Embed Size (px)
Citation preview
Improving User Association
in High-Density WLANs using Machine Learning
Carrascosa Zamacois, Marc
Curs 2017-2018
Director: Boris Bellalta Jimenez
GRAU EN ENGINYERIA TELEMÀTICA
Treball de Fi de Grau
GRAU EN ENGINYERIA EN
xxxxxxxxxxxx


Improving User Association in High-DensityWLANs using Machine Learning
Marc Carrascosa Zamacois
Bachelor’s thesis
Telematics engineering
Escola superior politècnica UPF
2018
Thesis director
Boris Bellalta Jimenez

Acknowledgements
I would like to thank my tutor Boris Bellalta for all the help and encouragement hehas given me.
A special thank you to Arnau for making class that much more enjoyable.
And last but not least, to my parents, whose help, encouragement and patiencemanaged to get me through this. I can never thank you enough.
This work has been partially supported by a Gift from the Cisco University ResearchProgram (CG#890107, Towards Deterministic Channel Access in High-Density WLANs)Fund, a corporate advised fund of Silicon Valley Community Foundation.
iii

Abstract
When deploying a Wi-Fi network, it is common to have the coverage area of multipleAccess Points (APs) overlapping as to ensure that no area is left without service.This and the ever increasing amount of wireless devices that users carry can create alot of additional interference to the network. As a result, the optimal AP - end userdevice association has become quite a challenge. Our aim is to study the currentproblems in 802.11 networks, such as associating an end user’s Wi-Fi station (STA)to an AP only using the received signal strength, which can overcrowd an AP andleave another underused. We will also investigate current efforts to mitigate theseissues, as well as design new association schemes that take into consideration theinformation acquired by the APs and end user STAs to improve user satisfaction,which we will measure in number of successful transmissions, as well as amountof bandwidth obtained by each STA. We will attempt to do this by using machinelearning algorithms that will dynamically improve the association of STAs over time.
Resum
És habitual al fer un desplegament de xarxes Wi-Fi que les àrees de cobertura dediversos Punts d’Accés (APs) coincideixin per tal d’assegurar que es pugui acon-seguir una connexió en qualsevol punt del desplegament. Si a això li sumem que elnombre de dispositius sense fils per persona augmenta cada vegada més, trobem quela quantitat d’interferència que hi ha en una xarxa és molt alta. Com a conseqüèn-cia, trobar una associació òptima entre l’usuari i l’AP és una tasca complicada. Elnostre objectiu és estudiar els problemes actuals en l’associació del IEEE 802.11, undels quals és fer servir la potència de senyal rebuda com a criteri d’associació, cosaque pot sobrecarregar un AP i deixar-ne un altre amb molt pocs usuaris. Tambéestudiarem el treball que s’està portant a terme actualment per a mitigar aquestsproblemes i intentarem dissenyar nous mecanismes d’associació que considerin lainformació obtinguda pels APs i els terminals finals per a millorar la satisfacciódels usuaris. Pretenem utilitzar algorismes de Machine Learning que milloraranl’associació de la xarxa de manera progressiva.
v

Resumen
Es habitual al hacer un despliegue de redes Wi-Fi que las áreas de cobertura devarios Puntos de Acceso (APs) coincidan para asegurar que se pueda conseguir unaconexión en cualquier punto del despliegue. Si a esto le sumamos que el númerode dispositivos inalámbricos por persona aumenta cada vez más, encontramos quela cantidad de interferencia que hay en una red es muy alta. Como consecuencia,encontrar una asociación óptima entre el usuario y el AP es una tarea complicada.Nuestro objetivo es estudiar los problemas actuales en la asociación del IEEE 802.11,uno de los cuales es usar la potencia de señal recibida como criterio de asociación,cosa que puede sobrecargar un AP y dejar otro con muy pocos usuarios. Tambiénestudiaremos el trabajo que se está llevando a cabo actualmente para mitigar estosproblemas e intentaremos diseñar nuevos mecanismos de asociación que consideren lainformación obtenida por los APs y los terminales finales para mejorar la satisfacciónde los usuarios. Pretendemos utilizar algoritmos de Machine Learning que mejoraránla asociación de la red de manera progresiva.
vi

Contents
Acknowledgements iii
List of Figures x
List of Tables xi
1 Introduction 11.1 Motivation . . . . . . . . . . . . . . . . . . . . . . . . . . . . . . . . . 11.2 Objectives . . . . . . . . . . . . . . . . . . . . . . . . . . . . . . . . . 21.3 Document structure . . . . . . . . . . . . . . . . . . . . . . . . . . . 2
2 Related Work 32.1 User association . . . . . . . . . . . . . . . . . . . . . . . . . . . . . . 32.2 HD WLANs . . . . . . . . . . . . . . . . . . . . . . . . . . . . . . . . 42.3 Machine Learning in WLANs . . . . . . . . . . . . . . . . . . . . . . 6
3 User association in IEEE 802.11 WLANs 93.1 Introduction . . . . . . . . . . . . . . . . . . . . . . . . . . . . . . . . 93.2 Basic procedure . . . . . . . . . . . . . . . . . . . . . . . . . . . . . . 93.3 IEEE 802.11 amendments . . . . . . . . . . . . . . . . . . . . . . . . 11
3.3.a IEEE 802.11i . . . . . . . . . . . . . . . . . . . . . . . . . . . 113.3.b IEEE 802.11r . . . . . . . . . . . . . . . . . . . . . . . . . . . 143.3.c 802.11ai . . . . . . . . . . . . . . . . . . . . . . . . . . . . . . 153.3.d 802.11k . . . . . . . . . . . . . . . . . . . . . . . . . . . . . . 163.3.e 802.11ax . . . . . . . . . . . . . . . . . . . . . . . . . . . . . . 16
3.4 AP selection in IEEE 802.11 . . . . . . . . . . . . . . . . . . . . . . . 163.5 Conclusions . . . . . . . . . . . . . . . . . . . . . . . . . . . . . . . . 17
4 Performance Evaluation of High Density WLANs 194.1 Introduction . . . . . . . . . . . . . . . . . . . . . . . . . . . . . . . . 194.2 System model . . . . . . . . . . . . . . . . . . . . . . . . . . . . . . . 19
4.2.a Scenario . . . . . . . . . . . . . . . . . . . . . . . . . . . . . . 194.2.b Metrics used . . . . . . . . . . . . . . . . . . . . . . . . . . . 214.2.c Simulation approach . . . . . . . . . . . . . . . . . . . . . . . 22
4.3 Results . . . . . . . . . . . . . . . . . . . . . . . . . . . . . . . . . . . 244.3.a Multiple Overlapping WLANs . . . . . . . . . . . . . . . . . . 244.3.b Increasing nodes in the network . . . . . . . . . . . . . . . . . 26
vii

4.3.c Capture effect . . . . . . . . . . . . . . . . . . . . . . . . . . . 304.3.d CCA and power adjustment . . . . . . . . . . . . . . . . . . . 35
4.4 Conclusions . . . . . . . . . . . . . . . . . . . . . . . . . . . . . . . . 44
5 Decentralized AP selection using RL 455.1 Introduction . . . . . . . . . . . . . . . . . . . . . . . . . . . . . . . . 455.2 System Model . . . . . . . . . . . . . . . . . . . . . . . . . . . . . . . 45
5.2.a Scenario . . . . . . . . . . . . . . . . . . . . . . . . . . . . . . 455.2.b Network throughput model . . . . . . . . . . . . . . . . . . . 465.2.c Simulation approach . . . . . . . . . . . . . . . . . . . . . . . 49
5.3 Reinforcement Learning . . . . . . . . . . . . . . . . . . . . . . . . . 505.3.a Multi armed bandits . . . . . . . . . . . . . . . . . . . . . . . 505.3.b ϵ-greedy . . . . . . . . . . . . . . . . . . . . . . . . . . . . . . 51
5.4 SSF, ϵ-greedy and STA placement . . . . . . . . . . . . . . . . . . . . 515.5 Our modifications to the algorithm . . . . . . . . . . . . . . . . . . . 545.6 Initial simulation . . . . . . . . . . . . . . . . . . . . . . . . . . . . . 545.7 Different network topologies . . . . . . . . . . . . . . . . . . . . . . . 595.8 Stickiness vs. regular algorithm . . . . . . . . . . . . . . . . . . . . . 615.9 Tweaking the algorithm . . . . . . . . . . . . . . . . . . . . . . . . . 62
5.9.a Non-Binary rewards . . . . . . . . . . . . . . . . . . . . . . . 625.9.b Exploit vs. inaction . . . . . . . . . . . . . . . . . . . . . . . 635.9.c Comparison . . . . . . . . . . . . . . . . . . . . . . . . . . . . 64
5.10 A second look at fixed STA positions . . . . . . . . . . . . . . . . . . 665.11 Variable bandwidth . . . . . . . . . . . . . . . . . . . . . . . . . . . . 675.12 Conclusions . . . . . . . . . . . . . . . . . . . . . . . . . . . . . . . . 71
6 Conclusions 73
viii

List of Figures
3.1 Standard 802.11 frame [1] . . . . . . . . . . . . . . . . . . . . . . . . 103.2 Message flow for each association type . . . . . . . . . . . . . . . . . 103.3 802.11 time line . . . . . . . . . . . . . . . . . . . . . . . . . . . . . . 113.4 802.11i frame flows . . . . . . . . . . . . . . . . . . . . . . . . . . . . 133.5 802.11r re-association . . . . . . . . . . . . . . . . . . . . . . . . . . . 143.6 802.11i re-association with ERP . . . . . . . . . . . . . . . . . . . . . 153.7 802.11ai re-association with FILS . . . . . . . . . . . . . . . . . . . . 15
4.1 Example of a hidden node when using a threshold of 10 dBs . . . . . 224.2 Transmission examples. Successful transmissions in blue and unsuc-
cessful ones in red. . . . . . . . . . . . . . . . . . . . . . . . . . . . . 234.3 AP configurations . . . . . . . . . . . . . . . . . . . . . . . . . . . . . 244.4 2 APs share the channel . . . . . . . . . . . . . . . . . . . . . . . . . 254.5 3 APs share the channel . . . . . . . . . . . . . . . . . . . . . . . . . 254.6 4 APs share the channel . . . . . . . . . . . . . . . . . . . . . . . . . 254.7 3 APs with different channels . . . . . . . . . . . . . . . . . . . . . . 264.8 Increasing the amount of STAs in the network . . . . . . . . . . . . . 264.9 Increasing the amount of APs in the network . . . . . . . . . . . . . 274.10 Successful vs. unsuccessful transmissions . . . . . . . . . . . . . . . . 274.11 Hidden and exposed nodes with increasing number of channels . . . . 284.12 Hidden and exposed nodes with increasing number of channels . . . . 284.13 Transmissions with 4 APs and increasing number of STAs and channels 294.14 Transmissions with 100 STAs and increasing number of APs and
channels . . . . . . . . . . . . . . . . . . . . . . . . . . . . . . . . . . 294.15 Hidden and exposed nodes with 2 APs and 10 STAs . . . . . . . . . . 314.16 Transmissions with 2 APs and 10 STAs . . . . . . . . . . . . . . . . . 314.17 Hidden and exposed nodes with 3 APs and 10 STAs . . . . . . . . . . 314.18 Transmissions with 3 APs and 10 STAs . . . . . . . . . . . . . . . . . 324.19 Hidden and exposed nodes with 4 APs and 10 STAs . . . . . . . . . . 324.20 Transmissions with 4 APs and 10 STAs . . . . . . . . . . . . . . . . . 324.21 Boxplots of the average hidden and exposed nodes with 4 APs and
increasing STAs . . . . . . . . . . . . . . . . . . . . . . . . . . . . . . 334.22 Transmissions with 4 APs when the threshold and STAs increase . . 334.23 Boxplots of the average hidden nodes with 100 STAs and increasing
APs . . . . . . . . . . . . . . . . . . . . . . . . . . . . . . . . . . . . 344.24 Boxplots of the average exposed nodes with 100 STAs and increasing
APs . . . . . . . . . . . . . . . . . . . . . . . . . . . . . . . . . . . . 34
ix

4.25 Transmissions with 100 STAs when the threshold and APs increase . 354.26 Results for 2 APs and 10 STAs . . . . . . . . . . . . . . . . . . . . . 374.27 Results for 3 APs and 10 STAs . . . . . . . . . . . . . . . . . . . . . 384.28 Hidden and exposed nodes for 4 APs and 10 STAs . . . . . . . . . . 384.29 Transmissions for 4 APs and 10 STAs . . . . . . . . . . . . . . . . . . 394.30 Transmission power for each configuration . . . . . . . . . . . . . . . 394.31 Results with 4 APs when we increase the amount of STAs in the
network . . . . . . . . . . . . . . . . . . . . . . . . . . . . . . . . . . 404.32 Transmission power selected when STAs increase . . . . . . . . . . . 414.33 Results with 100 STAs when we increase the amount of APs in the
network . . . . . . . . . . . . . . . . . . . . . . . . . . . . . . . . . . 424.34 Average STA CCA with 100 STAs and increasing APs . . . . . . . . 434.35 Transmission power used with 100 STAs and increasing APs . . . . . 43
5.1 Structure of the simulation . . . . . . . . . . . . . . . . . . . . . . . . 505.2 Node configurations . . . . . . . . . . . . . . . . . . . . . . . . . . . . 525.3 Percentage of bandwidth obtained . . . . . . . . . . . . . . . . . . . . 535.4 Convergence . . . . . . . . . . . . . . . . . . . . . . . . . . . . . . . . 565.5 Bandwidth and satisfaction achieved . . . . . . . . . . . . . . . . . . 575.6 States of the algorithm and STA stickiness vs. bandwidth . . . . . . 585.7 Bandwidth achieved with different requirements . . . . . . . . . . . . 595.8 Changing the epsilon value . . . . . . . . . . . . . . . . . . . . . . . . 615.9 Bandwidth achieved with each association . . . . . . . . . . . . . . . 635.10 Bandwidth achieved with each association . . . . . . . . . . . . . . . 635.11 Comparison of bandwidth achieved . . . . . . . . . . . . . . . . . . . 645.12 Jain’s fairness . . . . . . . . . . . . . . . . . . . . . . . . . . . . . . 655.13 Percentage of bandwidth obtained . . . . . . . . . . . . . . . . . . . . 665.14 Performance when the demands change . . . . . . . . . . . . . . . . 685.15 Performance of two STAs in a single simulation . . . . . . . . . . . . 69
x
List of Tables
4.1 Glossary . . . . . . . . . . . . . . . . . . . . . . . . . . . . . . . . . . 204.2 Simulation parameters . . . . . . . . . . . . . . . . . . . . . . . . . . 20
5.1 Glossary . . . . . . . . . . . . . . . . . . . . . . . . . . . . . . . . . . 465.2 Simulation parameters . . . . . . . . . . . . . . . . . . . . . . . . . . 465.3 Notation used . . . . . . . . . . . . . . . . . . . . . . . . . . . . . . . 475.4 IEEE 802.11ax rates for 20 MHz and one spatial stream . . . . . . . 485.5 Statistics for each configuration . . . . . . . . . . . . . . . . . . . . . 545.6 Statistics for the simulation of 3 APs and 10 STAs . . . . . . . . . . 565.7 Statistics when changing the amount of APs . . . . . . . . . . . . . . 605.8 Statistics as the ϵ value changes . . . . . . . . . . . . . . . . . . . . . 625.9 Statistics for each algorithm . . . . . . . . . . . . . . . . . . . . . . . 655.10 Statistics for each configuration . . . . . . . . . . . . . . . . . . . . . 675.11 Statistics for each approach . . . . . . . . . . . . . . . . . . . . . . . 685.12 Convergence intervals for each algorithm . . . . . . . . . . . . . . . . 69
xi


Chapter 1
Introduction
1.1 Motivation
High density Wireless Local Area Networks (HD-WLANs) are networks with a highnumber of Access Points (APs) in a given area. Shopping malls, universities andeven entire cities have massive multi-AP deployments giving coverage to hundredsof users, which means that these networks have a different set of challenges thansingle AP deployments, such as user association.
In the context of IEEE 802.11 WLANs, user association is based on the StrongestSignal First (SSF) mechanism, in which the end user stations (STAs) find thestrongest signal available based on their Signal to Noise Ratio (SNR) and asso-ciate to whichever AP sent it. This method works properly in single AP networks,but has been shown to be inefficient in multiple-AP deployments [2, 3] by ignoringthe AP load, the topology of the network and the other users in it.
Another challenge with HD-WLANs is channel interference. Ideally, each WLANwill be in a different channel and it will only sense the users that belong to thatnetwork. In reality, there are few orthogonal channels available, especially in the 2.4GHz band, which has only 3. A limited number of channels means that interferencebetween APs will not always be avoidable.
Overlapping creates two problems in HD-WLANs:
• Hidden nodes: These appear when two nodes on the same channel do notsense each other. Since they are unaware of the other’s existence, they willend up transmitting at the same time, creating collisions. Hidden nodes arealready present in single AP networks, but in HD-WLANs these collisions canbe created by nodes from different networks that are on the same channel,aggravating the problem.
• Exposed nodes: If two networks are close to each other and on the samechannel, a node from the first network can sense a node from the second one.Then, if the first node senses that the second one is transmitting, it will wait totransmit to not create a collision, but since they are from different networks
1

their receivers are likely in different places, and it is also likely that thosereceivers are outside of the range of the interfering node, which means thatthey could receive simultaneously without suffering from interference. In thiscase the problem is not a collision, it is a loss in potential throughput.
We will be studying the effects that these problems have on the network performanceand possible ways to mitigate them.
For the association problem, we will use Machine Learning (ML) algorithms to makethe entire network learn and adapt to its environment over time. We will specificallylook at Reinforcement Learning (RL), which has an algorithm learn by taking actionswhich receive a reward or punishment that serve as knowledge to inform the nextdecision. Usually the issue is to find a balance between exploring all options to findnew information and exploiting the knowledge that has already been accumulated.
1.2 Objectives
The main purpose of this project is to improve the IEEE 802.11 performance inHD-WLANs by intelligently associating STAs to APs. To that end we will:
1. Study the current version of IEEE 802.11, as well as the drafts of futurerevisions (11ai,11ax), and find what has been done in regards to improvinguser association.
2. Study Machine Learning techniques to create an algorithm that is able to findthe optimal association solution.
3. Create a simulation tool using MATLAB where we can test and evaluate theperformance of HD-WLANs.
4. Design and evaluate Machine Learning algorithms for improving user associa-tion in HD-WLANs.
1.3 Document structure
This document is organized as follows: in Chapter 2 the state of the art for currentassociation improvement efforts and channel interference is presented. Chapter 3summarizes the current state of the IEEE 802.11 standard, as well as future amend-ments. Chapter 4 presents the model used for our simulations and an analysis of thehidden and exposed node problem, to see if they are a problem that can be ignored orneeds to be taken into consideration when designing new associations mechanisms.In Chapter 5 the reinforcement learning algorithm used and the model in which itwas tested can be found. Finally, our conclusions are discussed in Chapter 6.
2

Chapter 2
Related Work
2.1 User association
Strongest Signal First (SSF) is the de facto method for Access Point (AP) associ-ation in WLANs. However, it has been shown to lead to uneven load and clientdistribution among APs [3, 4], which leads to poor performance and unfairness sit-uations. Such user behavior analysis shows that the number of users associated toan AP is related to its location. However, peak throughput is not achieved with fullusers load, since most peaks in the system depend on the needs of individual users.The results in [4] show that 10% of users are responsible for 40 % of the load inmost APs.
In order to extend the current SSF-based approach, some works use an extendedset of measurements for decision-making. In [5], the hand-off of re-associations isimproved by letting the stations (STAs) keep a list of APs found during scanningorganized by their Received Signal Strength Indicator (RSSI). With that, AP re-association can be done while skipping scanning. The authors in [6] use probemessages to measure the AP’s available bandwidth, in order to decide to which onethey want to associate with. Once associated, the STAs periodically check if theirindividual service requirements are still met. Otherwise, probing is done with thegoal of finding a better AP that enhances the individual performance. Similarly, themethod presented in [7] uses the beacon frames received at STAs to measure thesignal strength of each AP that is in range, thus allowing to estimate the throughputthey could achieve after association.
As an alternative to SNR-based methods, works based on performance estimationare gaining attention. In particular, we highlight potential bandwidth [8] and pro-portional fairness [9, 10] estimation methods to perform AP association. These addsome computational time which can be undertaken in the STAs themselves or on acentral hub that communicates the decisions to the STAs later. For these cases, theIEEE 802.11r standard could be really useful, since it provides the neighbor report,in which an AP obtains information from other APs and relays it to its STAs, sothat they can make more intelligent decisions regarding possible re-associations.
3
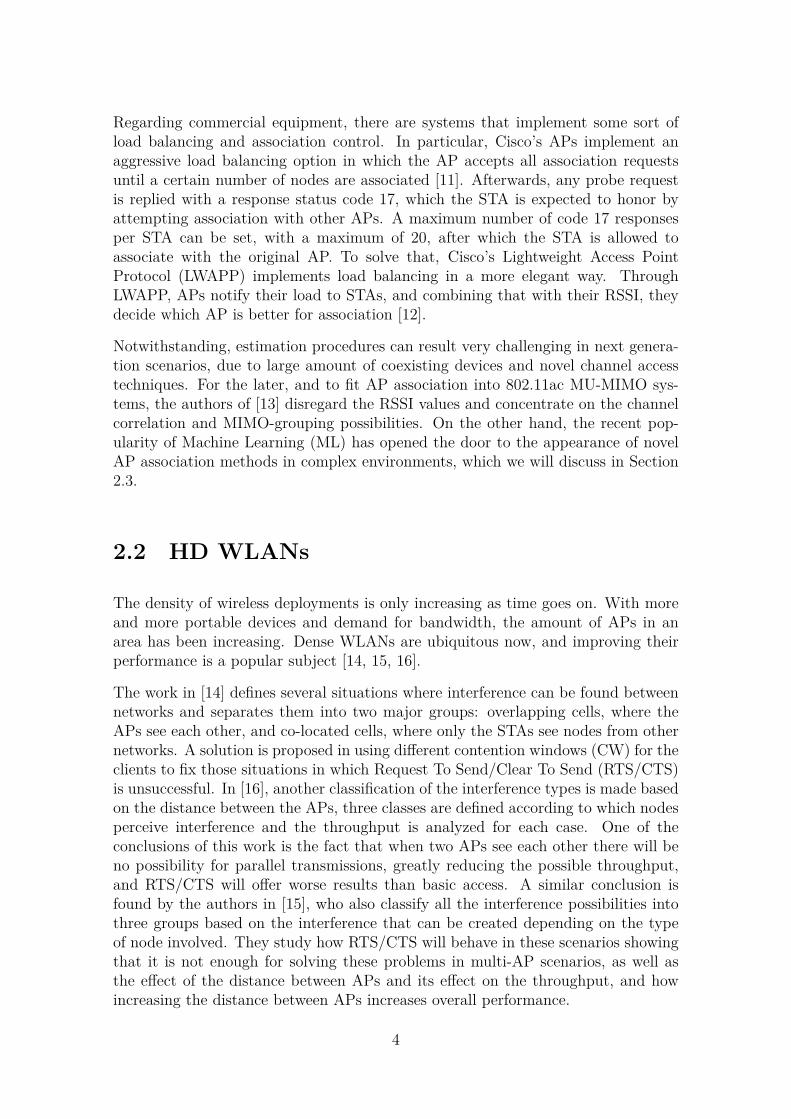
Regarding commercial equipment, there are systems that implement some sort ofload balancing and association control. In particular, Cisco’s APs implement anaggressive load balancing option in which the AP accepts all association requestsuntil a certain number of nodes are associated [11]. Afterwards, any probe requestis replied with a response status code 17, which the STA is expected to honor byattempting association with other APs. A maximum number of code 17 responsesper STA can be set, with a maximum of 20, after which the STA is allowed toassociate with the original AP. To solve that, Cisco’s Lightweight Access PointProtocol (LWAPP) implements load balancing in a more elegant way. ThroughLWAPP, APs notify their load to STAs, and combining that with their RSSI, theydecide which AP is better for association [12].
Notwithstanding, estimation procedures can result very challenging in next genera-tion scenarios, due to large amount of coexisting devices and novel channel accesstechniques. For the later, and to fit AP association into 802.11ac MU-MIMO sys-tems, the authors of [13] disregard the RSSI values and concentrate on the channelcorrelation and MIMO-grouping possibilities. On the other hand, the recent pop-ularity of Machine Learning (ML) has opened the door to the appearance of novelAP association methods in complex environments, which we will discuss in Section2.3.
2.2 HD WLANs
The density of wireless deployments is only increasing as time goes on. With moreand more portable devices and demand for bandwidth, the amount of APs in anarea has been increasing. Dense WLANs are ubiquitous now, and improving theirperformance is a popular subject [14, 15, 16].
The work in [14] defines several situations where interference can be found betweennetworks and separates them into two major groups: overlapping cells, where theAPs see each other, and co-located cells, where only the STAs see nodes from othernetworks. A solution is proposed in using different contention windows (CW) for theclients to fix those situations in which Request To Send/Clear To Send (RTS/CTS)is unsuccessful. In [16], another classification of the interference types is made basedon the distance between the APs, three classes are defined according to which nodesperceive interference and the throughput is analyzed for each case. One of theconclusions of this work is the fact that when two APs see each other there will beno possibility for parallel transmissions, greatly reducing the possible throughput,and RTS/CTS will offer worse results than basic access. A similar conclusion isfound by the authors in [15], who also classify all the interference possibilities intothree groups based on the interference that can be created depending on the typeof node involved. They study how RTS/CTS will behave in these scenarios showingthat it is not enough for solving these problems in multi-AP scenarios, as well asthe effect of the distance between APs and its effect on the throughput, and howincreasing the distance between APs increases overall performance.
4

The authors in [17] study the effect of path-loss in high density WLANs, showingthat a network that is considered over-congested in an open environment can benon-congested when walls are present, arriving at the conclusion that unplannedAP deployments in moderate to high path-loss areas are far less critical than theyare in open environments.
In [18], the authors concentrated on the current methods for dealing with chan-nel interference, they study how Auto Channel Selection(ACS) does not use onlyorthogonal channels and uses sub-optimal channels that create inter-channel inter-ference, as well as how Auto Rate Fallback (ARF) worsens the throughput for everynode in the network in an attempt to fix one single node’s performance. Theypropose a solution for channel assignment based on number of nodes in a WLAN.In [19] another dynamic channel assignment scheme is proposed, in which the APsbroadcast their channel and the amount of nodes associated to them, so that eachAP can decide which channel to use asynchronously. The authors in [20] propose amethod to detect overlapping networks by using a differential of the RSSI at a giventime and checking if it exceeds certain thresholds. They also propose calculatingthe duration of packets with the size and rate defined in the header and checking ifthe RSSI after that point is still higher than the noise level to detect interference.After the detection, they rely on the AP auto-selecting a different channel to avoidfurther interference.
The authors in [21] propose methods to optimally design a dense network, consid-ering both 11g and 11a protocols, and centering their study on finding the right cellradius as well as optimal Clear Channel Assessment (CCA) tuning. They also findthat the higher data rates are not desirable due to their high SINR requirements.The work in [22] also attempts to modify the CCA dynamically to improve through-put of the system by making it proportional to the number of contending STAs ofeach node. It also attempts to improve overall fairness by tuning the transmissionopportunity (TXOP) according to a pre-set threshold defined by the network man-ager so that the links with lower access probability can send multiple consecutiveframes for a short period of time.
The work in [23] extends the idea of Enhanced Distributed Channel Access (EDCA)by giving different access priorities to the STAs or even the APs. By setting differentpriority groups it proposes a system in which the values for the CWmin, CWmax,Arbitration InterFrame Space Number (AIFSN) and TXOP are changed during aperiod of time on each AP of a network, giving priority to one Basic Service Set sothat it can work unhindered, improving the overall network performance over time.This system is based around the idea of every node seeing each other.
In [24], the authors propose a modification of the current Network Allocation Vector(NAV) in which the current vector will be called Self BSS NAV(SBNAV) and a newone will be created called Overlapping BSS NAV (OBNAV), this new vector willbe set according to beacons and packets received from a different network, and thenode will only transmit once both NAVs allow it.
5

2.3 Machine Learning in WLANs
While Machine Learning is not a new subject, its use as a way to improve wirelessnetworks is fairly recent. There are several types of Machine Learning algorithms andthey can be classified in two groups: Supervised Learning, in which the algorithmis trained with data that has been labeled following certain rules, and then it issupposed to find the function, pattern or model that best defines the entire data set,and Unsupervised Learning, in which the data fed to the algorithm is not labeled atall, meaning that the algorithm is supposed to sort the data by finding patterns in it.Supervised Learning has several subcategories, like semi-supervised learning, whichuses a combination of labeled and unlabeled data, Active Learning, which allows thealgorithm to ask questions to an information source, and Reinforcement Learning,which uses rewards and punishments as a way to help the algorithm predict theaction with a better reward through trial and error.
In [25], the authors present a summary of the future of wireless networks and theiruse of Machine Learning centered on 5G. Their Reinforcement Learning sectiongives a good introduction on Q-Learning and its use in conjunction with the Markovdecision process, as well as mentioning the Multi Armed bandits problem and itsapplications. The authors in [26] use Reinforcement Learning so that a WirelessSensor Network may organize itself. The nodes treat sending a broadcast query ina particular channel as an action, and keep trying different channels to update therewards for each one based on the neighbors discovered with the end goals to findthe best possible path to the sink.
The work in [27] aims to improve the coexistence of LTE and Wi-Fi networks byusing Q-learning and an ϵ-greedy algorithm to dynamically select the amount of timean LTE device should transmit in its duty cycle so that interference can be minimalfor both networks. In [28], coexistence between LTE and Wi-Fi is also attemptedby having the base station offload traffic from applications that can handle delays tothe Wi-Fi bands while keeping the stricter applications in the licensed bands. Theyuse Reinforcement Learning to find an optimal configuration of transmission acrossboth Wi-Fi and cellular bands.
In [29], the authors use a feed-forward Neural Network (NN) to improve STAs’ability to pick the best AP at any time. A STA implementing such a NN musttake into consideration several metrics for estimating the performance achieved byeach AP. Once AP association is done, the model is validated by comparing theexperienced performance with the predictions done. Such procedure is carried outuntil enough iterations have passed so as to guarantee convergence.
In [30], an AP association scheme is proposed in which the STAs keep estimating theutilization of the APs they use, and based on a threshold, switch to a new AP if theybecome unsatisfied. They use Reinforcement Learning to stop the AP switching tobecome too frequent.
The authors in [31] explore several Reinforcement Learning algorithms as a way tosolve resource allocation in wireless networks. Actions chosen by the agents are the
6

configuration of both channel and transmission power; and they try to find the onethat gives the higher throughput.
7

Chapter 3
User association in IEEE 802.11WLANs
3.1 Introduction
In this Chapter we will explain the standard association procedure for IEEE 802.11,from its initial release where there was only a single method of encryption to thecurrent amendment and future ones. We will see that several improvements try toreduce the association time so that switching to a different AP can be imperceptibleto the end user, while others are designed with the intention to give information tothe STA and improve the AP selection.
3.2 Basic procedure
IEEE 802.11 uses three different types of frames:
• Management: These frames carry information about the network, they areused by the APs and STAs to find each other, negotiate association, terminateit, or just ask for reports on the quality of the connection.
• Control: These frames are used once the connection has been establishedbetween APs and STAs, they are used for signaling between all the nodesin the network to better control the flow of transmissions (like RTS & CTSframes).
• Data: Frames containing data, meaning that they are used to encapsulateother protocols, like TCP or UDP.
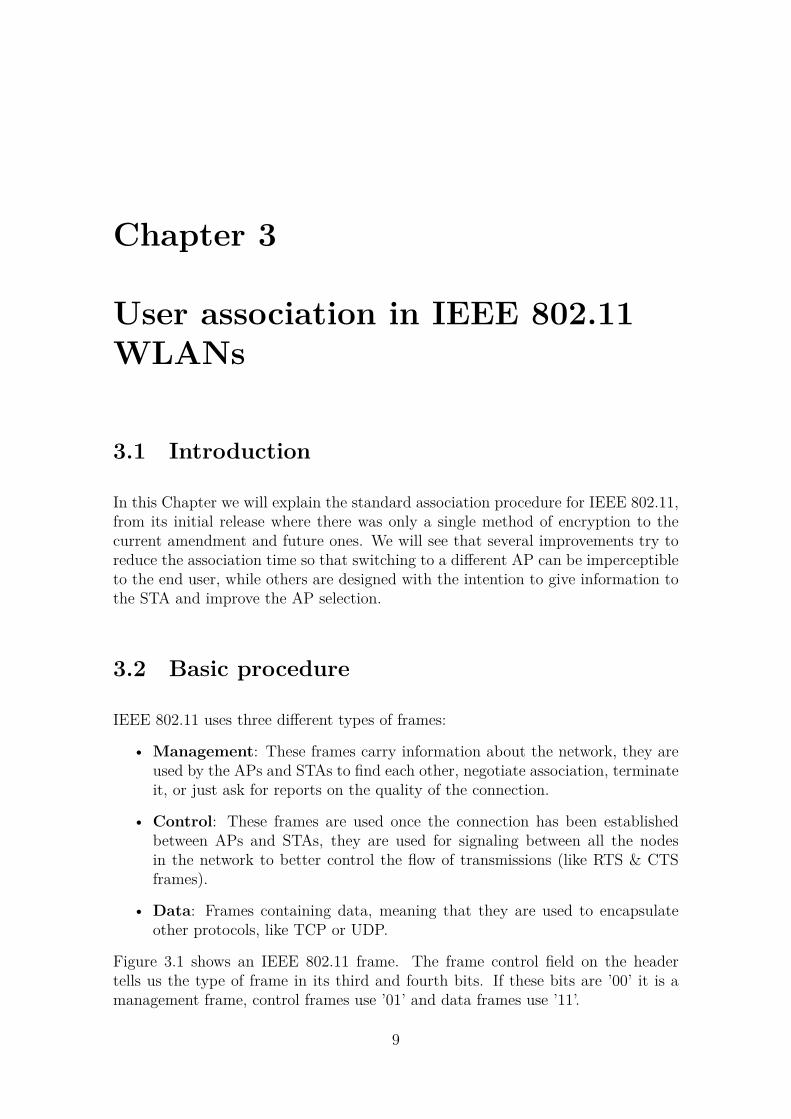
Figure 3.1 shows an IEEE 802.11 frame. The frame control field on the headertells us the type of frame in its third and fourth bits. If these bits are ’00’ it is amanagement frame, control frames use ’01’ and data frames use ’11’.
9
For the entirety of this Chapter, we will concentrate on Management frames, sincethey are the ones that take care of user association.
Figure 3.1: Standard 802.11 frame [1]
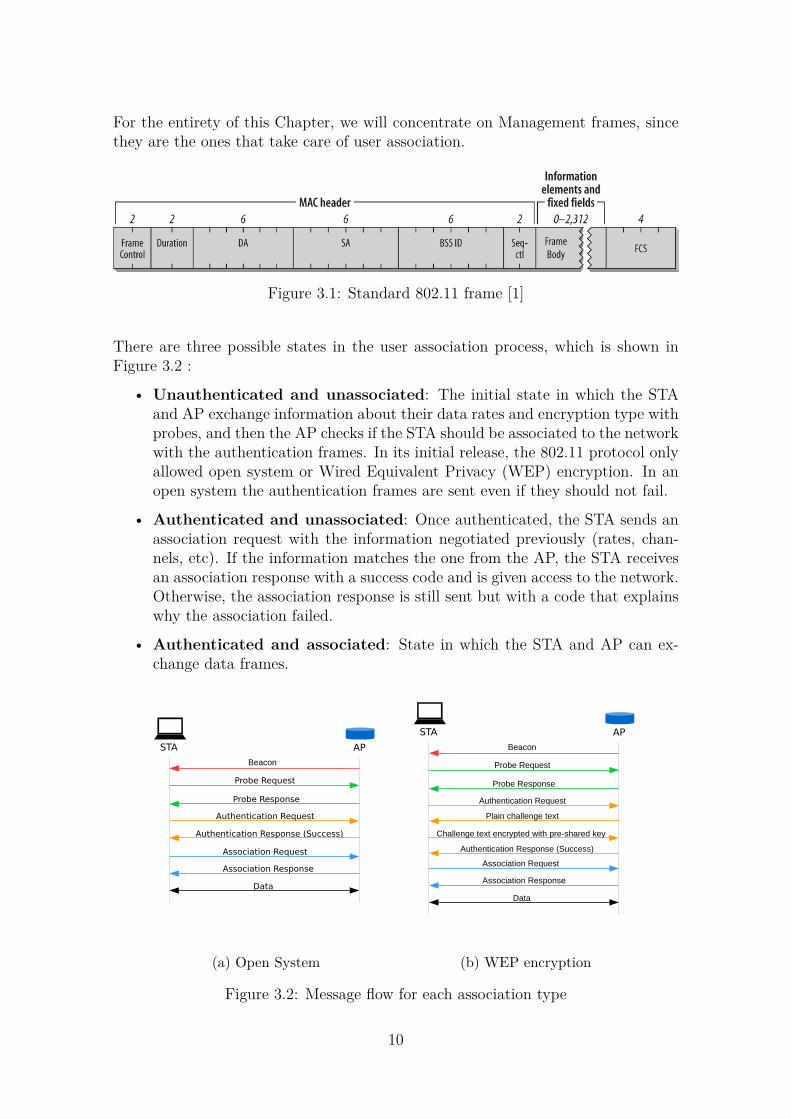
There are three possible states in the user association process, which is shown inFigure 3.2 :
• Unauthenticated and unassociated: The initial state in which the STAand AP exchange information about their data rates and encryption type withprobes, and then the AP checks if the STA should be associated to the networkwith the authentication frames. In its initial release, the 802.11 protocol onlyallowed open system or Wired Equivalent Privacy (WEP) encryption. In anopen system the authentication frames are sent even if they should not fail.
• Authenticated and unassociated: Once authenticated, the STA sends anassociation request with the information negotiated previously (rates, chan-nels, etc). If the information matches the one from the AP, the STA receivesan association response with a success code and is given access to the network.Otherwise, the association response is still sent but with a code that explainswhy the association failed.
• Authenticated and associated: State in which the STA and AP can ex-change data frames.
(a) Open System (b) WEP encryption
Figure 3.2: Message flow for each association type
10

3.3 IEEE 802.11 amendments
There have been several improvements to the IEEE 802.11 standard over the years.These improvements are amendments that get added to the standard, and are de-noted with a letter behind the standard’s name. We will look at those that relate touser association in this section. Figure 3.3 shows a bit of the history of the standardand how the amendments get added over time. As we can see it can take a whilebefore a new version of the standard is implemented, which means that usually abunch of amendments get added at once. The current standard is the 2016 version,and there already are multiple amendments being drafted for the next version.
We will focus on amendments centered around AP-STA association. We have seenin the previous section that initially, association was a fast and simple process.However because of security needs, this process got more complicated with time.We will mention the steps taken from the initial amendment to the future 802.11ai,which aims to greatly shorten the association time.
Figure 3.3: 802.11 time line
3.3.a IEEE 802.11i
We mentioned previously that WEP encryption was the only option in the originalstandard. This mechanism was created in 1997 and uses a stream cipher called RC4.This creates a semi random key and the key is combined with a plain text usingExclusive or (XOR).
WEP was quite vulnerable to an attacker that captured the challenge frames, andafter a few years the key was easily decipherable in minutes. The first solution tothis problem was Wi-Fi Protected Access (WPA), which was a patch that could beimplemented with firmware updates to improve on the WEP mechanism before anew, better mechanism was devised. WPA improved the cipher construction and
11
used a new key for each packet, dealing with the main vulnerability of the WEPmechanism, its static key. It also included a Message Integrity Check (MIC).
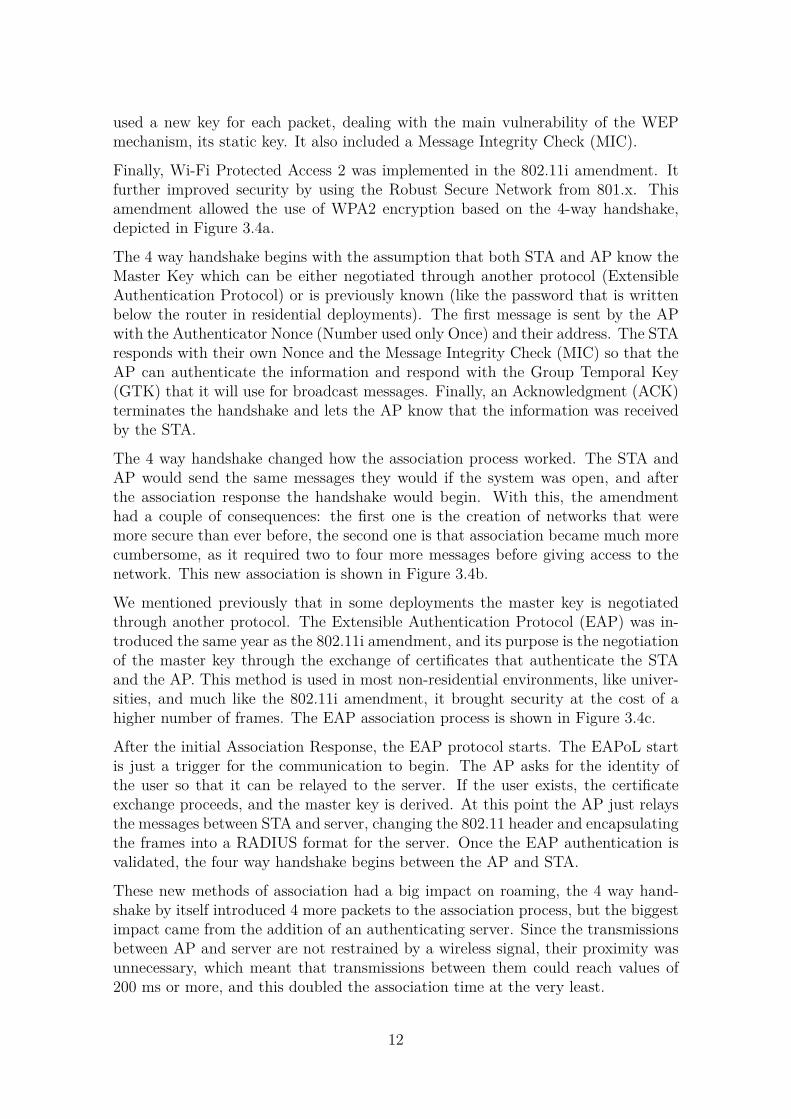
Finally, Wi-Fi Protected Access 2 was implemented in the 802.11i amendment. Itfurther improved security by using the Robust Secure Network from 801.x. Thisamendment allowed the use of WPA2 encryption based on the 4-way handshake,depicted in Figure 3.4a.
The 4 way handshake begins with the assumption that both STA and AP know theMaster Key which can be either negotiated through another protocol (ExtensibleAuthentication Protocol) or is previously known (like the password that is writtenbelow the router in residential deployments). The first message is sent by the APwith the Authenticator Nonce (Number used only Once) and their address. The STAresponds with their own Nonce and the Message Integrity Check (MIC) so that theAP can authenticate the information and respond with the Group Temporal Key(GTK) that it will use for broadcast messages. Finally, an Acknowledgment (ACK)terminates the handshake and lets the AP know that the information was receivedby the STA.
The 4 way handshake changed how the association process worked. The STA andAP would send the same messages they would if the system was open, and afterthe association response the handshake would begin. With this, the amendmenthad a couple of consequences: the first one is the creation of networks that weremore secure than ever before, the second one is that association became much morecumbersome, as it required two to four more messages before giving access to thenetwork. This new association is shown in Figure 3.4b.
We mentioned previously that in some deployments the master key is negotiatedthrough another protocol. The Extensible Authentication Protocol (EAP) was in-troduced the same year as the 802.11i amendment, and its purpose is the negotiationof the master key through the exchange of certificates that authenticate the STAand the AP. This method is used in most non-residential environments, like univer-sities, and much like the 802.11i amendment, it brought security at the cost of ahigher number of frames. The EAP association process is shown in Figure 3.4c.
After the initial Association Response, the EAP protocol starts. The EAPoL startis just a trigger for the communication to begin. The AP asks for the identity ofthe user so that it can be relayed to the server. If the user exists, the certificateexchange proceeds, and the master key is derived. At this point the AP just relaysthe messages between STA and server, changing the 802.11 header and encapsulatingthe frames into a RADIUS format for the server. Once the EAP authentication isvalidated, the four way handshake begins between the AP and STA.
These new methods of association had a big impact on roaming, the 4 way hand-shake by itself introduced 4 more packets to the association process, but the biggestimpact came from the addition of an authenticating server. Since the transmissionsbetween AP and server are not restrained by a wireless signal, their proximity wasunnecessary, which meant that transmissions between them could reach values of200 ms or more, and this doubled the association time at the very least.
12
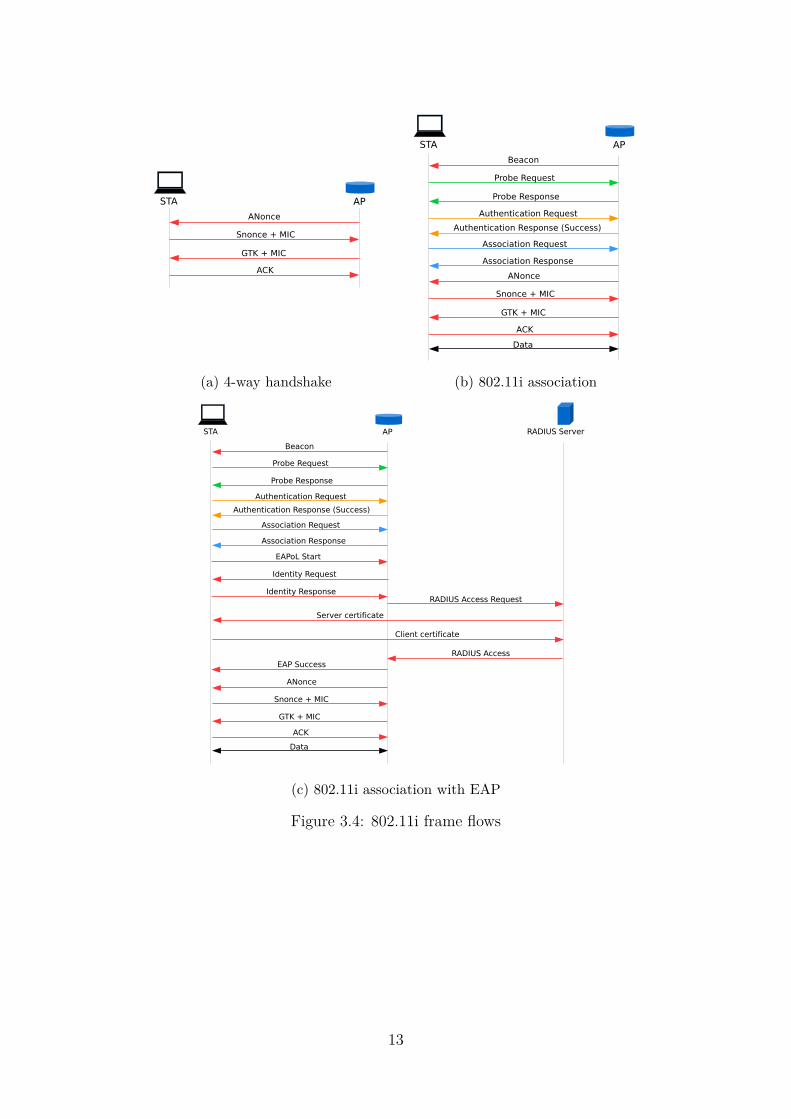
(a) 4-way handshake (b) 802.11i association
(c) 802.11i association with EAP
Figure 3.4: 802.11i frame flows
13

3.3.b IEEE 802.11r
This amendment was designed to reduce the amount of frames needed to roambetween APs, reducing the time needed to switch to another AP. The solution pro-posed was called Fast BSS transition, and it worked for all Basic Service Sets (BSS)in an Extended Service Set (ESS), meaning that it worked for all the APs in thesame network. Fast BSS transition does three things: the first one is encapsulatingthe 4-way handshake in the authentication and re-association frames; the second isskipping the certificate exchange if it has been done once already; and the third oneis allowing the current AP to relay the authentication frames to the new one, allow-ing the STA to remain connected instead of having to disassociate before sendingthem.
The same year that this amendment was published, a revision of EAP was proposed,called the Extensible Re-association Protocol (ERP). Much like 802.11r, it was de-signed for roaming, and tries to reduce the amount of frames needed for a STA thatreturns to a network. It is built on top of EAP, meaning that if a STA sends anERP message and the AP does not use the protocol, after a certain time the STAwill initiate a full EAP communication. When available, it halves the amount offrames needed. The ERP exchange can be seen in Figure 3.6.
Figure 3.5: 802.11r re-association
14
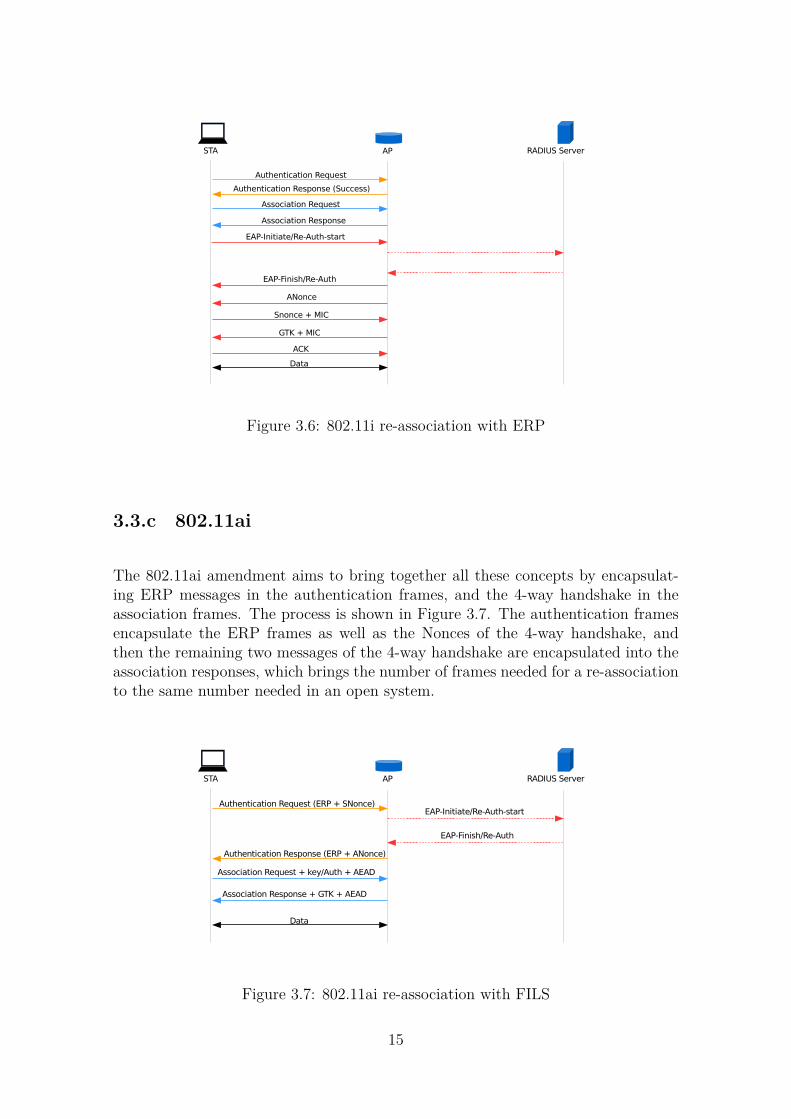
Figure 3.6: 802.11i re-association with ERP
3.3.c 802.11ai
The 802.11ai amendment aims to bring together all these concepts by encapsulat-ing ERP messages in the authentication frames, and the 4-way handshake in theassociation frames. The process is shown in Figure 3.7. The authentication framesencapsulate the ERP frames as well as the Nonces of the 4-way handshake, andthen the remaining two messages of the 4-way handshake are encapsulated into theassociation responses, which brings the number of frames needed for a re-associationto the same number needed in an open system.
Figure 3.7: 802.11ai re-association with FILS
15

3.3.d 802.11k
The 802.11k is an amendment that is usually associated with 802.11r, not onlybecause they were published the same year, but because they complement eachother. The 802.11r amendment allowed for faster re-association, but a STA doesnot send probe requests once it is associated, and unless other APs happened tobe on the same channel as their current one, they would not receive their beacons.That is what 802.11k fixes with the neighbour report, which is an action frame thata STA sends to its current AP to acquire information about nearby APs. This reportis a list of all the APs that the current AP can sense, with all the information thatwould usually be found in a beacon, such as security type and channel used. Thisreport is designed to allow the STAs to skip the disassociation and scanning thatroaming would usually require.
3.3.e 802.11ax
This amendment is not focused on association, but on improving the performanceof the network in terms of data rates and overheads. To do this it uses Orthogo-nal Frequency-Division Multiple Access (OFDMA), which will replace the currentOrthogonal Frequency-Division Multiplexing (OFDM). OFDM encodes informationby splitting it into several carrier frequencies that travel at low data rates, and oncereceived the information is put together again. Its advantage over a single carrierat high speed is the use of guard intervals that allow it to evade Inter Symbol Inter-ference (ISI). OFDMA improves upon it with a multi user version in which a subsetof carrier frequencies is assigned to one user, and another subset to another user.Further, OFDMA increases the number of subcarriers available, and also brings the1024-QAM modulation, which will allow us to reach higher rates than the previousmaximum of 256-QAM.
As we mentioned, this amendment has no bearing on user association, but we willbe using its features when simulating networks in future chapters.
3.4 AP selection in IEEE 802.11
In this Section we want to take a deeper look at the current AP selection methodthat STAs use: the Strongest Signal First (SSF) mechanism.
The first step in this mechanism is the scanning of channels. STAs scan all availablechannels looking for nearby APs, and they can do so in two ways:
• Passive Scanning: A STA starts by setting its antenna to a specific channeland waits a certain amount of time to receive beacons from APs in that chan-nel. The amount of time spent in the channel depends on the implementation,but it should take into account that most APs send beacons every 100 ms bydefault. If the STA receives a beacon, it stores its information, and once the
16

STA has waited long enough, it switches to a new channel. This is repeateduntil the STA has tried every channel in its channel list, which can vary withthe implementation, and could contain every channel or only a few.
• Active Scanning: The STA scans all the channels in its list much like thepassive scanning, but instead of waiting for beacons, it sends probe requests,which will be answered by probe responses of nearby APs with the sameinformation that would be in their beacons. This type of scanning shouldideally take less time than the passive scanning because the waiting timebefore switching channels is based on the time that it would take for an APto answer its request, instead of the beacon frequency. This wait time is alsoimplementation dependent, but usually is based around the amount of timethat the AP would need to answer the request if it were not overloaded.
While active scanning seems the better option of the two because of its lower scan-ning time, it has the disadvantage of adding overhead to the network, which can bea problem if there are a lot of STAs around. Most systems nowadays still use activescanning as a default in spite of this.
After the scanning is completed, the STA looks at the Basic Service Set Identifiers(BSSID) from the beacons or probes received to try and find one that it recognizes.If there are multiple BSSIDs that are known to the STA, it selects the one withthe strongest Received Signal Strength Indicator (RSSI) and starts the associationprocess as we described in Section 3.2.
3.5 Conclusions
From what we have seen, the majority of the association amendments proposedfor the 802.11 protocol have been dedicated to improving security or making theexchange of frames more efficient. This is helpful for our purposes, considering thatour aim is to allow a STA to find its most optimal AP, and that will require re-association to multiple APs to gather information, which requires short associationtimes. In order to obtain information to decide which AP to use for re-association,802.11k seems the most interesting proposal, as it gives the STAs the informationrequired without interrupting the service for the end user. A conjunction of 802.11kand 802.11ai would allow the STA to find the optimal AP with a minimal amountof re-associations.
17

Chapter 4
Performance Evaluation of HighDensity WLANs
4.1 Introduction
In this Chapter we will create a model that accurately portrays a High-DensityWLAN to study the more common problems that can be found when there aremultiple APs in the same area. We will study the effect of channel interference, theeffects of increasing the amount of nodes in a network and how we can use powersaving and CCA adjustment to mitigate these issues.
Our aim in this Chapter is to find how much of a problem the hidden and exposednodes are, to see if we already have the tools at our disposal to lessen their effect onthe network throughput or if new mechanisms need to be devised to discover andcontrol them.
4.2 System model
In this Section we will describe the parameters, assumptions and metrics we usedto create our simulation of HD-WLANs and evaluate their performance.
4.2.a Scenario
Our simulation creates a 2D plane and sets a number of APs and STAs in randompositions distributed uniformly. After that, each STA gets assigned to an AP follow-ing the Strongest Signal First (SSF) mechanism. The signal received by each nodeis calculated using the log distance path-loss model, which we show in Equation 4.1.The parameters used in the equation are described in Tables 4.1 and 4.2.
19

Parameter MeaningRP(dBm) Received PowerTP (dBm) Transmission PowerPL (dB) Path Loss
BPL Break-Point LossPL_0(dB) Path Loss at 1 meter
Gs(dB) Shadowing interferencefc (GHz) Frequency band used
d_walls (m) Distance between walls
Table 4.1: Glossary
Parameter ValueArea(m) 50x50
PL_0(dB) 40.05Gs(dB) Normally distributed with std. dev. 5
Channels 8fc (GHz) 5
d_walls(m) 10
Table 4.2: Simulation parameters
Log distance path-loss model according to the enterprise simulation scenario by the802.11ax task force [32]:
RP = TP-PL = TP-PL0 + 20 log10
(fc2.4
)+ 20 log10(min(dist, 10))+
+BPL · 35 log10(
dist10
)+ 7 ·
(dist
d_walls
)+ Gs
(4.1)
We calculate the received power by subtracting the path-loss from the transmissionpower of the node, which will be 20 dBm unless specified. PL_0 is the loss in dBmafter the signal travels one meter. The fc parameter refers to the band used, it caneither be 2.4 Ghz or 5 GHz. The next two elements in the equation give the lossbased on the distance between STA and AP. First we check the losses when thedistance is less than 10, and the next element checks for those cases in which thedistance is equal or higher than 10 with the break-point loss (BPL). If BPL is 1 thenwe add further loss to the equation.
20
BPL =
{1, if dist ≥ 10
0, otherwise(4.2)
The penultimate element gives us the loss due to the traversed walls in the signal’spath. The d_walls is the separation between walls in our simulation: 10 metres.Finally, the Gs is the shadowing, or interference due to objects affecting the prop-agation of the signal, each pair of AP-STA obtains the shadowing using randomnormally distributed values with a standard deviation of 5.
4.2.b Metrics used
To evaluate the performance of an HD-WLAN we will use several metrics, and themost important ones are the successful and unsuccessful transmissions. We wantour network to have a higher number of successful transmissions than unsuccessfulones, and we will use the following metrics to analyze the interference that causestransmissions to fail or succeed. These metrics are mainly a classification of thetypes of nodes in the network.
We consider three types of nodes:
1. Hidden nodes: If two nodes A and B are in the same channel and cannotsense each other (they receive less than −82 dBms from the other one’s signal),and the difference in their signal strength at A’s receiver is lower than a certainthreshold, B is a hidden node of A. This relationship can be reciprocal, but itdoes not need to be.
2. Contending nodes: If two nodes sense each other they are contending nodes,and like before, this can be a reciprocal relationship but it does not need tobe.
3. Exposed nodes: If two nodes A and B are in different networks that sharethe same channel and can sense each other, if the difference between the powerperceived by their transmissions at A’s receiver is higher than a certain thresh-old, B is an exposed node of A. Once again, this does not need to be reciprocal.It bears mentioning that exposed nodes are a subset of contending nodes.
Let us explain this threshold that we have mentioned: when a node receives a signal,this signal needs to be above a certain SNR ratio to be decoded. The ratio dependson the hardware and the data rate used, but when two signals are received, oneneeds to have a higher transmit power than the other for the node to be able tofilter the weak one out.
The example in figure 4.1 shows the detection of a hidden node: STA 2 receives −91dBms from STA 1. Since STA 2’s CCA is −82 dBm, STA 1 is ignored, but if thetwo STAs transmit at the same time, the AP receives a signal of −48 and −59 dBmsfrom STA 1 and STA 2 respectively. STA 1 has a strong enough signal that the AP
21

can decode it even if they transmit simultaneously, but STA 2 does not, therefore,STA 1 is a hidden node of STA 2.
Figure 4.1: Example of a hidden node when using a threshold of 10 dBs
With this we can now explain how the types of nodes have an effect on the amountof successful transmissions we can find:
If STA 1 is a hidden node of STA 2, that means that STA 1 and STA 2 do not senseeach other, and that sometimes they will try to transmit at the same time, whichwill create a collision: an unsuccessful transmission.
If STA 1 is an exposed node of STA 2, STA 2 will hear STA 1 transmitting andhold its transmission to not create a collision in a situation when both STAs couldtransmit at the same time without issues. These nodes do not create an unsuccessfultransmission but stop a successful one from happening.
The contending nodes are just part of the CSMA mechanism, two contending nodesrespect each others transmissions and evade collisions. This works as intended on asingle AP network, but when there are multiple APs it leads to exposed nodes.
An ideal network should have no hidden or exposed nodes, and every node shouldbe a contending node for every other node.
4.2.c Simulation approach
We will now explain how the transmissions are simulated1: First, at the beginning ofthe simulation we define which node will be the receiver for each node. In the case ofthe STAs they all transmit to their respective APs, and the APs choose one randomSTA associated to them as their receiver. Now that every node has a receiver we cancheck which transmissions will create problems with each other. Following what weshowed in Figure 4.1 we now check which nodes are hidden, exposed or contendingnodes for every STA and AP in the network and store this information in a table.
Finally we simulate transmission slots in a simplification of the CSMA mechanism.For every slot, every node in the network tries to transmit. We assign a random
1The code for the simulation can be found in: https://github.com/MCarrascosaZ/Improving-user-association-in-HD-WLANs-using-Machine-Learning
22
number to every node in the network and then check them one by one. The firstone we check gets to transmit by default, the second one gets to transmit as longas the first node is not its contender, the third one transmits if the first and secondone are not its contenders, and so on.
Once we go through all the nodes we have obtained a list of nodes that will tryto transmit in the slot, and now we check if they are hidden nodes of anothertransmitting node. If a transmitting node has a hidden node in this list, then itstransmission is considered unsuccessful, if it does not, then the transmission will besuccessful.
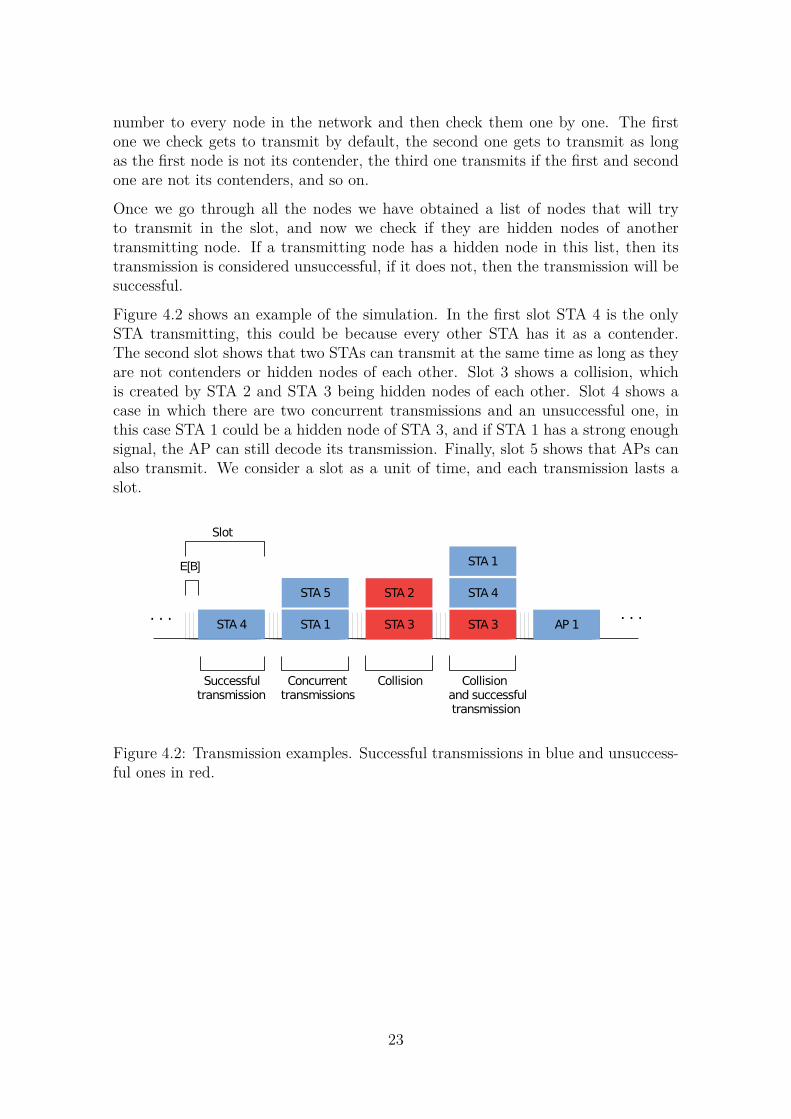
Figure 4.2 shows an example of the simulation. In the first slot STA 4 is the onlySTA transmitting, this could be because every other STA has it as a contender.The second slot shows that two STAs can transmit at the same time as long as theyare not contenders or hidden nodes of each other. Slot 3 shows a collision, whichis created by STA 2 and STA 3 being hidden nodes of each other. Slot 4 shows acase in which there are two concurrent transmissions and an unsuccessful one, inthis case STA 1 could be a hidden node of STA 3, and if STA 1 has a strong enoughsignal, the AP can still decode its transmission. Finally, slot 5 shows that APs canalso transmit. We consider a slot as a unit of time, and each transmission lasts aslot.
Figure 4.2: Transmission examples. Successful transmissions in blue and unsuccess-ful ones in red.
23

4.3 Results
Every simulation uses random values for the placement of the STAs. For the APswe will use mostly fixed placements that will be specified in each section. Each nodehas a contention window of 16, a CCA of −82 dBm and a transmission power of 20dBm. Every simulation is repeated 100 times with a different seed each time.
4.3.a Multiple Overlapping WLANs
In this first simulation we show the effects of having multiple networks in range ofeach other and on the same channel. We will use three configurations in which thelocation of 10 STAs will be randomized, but the position of the APs will be fixed.In the first configuration we have 2 APs side by side, in the second one we have 3APs side by side, and on the third one we set 4 APs in a square formation. We showthese configurations in Figure 4.3
0 10 20 30 40 50
x [meters]
0
10
20
30
40
50
y [m
ete
rs]
1 2
(a) 2 APs in a line
0 10 20 30 40 50
x [meters]
0
10
20
30
40
50
y [
me
ters
]
1 2 3
(b) 3 APs in a line
0 10 20 30 40 50
x [meters]
0
10
20
30
40
50
y [m
ete
rs]
1
23
4
(c) 4 APs in a grid
Figure 4.3: AP configurations
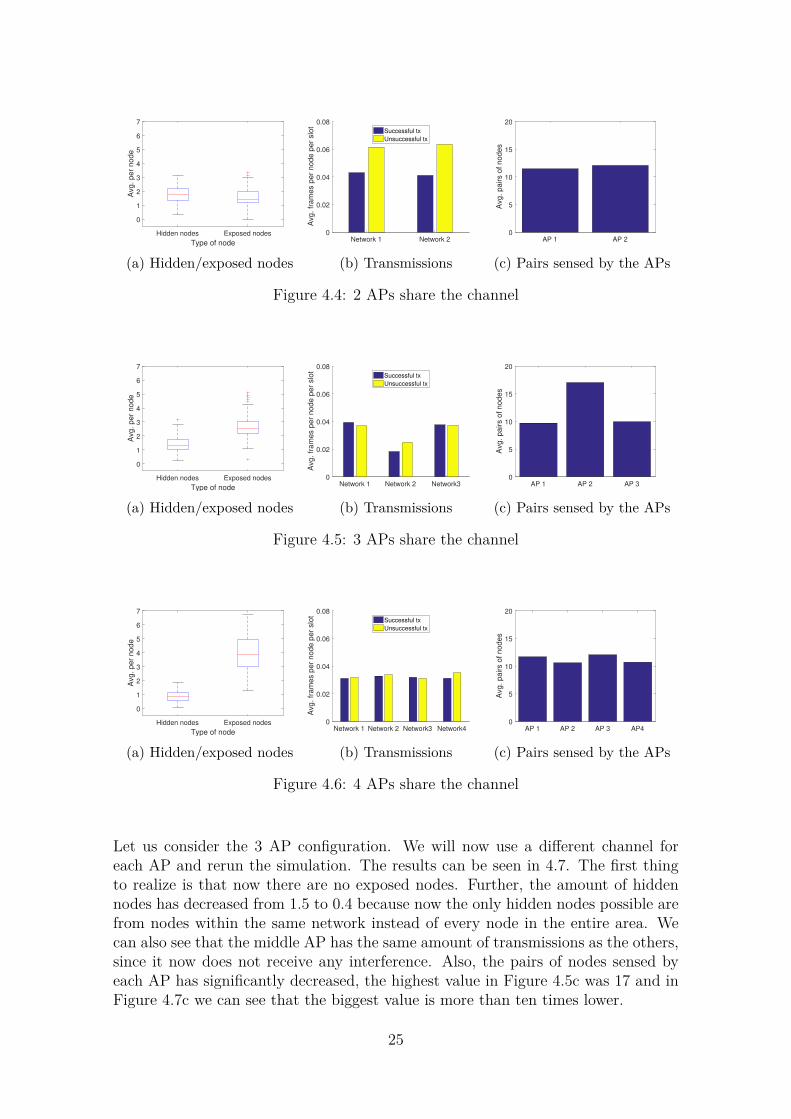
Figure 4.4a shows the average amount of hidden and exposed nodes for each node inthe network. We can compare with figure 4.5a to see that as the amount of hiddennodes is a bit smaller when using 3 APs, and even smaller when using 4. This isdue to the increasing distances between APs. In the case of the 3 APs, even if themiddle one is close to the other two, the first and third AP are at a distance of 25metres, and this allows some of their nodes to not create interference.
Figures 4.4c,4.5c and 4.6c show how many pairs of nodes each AP can sense inwhich the nodes of that pair cannot sense each other (i.e: AP 1 senses STA 1 and2, but STA 1 does not sense STA 2). This serves as an approximation of how muchinterference each AP will receive. We can see that in the cases of 2 and 4 APs, sincethey are balanced scenarios, the amount of pairs is similar for each AP. However, inthe configuration that uses 3 APs we can see the imbalance created in the middle AP,which sees 7 pairs more than the other APs. The consequence of this can be seen inFigure 4.5b, where the middle network has half the amount of transmissions as theother APs, and is the only one with more unsuccessful than successful transmissions.
24
Hidden nodes Exposed nodes
Type of node
0
1
2
3
4
5
6
7A
vg. per
node
(a) Hidden/exposed nodes
Network 1 Network 20
0.02
0.04
0.06
0.08
Avg. fr
am
es p
er
node p
er
slo
t
Successful tx
Unsuccessful tx
(b) Transmissions
AP 1 AP 20
5
10
15
20
Avg. pairs o
f nodes
(c) Pairs sensed by the APs
Figure 4.4: 2 APs share the channel
Hidden nodes Exposed nodes
Type of node
0
1
2
3
4
5
6
7
Avg. per
node
(a) Hidden/exposed nodes
Network 1 Network 2 Network30
0.02
0.04
0.06
0.08
Avg. fr
am
es p
er
node p
er
slo
t
Successful tx
Unsuccessful tx
(b) Transmissions
AP 1 AP 2 AP 30
5
10
15
20
Avg. pairs o
f nodes
(c) Pairs sensed by the APs
Figure 4.5: 3 APs share the channel
Hidden nodes Exposed nodes
Type of node
0
1
2
3
4
5
6
7
Avg. per
node
(a) Hidden/exposed nodes
Network 1 Network 2 Network3 Network40
0.02
0.04
0.06
0.08
Avg. fr
am
es p
er
node p
er
slo
t
Successful tx
Unsuccessful tx
(b) Transmissions
AP 1 AP 2 AP 3 AP40
5
10
15
20
Avg. pairs o
f nodes
(c) Pairs sensed by the APs
Figure 4.6: 4 APs share the channel
Let us consider the 3 AP configuration. We will now use a different channel foreach AP and rerun the simulation. The results can be seen in 4.7. The first thingto realize is that now there are no exposed nodes. Further, the amount of hiddennodes has decreased from 1.5 to 0.4 because now the only hidden nodes possible arefrom nodes within the same network instead of every node in the entire area. Wecan also see that the middle AP has the same amount of transmissions as the others,since it now does not receive any interference. Also, the pairs of nodes sensed byeach AP has significantly decreased, the highest value in Figure 4.5c was 17 and inFigure 4.7c we can see that the biggest value is more than ten times lower.
25

Hidden nodes Exposed nodes
Type of node
0
1
2
3
4
5
6
7A
vg. per
node
(a) Hidden/exposed nodes
Network 1 Network 2 Network30
0.02
0.04
0.06
0.08
Avg. fr
am
es p
er
node p
er
slo
t Successful tx
Unsuccessful tx
(b) Transmissions
AP 1 AP 2 AP 30
5
10
15
20
Avg. pairs o
f nodes
(c) Pairs sensed by the APs
Figure 4.7: 3 APs with different channels
4.3.b Increasing nodes in the network
In this section we will check the effects that adding more nodes will have on thenetwork. We will use two configurations: one in which we fix the amount of APsto 4 and increase the amount of STAs from 4 to 100, and another in which we fixthe number of STAs to 100 and increase the amount of APs from 4 to 50. In bothcases the first AP will be located at the center of the area, and every other nodewill have a random location. The APs pick one of eight channels at random. Werun 100 iterations every time.
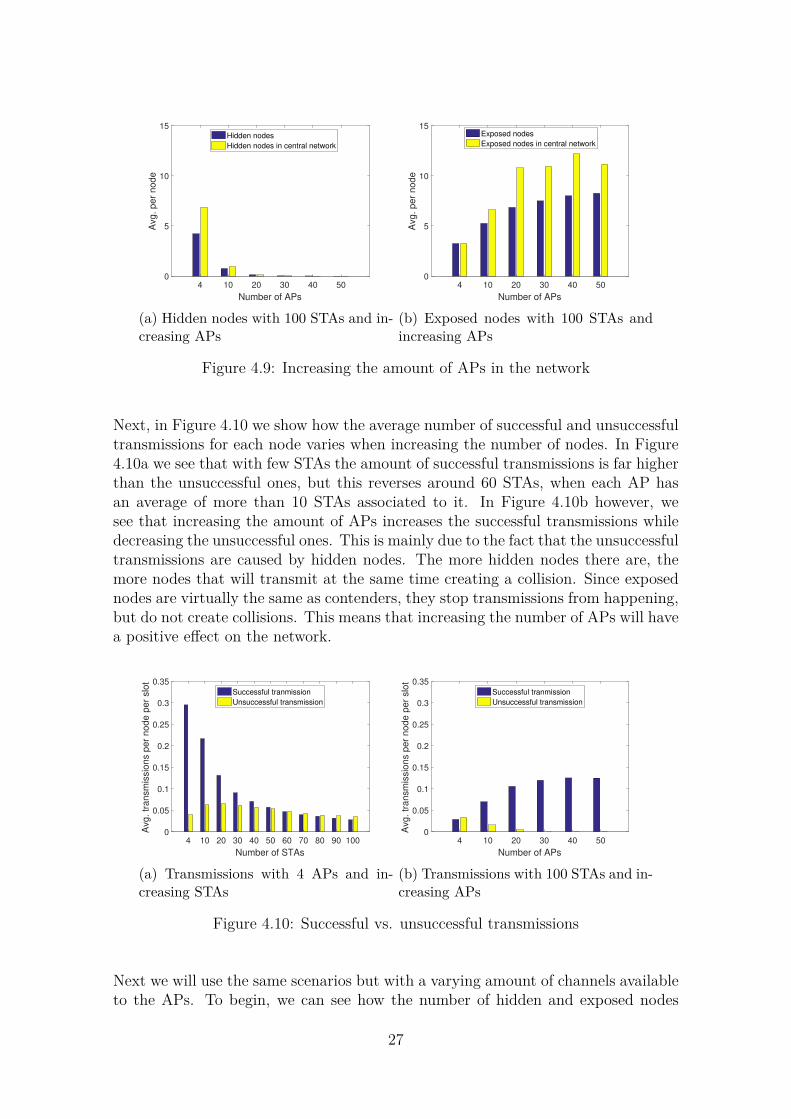
We start by checking the number of hidden and exposed nodes. In Figures 4.8 and4.9 we show the average amount of hidden and exposed nodes for each configurationand we compare them to the central network, which is in the busiest location of thearea. We can see in Figures 4.8a and 4.8b that as the amount of STAs increase, so doboth the hidden and the exposed nodes. This behaviour is replicated in Figure 4.9b,where we see the exposed nodes also increase when we increase the number of APs.Figure 4.9a however, shows that by adding more APs we can greatly reduce theamount of hidden nodes in our network. The hidden and exposed nodes perceivedby the central network serve once again to show that the position of the nodes is animportant part of avoiding interference.
4 10 20 30 40 50 60 70 80 90 100
Number of STAs
0
1
2
3
4
5
6
7
Avg
. p
er
no
de
Hidden nodes
Hidden nodes in central network
(a) Hidden nodes with 4 APs and in-creasing STAs
4 10 20 30 40 50 60 70 80 90 100
Number of STAs
0
1
2
3
4
5
6
7
Avg
. p
er
no
de
Exposed nodes
Exposed nodes in central network
(b) Exposed nodes with 4 APs and in-creasing STAs
Figure 4.8: Increasing the amount of STAs in the network
26
4 10 20 30 40 50
Number of APs
0
5
10
15
Avg
. p
er
no
de
Hidden nodes
Hidden nodes in central network
(a) Hidden nodes with 100 STAs and in-creasing APs
4 10 20 30 40 50
Number of APs
0
5
10
15
Avg
. p
er
no
de
Exposed nodes
Exposed nodes in central network
(b) Exposed nodes with 100 STAs andincreasing APs
Figure 4.9: Increasing the amount of APs in the network
Next, in Figure 4.10 we show how the average number of successful and unsuccessfultransmissions for each node varies when increasing the number of nodes. In Figure4.10a we see that with few STAs the amount of successful transmissions is far higherthan the unsuccessful ones, but this reverses around 60 STAs, when each AP hasan average of more than 10 STAs associated to it. In Figure 4.10b however, wesee that increasing the amount of APs increases the successful transmissions whiledecreasing the unsuccessful ones. This is mainly due to the fact that the unsuccessfultransmissions are caused by hidden nodes. The more hidden nodes there are, themore nodes that will transmit at the same time creating a collision. Since exposednodes are virtually the same as contenders, they stop transmissions from happening,but do not create collisions. This means that increasing the number of APs will havea positive effect on the network.
4 10 20 30 40 50 60 70 80 90 100
Number of STAs
0
0.05
0.1
0.15
0.2
0.25
0.3
0.35
Avg
. tr
an
sm
issio
ns p
er
no
de
pe
r slo
t
Successful tranmission
Unsuccessful transmission
(a) Transmissions with 4 APs and in-creasing STAs
4 10 20 30 40 50
Number of APs
0
0.05
0.1
0.15
0.2
0.25
0.3
0.35
Avg
. tr
an
sm
issio
ns p
er
no
de
pe
r slo
t
Successful tranmission
Unsuccessful transmission
(b) Transmissions with 100 STAs and in-creasing APs
Figure 4.10: Successful vs. unsuccessful transmissions
Next we will use the same scenarios but with a varying amount of channels availableto the APs. To begin, we can see how the number of hidden and exposed nodes
27

react in Figure 4.11 and 4.12. We see that predictably, both hidden and exposednodes decrease once we have more channels available, and that this is the same nomatter what type of node we add to the network.
4 10 20 30 40 50 60 70 80 90 100
Number of STAs
0
2
4
6
8
10
12
14
Avg
. H
idd
en
no
de
s p
er
no
de
2 channels
4 channels
8 channels
(a) Hidden nodes with 4 APs and in-creasing STAs
4 10 20 30 40 50 60 70 80 90 100
Number of STAs
0
2
4
6
8
10
12
14
Avg
. E
xp
ose
d n
od
es p
er
no
de
2 channels
4 channels
8 channels
(b) Exposed nodes with 4 APs and in-creasing STAs
Figure 4.11: Hidden and exposed nodes with increasing number of channels
4 10 20 30 40 50
Number of APs
0
5
10
15
20
25
30
35
Avg
. H
idd
en
no
de
s p
er
no
de
2 channels
4 channels
8 channels
(a) Hidden nodes with 100 STAs and in-creasing APs
4 10 20 30 40 50
Number of APs
0
5
10
15
20
25
30
35
Avg
. E
xp
ose
d n
od
es p
er
no
de
2 channels
4 channels
8 channels
(b) Exposed nodes with 100 STAs andincreasing APs
Figure 4.12: Hidden and exposed nodes with increasing number of channels
When we look at how the successful transmissions change when we use more channelswe find the expected result in Figures 4.13a and 4.14a, where we see that the morechannels we have, the more successful transmissions we will get. In the case of theunsuccessful transmissions however, we see that more channels can actually havethem increase instead of decrease. If we look at Figure 4.13b we see that up untilthere are 20 STAs, there are more unsuccessful transmissions with less channels,and after that, there are more. In the case of Figure 4.14b, with 4 APs less channelswork better, but as the number of APs increases the difference between using 2,4 or8 channels starts to become smaller.
When increasing STAs, the increase in unsuccessful transmissions is due to thehigher amount of contending nodes. When using 2 channels the amount of exposed
28

nodes and contender nodes on the same channel is higher than when using 8. Thismeans that every single node has more nodes that stop it from transmitting. Whenusing 8 channels there are less contenders on the same channel, which means thenodes get to transmit more often, creating collisions.
4 10 20 30 40 50 60 70 80 90 100
Number of STAs
0
0.05
0.1
0.15
0.2
0.25
0.3
0.35
Avg
. su
cce
ssfu
l tx
pe
r n
od
e p
er
slo
t
2 channels
4 channels
8 channels
(a) Successful transmissions
4 10 20 30 40 50 60 70 80 90 100
Number of STAs
0
0.05
0.1
0.15
0.2
0.25
0.3
0.35
Avg
. u
nsu
cce
ssfu
l tx
pe
r n
od
e p
er
slo
t
2 channels
4 channels
8 channels
(b) Unsuccessful transmissions
Figure 4.13: Transmissions with 4 APs and increasing number of STAs and channels
For the case in which we increase the amount of APs, we always have the samenumber of STAs (100). We start by using 4 APs, and this means that each nodehas an average of 25 contenders or possible hidden nodes with 8 channels, but anaverage of 50 when using 2 channels. If we look back to Figures 4.12a and 4.12bwe can see that the amount of exposed nodes is far higher than the amount ofhidden nodes. What happens in this case is that when we use less channels, thehigh amount of exposed nodes prevents most nodes from transmitting, and whenthey get to transmit, the amount of hidden nodes is small enough that they causefew collisions. However, when we use more channels the amount of hidden nodesslightly decreases while the number of exposed nodes does so heavily, meaning thatnodes get more chances to transmit with the same chance of a collision when theydo so.
4 10 20 30 40 50
Number of APs
0
0.05
0.1
0.15
Avg
. su
cce
ssfu
l tx
pe
r n
od
e p
er
slo
t
2 channels
4 channels
8 channels
(a) Successful transmissions
4 10 20 30 40 50
Number of APs
0
0.05
0.1
0.15
Avg
. u
nsu
cce
ssfu
l tx
pe
r n
od
e p
er
slo
t
2 channels
4 channels
8 channels
(b) Unsuccessful transmissions
Figure 4.14: Transmissions with 100 STAs and increasing number of APs and chan-nels
29
4.3.c Capture effect
The capture effect refers to the fact that when a node receives two signals at thesame time, it can only decode one or none of them, depending on their difference insignal strength. The stronger signal is decoded, and the weakest is treated as noise.
In our simulation we have considered the following: two nodes that do not senseeach other are not hidden nodes as long as the receiver can decode one of the signals.When there are two transmissions at the same time because of two nodes not sensingeach other, the receiver may be able to decode it depending on their SNR. If it candecode it, we do not consider them hidden nodes because the slot, at least for twoout of the three nodes in this conversation, has proceeded without an issue. For theexposed nodes we consider something similar: if the difference in the SNR of twosignals from nodes on different networks is big enough to not create a collision if thenodes transmitted, then we consider them exposed nodes, otherwise, they should becalled contenders since they would create a collision if they transmitted.
The SNR needed to decode a signal depends on two things: the data rate and thehardware used. The higher the data rate used the higher the SNR needed willbe, this is studied in [33], where they propose to use lower data rates to improveperformance thanks to lowering this SNR threshold, avoiding packet loss. The SNRneeded also depends on the hardware used. In [34], the authors show that two nodeswith the same antenna model can have a different threshold, in their case the samethey find a difference of almost 2 dB. The authors in the previously mentioned [33]also discuss a specific case in which the strongest signal comes after the first weakersignal, and in that case they found a minimum threshold of 10 dBs which theytheorize could be programmed into the hardware to protect weaker signals up tothat threshold.
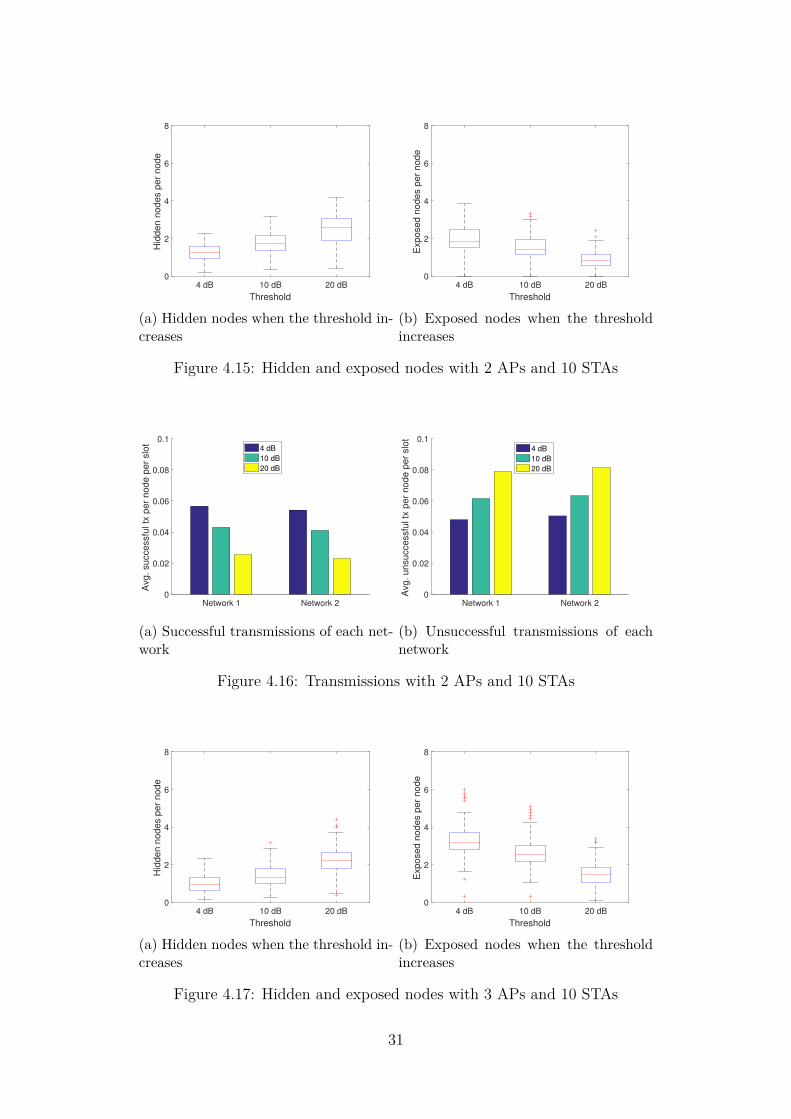
We will begin with the three configurations we used previously, using 10 STAs and2, 3 and 4 APs on the same channel. Figures 4.15, 4.17, and 4.19 show the averagehidden and exposed nodes for each node in the network, as well as the averagesuccessful and unsuccessful transmissions averaged across 100 iterations.
The first thing to see from these plots is that the overall tendencies we saw beforeare still present, the middle AP in the 3 AP configuration is going to be moresaturated than the others no matter what our SNR threshold is. What changesis the amount of hidden nodes and exposed nodes we perceive. When increasingthe SNR threshold we make it so that signals are harder to decode because nodesthat are relatively close to each other will usually have signals of similar strength,this means that the higher the threshold, the higher the distance (or the channelinterference) between the contending nodes needs to be. We can see this in Figures4.15a, 4.17a and 4.19a, where the amount of hidden nodes increases steadily withthe threshold. Figures 4.15b, 4.17b and 4.19b however, show that the amount ofexposed nodes has decreased, meaning that the nodes can sense their contendersmore accurately.
Finally, Figures 4.16a, 4.18a and 4.20a show that a lower threshold will benefit thenetwork by having more successful transmissions and less unsuccessful ones.
30
4 dB 10 dB 20 dB
Threshold
0
2
4
6
8
Hid
de
n n
od
es p
er
no
de
(a) Hidden nodes when the threshold in-creases
4 dB 10 dB 20 dB
Threshold
0
2
4
6
8
Exp
ose
d n
od
es p
er
no
de
(b) Exposed nodes when the thresholdincreases
Figure 4.15: Hidden and exposed nodes with 2 APs and 10 STAs
Network 1 Network 20
0.02
0.04
0.06
0.08
0.1
Avg
. su
cce
ssfu
l tx
pe
r n
od
e p
er
slo
t
4 dB
10 dB
20 dB
(a) Successful transmissions of each net-work
Network 1 Network 20
0.02
0.04
0.06
0.08
0.1
Avg
. u
nsu
cce
ssfu
l tx
pe
r n
od
e p
er
slo
t
4 dB
10 dB
20 dB
(b) Unsuccessful transmissions of eachnetwork
Figure 4.16: Transmissions with 2 APs and 10 STAs
4 dB 10 dB 20 dB
Threshold
0
2
4
6
8
Hid
de
n n
od
es p
er
no
de
(a) Hidden nodes when the threshold in-creases
4 dB 10 dB 20 dB
Threshold
0
2
4
6
8
Exp
ose
d n
od
es p
er
no
de
(b) Exposed nodes when the thresholdincreases
Figure 4.17: Hidden and exposed nodes with 3 APs and 10 STAs
31

Network 1 Network 2 Network 30
0.02
0.04
0.06
0.08
0.1
Avg
. su
cce
ssfu
l tx
pe
r n
od
e p
er
slo
t4 dB
10 dB
20 dB
(a) Successful transmissions of each net-work
Network 1 Network 2 Network 30
0.02
0.04
0.06
0.08
0.1
Avg
. u
nsu
cce
ssfu
l tx
pe
r n
od
e p
er
slo
t
4 dB
10 dB
20 dB
(b) Unsuccessful transmissions of eachnetwork
Figure 4.18: Transmissions with 3 APs and 10 STAs
4 dB 10 dB 20 dB
Threshold
0
2
4
6
8
Hid
de
n n
od
es p
er
no
de
(a) Hidden nodes when the threshold in-creases
4 dB 10 dB 20 dB
Threshold
0
2
4
6
8
Exp
ose
d n
od
es p
er
no
de
(b) Exposed nodes when the thresholdincreases
Figure 4.19: Hidden and exposed nodes with 4 APs and 10 STAs
Network 1 Network 2 Network 3 Network 40
0.02
0.04
0.06
0.08
0.1
Avg
. su
cce
ssfu
l tx
pe
r n
od
e p
er
slo
t
4 dB
10 dB
20 dB
(a) Successful transmissions of each net-work
Network 1 Network 2 Network 3 Network 40
0.02
0.04
0.06
0.08
0.1
Avg
. u
nsu
cce
ssfu
l tx
pe
r n
od
e p
er
slo
t
4 dB
10 dB
20 dB
(b) Unsuccessful transmissions of eachnetwork
Figure 4.20: Transmissions with 4 APs and 10 STAs
32

Now we will check if the results we saw in these first configurations hold whenwe increase the number of nodes in the network. Figure 4.21 shows the averagehidden and exposed nodes per node as the number of STAs increases. Previously wehave seen that increasing the number of STAs increases the amount of hidden andexposed nodes, and increasing the threshold increases the amount of hidden nodesand decreases the exposed nodes. When we do both, we see that hidden nodes doincrease, but exposed nodes decrease slightly, at 100 STAs with 4 dBs we get 2.6exposed nodes, while with 20 dBs we get 1.3. In this case, it seems that the changein the SNR threshold has bigger effects than the amount of STAs in the network.
4 10 20 30 40 50 60 70 80 90 100
Number of STAs
0
5
10
15
20
25
30
Avg. H
idden n
odes p
er
node
(a) Threshold of 4 dBs
4 10 20 30 40 50 60 70 80 90 100
Number of STAs
0
5
10
15
20
25
30A
vg. H
idden n
odes p
er
node
(b) Threshold of 10 dBs
4 10 20 30 40 50 60 70 80 90 100
Number of STAs
0
5
10
15
20
25
30
Avg. H
idden n
odes p
er
node
(c) Threshold of 20 dBs
4 10 20 30 40 50 60 70 80 90 100
Number of STAs
0
5
10
15
20
25
30
Avg. E
xposed n
odes p
er
node
(d) Threshold of 4 dBs
4 10 20 30 40 50 60 70 80 90 100
Number of STAs
0
5
10
15
20
25
30
Avg. E
xposed n
odes p
er
node
(e) Threshold of 10 dBs
4 10 20 30 40 50 60 70 80 90 100
Number of STAs
0
5
10
15
20
25
30
Avg. E
xposed n
odes p
er
node
(f) Threshold of 20 dBs
Figure 4.21: Boxplots of the average hidden and exposed nodes with 4 APs andincreasing STAs
4 10 20 30 40 50 60 70 80 90 100
Number of STAs
0
0.05
0.1
0.15
0.2
0.25
0.3
0.35
Avg
. su
cce
ssfu
l tx
pe
r n
od
e p
er
slo
t
4 dB
10 dB
20 dB
(a) Successful transmissions
4 10 20 30 40 50 60 70 80 90 100
Number of STAs
0
0.05
0.1
0.15
0.2
0.25
0.3
0.35
Avg
. u
nsu
cce
ssfu
l tx
pe
r n
od
e p
er
slo
t
4 dB
10 dB
20 dB
(b) Unsuccessful transmissions
Figure 4.22: Transmissions with 4 APs when the threshold and STAs increase
Figure 4.22 shows how many transmissions every node gets on average when we
33

add STAs and change the threshold. The number of successful transmissions pernode decreases the more nodes there are, they also decrease when the threshold ishigher, and the reverse happens with the unsuccessful transmissions, we get moreof them with a higher threshold. In this case, the difference between unsuccessfultransmissions between thresholds seems to get smaller the more STAs we add.
Next, we will increase the number of APs. In Section 4.3.b we saw that as we addAPs we get less hidden nodes and more exposed nodes. In this section we saw thatwhen we increase the threshold we see more hidden nodes and less exposed ones.Figure 4.23 shows the hidden nodes for each threshold. While the effect of addingAPs is still strong, we can see more hidden nodes with a smaller threshold. Whenwe use 4 dBs and 10 APs, the median is 0.67 hidden nodes, and with 20 dBs wehave 2.05. Which means that increasing the number of APs can mitigate the effectof the threshold, depending on how big the capture effect is, the bigger amount ofAPs we will need however.
4 10 20 30 40 50
Number of APs
0
10
20
30
40
Avg. H
idden n
odes p
er
node
(a) Threshold of 4 dBs
4 10 20 30 40 50
Number of APs
0
10
20
30
40
Avg. H
idden n
odes p
er
node
(b) Threshold of 10 dBs
4 10 20 30 40 50
Number of APs
0
10
20
30
40
Avg. H
idden n
odes p
er
node
(c) Threshold of 20 dBs
Figure 4.23: Boxplots of the average hidden nodes with 100 STAs and increasingAPs
4 10 20 30 40 50
Number of APs
0
10
20
30
40
Avg. E
xposed n
odes p
er
node
(a) Threshold of 4 dBs
4 10 20 30 40 50
Number of APs
0
10
20
30
40
Avg. E
xposed n
odes p
er
node
(b) Threshold of 10 dBs
4 10 20 30 40 50
Number of APs
0
10
20
30
40
Avg. E
xposed n
odes p
er
node
(c) Threshold of 20 dBs
Figure 4.24: Boxplots of the average exposed nodes with 100 STAs and increasingAPs
In Figure 4.24 we see a similar tendency, adding APs increases the amount of exposednodes, yet the higher the threshold the smaller the amount of exposed nodes we canfind when we compare the three figures.
Finally, we check how the transmissions are affected by the threshold as we addAPs. In Figure 4.25a we see that a smaller threshold gives us more successful
34

transmissions, yet this effect is diminished as we increase the number of APs, tothe point that at 50 APs the values are almost the same. Figure 4.25b works asexpected, with a higher threshold always leading to more unsuccessful transmissions.
4 10 20 30 40 50
Number of APs
0
0.05
0.1
0.15
Avg
. su
cce
ssfu
l tx
pe
r n
od
e p
er
slo
t
4 dB
10 dB
20 dB
(a) Successful transmissions
4 10 20 30 40 50
Number of APs
0
0.05
0.1
0.15
Avg
. u
nsu
cce
ssfu
l tx
pe
r n
od
e p
er
slo
t
4 dB
10 dB
20 dB
(b) Unsuccessful transmissions
Figure 4.25: Transmissions with 100 STAs when the threshold and APs increase
4.3.d CCA and power adjustment
CCA adjustment
In this section we change the CCA of the STAs to see if it is a viable solution toincrease the number of transmissions of our nodes. All our STAs start with a CCAof−82 dBm. This is the minimum RSSI required to maintain a connection betweenan AP and a STA.
Once all STAs are associated, we change the CCA so that the STAs use the minimumCCA that allows them to receive frames from the AP consistently. We do thisfollowing Equation 4.3, in which CSth_max is a maximum threshold we choose as astopping point so that our STA cannot end up with a CCA that is too high to bepractical, in this case −42 dBm. EAP_RSSI is the mean received power from the APbeacons. Finally, the margin is another value we set to ensure that we do not letour CCA be too high. If the value chosen is lower than −82 dBm, we leave the CCAas the default.
CCA =
{−82, if (EAP_RSSI + margin) ≤ −82
min(CSth_max, (EAP_RSSI + margin)), otherwise(4.3)
Simply put, if a STA receives −65 dBm from an AP, the default CCA of −82 dBm istoo generous and will allow transmissions from other STAs that are beyond the APto reach us, meaning that our number of contenders will be higher than necessary.By increasing the CCA we will avoid these situations.
35
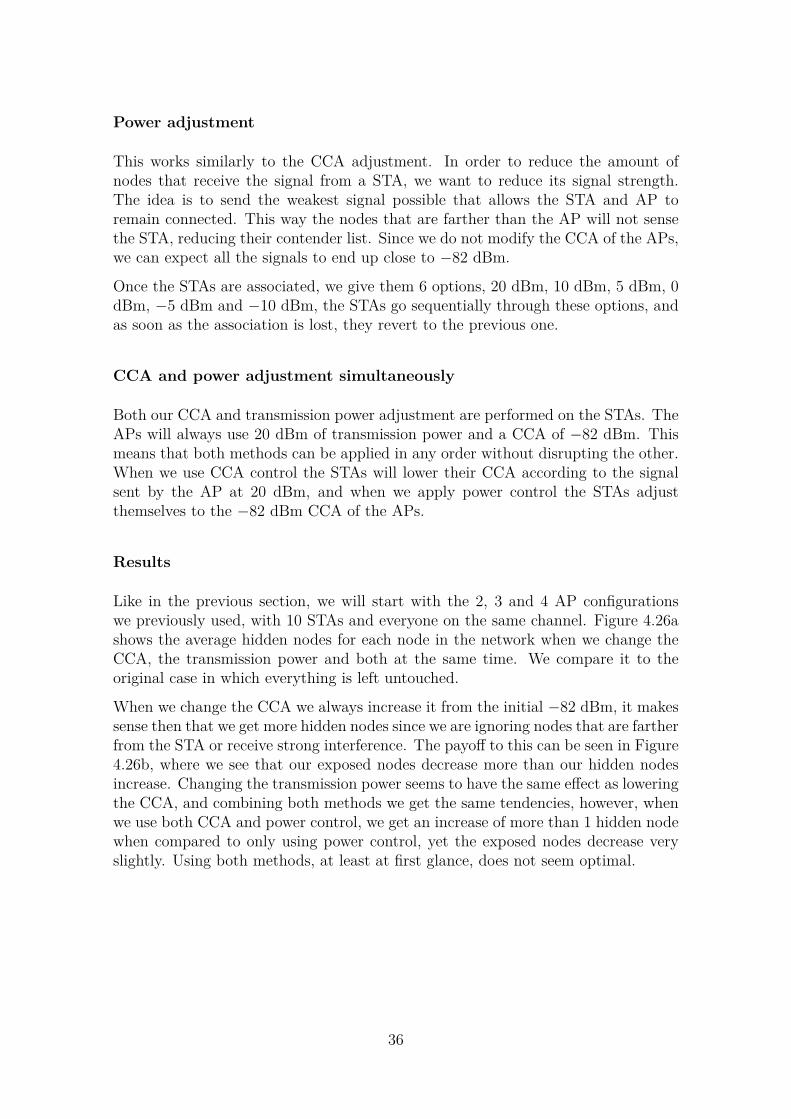
Power adjustment
This works similarly to the CCA adjustment. In order to reduce the amount ofnodes that receive the signal from a STA, we want to reduce its signal strength.The idea is to send the weakest signal possible that allows the STA and AP toremain connected. This way the nodes that are farther than the AP will not sensethe STA, reducing their contender list. Since we do not modify the CCA of the APs,we can expect all the signals to end up close to −82 dBm.
Once the STAs are associated, we give them 6 options, 20 dBm, 10 dBm, 5 dBm, 0dBm, −5 dBm and −10 dBm, the STAs go sequentially through these options, andas soon as the association is lost, they revert to the previous one.
CCA and power adjustment simultaneously
Both our CCA and transmission power adjustment are performed on the STAs. TheAPs will always use 20 dBm of transmission power and a CCA of −82 dBm. Thismeans that both methods can be applied in any order without disrupting the other.When we use CCA control the STAs will lower their CCA according to the signalsent by the AP at 20 dBm, and when we apply power control the STAs adjustthemselves to the −82 dBm CCA of the APs.
Results
Like in the previous section, we will start with the 2, 3 and 4 AP configurationswe previously used, with 10 STAs and everyone on the same channel. Figure 4.26ashows the average hidden nodes for each node in the network when we change theCCA, the transmission power and both at the same time. We compare it to theoriginal case in which everything is left untouched.
When we change the CCA we always increase it from the initial −82 dBm, it makessense then that we get more hidden nodes since we are ignoring nodes that are fartherfrom the STA or receive strong interference. The payoff to this can be seen in Figure4.26b, where we see that our exposed nodes decrease more than our hidden nodesincrease. Changing the transmission power seems to have the same effect as loweringthe CCA, and combining both methods we get the same tendencies, however, whenwe use both CCA and power control, we get an increase of more than 1 hidden nodewhen compared to only using power control, yet the exposed nodes decrease veryslightly. Using both methods, at least at first glance, does not seem optimal.
36

Figure 4.26c and 4.26d show the average successful and unsuccessful transmissionsper node, separated by network. Here we can see that the CCA adjustment seems tobe the only method worth using in this case, since it gives us an increase in successfultransmissions, with a similar increase in the unsuccessful ones. Every other methoddecreases the successful transmissions and highly increases the unsuccessful ones.We can also see here that using power control alone is far better than using bothpower and CCA control, since unsuccessful transmissions spike from less than 0.7with only power control to more than 1 with both used, while leaving the successfulones at a similar amount.
Standard CCA TxP CCA+TxP
0
1
2
3
4
5
6
7
Avg
. H
idd
en
no
de
s p
er
no
de
(a) Avg. hidden nodes
Standard CCA TxP CCA+TxP
0
1
2
3
4
5
6
7
Avg
. E
xp
ose
d n
od
es p
er
no
de
(b) Avg. exposed nodes
Network 1 Network 20
0.2
0.4
0.6
0.8
1
1.2
Avg
. su
cce
ssfu
l tx
pe
r n
od
e p
er
slo
t Standard
CCA
TxP
CCA+TxP
(c) Avg. successful transmissions by net-work
Network 1 Network 20
0.2
0.4
0.6
0.8
1
1.2
Avg
. u
nsu
cce
ssfu
l tx
pe
r n
od
e p
er
slo
t
Standard
CCA
TxP
CCA+TxP
(d) Avg. unsuccessful transmissions bynetwork
Figure 4.26: Results for 2 APs and 10 STAs
Figure 4.27 shows very similar results to the previous image. CCA control maybe worth using but power control or power and CCA control at the same time arecompletely detrimental to the network. We could gather from this that perhapsavoiding exposed nodes is not as beneficial as avoiding hidden nodes.
37
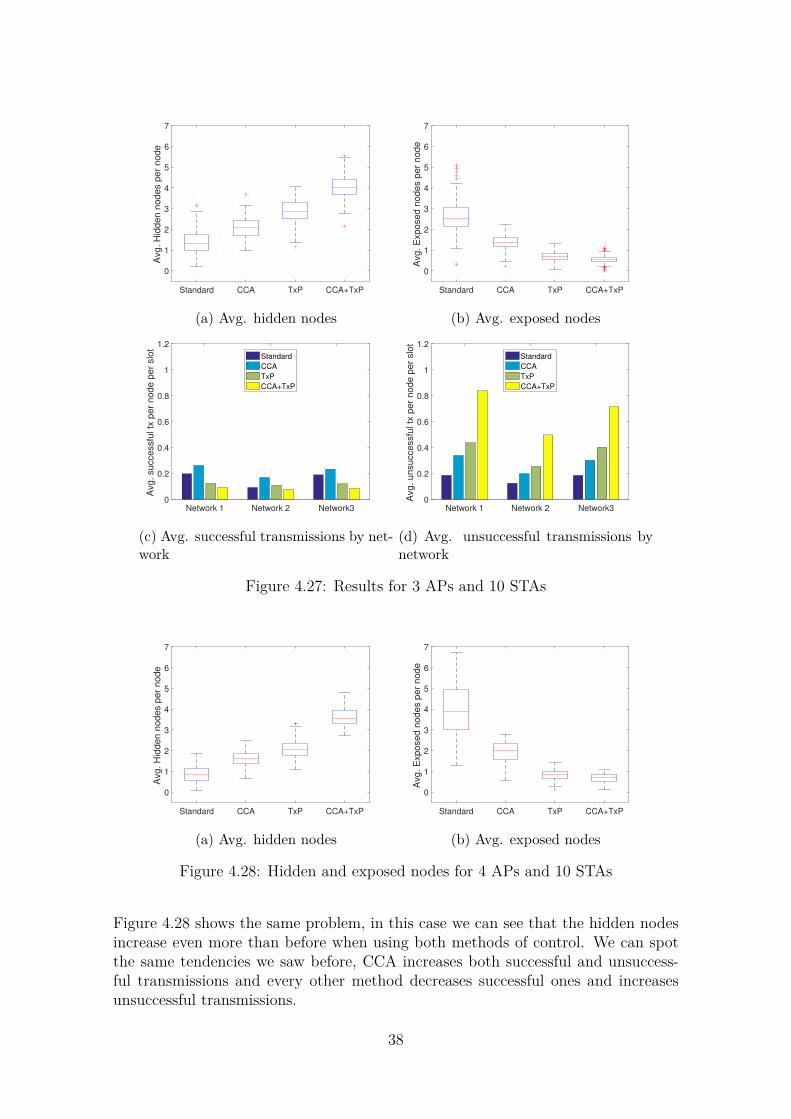
Standard CCA TxP CCA+TxP
0
1
2
3
4
5
6
7
Avg
. H
idd
en
no
de
s p
er
no
de
(a) Avg. hidden nodes
Standard CCA TxP CCA+TxP
0
1
2
3
4
5
6
7
Avg
. E
xp
ose
d n
od
es p
er
no
de
(b) Avg. exposed nodes
Network 1 Network 2 Network30
0.2
0.4
0.6
0.8
1
1.2
Avg
. su
cce
ssfu
l tx
pe
r n
od
e p
er
slo
t
Standard
CCA
TxP
CCA+TxP
(c) Avg. successful transmissions by net-work
Network 1 Network 2 Network30
0.2
0.4
0.6
0.8
1
1.2
Avg
. u
nsu
cce
ssfu
l tx
pe
r n
od
e p
er
slo
t
Standard
CCA
TxP
CCA+TxP
(d) Avg. unsuccessful transmissions bynetwork
Figure 4.27: Results for 3 APs and 10 STAs
Standard CCA TxP CCA+TxP
0
1
2
3
4
5
6
7
Avg
. H
idd
en
no
de
s p
er
no
de
(a) Avg. hidden nodes
Standard CCA TxP CCA+TxP
0
1
2
3
4
5
6
7
Avg
. E
xp
ose
d n
od
es p
er
no
de
(b) Avg. exposed nodes
Figure 4.28: Hidden and exposed nodes for 4 APs and 10 STAs
Figure 4.28 shows the same problem, in this case we can see that the hidden nodesincrease even more than before when using both methods of control. We can spotthe same tendencies we saw before, CCA increases both successful and unsuccess-ful transmissions and every other method decreases successful ones and increasesunsuccessful transmissions.
38
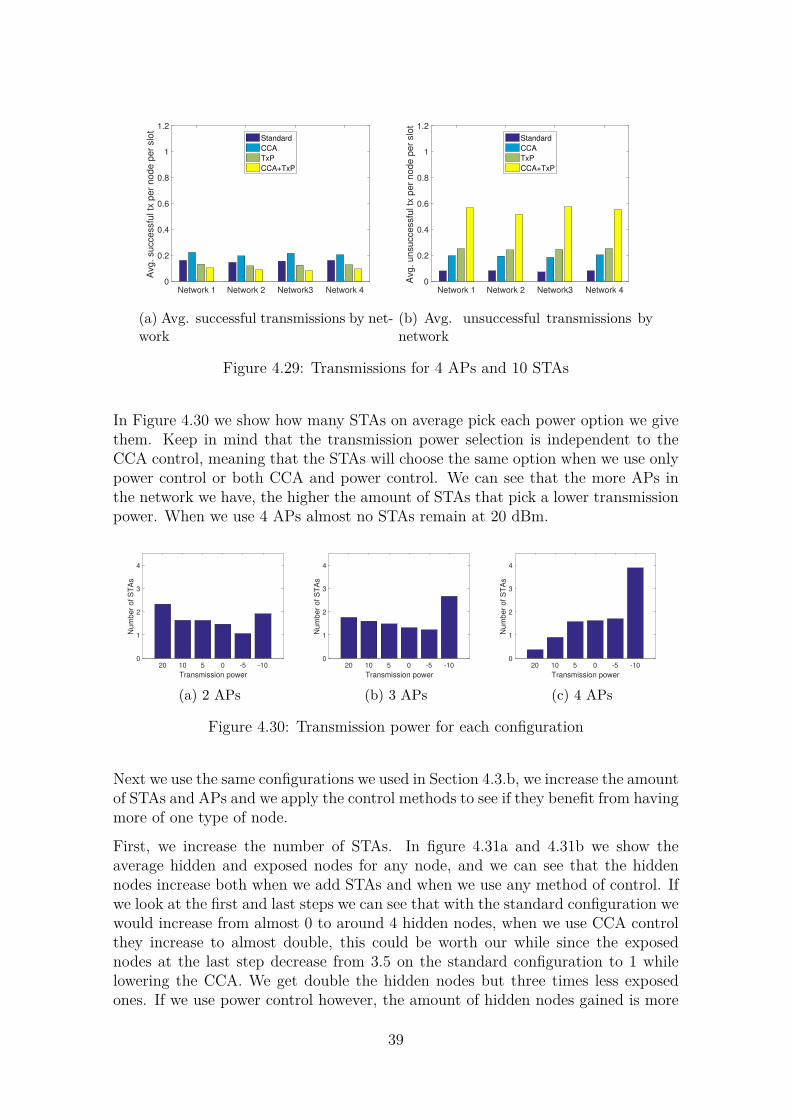
Network 1 Network 2 Network3 Network 40
0.2
0.4
0.6
0.8
1
1.2
Avg
. su
cce
ssfu
l tx
pe
r n
od
e p
er
slo
tStandard
CCA
TxP
CCA+TxP
(a) Avg. successful transmissions by net-work
Network 1 Network 2 Network3 Network 40
0.2
0.4
0.6
0.8
1
1.2
Avg
. u
nsu
cce
ssfu
l tx
pe
r n
od
e p
er
slo
t
Standard
CCA
TxP
CCA+TxP
(b) Avg. unsuccessful transmissions bynetwork
Figure 4.29: Transmissions for 4 APs and 10 STAs
In Figure 4.30 we show how many STAs on average pick each power option we givethem. Keep in mind that the transmission power selection is independent to theCCA control, meaning that the STAs will choose the same option when we use onlypower control or both CCA and power control. We can see that the more APs inthe network we have, the higher the amount of STAs that pick a lower transmissionpower. When we use 4 APs almost no STAs remain at 20 dBm.
20 10 5 0 -5 -10
Transmission power
0
1
2
3
4
Num
ber
of S
TA
s
(a) 2 APs
20 10 5 0 -5 -10
Transmission power
0
1
2
3
4
Num
ber
of S
TA
s
(b) 3 APs
20 10 5 0 -5 -10
Transmission power
0
1
2
3
4
Num
ber
of S
TA
s
(c) 4 APs
Figure 4.30: Transmission power for each configuration
Next we use the same configurations we used in Section 4.3.b, we increase the amountof STAs and APs and we apply the control methods to see if they benefit from havingmore of one type of node.
First, we increase the number of STAs. In figure 4.31a and 4.31b we show theaverage hidden and exposed nodes for any node, and we can see that the hiddennodes increase both when we add STAs and when we use any method of control. Ifwe look at the first and last steps we can see that with the standard configuration wewould increase from almost 0 to around 4 hidden nodes, when we use CCA controlthey increase to almost double, this could be worth our while since the exposednodes at the last step decrease from 3.5 on the standard configuration to 1 whilelowering the CCA. We get double the hidden nodes but three times less exposedones. If we use power control however, the amount of hidden nodes gained is more
39

than five times the standard’s, while the decrease in exposed nodes is not that muchbetter than the one offered by the CCA control.
Figures 4.31c and 4.31d give a similar impression. CCA control increases our suc-cessful and unsuccessful transmissions in a similar proportion. Power control inalmost all cases gives us more unsuccessful transmissions than successful ones. Andusing both at the same time doubles the power control’s effects.
In most cases, if not all, it seems that the best idea would be to leave everything tothe default.
4 10 20 30 40 50 60 70 80 90 100
Number of STAs
0
5
10
15
20
25
Avg
. H
idd
en
no
de
s p
er
no
de
Standard
CCA
TxP
CCA+TxP
(a) Avg. hidden nodes
4 10 20 30 40 50 60 70 80 90 100
Number of STAs
0
5
10
15
20
25
Avg
. E
xp
ose
d n
od
es p
er
no
de
Standard
CCA
TxP
CCA+TxP
(b) Avg. exposed nodes
4 10 20 30 40 50 60 70 80 90 100
Number of STAs
0
0.1
0.2
0.3
0.4
0.5
Avg
. su
cce
ssfu
l tx
pe
r n
od
e p
er
slo
t
Standard
CCA
TxP
CCA+TxP
(c) Avg. successful transmissions
4 10 20 30 40 50 60 70 80 90 100
Number of STAs
0
0.1
0.2
0.3
0.4
0.5
Avg
. u
nsu
cce
ssfu
l tx
pe
r n
od
e p
er
slo
t
Standard
CCA
TxP
CCA+TxP
(d) Avg. unsuccessful transmissions
Figure 4.31: Results with 4 APs when we increase the amount of STAs in thenetwork
40
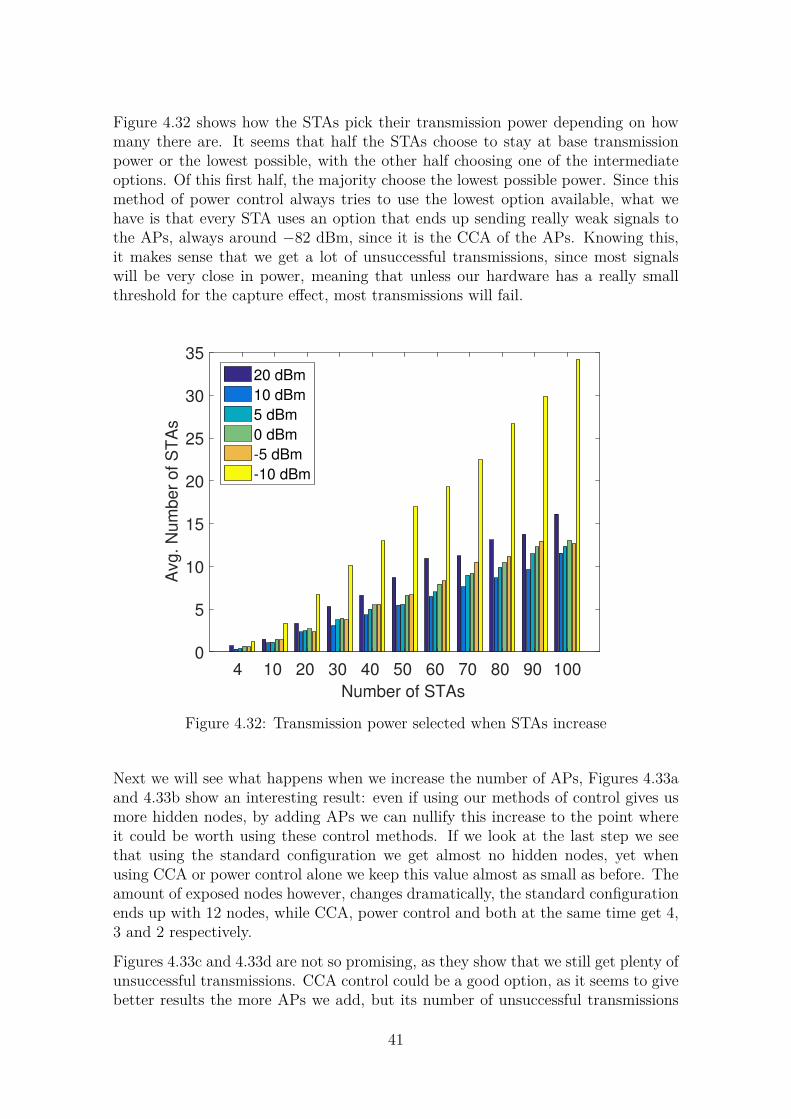
Figure 4.32 shows how the STAs pick their transmission power depending on howmany there are. It seems that half the STAs choose to stay at base transmissionpower or the lowest possible, with the other half choosing one of the intermediateoptions. Of this first half, the majority choose the lowest possible power. Since thismethod of power control always tries to use the lowest option available, what wehave is that every STA uses an option that ends up sending really weak signals tothe APs, always around −82 dBm, since it is the CCA of the APs. Knowing this,it makes sense that we get a lot of unsuccessful transmissions, since most signalswill be very close in power, meaning that unless our hardware has a really smallthreshold for the capture effect, most transmissions will fail.
4 10 20 30 40 50 60 70 80 90 100
Number of STAs
0
5
10
15
20
25
30
35
Avg. N
um
ber
of S
TA
s
20 dBm
10 dBm
5 dBm
0 dBm
-5 dBm
-10 dBm
Figure 4.32: Transmission power selected when STAs increase
Next we will see what happens when we increase the number of APs, Figures 4.33aand 4.33b show an interesting result: even if using our methods of control gives usmore hidden nodes, by adding APs we can nullify this increase to the point whereit could be worth using these control methods. If we look at the last step we seethat using the standard configuration we get almost no hidden nodes, yet whenusing CCA or power control alone we keep this value almost as small as before. Theamount of exposed nodes however, changes dramatically, the standard configurationends up with 12 nodes, while CCA, power control and both at the same time get 4,3 and 2 respectively.
Figures 4.33c and 4.33d are not so promising, as they show that we still get plenty ofunsuccessful transmissions. CCA control could be a good option, as it seems to givebetter results the more APs we add, but its number of unsuccessful transmissions
41
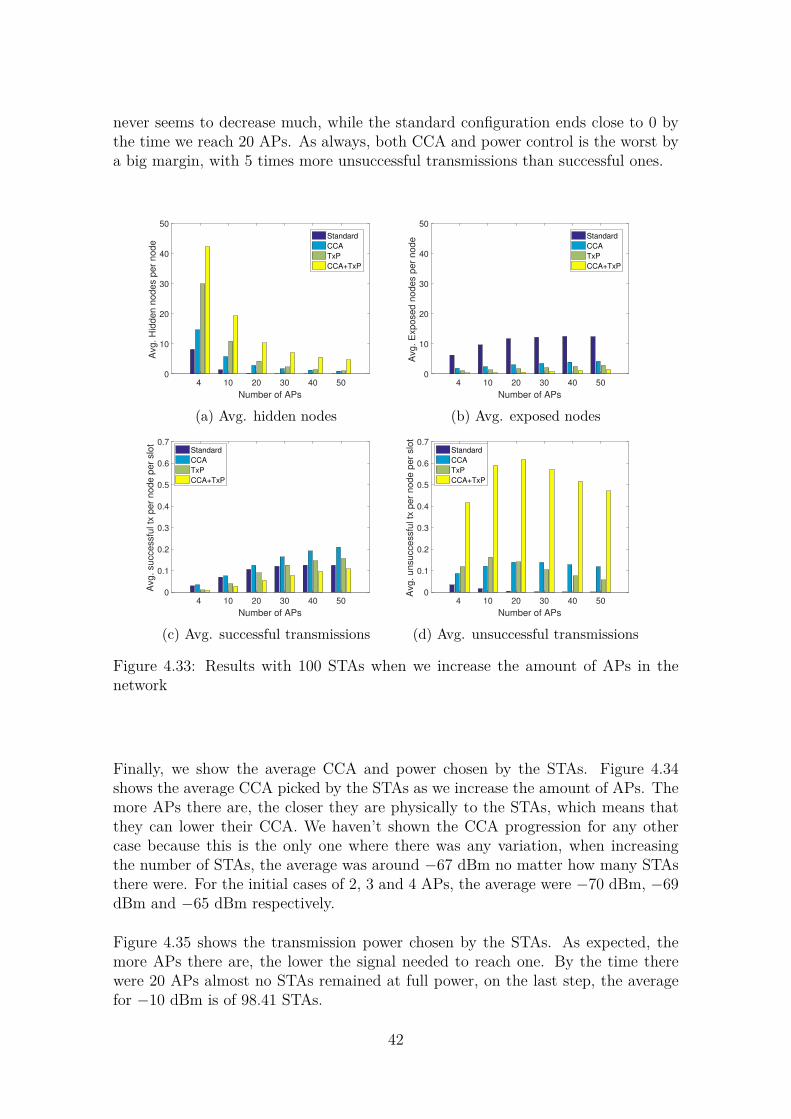
never seems to decrease much, while the standard configuration ends close to 0 bythe time we reach 20 APs. As always, both CCA and power control is the worst bya big margin, with 5 times more unsuccessful transmissions than successful ones.
4 10 20 30 40 50
Number of APs
0
10
20
30
40
50
Avg
. H
idd
en
no
de
s p
er
no
de
Standard
CCA
TxP
CCA+TxP
(a) Avg. hidden nodes
4 10 20 30 40 50
Number of APs
0
10
20
30
40
50
Avg
. E
xp
ose
d n
od
es p
er
no
de Standard
CCA
TxP
CCA+TxP
(b) Avg. exposed nodes
4 10 20 30 40 50
Number of APs
0
0.1
0.2
0.3
0.4
0.5
0.6
0.7
Avg
. su
cce
ssfu
l tx
pe
r n
od
e p
er
slo
t
Standard
CCA
TxP
CCA+TxP
(c) Avg. successful transmissions
4 10 20 30 40 50
Number of APs
0
0.1
0.2
0.3
0.4
0.5
0.6
0.7
Avg
. u
nsu
cce
ssfu
l tx
pe
r n
od
e p
er
slo
t
Standard
CCA
TxP
CCA+TxP
(d) Avg. unsuccessful transmissions
Figure 4.33: Results with 100 STAs when we increase the amount of APs in thenetwork
Finally, we show the average CCA and power chosen by the STAs. Figure 4.34shows the average CCA picked by the STAs as we increase the amount of APs. Themore APs there are, the closer they are physically to the STAs, which means thatthey can lower their CCA. We haven’t shown the CCA progression for any othercase because this is the only one where there was any variation, when increasingthe number of STAs, the average was around −67 dBm no matter how many STAsthere were. For the initial cases of 2, 3 and 4 APs, the average were −70 dBm, −69dBm and −65 dBm respectively.
Figure 4.35 shows the transmission power chosen by the STAs. As expected, themore APs there are, the lower the signal needed to reach one. By the time therewere 20 APs almost no STAs remained at full power, on the last step, the averagefor −10 dBm is of 98.41 STAs.
42
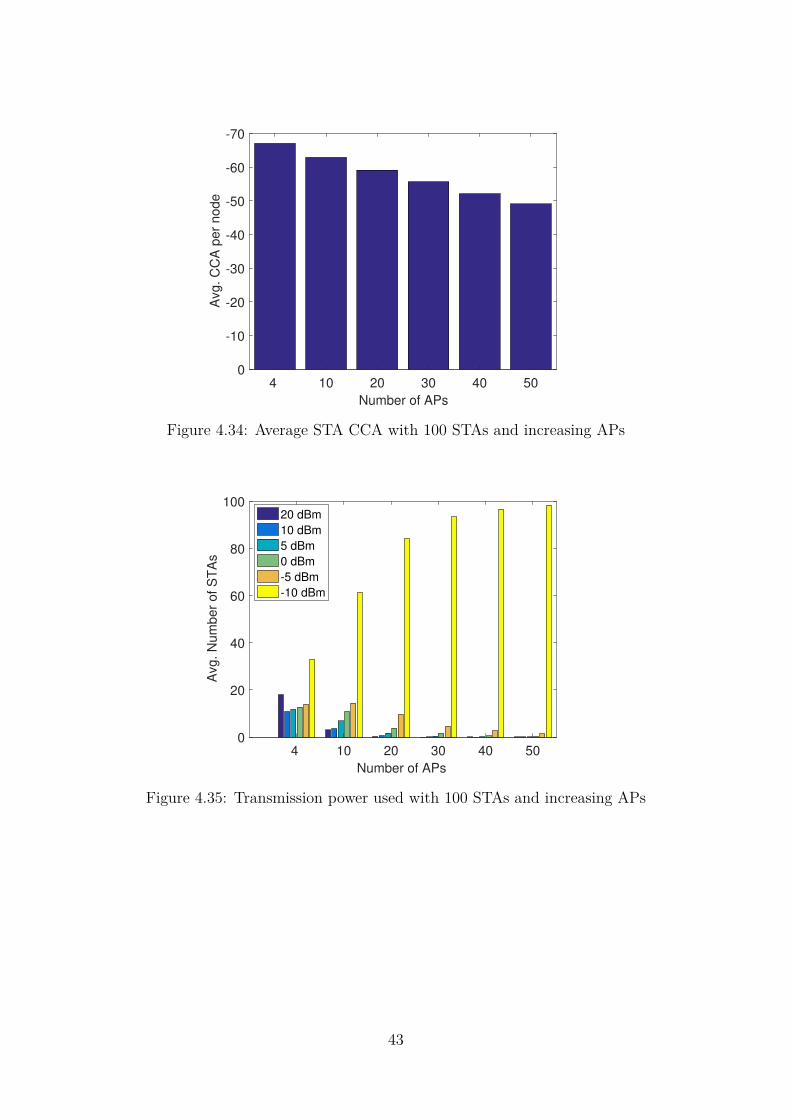
4 10 20 30 40 50
Number of APs
0
-10
-20
-30
-40
-50
-60
-70
Avg
. C
CA
pe
r n
od
e
Figure 4.34: Average STA CCA with 100 STAs and increasing APs
4 10 20 30 40 50
Number of APs
0
20
40
60
80
100
Avg
. N
um
be
r o
f S
TA
s
20 dBm
10 dBm
5 dBm
0 dBm
-5 dBm
-10 dBm
Figure 4.35: Transmission power used with 100 STAs and increasing APs
43

4.4 Conclusions
We have shown the effect of the hidden and exposed nodes problem in HD-WLANs,that poor channel allocation will greatly reduce the amount of transmissions in ournetwork, how a high density of APs can be useful in evading hidden nodes while itcan give us an increased number of exposed nodes. We have also shown that thehardware we use can have a big impact on the network through the capture effect,and finally we have seen that adjusting the CCA of the STAs can be a viable way ofmitigating some of these problems, while power control seems detrimental in everyway.
With all this, we believe that when designing an association mechanism, the avoid-ance of hidden and exposed nodes should not be a priority, as there are alreadyseveral ways available to reduce their impact on the network. Dedicated mecha-nisms like the RTS/CTS further reduce this impact.
We have adjusted the CCA and TP of the STAs in accordance to the signal receivedfrom the AP. In the future, it would be interesting to adapt the CCA and TP of theAPs themselves, and see if it can be beneficial to the network.
44
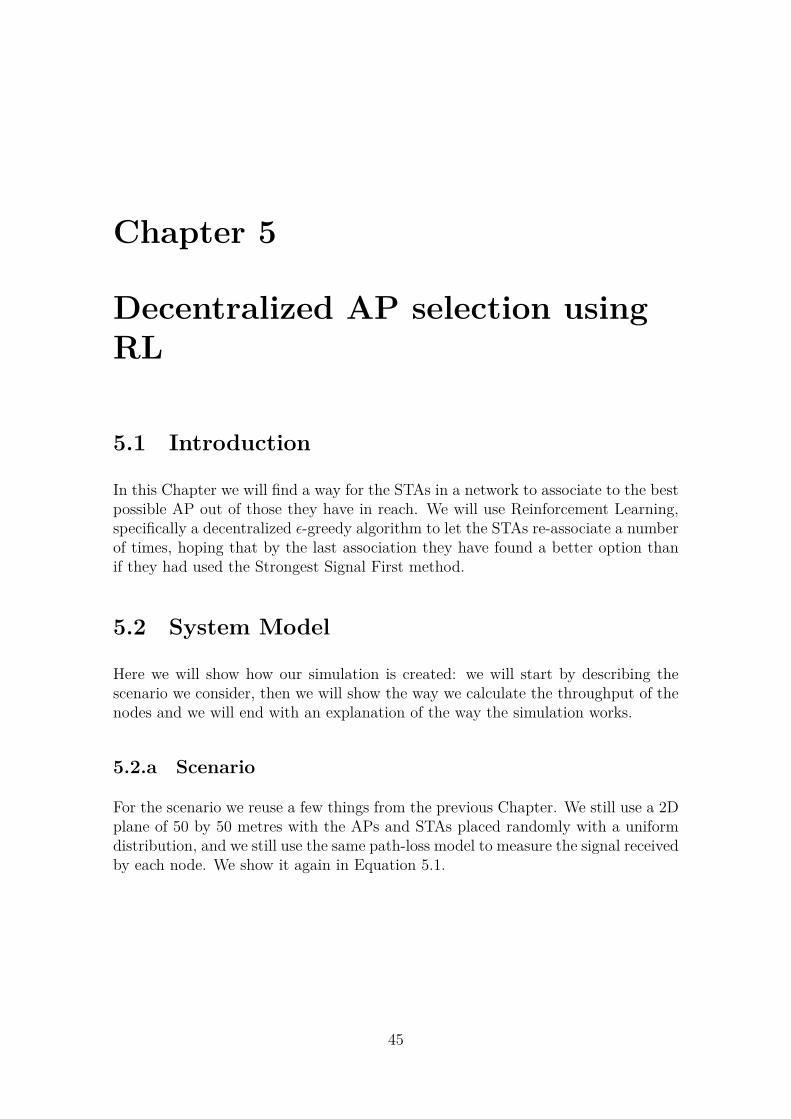
Chapter 5
Decentralized AP selection usingRL
5.1 Introduction
In this Chapter we will find a way for the STAs in a network to associate to the bestpossible AP out of those they have in reach. We will use Reinforcement Learning,specifically a decentralized ϵ-greedy algorithm to let the STAs re-associate a numberof times, hoping that by the last association they have found a better option thanif they had used the Strongest Signal First method.
5.2 System Model
Here we will show how our simulation is created: we will start by describing thescenario we consider, then we will show the way we calculate the throughput of thenodes and we will end with an explanation of the way the simulation works.
5.2.a Scenario
For the scenario we reuse a few things from the previous Chapter. We still use a 2Dplane of 50 by 50 metres with the APs and STAs placed randomly with a uniformdistribution, and we still use the same path-loss model to measure the signal receivedby each node. We show it again in Equation 5.1.
45
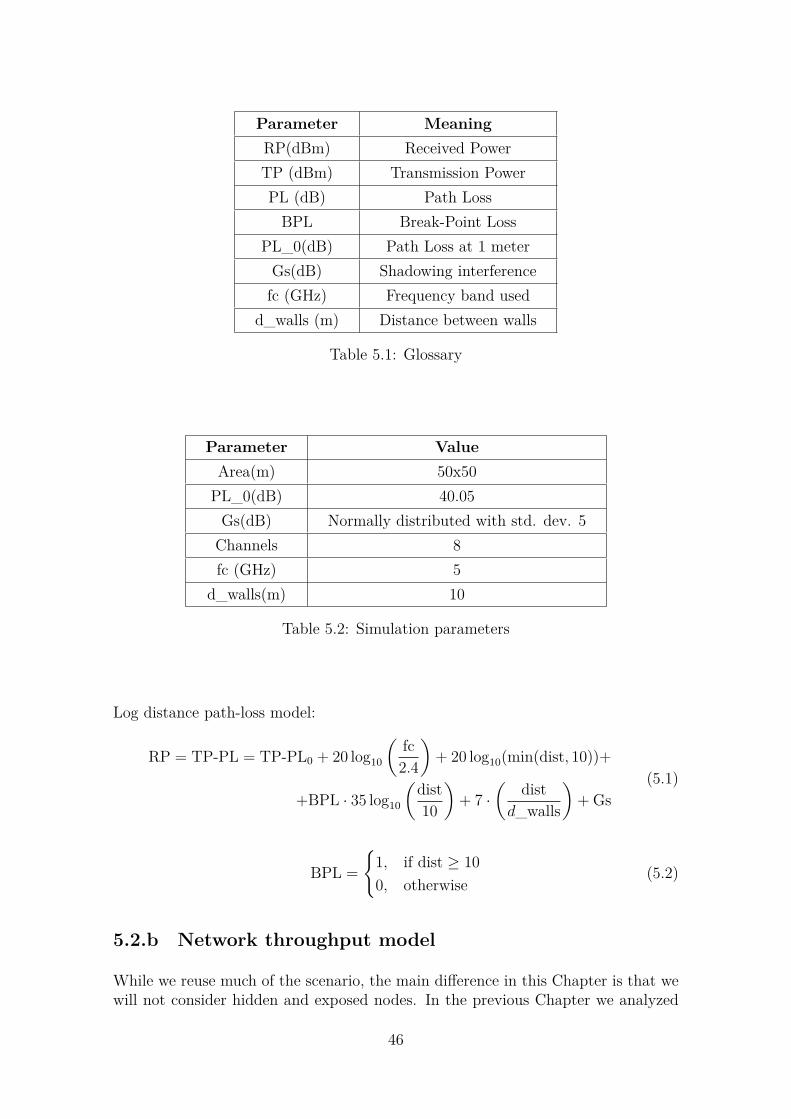
Parameter MeaningRP(dBm) Received PowerTP (dBm) Transmission PowerPL (dB) Path Loss
BPL Break-Point LossPL_0(dB) Path Loss at 1 meter
Gs(dB) Shadowing interferencefc (GHz) Frequency band used
d_walls (m) Distance between walls
Table 5.1: Glossary
Parameter ValueArea(m) 50x50
PL_0(dB) 40.05Gs(dB) Normally distributed with std. dev. 5
Channels 8fc (GHz) 5
d_walls(m) 10
Table 5.2: Simulation parameters
Log distance path-loss model:
RP = TP-PL = TP-PL0 + 20 log10
(fc2.4
)+ 20 log10(min(dist, 10))+
+BPL · 35 log10(
dist10
)+ 7 ·
(dist
d_walls
)+ Gs
(5.1)
BPL =
{1, if dist ≥ 10
0, otherwise(5.2)
5.2.b Network throughput model
While we reuse much of the scenario, the main difference in this Chapter is that wewill not consider hidden and exposed nodes. In the previous Chapter we analyzed
46
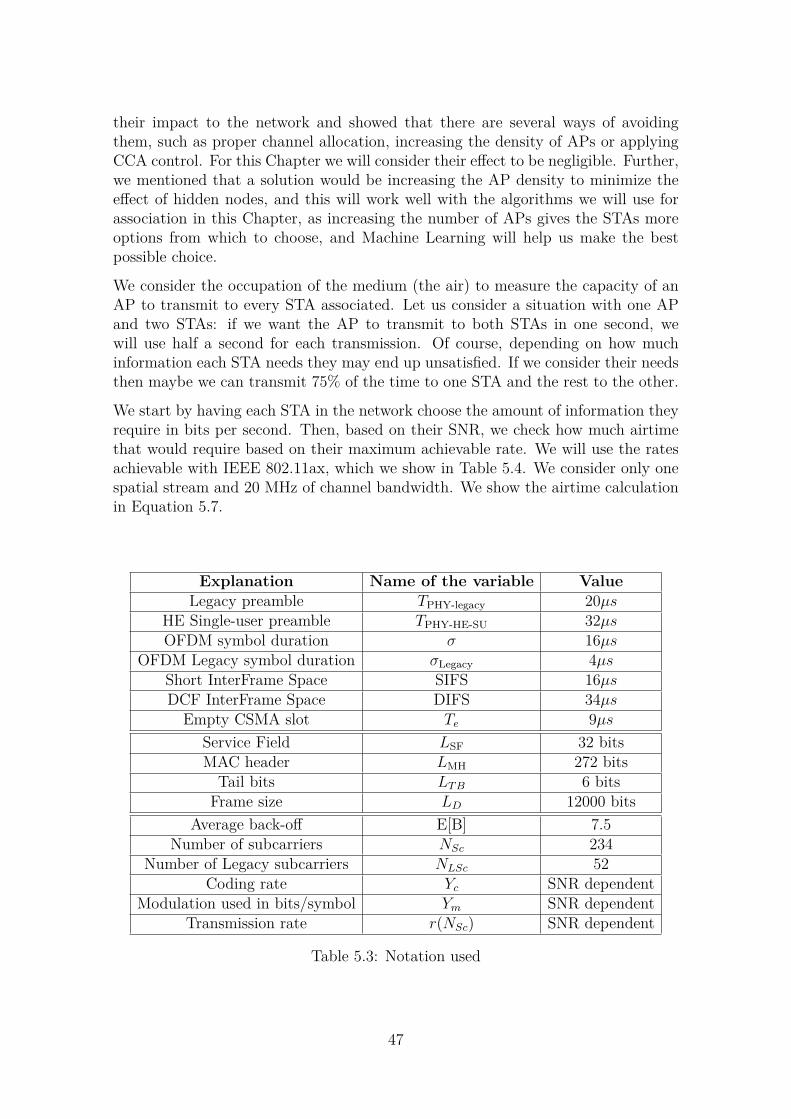
their impact to the network and showed that there are several ways of avoidingthem, such as proper channel allocation, increasing the density of APs or applyingCCA control. For this Chapter we will consider their effect to be negligible. Further,we mentioned that a solution would be increasing the AP density to minimize theeffect of hidden nodes, and this will work well with the algorithms we will use forassociation in this Chapter, as increasing the number of APs gives the STAs moreoptions from which to choose, and Machine Learning will help us make the bestpossible choice.
We consider the occupation of the medium (the air) to measure the capacity of anAP to transmit to every STA associated. Let us consider a situation with one APand two STAs: if we want the AP to transmit to both STAs in one second, wewill use half a second for each transmission. Of course, depending on how muchinformation each STA needs they may end up unsatisfied. If we consider their needsthen maybe we can transmit 75% of the time to one STA and the rest to the other.
We start by having each STA in the network choose the amount of information theyrequire in bits per second. Then, based on their SNR, we check how much airtimethat would require based on their maximum achievable rate. We will use the ratesachievable with IEEE 802.11ax, which we show in Table 5.4. We consider only onespatial stream and 20 MHz of channel bandwidth. We show the airtime calculationin Equation 5.7.
Explanation Name of the variable ValueLegacy preamble TPHY-legacy 20µs
HE Single-user preamble TPHY-HE-SU 32µsOFDM symbol duration σ 16µs
OFDM Legacy symbol duration σLegacy 4µsShort InterFrame Space SIFS 16µsDCF InterFrame Space DIFS 34µs
Empty CSMA slot Te 9µs
Service Field LSF 32 bitsMAC header LMH 272 bits
Tail bits LTB 6 bitsFrame size LD 12000 bits
Average back-off E[B] 7.5Number of subcarriers NSc 234
Number of Legacy subcarriers NLSc 52Coding rate Yc SNR dependent
Modulation used in bits/symbol Ym SNR dependentTransmission rate r(NSc) SNR dependent
Table 5.3: Notation used
47

MCS Mod. Ym Coding rate Yc Rate (Mbps) RP (dBm)0 BPSK 1/2 7.3 [−82,−79)
1 QPSK 1/2 14.6 [−79,−77)
2 QPSK 3/4 21.9 [−77,−74)
3 16-QAM 1/2 29.3 [−74,−70)
4 16-QAM 3/4 43.9 [−70,−66)
5 64-QAM 2/3 58.5 [−66,−65)
6 64-QAM 3/4 65.8 [−65,−64)
7 64-QAM 5/6 73.1 [−64,−59)
8 256-QAM 3/4 87.8 [−59,−57)
9 256-QAM 5/6 97.5 [−57,−54)
10 1024-QAM 3/4 109.7 [−54,−51)
11 1024-QAM 5/6 121.9 [−51,∞)
Table 5.4: IEEE 802.11ax rates for 20 MHz and one spatial stream
To calculate the airtime percentage of a STA we start by calculating their transmis-sion rate in bits per symbol in Equation 5.3, which depends on the modulation andcoding rate used, which change with the SNR.
r(NSc) = NSc · Yc · Ym (5.3)
Next we want to know the time it would take to transmit the frame data, the firsttwo elements in Equation 5.4 are the legacy and high-efficiency preambles, these aretransmitted at 20 MHz and legacy rate of 6 Mbps. The rest of the data, includingthe service field, tail bits and MAC header are sent at the maximum rate available,which is why they are divided by r(NSc) and multiplied by the OFDMA symboltime σ.
TData = TPHY-legacy + TPHY-HE-SU +
(LSF + LMH + LD + LTB
r(NSc)
)· σ (5.4)
Equation 5.5 shows the time calculation for the acknowledgments that are receivedafter each transmission. It works similarly to the previous equation, but in thiscase it is transmitted entirely in legacy parameters, which is why we use the legacyamount of subcarriers and the OFDM symbol time.
TACK = TPHY-legacy +
(LSF + LACK + LTB
r(NLSc)
)· σLegacy (5.5)
We now calculate the time required for the entire process in Equation 5.6 we addthe values of TData and TACK , plus the Short Interframe Space and DCF Interframe
48

Space, as well as the time for an empty slot, all according to the CSMA/CA protocol,to obtain the amount of time the air will be occupied.
T = TData + SIFS + TACK + DIFS + Te (5.6)
Finally, in Equation 5.7 we can transform this time into a percentage. We take thetime we calculated, add to it the time of the average back-off and multiply it by thedivision of the bandwidth demanded and the size of our frames.
STA Airtime Percentage =Bandwidth demanded
LD
· (T + E[B]) (5.7)
Once we know how much time the STAs require to transmit, we check every APthat is in the same channel and add that percentage to their own. We show this inEquation 5.8.
AP Airtime Percentage =∑
∀ Stations
STA Airtime Percentage (5.8)
Finally, we check each AP’s airtime percentage, and if the value is over 1 (meaningthat all the STAs in that channel would need more than 100% of the airtime availableto transmit), the AP gives them a proportional amount based on how much theyneed, as shown in Equation 5.9. If the AP has an airtime inferior or equal to 1, thenthey receive the airtime calculated in Equation 5.7 and the entirety of their desiredbandwidth.
STA Bandwidth achieved = Bandwidth demanded ·(
STA airtimeAP airtime
)(5.9)
5.2.c Simulation approach
We will now discuss the way our simulation works1: We begin by setting a numberof APs and STAs on our 2D plane. In this Chapter the APs will be in fixed positionsand the STAs will generally be placed randomly.
The simulation then runs 101 iterations of association, following the pattern inFigure 5.1. Each iteration consists of two phases: the first one is the decision phasein which the association of the STAs to APs takes place. In the first iteration we usethe SSF method so that each STA associates to the AP with the strongest receivedsignal, and the 100 following ones use an ϵ-greedy algorithm that continually triesto find an optimal association. The second phase is the evaluation of the decisionmade. In this phase we check the satisfaction obtained by each STA and updatetheir knowledge of the network. This is done by having the STA keep a list of each
1The code for this simulation can also be found in: https://github.com/MCarrascosaZ/Improving-user-association-in-HD-WLANs-using-Machine-Learning
49
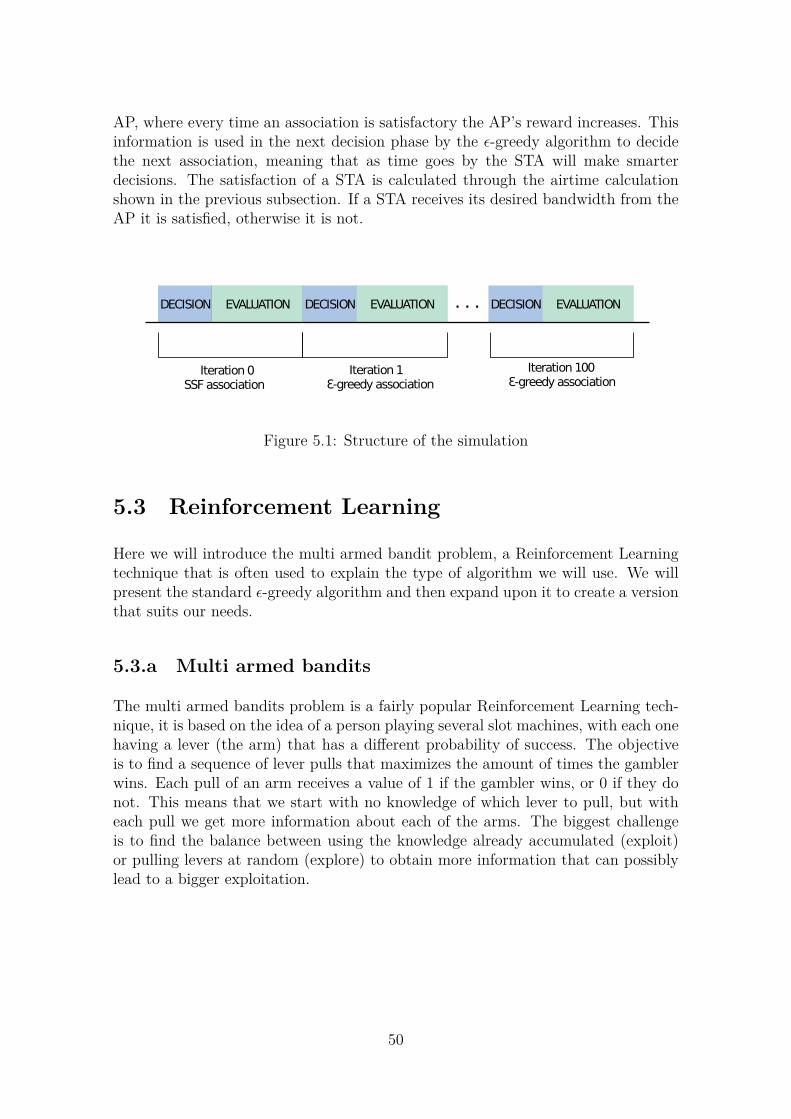
AP, where every time an association is satisfactory the AP’s reward increases. Thisinformation is used in the next decision phase by the ϵ-greedy algorithm to decidethe next association, meaning that as time goes by the STA will make smarterdecisions. The satisfaction of a STA is calculated through the airtime calculationshown in the previous subsection. If a STA receives its desired bandwidth from theAP it is satisfied, otherwise it is not.
Figure 5.1: Structure of the simulation
5.3 Reinforcement Learning
Here we will introduce the multi armed bandit problem, a Reinforcement Learningtechnique that is often used to explain the type of algorithm we will use. We willpresent the standard ϵ-greedy algorithm and then expand upon it to create a versionthat suits our needs.
5.3.a Multi armed bandits
The multi armed bandits problem is a fairly popular Reinforcement Learning tech-nique, it is based on the idea of a person playing several slot machines, with each onehaving a lever (the arm) that has a different probability of success. The objectiveis to find a sequence of lever pulls that maximizes the amount of times the gamblerwins. Each pull of an arm receives a value of 1 if the gambler wins, or 0 if they donot. This means that we start with no knowledge of which lever to pull, but witheach pull we get more information about each of the arms. The biggest challengeis to find the balance between using the knowledge already accumulated (exploit)or pulling levers at random (explore) to obtain more information that can possiblylead to a bigger exploitation.
50

5.3.b ϵ-greedy
We show the basic ϵ-greedy in Algorithm 1. We can see that it illustrates the multiarmed bandits problem very clearly. First a value for ϵ is chosen between 0 and1, and then for each agent (in this case the STAs), a random number is generatedbetween 0 and 1, if the random number is smaller than the value of ϵ we exploreand pick an AP at random. If the random number is higher than the value of ϵ weexploit our knowledge and pick the AP that has the maximum accumulated reward.It is common to pick a value for ϵ that changes over time, starting at 1 to ensurethat the agent begins by exploring their options and then getting closer to 0, so thatwe exploit our knowledge almost constantly.
Algorithm 1: Implementation of ϵ-greedy in STAs to associate to the bestAP possible1 Function ϵ-greedy (STA);
Input : STA: struct containing all STAs and relevant information2 initialize: ϵ ∈ [0, 1], Reward=03 for each STA do4 if rand() < ϵ then5 STA chooses any AP it senses at random6 else7 STA chooses AP with maximum accumulated reward8 end9 EvaluateAction()
10 if Action was positive then11 Reward++12 end13 end
5.4 SSF, ϵ-greedy and STA placement
In this and future sections we will be comparing the ϵ-greedy algorithm to theStrongest Signal First association mechanism. One of the strengths of any machinelearning algorithm is that they explore the possibilities that are available to them,which allows them to react to their environment. This is something that the SSFmethod does not do, and in this section we want to see how these methods ofassociation deal with their environment, specifically the positions of the STAs.
We will do two different simulations: one will have the STAs in random positions(using a uniform distribution), and the other will use fixed positions. For the casein which we use fixed positions we will have most of the STAs around the first andsecond APs, and almost none near the third one. This is to test a network with anunbalanced placement of users, which will lead to some APs being congested andothers underused. In the case of random STAs we will find that due to their uniform
51

distribution the load on the APs will be pretty even (on average). We show bothconfigurations in Figure 5.2. For this section we use a limited range of placementsfor the STAs, since we want them to be able to sense all the APs so that they canrecover from their bad placement in Figure 5.3a. We will talk about this limitedrange and its effects in Section 5.10.
0 10 20 30 40 50
x [meters]
0
10
20
30
40
50
y [
me
ters
]
1 2 3 1
2
3
4
5
6
7
8
9
10
APs
STAs
Share channel
(a) Fixed STAs
0 10 20 30 40 50
x [meters]
0
10
20
30
40
50
y [
me
ters
]
1 2 3 1 2 3
4
5 6
7
8
9
10
APs
STAs
Share channel
(b) Random STAs
Figure 5.2: Node configurations
Our simulation will run 100 times for each configuration, in each simulation the firstassociation is done through the SSF method, and after that, the ϵ-greedy algorithmwill have 100 iterations in which to find the best possible association configuration,meaning that the full simulations is comprised of 10100 iterations.
In the random configuration the location of the STAs will be changed every simula-tion, and on the fixed configuration we will use the same positions but change theshadowing every time. The APs can also choose a channel out of 8 available, and doso randomly for every simulation. All the STAs will demand the same bandwidthof 7.5 Mbps.
We mentioned previously that it is desirable to use an ϵ value that changes overtime. We will try two different ways of calculating this value based on the amountof iterations that have passed. The first one is ϵ = 1√
iteration, which starts at 1
but rapidly decreases, allowing us to exploit early; the other method is ϵ = 1 −iteration
MaxIteration, which decreases linearly, meaning that we will explore quite a bit more
than with the previous method.
Figure 5.3 shows the average percentage of bandwidth obtained after the last ϵ-greedy iteration of each one of the 100 simulations. In Figure 5.3a we see that bothϵ-greedy algorithms are better than SSF when the STAs are badly distributed, andin Figure 5.3b we can see that the opposite is true when the STAs are spread outuniformly. We can also see that using the square root of the iteration to calculatethe value of ϵ gives better results than the other method.
52
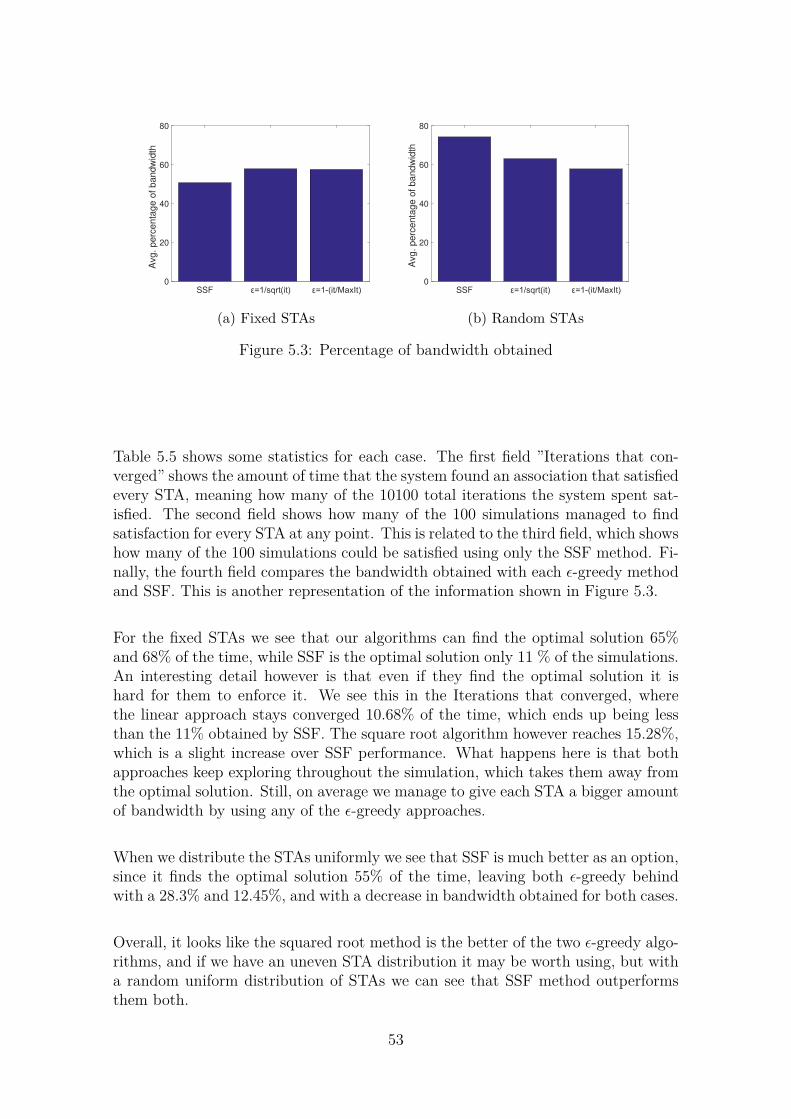
SSF0
20
40
60
80
Avg
. p
erc
en
tag
e o
f b
an
dw
idth
(a) Fixed STAs
SSF0
20
40
60
80
Avg
. p
erc
en
tag
e o
f b
an
dw
idth
(b) Random STAs
Figure 5.3: Percentage of bandwidth obtained
Table 5.5 shows some statistics for each case. The first field ”Iterations that con-verged” shows the amount of time that the system found an association that satisfiedevery STA, meaning how many of the 10100 total iterations the system spent sat-isfied. The second field shows how many of the 100 simulations managed to findsatisfaction for every STA at any point. This is related to the third field, which showshow many of the 100 simulations could be satisfied using only the SSF method. Fi-nally, the fourth field compares the bandwidth obtained with each ϵ-greedy methodand SSF. This is another representation of the information shown in Figure 5.3.
For the fixed STAs we see that our algorithms can find the optimal solution 65%and 68% of the time, while SSF is the optimal solution only 11 % of the simulations.An interesting detail however is that even if they find the optimal solution it ishard for them to enforce it. We see this in the Iterations that converged, wherethe linear approach stays converged 10.68% of the time, which ends up being lessthan the 11% obtained by SSF. The square root algorithm however reaches 15.28%,which is a slight increase over SSF performance. What happens here is that bothapproaches keep exploring throughout the simulation, which takes them away fromthe optimal solution. Still, on average we manage to give each STA a bigger amountof bandwidth by using any of the ϵ-greedy approaches.
When we distribute the STAs uniformly we see that SSF is much better as an option,since it finds the optimal solution 55% of the time, leaving both ϵ-greedy behindwith a 28.3% and 12.45%, and with a decrease in bandwidth obtained for both cases.
Overall, it looks like the squared root method is the better of the two ϵ-greedy algo-rithms, and if we have an uneven STA distribution it may be worth using, but witha random uniform distribution of STAs we can see that SSF method outperformsthem both.
53

Fixed STAsAlgorithm ϵ = 1√
iterationϵ = 1− it
MaxIt
Iterations that converged 15.28% 10.68%Simulations where convergence was found 65% 68%
Satisfied with SSF 11% 11%Avg. Bandwidth (vs.SSF) +14,1% +13.3%
Random STAsAlgorithm ϵ = 1√
iterationϵ = 1− it
MaxIt
Iterations that converged 28.3% 12.45%Simulations where convergence was found 73% 71%
Satisfied with SSF 55% 55%Avg. Bandwidth (vs.SSF) −15.06% −22.15%
Table 5.5: Statistics for each configuration
5.5 Our modifications to the algorithm
Now that we have seen the standard algorithm we adapt it to the situation we willbe treating from now on. We will be using the concept of stickiness in a similarway as the one found in [35]. When a STA finds a satisfactory AP, a sticky counterwill increase, which will make the STA exploit its knowledge as long as the counterdoes not go back to 0. This will allow the STAs to converge to a satisfactoryassociation even if their ϵ value would force an exploration, and in the case of thesticky counter being higher than 1, if an iteration happens to be unsatisfactory dueto some other STA’s actions, we can keep the STA exploiting to see if the nextiteration the situation fixes itself. We show the full algorithm in Algorithm 2.
5.6 Initial simulation
We will start by studying how the bandwidth required by each STA has an effect onthe capacity of the algorithm to converge. We use 3 APs in a line and 10 randomlylocated STAs. This time the STAs can pick any position of the 50 by 50 area, asopposed to the limited range we gave them in the previous section. By doing thiswe allow situations in which STAs will only sense a single AP or maybe they willnot sense even one. This benefits the SSF method, and we do it so that we cansee if the ϵ-greedy algorithm can outperform it even in unfavourable situations. Wehave every STA demand the same amount of bandwidth from the APs and see ifwe can find an optimal association that can satisfy everyone. We use 5, 7.5 and 10Mbps. Figure 5.4a shows the average number of associations required for all STAsto converge and find an association that keeps them satisfied. We can observe thatwe never converge when using 10 Mbps, while we find a solution really quickly inthe other two cases. For 5 Mbps we barely need to have the STA try each AP once,
54
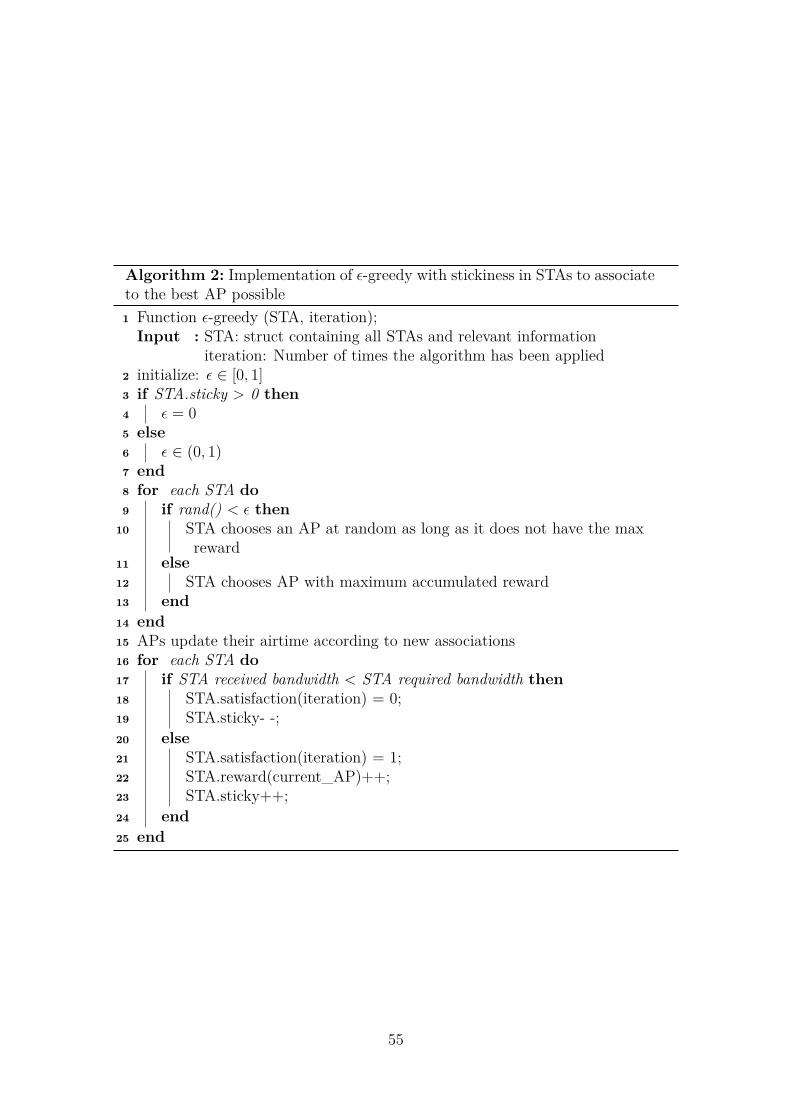
Algorithm 2: Implementation of ϵ-greedy with stickiness in STAs to associateto the best AP possible1 Function ϵ-greedy (STA, iteration);
Input : STA: struct containing all STAs and relevant informationiteration: Number of times the algorithm has been applied
2 initialize: ϵ ∈ [0, 1]3 if STA.sticky > 0 then4 ϵ = 05 else6 ϵ ∈ (0, 1)7 end8 for each STA do9 if rand() < ϵ then
10 STA chooses an AP at random as long as it does not have the maxreward
11 else12 STA chooses AP with maximum accumulated reward13 end14 end15 APs update their airtime according to new associations16 for each STA do17 if STA received bandwidth < STA required bandwidth then18 STA.satisfaction(iteration) = 0;19 STA.sticky- -;20 else21 STA.satisfaction(iteration) = 1;22 STA.reward(current_AP)++;23 STA.sticky++;24 end25 end
55

and for 7.5 Mbps we need a bit more than double that amount. This would lead usto believe that as long as convergence is possible, we can find it pretty quickly.
Figure 5.4b shows the satisfaction of a single STA across 100 associations for a singlesimulation. In it we can see that with 5 and 7.5 Mbps we find satisfaction sooneror later and manage to stay satisfied after that, while with 10 Mbps our STA keepstrying to find a solution throughout the entire simulation.
5 Mbps 7.5 Mbps 10 Mbps
Bandwith required per STA
0
1
2
3
4
5
6
7
Avg
. ite
ratio
ns u
ntil co
nve
rge
nce
(a) Avg. iterations until convergence
0 20 40 60 80 100
Association iterations
0
20
40
60
80
100
Sa
tisfa
ctio
n
BW=5 Mbps
BW=7.5 Mbps
BW=10 Mbps
(b) Satisfaction for one STA
Figure 5.4: Convergence
Table 5.6 shows some statistics from our simulations, the first is the amount ofunassociated STAs. Since we locate the STAs randomly, they may end up in badpositions where they cannot reach an AP, and in those events we do not considerthese STAs when we check if convergence is reached, as they can never be satisfied.The next fields function in the same way as they were presented in Table 5.5, back inSection 5.4. We see that the amount of bandwidth desired by the STAs has an effecton the capacity to reach convergence, with 10 Mbps making satisfaction impossible.
Field 5 Mbps 7.5 Mbps 10 MbpsAvg. Unassociated STAs 0.12 %Max. Unassociated STAs 2Iterations that converged 52.89% 10.39% 0%
Simulations where convergence was found 61% 15% NaSatisfied with SSF 34 % 5% Na
Table 5.6: Statistics for the simulation of 3 APs and 10 STAs
56

For the next figure we will look at satisfaction in two different ways: the first one is byjust checking the satisfaction accumulated according to our algorithm; the secondone is to check the last iteration of each simulation and compare the bandwidthreceived with the bandwidth demanded.In Figure 5.5a we use the second one, andcompare the result obtained with our algorithm to the result we get in the firstassociation iteration, in which we use SSF. We can observe that when using 5 Mbpswe reach 77% satisfaction by the final iteration, which is an improvement of 18%over the SSF method; when using 7.5 Mbps we get very similar performances, bothreach 47 % of the desired bandwidth with ϵ-greedy behind by only 0.6%, and whenusing 10 Mbps we get a performance decrease of 10.7%.
These results reinforce what we see in Figure 5.4, where we saw that the bandwidthrequired is a deciding factor on convergence being achievable. Figure 5.5b shows theaverage satisfaction for all STAs, where we see that the amount of times a STA canbe satisfied decreases heavily when increasing the airtime demands, with 5 Mbpsreaching more than 70 satisfaction, 7.5 Mbps struggling at less than 30 and 10 Mbpsbarely making it over 10.
5 Mbps 7.5 Mbps 10 Mbps
Bandwith required per STA
0
20
40
60
80
Avg
. p
erc
en
tag
e o
f b
an
dw
idth
SSF Association
(a) Bandwidth achieved by association
0 20 40 60 80 100
Association iterations
0
20
40
60
80
Avg
. S
atisfa
ctio
n
BW=5 Mbps
BW=7.5 Mbps
BW=10 Mbps
(b) Mean satisfaction
Figure 5.5: Bandwidth and satisfaction achieved
Our algorithm has two different states, the first one happens when the sticky counteris above 0, we will call this the sticky state; the other when the sticky counter is 0or less, which we call regular state. In the sticky state the STA will always exploit(use ϵ = 0 ) and re-associate to the AP with a higher reward, and as long as it stayssatisfied this state will remain active. The regular state uses an epsilon between 0and 1, so that the STA will alternate between exploring and exploiting, and for oursimulations we have used ϵ = 0.75 to compensate for the fact that the sticky stateonly exploits. The intention is for the STA to explore most of the time in this state,and then exploit with enough information to enter the sticky state.
57
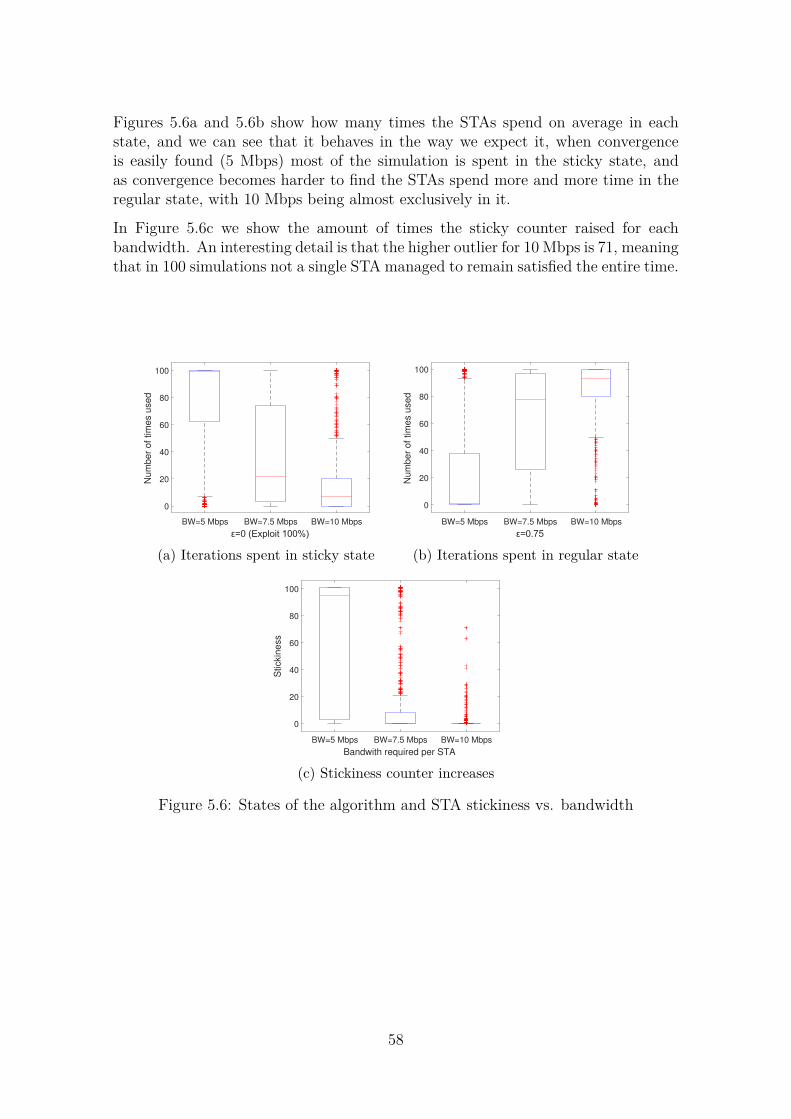
Figures 5.6a and 5.6b show how many times the STAs spend on average in eachstate, and we can see that it behaves in the way we expect it, when convergenceis easily found (5 Mbps) most of the simulation is spent in the sticky state, andas convergence becomes harder to find the STAs spend more and more time in theregular state, with 10 Mbps being almost exclusively in it.
In Figure 5.6c we show the amount of times the sticky counter raised for eachbandwidth. An interesting detail is that the higher outlier for 10 Mbps is 71, meaningthat in 100 simulations not a single STA managed to remain satisfied the entire time.
BW=5 Mbps BW=7.5 Mbps BW=10 Mbps
0
20
40
60
80
100
Nu
mb
er
of
tim
es u
se
d
(a) Iterations spent in sticky state
BW=5 Mbps BW=7.5 Mbps BW=10 Mbps
0
20
40
60
80
100
Nu
mb
er
of
tim
es u
se
d
(b) Iterations spent in regular state
BW=5 Mbps BW=7.5 Mbps BW=10 Mbps
Bandwith required per STA
0
20
40
60
80
100
Stickin
ess
(c) Stickiness counter increases
Figure 5.6: States of the algorithm and STA stickiness vs. bandwidth
58
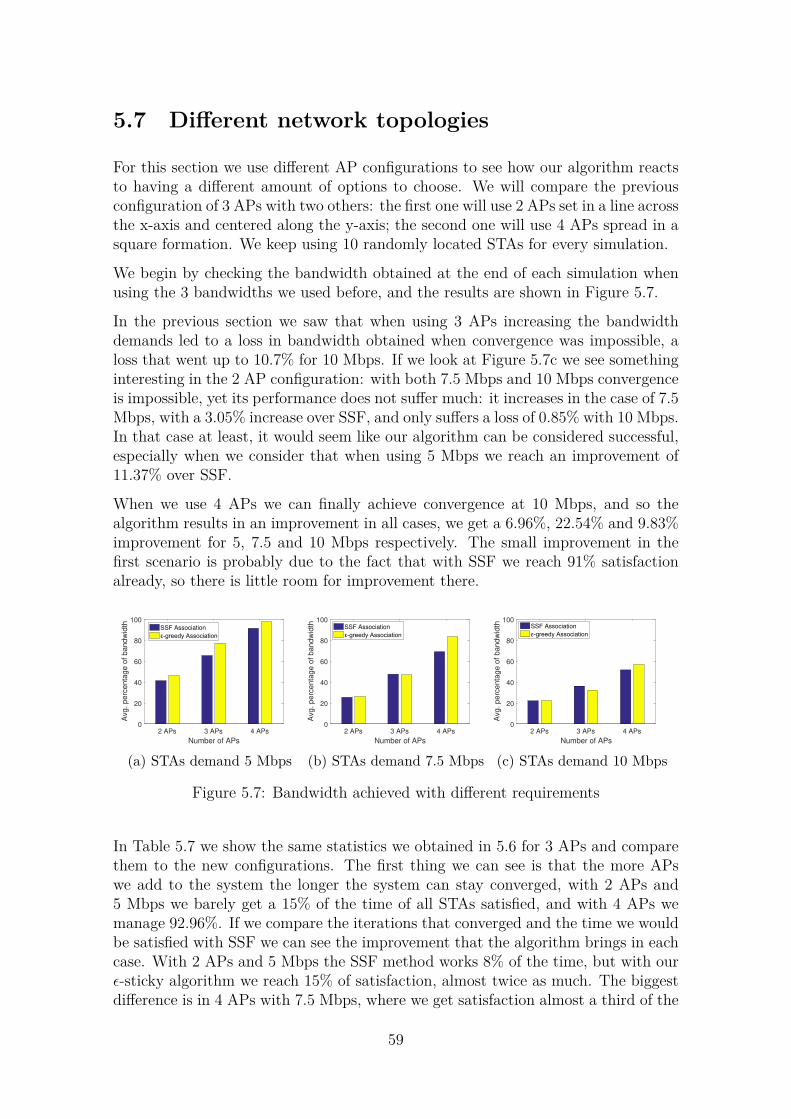
5.7 Different network topologies
For this section we use different AP configurations to see how our algorithm reactsto having a different amount of options to choose. We will compare the previousconfiguration of 3 APs with two others: the first one will use 2 APs set in a line acrossthe x-axis and centered along the y-axis; the second one will use 4 APs spread in asquare formation. We keep using 10 randomly located STAs for every simulation.
We begin by checking the bandwidth obtained at the end of each simulation whenusing the 3 bandwidths we used before, and the results are shown in Figure 5.7.
In the previous section we saw that when using 3 APs increasing the bandwidthdemands led to a loss in bandwidth obtained when convergence was impossible, aloss that went up to 10.7% for 10 Mbps. If we look at Figure 5.7c we see somethinginteresting in the 2 AP configuration: with both 7.5 Mbps and 10 Mbps convergenceis impossible, yet its performance does not suffer much: it increases in the case of 7.5Mbps, with a 3.05% increase over SSF, and only suffers a loss of 0.85% with 10 Mbps.In that case at least, it would seem like our algorithm can be considered successful,especially when we consider that when using 5 Mbps we reach an improvement of11.37% over SSF.
When we use 4 APs we can finally achieve convergence at 10 Mbps, and so thealgorithm results in an improvement in all cases, we get a 6.96%, 22.54% and 9.83%improvement for 5, 7.5 and 10 Mbps respectively. The small improvement in thefirst scenario is probably due to the fact that with SSF we reach 91% satisfactionalready, so there is little room for improvement there.
2 APs 3 APs 4 APs
Number of APs
0
20
40
60
80
100
Avg. perc
enta
ge o
f bandw
idth SSF Association
(a) STAs demand 5 Mbps
2 APs 3 APs 4 APs
Number of APs
0
20
40
60
80
100
Avg. perc
enta
ge o
f bandw
idth SSF Association
(b) STAs demand 7.5 Mbps
2 APs 3 APs 4 APs
Number of APs
0
20
40
60
80
100
Avg. perc
enta
ge o
f bandw
idth SSF Association
(c) STAs demand 10 Mbps
Figure 5.7: Bandwidth achieved with different requirements
In Table 5.7 we show the same statistics we obtained in 5.6 for 3 APs and comparethem to the new configurations. The first thing we can see is that the more APswe add to the system the longer the system can stay converged, with 2 APs and5 Mbps we barely get a 15% of the time of all STAs satisfied, and with 4 APs wemanage 92.96%. If we compare the iterations that converged and the time we wouldbe satisfied with SSF we can see the improvement that the algorithm brings in eachcase. With 2 APs and 5 Mbps the SSF method works 8% of the time, but with ourϵ-sticky algorithm we reach 15% of satisfaction, almost twice as much. The biggestdifference is in 4 APs with 7.5 Mbps, where we get satisfaction almost a third of the
59

time with SSF, and close to half the time with ϵ-sticky. If we compare the iterationsthat converged and the simulations where convergence was found we see that thefirst one is always smaller than the second one. This is because of the explorationperiod, if we were able to find convergence on the first iteration, then this valueswould coincide. In a way, it is a representation of how much time is needed to obtainenough information to reach satisfaction.
2 APsBandwidth 5 Mbps 7.5 Mbps 10 Mbps
Avg. Unassociated STAs 0.26 %Max. Unassociated STAs 3Iterations that converged 15.01% 0% 0%
Simulations where convergence was found 19% Na NaSatisfied with SSF 8 % Na Na
3 APsBandwidth 5 Mbps 7.5 Mbps 10 Mbps
Avg. Unassociated STAs 0.12 %Max. Unassociated STAs 2Iterations that converged 52.89% 10.39% 0%
Simulations where convergence was found 61% 15% NaSatisfied with SSF 34 % 5% Na
4 APsBandwidth 5 Mbps 7.5 Mbps 10 Mbps
Avg. Unassociated STAs 0.02 %Max. Unassociated STAs 1Iterations that converged 92.69% 48.99% 11.66%
Simulations where convergence was found 94% 58% 16%Satisfied with SSF 83 % 30% 2 %
Table 5.7: Statistics when changing the amount of APs
With the results presented in this section we can say that as long as convergence ispossible (which depends on the area covered, the amount of APs and STAs, as wellas their requirements in bandwidth), ϵ-sticky will find an optimal solution that isbetter than the SSF method.
60

5.8 Stickiness vs. regular algorithm
In this section we want to compare the effectiveness of the regular ϵ-greedy algorithmto our modified one with a sticky counter. The regular algorithm would always gointo the regular state we described earlier, and its effectiveness depends on the ϵused. In the previous sections we used a fixed ϵ of 0.75 to compensate for the highexploitation of the sticky state, but if we were to only use the regular state, wewould want the ϵ to change with time, so that it starts close to 1, high exploration,and gets closer to 0 with time, exploiting the knowledge accumulated. We will usethe fixed ϵ, as well as one that changes with the number of iterations that pass. Weuse 1√
iteration, which at the first iteration gives us ϵ = 1 and in the last one ϵ = 0.1.
For this entire section, we use the same simulation parameters as section 1: 3 APsand 10 STAs.
Figure 5.8a shows the results for the fixed ϵ = 0.75. In this case both SSF and ourϵ-sticky implementation are superior to the ϵ-standard implementation. They bothhave medians of 1 and their 25th percentiles are higher. In Figure5.8b we can see amassive improvement by the ϵ-standard implementation, with not only a median of1 but a higher 25th percentile than SSF. ϵ-sticky however seems to have improvedeven more in this case, with its 25th percentile going from 40% bandwidth obtainedto 60%. Considering the other two have theirs around 20%, it seems that the stickystate does improve the basic algorithm.
SSF
Association used
0
0.2
0.4
0.6
0.8
1
Avg
. b
an
dw
idth
ob
tain
ed
(a) ϵ = 0.75
SSF
Association used
0
0.2
0.4
0.6
0.8
1
Avg
. b
an
dw
idth
ob
tain
ed
(b) ϵ = 1/√
iteration
Figure 5.8: Changing the epsilon value
While Figure 5.8 implies that using a decreasing ϵ improves the ϵ-sticky implemen-tation, Table 5.8 shows a different story: the STAs in our simulation spent lesstime converged when using a dynamic ϵ. This means that we can trade some ofour capacity to find convergence for a slight overall increase in bandwidth acquired.Considering that our median stays at 1 for both cases, we have decided to prioritizeour capacity to converge, and keep using a fixed ϵ.
61

ϵ = 0.75Bandwidth Standard Sticky
Iterations that converged 4.34% 52.89%Simulations where convergence was found 53% 61%
Satisfied with SSF 34 % 34%ϵ = 1/
√iteration
Bandwidth Standard StickyIterations that converged 20.02 % 50.1%
Simulations where convergence was found 53% 60%Satisfied with SSF 34 % 34%
Table 5.8: Statistics as the ϵ value changes
5.9 Tweaking the algorithm
In this section we will add some slight variations of our ϵ-sticky algorithm. Sincewe played with the ϵ value in the previous section we will not be changing it hereand use the same one throughout. There are two changes we want to address: thefirst one is to use non-binary rewards, and the second one is to change the action toperform when the sticky counter is above 0.
For this section we will still use 3 APs with 10 randomly placed STAs, as well asusing two bandwidths: 5 Mbps and 10 Mbps, to showcase the effects of the changeswhen convergence is easily achievable and when it is not.
5.9.a Non-Binary rewards
In our implementation of the algorithm we have only used binary rewards, meaningthat we only update the reward for an AP we have chosen if the STA is completelysatisfied. This means that if a STA does not get all the bandwidth it wants it doesnot take into consideration if it received half of it in one AP and a third of it inanother. For this section we will have the STAs update the reward of each AP withthe proportion of bandwidth that they received, meaning that an AP still gets a1 when it satisfies the STA, and when it does not we set the reward to whicheverproportion we get from 0 to 0.99.
This small change means that each iteration obtains some information from thenetwork, while previously we could go several iterations without updating the rewardfor any of the APs the STA senses; as a result, the regular state of the STA alwaysacted like it had ϵ = 1. Now even in cases where full satisfaction is unreachable, whenthe STA exploits it will be going to the AP that has given it the most bandwidthout of all available ones, instead of a random one.
We show our results in Figure 5.9, we call our ϵ-sticky implementation ϵ-binary hereto reflect how we address the reward updating, and the new one ϵ-proportional.
62

Figure 5.9a shows that for 5 Mbps using proportional rewards lands us an increasein bandwidth obtained, with the 25th percentile going from 1.93 Mbps using binaryrewards to 2.47 Mbps, a 28% increase. In Figure 5.9b however, the opposite happens,and the proportional rewards get the lowest value. In this case however, the decreaseis not so substantial, with a 1.8% decrease in the median when comparing to binaryrewards. This could be considered an overall improvement.
SSF
Association used
0
1
2
3
4
5
Avg
. b
an
dw
idth
ob
tain
ed
106
(a) Each STA demands 5 Mbps
SSF
Association used
0
2
4
6
8
10
Avg
. b
an
dw
idth
ob
tain
ed
106
(b) Each STA demands 10 Mbps
Figure 5.9: Bandwidth achieved with each association
5.9.b Exploit vs. inaction
For this section we will keep the rewards binary again, and change how the stickystate behaves. Now, instead of exploiting when the sticky counter is above 0, theSTA will just stay associated to its AP. With this change we would ideally evade thesituation in which a satisfied STA would change to another AP due to the rewardsof two APs being similar; or allow an AP’s reward to catch up to the others if ithad fallen behind because of the STA sticking to another AP.
We show the results in Figure 5.10. We call this new approach ϵ-remains, and keepthe nomenclature of ϵ-binary for our initial implementation.
SSF
Association used
0
1
2
3
4
5
Avg
. b
an
dw
idth
ob
tain
ed
106
(a) Each STA demands 5 Mbps
SSF
Association used
0
2
4
6
8
10
Avg
. b
an
dw
idth
ob
tain
ed
106
(b) Each STA demands 10 Mbps
Figure 5.10: Bandwidth achieved with each association
63
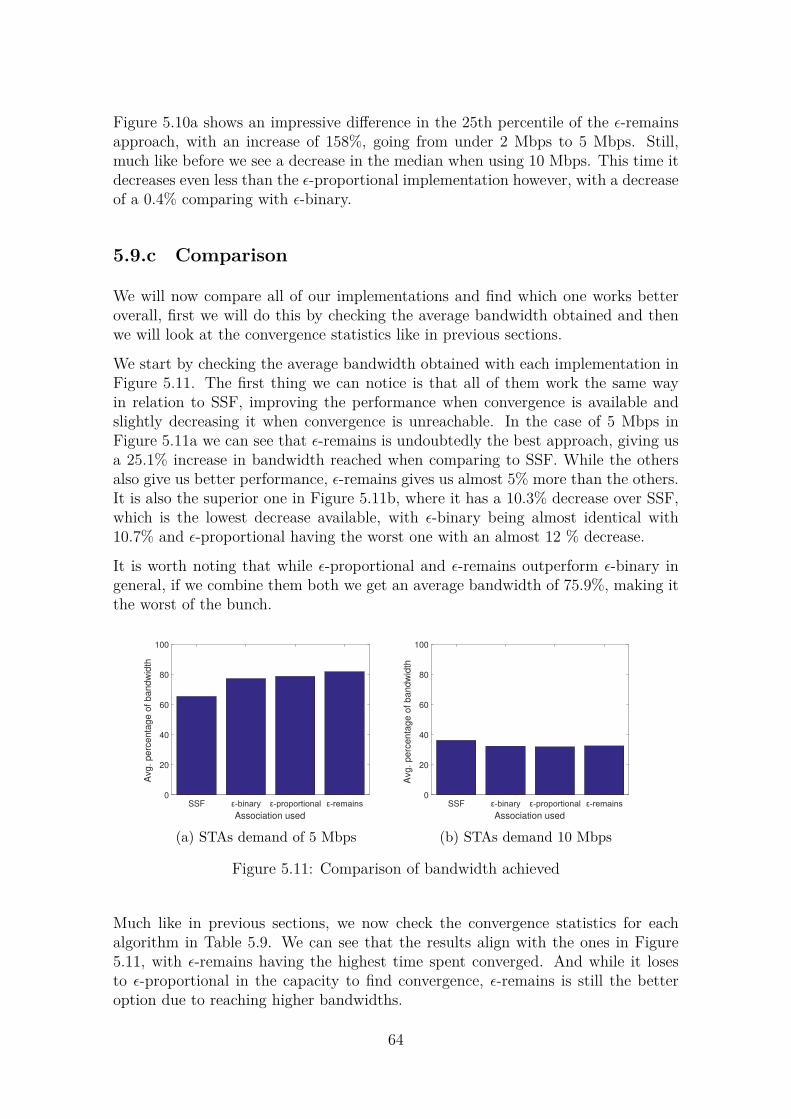
Figure 5.10a shows an impressive difference in the 25th percentile of the ϵ-remainsapproach, with an increase of 158%, going from under 2 Mbps to 5 Mbps. Still,much like before we see a decrease in the median when using 10 Mbps. This time itdecreases even less than the ϵ-proportional implementation however, with a decreaseof a 0.4% comparing with ϵ-binary.
5.9.c Comparison
We will now compare all of our implementations and find which one works betteroverall, first we will do this by checking the average bandwidth obtained and thenwe will look at the convergence statistics like in previous sections.
We start by checking the average bandwidth obtained with each implementation inFigure 5.11. The first thing we can notice is that all of them work the same wayin relation to SSF, improving the performance when convergence is available andslightly decreasing it when convergence is unreachable. In the case of 5 Mbps inFigure 5.11a we can see that ϵ-remains is undoubtedly the best approach, giving usa 25.1% increase in bandwidth reached when comparing to SSF. While the othersalso give us better performance, ϵ-remains gives us almost 5% more than the others.It is also the superior one in Figure 5.11b, where it has a 10.3% decrease over SSF,which is the lowest decrease available, with ϵ-binary being almost identical with10.7% and ϵ-proportional having the worst one with an almost 12 % decrease.
It is worth noting that while ϵ-proportional and ϵ-remains outperform ϵ-binary ingeneral, if we combine them both we get an average bandwidth of 75.9%, making itthe worst of the bunch.
SSF
Association used
0
20
40
60
80
100
Avg
. p
erc
en
tag
e o
f b
an
dw
idth
(a) STAs demand of 5 Mbps
SSF
Association used
0
20
40
60
80
100
Avg
. p
erc
en
tag
e o
f b
an
dw
idth
(b) STAs demand 10 Mbps
Figure 5.11: Comparison of bandwidth achieved
Much like in previous sections, we now check the convergence statistics for eachalgorithm in Table 5.9. We can see that the results align with the ones in Figure5.11, with ϵ-remains having the highest time spent converged. And while it losesto ϵ-proportional in the capacity to find convergence, ϵ-remains is still the betteroption due to reaching higher bandwidths.
64

5 MbpsAlgorithm binary proportional remains
Iterations that converged 52.89% 55.28% 57.64%Simulations where convergence was found 61% 63% 60%
Satisfied with SSF 34% 34% 34%Avg. Bandwidth 77.31% 78.79% 81.91%
Avg. Bandwidth vs.SSF +18,1% +20.3% +25.1%10 Mbps
Algorithm binary proportional remainsAvg. Bandwidth 32.39% 31.97% 32.53%
Avg. Bandwidth vs.SSF −10.7% −11.9% −10.3%
Table 5.9: Statistics for each algorithm
We have mentioned several times how the ϵ-greedy algorithm works well when con-vergence can be reached, but has some flaws when it is unreachable. The reason forthis comes from it being a decentralized approach to association. Much like withSSF, every STA looks only for its own satisfaction, meaning that there will be caseswhere a STA with a bad connection will remain associated to an AP while blockingthe others and taking all of the airtime available, making it an unfair system. Sincewe value bandwidth satisfaction and not fairness, this problem appears wheneverconvergence is unavailable. When convergence can be reached however, the systemdoes find a fairer situation in which everyone is satisfied. We show this in Figure5.12, where we use Jain’s fairness index with the bandwidth obtained by each STAat the end of each simulation. Figure 5.12a shows that with 5 Mbps we can reacha median of 1, making it a fair system, and greatly improving on SSF. But whenwe use 10 Mbps our fairness looks similar to that of SSF, and even worse, since ourupper adjacent is less than 1, while SSF can reach 1.
SSF
Association used
0.4
0.5
0.6
0.7
0.8
0.9
1
Ja
in f
airn
ess
(a) Fairness when STAs ask for 5 Mbps
SSF
Association used
0.4
0.5
0.6
0.7
0.8
0.9
1
Ja
in f
airn
ess
(b) Fairness when STAs ask for 10 Mbps
Figure 5.12: Jain’s fairness
65
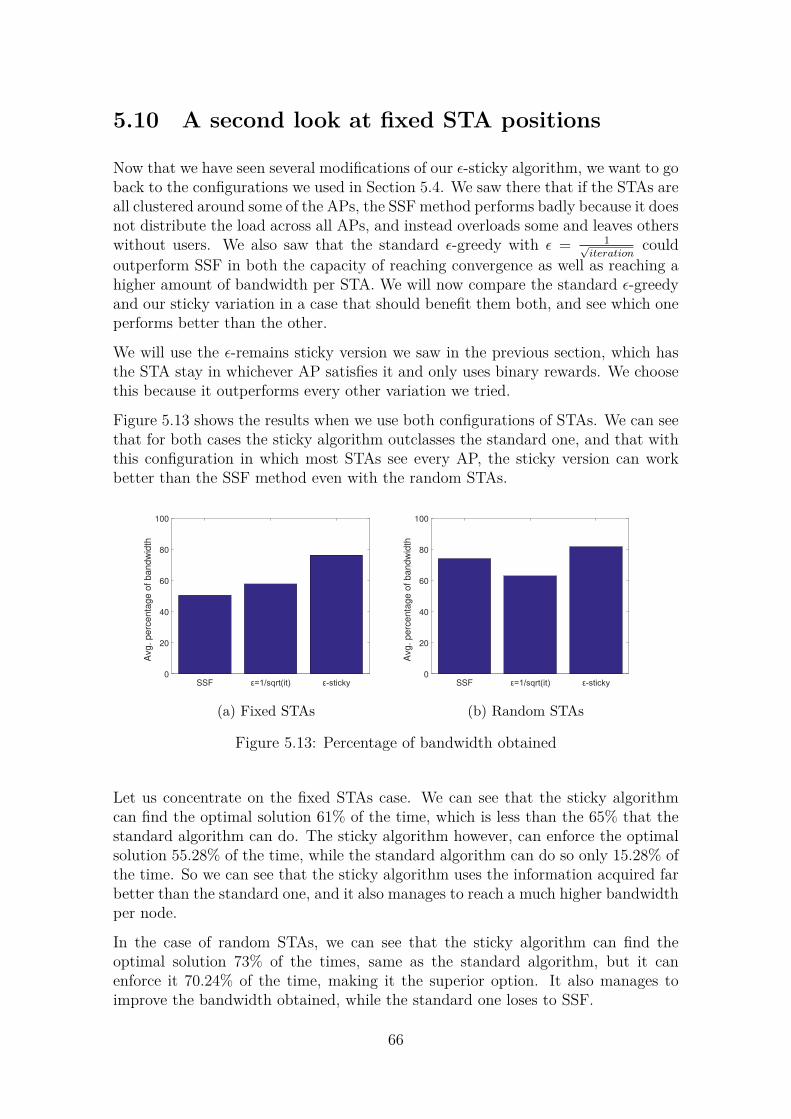
5.10 A second look at fixed STA positions
Now that we have seen several modifications of our ϵ-sticky algorithm, we want to goback to the configurations we used in Section 5.4. We saw there that if the STAs areall clustered around some of the APs, the SSF method performs badly because it doesnot distribute the load across all APs, and instead overloads some and leaves otherswithout users. We also saw that the standard ϵ-greedy with ϵ = 1√
iterationcould
outperform SSF in both the capacity of reaching convergence as well as reaching ahigher amount of bandwidth per STA. We will now compare the standard ϵ-greedyand our sticky variation in a case that should benefit them both, and see which oneperforms better than the other.
We will use the ϵ-remains sticky version we saw in the previous section, which hasthe STA stay in whichever AP satisfies it and only uses binary rewards. We choosethis because it outperforms every other variation we tried.
Figure 5.13 shows the results when we use both configurations of STAs. We can seethat for both cases the sticky algorithm outclasses the standard one, and that withthis configuration in which most STAs see every AP, the sticky version can workbetter than the SSF method even with the random STAs.
SSF0
20
40
60
80
100
Avg
. p
erc
en
tag
e o
f b
an
dw
idth
(a) Fixed STAs
SSF0
20
40
60
80
100
Avg
. p
erc
en
tag
e o
f b
an
dw
idth
(b) Random STAs
Figure 5.13: Percentage of bandwidth obtained
Let us concentrate on the fixed STAs case. We can see that the sticky algorithmcan find the optimal solution 61% of the time, which is less than the 65% that thestandard algorithm can do. The sticky algorithm however, can enforce the optimalsolution 55.28% of the time, while the standard algorithm can do so only 15.28% ofthe time. So we can see that the sticky algorithm uses the information acquired farbetter than the standard one, and it also manages to reach a much higher bandwidthper node.
In the case of random STAs, we can see that the sticky algorithm can find theoptimal solution 73% of the times, same as the standard algorithm, but it canenforce it 70.24% of the time, making it the superior option. It also manages toimprove the bandwidth obtained, while the standard one loses to SSF.
66

Fixed STAsAlgorithm ϵ = 1√
iterationϵ-sticky
Iterations that converged 15.28% 55.28%Simulations where convergence was found 65% 61%
Satisfied with SSF 11% 11%Avg. Bandwidth (vs.SSF) +14,1% +50.82%
Random STAsAlgorithm ϵ = 1√
iterationϵ-sticky
Iterations that converged 28.3% 70.24%Simulations where convergence was found 73% 73%
Satisfied with SSF 55% 55%Avg. Bandwidth (vs.SSF) −15.06% +10.3%
Table 5.10: Statistics for each configuration
For the fixed STAs case, we know the STA positions and implemented an associationthat would work optimally, one that we could call the optimal solution to the prob-lem. Since the APs still choose the channel randomly and the shadowing is changedevery iteration we could not find an association that works 100% of the time, butwe found one that manages to converge 66.45% of the time, and offered an increasein bandwidth of 62.7% over SSF. We can see that this is not so far from the 55.28%that our sticky algorithm achieves, especially if we consider that we enforced theassociation by hand instead of reaching it through any exploration, meaning thatno time was lost exploring options.
Previously, we mentioned that the uniform distribution of STAs benefits the SSFmethod, but in this section we saw that what actually has an effect on the effec-tiveness of the ϵ-greedy algorithm is not only the distribution used when placingSTAs, but how many options the algorithm has to explore. In the previous sectionswe have many situations with a STA only sensing a single AP, meaning that thealgorithm can not do anything in that case. Here however, since we place the STAsclose enough to see most if not all the APs, they can explore more options and havea bigger chance of finding an optimal solution.
5.11 Variable bandwidth
In the previous sections we had all the STAs demanding the same bandwidth duringthe entire simulation, and since a STA would increase its sticky counter by one foreach iteration that was successful, we could find sticky counters that reached over50, meaning that if the STA suddenly became unsatisfied it would take 50 iterationsfor the sticky counter to return to 0. In this section we will now have the STAshave different demands to show how the algorithm reacts to these changes. We willuse the ϵ-sticky with binary rewards and the implementation of the sticky state inϵ-remains that has the STA stay associated to its AP when it is satisfied. We will
67

also implement a limit on the sticky counter to make it easier for the STA to resetit.
Like before, we use 3 APs, 10 randomly placed STAs and have every STA pick abandwidth at random from 0 to 10 Mbps, as well as have them pick a new bandwidthin iterations 20,40, 60 and 80.
In Figure 5.14a we show the bandwidth that the STAs have on the last iteration ofthe simulation, in which we should see if the algorithm has reacted properly to thechanges in the network and managed to find an optimal solution for the last changein the STAs demands. As we can see, both ϵ-sticky implementations manage tooutperform SSF by the end of the simulation, ϵ-sticky without limiting the stickycounter offers an improvement of 4.64% over SSF, while limiting the sticky counteroffers the bigger improvement of the two, with a 6.83 % over SSF.
In Figure 5.14b we show the average accumulated satisfaction across the entiresimulation, there SSF reaches 64.3, while ϵ-sticky unlimited reaches 67.82 and ϵ-sticky limited manages to get 71.28. Both figures suggest the ϵ-sticky approach canadapt to the networks’ demands changing, and that limiting the sticky counter is abetter option. And if we look at Table 5.11 we can see the same, with the limitedϵ-sticky managing to spend more than half the time converged, while the others stayclose to 40%.
SSF Sticky-no max Sticky-max
Association used
0
20
40
60
80
Avg
. B
an
dw
idth
ob
tain
ed
(a) Avg. bandwidth in the last iteration
0 20 40 60 80 100
Association iterations
0
20
40
60
80
Avg
. S
atisfa
ctio
n
SSF
Sticky without max
Sticky with max
(b) Avg. satisfaction
Figure 5.14: Performance when the demands change
Algorithm SSF Sticky No Max Sticky MaxIterations that converged 40.13% 42.44% 51.05%
Avg. Bandwidth in last iteration 70.37 % 73.64% 75.18%
Table 5.11: Statistics for each approach
Finally we want to show a particular iteration and how the STAs react with eachalgorithm. We have chosen two STAs in this iteration that have very different ac-cumulated satisfaction counters, and we show their progression over time in Figures5.15. The first STA in Figure 5.15a shows that SSF keeps the STA unsatisfied until
68
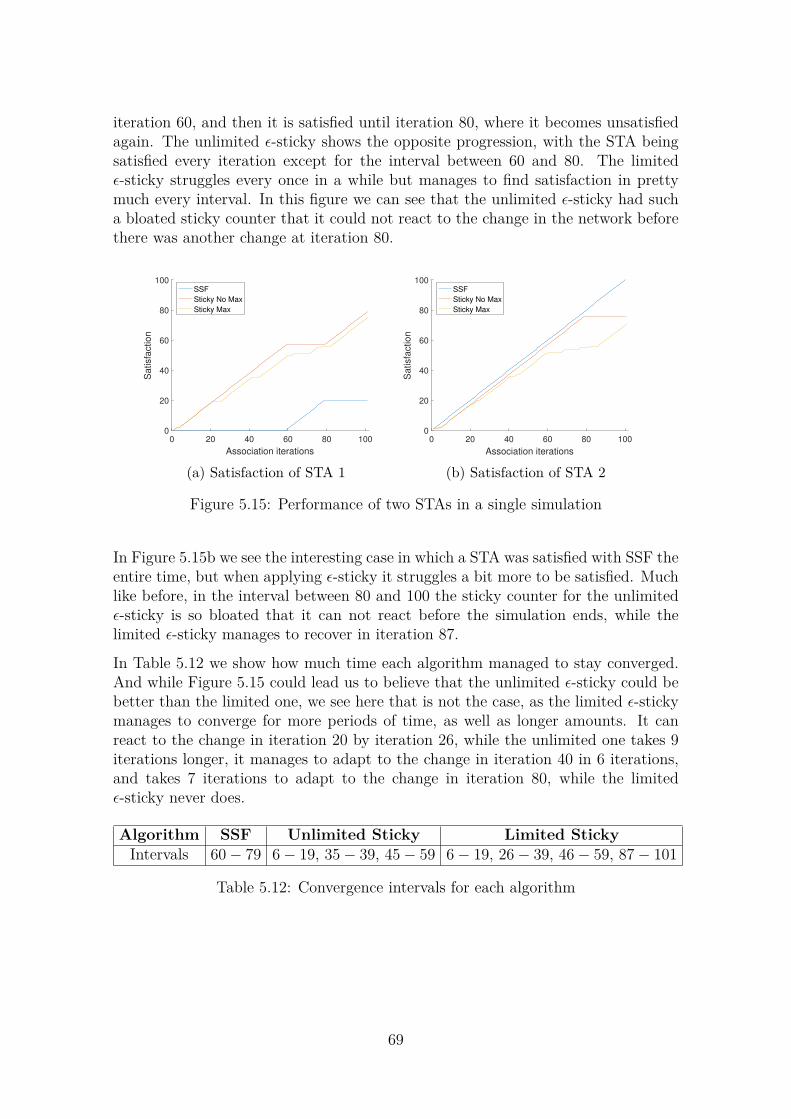
iteration 60, and then it is satisfied until iteration 80, where it becomes unsatisfiedagain. The unlimited ϵ-sticky shows the opposite progression, with the STA beingsatisfied every iteration except for the interval between 60 and 80. The limitedϵ-sticky struggles every once in a while but manages to find satisfaction in prettymuch every interval. In this figure we can see that the unlimited ϵ-sticky had sucha bloated sticky counter that it could not react to the change in the network beforethere was another change at iteration 80.
0 20 40 60 80 100
Association iterations
0
20
40
60
80
100
Sa
tisfa
ctio
n
SSF
Sticky No Max
Sticky Max
(a) Satisfaction of STA 1
0 20 40 60 80 100
Association iterations
0
20
40
60
80
100
Sa
tisfa
ctio
n
SSF
Sticky No Max
Sticky Max
(b) Satisfaction of STA 2
Figure 5.15: Performance of two STAs in a single simulation
In Figure 5.15b we see the interesting case in which a STA was satisfied with SSF theentire time, but when applying ϵ-sticky it struggles a bit more to be satisfied. Muchlike before, in the interval between 80 and 100 the sticky counter for the unlimitedϵ-sticky is so bloated that it can not react before the simulation ends, while thelimited ϵ-sticky manages to recover in iteration 87.
In Table 5.12 we show how much time each algorithm managed to stay converged.And while Figure 5.15 could lead us to believe that the unlimited ϵ-sticky could bebetter than the limited one, we see here that is not the case, as the limited ϵ-stickymanages to converge for more periods of time, as well as longer amounts. It canreact to the change in iteration 20 by iteration 26, while the unlimited one takes 9iterations longer, it manages to adapt to the change in iteration 40 in 6 iterations,and takes 7 iterations to adapt to the change in iteration 80, while the limitedϵ-sticky never does.
Algorithm SSF Unlimited Sticky Limited StickyIntervals 60− 79 6− 19, 35− 39, 45− 59 6− 19, 26− 39, 46− 59, 87− 101
Table 5.12: Convergence intervals for each algorithm
69
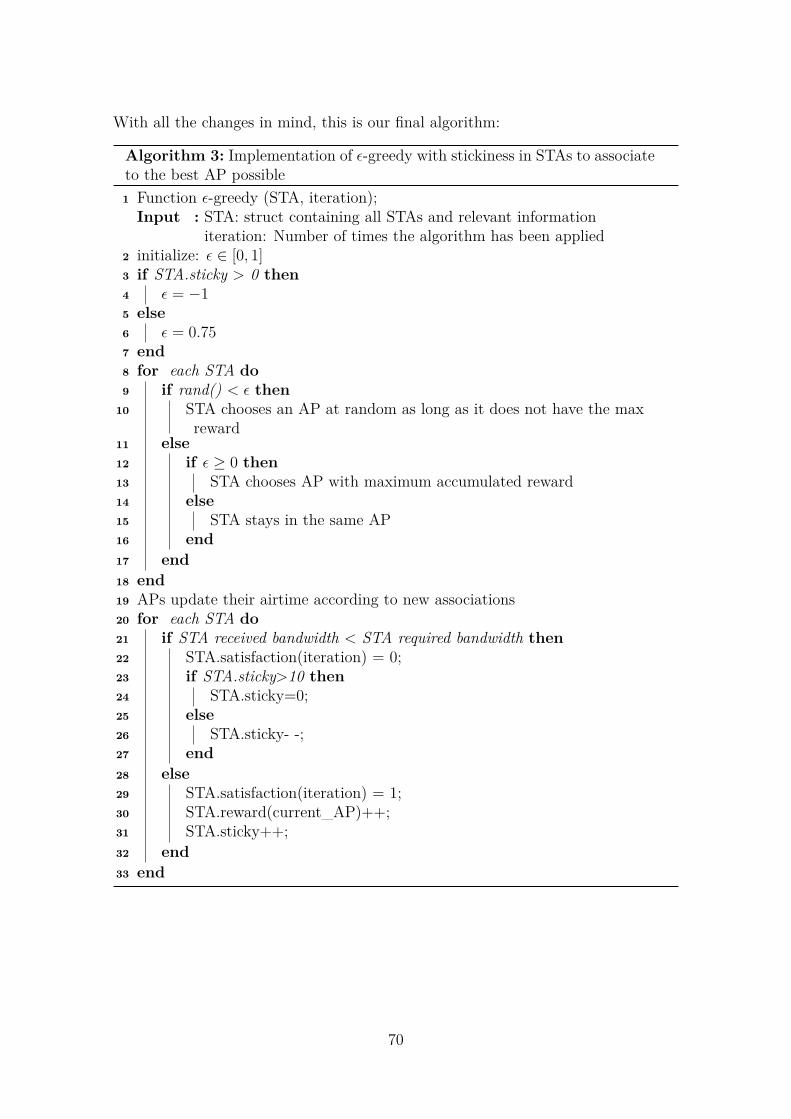
With all the changes in mind, this is our final algorithm:
Algorithm 3: Implementation of ϵ-greedy with stickiness in STAs to associateto the best AP possible1 Function ϵ-greedy (STA, iteration);
Input : STA: struct containing all STAs and relevant informationiteration: Number of times the algorithm has been applied
2 initialize: ϵ ∈ [0, 1]3 if STA.sticky > 0 then4 ϵ = −15 else6 ϵ = 0.757 end8 for each STA do9 if rand() < ϵ then
10 STA chooses an AP at random as long as it does not have the maxreward
11 else12 if ϵ ≥ 0 then13 STA chooses AP with maximum accumulated reward14 else15 STA stays in the same AP16 end17 end18 end19 APs update their airtime according to new associations20 for each STA do21 if STA received bandwidth < STA required bandwidth then22 STA.satisfaction(iteration) = 0;23 if STA.sticky>10 then24 STA.sticky=0;25 else26 STA.sticky- -;27 end28 else29 STA.satisfaction(iteration) = 1;30 STA.reward(current_AP)++;31 STA.sticky++;32 end33 end
70

5.12 Conclusions
Machine Learning has the potential to improve HD-WLANs reach better perfor-mance, we have seen this by creating an algorithm that can find an optimal associ-ation where Strongest Signal First cannot.
We have also shown that both mechanisms have different strengths: when the sce-nario is uniform the SSF method can be really close to the optimal solution, sinceit will associate each STA to its closer AP, spreading the STAs evenly. When thescenario is not uniform then SSF cannot compete with the ϵ-greedy mechanism,which can distribute the STAs among the APs and find a better solution throughtrial and error.
This means that as they are now, we require knowledge of the user distributionto choose the better option. An algorithm that outperforms them both SSF andour implementation of ϵ-sticky would need to use aspects from each of them, be itthrough acquiring information on the distribution of the network or by defaultingto SSF if ϵ-sticky cannot reach an optimal solution past a certain amount of time.
If we consider that both association mechanisms are flawed, then it is clear why SSFis the undisputed standard. SSF is a simple mechanism that does not need any extrainformation or steps. A STA just needs to receive a signal for SSF to work. On theother hand, ϵ-greedy or any other Reinforcement Learning algorithm will requiretime to reach their potential, as well as being able to re-associate from one AP toanother, which means that service could be interrupted. This is why ϵ-greedy willneed to outperform SSF in every possible user distribution to succeed it, becausewe can say that SSF is unoptimal, but it has no major drawbacks in terms of setup.On the other hand, Machine Learning algorithms will always have a setup time, butin the future we believe that their benefits will make their drawbacks worth it.
71

Chapter 6
Conclusions
Over the course of this work we have seen that the 802.11 protocol has received alot of changes over the years, and some of the most recent amendments are trying toimprove user association. The 802.11ai amendment is going to improve the roamingcapabilities of STAs, while 802.11k and the neighbor report starts to move thestandard towards smart networks where information is shared between nodes toimprove the user experience.
We have studied the hidden node problem in HD-WLANs, and how proper planningof the network is necessary for it to not become a problem. We have seen thatchannel allocation is necessary to mitigate it, that increasing the density of APsin the network can actually be beneficial in reducing the problem. We have alsochecked the effectiveness of CCA and power control, and seen that these methodswill decrease the amount of exposed nodes at the cost of adding more hidden nodes.In the case of CCA control we can consider these exchange worthwhile, since theincrease in hidden nodes is almost negligible compared to the decrease in exposednodes. In the case of power control, as well as using both techniques combined, wehave seen that they create far more issues than they solve, and that it is not worthit to use them.
Another way to improve the network’s performance is to change the way STAsassociate with APs, we have studied how Machine Learning algorithms can helpthe STAs obtain a better association, improving overall user satisfaction. Thesealgorithms require time and information to work properly however, and it will takesome tweaking before SSF can be dethroned as the main user association mechanism.
Looking forward, networks are going to be getting smarter with time, some manu-facturers are already implementing load control mechanisms in their APs to miti-gate the weaker aspects of the SSF mechanism. IEEE 802.11 amendments are alsomoving towards this, with the 802.11k and the neighbor report, which will receiveimprovements in the 802.11ai amendment, compressing the information sent in thereport, as well as reducing the re-association time between APs. It is possible thatin the future a single re-association will be enough to obtain the optimal associationbetween STA and APs.
73

Bibliography
[1] Matthew S. Gast. 802.11 Wireless Networks: The Definitive Guide, 2nd Edi-tion. O’Reilly Media, Inc., 2005.
[2] Glenn Judd and Peter Steenkiste. Fixing 802.11 access point selection. ACMSIGCOMM Computer Communication Review, 32(3):31–31, 2002.
[3] Anand Balachandran, Geoffrey M. Voelker, Paramvir Bahl, and VenkatP.Rangan. Characterizing user behavior and network performance in a publicwireless lan. ACM SIGMETRICS Performance Evaluation Review - Measure-ment and modeling of computer systems, 30(1):195–205, 2002.
[4] Magdalena Balazinska and Paul Castro. Characterizing mobility and networkusage in a corporate wireless local-area network. MobiSys ’03 Proceedings ofthe 1st international conference on Mobile systems, applications and services,pages 303–316, 2003.
[5] Sangho Shin, Andrea G.Forte, Anshuman Singh Rawat, and HenningSchulzrinne. Reducing mac layer handoff latency in ieee 802.11 wireless lans.MobiWac ’04 Proceedings of the second international workshop on Mobilitymanagement & wireless access protocols, pages 19–26, 2004.
[6] Tingting Sun, Yanyong Zhang, and Wade Trappe. Improving access pointassociation protocols through channel utilization and adaptive switching. EighthIEEE International Conference on Mobile Ad-Hoc and Sensor Systems, 2011.
[7] Dawei Gong and Yang Yuanyuan. Ap association in s02.lln wlans with hetero-geneous clients. 2012 Proceedings IEEE INFOCOM, pages 1440–1448, 2012.
[8] S. Vasudevan, K. Papagiannaki, C. Diot, J. Kurose, and D. Towsley. Facilitatingaccess point selection in ieee 802.11 wireless networks. IMC ’05 Proceedings ofthe 5th ACM SIGCOMM conference on Internet measurement, pages 26–26,2005.
[9] Wei Li, Shengling Wang, Yong Cui, Xiuzhen Cheng, Ran Xin, A. Al-RodhaanMznah, and Abdullah Al-Dhelaan. Ap association for proportional fairness inmultirate wlans. IEEE/ACM Transactions on networking, 22(1), 2014.
[10] Mohammed Amer, Anthony Busson, and Isabelle Guérlin Lassous. Associationoptimization in wi-fi networks: Use of an access-based fairness. The 19th ACM
75

International Conference on Modeling, Analysis and Simulation of Wireless andMobile Systems (MSWIM), pages 119–126, 2016.
[11] Cisco. Configuring aggressive load balancing in cisco wireless lan controllerconfiguration guide, release 7.4, 2017. Accessed: 08/06/2018.
[12] Cisco. The benefits of centralization in wireless lans via the cisco unified wirelessnetwork, 2006.
[13] Yunze Zeng, Ioannis Pefkianakis, Kyu-Han Kim, and Prasant Mohapatra. Mu-mimo-aware ap selection for 802.11ac networks. Mobihoc ’17 Proceedings ofthe 18th ACM International Symposium on Mobile Ad Hoc Networking andComputing, 2017.
[14] K. Heck. Wireless lan performance in overlapping cells. In 2003 IEEE 58thVehicular Technology Conference. VTC 2003-Fall (IEEE Cat. No.03CH37484),volume 5, pages 2895–2900 Vol.5, Oct 2003.
[15] Z. Zhong, P. Kulkarni, F. Cao, Z. Fan, and S. Armour. Issues and challengesin dense wifi networks. In 2015 International Wireless Communications andMobile Computing Conference (IWCMC), pages 947–951, Aug 2015.
[16] M. Drieberg, F. C. Zheng, R. Ahmad, and M. Fitch. Impact of interference onthroughput in dense wlans with multiple aps. In 2009 IEEE 20th InternationalSymposium on Personal, Indoor and Mobile Radio Communications, pages 752–756, Sept 2009.
[17] A. Ozyagci, K. W. Sung, and J. Zander. Effect of propagation environment onarea throughput of dense wlan deployments. In 2013 IEEE Globecom Workshops(GC Wkshps), pages 333–338, Dec 2013.
[18] Natsumi Kumatani, Mitomo Isomura, Tutomu Murase, Masato Oguchi, AkashBaid, Shweta Sagari, Ivan Seskar, and Dipankar Raychaudhuri. [paper]throughput characteristics in densely deployed wireless lans with various chan-nel assignments and differing numbers of terminals. ITE Transactions on MediaTechnology and Applications, 2(4):336–344, 2014.
[19] M. Drieberg, F. C. Zheng, R. Ahmad, and S. Olafsson. An asynchronousdistributed dynamic channel assignment scheme for dense wlans. In 2008 IEEEInternational Conference on Communications, pages 2507–2511, May 2008.
[20] T. Tandai, K. Toshimitsu, and T. Sakamoto. Interferential packet detectionscheme for a solution to overlapping bss issues in ieee 802.11 wlans. In 2006IEEE 17th International Symposium on Personal, Indoor and Mobile RadioCommunications, pages 1–5, Sept 2006.
[21] Vivek P. Mhatre and Konstantina Papagiannaki. Optimal design of high density802.11 wlans. In Proceedings of the 2006 ACM CoNEXT Conference, CoNEXT’06, pages 8:1–8:12, New York, NY, USA, 2006. ACM.
76
[22] H. Ma and S. Roy. Contention window and transmission opportunity adap-tation for dense ieee 802.11 wlan based on loss differentiation. In 2008 IEEEInternational Conference on Communications, pages 2556–2560, May 2008.
[23] B. Han, L. Ji, S. Lee, R. R. Miller, and B. Bhattacharjee. Channel access throt-tling for overlapping bss management. In 2009 IEEE International Conferenceon Communications, pages 1–6, June 2009.
[24] Yue Fang, Daqing Gu, A. B. McDonald, and Jinyun Zhang. A two-level carriersensing mechanism for overlapping bss problem in wlan. In 2005 14th IEEEWorkshop on Local Metropolitan Area Networks, pages 6 pp.–6, Sept 2005.
[25] C. Jiang, H. Zhang, Y. Ren, Z. Han, K. C. Chen, and L. Hanzo. Machinelearning paradigms for next-generation wireless networks. IEEE Wireless Com-munications, 24(2):98–105, April 2017.
[26] L. Stabellini and J. Zander. Interference aware self-organization for wirelesssensor networks: A reinforcement learning approach. In 2008 IEEE Interna-tional Conference on Automation Science and Engineering, pages 560–565, Aug2008.
[27] N. Rupasinghe and İ. Güvenç. Reinforcement learning for licensed-assisted ac-cess of lte in the unlicensed spectrum. In 2015 IEEE Wireless Communicationsand Networking Conference (WCNC), pages 1279–1284, March 2015.
[28] M. Simsek, M. Bennis, M. Debbah, and A. Czylwik. Rethinking offload: Howto intelligently combine wifi and small cells? In 2013 IEEE InternationalConference on Communications (ICC), pages 5204–5208, June 2013.
[29] Biljana Bojovic, Nicola Baldo, Jaume Nin-Guerrero, and Paolo Dini. A su-pervised learning approach to cognitive access point selection. GLOBECOMWorkshops, Joint Workshop of SCPA 2011 and SaCoNAS 2011, 2011.
[30] Tingting Sun, Wade Trappe, and Yanyong Zhang. Improved ap associationmanagement using machine learning. SIGMOBILE Mob. Comput. Commun.Rev., 14(4):4–6, November 2010.
[31] Francesc Wilhelmi, Cristina Cano, Gergely Neu, Boris Bellalta, Anders Jonsson,and Sergio Barrachina-Muñoz. Collaborative spatial reuse in wireless networksvia selfish multi-armed bandits. CoRR, abs/1710.11403, 2017.
[32] Task Group AX. Tgax simulation scenarios. Technical report, IEEE P802.11,2015.
[33] Jeongkeun Lee, Wonho Kim, Sung-Ju Lee, Daehyung Jo, Jiho Ryu, TaekyoungKwon, and Yanghee Choi. An experimental study on the capture effect in802.11a networks. In Proceedings of the Second ACM International Workshopon Wireless Network Testbeds, Experimental Evaluation and Characterization,WinTECH ’07, pages 19–26, New York, NY, USA, 2007. ACM.
77

[34] Dongjin Son, Bhaskar Krishnamachari, and John Heidemann. Experimentalstudy of concurrent transmission in wireless sensor networks. In Proceedingsof the 4th International Conference on Embedded Networked Sensor Systems,SenSys ’06, pages 237–250, New York, NY, USA, 2006. ACM.
[35] Jaume Barcelo, Boris Bellalta, Cristina Cano, Anna Sfairopoulou, MiquelOliver, and Kshitiz Verma. Towards a collision-free wlan: Dynamic parameteradjustment in csma/e2ca. EURASIP Journal on Wireless Communications andNetworking, 2011(1):708617, Mar 2011.
78