Embed Size (px)
Citation preview
Report No. FHWA/RD-81/031
TE662.A3no
.
FHWA-RD-S 1 -03 I
ROVING THE RESIDENTIAL STREET
IRONMENT
May 1981
Final Report
^O^.
**4TES O*
Document is available to the public through
-Springfield,. Virginia -22-1-61
u S
<
C6 rtrxs ~* n-t P n „ # Kj. f
,-
c?
Prepared for
FEDERAL HIGHWAY ADMINISTRATION
Offices of Research & Development
Environmental Division
Washington, D.C. 20590
FOREWORD
This report capsulizes the results of state-of-the-artresearch on a broad range of techniques for residentialtraffic control or traffic management and specific casestudy research on applications of the Transportation andRoad Research Laboratory (TRPL) developed "road hump"on United States residential streets. It also summarizesfinding of original research on resident preferencesregarding traffic speed and volume on residential streets,and on factors which affect drivers' speed choice onresidential streets, and reviews legal consideration inneighborhood traffic management.
This study was initiated as a result of problem statementssubmitted for FCP Project 1A by engineers in Berkeley,California; Mesa, Arizonia; Anne Arundel County, Maryland;Sacramento, California and Santa Ana, California.
Sufficient copies of the Executive Summary are being dis-tributed to provide two copies to each regional office,two copies to each division office, two copies to eachState highway agency, and one copy to each MetropolitanPlanning Organization (MPO) . One copy of the full reportis being sent to each regional office, division office,State highway agency, and Metropolitan Planning Organiza-tion (MPO). The State, division office, and MPO copiesof both reports are being sent directly to each divisionoffice.
Gfiarles F. Scheffe:eyDirector of ResearchFederal Highway Administration
NOTICE
This document is disseminated under the sponsorship of the
Department of Transportation in the interest of information
exchange. The United States Government assumes no liability
for its contents or use thereof. The contents of this report
reflect the views of the contractor, who is responsible for
the accuracy of the data presented herein. The contents do
not necessarily reflect the official views or policy of the
Department of Transportation. This report does not constitute
a standard, specification, or regulation.
The United States Government does not endorse products or
manufacturers. Trade or manufacturers' names appear herein
only because they are considered essential to the object of
this document.
-A3 Technical Report Documentation Page
1. Report No.
FHWA/RD-81/031
2. Government Accession Nc 3. Recipient's Catalog No.
4. Title and Subtitle
IMPROVING THE RESIDENTIAL STREET ENVIRONMENTFINAL REPORT
5. Report Date
May 19816. Performing Organization Code
7. Author's)
Daniel T. Smith, Jr. and Donald Appleyard
8. Performing Organization Report No.
9. Performing Organization Name and Address
DeLeuw, Cather & CompanyP.O. Box 7991, San Francisco, CA
with: Donald Appleyard, Berkeley Planning Associates and DKS Associates
10. Work Unit No. (TRAIS)
FCP 31A1-72U11. Contract or Grant No.
D0T-FH-1 1-9309
12. Sponsoring Agency Name and Address
Office of ResearchFederal Highway AdministrationU.S. Department of Transportation-Washington, D.C. 70590
13. Type of Report and Period Covered
Final Report
14. Sponsoring Agency Code
15. Supplementary Notes
Contract Manager: John Fegan (HRS-41)
16. Abstract
This final report summarizes state of the art research on a broad range of tech-niques for Residentail Street Traffic Control or Traffic Management and specificcase study research on applications of the TRRL-developed "road hump" on U.S.
residential streets. It also summarizes findings of original research on residentpreferences regarding traffic speed and volume on residential streets, on factorswhich affect drivers' speed choice on residential streets and reviews legal con-
siderations in neighborhood traffic management.
L{ A<Cv\/^y> iri'viL r^inti
Sjroi({°*fic
w>OSO->oo\ooil<i-1
fLf
17. Key Words
Residential Street Traffic ControlNeighborhood Traffic ManagementRoad Humps, Speed Bumps, DivertersTraffic Restraint
18. Distribution Stotement
No Restrictions.
jjh^fiugh 1- hjQ. Not i-oool Tochni cjrM^^rr-
ffla-t-i-Oft^Scrvi ce t Sprinq fiold, VA—£-2r\44-
19. Security Classif. (of this report)
Unclassi f ied
20. Security Classif. (of this page)
Unclassi f ied
21. No. of Pages
149
22. Price
Form DOT F 1700.7 (8-72) Reproduction of completed page authorized
TABLE OF CONTENTS
IMPROVING THE RESIDENTIAL STREET ENVIRONMENT
CONTENTS PAGE
CHAPTER I - INTRODUCTION I
REPORT AND PROJECT SCOPE I
SUMMARY OF KEY FINDINGS 2
CHAPTER 2 - STATE OF THE ART IN RESIDENTIALAREA TRAFFIC CONTROL 10
NEIGHBORHOOD TRAFFIC MANAGEMENT - A DEFINITION I I
PRIMARY DEVICES FOR NEIGHBORHOOD TRAFFICMANAGEMENT 16
SYSTEMIC PLANNING FOR NEIGHBORHOOD TRAFFICCONTROL 27
PLANNING FOR NEIGHBORHOOD TRAFFIC MANAGEMENT 34
CHAPTER 3 - RESEARCH ON ROAD HUMPS 48WHAT IS A ROAD HUMP 48SUMMARY OF ROAD HUMP RESEARCH BY TRRL 48ST. LOUIS AND SACRAMENTO CLOSED - SITE TESTS 5
1
THE BREA CASE STUDY 59
PERFORMANCE OBSERVATIONS 63
REACTIONS OF RESIDENTS AND DRIVERS TO THE HUMPS 74BOSTON CASE STUDIES 80PERFORMANCE 84REACTIONS OF BOSTON RESIDENTS TO THE HUMPS 88SACRAMENTO CASE STUDY 95
SPEED VS. HUMP SEPARATION 97
CHAPTER 4 - IMPLEMENTATION PLAN FOR ROAD HUMPS 99
SUMMARY OF ROAD HUMPS PERFORMANCE 99GENERAL CRITERIA FOR APPLICATION 99
INSTALLATION DETAILS 101
PREPARING THE STREET'S USERS 108
MONITORING AND EVALUATING THE HUMP'S PERFORMANCE 1 10
FHWA FOLLOW-UP I I I
CHAPTER 5 - STUDIES OF SPEED AND VOLUME ONRESIDENTIAL STREETS 1 1 3
THE PROBLEM 113
RESEARCH PROCEDURE 114
HOW FAST IS TOO FAST, HOW MUCH IS TO MUCH? I 16
EFFECTS OF STREET ENVIRONMENT ELEMENTS ONTRAFFIC SPEED 123
RESULTS 125
i i
TABLE OF CONTENTS (Continued)
CONTENTS PAGE
CHAPTER 6 - LEGAL ISSUES IN NEIGHBORHOOD TRAFFICMANAGEMENT 1 3
1
AUTHORITY OF LOCAL JURISDICTIONS TO UNDERTAKERESIDENTIAL TRAFFIC MANAGEMENT 1 3
1
REASONABLENESS IN EXERCISE OF THE POLICE POWER 132
RIGHTS OF ACCESS 133
CONFORMANCE TO TRAFFIC CONTROL AND DESIGNSTANDARDS 134
APPENDIX 1 37
i i i
LIST OF FIGURES
Page
1. Speed Bumps And Road Humps 19
2. Rumble Strip 20
3. Diagonal Diverter 21
4. Cul-de-Sac 22
5. Semi-Diverter 22
6. Speed Control Circle 247. Choker 248. One-Way Systems 25
9. Woonerf 2610. Peripheral Barrier System - Dominant Direction 29
11. Peripheral Barrier System - Multi-Direction 2912. Return Loop System 29
13. Anti-through System 2914. Maze 31
15. Maze With Internal Special Generator 31
16. Non-grid System Problems 32
17. Citizen Participation In Transportation Planning 36
18. Speed Bumps And Road Humps 49
19. Discomfort Perceptions - Automobiles 5420. Discomfort Ratings - Long Wheelbase Vehicles 56
21. Discomfort Rating - Motorcycles 57
22. La Canada (Brea) Vicinity Map 61
23. Installation Procedures - Brea 62
24. Sign Details And Finished Appearance - Brea 64
25. Effects On Traffic Volume - Brea 6626. La Canada (Brea) Speed Effects - Northbound 67
27. La Canada (Brea) Speed Effects - Southbound 6828. Boston Hump Installations 8329. Lochstead Avenue (Boston) Speed Profiles - Westbound 85
30. Lochstead Avenue (Boston) Speed Profiles - Eastbound 8631. Willow Street (Boston) Speed Profiles 87
32. Sacramento Installation Details 96
33. Mid-Hump Speed vs. Separation Distance 98
34. Hump Spacing Concepts 103
35. Hump Cross Section 104
36. Curbline Taper Detail 106
37. Gutter Running Countermeasures 107
38. Residents' Speed Acceptance Ratings 117
39. Speed Acceptance Considering Children - Prince Street 117
40. Speed Acceptance Considering Children - Fulton 119
41. Actual Speed vs. Resident Perceptions - Fulton I 19
42. Actual Speed vs. Resident Perceptions - Prince 120
IV
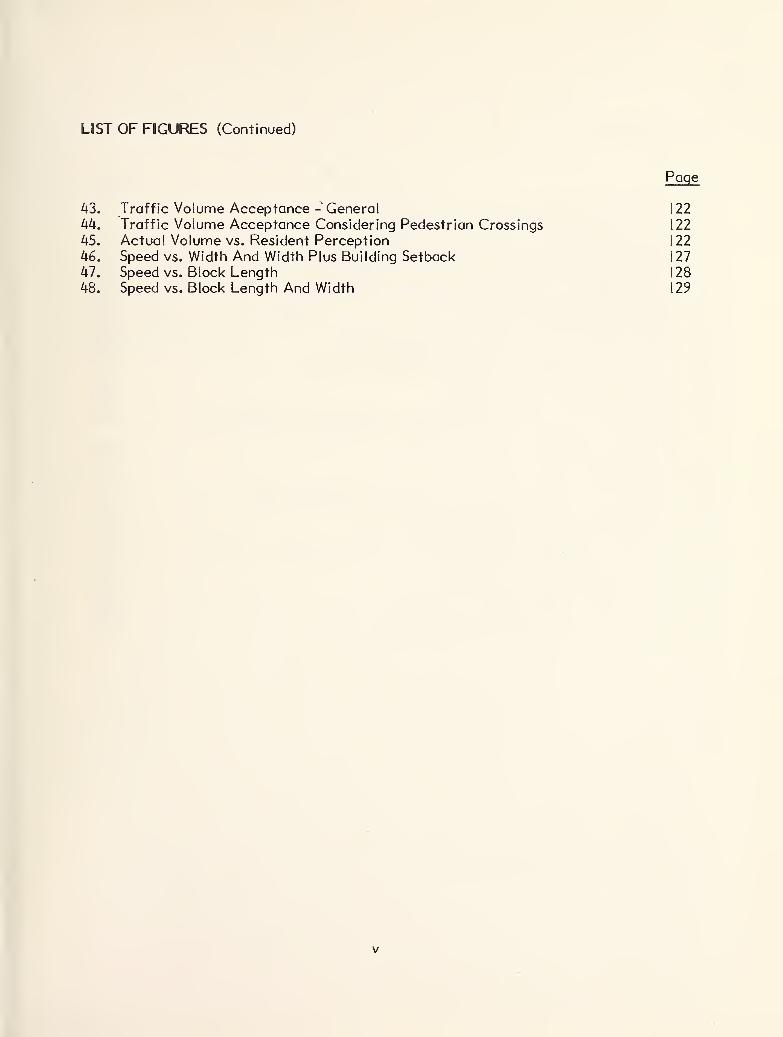
LIST OF FIGURES (Continued)
Page
43. Traffic Volume Acceptance -General 122
44. Traffic Volume Acceptance Considering Pedestrian Crossings 122
45. Actual Volume vs. Resident Perception 122
46. Speed vs. Width And Width Plus Building Setback 127
47. Speed vs. Block Length 128
48. Speed vs. Block Length And Width 129
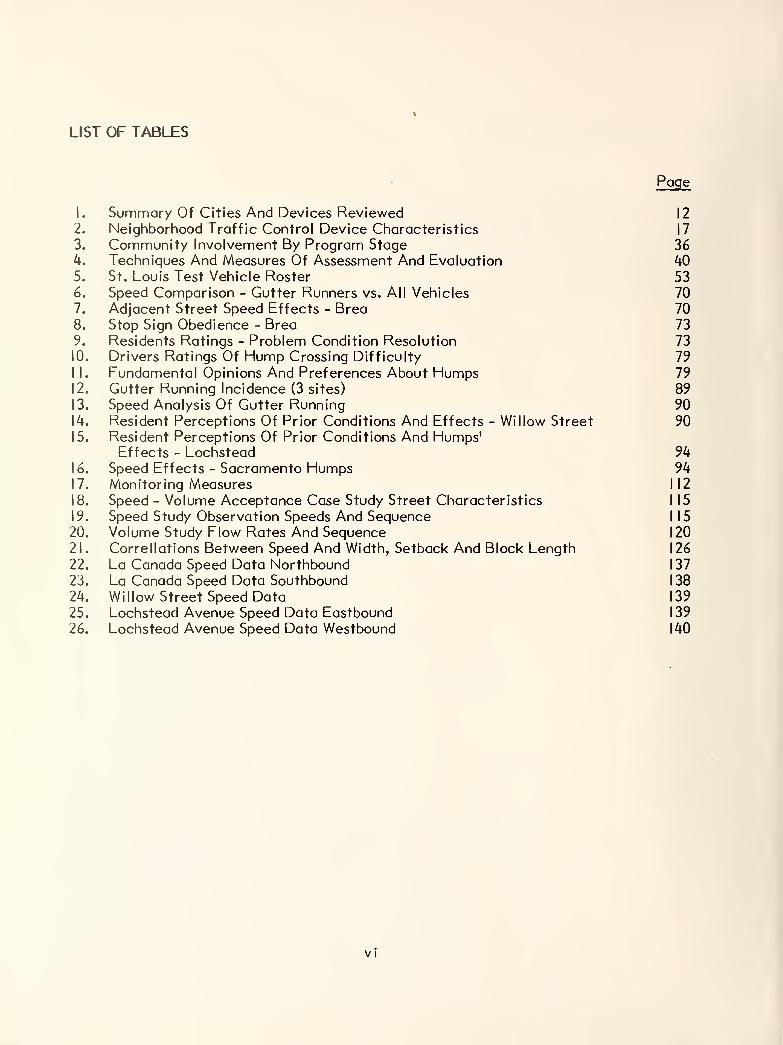
LIST OF TABLES
Page
1. Summary Of Cities And Devices Reviewed 12
2. Neighborhood Traffic Control Device Characteristics 17
3. Community Involvement By Program Stage 364. Techniques And Measures Of Assessment And Evaluation 405. St. Louis Test Vehicle Roster 536. Speed Comparison - Gutter Runners vs. All Vehicles 707. Adjacent Street Speed Effects - Brea 708. Stop Sign Obedience - Brea 73
9. Residents Ratings - Problem Condition Resolution 7310. Drivers Ratings Of Hump Crossing Difficulty 79
I I. Fundamental Opinions And Preferences About Humps 7912. Gutter Running Incidence (3 sites) 8913. Speed Analysis Of Gutter Running 9014. Resident Perceptions Of Prior Conditions And Effects - Willow Street 9015. Resident Perceptions Of Prior Conditions And Humps'
Effects - Lochstead 9416. Speed Effects - Sacramento Humps 9417. Monitoring Measures 112
18. Speed - Volume Acceptance Case Study Street Characteristics 115
19. Speed Study Observation Speeds And Sequence 115
20. Volume Study Flow Rates And Sequence 120
21. Correlations Between Speed And Width, Setback And Block Length 126
22. La Canada Speed Data Northbound 137
23. La Canada Speed Data Southbound 138
24. Willow Street Speed Data 139
25. Lochstead Avenue Speed Data Eastbound 139
26. Lochstead Avenue Speed Data Westbound 140
VI
ACKNOWLEDGMENTS
Several officials in local jurisdictions made contributions which were vital to the success
of this program. Messers. Bill Wilson and Earl Ray of the City of St. Louis, WarrenSiecke of the City of Brea, Bob Drummond of the City of Boston and Dick Folkers of the
City of Sacramento were instrumental in the case study research on road humps. Others
too numerous to cite here individually shared information and insights which comprisedthe fundamental data base for the State-of-the-Art Report. Their contributions are
gratefully acknowledged.
VI I

CHAPTER I
INTRODUCTION
REPORT AND PROJECT SCOPE
This final technical report is one of three
documents resulting from Contract Num-ber DOT-FH-I 1-9309, Improving The Re-sidential Street Environment, sponsored
by the Federal Highway Administration.
It details current practice and new tech-
niques for control of traffic on residen-
tial streets. The word "control" is used
here in a broader sense than the traffic
engineer's strict definition. Many of the
devices considered herein may more pro-
perly be termed geometric features of
the road. In the context of this study,
the traffic controls of interest are ones
which guide, warn or regulate traffic for
purposes of improving the quality of the
residential environment along streets
having the predominant intended func-
tion of providing access to residential
properties in the immediate local area .
The study is concerned with responses to
problems experienced on existing resi-
dential streets; design of new residential
streets is not within its scope.
The initial phase of the study involved
a review of current practices in residen-
tial street traffic control or residential
street traffic management. The reviewconcentrated on activities in the UnitedStates but also scanned overseas experi-
ence and practices on the subject mat-ter. Findings of this review were tho-
roughly documented in a report entitled
Improving the Residential Street En-vironment, State-of-the-Art . The State-
of-the-Art report identifies devices cur-
rently in use for residential area traffic
control and presents data on their per-formance. It also provides an extensive
guide to the process of planning and de-
sign for residential area traffic control
and for community involvement in that
process. Chapter 2 of this final report
details procedures followed in the state-
of-the-art search and highlights signifi-
cant portions of the State-of-the-Artreport.
The state-of-the-art search led to fo-
cusing a significant portion of the secondphase of the research project on testing
and field application of a form of speedcontrol hump developed by the Transpor-tation and Road Research Laboratory(TRRL) in Great Britain. The TRRL "un-
dulation" differs from "conventional
speed bumps" in both its physical shape(12 feet (3.65m) long in the direction of
vehicle travel versus 1.5-3 feet (.46-
.92m) for conventional bumps) and in
performance characteristics (apparently
both safer and more effective in control-
ling speeds than conventional humps).Field testing of the device was conduct-ed in St. Louis, Missouri, and public
street case studies were conducted in
Boston, Massachusetts and Brea, Califor 1-
nia. Additional field tests and public
street case studies were observed in Sac-ramento, California. Chapter 3 details
study procedures and findings of the re-
search on undulations.
As an outgrowth of the state-of-the-
art search findings, the research teamwas requested to conduct an exploratory
probe of what traffic speeds and volumeson residential streets met resident ex-pectations or achieved broad accep-tance. That is to say, what should the
speed limit be on a local residential
street? This inquiry stemmed from the
finding in the first phase of the research
that objective traffic measures tradi-
tionally relied-upon by traffic engineers
to identify problem conditions frequently
do not coincide with resident perceptions
of problem thresholds or conditions. This
is particularly true with respect to traf-
fic speed and traffic volume. Chapter 4presents an Implementation Plan for ap-
plications of the TRRL Road Humps.The plan stresses carefully monitoredapplications rather than providing
blanket approval for use of the device.
Chapter 5 of this report details research
methodology utilized in the probe of re-
sident sensitivity to traffic speed and
volume, details findings of the research
and suggests directions for further re-
search on this subject. Chapter 5 also
presents the results of pilot research re-
lating driver speed on residential streets
to roadside environmental factors. This
research, if carried further, may be as-
sistive in development of "psychological
controls" on residential street speeding.
Chapter 6 presents a review of legal
considerations in neighborhood traffic
management.
SUMMARY OF KEY FINDINGS
State-of-the-Art Research
The state-of-the-art search included re-
view of residential traffic managementinstallations or attempts in over 250local jurisdictions in the U.S., extensive
review of applications overseas and dir-
ect contacts with leading practitioners in
the field. Major findings of the state-of-
the-art phase of the project are summar-ized below.
• Employment of special traffic control
measures intended to mitigate the im-pacts of traffic on the quality andliveability of residential streets is
extremely pervasive in local jurisdic-
tions across the U.S. Even those juris-
dictions which have not actually re-
sorted to employment of such devices
have almost universally experiencedsome problems or pressures related to
conflicts between local street traffic
and residential liveability.
• There has been considerable communi-cation of techniques through profes-
sional journals, professional society
work and informal jurisdiction to jur-
isdiction contacts. However, at the
time of the state-of-the-art search,
the most extensive publications on the
subject matter (Appleyard - Liveable
Urban Streets; Managing Auto Traffic
in Neighborhoods and Buchanan - Traf-
fic in Towns) had not reached the im-plementation-level professionals in
most local jurisdictions. Furthermore,even these works lack the specificity
regarding device design, location cri-
teria and planning process guidance
which the action-level professionals
need.
As a result, actions taken to date at
the local level reflect the efforts of
individual professionals operating lar-
gely on their own judgment and initia-
tive with limited knowledge of parallel
experiences and without knowledge of
the full range of options open to
them. This has produced a wide varia-
tion in both methods of control at-
tempted and in the design treatmentsof fundamentally similar devices. It
has also led to repetitions of similar
unsatisfactory experiences in several
communities and to wasted efforts re-
inventing solutions which have already
proven satisfactory somewhere else.
The lack of guidance and heavy reli-
ance on individual judgment has led to
numbers of installations involving
peculiar geometries and choices of
materials and absence of signs andmarkings such that the research teamfelt concern for the functionality and
safety of these particular installa-
tions. The need for authoritative
guidance on the subject seemed clear.
Many of the techniques utilized in
neighborhood traffic control have not
yet been clearly addressed in the Man-ual on Uniform Traffic Control Devi-
ces (MUTCD), parallel state manualsand basic traffic engineering reference
texts. There is need for a means of
improving techniques and fostering
conformity of design practices with
respect to geometries, materials, sign-
ing and marking of residential street
traffic control devices as well as to
official recognition of residential
street traffic management as legiti-
mate traffic control activity. It ap-
pears desirable that the subject of
residential street traffic control
receive more direct treatment in the
MUTCD and complimentary design
guides.
Objective measures customarily used
by traffic engineers sometimes do not
measure, or relate to problem condi-
tions perceived by residents. Forinstance, traffic engineers consider
the 85th percentile speed in evaluating
conformity to speed limits while re-
sident perceptions of speeding tend to
be shaped by the speeds of the fewfastest drivers. As a result of this dif-
ference, professionals and residents
frequently disagree as to whether aproblem existed and whether a parti-
cular device really changed conditions
or not.
Engineers face many obstacles to be-
coming actively involved in traffic
management schemes. Obstacles in-
clude the lack of official or quasi-
official design guidance, conflicts
between traditional objective traffic
engineering measures and resident per-
ceptions of problem conditions, a par-
tial knowledge of attempts-gone-wrong in other communities and theinherent conflict between the philoso-
phy of neighborhood traffic manage-
ment and the traditional role of the
traffic engineer to facilitate and im-prove accessibility. As a consequence,some traffic engineers, public worksand planning officials have staunchly
opposed residential street traffic
control measures.
A variety of traffic control devices*
have been utilized in the U.S. for
residential street traffic control or
traffic management purposes with
some degree of success. Different
devices respond best to differing types
of problems and differing site circum-stances. No single device can betabbed the universal solution to resi-
dential street traffic problems.Many of the devices are physical in
the sense that they physically induce
or preclude specific patterns of driver
behavior. Physical devices are nor-
mally successful in bringing about the
desired change in traffic. But they
usually involve fairly substantial
engineering and construction costs andcan have substantial secondary im-pacts, some positive and others ad-
verse in nature.
Other devices are passive in the
sense that they simply command or
suggest a driver behavior pattern but
depend on driver choice to comply to
achieve their intended effect. Since
they are more easily violated than
physical controls, they tend to be less
effective in achieving their objec-
tive. Passive controls generally in-
volve low cost installations and usually
* Throughout this report, the words "traffic control devices" are used in a broad contextrather than in the traffic engineer's specific definition. Some of the devices of
interest (i.e.: diagonal diverters, undulations, culs-de-sac) might more properly betermed "geometric features of the road" rather than "control devices". However, since
these features are introduced for purposes of controlling the amount and behavior of
traffic which uses the streets in the same way as turn prohibition signs, stop signs or
speed limits might be, the term traffic control devices is used in a broad contextthroughout the report.
have fewer secondary impacts than
physical controls but do require somedegree of enforcement for success.
An ideal form of control would be onewhich operates on inherent driver
response patterns to particular stimuli
to induce desired driver behavior pat-
terns. Such psychological controls
might avoid the cost and heavy-handedsecondary impacts associated with
physical controls and the dependenceon drivers' voluntary compliance of the
passive controls. Some attempts at
developing such controls have beenmade but few have proven effective.
• A key problem with physical devices is
the need to preserve essential accessi-
bility for emergency vehicles.
• Overseas attempts at residential area
traffic management have generally
employed the same types of control
devices as are being employed by local
jurisdictions in the U.S. However,there are two major foreign develop-
ments which deserve further conside-
ration in the U.S. One of these is a
form of speed control hump or undula-
tion developed by TRRL in GreatBritain. The device is a hump of
circular-arc cross-section raising to amaximum of four inches (I Ocm) abovethe normal pavement surface and hav-
ing a chord distance of 12 feet (3.65m)
in the direction of vehicular travel.
TRRL's test track and public street
experiments indicated its speed con-trol performance and safety charact-
eristics were sufficiently different
from (improved over) those of "con-
ventional speed bumps" to warrantconsideration of U.S. applications of
the TRRL device. Case studies of
such U.S. applications became a majorelement of the Phase Two research
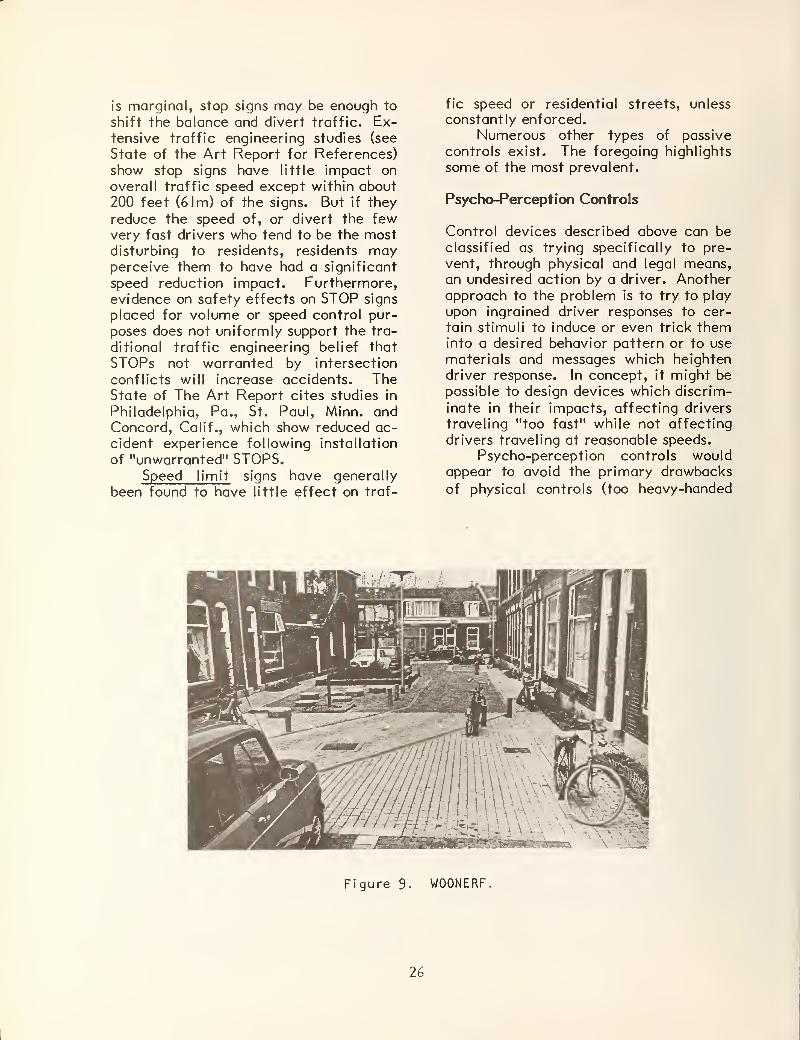
program.In the Netherlands, extensive efforts
have been devoted to development of
"woonerven" (residential precincts).
Woonerven involve changes in both the
physical characteristics of the street
and in the regulations governing vehi-
cular operation. The physical changesinvolve elimination of any features
which suggest a separation of different
types of traffic (and hence, priority
for motorized traffic). Features sug-
gesting pedestrians have complete ac-
cess to the entire street area are em-phasized. Other physical changes in-
troduced to slow traffic include
humps, changes in alignment, changesin pavement texture, narrowings anduse of bollards, planters, trees, street
furniture and parking areas to rein-
force the alignment changes and nar-
rowings. The special "rules of the
road" which apply in a woonerf restrict
drivers to speeds no faster than "a
walking pace," orders that drivers not
hinder pedestrians and that pedestrians
not unnecessarily hamper the progress
of drivers.
A woonerf can be a single block or an
area of several blocks. Over 800woonerven have been constructed in
the Netherlands over the past de-
cade. The concept is also being ap-
plied extensively in Germany.
• Although neighborhood traffic pro-
blems usually manifest themselves
through site specific conditions and
complaints, the fundamental problems
are as often systemic as they are site
specific. Attempts at site specific
traffic management actions in many of
the communities observed were not
entirely satisfactory because of failure
to recognize the systemic nature of
the problems. Effective solutions to
systemic problems involve a group of
control devices treating an entire area
or neighborhood. For this reason, the
State-of-the-Art report emphasizes
systemic approaches to planning for
neighborhood traffic management.
Peoples' feelings about their homeenvironment, particularly with respect
to traffic and street appearance is-
sues, are extremely strong and often
emotionally charged. Residential traf-
fic management actions often benefit
some residents at the expense of in-
conveniences or disbenefits to others
(mostly drivers). For these reasons,
residential traffic management actions
are usually controversial.
Successful planning for residential
traffic management requires conside-
ration of many fine-grained details
involving residents' perceptions of the
problems, people's behavior in using
the street and precise physical con-
ditions and constraints. Because of
the inherently controversial nature of
the actions and the importance of re-
sident perceptions and of minute de-
tails of usage and behavior known only
to residents, community involvementis an essential element in planning for
residential traffic management. Forthis reason, the State-of-the-Art re-
port presents extensive guidance oncommunity involvement in the plan-
ning process.
Attempts at residential traffic man-agement were hampered by shortcom-ings in understanding how to conduct a
planning process for this purpose as
frequently as they were hindered byincomplete knowledge relating to the
specific control devices. Shortcomingswere noted involving virtually everystep of planning: what data to collect,
how and where to collect it, how to in-
terpret data and identify the exist-
ence, nature and extent of problems,how to involve the community and howto utilize community input, how to de-velop alternative plans and how to
choose among them and how to evalu-ate what actually happened after theplan was implemented. For this rea-son, the State-of-the-Art report in-
cluded an extensive guide to planningfor residential traffic management.
Research on TRRL Road Humps
As noted above, findings in the State-of-
the-Art search led to interest in the po-
tential for applying the TRRL road humpto U.S. streets. The Phase Two research
on this subject included the following ac-
tivities.
Further direct contacts were madewith TRRL researchers and details of
their installation, site selection and mon-itoring procedures not covered in pub-lished reports were conveyed. Most re-
cent reports on TRRL's public street
tests of the device were obtained andreviewed.
Tests of the device on a closed site
were conducted in St. Louis, Missouri.
Case studies involving application of the
device on two public streets in Boston,
Massachusetts and one public street in
Brea, California, were conducted. Fur-ther tests on a closed site and a case
study application on a public street
conducted independently by the City of
Sacramento, California were monitoredby the research team. An additional
case study application in Washington,D.C. was prepared. However, implemen-tation did not take place at a date early
enough for monitoring in this program.Principal findings of the research on
undulations are summarized as follows:
• The humps appear to be extremely ef-
fective in reducing traffic speed to
levels reasonable for local residential
streets. For example, 85th percentile
speeds on the Brea and Boston test
segments were at or just below the 25
mph (46 kmph) speed limit after humpinstallation while beforehand the 85th
percentive speed profile ranged to 38
mph (70 kmph) on the Brea street andto 35 mph (65 kmph) on the two Boston
streets. Speeds of the fastest drivers
are affected as well as those of
"average" drivers. This speed behavior
modification occurs even though driv-
ers who wish to travel fast over the
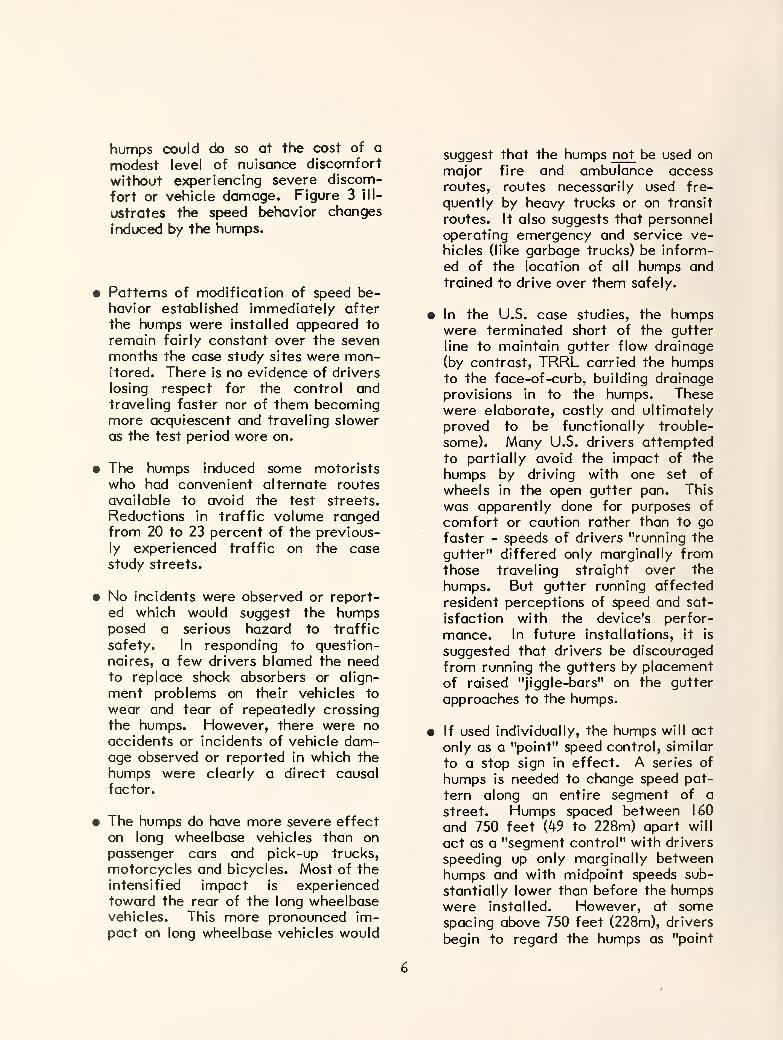
humps could do so at the cost of a
modest level of nuisance discomfort
without experiencing severe discom-
fort or vehicle damage. Figure 3 ill-
ustrates the speed behavior changes
induced by the humps.
• Patterns of modification of speed be-havior established immediately after
the humps were installed appeared to
remain fairly constant over the sevenmonths the case study sites were mon-itored. There is no evidence of drivers
losing respect for the control andtraveling faster nor of them becomingmore acquiescent and traveling sloweras the test period wore on.
• The humps induced some motoristswho had convenient alternate routes
available to avoid the test streets.
Reductions in traffic volume rangedfrom 20 to 23 percent of the previous-
ly experienced traffic on the casestudy streets.
• No incidents were observed or report-
ed which would suggest the humpsposed a serious hazard to traffic
safety. In responding to question-
naires, a few drivers blamed the needto replace shock absorbers or align-
ment problems on their vehicles to
wear and tear of repeatedly crossing
the humps. However, there were noaccidents or incidents of vehicle dam-age observed or reported in which the
humps were clearly a direct causal
factor.
• The humps do have more severe effect
on long wheelbase vehicles than onpassenger cars and pick-up trucks,
motorcycles and bicycles. Most of the
intensified impact is experiencedtoward the rear of the long wheelbasevehicles. This more pronounced im-pact on long wheelbase vehicles would
suggest that the humps not be used onmajor fire and ambulance accessroutes, routes necessarily used fre-
quently by heavy trucks or on transit
routes. It also suggests that personnel
operating emergency and service ve-hicles (like garbage trucks) be inform-
ed of the location of all humps andtrained to drive over them safely.
• In the U.S. case studies, the humpswere terminated short of the gutter
line to maintain gutter flow drainage
(by contrast, TRRL carried the humpsto the face-of-curb, building drainage
provisions in to the humps. Thesewere elaborate, costly and ultimately
proved to be functionally trouble-
some). Many U.S. drivers attemptedto partially avoid the impact of the
humps by driving with one set of
wheels in the open gutter pan. This
was apparently done for purposes of
comfort or caution rather than to gofaster - speeds of drivers "running the
gutter" differed only marginally fromthose traveling straight over the
humps. But gutter running affected
resident perceptions of speed and sat-
isfaction with the device's perfor-
mance. In future installations, it is
suggested that drivers be discouraged
from running the gutters by placementof raised "jiggle-bars" on the gutter
approaches to the humps.
• If used individually, the humps will act
only as a "point" speed control, similar
to a stop sign in effect. A series of
humps is needed to change speed pat-
tern along an entire segment of a
street. Humps spaced between 160
and 750 feet (49 to 228m) apart will
act as a "segment control" with drivers
speeding up only marginally betweenhumps and with midpoint speeds sub-
stantially lower than before the humpswere installed. However, at somespacing above 750 feet (228m), drivers
begin to regard the humps as "point
controls" and acclerate back to their
normal speeds for most of the distance
between humps. Precise threshold
separation distance of this transition
from "segment" to "point" control has
not been determined. However, in the
Sacramento case the humps, separated
by distances of 1200 to 1500 feet (365
to 455m) clearly functioned as point
controls.
• Exact separation distance specifica-
tions (i.e., precisely 400 feet or 500feet (122 or 152m) or whatever) shouldnot be used as a rigid criterion in lo-
cating the humps on a street. Loca-tion to take into account positions of
existing features (i.e., drainage inlets,
manholes and gate valves, driveways,
fire plugs, street lighting and the like)
is more important than spacing on aprecise pattern.
• Humps should be positioned so that
drivers do not approach the first humpin a series at high speed. The first
hump should be placed relatively close
to an intersection where vehicles muststop but far enough away for drivers to
see and react to the humps and related
warning signs and markings. Humpslocated near any curvature of horizon-
tal or vertical alignment should alwaysbe placed so as to allow adequate sight
distance for perception and reaction.
• The steepest slope on which humpswere placed in the U.S. case studies
was 3 percent. TRRL offers no gui-
dance as to the maximum slope onwhich the humps can be safely employ-ed. Further testing seems desirable
before humps are placed on any sub-stantial gradients.
• Adequate signing and marking of eachhump is essential.
• As a rule of thumb for cost estimatingpurposes, an allowance of $500 per
hump (1980 dollars) appears reasonable
for engineering design and construc-
tion. This cost does not include pre-
liminary planning (i.e., communityinvolvement, establishing justification
for the measure).
• No snowplowing difficulties were re-
ported at the Boston study sites whichwere subject to winter snowfall condi-
tions.
• Residents thought the humps weren't
severe enough and that they didn't
completely solve perceived traffic
problems. They were irritated by dri-
vers' gutter-running and a few com-plained about the appearance of the
warning signs. But 79 to 88 percent
felt the humps served a useful purpose,
73 to 88 percent felt they should be
made permanent or at least kept for
more testing and 77 to 92 percent
thought they should be used or tested
on other streets.
• Drivers tended to regard the humps as
too severe (52 percent rated them too
severe versus 44 percent rating them"about right" and 4 percent calling
them too gentle). But 66 percent of
drivers thought the humps on served a
useful purpose, 62 percent thought
they should be made permanent or
kept there for more testing and 75
percent thought they should be used or
tested on other streets as well.
• The humps are not a cure-all for resi-
dential street traffic problems. Theyshould be applied with prudence only
where sound justification warrants
their use.
• Noise emitted by individual vehicles
near the humps tended to increase due
to braking and accleration - not due to
sounds of vehicles striking the humps.But traffic reductions resulting from
hump installation tend to have a can-
celling effect. Some 75 percent of
residents thought noise levels had de-
creased.
• The reasons the TRRL undulations ap-
pear to work as satisfactorily as they
do while conventional speed bumpshave unsatisfactory characteristics are
as follows. In the undulation, the
gradually applied vertical force pro-
duced by the four inch (I Ocm) height
and 12 foot (3.65m) length is trans-
mitted to the driver compartmentthrough the suspension and is just
enough to produce a nuisance level of
discomfort which makes drivers wantto slow down. But the force trans-
mitted is not so severe as to cause loss
of control or suspension damage andthe four inch height is just low enoughto avoid damage due to vehicles bot-
toming out.
The short length of conventional
humps causes vertical forces to betransmitted abruptly. Abruptly trans-
mitted forces tend to be absorbed in
tire and suspension system deforma-tion rather than causing disconfort.
• Drivers and passengers in vehicles of
differing wheelbase and suspension
characteristics inevitably experiencediffering degrees of discomfort in
passing over the humps of any given
speed. The TRRL undulation shape ap-
pears to provide a reasonable range of
performance for the range of vehicle
types which pass over it. In the re-
search team's judgment, it appearsdoubtful that significant improvementsin performance for the range of vehi-
cles in use in the U.S. can be achieved
by modifying the TRRL shape.
Speed and Volume Studies
Residents' tolerance levels of traffic
speed and volume were measured by sub-
jecting panels of residents to vehicles
traveling at varying speeds and to pla-
toons of vehicles simulating varying
volume levels. Residents then rated the
acceptability or unacceptability of the
conditions they witnessed. Principal
conclusions of this pilot research are as
follows:
• The methodology appears to produceresults promising enough to warrantmore extensive application involving
more streets and panels and more rig-
orous selection procedures relative to
panel composition.
• Resident opinion of speed acceptabil-
ity shifts from almost total accep-tance to almost total non-acceptanceover a relatively narrow range of
speeds - from 20 to 30 mph (32 to 48kmph).
• Even if the vast majority of drivers
conformed to a 25 mph (40 kmph)speed limit, nearly half the residents
might not be satisfied.
• Speeds which would be considered ac-
ceptable by nearly all residents are
several miles per hour slower than
most drivers choose to drive on typical
residential streets. Achieving speeds
uniformly acceptable to residents
probably reguires establishment of
Woonerf-like conditions rather than
just enforcing current speed limits.
• Volume levels tested in the pilot study
appeared to be above the crucial range
where resident opinion shifts from ac-
ceptance to non-acceptance. Future
studies should concentrate on rates in
the to 4 vehicles per minute range
(vpm) rather than the 2 to 12 vpmrange used in the pilot study.
Studies of the effects of elements of the
residential street environment on driver
speed choice gave some indication that
the visual "walls" of the street created
by building setbacks, curbside trees and
similar features can exert subtle influ-
ences on driver behavior. However, far
more extensive study is required to pro-
duce statistically significant results.
Legal Considerations In
Residential Traffic Restraint
erences, whichever is most appropriate,
will give engineers a basis for demon-strating conformance to standards and
recommended practices and exercise of
reasonable care in liability cases in-
volving allegations of negligence.
Residential traffic control plans have led
to a number of court challenges as to the
"authority" and "reasonability' of the
acting jurisdiction's programs. In addi-
tion, as a relatively new and not fully
defined aspect of engineering practices,
residential area traffic controls may in-
troduce special nuances to negligence-
liability claims in accident cases.
Relative to the authority and reason-
ability issues, jurisdictions should under-stand from the outset what specific legal
authority it has to control traffic in this
fashion and should tailor its planning pro-
cess and the controls it employs to the
provisions of that legal authority. To de-
monstrate reasonableness of actions, the
jurisdiction should document evidence of
the need for action - harm to residents
resultant from existing traffic condi-
tions. It should also document the vol-
ume, composition and percent of throughtraffic on affected streets and contrast
these with conditions which might be ex-
pected considering the designated func-
tion of the street according to the jur-
isdiction's Master Plan. Furthermore, it
should demonstrate that less severe traf-
fic control measures were attempted or
considered, take into consideration the
circuity of routing for area residents anddemonstrate a scheme of reasonableroutings for through traffic around the
protected area and consider access needsof emergency vehicles and demonstrateinvolvement of the public in the planning
process.
Inclusion of neighborhood traffic con-trol practices and devices in the MUTCDand/or authorative geometric design ref-
CHAPTER 2
RESEARCH ON THE STATE OF THEART IN RESIDENTIAL AREA TRAFFICCONTROL
The initial phase of this research pro-
gram was an extensive review of currentpractices in residential street traffic
control or restraint. The review concen-trated on activities in the United States
but also scanned experiences in othercountries. Findings of this research are
thoroughly documented in a report enti-
tled Improving the Residential StreetEnvironment, State of the Art . In addi-
tion to reviewing control devices in use,
the report evaluates the effectiveness of
these techniques. The report also pro-
vides an extensive guide to the processof planning and design for residential
area traffic control and community in-
volvement in that process. This chapteroutlines research methodology followedin the state of the art search and sum-marizes key portions of the report. Forfull details on the state of the art, thereader is referenced to the subject re-
port which is available through the Na-tional Technical Information Service.
Search Approach
The principal researchers on this pro-
gram had previously performed majorprojects in the field of residential traffic
management. As the direct result, theresearch team were already in commandof the vast bulk of the literature on thesubject. They were also already in con-tact with the key researchers, innovators
and implementors in the field and werealready aware of the major projects im-plemented. The initial data base wasexpanded through an international litera-
ture search and direct contacts with the
key innovators to obtain latest documen-tation or reports of progress in their
work and references to other relevantprojects and individuals of whom these
contacts were aware. In addition, the
attention focused on the research team's
prior work had drawn literally hundreds
of requests for information from profess-
ionals in local jurisdictions across the
U.S. and abroad. Reasoning that there
was a high probability that many of the
individuals who had contacted us for in-
formation had subsequently taken or at-
tempted some form of traffic manage-ment actions, we recontacted them.
From them we elicited not only infor-
mation on their own traffic managementexperiences or attempts; we also obtain-
ed reference to literature and projects in
other communities which had influenced
their actions or of which they were a-
ware. In cases where the research teamwas not already cognizant of the refer-
ences thus obtained, further direct
follow-up was undertaken. Reports, in-
formal documents, raw data and personal
insights obtained from all of these con-
tacts vastly expanded the data base
available through the published litera-
ture.
In addition to this data obtained
through secondary sources, members of
the research team inspected countless
individual neighborhood traffic manage-ment devices in over 60 cities across the
U.S. to photograph the installations and
observe and evaluate performance.
While in Europe, members of the teamalso took the opportunity to observe and
photograph important European develop-
ments as well as to meet directly with
key European officials in the field.
As a result of the nature of this ap-
proach, the State of the Art search is not
a census or statistically rigorous survey
of ongoing traffic management actions in
the United States. However, the sheer
numbers of individuals contacted and the
geographic distribution of jurisdictions
sharing data and experiences lend confi-
dence that the information presented
herein reasonably represents the current
State-of-the-Art. The depth, breadth,
and consistency of data and experiences
reported by widespread and independent
sources support this conclusion. As anindication of the extensiveness of the
search, Table I presents a summary of
North American cities and devices con-
sidered in the search.
In its initial intent, the State-of-the-
Art report was to have focused on the
control devices and their performance.However, as the search progressed the
research team became aware that lack
of knowledge about how to conduct the
process of planning for neighborhood
traffic management effectively was at
least as big if not a bigger problem for
implementation-level professionals in the
local jurisdictions than was the know-ledge about control devices and how they
perform. For this reason, research on
the planning process and community in-
volvement in it was acclerated. An ex-
tensive chapter on the process of plan-
ning neighborhood traffic managementand community involvement in it is in-
cluded in the State-of-the-Art report.
This guide to planning is the authors' re-
sponse to the particular planning needs
of a neighborhood traffic managmentprogram and to the planning pitfalls en-
countered by communities observed in
the state of the art review. It drawsheavily on the most current literature onprocess planning and community in-
volvement as well as technigues that
worked in other communities observed in
the state of the art search and on the
authors' own professional experiences.
NEIGHBORHOOD TRAFFIC MANAGE-MENT - A DEFINITION
The terms "neighborhood traffic man-agement" "residential area traffic con-trol" and "traffic restraint" embrace thewide range of treatments intended to
improve the residential environment bydirectly affecting traffic, thereby cut-
ting off undesired impacts at the
source. The treatments do this by limit-
ing the amount of traffic on the residen-
tial streets, usually by restricting
accessibility and street system continu-
ity or by affecting the behavior of
drivers. The predominant behavioral
control attempted relates to traffic
speed.
Neighborhood traffic management de-
vices are normally employed on local
residential streets- -streets which are
predominantly residential in character
and which have the sole intended traffic
function of providing accessibility to
limited numbers of immediately tribu-
tary properties. The rationale for neigh-
borhood traffic management lies in the
recognition of the breadth and limit-
ations of a local residential streets
function's. Local residential streets are
meant to provide accessibility to limited
areas directly dependent upon them, not
to all travelers who find it convenient to
use them. And serving traffic, even the
local traffic which "belongs" there, Is
only a part, not the whole of their pur-
pose. The neighborhood street is a place
where children play, where neighbors
meet, an extension of the front yard, a
feature which affects the appearance of
homes along it and the guality of life
within them. Neighborhood traffic man-agement is an attempt to control streets
so as to meet real accessibility needs yet
keep the traffic service function of these
streets in perspective with the other
considerations noted above.
Traffic management should not be
confused with two alternatives to it,
protection and amelioration . Residential
protection measures shield residents
from the adverse impacts of traffic
without attempting to affect traffic
itself. Noise buffers, double glazed
windows and view screens are examplesof protection measures located onstreets intended to carrry substantial
volumes of traffic, usually at moderateto fairly high speeds. Amelioration
measures compensate residents for
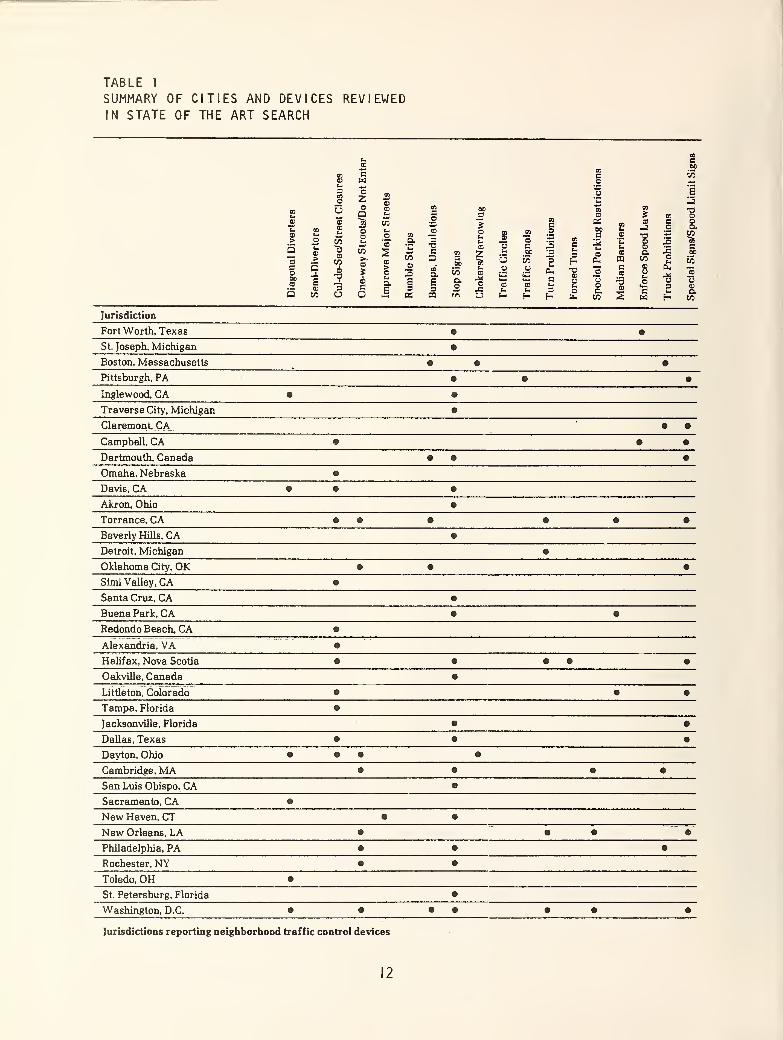
TABLE 1
SUMMARY OF CITIES AND DEVICES REVIEWEDIN STATE OF THE ART SEARCH
03u. c0> 00
CO c a coCD w o
ai
3COo
o2oD
en
CD Ed
BOffl
_e"3
•Dcp
00C
ffl
u
03CD
03
5
E3aCD
aus>5EC
03
£CB
>
CDCD
CO"5
CB
CO
in
"SCDuCO>>CO
4cO
co
o'«
sCD
m&
CO03
Eat
COao
oEri
uCO
2
CO
J2"3Em
3
03"3
s
co
03
Coffl
IE
IEo
to
Cu9H
OS00c.3uCO
a.
03Em
.2
EmCO
m
a-J
aCDCD
aCO
c_o
IEoEn
CD
a,co•sa.2PCO
CoCOCD
5
a'1
CD
CO
4-a
~BCJ
>oE*
O.
E
ffl
Eaas
CO
O.
E3
ffl
E*CD-MO
ffl
CJ
au
"ffl
uE-
a,
cEm
H
-DCDCJEm
o
.3"oCDaCO
eCO
CD
2
CDVuecw
a.
u9Em
H
"5
CD
co
Jurisdiction
Fort Worth, Texas •
St. Joseph, Michigan •
Boston, Massachusetts • • •
Pittsburgh, PA • •
Inglewood, CA •
Traverse City, Michigan •
Claremont, CA_ • •
Campbell, CA • • •
Dartmouth, Canada • < •
Omaha, Nebraska •
Davis, CA • •
Akron, Ohio •
Torrance, CA • • • • • •
Beverly Hills, CA •
Detroit, Michigan •
Oklahoma City, OK • • •
Simi Valley. CA •
Santa Cruz, CA •
Buena Park, CA •
Redondo Beach, CA •
Alexandria, VA •
Halifax, Nova Scotia • • • •
Oakville, Canada •
Littleton, Colorado • • •
Tampa, Florida •
Jacksonville, Florida •
Dallas, Texas • •
Dayton, Ohio • • • •
Cambridge, MA • • •
San Luis Obispo, CA •
Sacramento, CA •
New Haven, CT •
New Orleans, LA • • • •
Philadelphia, PA • •
Rochester, NY •
Toledo, OH •
St. Petersburg, Florida •
Washington, D.C. • • • • • •
Jurisdictions reporting neighborhood traffic control devices
12
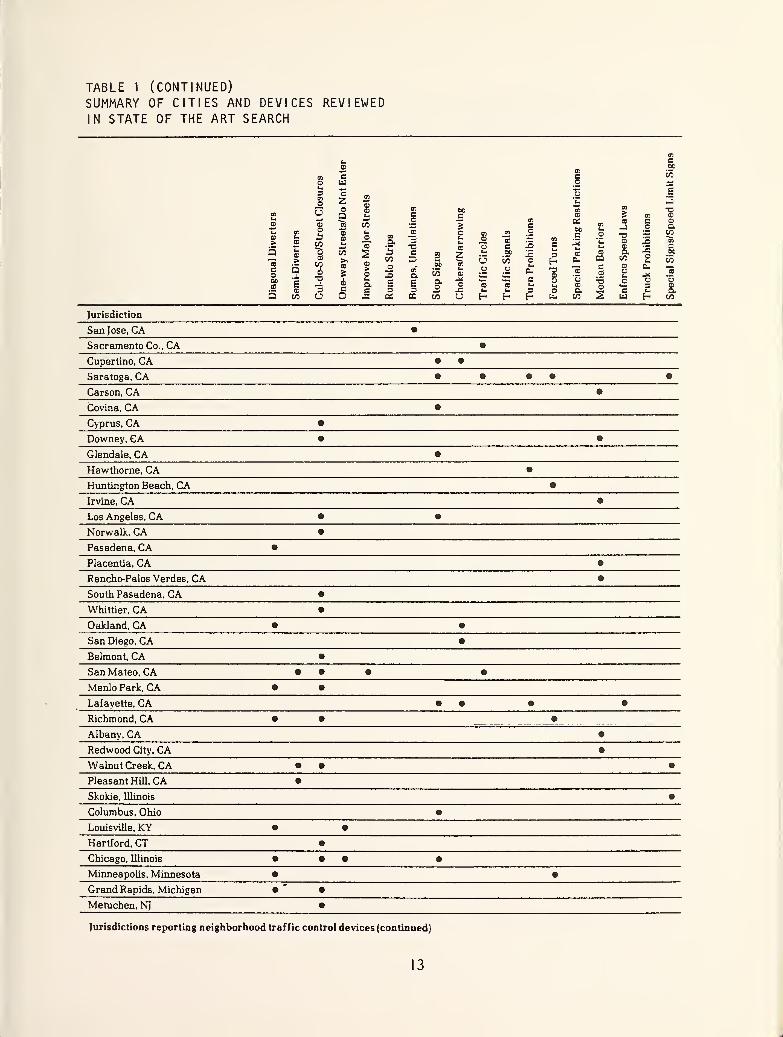
TABLE 1 (CONTINUED)SUMMARY OF CITIES AND DEVICES REVIEWEDIN STATE OF THE ART SEARCH
B B C/3
CD w O *-
3 "o o E
en
eno z
oQ
»CDfa
en
C DCE
fa
enCD
03
5 en
-3
•aCD
o 03 CSocB23
CD
CDfa
53
en C/3 '.2is s en
-3 o afaa>
enfa
aCDCDfa
faO'5"
enaCO
"3
•u
ofa
en
J2
en"3
B 3cn
e.2'fafa
aCDs 3
C/3
"aB
QCO
coOC
CD>5's
5CO
C/3
6o
CD>.CB
4
2CD
>fa
a
5?CD
E
aDenaE
en
C00
c/3
ao
Z"cofa
V_«;
o
fa
G
CO
BC
o
"ffl
—ofa
0.
Bfa
3H"OCDu
B
"3
'5
CD
amBaTJCD
aC/3
CDafa
o
ofa
6.
CJ
3
DC
W3"3
"3
CD
B 3 E 3 3 -c fa fa 3 o o. B fa au C/3 CJ u OS ffi c/3 CJ H H H u. C/3 w H C/3
Jurisdiction
San Jose, CA •
Sacramento Co., CA •
Cupertino, CA • •
Saratoga, CA • • • • •
Carson, CA •
Covina, CA •
Cyprus, CA •
Downey, CA • •
Glendale, CA •
Hawthorne, CA •
Huntington Beach, CA •
Irvine, CA •
Los Angeles, CA • •
Norwalk, CA •
Pasadena, CA •
Placentia, CA •
Rancho-Palos Verdes, CA •
South Pasadena, CA •
Whittier, CA •
Oakland, CA • •
San Diego, CA •
Belmont, CA •
San Mateo, CA • • • •
Menlo Park, CA • •
Lafayette, CA • • • •
Richmond, CA • • ..._.•_.
Albany, CA •
Redwood City, CA •
Walnut Creek, CA • • •
Pleasant Hill, CA •
Skokie, Illinois •
Columbus, Ohio •
Louisville, KY • •
Hartford, CT •
Chicago, Illinois • • • •
Minneapolis, Minnesota • •
Grand Rapids, Michigan •"
•
Metuchen, NT •
Jurisdictions reporting neighborhood traffic control devices (continued)
13
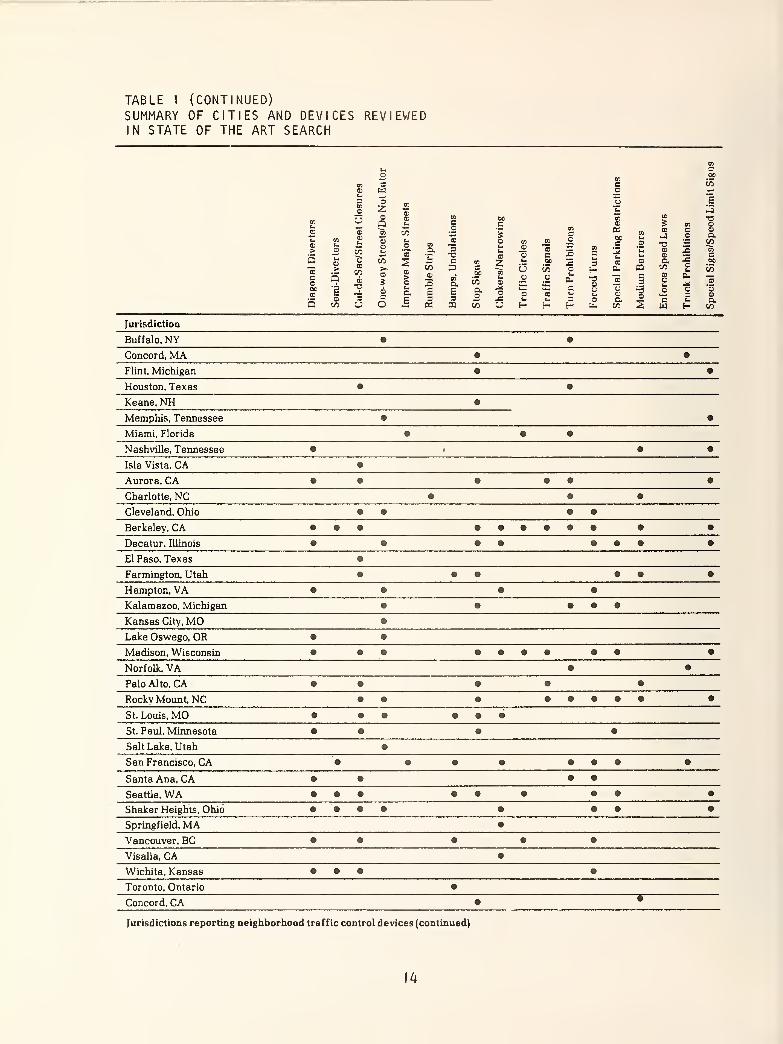
TABLE 1 (CONTINUED)SUMMARY OF CITIES AND DEVICES REVIEWEDIN STATE OF THE ART SEARCH
c© U3Lt
3 O03o 2
CDuCOUU o
DCO
co
DCB
01 0303u
en CO «rt. CO u a o03 o> a? CO E*
GSD,
to
•ab
-J V ua
eft 2 c co
B 2111 CO CD
03
a2E
BO CO
CDC
Q 4T)
>ua.
enaE
COao
CD
Oto 3 E 9 3 J=
-J CO u u a CQ co U
Boc
B COOX)o Eu,
CO
o CO 03
PS o B 03
CO
"3c
B
'£CO
c
00
IS
C*
.£
brt
_3
T30303
15
aCO~C0B
at
CO o3H
oa.
w03
Q.CO
2o
op
CO_o 0- 13
03
"3 E 93O "3
B V u o O o oCO u 03
03
23 03w 3 o a B h. D.H H b CO W H CO
m .2 •-
U
Jurisdiction
Buffalo, NY • •
Concord, MA • •
Flint, Michigan • •
Houston, Texas • •
Keane, NH •
Memphis, Tennessee • •
Miami, Florida • • •
Nashville, Tennessee • . • •
Isla Vista, CA •
Aurora, CA • • • • •
Charlotte, NC • • •
Cleveland, Ohio • • •
Berkeley, CA • • • •
Decatur, Illinois • • • • • • •
El Paso, Texas •
Farmington, Utah • • • • •
Hampton, VA • • • •
Kalamazoo, Michigan • • • • •
Kansas City, MO •
Lake Oswego, OR • •
Madison, Wisconsin • • • • • • • • • •
Norfolk. VA • •
Palo Alto, CA • • • • •
Rocky Mount, NC • • • •
St. Louis, MO • • • • • •
St. Paul, Minnesota • • • •
Salt Lake, Utah •
San Francisco, CA • • • • • • • •
Santa Ana, CA • • • •
Seattle, WA •
•
•
•
•
•
• • • • • •
Shaker Heights, Ohio • • • • •
Springfield, MA •
Vancouver, BC • • • • •
Visalia, CA •
Wichita, Kansas • • • •
Toronto, Ontario •
Concord, CA • •
Jurisdictions reporting neighborhood traffic control devices (continued)
14
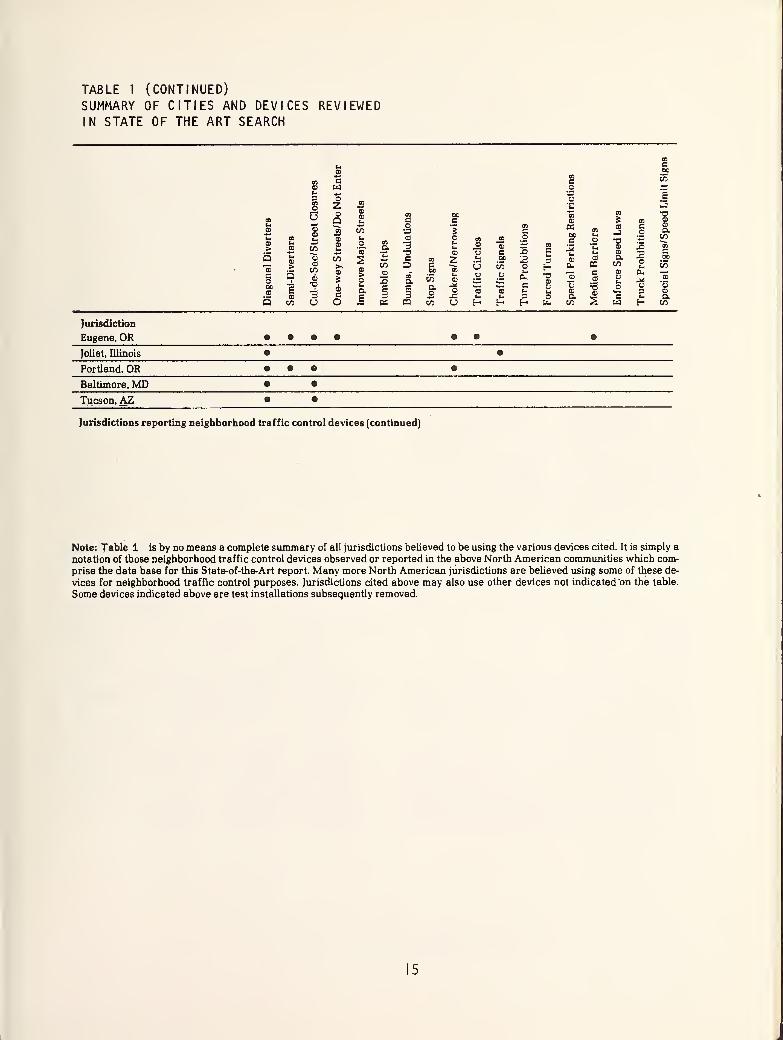
TABLE 1 (CONTINUED)
SUMMARY OF CITIES AND DEVICES REVIEWEDIN STATE OF THE ART SEARCH
ewoZ
B
u
u- « 5
_> o co S
to4e
6cO
en
o CO
•a-a
|»
a I
eo
3
e3
m
is
o(aUCO
g 2CJ
CO
aco cj
CO
J3
o3E--o
cj
00
|
CDUCD
CD co•J
CDaCO
a> x>
oIX
a03
CD
aCO
2ou
cc*
COc CD c
CB EC CD -* oCD
cc
O u CD0) 3 CDa c u Q.CO w t- CO
Jurisdiction
Eugene, OR « • • • • • •
Joliet, Illinois < •
Portland, OR <> • • •
Baltimore, MD (- •
Tucson.AZ •» •
Jurisdictions reporting neighborhood traffic control devices (continued)
Note: Table 1 is by no means a complete summary of all jurisdictions believed to be using the various devices cited. It is simply a
notation of those neighborhood traffic control devices observed or reported in the above North American communities which com-
prise the data base for this State-of-the-Art report. Many more North American jurisdictions are believed using some of these de-
vices for neighborhood traffic control purposes. Jurisdictions cited above may also use other devices not indicated on the table.
Some devices indicated above are test installations subsequently removed.
15
tolerating the undesirable impacts of
street traffic by providing other amen-ities or services. The compensation mayattempt to overcome adverse traffic im-pacts directly (i.e., providing parks along
a street on which it is unsafe for children
to play because of traffic). Or it maysimply offset the adverse impacts of
traffic by offering some totally unre-lated but desirable facility or service.
PRIMARY DEVICES FOR NEIGHBORHOOD TRAFFIC MANAGEMENT
Three generic types of control devices
for neighborhood traffic managementhave been identified: positive physical
controls, passive controls and psyco-
perception controls . Performance char-acteristics and primary attributes of
devices in these generic categories are
capsuled in Table 2 and further summar-ized in the paragraphs which follow. TheState of the Art report provides far moredetailed description and specific datathan can be included herein. The reader
is referenced to that document for morecomplete information.
Physical Controls
Positive physical controls have as a
common characteristic the positive en-
forcement or prohibition of a specific
action through the direct physical pre-
sence and character of the device it-
self. Physical controls have the advant-ages of being largely self-enforcing andof creating a visual impression, real or
imagined, that a street is not intended
for through traffic. Their disadvantages
relative to other devices are their cost,
their negative impact on emergency andservice vehicles, and their imposition of
inconvenient access on some parts of aneighborhood. Examples of physical con-trols include speed bumps, rumble strips,
median barriers, cul-de-sacs, semidiver-
ters, diagonal diverters, traffic circles,
chokers and other less commonly useddevices. The following paragraphs brief-
ly illustrate these devices.
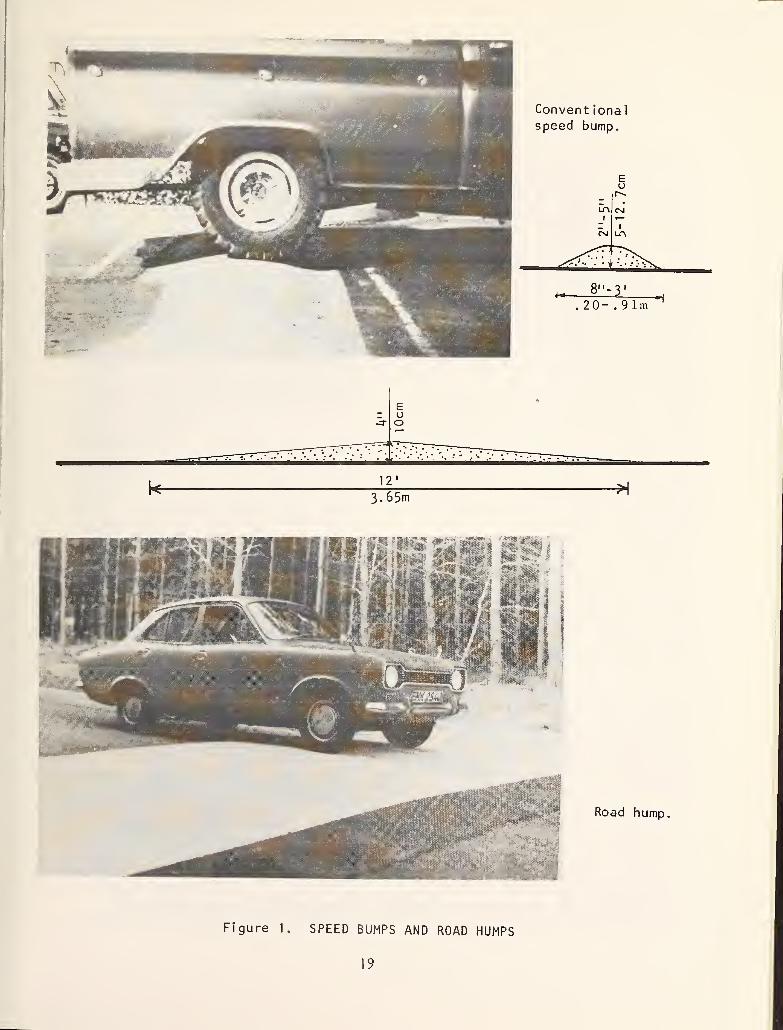
Speed bumps (Figure I) are raised
bumps in the pavement surface extending
across the traveled way. Their primaryobjective is to reduce traffic speed. Butif they force traffic to go slowly enoughor make drivers uncomfortable, they maycause volume reductions by diverting
traffic to alternate routes. Conventional
bumps normally have a height of less
than 5 inches (.1 meter), a length (in the
direction of vehicular travel) normallyless than 3 feet (I meter), and a variety
of shapes including circular, parabolic
and triangular. Conventional speed
bumps have generally been rejected in
the U.S. for neighborhood traffic control
applications because of potential failure
to control speed and vehicle damage andsafety hazards. (I) In general, the faster
automobiles travel, the less discomfort is
felt by drivers at the bumps. Vehicular
damage possibilities include oil panscracked in "bottoming out", damages to
alignment and suspension, bent wheelrims on bicycles and loss of inadequately
secured gear on emergency and service
vehicles. Safety hazards include loss of
control (particularly for bicyclists andmotorcyclists) and falls by personnel
riding the exterior footboards on fire
apparatus and refuse vehicles.
I. Walsh, Lawrence B., A Study of Speed Bumps, 1975
16
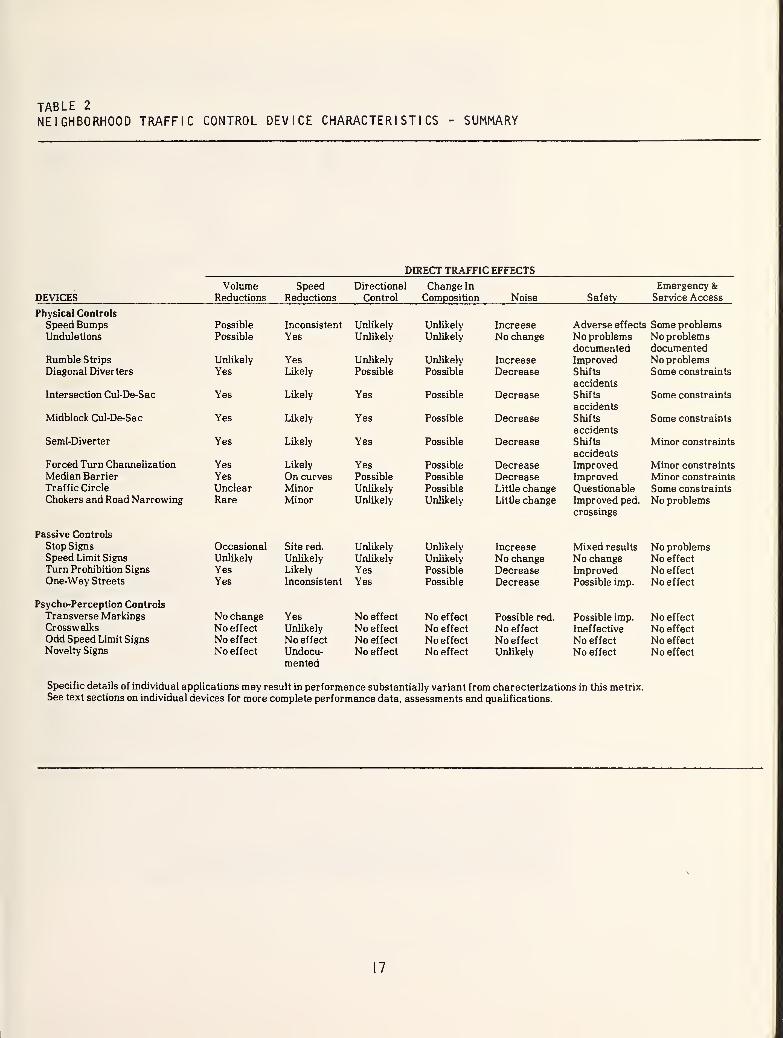
TABLE 2
NEIGHBORHOOD TRAFFIC CONTROL DEVICE CHARACTERISTICS - SUMMARY
DIRECT TRAFFIC EFFECTS
Volume Speed Directional Change In Emergency &DEVICES Reductions Reductions Control Composition Noise Safety Service Access
Physical Controls
Speed Bumps Possible Inconsistent Unlikely Unlikely Increase Adverse effects Some problemsUndulations Possible Yes Unlikely Unlikely No change No problems
documentedNo problemsdocumented
Rumble Strips Unlikely Yes Unlikely Unlikely Increase Improved No problemsDiagonal Diverters Yes Likely Possible Possible Decrease Shifts
accidents
Some constraints
Intersection Cul-De-Sac Yes Likely Yes Possible Decrease Shifts
accidents
Some constraints
Midblock Cul-De-Sac Yes Likely Yes Possible Decrease Shifts
accidents
Some constraints
Semi-Diverter Yes Likely Yes Possible Decrease Shifts
accidents
Minor constraints
Forced Turn Channelization Yes Likely Yes Possible Decrease Improved Minor constraints
Median Barrier Yes On curves Possible Possible Decrease Improved Minor constraints
Traffic Circle Unclear Minor Unlikely Possible Little change Questionable Some constraints
Chokers and Road Narrowing Rare Minor Unlikely Unlikely Little change Improved ped.
crossings
No problems
Passive Controls
Stop Signs Occasional Site red. Unlikely Unlikely Increase Mixed results No problemsSpeed Limit Signs Unlikely Unlikely Unlikely Unlikely No change No change No effect
Turn Prohibition Signs Yes Likely Yes Possible Decrease Improved No effect
One-Way Streets Yes Inconsistent Yes Possible Decrease Possible imp. No effect
Psycho-Perception Controls
Transverse Markings No change Yes No effect No effect Possible red. Possible imp. No effect
Crosswalks No effect Unlikely No effect No effect No effect Ineffective No effect
Odd Speed Limit Signs No effect No effect No effect No effect No effect No effect No effect
Novelty Signs No effect Undocu-mented
No effect No effect Unlikely No effect No effect
Specific details of individual applications may result in performance substantially variant from characterizations in this matrix.See text sections on individual devices for more complete performance data, assessments and qualifications.
17
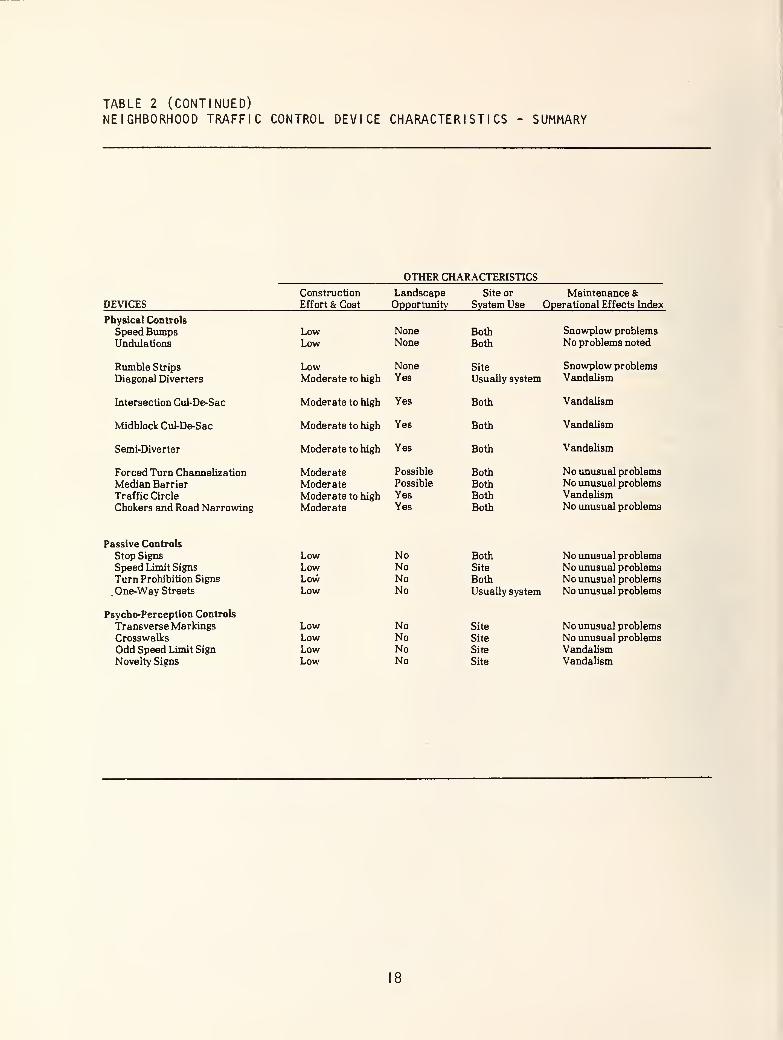
TABLE 2 (CONTINUED)NEIGHBORHOOD TRAFFIC CONTROL DEVICE CHARACTERISTICS - SUMMARY
OTHER CHARACTERISTICS
DEVICESConstruction
Effort & Cost
LandscapeOpportunity
Site or
System UseMaintenance &
Dperational Effects Index
Physical Controls
Speed BumpsUndulations
LowLow
NoneNone
BothBoth
Snowplow problemsNo problems noted
Rumble Strips
Diagonal Diverters
LowModerate to high
NoneYes
Site
Usually system
Snowplow problemsVandalism
Intersection Cul-De-Sac Moderate to high Yes Both Vandalism
Midblock Cul-De-Sac Moderate to high Yes Both Vandalism
Semi-Diverter Moderate to high Yes Both Vandalism
Forced Turn Channelization
Median Barrier
Traffic Circle
Chokers and Road Narrowing
ModerateModerateModerate to high
Moderate
Possible
Possible
YesYes
Both
Both
Both
Both
No unusual problemsNo unusual problemsVandalismNo unusual problems
Passive Controls
Stop Signs
Speed Limit Signs
Turn Prohibition Signs
. One-Way Streets
LowLowLowLow
NoNoNoNo
BothSite
Both
Usually system
No unusual problemsNo unusual problemsNo unusual problems
No unusual problems
Psycho-Perception Controls
Transverse Markings
Crosswalks
Odd Speed Limit Sign
Novelty Signs
LowLowLowLow
NoNoNoNo
Site
Site
Site
Site
No unusual problemsNo unusual problemsVandalismVandalism
Convent ional
speed bump.
Er--
•
LA CN1 '—
CNI LA
-^<"T"! T^s^^<C\- .
1•Vs^
8"-3
. 20- .91i
12
3.65m
Road hump.
Figure 1. SPEED BUMPS AND ROAD HUMPS
19
In the U.K. the Transportation andRoad Reseach Laboratory (TRRL) has
developed and road-tested a quite diffe-
rent type of Road Hump.(2-6) Muchlonger (in the direction of vehicular
travel) than the convential speed bump,the TRRL humps (also shown on Figure I)
have a length of 12 feet (3.6 m), a height
of k inches (10 cm) and a circular arc
cross-section. Experience in the U.K.indicates this shape, identified as anundulation in the literature performsconsiderably better than the conven-tional speed bump. Driver discomfortreportedly increases with increasing
speed and vehicle damage and personal
injury potential appears to be minimal.High hopes have been held for satisfac-
tory application of this device on resi-
dential streets in the U.S., because it
appeared to provide the needed restraint
on drivers without the undesired secon-
dary impacts of some of the other physi-
cal controls discussed below. Such anapplication comprised a major elementof the second phase of research in this
program. This research is documented in
Chapter 3 of this report.
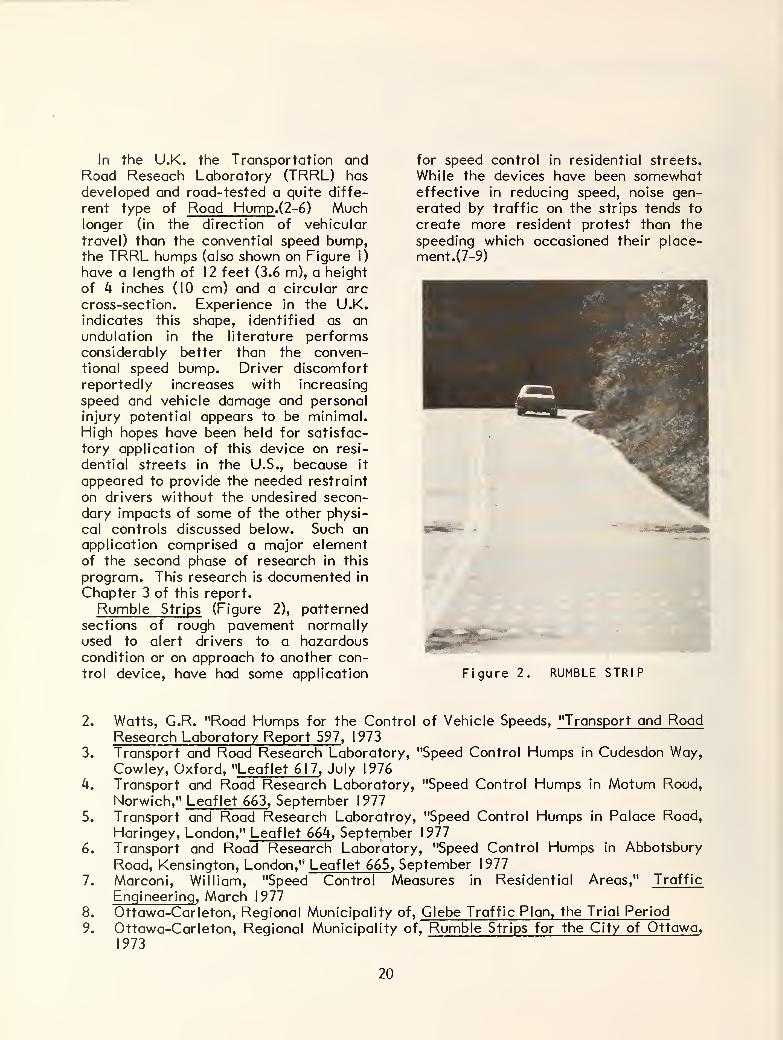
Rumble Strips (Figure 2), patterned
sections of rough pavement normallyused to alert drivers to a hazardouscondition or on approach to another con-
trol device, have had some application
for speed control in residential streets.
While the devices have been somewhateffective in reducing speed, noise gen-erated by traffic on the strips tends to
create more resident protest than the
speeding which occasioned their place-
ment.^)
|pa«te-
Figure 2. RUMBLE STRIP
2. Watts, G.R. "Road Humps for the Control of Vehicle Speeds, "Transport and RoadResearch Laboratory Report 597 , 1973
3. Transport and Road Research Laboratory, "Speed Control Humps in Cudesdon Way,Cowley, Oxford, "Leaflet 617, July 1976
4. Transport and Road Research Laboratory, "Speed Control Humps in Motum Road,
Norwich," Leaflet 663, September 1977
5. Transport and Road Research Laboratroy, "Speed Control Humps in Palace Road,
Haringey, London," Leaflet 66h, September 1977
6. Transport and Road Research Laboratory, "Speed Control Humps in Abbotsbury
Road, Kensington, London," Leaflet 665, September 1977
7. Marconi, William, "Speed Control Measures in Residential Areas," Traffic
Engineering, March 1977
8. Ottawa-Carleton, Regional Municipality of, Glebe Traffic Plan, the Trial Period
9. Ottawa-Carleton, Regional Municipality of, Rumble Strips for the City of Ottawa,1973
20
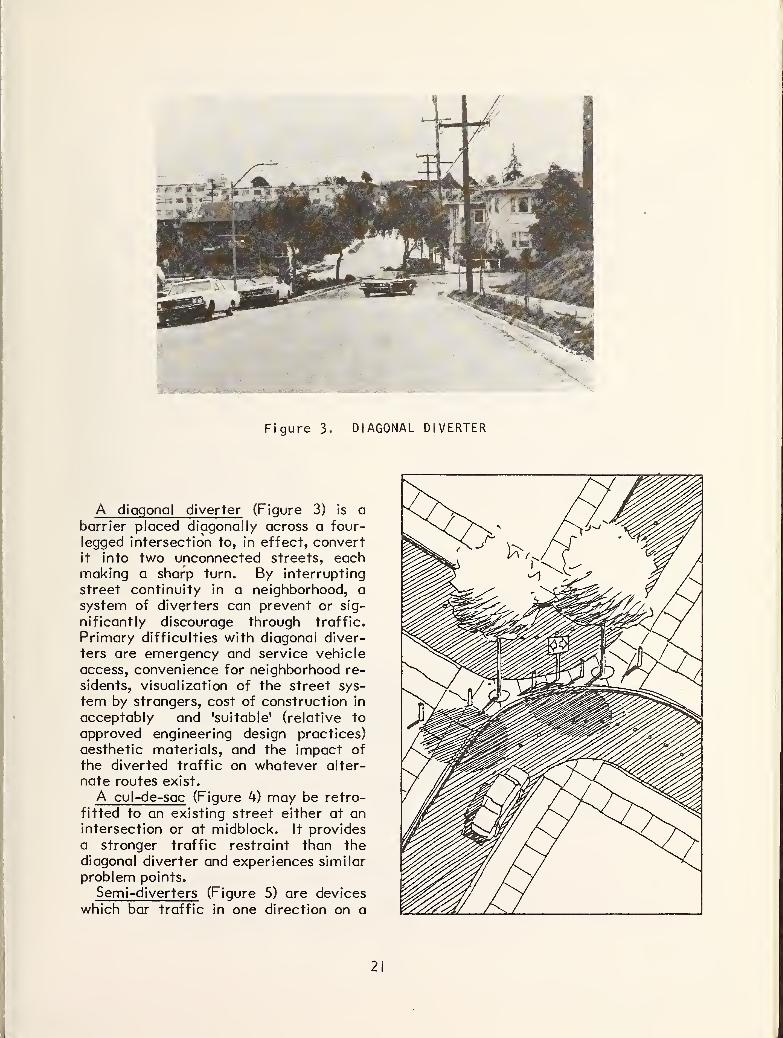
Figure 3- DIAGONAL DIVERTER
A diagonal diverter (Figure 3) is a
barrier placed diagonally across a four-
legged intersection to, in effect, convertit into two unconnected streets, eachmaking a sharp turn. By interrupting
street continuity in a neighborhood, a
system of diverters can prevent or sig-
nificantly discourage through traffic.
Primary difficulties with diagonal diver-
ters are emergency and service vehicle
access, convenience for neighborhood re-
sidents, visualization of the street sys-
tem by strangers, cost of construction in
acceptably and 'suitable* (relative to
approved engineering design practices)
aesthetic materials, and the impact of
the diverted traffic on whatever alter-
nate routes exist.
A cul-de-sac (Figure 4) may be retro-
fitted to an existing street either at anintersection or at midblock. It providesa stronger traffic restraint than the
diagonal diverter and experiences similar
problem points.
Semi-diverters (Figure 5) are deviceswhich bar traffic in one direction on a
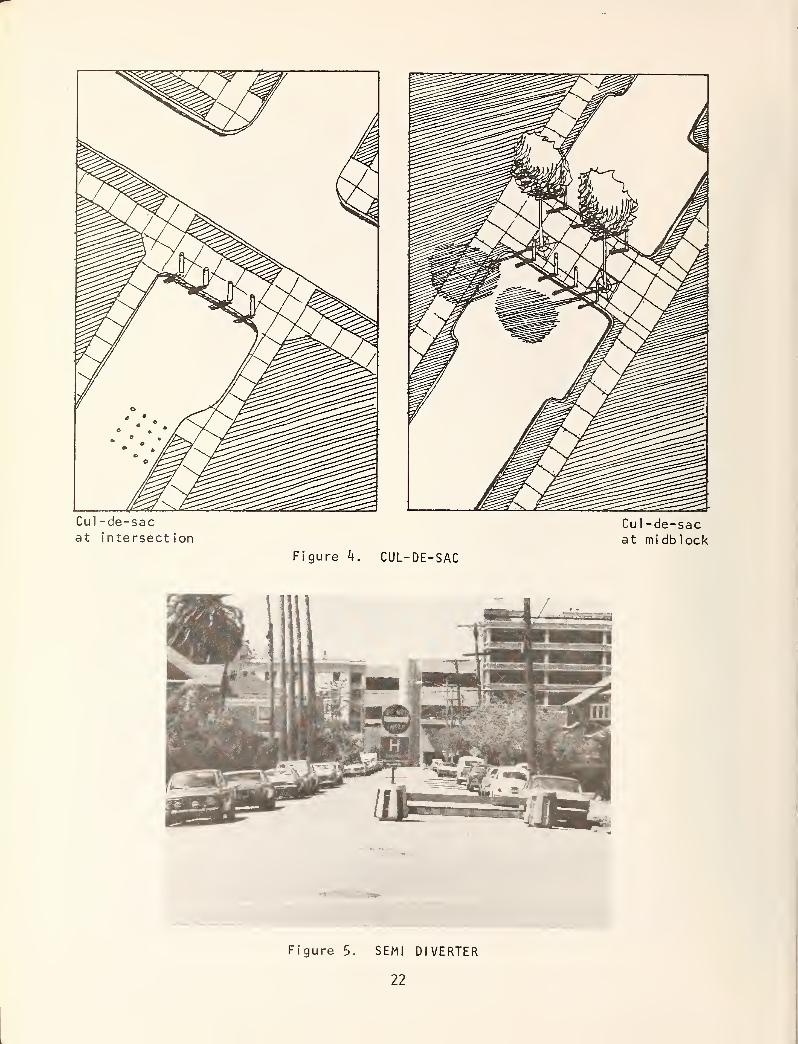
Cul -de-sacat intersection
Figure 4. CUL-DE-SAC
Cul -de-sacat midblock
Figure 5. SEMI DIVERTER
22
street while permitting travel in the
other direction. Because semidiverters
block only half the street, they are easily
violated by motorists who are so in-
clined. But this same property makesthem a minimal impediment to emergen-cy vehicles.
Forced turn channelization is com-prised of traffic islands designed to
prevent traffic from executing specific
movements or to force it to executeothers. This is simply an adaptation of
techniques commonly used to improvetraffic flows along arterial streets
except that the movements prevented or
forced are specifically selected to dis-
courage through traffic on local streets.
Median barriers , standard traffic en-
gineering devices normally used to sep-
arate and improve flows on arterial
streets, can be employed to prevent left
turn entries to local neighborhood streets
from the arterials and to prevent throughtraffic flows on local streets from oneneighborhood to another across anarterial.
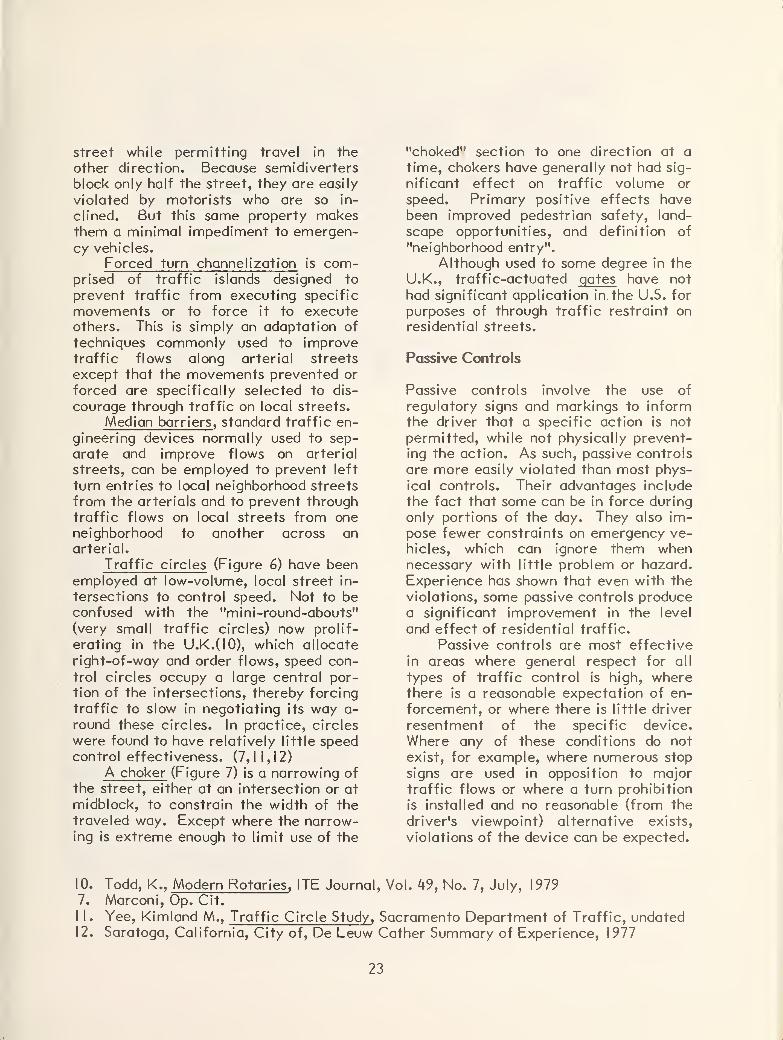
Traffic circles (Figure 6) have beenemployed at low-volume, local street in-
tersections to control speed. Not to beconfused with the "mini-round-abouts"
(very small traffic circles) now prolif-
erating in the U.K. (10), which allocate
right-of-way and order flows, speed con-
trol circles occupy a large central por-
tion of the intersections, thereby forcing
traffic to slow in negotiating its way a-
round these circles. In practice, circles
were found to have relatively little speedcontrol effectiveness. (7,11,12)
A choker (Figure 7) is a narrowing of
the street, either at an intersection or at
midblock, to constrain the width of the
traveled way. Except where the narrow-ing is extreme enough to limit use of the
"choked" section to one direction at a
time, chokers have generally not had sig-
nificant effect on traffic volume or
speed. Primary positive effects havebeen improved pedestrian safety, land-
scape opportunities, and definition of
"neighborhood entry".
Although used to some degree in the
U.K., traffic-actuated gates have not
had significant application in the U.S. for
purposes of through traffic restraint onresidential streets.
Passive Controls
Passive controls involve the use of
regulatory signs and markings to informthe driver that a specific action is not
permitted, while not physically prevent-ing the action. As such, passive controls
are more easily violated than most phys-
ical controls. Their advantages include
the fact that some can be in force during
only portions of the day. They also im-
pose fewer constraints on emergency ve-hicles, which can ignore them whennecessary with little problem or hazard.
Experience has shown that even with the
violations, some passive controls producea significant improvement in the level
and effect of residential traffic.
Passive controls are most effective
in areas where general respect for all
types of traffic control is high, wherethere is a reasonable expectation of en-
forcement, or where there is little driver
resentment of the specific device.
Where any of these conditions do not
exist, for example, where numerous stop
signs are used in opposition to majortraffic flows or where a turn prohibition
is installed and no reasonable (from the
driver's viewpoint) alternative exists,
violations of the device can be expected.
10. Todd, K., Modern Rotaries, ITE Journal, Vol. 49, No. 7, July, 19797. Marconi, Op. Cit.
I I. Yee, Kimland M., Traffic Circle Study, Sacramento Department of Traffic, undated12. Saratoga, California, City of, De Leuw Cather Summary of Experience, 1977
23
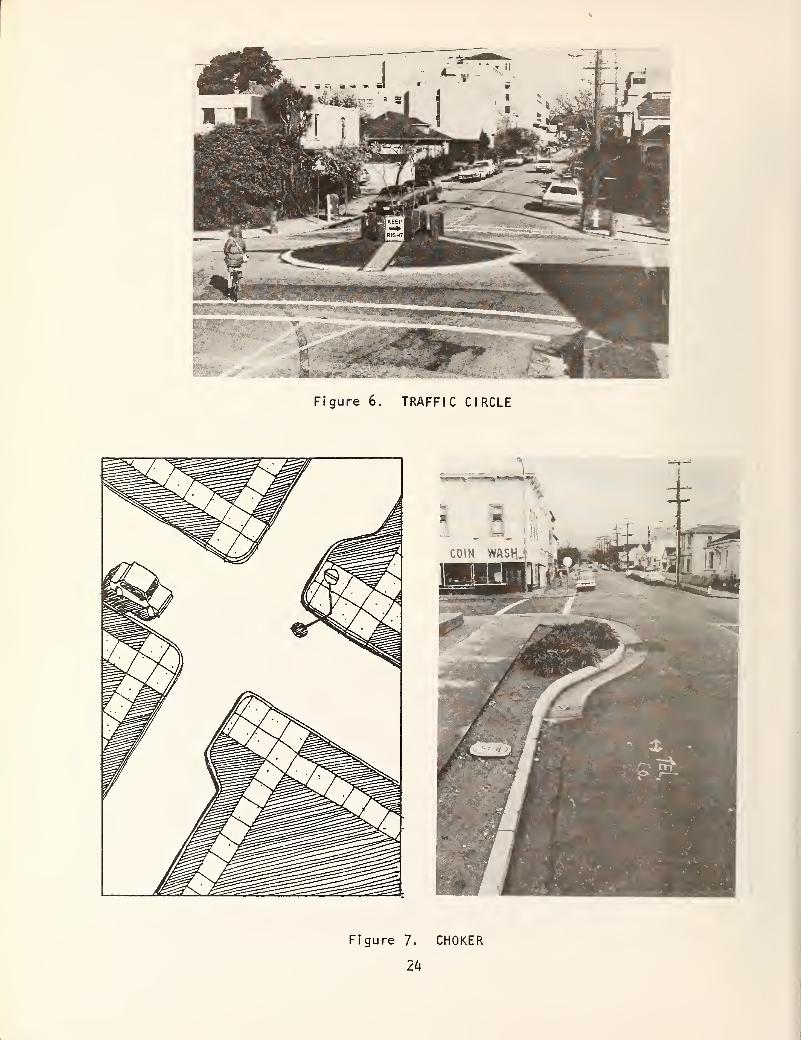
Figure 6. TRAFFIC CIRCLE
COIN WASH-
iiwin?
Figure 7. CHOKER
24
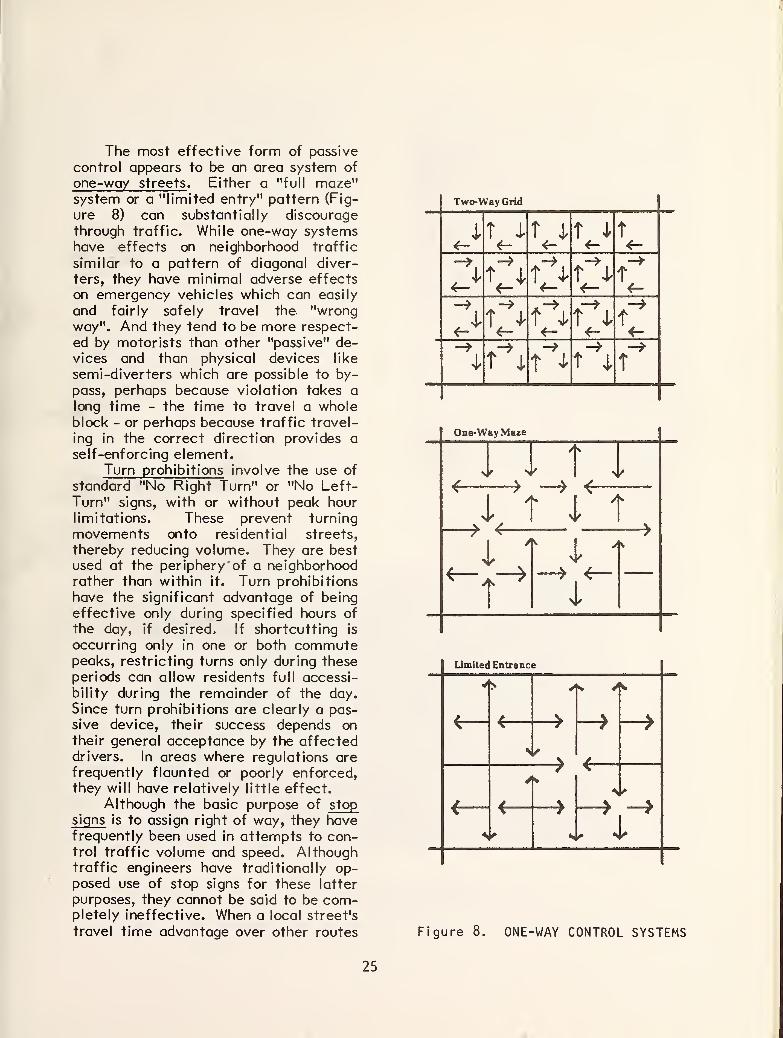
The most effective form of passive
control appears to be an area system of
one-way streets . Either a "full maze"system or a "limited entry" pattern (Fig-
ure 8) can substantially discourage
through traffic. While one-way systemshave effects on neighborhood traffic
similar to a pattern of diagonal diver-
ters, they have minimal adverse effects
on emergency vehicles which can easily
and fairly safely travel the "wrongway". And they tend to be more respect-
ed by motorists than other "passive" de-vices and than physical devices like
semi-diverters which are possible to by-
pass, perhaps because violation takes along time - the time to travel a wholeblock - or perhaps because traffic travel-
ing in the correct direction provides aself-enforcing element.
Turn prohibitions involve the use of
standard "No Right Turn" or "No Left-
Turn" signs, with or without peak hour
limitations. These prevent turning
movements onto residential streets,
thereby reducing volume. They are best
used at the periphery' of a neighborhoodrather than within it. Turn prohibitions
have the significant advantage of being
effective only during specified hours of
the day, if desired. If shortcutting is
occurring only in one or both commutepeaks, restricting turns only during these
periods can allow residents full accessi-
bility during the remainder of the day.
Since turn prohibitions are clearly a pas-sive device, their success depends ontheir general acceptance by the affecteddrivers. In areas where regulations are
frequently flaunted or poorly enforced,they will have relatively little effect.
Although the basic purpose of stop
signs is to assign right of way, they havefrequently been used in attempts to con-trol traffic volume and speed. Althoughtraffic engineers have traditionally op-posed use of stop signs for these latter
purposes, they cannot be said to be com-pletely ineffective. When a local street's
travel time advantage over other routes
Two-Way Grid
<-
I
I
T I
o->
4-T. J-
f*|
T 4,
tr*
f 4<
t j-
4-
ot J,f-
t J,
f
t
T
One-Way Maze
4 >
I t
rr<-
t
I
Limited Entrance
-> <r
> —>i
Figure 8. ONE-WAY CONTROL SYSTEMS
25
is marginal, stop signs may be enough to
shift the balance and divert traffic. Ex-tensive traffic engineering studies (see
State of the Art Report for References)
show stop signs have little impact on
overall traffic speed except within about200 feet (61m) of the signs. But if they
reduce the speed of, or divert the fewvery fast drivers who tend to be the mostdisturbing to residents, residents mayperceive them to have had a significant
speed reduction impact. Furthermore,evidence on safety effects on STOP signs
placed for volume or speed control pur-
poses does not uniformly support the tra-
ditional traffic engineering belief that
STOPs not warranted by intersection
conflicts will increase accidents. TheState of The Art Report cites studies in
Philadelphia, Pa., St. Paul, Minn, andConcord, Calif., which show reduced ac-
cident experience following installation
of "unwarranted" STOPS.Speed limit signs have generally
been found to have little effect on traf-
fic speed or residential streets, unless
constantly enforced.
Numerous other types of passive
controls exist. The foregoing highlights
some of the most prevalent.
Psycho-Perception Controls
Control devices described above can beclassified as trying specifically to pre-
vent, through physical and legal means,an undesired action by a driver. Anotherapproach to the problem is to try to play
upon ingrained driver responses to cer-
tain stimuli to induce or even trick theminto a desired behavior pattern or to use
materials and messages which heighten
driver response. In concept, it might bepossible to design devices which discrim-
inate in their impacts, affecting drivers
traveling "too fast" while not affecting
drivers traveling at reasonable speeds.
Psycho-perception controls wouldappear to avoid the primary drawbacks
of physical controls (too heavy-handed
Figure 9. W00NERF,
26
and too much interference with emer-gency services) and passive controls (too
easy to violate). However, few effective
examples have been demonstrated.Transverse lines with increasingly close
spacing to give the driver the illusion of
increasing speed, odd speed limit signs
and unique message signs to attract at-
tention by their novelty, and speed-
actuated flashing warning or speed limit
signs are examples of psycho-perceptioncontrols which have been tried, thoughnone have enjoyed outstanding success in
local residential street applications.
Further development in this area of con-
trol is needed.
Woonerf
While the much publicized Woonerftreatment (Figure 9) developed in the
Netherlands might be considered by someto be a physical control, we prefer to
consider it as a unique category on its
own.(l3, 14) First, it is not comprised of
a single control device, or discrete pat-
tern of devices. It is a composite treat-
ment of a street or group of streets. Thechanges in travelled way alignment, nar-
rowings, constrasts in paving materials,
use of planters, walls, benches, bollards,
mounds, parking areas and landscapehave no single set pattern; they are not
designed for individual impacts on traffic
but rather for the impact when the
street is perceived as a whole by the
driver. Second, the Woonerf is notsimply a physical control though physical
changes to the roadway are massive.Equally important is the concept of the
street as an integrated area - a sharedspace for multiple uses - as constrastedto the traditional segregation of driving,
parking and pedestrian activities on the
ordinary street. This difference in func-
tion of the street space is explicitly
recognized in unique rules of the roadapplicable to driving in the Woonerf.These rules essentially require drivers to
operate at a walking pace and give wayto pedestrians (while not allowing pe-
destrians to unnecessarily obstruct
drivers).
SYSTEMIC PLANNING FORNEIGHBORHOOD TRAFFIC CONTROL
While Woonerf treatments may not havebroad scale applicability to residential
streets typical in the U.S. and manyother areas, their holistic approachserves as a useful introduction to a dis-
cussion of neighborhood traffic control
as an area strategy rather than as an in-
dividual site and device application.
A common cause of failure of neigh-
borhood traffic restraint schemes in the
U.S. is attributable to a lack of systemicstrategic planning - concentrating on in-
dividual sites and devices rather than
controlling all traffic in a systemic way.Most neighborhood traffic problems
are area problems rather than conditions
peculiar to a single limited site. Many of
the devices used to treat neighborhood
problems have impacts which extend well
beyond the immediate site of their de-
ployment. Some devices must be deploy-
ed in a series of installations to be
effective neighborhood traffic manage-ment tools. And even if they are not
dependent on the presence of other de-vices for inherent effectiveness, combin-ations of devices can have synergistic
effects. For these reasons, the pattern
or systemic way in which devices are de-
ployed can be a significant determinantas to how effective the devices are in
managing neighborhood traffic, in howdrivers react to them, and the extent to
13. Royal Dutch Touring Club des Pays-Bas ANWB, Woonerf, 197714. DeJaeger, D.M., "Woonerven (Residential Yards)," ITE Compendium of Technical
Papers, 47th Annual Meeting, Mexico City, 1977
27
which the devices pose inherent incon-
veniences to residents of the protectedneighborhoods themselves. The various
strategies pose trade-offs between the
degree of protection from through traf-
fic and compromises to resident access,
internal neighborhood circulation andemergency and service access. Thesetrade-offs and the specific nature of the
individual neighborhood's problems are
primary considerations in choosing a con-
trol system strategy for neighborhoodtraffic control.
Over and above the complex and in-
teractive nature of problems, the fund-
amental concept of the residential neigh-
borhood as a discrete area and entity to
be treated in a holistic way underlies the
organized approach to traffic manage-ment. The "neighborhood unit" in
American planning, Buchanan's "envir-
onmental areas", "woonerven" in the
Netherlands, and "traffic cells" used in
Japan and other countries all define dis-
crete residential districts where traffic
behavior is to be controlled on internal
streets and through traffic confined to
peripheral streets. The following para-
graphs expand on the concept of area-
wide strategies for neighborhood traffic
control.
Peripheral barrier treatments pre-
vent traffic from entering the neighbor-
hood by means of controls placed at local
street intersections with bounding arte-
rials and collectors. This form of boun-dary control can be achieved using phys-
ical devices such as cul-de-sacs, semi-diverters and median barriers, or passive
devices such as turn prohibition signs andone-way streets. A primary advantageof the peripheral barrier system is that
the potential intrusive traffic encounters
the protective barriers while it is still onthe bounding streets and still has a clear
option to use these routes to its destin-
ation with little out-of-direction travel
or delay. By contrast, with internal sys-
tems, drivers are first led into the
neighborhood before being blocked andperhaps disoriented, trapped, certainly
frustrated and possibly enraged. Anotheradvantage of peripheral systems is that
motorists are less likely to violate themalong the busier streets where the per-
ceived likelihood of enforcement is
greater. Peripheral barrier treatmentswork best when the problematic through
traffic is on a single axis of the street
grid as shown in Figure 10. The treat-
ment shown allows streets at right angles
to the problem flow to be left open so
that local trips can enter from the sides;
entries are blocked in problem direct-
ions.
If through traffic incursions are pro-
blems on two axes of the street grid, the
peripheral barrier scheme does not workguite so well because gaps must be left
in the protective cordon to provide op-
portunities to allow neighborhood resi-
dents to return home. If this is done, the
streets left open will suffer from a con-
centration of through and local traffic.
One solution to the two axis problem is
to supplement peripheral devices with in-
ternal devices to prevent the "open"
streets from becoming through routes as
shown on Figure I I. Even if this is done,
the peripheral barrier scheme tends to be
less effective in responding to biaxial
through traffic problems than in the sin-
gle axis situation.
Another advantage of the peripheral
barrier scheme is that inconvenience to
residents, while they themselves are
driving, is relatively limited. Traffic
flows internal to the neighborhood are
unobstructed, residents have freedom of
egress in any direction and reasonably
convenient access in returning to the
neighborhood.Internal systems are preferred over
peripheral ones in cases where problemtraffic is biaxial, where boundary street
oriented, office-commerical uses extend
partially into the neighborhood along lo-
cal streets, where traffic conditions pre-
clude a peripheral scheme, or where a
28
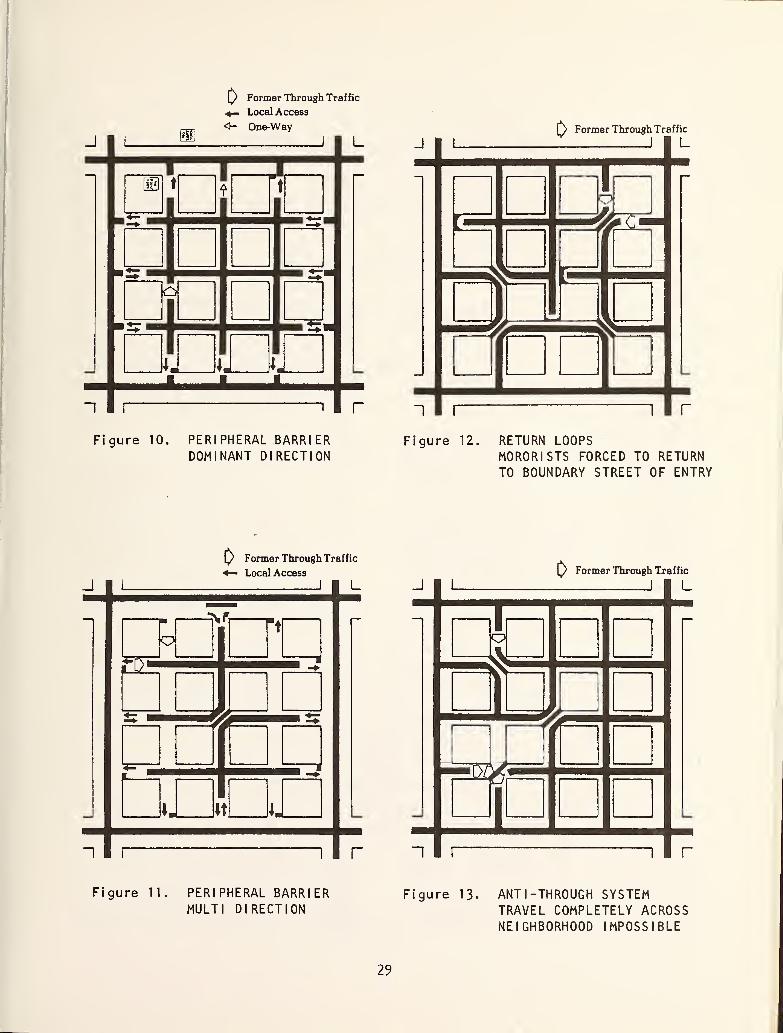
[J Former Through Traffic
*— Local Access
<- One-Way
l_
Figure 10. PERI PHERAL BARRI ERDOMINANT DIRECTION
J
~l
Q Former Through Traffic
_ I L
D
Dz?
w^
npnnr
Figure 12. RETURN LOOPSMORORISTS FORCED TO RETURNTO BOUNDARY STREET OF ENTRY
[/ Former Through Traffic
*— Local Access
J L 11
L/ Former Through Tra
!
ffic
1
—
'
\
1A,
| 1
*1
ptt
1
1
—«' V1
—m _
1 1 1 r
Figure 11 PERIPHERAL BARRIERMULT I DIRECTION
Figure 13. ANTI-THROUGH SYSTEMTRAVEL COMPLETELY ACROSSNEIGHBORHOOD IMPOSSIBLE
29
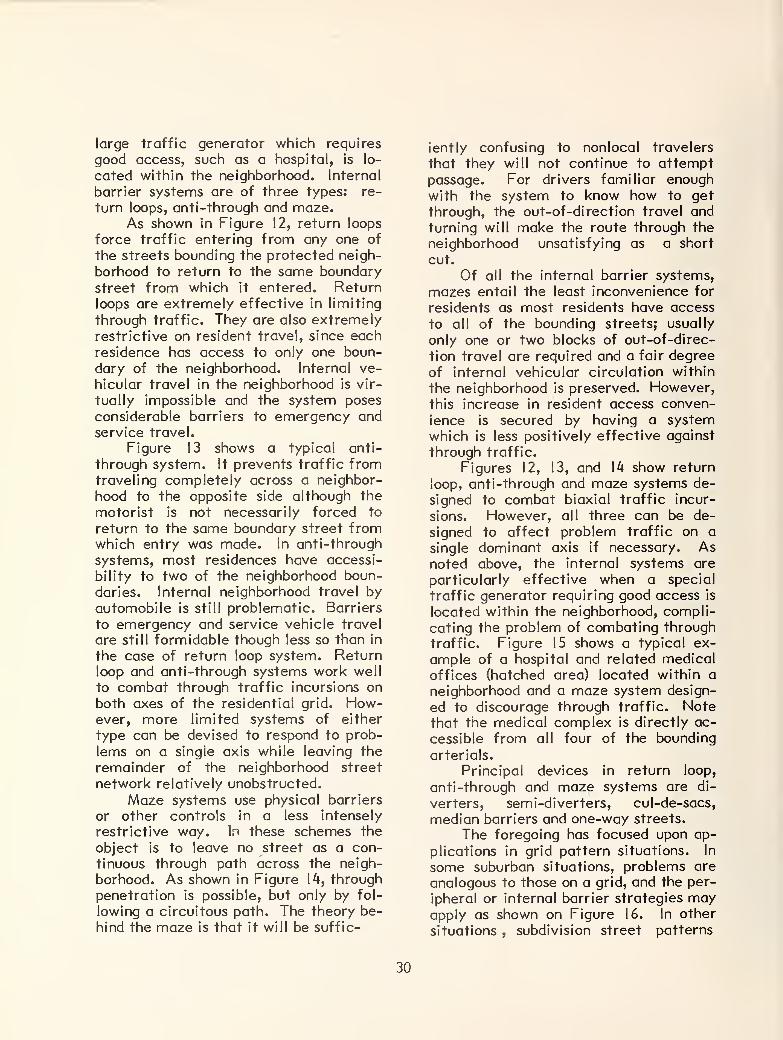
large traffic generator which requires
good access, such as a hospital, is lo-
cated within the neighborhood. Internal
barrier systems are of three types: re-
turn loops, anti-through and maze.As shown in Figure 12, return loops
force traffic entering from any one of
the streets bounding the protected neigh-
borhood to return to the same boundarystreet from which it entered. Returnloops are extremely effective in limiting
through traffic. They are also extremelyrestrictive on resident travel, since eachresidence has access to only one boun-
dary of the neighborhood. Internal ve-
hicular travel in the neighborhood is vir-
tually impossible and the system poses
considerable barriers to emergency andservice travel.
Figure 13 shows a typical anti-
through system. It prevents traffic fromtraveling completely across a neighbor-
hood to the opposite side although the
motorist is not necessarily forced to
return to the same boundary street fromwhich entry was made. In anti-through
systems, most residences have accessi-
bility to two of the neighborhood boun-
daries. Internal neighborhood travel byautomobile is still problematic. Barriers
to emergency and service vehicle travel
are still formidable though less so than in
the case of return loop system. Returnloop and anti-through systems work well
to combat through traffic incursions onboth axes of the residential grid. How-ever, more limited systems of either
type can be devised to respond to prob-
lems on a single axis while leaving the
remainder of the neighborhood street
network relatively unobstructed.
Maze systems use physical barriers
or other controls in a less intensely
restrictive way. Ir» these schemes the
object is to leave no street as a con-tinuous through path across the neigh-
borhood. As shown in Figure 14, through
penetration is possible, but only by fol-
lowing a circuitous path. The theory be-
hind the maze is that it will be suffic-
iently confusing to nonlocal travelers
that they will not continue to attemptpassage. For drivers familiar enoughwith the system to know how to get
through, the out-of-direction travel andturning will make the route through the
neighborhood unsatisfying as a short
cut.
Of all the internal barrier systems,
mazes entail the least inconvenience for
residents as most residents have access
to all of the bounding streets; usually
only one or two blocks of out-of-direc-
tion travel are required and a fair degree
of internal vehicular circulation within
the neighborhood is preserved. However,this increase in resident access conven-
ience is secured by having a systemwhich is less positively effective against
through traffic.
Figures 12, 13, and 14 show return
loop, anti-through and maze systems de-
signed to combat biaxial traffic incur-
sions. However, all three can be de-
signed to affect problem traffic on a
single dominant axis if necessary. Asnoted above, the internal systems are
particularly effective when a special
traffic generator requiring good access is
located within the neighborhood, compli-
cating the problem of combating through
traffic. Figure 15 shows a typical ex-
ample of a hospital and related medical
offices (hatched area) located within a
neighborhood and a maze system design-
ed to discourage through traffic. Notethat the medical complex is directly ac-
cessible from all four of the bounding
arterials.
Principal devices in return loop,
anti-through and maze systems are di-
verters, semi-diverters, cul-de-sacs,
median barriers and one-way streets.
The foregoing has focused upon ap-
plications in grid pattern situations. In
some suburban situations, problems are
analogous to those on a grid, and the per-
ipheral or internal barrier strategies mayapply as shown on Figure 16. In other
situations , subdivision street patterns
30
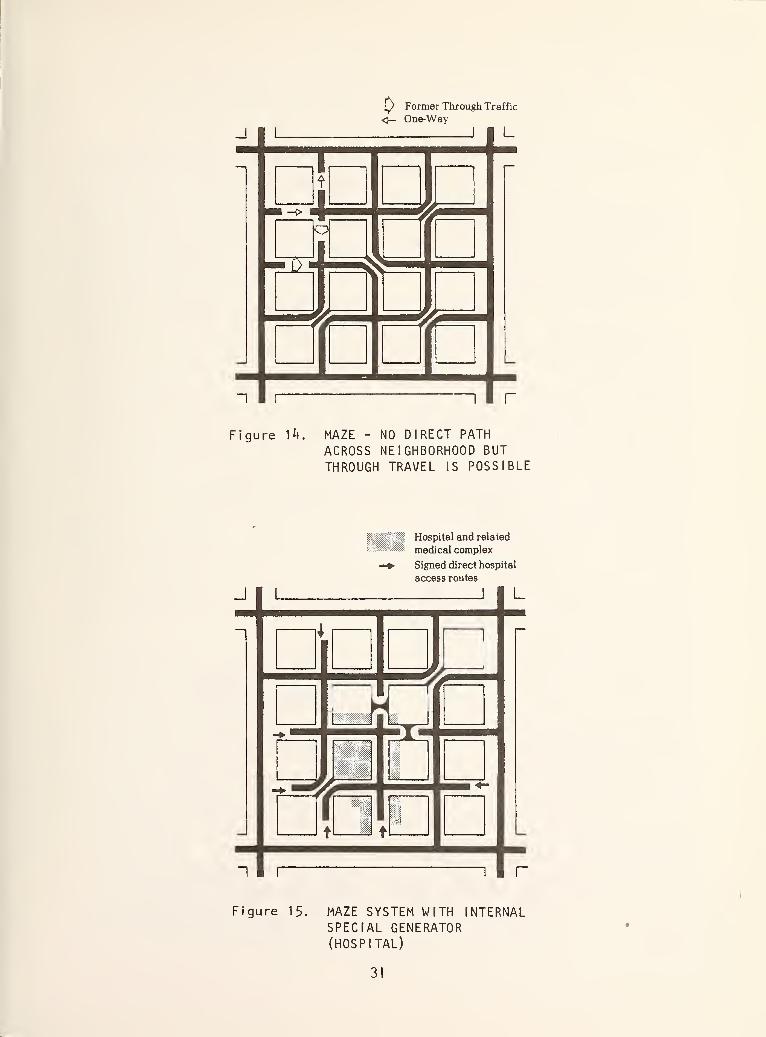
iy Former Through Traffic
<— One-Way
Figure ]k. MAZE - NO DIRECT PATH
ACROSS NEIGHBORHOOD BUT
THROUGH TRAVEL IS POSSIBLE
Hospital and related
medical complex
Signed direct hospital
access routes
Figure 15. MAZE SYSTEM WITH INTERNALSPECIAL GENERATOR(HOSPITAL)
31
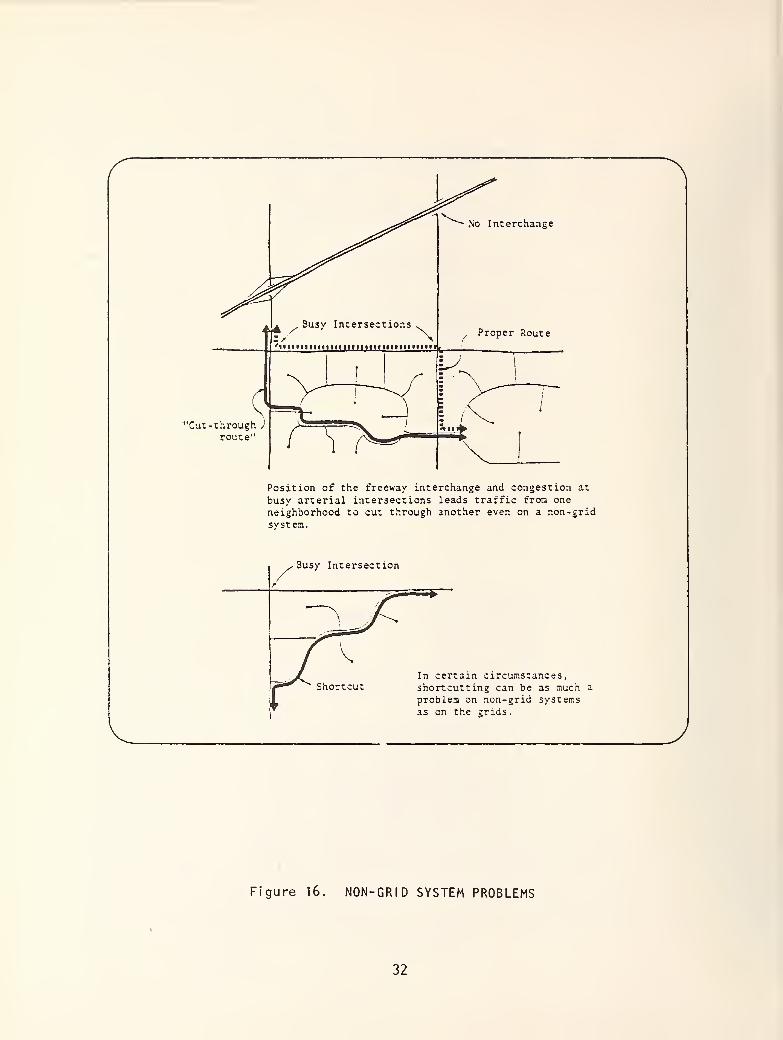
No Interchange
'Cut-throughroute"
Position of the freeway interchange and congestion at
busy arterial intersections leads traffic from oneneighborhood to cut through another even on a non-gridsystem.
3usy Intersection
ShortcutIn certain circumstances,shortcutting can be as much a
problem on non-grid systemsas on the grids.
Figure 16. NON-GRID SYSTEM PROBLEMS
32

produce problems unique to modern sub-
urban development.Beyond the schematic pattern of
neighborhood traffic control, overall
planning philosophy of the designer canhave tremendous impact on the form of aneighborhood traffic control scheme.The classical area-oriented approach set
forth by Buchanan (and typical of Europ-ean "traffic replanning" efforts and someU.S. urban renewal schemes) works back-ward from an "end-state vision" for aneighborhood or "environmental pre-
cinct" to a specific plan to achieve that
state. Site-specific problems may init-
iate the planning process, but treatmentis sought for the entire unit. Whileconditions which spurred action are not
specifically considered, the plans pro-
duced will hopefully resolve site-specific
problems initially recognized.
Application of this fairly simpleconcept may result in a clearly under-standable scheme which generates com-munity support and operates well in
practice. The approach also eliminatesneed for extensive data on the specific
nature of problems. However, it suffersfrom these drawbacks:
• There may be difficulty in defining
homogeneous environmental pre-cincts or neighborhood units. Quiteoften there are isolated divergentland uses withing neighborhoods suchas corner stores, hospitals, andschools within the unit which require
special consideration. Frequentlytoo, neighborhoods do not havesharply defined boundaries; the
transition in land use character andneighborhood identity may be ratheramorphous.
• In working from a broad scale vision,
this approach may fail to satisfy
micro-scale needs within a planningunit, e.g., the one or two householdsnear the device severely impacted
by one device or location but not by
another.
• The approach is one primarily di-
rected to diversion of non-neighbor-
hood traffic. It does not respond
well when diversion is infeasible or
when the residents themselves causethe problem - e.g., speeding on other
blocks of their own neighborhood.
The problem-oriented method devel-
ops a traffic managment scheme fromanalysis of an array of specific condi-
tions in an area. The focus is at a micro-scale level, a "bottom-up" approach in
which attempts are made to solve ident-
ified problems individually, while still
considering the systemic effects and in-
terrelations of separate problem sites,
until a set of solutions is developed for
an entire area. This method requires
substantial data on the specific nature of
problems to determine feasible and ef-
fective alternatives. This method is
common to U.S. efforts at neighborhood
traffic management. The BerkeleyNeighborhood Traffic Plan is perhaps the
most extensive example of this assess-
ment strategy. A chief advantage of this
approach is that it works well in dealing
with problem situations internal to a
neighborhood such as those created by a
divergent land use or by the behavior of
the residents themselves.Potential drawbacks to the problem-
oriented approach become evident whenlarge areas are being treated. They re-
late to difficulties in gathering andeffectively using large amounts of data
and a tendency toward lack of cohesion
among the solutions at sites which im-pact one another. These potential pro-
blems can be overcome by effective data
management systems and by subdividing
the total study area into manageablesized units or neighborhoods for whichdata can be effectively organized andsolutions to problems can be considered
both in site context and in a cohesive
33
neighborhood context. Then alternatives
for the individual neighborhoods can bematched with one another to develop co-hesive plan alternatives for the entire
planning area.
This discussion of strategic planning
methods is emphasized out of concernfor the tendency in current practice to
overlook the systemic nature of mostneighborhood traffic conditions andcontrol plans. However, it is also pos-
sible to err by being "over-comprehen-sive". When traffic issues in a commun-ity are few and site specific, they can besuccessfully addressed on an ad hoc bas-
is. Furthermore, the broad-focused ap-
proaches above can take considerabletime and resources which in many cases
may not be available. In such circum-stances, consideration on an individual
site basis of conditions or solutions
recognized to be systemic in nature canbe a responsible professional approachprovided no serious and irreversible dam-age seems likely to result. At times,
treading the fine line between over-
comprehensiveness on the one hand andtoo limited focus on the other may de-
mand more clairvoyance than profession-
al judgment. But it is as important to
pursue ad hoc solutions when "half a loaf
is better than none" as to resist incom-plete scheme when well-thought out sys-
temic approaches are indicated.
PLANNING FOR NEIGHBORHOODTRAFFIC MANAGEMENT
Introduction
An effective planning process is the mostimportant element in the creation of a
successful neighborhood traffic manage-ment program. It is not necessarily true
that the planning process is more import-
ant than selection of the "right" device;
more important than design; or more im-portant than implementation technique.
Yet experiences reported in cities con-
tacted in the state-of-the-art search in-
clude numerous failures. In virtually
every case, the failure of a program canbe traced directly to either a breakdownin the planning process or the failure to
have a structured process at all.
For this reason, the State-of-the-
Art report includes a chapter illustrating
the more effective technical, political
and social techniques for achieving a
successful program. That chapter is
summarized in the sections which follow.
Structuring an Effective PlanningProcess
Planning for neighborhood traffic man-agement is normally done in cognizanceof but independent from the ongoing for-
malized city and regional planning pro-
cess structure.
An effective planning process for a
neighborhood consists of the following
steps:
1. Assessment of Problems and Needs
2. Development of Alternative Plans
3. Evaluation of Alternative Plans andPlan Selection
4. Implementation of Selected Plan
5. Evaluation of Selected Plan
6. Modification of Plan and Recycling
the Process
Each of these steps invove technical
effort by the professional and involve-
ment of the community. The sections
which follow delineate the componentsof each of these steps, noting necessary
technical and community involvementtechniques. All of the techniques havebeen used to some extent by State-of-
the-Art cities observed, though none fol-
lowed the process exactly or complete-
ly. Thus what follows is an "ideal"
34
planning process synthesized by the re-
search team from current successful
practice.
Why Community Involvement is
Necessary
Cities observed in this State-of-the-Art
review provide examples where well-
intentioned efforts have failed becausecommunity involvement was inadequate
or non-existent. The need for an effec-
tive community participation process is
evidenced not only from a technical, but
also a political or social standpoint. En-gineers and planners may propose a tech-
nically correct solution relative to the
data they have. But the solution may not
solve the real problem because it doesnot address the unrecorded incidents
observed by and of concern to the
community. Or the community, distrust-
ful of the professionals, may use political
muscle to gain implementation of a
scheme which has overwhelming techni-
cal weaknesses. Community involvementallows the professionals to learn of re-
sidents' perceptions of problems, their
depth of feeling about their needs, their
ideas about what ought to be done anddata items which only people as close to
the situation as residents can observe,while professionals let residents knowthe physical, legal, financial and tech-nical constraints on what can be done.
Local traffic schemes arouse power-ful emotions and have widespread im-pact. Politically, neighborhood traffic
management is controversial because in-
evitably some people gain and somelose. The public participation processpermits assessment and exposure of po-tential trade-offs before implementa-tion. Communication with potential op-position raises the possibility of workingout compromises during the planning
stage. And if adverse effects are not"advertised" in advance, the fact thatthey do occur might be used to discredit
the the planning process - it will be
alleged that the process and the plan
were defective because of these "unplan-
ned" and "unforeseen" adverse impacts.
People are also far more likely to accept
a plan or take responsibility for makingit successful if they have been part of
the planning or design process.
The following section summarizesreliable techniques and references for
the community involvement process.
Techniques For Community Involvement
A diverse array of community involve-
ment techniques developed for other
types of planning activities is potentially
adaptable to neighborhood traffic man-agement. Community involvement us-
ually operates at two levels:
• participatory programs involve com-munity " leaders and "active citi-
zens".
• outreach programs to communicatewith the "silent citizens," normally
the vast majority of residents.
Table 3 shows the functions of commun-ity involvement at each stage of the
neighborhood traffic planning process.
Naturally, different types of involvement
techniques are needed to meet the dis-
parate objectives at each stage. Figure
17 presents a range of involvement tech-
niques and indicates which ones may be
useful at each planning step. Some of
the techniques shown may be more sop-
histicated, costly or time consuming than
is appropriate in the context of the par-
ticular community and problem under
consideration. The following are major
factors to consider in selecting tech-
niques most applicable to the particular
situation and community.
• The intensity and pervasiveness of
the community's interest in the traf-
fic problem. Where strong interest
is limited to a few residents, out-
reach approaches are indicated.
35
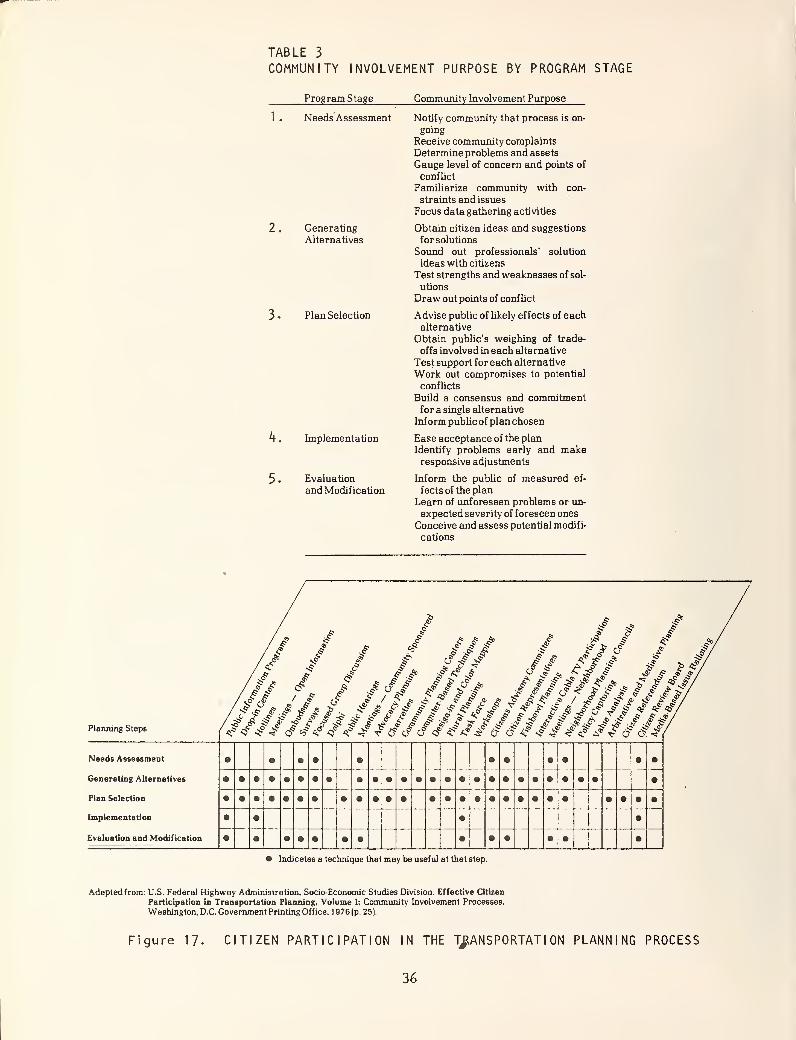
TABLE 3
COMMUNITY NVOLVEMENT PURPOSE BY PROGRAM STAGE
Program Stage Community Involvement Purpose
Needs Assessment
Generating
Alternatives
Plan Selection
Implementation
Evaluation
and Modification
Notify community that process is on-
going
Receive community complaints
Determine problems and assets
Gauge level of concern and points of
conflict
Familiarize community with con-
straints and issues
Focus data gathering activities
Obtain citizen ideas and suggestions
for solutions
Sound out professionals' solution
ideas with citizens
Test strengths and weaknesses of sol-
utions
Draw out points of conflict
Advise public of likely effects of eachalternative
Obtain public's weighing of trade-
offs involved in each alternative
Test support for each alternative
Work out compromises to potential
conflicts
Build a consensus and commitmentfor a single alternative
Inform public of plan chosen
Ease acceptance of the plan
Identify problems early and makeresponsive adjustments
Inform the public of measured ef-
fects of the plan
Learn of unforeseen problems or un-
expected severity of foreseen ones
Conceive and assess potential modifi-
cations
Planning Steps
# >
/,&?
'iJfA 2?
# J? 5J
Needs Assessment
Generating Alternatives
Plan Selection
Implementation
Evaluation and Modification
v & tf <f#& *?& 6* 6$ 4* s^# ££ £ / if <?.4
• Indicates a technique that may be useful at that step.
Adapted from: U.S. Federal Highway Administration, Socio-Economic Studies Division. Effective Citizen
Participation in Transportation Planning, Volume I; Community Involvement Processes,
Washington, DC. Government Printing Office. 1976 (p. 25).
Figure 17- CITIZEN PARTICIPATION IN THE TRANSPORTATION PLANNING PROCESS
36
Where interest is broad based, direct
participatory techniques can pre-
dominate.
• The community's attitude, positive,
negative, or neutral, toward the
traffic problem. When a communityhas already developed an attitude,
more sophisticated techniques maybe required to assure fair consid-
eration of all alternatives.
• The community's cohesion whichgreatly determines the ease withwhich consensus can be reached on aproper course of action.
• The community's expectations of its
role in the planning process, whichcan determine what techniques theywill accept and consider legitimate.
• The community's past experiencewith citizen participation and par-ticular techniques.
• The community's median educationlevel which can influence success of
techniques heavily relying on certain
skills, such as reading and writing.
In general, esoteric techniques should beavoided and the simplest techniqueswhich seem likely to produce satisfac-
tory results should be tried.
I. PROBLEM IDENTIFICATION ANDNEEDS ANALYSIS
Elements of a Community NeedsAssessment
The planning processs usually begins withcitizen requests for action or with theprofessional's perception that a problemexists. In either case, the planner mustgain a thorough understanding of the
problem both in technical terms andfrom the community's point of view.
With this background, a technical eval-
uation of need can be made to compareperceived problems with objective data
that may or may not confirm the prob-
lem. Effective analysis at this stage of
the planning process requires:
• Searching for all possible points of
view. Attempts should be made to in-
volve merchants, residents and com-muters who will be affected by any
plan.
• Outreach to silent citizens. Althoughoutgoing and active citizens easily be-
come involved, the vast majority of
people, even though they have strong
feelings on an issue, do not write let-
ters to the editor, petition city coun-
cils or attend public meetings. If the
community involvement process is to
be effective and truly representative,
it must reach out to these silent citi-
zens. Early use of mass media, public-
ity and opinion surveys are good waysof gaining silent citizens' inputs at the
start of the planning process.
• Efficient utilization of citizen involve-
ment or input. Early involvement is
vital to assure that the process is
directed to citizen needs rather than
following preconceived notions of offi-
cials. Citizen involvement must be
sufficiently focused to provide useful
input.
• Proper weighing of viewpoints. Re-cognition of different viewpoints andneeds in the neighborhood should beacknowledged, as should determination
of whether a vocal majority or minor-ity is representing interested parties
at public hearings/neighborhood meet-ings.
• Sensitivity to special resident groups.
Residents most vulnerable to changesin traffic patterns include the elderly,
handicapped and children. These
37
groups are usually less vocal, less or-
ganized participants in the public or
political process and their needs andconcerns are different than those of
other residents. Similarly, recognition
should be given to different residential
preference or lifestyle groups, e.g.,
those who spend a majority of their
time at home versus those workingduring the day and who often seeking
relaxation and enjoyment outside their
home.
Sensitivity to perceived as well as
measurable problems. Traffic engi-
neering as it is practiced on arterial
and higher order facilities relies heav-ily on evaluation of objective andquantifiable data. On local neighbor-
hood streets, a different approach is
needed. Driver actions which citizens
on local streets perceive as problemsoften "measure" to be quite normalwhen they are evaluated by arterial
standards. The key to successful as-
sessment of neighborhood traffic prob-
lems is to understand the residents'
perception of the neighborhood, and to
use measures which respond to the re-
sidents' perceptions and expectations.
Organized analysis program and rele-
vant observations. Resources can eas-
ily be wasted collecting large amountsof irrelevant data or conversely, crit-
ical data may be overlooked. Once the
issues and individuals involved becomeclear, an organized approach to the
needs assessment is essential.
Proper staff and resource support. In
the cities observed, technically orien-
ted professionals often assumed res-
ponsibility for performing a needs as-
sessment. While their technical input
was complete and reliable, their hand-ling of community participation wasoften ineffective or virtually non-
existent. Other specialists offering
guidance in community participation,
techniques such as surveys, interviews,
presentations and meetings, should berelied upon.
Initiating the Needs Assessment
When should a formal needs assessmentbe undertaken? If the objective traffic
statistics available or casual direct ob-
servation present direct evidence of a
problem, there is clear indication that
some sort to analysis should begin. How-ever, the absence of such direct objec-
tive evidence in an initial screening is
not a sufficient basis for concluding that
no problem exists. Data customarily col-
lected by traffic and planning profession-
als or the way they customarily analyze
and interpret that data may not be rele-
vant to the actual concerns of residents
and other street users.
If a sizeable minority of residents or
users of a block, street or area complain
about some condition, or if a majority of
people in a particularly vulnerable or
sensitive group (i.e., the elderly, parents
with young children) complain, then
there indeed is some kind of problem.
Techniques and Measures for ProblemIdentification and Needs Analysis
Community needs analysis has two points
of focus, resident conditions and traffic
service conditions. Resident analysis as-
sesses the needs, problems and impacts
of traffic on residents, and other institu-
tions sensitive to it. Traffic and services
analysis assesses the needs and problems
of all those who wish to have access to
or through the area.
The traffic analysis and resident
analysis act as mutual checks, ensuring
that there are grounds for communityconcerns, that solutions will be relevant
to residents' concerns and that basic
transportation needs will be met. Takentogether, they generate a "before" data
base upon which performance of the "so-
38
lution" eventually implemented can beevaluated.
Techniques used for resident analysis
and traffic service analysis fall into five
main categories: citizens direct inputs,
traffic/service observations, environ-
mental observations, observations of
resident acitivities, and records. Table 4presents a range of measures in each of
these categories. The large number of
measures reflects the diversity of traffic
impacts and the limitations of individual
measures. No single measure or small
group of them is sufficiently comprehen-sive to reasonably relate to all of theissues of possible concern. And evenwhere measures are relevant, reliability
of the measure can be a problem.* Di-
rect inputs of citizens are usually re-
levant but not necessarily reliable. Di-
rect observations and records are usually
reliable but not always directly rele-
vant. For this reason Table 4 arrays
measures by resident and* traffic condi-tions each purports to assess, and rate
each for relevance and reliability. Thetable also demonstrates why traffic
counts are the most predominant mea-sure in current use - volume counts are a
highly reliable and at least somewhat re-
levant indicator on virtually every needissue.
The needs assessment should not be-come an immense data-bound project.
Table 4 provides a basis for organizing ananalysis plan so that only those measurerelevant to the specific problem at handare used. But data should be assemblednot just for the apparent problem site
but for the full area likely to be impact-ed by the problem or by its solution.
2. GENERATING ALTERNATIVEPLANS
The reasoned approach to neighborhood
traffic issues recognizes the potential
for more than one adequate solution. It
also allows for orderly assessment of a
variety of inputs, e.g., neighborhoodgroups, businessmen, traffic engineers/
planners, and public officials.
In current practice, consideration of a
full range of possible solutions may bethe exception rather than the rule; i.e.,
needs assessment, definition of a solu-
tion, and implementation often are com-pressed to a single line of action. Aneighborhood group may petition to CityHall that diverters be installed to dis-
courage through traffic, and a resolution
may be voted on and action mandated to
the traffic engineering department - all
within the course of one or two city
council sessions. Whether such a courseof action, undertaken with little or notechnical analysis or citizen input, will
succeed or fail depends on good luck andgood intuition. Cities studied in the
State-of-the-Art review exhibited mixedresults under such circumstances.The more conventional approach for
analysis of alternative traffic control
plans recognizes the need to accommo-date a variety of inputs through a for-
mal, and sometimes lengthy, evaluation
process. Key elements of the alternative
development process are:
• Strategic considerations
• Managing and arraying available data
• Developing the alternative plans
• Community involvement in plan devel-
opment
Each procedure is addressed below.
Strategic considerations and data man-agement techniques have been discussed
* A measure is said to be reliable if different people independently evaluating acondition or event consistently coincide in rating it.
39
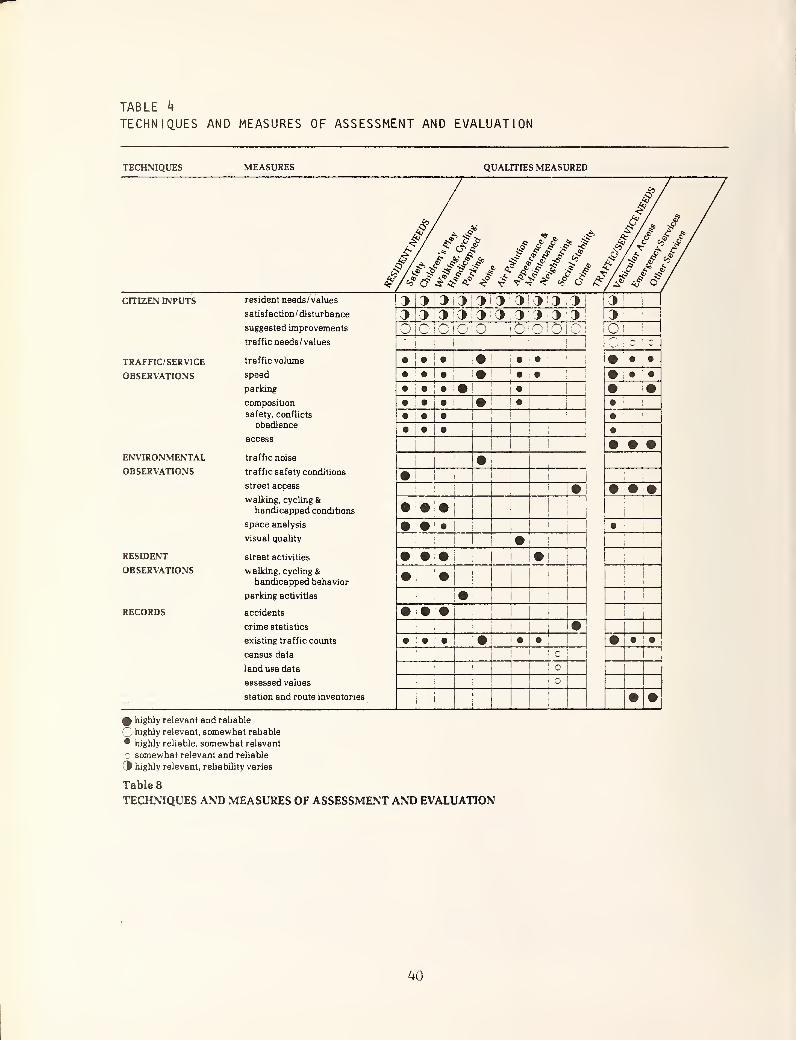
TABLE h
TECHNIQUES AND MEASURES OF ASSESSMENT AND EVALUATION
TECHNIQUES MEASURES QUALITIES MEASURED
o
sff.Wfft? G £
highly relevant and reliable
O highly relevant, somewhat reliable
• highly reliable, somewhat relevant
C somewhat relevant and reliable
3 highly relevant, reliability varies
Table 8
TECHNIQUES AND MEASURES OF ASSESSMENT AND EVALUATION
CITIZEN INPUTS resident needs/ values
satisfaction / disturbance
suggested improvements
traffic needs/ values
traffic volume
speed
parking
composition
safety, conflicts
obedience
access
traffic noise
traffic safety conditions
street access
walking, cycling &handicapped conditions
space analysis
visual quality
street activities
walking, cycling &handicapped behavior
parking activities
accidents
crime statistics
existing traffic counts
census data
land use data
assessed values
station and route inventories
3 J 3 3 i 3 13
1
3
3 3 3 3 l
3 3i3 3i3i3;3 3 3 3 3Oj olo OlO; iO!0 1 C Oi
ii
1
f~*; z I z
TRAFFIC/ SERVICE • i • !•! !• • • • •
OBSERVATIONS • ! • !•! :• • • • ' •
. . •! ;.j • ••i» i !•; !• i
i
• :
•!•!!
i
! !i
• !
•i•
,
ill!! •
|
i
!i • • •
ENVIRONMENTAL!
^ •i
}
OBSERVATIONS •i
i
i
1
!• • • •
• • •• • !•
i
• !
!• ;
i
|i
RESIDENT • • • i •OBSERVATIONS H i
•! 1
! 1
• i
!
RECORDS • • h#|
!
i
1
1 •• • • • • •
!
i • •1•
i wi
G
i i
• •
40
previously in this summary. Key facets
of the other activities are reviewedbelow.
Developing the Alternative Control Plans
Solution schemes do not spring miracul-
ously from a stack of data files or over-
lays. Developing solutions responsive to
an array of problem conditions, and con-
straints of any complexity demands exer-
cise of judgment and creativity by the
planner. While the control strategies
discussed previously provide general
guidance, each alternative must betailored to the peculiarities of the spe-
cific study area. It is inevitable that
conflicts of values and needs with eachother and with constraints will occur.
The responsible planner must define a set
of alternatives which reflect the full
range of technical possibilities andtrade-off choices between ^benefits andundesired impacts, roughly estimating
what the gains and drawbacks will be as
each alternative is evolved through trial
and error. Once a set of alternatives is
reasonably developed, a more formalized
projection of each alternative's potential
effects and trade-offs is prepared as in-
put to selection of one for action.
Community Involvement in PlanGeneration
The purpose of community involvementat this stage is to guide development of
schemes which seem to respond to resi-
dent perception of needs and constraints
and assure that residents' schemes areaddressed in the analysis. Communityinvolvement at this stage can range fromresidents taking full responsibility for
developing their own alternatives to sim-ply reacting to proposals developed byprofessionals. Either participatory pro-
cess requires immediate clarification of
the relationships and roles of profession-
als and different kinds and groups of pub-lic participants.
Communities observed in the State-of-
the-Art review exhibited the full range
of citizen involvement in generation of
alternative plans-from almost nil to full
responsibility.
While there is a definite heirarchy in
the level of citizen involvement at the
alternatives generation stage - andstrengths and weaknesses in each ap-
proach - the State-of-the-Art review
appears to indicate that community in-
volvement at the needs assessment and
plan selection stages has far more im-pact than community input to the alter-
natives generation process. Nonetheless,
involvement of a broad range of actors
at those stages appears a key to success.
3. PLAN SELECTION
In neighborhood traffic issues, selection
of one of several alternative plans for
implementation is inevitably both a tech-
nical and social/political process. Tech-nical analyses help clear the potential
impacts each alternative might have.
However, the process of placing value onthese impacts and weighing trade-offs is
predominantly a social and political
one. It involves individual citizens,
neighborhood organizations and/or public
officials. How these people perceive
benefits and drawbacks of the alterna-
tives ultimately has a large effect on
what plan is selected. If the selection
process is not carefully structured andtechnical information is not convincingly
presented to the public, there is a goodpossibility that technical considerations
which should not be compromised will be
cast aside.
This section first presents guidance ontechnical information which should be
available at the evaluation stage. It then
presents, through illustrations from act-
ual application, the various types of so-
cial/political selection processes whichare possible. Individual planners mustdetermine which techniques are applic-
able to their local resident and political
situation.
41
Technical Inputs
The technical inputs needed to choose a
neighborhood traffic management plan
are primarily estimates of what changesare likely to happen relative to those
qualities used originally to determine the
needs of the neighborhood. In this sense,
the selection process is a formal methodof determining to what degree the needswill be met. But the technical inputs to
plan selection must also attempt to
estimate what other possible impacts
(positive or negative) each alternative
might have beyond its direct objectives.
The technician's role at this stage of the
process is to present for each alternative
the best quantified or qualitative
estimates for the measures listed
previously in Table 4.
The measures listed and discussed in
detail in the State-of-the-Art report are
quite comprehensive and may not beneeded in all applications. They are
presented mainly as a checklist for the
planner to use in determining those is-
sues which he believes will be importantin his specific case. In large part, the
importance of issues will depend on site
circumstances and the concerns of those
who are involved in the selection pro-
cess, and at what point in the process
they are involved, as illustrated below.
Community Involvement in Plan
Selection
At this stage, community involvementmust serve several purposes: to draw out
citizens who won't participate until con-
fronted with specific plans, eliminating
the chance for "no one told me" argu-
ments; to provide opportunity for all
needs and constraints to be taken into
account, to let the citizens decide the
social trade-offs between alternatives,
and to select a plan which has reasonable
consensus or community support while
meeting technical conditions and con-
straints. Normally, plan selection is a
two phase process. In the preparatory
phase the community develops a consen-sus. In the decision phase, officials con-firm (or reject) the community's choice.
Preparatory Phase to Decision Mak-ing. Citizen participation may vary in
form from citizen review boards, wherea small number of participants represent
the whole neighborhood or community,through surveys, public meetings, andformal public hearings, to, in rare casesa citizen referendum where the affectedelectorate formally votes on a plan. Thekey issue is the degree to which the a-
gency, the community, and elected offic-
ials agree to be bound by the results.
A problem common to this stage of the
planning process is effective dissem-ination of details of plan alternatives andtheir projected impacts. Media an-
nouncements and articles (newspapers,
radio and TV), posters at prominent lo-
cations and leaflets mailed out or dis-
tributed door-to-door, can be effective.
Decision Making. Ultimately, mostcommunity decision making is finalized
at the city council level (or equivalent
elected body). While the council is the
ultimate decision-making body, whatgoes on before usually has strong impacton which alternative is selected and its
likely eventual success.
If the decision process is truly in-
itiated only at the council or Planning
Commission level, virtually anything canhappen. A well-organized interest groupwith political clout can gain their way,leaving important technical considera-
tions and the legitimate interests of the
other residents and travelers ignored.
Or, as more often happens, public inputs
give officials nothing more than a sense
of bitter conflict, leading officials to
choose to do nothing or to decide issues
on the basis of narrow technical findings.
Decision making by an official board
works best when a consensus of citizens
and technicians has beeen reached to
support a single alternative prior to
consideration by the council. In essence,
this depends on an already established
42
process, either formal or informal, whichis recognized as having status by theboard. The official body's decision-
making provides both an affirmation byauthority of the prior work and a point of
last appeal for those who oppose the re-
commended alternative.
4. IMPLEMENTING DECISIONS
Once the traffic plan has been adoptedby an official political body and funded,
staff must proceed with physical act of
installing the planned devices. Whileimplementation may seem straightfor-
ward - most city public works or traffic
departments have the resources, possibly
with contractor assistance - implementa-tion actions can have critical effect onthe success or failure of the plan. This
section reviews some of the significant
implementation issues. -
Permanent Versus Temporary Controls
There is widespread disagreement amongpractitioners as to whether temporary or
permanent devices should be used in in-
itial installations of diverters, semi-diverters, cul-de-sacs, circles and anyother devices involving substantial con-struction. In complex traffic manage-ment schemes, it is inevitable that
modifications will prove necessary afterthe schemes are implemented. Tempor-ary devices provide flexibility for suchmodification. Since they normally cost
less than permanent installations, an en-tire program can often be implementedimmediatly with temporary installations
even if funds are short. Individual
installation can then be upgraded afterthey prove successful and as funds be-come available. On the negative side,
foreknowledge of the ease of modifica-tion may lead to incomplete planning.Because of the devices' inherent imper-manence, issues are never truly settled.
The ready possibility of change encour-
ages opponents to continue the contro-
versy and leads other who might prefer
limited modifications to join the agita-
tion. In addition, use of temporary de-
vices appears to raise greater potential
for court challenges on the basis of al-
leged non-conformance to traffic control
device standards.
As for immediate permanent instal-
lations, the very nature of their perman-ence seems to command more driver re-
spect; hence better obedience and less
vandalism. Residents readily accept per-
manent landscaped devices as enhance-ments to the beauty of their neighbor-
hood whereas temporary materials areoften regarded as eyesores. Becausepermanent installations involve sizeable
funding commitments, professionals andthe public hopefully ensure they have the
"right answer" before deciding on a solu-
tion.
Choice between immediate permanentimplementation or initial use of
temporary devices should be based on the
individual community's situation. In
general, temporary installations might befavored in cases where plans are exten-sive and complex (where the possibility
of some planning error is high) and/orwhere funds are short. Where temporarydevices are selected, careful attention to
their attractiveness and conformance to
traffic control and design standards a
must and a future committment to makepermanent those devices which provethemselves should be made clear.
Incremental Versus One-StepImp Iementat ion
Devices in individual neighborhoodsshould be constructed or erected as near-
ly simultaneously as available resources
permit. But if the plan encompassess a
large district and involves a significant
number of devices, should it be construc-ted as a single short-term activity? Oris an incremental neighborhood approachmore realistic?
43
The incremental approach allows staff
to devote more attention to the details
of individual installations and to assurethat all necessary construction materialsare on hand.
With the incremental approach, lessons
learned in "early action" neighborhoodscan be applied citywide and repetition of
mistakes avoided. Yet the incrementalapproach leads to a lengthy period of
turmoil as traffic adjusts and readjusts
to a continuing series of changes in
street conditions. And public reactionsto temporary adverse impacts of an early
implementation increment can derail a
plan at the outset even though a later
staged step would have eliminated theimpact. On the other hand, massivechanges in traffic conditions resulting
from several programs implemented at
once can unite a large opposition. Theplanner must carefully review the indi-
vidual situation to judge whether anincremental or one-step implementationapproach is most appropriate.
Timing
Another helpful installation hint is to
install devices at a time when the least
number of drivers is likely to be around.Where possible, take advantage of the
"off-season" in a summer or winter re-
sort or tourist area and of summer vaca-tions in a campus town. In this way, yearround residents will have a chance to ad-just to the changes during off-peak traf-
fic conditions while part-time residents
and visitors will be confronted with a
fait ccompli when the arrive. While not
all communities have the advantage of
an off-season for traffic, the converse to
the principle applies everywhere - avoidimplementation in peak traffic seasons(like Christmas shopping season neardowntown and shopping centers).
Publicity
Publicity about the adopted plan's fea-
tures and its construction schedule are
important components of implementa-tion. Frequently, residents and motorists
are rudely surprised by abrupt changes in
their street system.
The immediate result can be erratic andillegal behavior such as dangerous driving
maneuevers or out-right vandalism. In
cases of large-scale plans involving bar-
rier devices, maps showing features of
the plan and its construction schedule
should be distributed to residents, to
commuters at their places of employ-ment and to all firms operating routed
services and deliveries in the city.
Notices warning of traffic control chan-ges and dates of construction should beprominently posted on the control sites
several days before construction takes
place. Where barriers are to be con-
structed on internal neighborhoodstreets, similar warning notices should
also be posted at the neighborhood entry
points and left standing for at least aweek after construction is complete.
Favorable First Impressions
When the first sign of a scheme is ob-
strusive and ugly without apparent pur-
pose, people naturally react against it.
Efforts to present an attractive appear-
ance, even with the low budget tempor-ary devices, are rewarded. The extra
cost of mature landscaping may be
money well spent. Devices initially per-
ceived as ugly may be removed before
landscaping has a chance to mature.
Early Surveillance and Adjustment
Planners and engineers should anticipate
the inevitable adverse reactions that
accompany the installation of traffic
control devices. Almost every city con-
tacted experienced some unfortunate ex-
perience, ranging from illegal driving
maneuvers to out-right vandalism. Pro-
fessional staff should be on the scene to
44
observe deviant behavior in first-
encounter reactions, to note if any de-sign features are its cause and if design
modifications can provide a counter-measure to unsafe or purpose-defeatingbehavior.
Additional police surveillance during
the period immediately following instal-
lation helps discourage erratic or illegal
driving behavior and vandalism. The per-
iod of intense first-encounter reaction
usually lasts no more than a week or so.
After that time, drivers have adjusted
their routes sufficiently to avoid the
inconvenience caused by the new system.
Committment to Specific EvaluationPeriod
While minor adjustments as a result of
early surveillance findings are possible, acommitment to a specific evaluationperiod before major changes in thescheme are made should be established.
This allows time for traffic and residents
to adjust patterns, and for tempers to
cool and permits evaluation to be basedon longer-term performance rather thaninitial reactions.
Community Involvement in
Implementation
Community involvement at this stage is
passive, e.g., citizens receiving in-
formation on how plans will be imple-mented. The technical staff assumes theduties of informing the citizens of plansand schedules to minimize surprises. Thecontinuing public meetings or public in-
formation program can serve as techni-ques to notify the public - particularly
those susceptible to change or negativeimpacts - of the implementation sche-dule and work-in-progress plans if
construction is needed. Negativereaction to any neighborhood traffic
management project may result from re-
sidents being taken by surprise by actual
implementation activities.
An information process is also useful
for identifying problems created by workin progress.
5. EVALUATING THE CONTROLPLAN'S PERFORMANCE
State-of-the-Art Observations
Thorough evaluations of how neighbor-
hood traffic control measures actually
perform in use are the exception rather
than the rule in current practice. In
most cases, if the devices implementedhave the effect of silencing the original
complaintants and no significant opposi-
tion surfaces or serious operational prob-
lems result, the program is normally jud-
ged to be a success. If the complaintants
are not satisfied or substantial opposition
does arise, no significantly greater ef-
forts are normally made to collect hard
data; the scheme is simply judged a fail-
ure.
If decisions can be made so simply,
why evaluate? For one reason, evalua-
tion of technical performance and com-munity perceptions is needed to provide
an unbiased basis for decisions as to
whether a plan is kept or abandoned.
Actual performance and impacts are of-
ten quite different from what opponentsmay believe or claim. Public reaction is
often shaped by first impressions and ob-
servation of erractic initial performancecharacteristics. An evaluation can clar-
ify issues, bring the more stabilized long-
term performance characteristics into
focus, and spotlight "hidden" gains and
losses which may be significant.
Secondly, evaluation makes modifi-
cations possible. Decisions made without
evaluation are typically all-or-nothing;
retain the scheme or abandon it. Evalu-
ation can point to opportunities for mod-ifying a scheme to make it perform its
intended function better or to lessen ad-
verse impacts. It can also be used to
determine if the plan should be expandedboth in terms of devices and geograph-
45
ical area. Finally, only when evaluations
are conducted will there be true growthin the State-of-the-Art in neighborhoodtraffic control. So little is known today,
not because measures haven't been tried,
but because the measures which havebeen applied have not been evaluated
sufficiently.
Evaluation Techniques
Most of the measures described in con-nection with Needs Assessment shown in
Table 4 are relevant to evaluation.
Basically, measures taken during that
planning stage constitute "before" con-
ditions which can be compared to paral-
lel measures of conditions "after" imple-
mentation to determine changes resul-
tant from the control scheme. Theconduct of the "after" measures and the
comparisons comprise the evaluation. In
addition, evaluation includes consider-
ation of other data measures not studied
in the assessment stage. Some of these
measures may be relevant solely on an"after" basis (such as incidents in whichtraffic controls interfered with emer-gency vehicle operations); others involve
"before" and "after" comparisons of in-
formation which was not relevant as anassessment tool but is affected by the
plan (e.g., changes in residential property
values). In preparing for before and af-
ter studies, analysts should take carethat all important measures of perishable
"before" conditions do get taken, even if
some of these are not needed or useful in
the initial program planning.
Community Involvement in Evaluation
Public inputs to the evaluation are ob-
tained by continuing an active commun-ity involvement process. The public canbe helpful in providing feedback on their
perception of how well the plan is work-ing, details of problems, possibilities for
improvement and any aspects overlookedin the initial planning process.
To evaluate in detail the acceptability- both positive and negative - of the
project usually requires a more structur-
ed approach in the form of a survey or
special neighborhood meetings wherequestions and reactions can easily be
focused and addressed to all concernedgroups and individuals.
Timing
In conducting the evaluation, three to six
months after implementation should be
allowed before "after" data measures are
taken. This gives residents and motorists
time to become familiar with the con-
trols and make adjustments. With this
interval, the "after" measures will be of
stabilized reactions rather than first-
encounter responses. For this same rea-
son, three to six months would appear to
be the reasonable period for application
of experimental devices. In explicit ex-
periments, a fixed period for application
of the devices should be firmly commit-ted in advance.
This focus of the formal evaluation on
stabilized long-term effects is not to
suggest that first-encounter responses
and early reactions should be ignored.
These should be carefully observed fromthe start so that countermeasures to any
serious safety problem or obvious defect
can be quickly implemented.
6. MODIFICATION AND RECYCLINGTHE PROCESS
Minor modification to a neighborhood
street's protection plan is a common oc-
currence. Most modifications are phys-
ical changes to individual devices or
application of a standard change to all
devices of a particular type. Usually
such changes are minor measures intend-
ed to improve the devices' operation,
eliminate some hazardous condition or
counter some deviant driver behavior.
Most are undertaken by professionals on
the basis of their own observations with-
46
out any extensive formalized review pro-
cess.
More important are situations where a
plan is successful enough that abandon-ment is not a consideration, but its per-
formance falls short of its intended ob-
jectives or it has some undesired side
effects. Here significant modifications
may be considered to fine-tune the plan.
The evaluation stage doubles as a
needs assessment for such modification.
In modifications of this nature, whichusually relate to a multi-device plan for
a sizeable area, on some sites one type
device may be substituted for another,
some devices may be eliminated entirely
or- devices may be added, reoriented or
shifted from one location to another.
Normally, this type of modification in-
volves a mini-version of the analytic andparticipatory processes used in needs as-
sessment, alternatives development andselection. Because of all that has gonebefore, the actual activity can be ex-
tremely compressed in time and scope,
though modification planning should beas thorough and deliberate as the original
plan development.When a plan in deemed to fail irretrie-
vably, "recycling" can occur. In essence,
the scheme tried is abandoned and the
problem is either returned to the alter-
natives development stage for a fresh
approach or one of the previously dismis-
sed planning alternatives is resurrected
for implementation. In actual practice,
when neighborhood traffic control
schemes have failed, the process invol-
ved so much controversy and acrimonythat there has been no energy or enthu-siasm for a "recycling" process. Calls
for .modification and recycling can con-tinue years after initial installation.
47
CHAPTER 3RESEARCH ON ROAD HUMPS
Overview findings in the state-of-the-art
search led to interest in the potential for
applying the TRRL road hump, an elon-
gated form of speed bump, on U.S.
streets. A major portion of the PhaseTwo research was devoted to such an ef-
fort. Phase Two research on the humpsincluded the following activities.
Further direct communication was es-
tablished with TRRL researchers and de-tails of their installations, site selection
procedures, monitoring procedures andother points not covered in published
reports were conveyed. Most recent re-
ports on TRRL's public street tests of
the device in Great Britain were obtain-ed and reviewed.
Tests of the device on a closed-site
were conducted in St. Louis, Missouri.
Further closed-site tests, conducted in-
dependently by the City of Sacramento,California, were monitored by the re-
search team.Local jurisdictions were solicited to
participate in public street case studyapplications of the device. Two public
streets in Boston, Massachusetts and onein Brea, California, were selected as
case study sites. An additional casestudy site in Washington, D.C. was se-
lected but implementation did not takeplace early enough for monitoring in this
research program. A public street casestudy application conducted independent-ly by the City of Sacramento was mon-itored by the research team. Details of
all the foregoing are presented in thesections which follow.
WHAT IS A ROAD HUMP?
Although "road humps" and "speed -
bumps" are discussed in Chapter 2, it is
useful to reiterate their characteristics
here. A road hump, also known as an"undulation" or a "sleeping policeman" in
the literature, is a device intended to
control traffic speed. Undulations weredeveloped in research conducted over the
last decade by the Transportation andRoad Research Laboratory in GreatBritain. In order to characterize the
road hump, it is useful to define "conven-tional speed bumps" as well.
Undulations and speed bumps are
raised humps in the pavement surfaceextending transversely across the tra-
veled way. Length in direction of vehi-
cular travel and specific height distin-
guishes undulations from conventionalbumps. Conventional bumps are abrupt
humps, normally less than 3 feet (.91m)
in length, varying in heights of up to 5 or
6 or more inches (12.7 -15.3cm) andvarying cross section slopes. Undulationsare more gradual humps with a length of
12 feet (3.65m), a height of 3 or 4 inches
(7.5 - I Ocm) and a circular arc cross sec-
tion. Figure 18 contrasts road humps andconventional bumps. Conventional speedbumps produce greatest driver discom-fort (hence, speed control effect) at verylow speeds, with discomfort decreasing
or disappearing at moderate and high
speeds. They appear to have potential
for producing vehicle damage or loss of
control. They also tend to dislodge gearand pose dangers to personnel riding the
exterior of fire apparatus. For these
reasons the use of conventional speedbumps has been discouraged.
Road humps appear to be free from (or
minimize) the above performance de-
fects of the conventional speed bump. In
fact, they were designed with this spe-
cific intent as a result of the acknow-ledged deficiencies of conventional
humps. Performance characteristics of
road humps are detailed in the sections
which follow.
SUMMARY OF ROAD HUMPRESEARCH BY TRRL
In the early 1970's, recognition of the
48
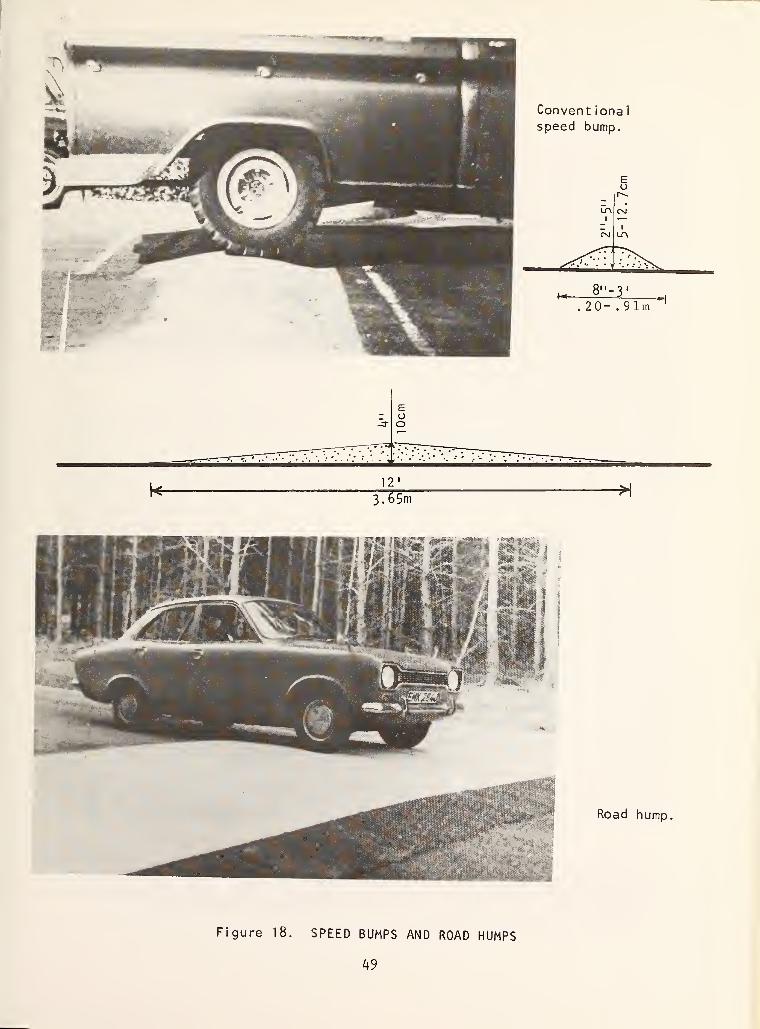
Convent ional
speed bump.
I
EU
i
8"-3
20- .91m
12
3.65m
Road hump,
Figure 18. SPEED BUMPS AND ROAD HUMPS
49
deficiencies of conventional speed bumpsand of the need for a device to discour-
age motorists from traveling too fast a-
long certain streets led Transportation
and Road Research Laboratory to initi-
ate an attempt to develop a more effec-
tive speed control hump.TRRL researchers theorized that the
principal problem with conventional
humps was their abrupt shape. Theshort, abrupt shape leads conventional
humps to administer a sharp jolt as eachaxle passes over the hump. The sharp-
ness of this jolt is what causes much of
the potential for vehicle damage, loss of
control and dislodgement of personnel.
At very low speeds, much of this jolt is
transmitted to the driver. But at higher
speeds, the sharpness of the jolt is ab-
sorbed in deformation of tires and sus-
pension rather than in deflection of the
vehicle's sprung mass, thereby limiting
the discomfort to drivers (a primaryspeed control factor). Hence, the abruptshape punished the very slow drivers
while detering the faster ones only bythe potential for vehicle damage. It wasfurther theorized that longer humpswhich administered vertical force over a
longer hump crossing time would result
in vehicle body deflection (hence driver
discomfort) rather than tire and suspen-sion deformation and that maximum dis-
comfort would be experienced at higher
speeds rather than extremely low
speeds. It was also believed that the
longer ramp effect would eliminate the
conventional humps' problem of low slung
vehicles bottoming-out.Operating on this theory, TRRL con-
ducted test track experiments on a var-
iety of hump shapes, subjecting each to
test runs over a range of speeds by ve-
hicle types ranging from a moped, sev-
eral sizes of autos, trucks and busesthrough an articulated truck-trailer rig.
As a result of this test track research,
TRRL identified the hump shape shownon Figure 18 as most suitable for appli-
cation on residential streets with 30 mphspeed Iimits.(l5)
The next step was public street casestudy applications on five residential
streets in Great Britain. These wereconducted between 1975 and 1978, after
measures on each being conducted about
10 months after hump installation. Prin-
cipal findings in these public street casestudies (16) are as follows:
• The humps had significant speed con-
trol effects. There was a consistent
reduction in vehicle speeds at all
sites. Eighty-fifth percentile speedsat the fastest points on the five
streets ranged between 30. 1 and 39.8
mph (48.4 - 64 kmph) before installa-
tion. After hump installation, 85thpercentile speeds at the fastest points
ranged between 21.9 and 27.2 mph (35- 27 kmph). Mean speeds over the en-
tire test segments (which ranged fromalmost a quarter-mile to over a half-
mile in length and usually included
several intersections) dropped from arange of from 22.7 to 30. 1 mph (36.5 -
48.4 kmph) before installation to a
range from 14.0 to 16.8 mph (22.5 - 27
kmph) after installation. Eighty-fifth
percentile speed on actual hump cross-
ings was 14.3 mph (23 kmph) for light
vehicles and 12.5 mph (20.1 kmph) for
heavy vehicles. Before the humpswere installed, a large proportion (at
some sites over 50 percent) of the dri-
vers were exceeding the 30 mph (48
15. Watts, G., Road Humps For the Control of Vehicle Speeds, Department of the
Environment, TRRL Report LR597. Crowthorne, 1973.
16. Sumner, R., and Baguley, C. Speed Control Humps On Residential Roads,Department of the Environment ^Rl Report 878, Crowthorne, 1979.
50
kmph) speed limit. After installation,
less than 5 percent of the drivers did
so. Before installation, many vehicles
exceeded 40 mph (64 kmph); after-
wards, none exceeded 35 mph (56
kmph).
• The humps induced substantial traffic
volume reductions. Volumes on test
streets decreased from 25 to 64 per-
cent with an average reduction of 35
percent.
• The humps resulted in traffic noise re-
ductions of 2 to 6 dB(A) measured at
the housefronts (18 hour Ljq read-
ings). Noise reductions are attribu-
table to traffic volume reductions as
well as to speed reductions.*
• Substantial decreases in accidents
were experienced on the test streets.
Two midblock accidents and 9 inter-
section accidents were experienced;
10. 1 and 17.8 respectively were ex-
pected.** This difference (II versus
27.9 total) is reported to be statis-
tically significant at the 0.1 percent
level. Increases in accidents over
those expected on surrounding streets
were reported not statistically signi-
ficant.
• No significant vehicle damage result-
ing from the humps was reported al-
though 4 individuals made unverifiable
claims that repeated driving over themhad worn out their shock absorbers.
During the test period an estimated 20
million hump-crossings occurred.
Some scarring of some hump surfaces
was noted. Since the TRRL track
tests using an assortment of vehicles
had failed to produce "bottoming-out"under any conditions of speed or load-
ing, the scars were attributed to over-
loaded vehicles with defective suspen-sions crossing the humps at high speed.
• No incidents involving serious disrup-
tions to emergency services were re-
ported. Fire and ambulance service
officials disliked the humps but could
site no specific instances of hazard to
safety of emergency vehicle occupantsor serious impediment to their opera-tions. All police authorities agreedthe humps significantly reduced speedand reported no unacceptable opera-tional delays for police vehicles.
THE ST. LOUIS AND SACRAMENTOCLOSED-SITE TESTS
The results of the TRRL work convincedthis research team and FHWA that the
major case study work of the secondphase of this project should be devotedto applications of the undulation de-
vice. But before applying the device on
**
These results contrast with prior findings on U.S. tests (17,18) of speed bumps whichmeasured only the sound of vehicles at the hump site and did not consider the effect
of changes in speed and volume which the humps induce.
Expected accidents are computed by multiplying the average on the test segmentsfor the prior 4 years by a factor calculated from the numbers of accidents over the
same periods on all similar roads in the general area of each test site.
17. Walsh, L.B., Op. Cit., See Reference I
18. Seattle Engineering Department, Speed Control Test of Raised Crosswalks, RumbleStrips, and Checkerboard Pavement, 1978.
51
public streets in the U.S., the resear-
chers wished to satisfy themselves first-
hand of the device's fundamental safety
characteristics as reported in the TRRLresults. Particularly with reference to
safety-related factors, they wished to
confirm that vehicles in common use in
the U.S. performed on the humps in sub-
stantially the same fashion as vehicles in
common use in Great Britain (simulation
work performed at the University of
Michigan had already provided theoreti-
cal confirmation of this). (19) To do this,
the team conducted a closed-site test
track procedure similar to the orignal
TRRL test track work and to the well
publicized San Jose, California tests of
speed bumps. (20) The City of St. Louis,
Missouri, which was interested in the un-
dulations, provided the site, vehicles andpersonnel to assist in the testing andconstructed the hump. A range of veh-
icles (types and characteristics are listed
in Table 5) were tested on a hump con-structed to correct TRRL dimensions at
speeds ranging in 5 mph (8 kmph) in-
crements from crawl speed to 35 mph (56
kmph) for all vehicles and to whateverhigher speed above that each vehicle
could attain on the test site (speeds up to
70 mph (113 kmph) for some vehicles
were attained).* On each run, vertical
displacement, lateral displacement,whether the vehicle actually became air-
borne, noise level as the vehicle nearedand crossed the hump, actual speed at
the hump crossing, driver perceptions of
control and safety, and driver and pass-
enger perceptions
monitored.Key findings of
were as follows:
of discomfort were
the St. Louis tests
The undulation did not appear to poseany significant safety problem to pass-
age of automobiles at speeds up to 70mph (113 kmph). A full range of autotypes from subcompact through luxury
sedans were tested. No test drivers
reported any meaningfull control prob-
lems. No incidents of automobiles be-
coming airborne, bottoming-out or de-viations in alignment (swerving) wereobserved.
The rear wheels of motorcycles tendedto become airborne for a brief instant
at speeds above 25-30 mph (40 - 48kmph) but operators reported absolute-
ly no problems with control on any of
the test runs which included speeds upto 49 mph (79 kmph). No problemswere observed with a 10-speed bicycle
and its operator reported absolutely nocontrol problems at speeds up to 20
mph (32 kmph).
Long wheelbase vehicle operations
were generally safe although the im-pact of humpcrossing on them wasconsiderably more severe than on
automobiles at moderate to high
speeds. The rear wheels of the dumptruck became airborne and the driver
reported moderate control difficulty
at speeds above 28 to 33 mph (45 - 53
* Run-up distance available on the test site generally limited the speeds heavyvehicles (fire trucks, bus, dump trucks) were able to attain on approach to the humpto under 45 mph (72 kmph). It was reasoned that this was likely to be the maximumspeeds such vehicles might attain on streets where the humps were apt to be used.
19. Post, T.M., and Bernard, J.E., Response of Vehicle to Pavement Undulations,
University of Michigan, 1976.
20. Walsh, L.B., Op. Cit., See Reference I
52
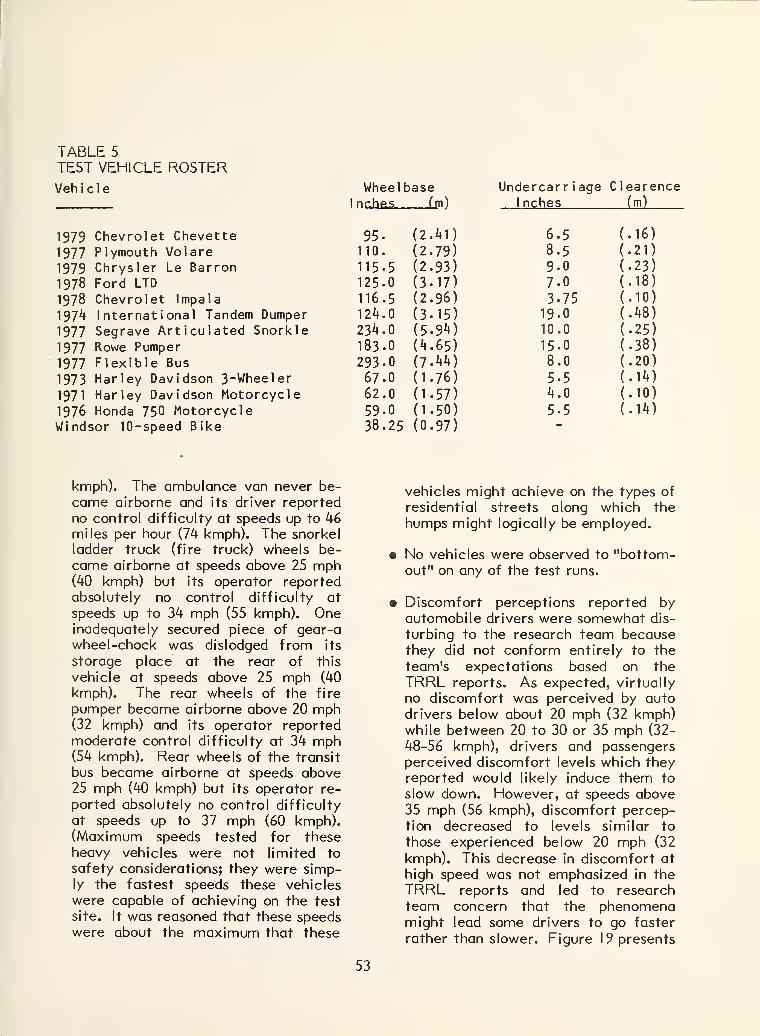
TABLE 5
TEST VEHICLE ROSTERVehicle
1979 Chevrolet Chevette
1977 Plymouth Volare
1979 Chrysler Le Barron
1978 Ford LTD
1978 Chevrolet Impala
1974 International Tandem Dumper
1977 Segrave Articulated Snorkle
1977 Rowe Pumper
1977 Flexible Bus
1973 Harley Davidson 3-Wheeler
1971 Harley Davidson Motorcycle
1976 Honda 750 MotorcycleWindsor 10-speed Bike
Wheel base Undercarriage C 1 earencenr.hes Cm) 1 nches (m)
95. (2.41) 6.5 < .16)
110. (2.79) 8.5 1 .21)
115.5 (2.93) 9-0 1'.23)
125.0 (3.17) 7.0 1 .18)
116.5 (2.96) 3.75 1'.10)
124.0 (3.15) 19.0 I'.48)
23^.0 (5-94) 10.0 I:.25)
183.0 (4.65) 15-0 I:-38)
293.0 (7.44) 8.0 [.20)
67.0 (1.76) 5-5 <[.14)
62.0 (1.57) 4.0 [.10)
59-0 (1.50) 5-5 [.14)
38.25 (0.97) -
kmph). The ambulance van never be-came airborne and its driver reported
no control difficulty at speeds up to 46miles per hour (74 kmph). The snorkel
ladder truck (fire truck) wheels be-
came airborne at speeds above 25 mph(40 kmph) but its operator reportedabsolutely no control difficulty at
speeds up to 34 mph (55 kmph). Oneinadequately secured piece of gear-awheel-chock was dislodged from its
storage place at the rear of this
vehicle at speeds above 25 mph (40
kmph). The rear wheels of the fire
pumper became airborne above 20 mph(32 kmph) and its operator reportedmoderate control difficulty at 34 mph(54 kmph). Rear wheels of the transit
bus became airborne at speeds above25 mph (40 kmph) but its operator re-
ported absolutely no control difficulty
at speeds up to 37 mph (60 kmph).(Maximum speeds tested for these
heavy vehicles were not limited to
safety considerations; they were simp-ly the fastest speeds these vehicles
were capable of achieving on the test
site. It was reasoned that these speedswere about the maximum that these
vehicles might achieve on the types of
residential streets along which the
humps might logically be employed.
• No vehicles were observed to "bottom-out" on any of the test runs.
• Discomfort perceptions reported byautomobile drivers were somewhat dis-
turbing to the research team becausethey did not conform entirely to the
team's expectations based on the
TRRL reports. As expected, virtually
no discomfort was perceived by autodrivers below about 20 mph (32 kmph)while between 20 to 30 or 35 mph (32-
48-56 kmph), drivers and passengersperceived discomfort levels which theyreported would likely induce them to
slow down. However, at speeds above35 mph (56 kmph), discomfort percep-tion decreased to levels similar to
those experienced below 20 mph (32
kmph). This decrease in discomfort at
high speed was not emphasized in theTRRL reports and led to research
team concern that the phenomenamight lead some drivers to go faster
rather than slower. Figure 1 9 presents
53
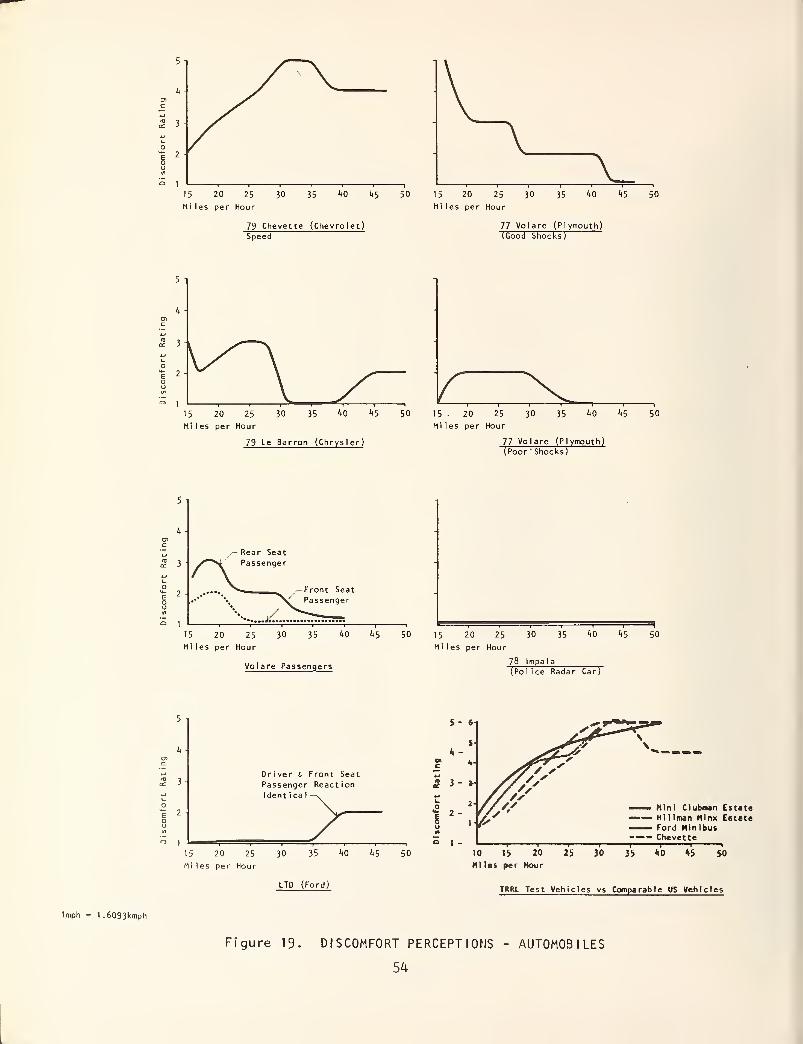
15 20 25
Miles per Hour
145 50
73 Chevette (Chevrolet)Speed
\15 20 25
Miles per Hour
30 35 '•O *45 50
77 Volare (Plymouth)(Good Shocks)
5 i
X. i
2 -
Q1
k:15 20 25 30 35 'tO *t5 50 15 20 25
Miles per Hour Miles per Hour
79 Le Barron (Chrysler)
30 35 hO hS 50
77 Volare (Plymouth)(Poor "Shocks)
2 -
/- Rear Seat/^"*\ Passenger
— Front Seat
^X Passenger
15 20 25 30 35 'tO kS 50 15 20 25 30 35 <t0 *t5 50
Miles per Hour Miles per Hour
Volare Passengers78 Impala
(Po I ice Radar Car)
Driver & Front Seat
Passenger ReactionIdent i ca
I
15 20 25
Miles per Hour
30 35 *t0 hS 50
LTD (Ford)
Imph - 1.6093kmph
1-
——. Mini Clubman Estate—— Hillman Minx Estate—— Ford Minibus— Chevette
10 15 20
Ml les per Hour
25 30 35 *0 *5 50
TRRL Test Vehicles vs Comparable US Vehicles
Figure 19. DISCOMFORT PERCEPTIONS - AUTOMOBILES
54
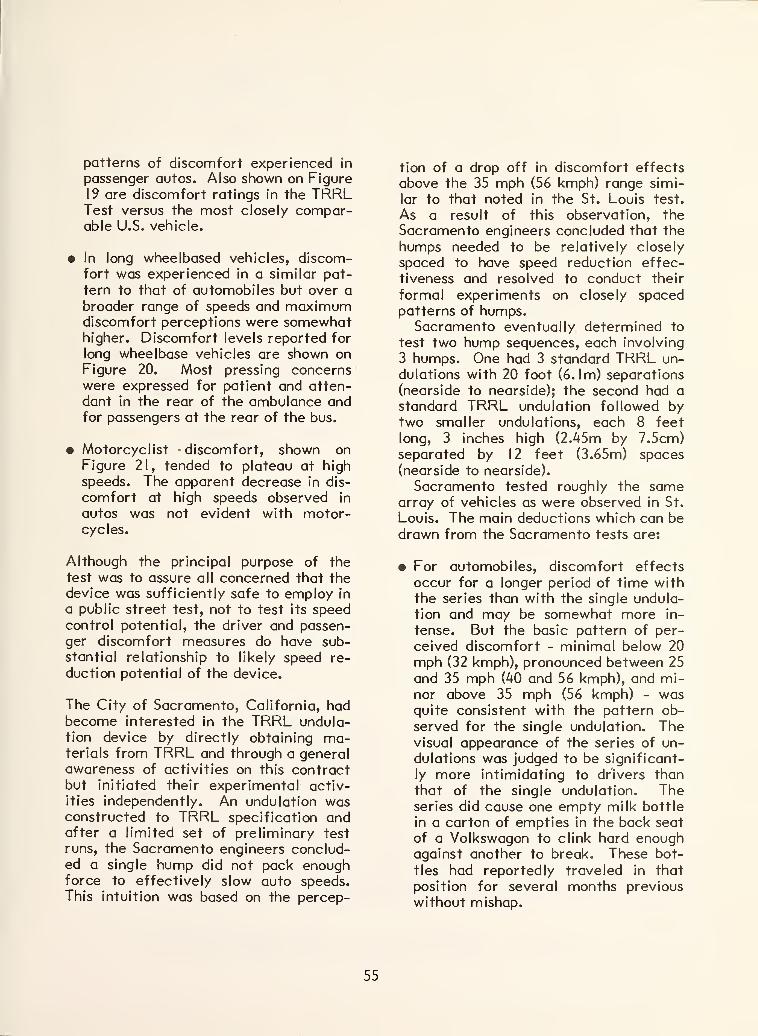
patterns of discomfort experienced in
passenger autos. Also shown on Figure
19 are discomfort ratings in the TRRLTest versus the most closely compar-able U.S. vehicle.
• In long wheelbased vehicles, discom-fort was experienced in a similar pat-
tern to that of automobiles but over a
broader range of speeds and maximumdiscomfort perceptions were somewhathigher. Discomfort levels reported for
long wheelbase vehicles are shown onFigure 20. Most pressing concernswere expressed for patient and atten-
dant in the rear of the ambulance andfor passengers at the rear of the bus.
• Motorcyclist -discomfort, shown onFigure 21, tended to plateau at high
speeds. The apparent decrease in dis-
comfort at high speeds observed in
autos was not evident with motor-cycles.
Although the principal purpose of the
test was to assure all concerned that thedevice was sufficiently safe to employ in
a public street test, not to test its speedcontrol potential, the driver and passen-ger discomfort measures do have sub-stantial relationship to likely speed re-
duction potential of the device.
The City of Sacramento, California, hadbecome interested in the TRRL undula-tion device by directly obtaining ma-terials from TRRL and through a generalawareness of activities on this contractbut initiated their experimental activ-
ities independently. An undulation wasconstructed to TRRL specification andafter a limited set of preliminary test
runs, the Sacramento engineers conclud-ed a single hump did not pack enoughforce to effectively slow auto speeds.This intuition was based on the percep-
tion of a drop off in discomfort effects
above the 35 mph (56 kmph) range simi-
lar to that noted in the St. Louis test.
As a result of this observation, the
Sacramento engineers concluded that the
humps needed to be relatively closely
spaced to have speed reduction effec-
tiveness and resolved to conduct their
formal experiments on closely spacedpatterns of humps.
Sacramento eventually determined to
test two hump sequences, each involving
3 humps. One had 3 standard TRRL un-
dulations with 20 foot (6.1m) separations
(nearside to nearside); the second had astandard TRRL undulation followed bytwo smaller undulations, each 8 feet
long, 3 inches high (2.45m by 7.5cm)separated by 12 feet (3.65m) spaces
(nearside to nearside).
Sacramento tested roughly the samearray of vehicles as were observed in St.
Louis. The main deductions which can be
drawn from the Sacramento tests are:
• For automobiles, discomfort effects
occur for a longer period of time withthe series than with the single undula-tion and may be somewhat more in-
tense. But the basic pattern of per-
ceived discomfort - minimal below 20
mph (32 kmph), pronounced between 25
and 35 mph (40 and 56 kmph), and mi-nor above 35 mph (56 kmph) - wasquite consistent with the pattern ob-
served for the single undulation. Thevisual appearance of the series of un-
dulations was judged to be significant-
ly more intimidating to drivers than
that of the single undulation. Theseries did cause one empty milk bottle
in a carton of empties in the back seat
of a Volkswagon to clink hard enoughagainst another to break. These bot-
tles had reportedly traveled in that
position for several months previous
without mishap.
55
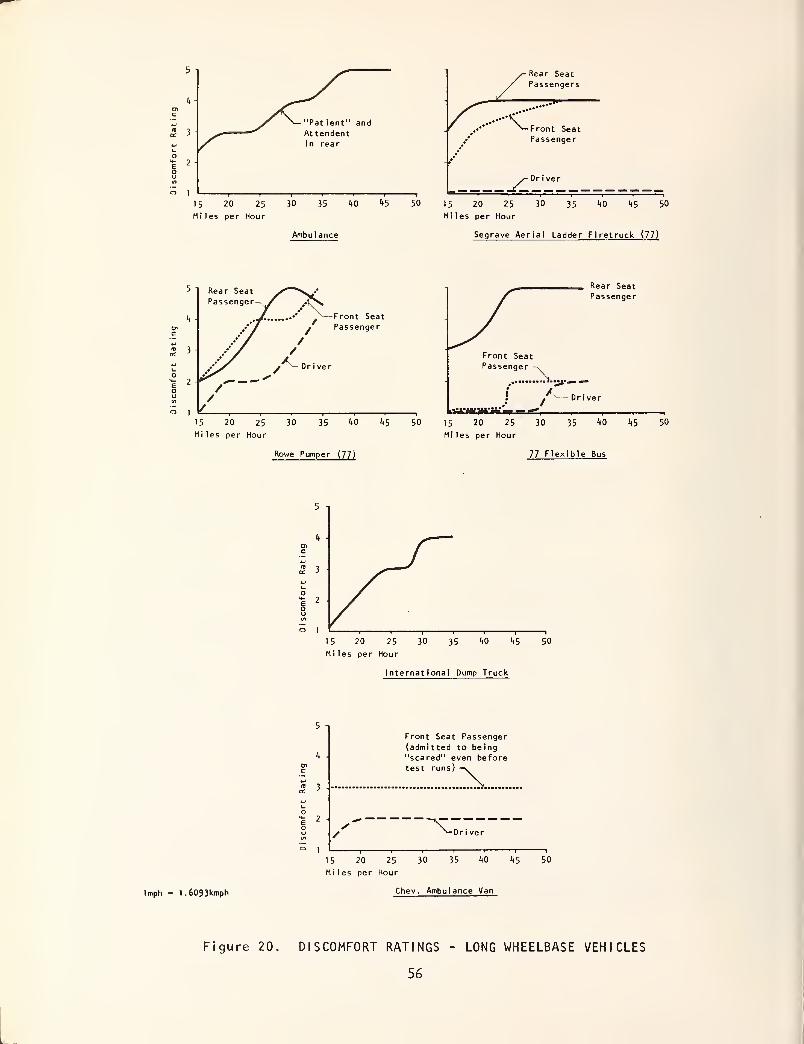
3-
2 -
=> 1
"Pat ient" andAt tendentin rear
•Rear SeatPassengers
...!
c_.•* >— Front Seat
Passenger
Or i ver
15 20 25 30 35 <t0 *t5 50 15 20 25 30 35 'tO *»5 50
Miles per Hour
Ambul ance
Miles per Hour
Segrave Aerial Ladder Firetruck (77)
5 Rear Seat
Passenger - ' A>14- .«
OPc // * Passenger~
.* / /rr i / / /
/^r /^ Dr i verO
? - &/ ^- —
—
SO /O /O 1
/
__ Roar SpatPassenger
Front SeatPassenger -.
/.^i-mpi-ii; _p — -*
Driver
15 20 25 30 35 ^0 1)5 50 15 20 25 30 35 '•O kS 50
Miles per Hour Miles per Hour
Rowe Pumper (77) 77 Flexible Bus
3 1
Internat ional Dump Truck
lmph - 1.6093kmph
ft -
5 3
t 2
o
Front Seat Passenger(admitted to being"scared" even beforetest runs) -\
Dr i ver
15 20 25 30 35 hO 1»5
Miles per Hour
Chev. Ambulance Van
50
Figure 20. DISCOMFORT RATINGS - LONG WHEELBASE VEHICLES
56
5n
4-
J2 -
<=> 1
15 20 25 30
Mi les per Hour
35 40 45
Harley Davidson Motorcycle(Pol ice 3-Wheeler)
50 15 20 25
Mi les per Hour
30 35 40 45
Harley Davidson Motorcycle(Pol ice Cycle)
50
1mph = 1 .6093kmph15 20 25
Mi les per Hour
Figure 21. DISCOMFORT RATING - MOTORCYCLES
57
• Bicyclists and motorcyclists appearedable to handle the series well and the
series appeared not to have effects
significantly different from those of
the single undulation.
• Effects on long wheelbase vehicles
were similar to those observed in the
St. Louis test of the single hump, withthe multiple hump appearing to accen-tuate the effects somewhat.
• One vehicle utilized in the Sacramentotests which was not tried in St. Louis
was a garbage truck. The researchteam's observer rode the rear foot-
boards of the vehicle and was satisfied
that this position was "safe" at speedstypical of collection operations during
which personnel ride in this exterior
position. But at speeds above 25 mph(40 kmph), the observer judged it un-safe to remain in the exterior position.
Interpretation of Results
The fundamental purpose of these closed- site tests was to assure that the humpswere safe enough to use in a public
street case study. The St. Louis andSacramento work satisfied the researchteam that the humps were sufficiently
safe to undertake public street casestudies of them. It was concluded that
any difficulties they posed were no worsethat those caused by potholes, excava-tion patches and other irregularities in
pavement occasionally encountered onnormal roadways. It was further con-cluded that careful site selection, humpmarkings and instruction of emergencyvehicle drivers would also help precludeany substantial difficulties involving long
wheelbase vehicles.
But the tests, in particular, the de-creased perception of discomfort in
autos at high speeds, raised considerable
doubt as to whether the humps would be
effective in controlling speeds.
The reseachers first satisfied them-selves that the test humps were accuratereproductions of the TRRL shape. Re-garding whether the differences in dis-
comfort observations were the result of
differences in suspension characteristics
and wheelbase of U.S. and British auto-
mobiles, it was concluded that wheelbaseand suspension differences were a factor
but not a fundamental explanatory one.
The U.S. tests had included vehicles
similar to the TRRL work. Suspension
stiffness and wheelbase differences a-
mong autos appeared to affect details
rather than the fundamental shape of the
discomfort curve. With stiffer suspen-
sions and shorter wheelbases, the dropoff
in discomfort perception appears to oc-
cur at slightly higher speeds than for
vehicles with "mushy" suspensions andlonger wheelbases.
Finally, the original TRRL experimen-tal data and reports were re-examined.
It was found that many more runs above30 mph (48 kmph) were made in the U.S.
tests than in the TRRL work. It wasconcluded that as a result of the con-
centration on high speed runs, the St.
Louis and Sacramento tests had identi-
fied a phenomena not noted in the British
test work.Still the question remained, would the
humps be effective in slowing traffic on
U.S. residential streets? It was conclud-
ed that this could only truly be answeredby performance in U.S. public street case
studies. Rationalization leading to this
conclusions was as follows:
• The results of the TRRL public street
applications are a far more valid indi-
cator of how the public will react to
the humps than are the impressions of
drivers in a controlled-site test. Theafter-the-fact impressions of a test
driver who drove over the humps at a
58
pre-specified high rate of speed in a
fleet vehicle do not necessarily cor-
relate with how fast members of the
general public will choose to go overthe humps in their own cars.*
Substantial speed reductions were un-
questionably achieved in the TRRLpublic road tests. The vehicle mix in
these applications doubtless included a
substantial percentage of vehicles with
wheelbase and suspension systemscharacteristic of those in use in the
U.S.
The humps look ominous to drivers andthe discomfort experienced at moder-ate speeds is* not likely to tempt mem-bers of the general public to attempt a
faster pass on their own. Strategic
placement of the first hump close
enough to the "entry" to the speed
control section that vehicles will not
have had the opportunity to accelerate
to speeds above the maximum discom-fort range can limit the opportunity of
the public to learn they can minimizediscomfort by going very fast.
THE BREA CASE STUDY
The City of Brea, California became the
site of the project's first U.S. public
street case study application. Brea is anupper middle class suburban communityin north-central Orange County. Thecity's Manager had previously observedthe TRRL undulations in Great Britain
and, learning of this FHWA research pro-
gram, had volunteered the City as a test
site.
The Site
Four streets where resident complaints
about speed had been substantiated byradar studies were offered as potential
case study streets. Of these, La Canada,which happended to have the most exten-
sive record of resident complaints aboutspeed, was selected. The primary factor
in selection of La Canada was that it wasrelatively flat while the other complaintsall had fairly substantial grades. In this
first public street case study, it was felt
prudent to confine the application to a
reasonable level segment. A secondaryfactor was that prior studies by the City
showed that it did indeed have a speeding
problem — 85th percentile speed 38 mph(61 kmph) and many vehicles in the high -
40's range (64 kmph) on a 25 mph (40
kmph) speed limit street.
The test segment on La Canada is a
quarter-mile local residential street set
in a semi-grid network (generally recti-
linear layout but some links of grid mis-
sing and some curvilinear elements in-
cluded). La Canada is approximately 39
feet (12m) wide curb to curb with onetravel lane in each direction and parking
permitted and moderately utilized onboth sides. There are sidewalks on both
sides of the streets. Few pedestrians are
ever observed but bicyclists are not un-
usual. Horizontal alignment on the en-
* This is a point which has not been properly considered in other tests of speedbumps. Anyone who has ever observed members of the general public crossing aconventional speed bump must seriously question the conclusion of the previously
cited San Jose (21) research that bumps are "ineffective" because discomfortdecreases with speed. Rare is the driver who chooses to go fast enough to takeadvantage of this.
21. Walsh, L.B., Op. Cit., See Reference I
59
tire proposed test section is straight
though the approaches to it are right
angle curves. The quarter mile test seg-
ment has a continuous slope from north
to south of less than I percent. Theapproach curve at the north end has a
considerably steeper slope toward the
test segment, probably contributing to
the observed speeding problem by acce-lerating vehicles into the test section.
The only cross street intersection in the
test segment is a T with a short low-
volume residential street (La Serna).
This intersection is located immediatelysouth of the north limit of the test sec-
tion. A general vicinity map of the test
site is presented on Figure 22. Generalpositioning of the humps is also indicat-
ed.
La Canada does not have any particular
significance as a fire or emergency ve-hicle route except for local access. It
does not affect any fixed route public
transit services. No outstanding con-
straint conditions prejudicial to desig-
nation of La Canada as a test site werenoted in the field review.
Abutting land use along La Canada andthe neighboring streets is uniformly sin-
gle family residential. Residences along
La Canada are well appointed upper mid-dle class homes, detached and generouslyset back from the street. Most wereconstructed about 15 years ago and manyof the residents are original or long termoccupants.
When homes on the test segment wereconstructed, La Canada was a cul-de-sac
terminating at the north end of the cur-
rent test segment. Subsequently, as de-velopment proceeded in the area to the
north La Canada was extended. It is re-
sidents of the several streets in this later
constructed "north area" rather than
"through" travelers who comprise the
"speeders" on La Canada.
Case Study Procedure
"Before" data measures were conductedin late October and early November,1979. Simultaneously, through a survey
and public meeting the City assured that
resident concern about speeding wasbroadbased (rather than limited to a fewgadflies) and that there was no strong
opposition to the conduct of the test
programs. Humps were installed in mid-November 1979 and first encounter re-
actions were monitored on the day-of
and two days immediately following in-
stallation. Subsequent observations of
traffic reactions were conducted three
months and seven months after installa-
tion. Seven months after installation,
the City surveyed test segment residents
and residents of the area to the north
who experienced the humps as drivers.
Installation
Three humps, constructed of hot rolled
asphalt, were installed on La Canada on
a single morning, (November 15, 1980) by
City of Brea Public Works crews at a to-
tal cost (labor and materials) of about
$1,800. It was initially intended to sim-
ply overlay the existing pavement except
for the last 1.5 feet (46cm) on each edge
where excavation to the base was plan-
ned. This was to assure minimum over-
lay thickness at the edges, thereby pre-
venting ravelling of the asphalt. How-ever, Brea's street maintenance super-
intendent elected to excavate to the
base course over the entire hump instal-
lation. While this requires a bit morematerial and effort, it probably results in
a more satisfactory installation wherehumps are to remain as a permanent fea-
ture. Figure 23 presents photos illus-
trating the installation of the humps.
The asphalt was hand laid and hot-rolled
to shape. A 2 x 12 timber inscribed with
the undulation shape was used as a tem-plate and was also useful as a pushing
blade in spreading the asphalt. The
60
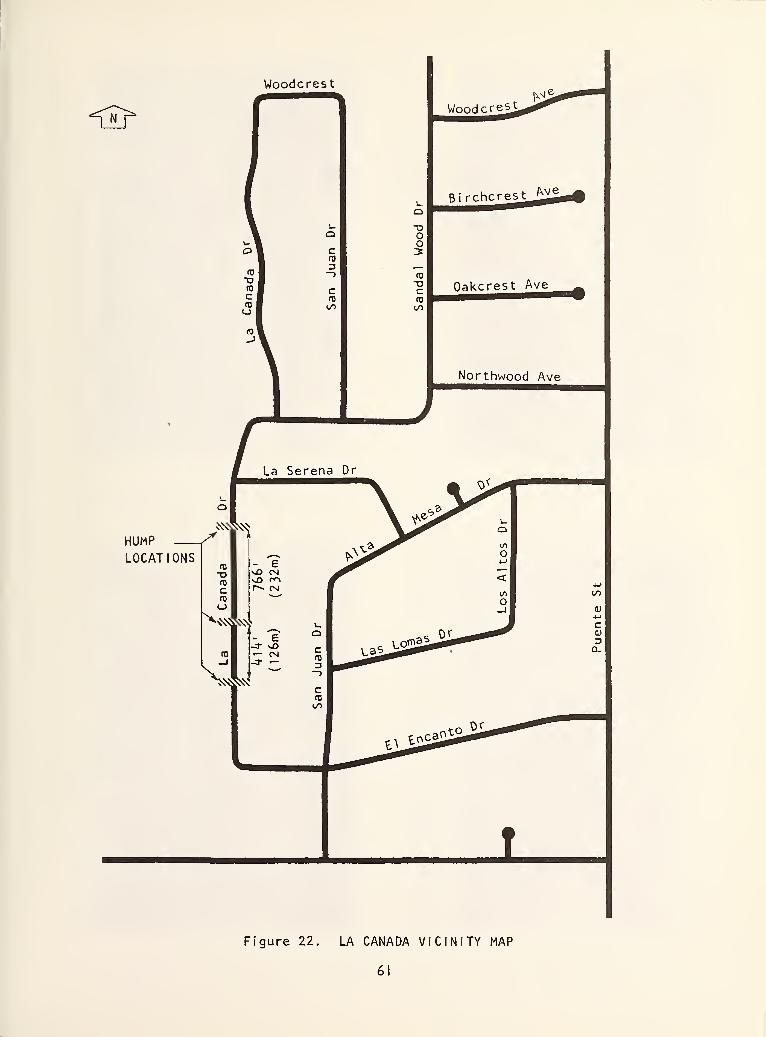
Woodcrest
HUMP <*
LOCATIONS
Figure 22. LA CANADA VICINITY MAP
61
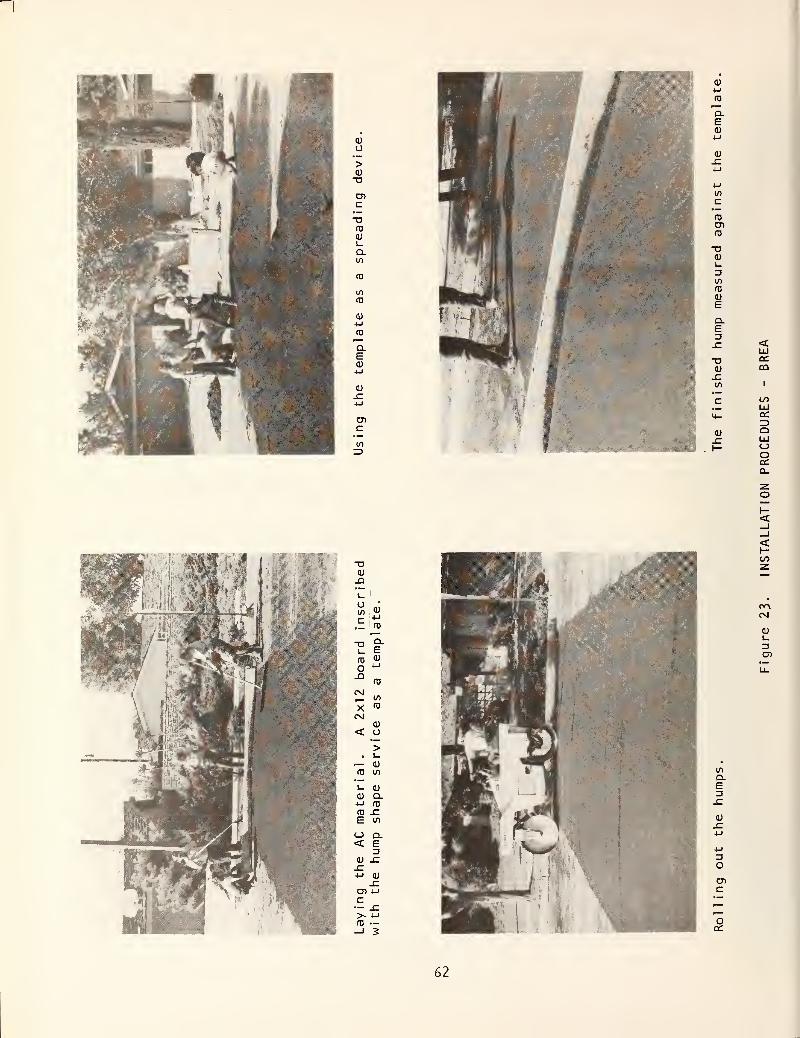
O
>
-o
enc
-o(0
OJl_
D.in
nj
in
«3
<D4->
03
Q_E0)
CDC
ID
fO
c
roen03
o4)i_
=>
in
05
0)
E
Q.E3
a:OQ
QUJOoa:a.
13a>
-QIM1_
oin a)
c 4-J
OJr—
"O
O ^
CNI
a)< o
— Q)
ID in
i_ <u
CU Q.4-1 fD
03 -CE in
O D.< E
ZJ
sz4-i a)
.cen 4-j
c— .c>• 4->
<TJ —-i 2
a.E
4-1
cnc
o
z
CM
cn
62
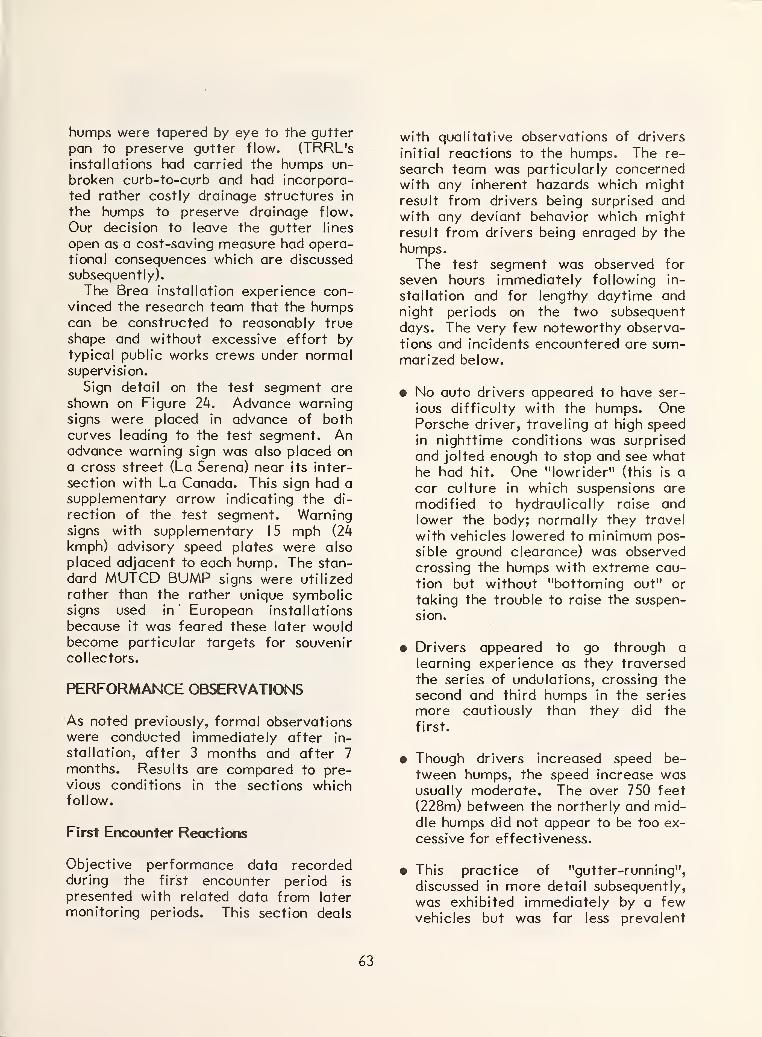
humps were tapered by eye to the gutter
pan to preserve gutter flow. (TRRL'sinstallations had carried the humps un-
broken curb-to-curb and had incorpora-
ted rather costly drainage structures in
the humps to preserve drainage flow.
Our decision to leave the gutter lines
open as a cost-saving measure had opera-tional consequences which are discussedsubsequently).
The Brea installation experience con-vinced the research team that the humpscan be constructed to reasonably true
shape and without excessive effort bytypical public works crews under normalsupervision.
Sign detail on the test segment are
shown on Figure 24. Advance warningsigns were placed in advance of both
curves leading to the test segment. Anadvance warning sign was also placed ona cross street (La Serena) near its inter-
section with La Canada. This sign had asupplementary arrow indicating the di-
rection of the test segment. Warningsigns with supplementary 15 mph (24
kmph) advisory speed plates were also
placed adjacent to each hump. The stan-
dard MUTCD BUMP signs were utilized
rather than the rather unique symbolicsigns used in European installations
because it was feared these later wouldbecome particular targets for souvenircollectors.
PERFORMANCE OBSERVATIONS
As noted previously, formal observationswere conducted immediately after in-
stallation, after 3 months and after 7
months. Results are compared to pre-vious conditions in the sections whichfollow.
First Encounter Reactions
Objective performance data recordedduring the first encounter period is
presented with related data from later
monitoring periods. This section deals
with qualitative observations of drivers
initial reactions to the humps. The re-
search team was particularly concernedwith any inherent hazards which mightresult from drivers being surprised andwith any deviant behavior which mightresult from drivers being enraged by the
humps.The test segment was observed for
seven hours immediately following in-
stallation and for lengthy daytime andnight periods on the two subsequentdays. The very few noteworthy observa-
tions and incidents encountered are sum-marized below.
• No auto drivers appeared to have ser-
ious difficulty with the humps. OnePorsche driver, traveling at high speedin nighttime conditions was surprised
and jolted enough to stop and see whathe had hit. One "lowrider" (this is a
car culture in which suspensions are
modified to hydraulically raise andlower the body; normally they travel
with vehicles lowered to minimum pos-
sible ground clearance) was observedcrossing the humps with extreme cau-
tion but without "bottoming out" or
taking the trouble to raise the suspen-
sion.
• Drivers appeared to go through a
learning experience as they traversed
the series of undulations, crossing thesecond and third humps in the series
more cautiously than they did the
first.
• Though drivers increased speed be-
tween humps, the speed increase wasusually moderate. The over 750 feet
(228m) between the northerly and mid-dle humps did not appear to be too ex-
cessive for effectiveness.
• This practice of "gutter-running",
discussed in more detail subsequently,
was exhibited immediately by a fewvehicles but was far less prevalent
63
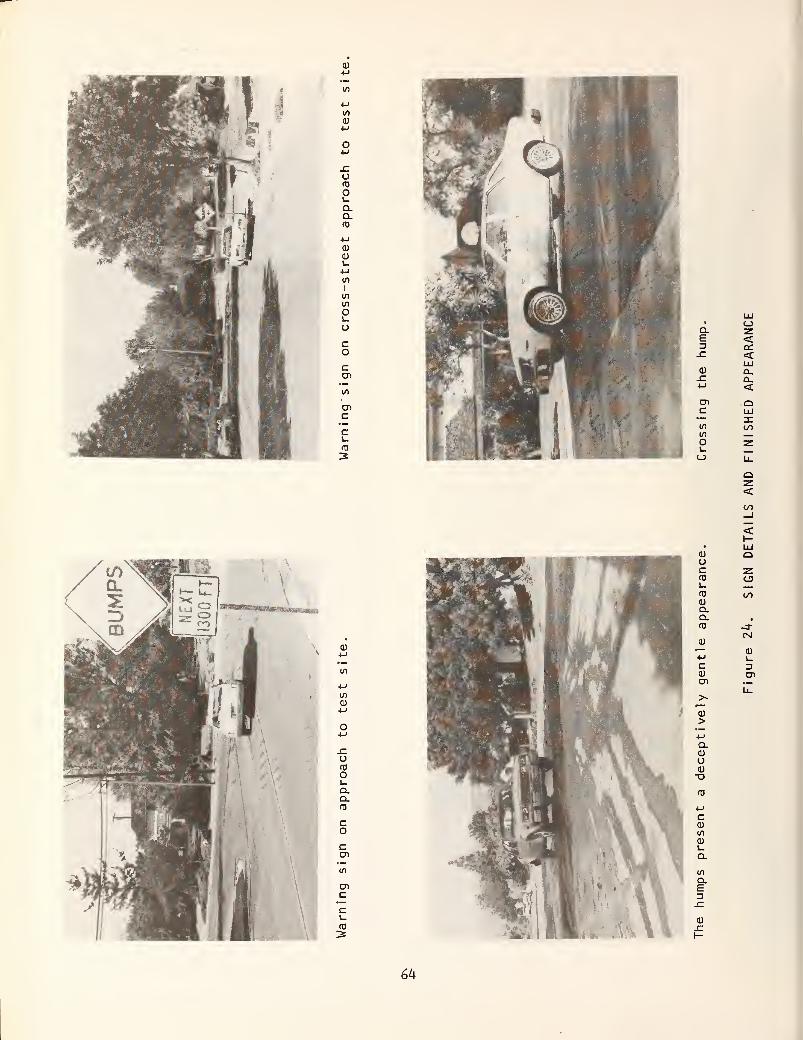
4-J
a)
OMx:ofD
o1_
D.Q.
(/>
Ol_
o
coccn
enc
'C1_
OJ
3
Q. zE <3 o;x: <
LU<u Q_x: D_4-1 <cn Qc LU
•
—
n:in COV) MMO z!_
CJ> L_
Qz<
""•»"•••... >^... .^,
ofD
o1_
Q.D.<TJ
COcCn
cnc
c:i_
<u Qoc Zm o1_
fD CO<DQ.Q. .
fO -3-
CMa)—
<D+-j 1_
c 3<u COcn
Li_
i—(U
>
•Ma.<uo<D"O
05
4-1
c(D
m<ui_
CL
LO
a.Eux
64
than it became subsequently. Even in
the first encounter period the numberof gutter-runners, who appeared to doso out of caution, was nearly equal to
those who ran the gutter to ease their
attempt to drive faster.
• Teenage bicyclists were observed to
use the humps in performing wheel-stands. However, they were observedperforming wheelstands as frequentlyon level sections of the test roadway.One particularly skillful one demon-strated the ability to ride the entire
quarter-mile length of the test seg-
ment in a continuous wheelstand.
• The driver of a large single unit truck
carrying bottle spring water apparent-ly missed the warning signs or didn't
believe them and hit the first hump at
about 25 mph (40 kmph). This dislod-
ged one of the water flasks from the
rear and it burst on the pavement. Toobservers the driver appeared to bechagrined and accepted the incident as
his own fault.
In the judgment of the research team,none of the incidents or deviant behaviorobserved in the first encounter periodindicated unacceptably hazardous condi-tions. But the observations point up the
need for installing adequate signing andmarkings immediately-before the hump-ed section is opened to traffic following
construction.
Traffic Volume
Twenty four hour traffic volume countson test area streets were machine re-
corded six weeks before and threemonths after the humps were installed onLaCanada. The counts on LaCanada andthe three alternative access routes to
the neighborhood LaCanada serves weretaken simultaneously for three midweekdays in each counting period. No inter-
vening events (such as construction
blockages, traffic control changes or
other conditions) to which volume chan-ges might be attributed actually occur-red. The entire change in traffic volumepattern is attributed to the presence of
the humps on LaCanada.
Figure 25 presents count locations, be-fore and after volumes recorded and net
volume changes. The pattern of traffic
reduction on LaCanada (a decrease of
about 22 percent of the "before" traffic)
and corresponding increases on the twomost convenient alternative accessroutes is consistent with the pattern of
change which reasonably might havebeen expected to result from the humpsinstallation. It is also consistent with
responses of residents of the "uphill"
areas regarding avoidance of the test
section and with the perceptions of test
segment residents regarding changes in
traffic volume on their street.
Traffic Speed
Traffic speed profiles on the test section
and its approaches were observed by ra-
dar six weeks before installation, imme-diately after installation (on the dayinstallation was completed and on the
following day), three months after andseven months after. Each vehicle wasradar tracked through the entire test
section and speeds were recorded at eachhump, the midpoints between humps, the
ends of the test straightaway and the
midpoints between ends and the nearesthumps. Separate comparisons of the
northbound and southbound speed dataare presented on Figures 26 and 27.
Principal conclusions which can be drawnfrom these data include:
• All "after" periods show substantial
reductions in speeds from those obser-
ved in the "before" period at all levels
of comparison - mean speed, 85th per-
centile speed and speed of fastest ve-hicle observed. Mean speed was re-
65
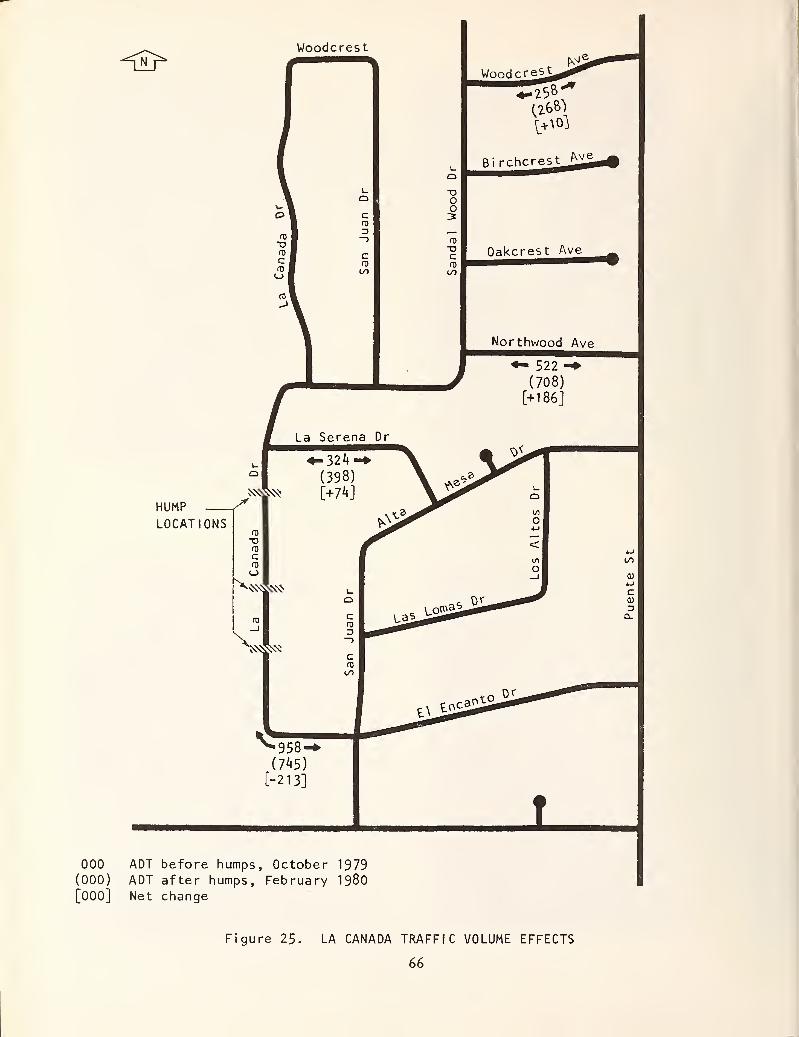
<N>Woodcrest
1_
ok l_ X)i
° oo
c 31 1>
Z> _->
OJ
"O1 c c1 rc 03
I/)
Mi6-
Woodc res_L
(268)
Oakcrest Ave
Northwood Ave
- 522
(708)
[+186J
La Serena Dr
o
HUMP
LOCATIONS
XW
\;
[-213]
O tnca^to Or
1000 ADT before humps, October 1979(000) ADT after humps, February 1980
[000] Net change
Figure 25. LA CANADA TRAFFIC VOLUME EFFECTS
66
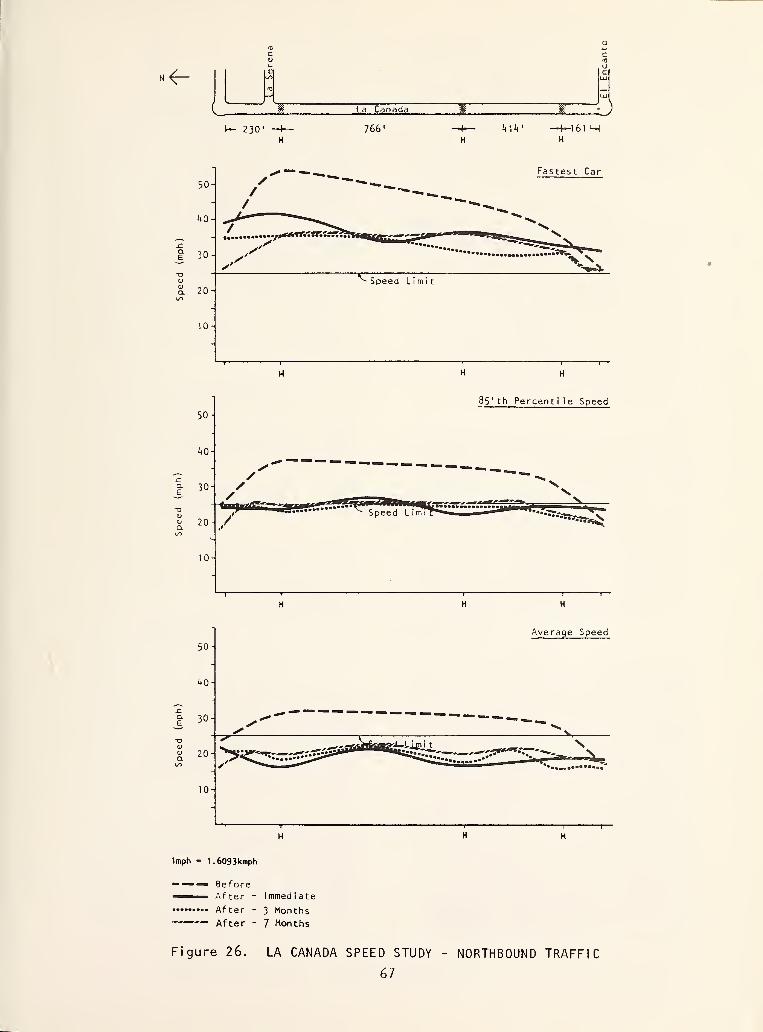
»<-
230'
La Canada
766' 4lV -f—161 H
50-
i(0
30-
Fastest Car
t:20-
10-
Speed Limit
50
kO
30
D 20-
•
^T"^**^
8 5' th Percentile Speed
M"* •«••"•BOB *»-l»8rf^—P*—^*W-^M
50
AO
30
SI 20
10
Average Speed
Imph - 1.609 3kmph
——^ Before—
—
After - Immediate
After -3 Months
— — After -7 Months
Figure 26. LA CANADA SPEED STUDY
67
NORTHBOUND TRAFFIC
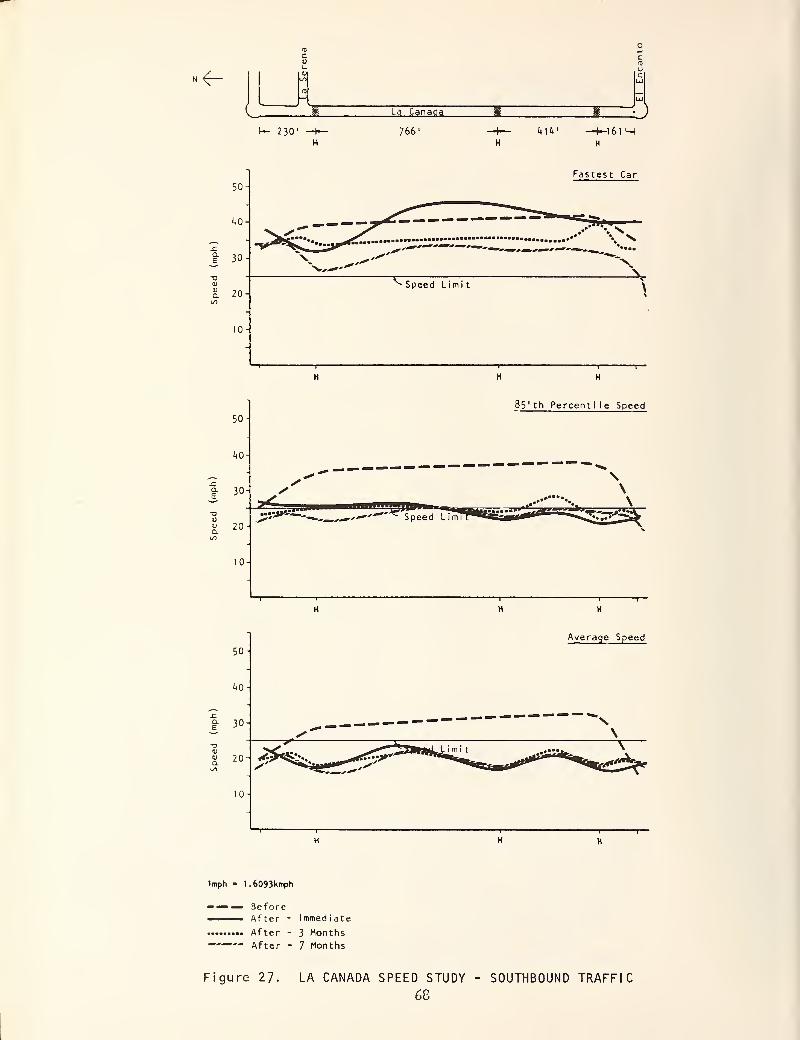
»<-
c230'
La Canada
766' <tlV
1 J-+-161 M
Fastest Car
50-
i+0-i
30- x"-^ ^'''~ ~"'
""***"*~C"
20-^ Speed Limit \
10-
5' th Percent i 1 e Speed
50-
v 20-
Average Speed
50-
c
l»0-
30-
20-
£ S^ \
Q. & Wsdfciii'™'
'
10-
Imph - 1.6093kmph
— •— «> Before—
—
After - Immediate
After - 3 Months— After - 7 Months
Figure 27. LA CANADA SPEED STUDY
68
- SOUTHBOUND TRAFFIC
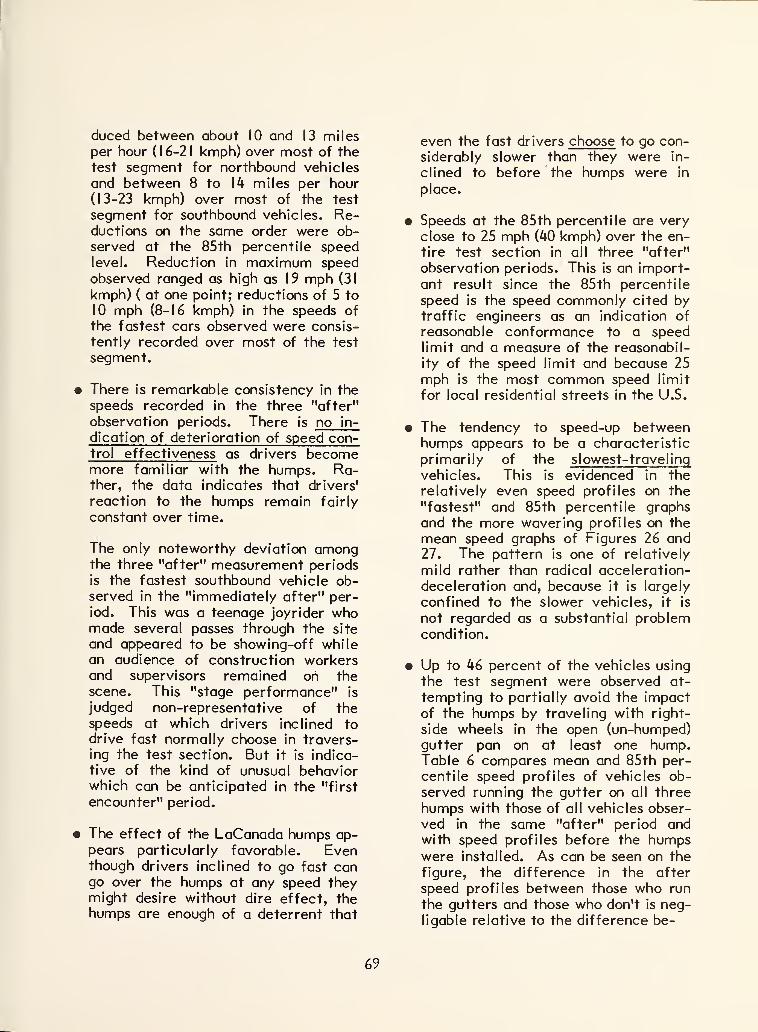
duced between about 10 and 13 miles
per hour ( 1 6-2 1 kmph) over most of the
test segment for northbound vehicles
and between 8 to 14 miles per hour(13-23 kmph) over most of the test
segment for southbound vehicles. Re-ductions on the same order were ob-served at the 85th percentile speedlevel. Reduction in maximum speedobserved ranged as high as 19 mph (31
kmph) ( at one point; reductions of 5 to
10 mph (8-16 kmph) in the speeds of
the fastest cars observed were consis-
tently recorded over most of the test
segment.
• There is remarkable consistency in the
speeds recorded in the three "after 11
observation periods. There is no in-
dication of deterioration of speed con-trol effectiveness as drivers becomemore familiar with the humps. Ra-ther, the data indicates that drivers'
reaction to the humps remain fairly
constant over time.
The only noteworthy deviation amongthe three "after" measurement periodsis the fastest southbound vehicle ob-served in the "immediately after" per-
iod. This was a teenage joyrider whomade several passes through the site
and appeared to be showing-off whilean audience of construction workersand supervisors remained on the
scene. This "stage performance" is
judged non-representative of thespeeds at which drivers inclined todrive fast normally choose in travers-ing the test section. But it is indica-tive of the kind of unusual behaviorwhich can be anticipated in the "first
encounter" period.
• The effect of the LaCanada humps ap-pears particularly favorable. Eventhough drivers inclined to go fast cango over the humps at any speed theymight desire without dire effect, thehumps are enough of a deterrent that
even the fast drivers choose to go con-
siderably slower than they were in-
clined to before the humps were in
place.
• Speeds at the 85th percentile are very
close to 25 mph (40 kmph) over the en-tire test section in all three "after"
observation periods. This is an import-
ant result since the 85th percentile
speed is the speed commonly cited bytraffic engineers as an indication of
reasonable conformance to a speedlimit and a measure of the reasonabil-
ity of the speed limit and because 25
mph is the most common speed limit
for local residential streets in the U.S.
• The tendency to speed-up betweenhumps appears to be a characteristic
primarily of the slowest-traveling
vehicles. This is evidenced in the
relatively even speed profiles on the
"fastest" and 85th percentile graphs
and the more wavering profiles on the
mean speed graphs of Figures 26 and27. The pattern is one of relatively
mild rather than radical acceleration-
deceleration and, because it is largely
confined to the slower vehicles, it is
not regarded as a substantial problemcondition.
• Up to 46 percent of the vehicles using
the test segment were observed at-
tempting to partially avoid the impactof the humps by traveling with right-
side wheels in the open (un-humped)gutter pan on at least one hump.Table 6 compares mean and 85th per-
centile speed profiles of vehicles ob-
served running the gutter on all three
humps with those of all vehicles obser-
ved in the same "after" period andwith speed profiles before the humpswere installed. As can be seen on the
figure, the difference in the after
speed profiles between those who run
the gutters and those who don't is neg-ligable relative to the difference be-
69
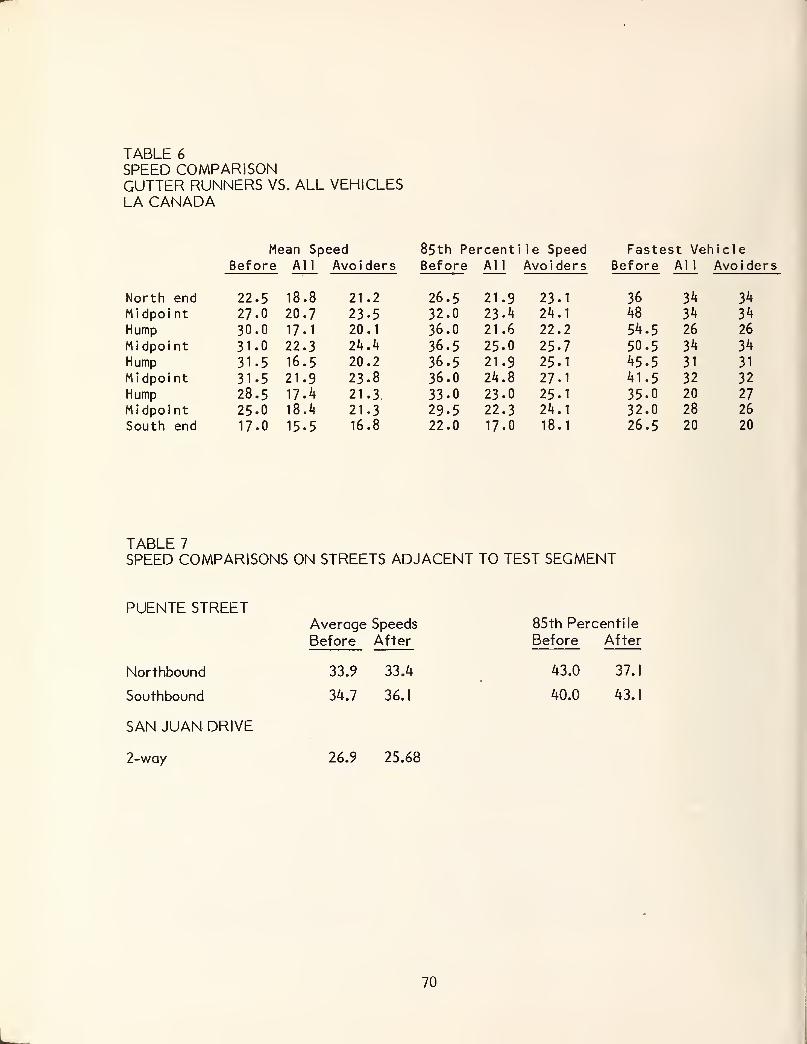
TABLE 6
SPEED COMPARISONGUTTER RUNNERS VS. ALL VEHICLESLA CANADA
North endMidpoi nt
HumpMidpointHumpMidpoi nt
HumpMidpoi nt
South end
Mean Speed 85th Percenti le Speed Fastest Vel"licle
Before All Avoiders Before All Avoiders Before All Avoiders
22.5 18.8 21.2 26.5 21.9 23.1 36 34 34
27.0 20.7 23.5 32.0 23.4 24.1 48 34 34
30.0 17.1 20.1 36.0 21.6 22.2 54.5 26 26
31.0 22.3 24.it 36.5 25.0 25.7 50.5 34 34
31-5 16.5 20.2 36.5 21.9 25.1 45.5 31 31
31.5 21.9 23.8 36.0 24.8 27.1 41.5 32 32
28.5 17.4 21.3 33.0 23.0 25.1 35-0 20 27
25.0 18.4 21.3 29.5 22.3 24.1 32.0 28 26
17.0 15.5 16.8 22.0 17.0 18.1 26.5 20 20
TABLE 7
SPEED COMPARISONS ON STREETS ADJACENT TO TEST SEGMENT
PUENTE STREETAverage Speeds
Before After
85th Percentile
Before After
Northbound 33.9 33.4 43.0 37.
1
Southbound 34.7 36.
1
40.0 43.
1
SAN JUAN DRIVE
2-way 26.9 25.68
70
tween each of these and the "before"
speed profile.
It appears that those who run the gut-
ters do so primarily to avoid some of
the discomfort effects of the humprather than in an attempt to go faster
and that the maneuvering involved in
gutter running causes drivers to pro-
ceed as slowly and cautiously as going
straight over the hump. Despite this
finding, the phenomena of gutter-run-
ning cannot be entirely dismissed. Foreven though gutter-running does not
lead to meaningful increases in speed,
it affects resident perceptions of the
humps performance (see subsequentsection on Resident Perceptions).
Table 7 presents comparisons of speedsobserved on streets most immediatelyparallel to LaCanada before and after
the humps were installed. Based on
this data it does not appear that there
were any meaningful overall speedchange trends in the area which mighthave influencede the LaCanada re-
sults. Futhermore, it does not appearthat traffic diverted by the humps
from LaCanada to these streets hadany meaningful effect on speed pat-
terns on them.
• One of the primary complaints of resi-
dents living near the ends of the test
segment of LaCanada was that ve-
hicles traveled so fast on the twocurves which define the test segmentlimits that noise from squealing tires
was disturbing. Initial attempts weremade to measure directly whether pre-
sence of the humps on the straight-
away influenced speed and tire squeal
on the curves. Because of difficulties*
in making reliable direct measures of
speed on the curves and relating actual
speed to noise, assessment of the
humps effects on speeds on the curves
adjacent to the test segment was lim-
ited to resident perceptions.
Obedience
Stop sign obedience studies were con-
ducted at the El Encanto approach to SanJuan Drive. This stop sign is immediate-ly downstream of the test segment for
vehicles traveling southbound on La
* Because the radar unit was ineffective on the curve, attempts were made to measurespeeds by timing vehicles. However, the total travel distance and time on the curvewas so short that it was somewhat difficult to make sufficiently accurate measures byhand-held stopwatch. For instance, a two mile per hour (3.2 kmph) difference betweenvehicles following the same path on the curve involves only a half-second difference in
travel time. Moreover, vehicles took different paths through the curve with faster
vehicles crossing the centerline to flatten-out the curve and shorten the travel
distrance. At the speeds typically traveled, this short cutting could cause a two to
three mph discrepancy between actual speeds and speeds estimated by timing. Error
introduced by timing inaccurancy and variability of vehicle path appeared to be similar
in magnitude to the changes in curve speeds which may have actually resulted frominstallation of the humps on the straightaways. As a result it was impossible to
distinguish real changes in curve speed from the error inherent in the measurements.It was also observed that actual speed traveled on the curve did not relate very closely
to the noise problem which was of ultimate concern. Slower vehicles which conformedto the centerline markings (hence making a sharp turn) tended to emit tire squeals as
frequently as the faster vehicles which "flattened-out" the curve. For this reason, nofurther attempts were made to conduct accurate measures of curve speeds and the
analysis of the "curve problem" was limited to changes in residents perceptions.
71
Canada. The obedience studies wereconducted to determine whether irrita-
tion with the humps might lead to deter-
ioration in obedience levels at the stop.
Table 8 presents obedience statistics
from one "before" and two "after" mon-itoring periods. Only vehicles unchal-
lenged by cross traffic were recorded so
obedience behavior is entirely volun-
tary. A significant comparison of the
data might lead one to conclude that the
humps had indeed induced a deterioration
in stop sign obedience. However, the sit-
uation is not so clear-cut. Most of the
differences in observations is betweenthe "full stop" and "0-5 mph" (0-8 kmph)categories. The percent of drivers in
these two categories in the three moni-toring periods are all well within the
range of obedience which would be con-sidered normal compliance for an inter-
section of two low volume residential
streets. And there is no meaningfulchange in the percentage of drivers in
the "over 10 mph" (16 kmph) category,the real indicator of flagrant disobed-
ience. There does appear to have beensome change in behavior at the stop -
perhaps the most careful drivers werepredominant among those diverted fromLa Canada by the humps and therefore
are not in the sample of vehicles ob-served at the stop in the "after" per-
iods. But the data and impressions of the
field observers give no evidence or sense
of flagrant violations and deliberate de-fiance of downstream traffic controls re-
sulting from driver frustration with the
humps.
Accident Experience
On any give low-volume, short-length re-
sidential street like La Canada, accidentincidence is usually extremely low andreflects random events rather than re-
curring patterns. Hence, there was little
expectation that in the short test period
the humps would lead to a statistically
significant change in accident exper-
ience. The primary intent of the acci-
dent review was to identify and analyzeany accidents occurring in the test per-
iod directly or inferentially attributable
to presence of the humps. But with re-
spect to accidents, La Canada is not en-
tirely typical of most residential
streets. While the test segment itself
had an undistinguished history - no re-
corded accident in the three years prior
to hump implementation - there was aninteresting pattern of accidents on the
curves which define the limits of the test
segment. In the 3 year period before im-plementation, at least 3 accidents occur-red in which speed developed in the test
segment was a contributory factor. Oneother curve accident stemmed fromspeeding by a vehicle about to enter the
test segment. Residents reported manymore hazardous incidents on the curvesrelated to speed in the test segment -
near misses between vehicles and ve-
hicles spinning out of control but avoid-
ing collision with anything substantial.
Police accident records for the 9 monthsimmediately following hump installation
contain no reports of any accidents onthe test segments of La Canada or its
approaches. This finding provides noreliable statistical basis to assert that
the humps reduced the accident rate onLa Canada or solved the accident prob-
lem on the approach curves. But it is
reassuring that the humps did not pro-
duce any recorded accidents during a
period in which the general driving public
made over 600,000 individual humpcrossings.
Emergency Service Reactions
Brea police report no negative encount-
ers resulting from the undulations on LaCanada. The Brea Fire Department did
not identify any serious problem inci-
dents relating to the humps. Fire offi-
cials note that the humps cause "brief
delays" due to the need to slow down at
72
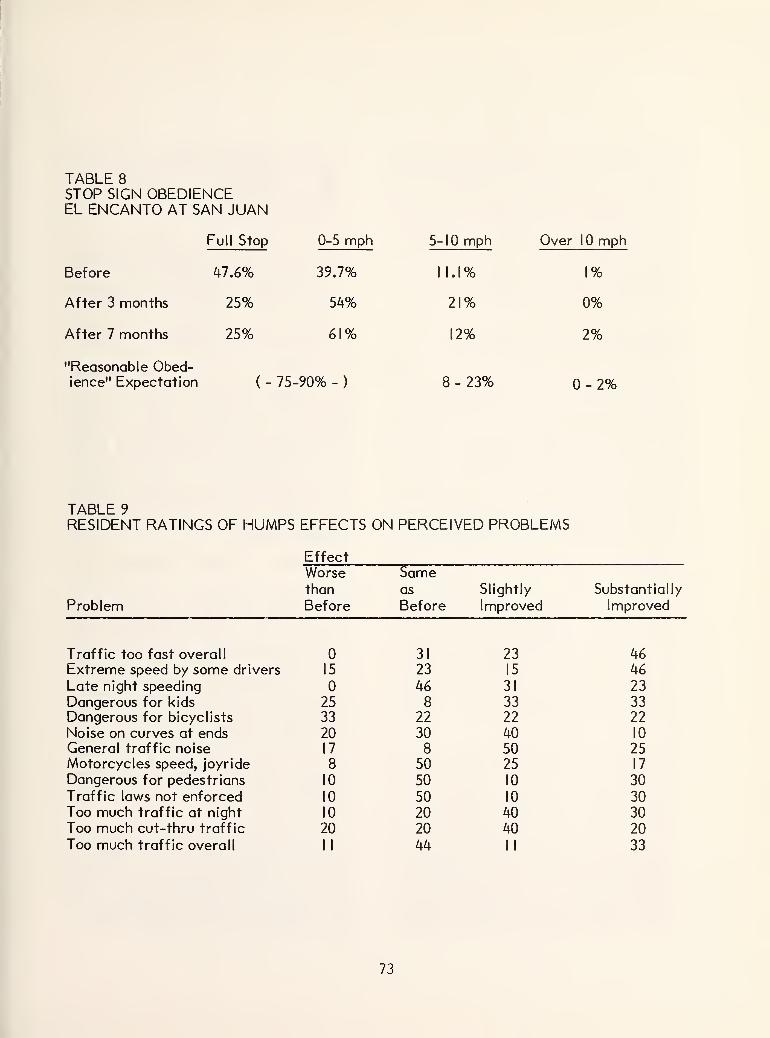
TABLE 8
STOP SIGN OBEDIENCEEL ENCANTO AT SAN JUAN
Full Stop 0-5 mph 5-10 mph Over 10 mph
Before 47.6% 39.7% 11.1% 1%
After 3 months 25% 54% 21% 0%
After 7 months 25% 61% 12% 2%
"Reasonable Obed-ience" Expectation (- 75-90% - ) 8 - 23% 0-2%
TABLE 9
RESIDENT RATINGS OF HUMPS EFFECTS ON PERCEIVED PROBLEMS
Effect
Problem
Worse Samethan as Slightly Substantially
Before Before Improved Improved
31 23 4615 23 15 46
46 31 23
25 8 33 3333 22 22 22
20 30 40 10
17 8 50 258 50 25 17
10 50 10 30
10 50 10 3010 20 40 3020 20 40 20
II 44 II 33
Traffic too fast overall
Extreme speed by some drivers
Late night speedingDangerous for kids
Dangerous for bicyclists
Noise on curves at endsGeneral traffic noise
Motorcycles speed, joyride
Dangerous for pedestrians
Traffic laws not enforcedToo much traffic at night
Too much cut-thru traffic
Too much traffic overall
73
each hump. As a precautionary measure,fire vehicles have slowed to 10 mph (16
kmph) while crossing each hump out of
concern for potential equipment dam-age. They further suggest the humpmarkings should be improved for "better
night visibility" - they are not easy to
identify the first time across and that
only "extreme traffic problems" would bejustification for hump installation.
REACTIONS OF RESIDENTS ANDDRIVERS TO THE HUMPS
Seven months after the humps were in-
stalled, the City of Brea solicited the
opinions of residents as to how effective
the humps were in solving the perceived
problems, what new problems they mayhave created and how they reacted to
the humps as drivers. Four separate
survey instruments were applied, all
using the doorstep-handout, mail-backtechnique, to the following groups:
• Residents of the test segment of LaCanada
• Residents of El Encanto, the contin-
uing street segment linking to the
south end of La Canada. El Encantoresidents are rarely impacted by the
humps as drivers but stand to partially
benefit from the impact of the humpson traffic volume and speed on their
street.
• Residents of La Serena, a street whichforms a T intersection with the test
segment of La Canada. Residents of
La Serena are rarely impacted as dri-
vers. They may suffer some adverseimpact from the hump installation dueto small amounts of former La Canadatraffic diverted to their street (less
than 200 ADT). However, they are
close enough to the test segment to
have been concious of and even, in
some cases, irritated by the prior
problems which existed on La Can-ada. They are also close enough to
have neighboring relationships with
and sympathy for residents on the test
segment of La Canada.
• Residents of several streets to the
north of the test segment for whomthe test segment serves as one of sev-
eral potential access routes to their
homes. These residents are not likely
to benefit from the humps directly and
experience them primarily as drivers.
Response from all surveys was extremelyhigh, ranging from 79 percent for the LaSerena residents to 49 percent of resi-
dents in the area north of the test seg-
ment. This response rate and the exten-
sive suggestions and comments of a con-
structive nature, even on returns by re-
sidents opposed to the humps, is indica-
tive of the high level of public interest in
the subject. Details of the response are
presented below.
La Canada Test Segment Residents
Responses were received from 15 of the
21 households on the test segment of LaCanada for a 7 1 percent response rate.
The responses to questions evaluating
performance on specific criteria leave
the impression that the humps do not
fully satisfy residents. But the responses
on evaluation questions - "do the humpsserve a useful purpose? . . . should they
be left on La Canada after the test per-
iod? . . .should they be used on other
streets?" - leave little doubt that a large
majority of the test segment residents
favor the humps.
Table 9 presents residents' impressions of
how the humps have affected specific
problem conditions which were identified
at a neighborhood meeting and in a sur-
vey before the humps installation. Sev-
eral indications were quite positive.
Sixty-nine percent indicated there had
74
been slight or substantial improvement(lowering) in overall speeds; 61 percent
indicated slight or substantial improve-ment (lowering) in speeds of fastest
drivers; 75 percent indicated improve-ment (lowering) of traffic noise and 70
percent felt that night traffic volumehad been reduced. But on other identi-
fied problem conditions, substantial per-
centages of respondents found conditions
unchanged and few believed them worse.
Relative to speed conditions, one-third
of the residents indicated overall speeds
remained "far too high", one-third in-
dicated it was now "only slightly faster
than it should be" and one-third felt
speed was "about right" for the street.
None felt traffic was held to speeds
"slower than reasonable" or "much slower
than reasonable". Forty percent felt
that fast drivers "still travel any speedthey wish" while 60 percent indicated the
faster drivers had "slowed somewhat,though still traveling too fast". Nonebelieved the faster drivers had been con-
fined to speeds "not much faster than
average drivers".
The previously described tendency of
some drivers to "run the gutters" ap-
peared to have significant impact on re-
sidents' perceptions of the humps effec-tiveness. Twenty-one percent indicated
gutter running was "so frequent it de-feats the purpose of the humps"; 57 per-
cent indicated gutter running was "fairly
frequent, but even gutter-runners slowdown some"; 14 percent said gutter run-
ning was "not very frequent, but those
who do it drive dangerously fast". Onlyone respondent indicated gutter running
was "too infrequent to worry about".
Several residents who felt the humpsshould be kept on the street wrote ex-tended comments complaining aboutgutter-running and suggesting counter-measures. Two residents who felt the
humps should be removed cited gutter-
running as the reason for this opinion.
Even with the humps in place, 53
percent of the respondents felt their
street was "still quite dangerous" con-
sidering safety from traffic of pedest-
rians, bicyclists and kids in general.
One-third felt it was now "about average
for a residential street while 13 percent
indicated it was now "safer than aver-
age".
Twenty percent of the respondents felt
that noise of traffic braking and accler-
ating near the humps was "a severe prob-
lem"; 13 percent indicated it was "an
occasional nuisance"; 47 percent felt it
was "an occasional nuisance but worth it
to keep speeds down" while 20 percent
indicated this was "not a problem at all".
None of the test segment respondents
felt the humps were "too severe for safe-
ty of vehicle occupants or could damagevehicles and cargo". Forty-three percent
felt the humps were "about right to slow
traffic safely"; 33 percent indicated the
humps were "somewhat more gentle than
they should be" and 20 percent felt the
humps were "far too gentle to be effec-
tive". Asked if they had encountered any
problems crossing the humps as the dri-
ver of specific vehicle types, none of the
respondents resident on the test segmentindicated they had encountered "serious
difficulty" in any vehicle type. Fourteen
percent of the respondents indicated
"moderate difficulty" in autos while 86
percent reported "no difficulty". For
vans and pickups, 13 percent of the resi-
dents indicated "moderate difficulty"
while 87 percent indicated "no diffi-
culty". For bikes, 20 percent of the
respondents reported "moderate difficul-
ty" while 80 percent reported "no dif-
ficulty". The single test segment re-
sidents reporting traversing the humps in
each of the "motorcycle," "towing trail-
er" and "heavy truck" categories indica-
ted "no difficulty". These responses by
test segment residents on the "severity"
and "hump crossing difficulty" questions
are in sharp contrast to responses of re-
sidents of the area to the north whodrive through the test segment. Those
75
responses are presented in a subsequent
section.
Relative to signing and marking of the
humps, 29 percent of respondents fromthe test segment felt that existing pro-
visions were "insufficient to warn dri-
vers"; 43 percent felt they were "about
right to help drivers cross safely" and 29percent felt they were "more extensive
than necessary". Many of those report-
ing insufficiency suggested painting the
humps and moving the signs now along-
side the humps to an approach position
(note that other advance warning signs
are actually in place). These commentsare echoed in the responses of drivers
from the area to the north. With respect
to the appearance of the humps and asso-
ciated signs and markings, 27 percent of
respondents felt they "detract from the
visual quality of the neighborhood"; 60
percent indicated they were "not parti-
cularly attractive but acceptable, con-sidering what humps do"; 13 percent re-
ported them "not a particularly notice-
able negative feature".
There was mixed opinion whether out-
siders came to La Canada to joyride onthe humps. Thirty-six percent reported
it "a serious continuing problem"; 28percent said it was "a minor problem"; 36
percent reported it "never was a notice-
able problem".Most residents agreed with the spacing
and number of humps on the street. Six-
ty-four percent reported spacing andnumber "about right"; 29 percent thoughtthey were too far and too few; only onerespondent thought them too close andtoo many.
Despite the mixed reviews on many of
the above points, on fundamental ques-tions as to whether the humps were goodor bad, residents of the test segmentwere strongly in support of the humps .
Seventy-nine percent believed the humps'"serve a useful purpose" while only 21
percent felt they do not. Seventy-threepercent indicated the humps should re-
main permanently, while 27 percent ad-
vocated their removal. Seventy-sevenpercent indicated they favored using the
humps on other streets experiencing
problems similar to La Canada's, while
only 23 percent opposed such use. Askedif they believed other measures, exclud-
ing cu I -de-sac ing, could be as effective
as the humps in controlling speed, 60
percent of the residents responded "no".
Of those who thought other measureswork, half cited cul-de-sacing. Mostothers suggested stop signs and one pro-
posed "doubling" the humps.
El Encanto Residents
Responses were received from 5 of the 7
households on El Encanto (7 I percent re-
turn).
Asked if the humps affected noise on
the curve at the end of the test segment(previously reported as disturbing to El
Encanto residents, three reported the
noise "decreased" while two reported it
"unchanged". All reported "no change" in
the amount of traffic on El Encanto (in
fact, it decreased 22 percent). Two re-
ported "the humps led some frustrated
drivers to speed on El Encanto", two be-
lieved El Encanto speeds "unchanged"while one felt "most drivers drive morecarefully on El Encanto". Three felt
humps on El Encanto "would be helpful,"
one "opposed" them and one was "not a-
ware of a need" for them.Relative to other residential streets
with speed problems, two "generally
favored use of the humps, though not
considering them perfect", one unqual-
ifiedly endorsed their use and two ex-
pressed no opinion.
La Serena Residents
Responses were received from I I of the
14 households on La Serena, a 79 percent
return rate. General reaction of La Ser-
ena residents to the humps appears to be
quite favorable. This is particularly
impressive since La Serena did suffer
76
some adverse impact (more traffic) as a
result of the hump installation on LaCanada.La Serena residents generally felt that
the humps were effective in controlling
speed on La Canada. Twenty seven per-
cent rated them "extremely effective",
55 percent rated them "partially effec-tive" and 18 percent rated them "slightly
effective". None rated them "not effec-
tive" or thought they "made conditions
worse".
Some La Serena residents were previ-
ously impacted by traffic noise on thecurve at the north end of the La Canadatest segment. One respondent felt the
humps "solved" the noise problem; 45percent indicated the humps "decreasedthe noise"; 36 percent felt noise on the
curve was "unchanged" and one respond-ent rated it "worse".
Most La Serena residents correctly
perceived the increase in traffic on their
street resulting from diversion from LaCanada (up 75 adt, 23 percent increaseover prior La Serena traffic). Thirty-six
percent felt there was "considerablymore" traffic on La Serena; 36 percentthought there was "slightly more"; 27percent thought it unchanged. Nonethought traffic had decreased. Some re-
sidents also felt the La Canada humpscaused the diverted traffic to speed onLa Serena. Forty-five percent thought"the humps caused some frustrated dri-
vers to speed on La Serena"; 55 percentthought there had been "no change" butnone thought drivers on La Serena werebeing "more careful".
Despite perceiving these adverse im-pacts, La Serena residents had favorableoverall impressions about the humps.Forty-five percent favored placinghumps on La Serena, 18 percent werecategorically opposed while 36 percentwere not aware of need for them there.In principle, 20 percent agree to humpson residential streets may be "necessaryin special cases"; 60 percent "generallyfavored the humps, though not consider-
ing them perfect"; 20 percent "endorsed"
them without qualification. None abso-
lutely opposed the humps.La Serena residents had generally fav-
orable opinions as to the severity of the
humps and the difficulty in driving across
them. Sixty-four percent felt the humpswere "about right to slow cars safely"; 18
percent rated them "somewhat moregentle than they should be" and 18 per-
cent rated them "far too gentle to be ef-
fective". None rated them "too severefor safety of occupants". One driver of a
van reported "serious difficulty" crossing
the humps; one auto driver reported"moderate difficulty". All other respon-
dents reported "no difficulty" in all ve-
hicle categories.
Ninety percent of La Serena respon-
dent indicated signs and markings gave"adequate warning of the humps location
and nature".
Sixty-four percent of La Serena re-
spondents felt the La Canada humpsshould be "made permanent", 18 percent
felt they should be "removed" and 18
percent felt they should be left in place
for more testing. One of those for re-
moval suggested a more severe measure,cul-de-sacing, as an alternative. As to
general application on other residential
streets, 45 percent favored, 45 percentopted for more testing first, one express-
ed no opinion and none opposed.
Residents of Area to North
Opinions of residents of the area to the
north of the test segment were muchmore favorable to the humps than mighthave been expected. These respondents
gain no direct benefit from the humpsand are primarily impacted by the humpsas drivers - they are the people at whomthe humps were aimed. However, nearly
as many of these respondents took pos-
itions favorable toward the humps as
took opposition views.
Speaking of the humps' speed restraint
characteristics in general, 19 percent of
77
the respondents felt the humps "restrict
speeds far too much"; 21 percent felt
speeds were restricted slightly belowwhat is desirable; 45 percent felt speeds
were restricted "to a reasonable level for
this street" and 16 percent felt they
"hardly restrict speed at all". Several
respondents commented that what they
resented most about the humps was that
they punished the reasonable drivers
along with the speeders and that the
speeders could still "get away with it" bygutter-running or just speeding over the
humps.Respondents' ratings of their personal
driving reactions to the humps were di-
verse. Thirty-nine percent reported they
drove "much slower" on La Canada now;44 percent rated themselves "a little
slower"; 15 percent rated their speed"about the same" as before the humpswere installed while one respondent
reported driving faster now on La Can-ada because of the humps presence.
Thirty-eight percent of the drivers re-
ported using La Canada as frequently as
ever; I I percent said they "sometimesavoid" the humped segment; 28 percent"avoid the humped segment wheneverconvenient" and 23 percent usually "go
out of their way" to avoid the humpedpart.
Seventy-two percent of the respon-
dents rated signing and marking of the
humps "adequate". Of the 28 percentwho rated it inadequate, principal sug-
gestions were for painting the humps andfor moving the adjacent warning signs to
an advance position.
As to severity of the humps and dif-
ficulty crossing them in various vehicles,
52 percent felt the humps were "too se-
vere for safety of occupants and could
damage vehicles and cargo" 1 44 percentreported them "about right to slow ve-
hicles safely"; and 4 percent believed
them "somewhat more gentle than they
should be". In their comments, several
residents attributed the need to replace
shock absorbers on their vehicles and
difficulties with wheel alignment to
effects of repeated traversal of the
humps. No respondents were able to cite
incidents or evidence of direct damageto vehicles by the humps. However, twodrivers of 4-wheel drive recreation ve-
hicles noted that rear seat passengers
heads had "hit the roof" when they droveover the humps. Ratings of degree of
difficulty experienced in crossing the
humps are summarized in Table 10.
Despite these ratings of severity andcrossing difficulty, surprisingly large
numbers of residents in the area to the
north of the test segment took positions
favorable to the humps . Only 21 percent
were "absolutely opposed" to the humpsin principle; 33 percent "agreed they maybe necessary in special cases"; 23 per-
cent "generally favored the humps,though not considering them perfect";
and 23 percent "endorsed" them without
qualification.
Sixty-six percent of the "north area"
respondents felt the humps on La Canada"served a useful purpose" while 29 per-
cent felt they did not and 5 percent wereundecided. Thirty-eight percent felt the
La Canada humps should be made per-
manent and 21 percent thought they
should be left in place for more testing.
Forty-seven percent felt the humpsshould be used on other streets with
speed problems, 28 percent opposed and
26 percent felt more testing should be
undertaken before this decision is
made. Many of those favoring the humpssuggested other specific streets as candi-
dates for their application.
With the surveys on La Canada, LaSerena and El Encanto, response rate wasso extremely high that there is no con-
cern that there might be meaningful dif-
ferences between the attitudes of those
who responded and those who didn't. Re-sponse rate for the area to the north
was, at 49 percent, also extremely high
for a survey of this type. But with about
as many persons not responding as those
who responded, there is a theoretical po-
78
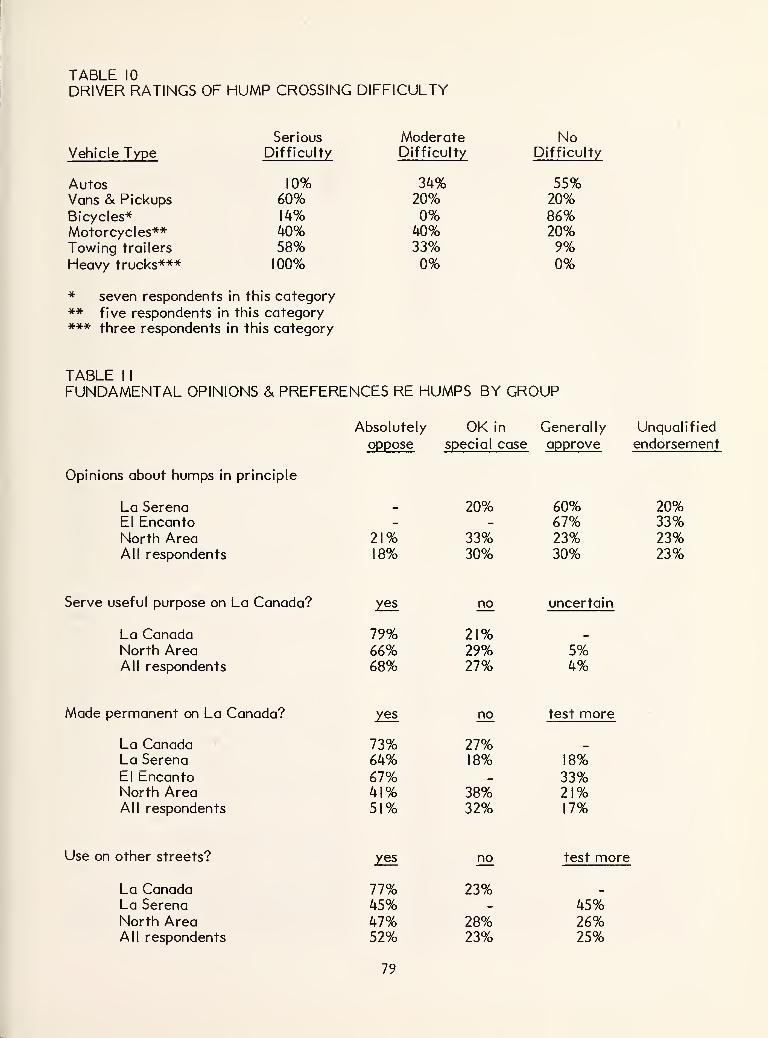
TABLE 10
DRIVER RATINGS OF HUMP CROSSING DIFFICULTY
Serious Moderate NoVehicle Type Difficulty Difficulty Difficulty
Autos 10% 34% 55%Vans & Pickups 60% 20% 20%Bicycles* 14% 0% 86%Motorcycles** 40% 40% 20%Towing trailers 58% 33% 9%Heavy trucks*** 100% 0% 0%
seven respondents in this category
five respondents in this category*** three respondents in this category
**
TABLE 1
1
FUNDAMENTAL OPINIONS & PREFERENCES RE HUMPS BY GROUP
Opinions about humps in principle
La SerenaEl EncantoNorth AreaAll respondents
Serve useful purpose on La Canada?
La CanadaNorth AreaAll respondents
Made permanent on La Canada?
La CanadaLa Serena
El EncantoNorth AreaAll respondents
Use on other streets?
La CanadaLa Serena
North AreaAll respondents
Absolutely
oppose
OK in
special case
Generally
approve
Unqualified
endorsement
21%18%
20%
33%30%
60%67%23%30%
20%33%23%23%
yes no uncertain
79%66%68%
21%29%27%
5%4%
yes no test more •
73%64%67%41%51%
27%18%
38%32%
18%33%21%17%
yes no test more
77%45%47%52%
23%
28%23%
45%26%25%
79
tential for a meaningful difference be-
tween the attitudes of those who re-
sponded and those who didn't. In this
case, that potential can be dismissed. In
this solidly upper middle class area,
there are no language or understanding
barriers which might have selectively
limited the opportunity to respond to a
particular segment of the resident popu-lation. There is strong response by both
those who favor and those who opposethe humps, so it appears unlikely that
those not bothering to respond were par-
ticularly polarized in favoring or oppos-
ing the humps. Probably, those whodidn't respond were persons who pre-
dominantly relied upon access routes
other than La Canada. Hence, theyweren't affected by the humps enough to
motivate a response or weren't familiar
enough with them to respond intelligent-
ly. Others who do travel across the LaCanada humps regularly but accept themwithout forming particularly strong pro
or con attitudes may also be among the
non-respondents.
Summary of Opinions
Responses of all four groups to the
fundamental questions of how they feel
about humps in principle, whether they
serve a useful purpose on La Canada,whether they should be made permanenton La Canada and whether they should beused on other streets are summarized onTable I I (note that all four groups werenot asked all four questions).
Despite the fact that response to the
question of the humps "in principle" is
dominated by persons who experiencethem solely as drivers and are not bene-fited by them, almost 83 percent of all
respondents indicated some level of ap-proval of the humps. Despite the fact
that four times as many "drivers" as
"benefiting residents" responded to the
question of whether the humps served a
useful purpose on La Canada, those whofelt the humps were useful outnumbered
those who did not by a 2.5 to I margin.
Those who experienced the humps purely
as drivers comprised 65 percent of all
respondents to the questions of whetherthe La Canada humps should be madepermanent and whether they should beused on other streets. Yet only 32
percent of all respondents thought the LaCanada humps should be removed; 68
percent felt they should be made per-
manent or at least left for more test-
ing. Relative to use on other streets,
only 23 percent were opposed; 77 percent
approved such use or at least favored
more testing.
In conclusion, while there are differ-
ences of opinion between residents anddrivers - residents feeling the humps are
not severe enough a restraint, drivers
feeling they are too severe - a strong
majority of both groups react to somedegree favorable on the fundamental is-
sue of their use. The "residents" anddrivers" opinions are about what one whojust examined the performance results
presented previously might expect. Re-sidents generally favor the device be-
cause it keeps most traffic under the 25
mph (40 kmph) speed limit and lowers
speeds of even the fastest traffic but are
not entirely satisfied because of gutter-
running and because the fastest drivers
still go well above the speed limit.
Drivers do not particularly like the
device because it constrains and discom-
forts them but accept it to some degree
because it does not constrain them to un-
reasonable speeds and because they can
see the possibility of it being used to
prevent other people from speeding on
their own street.
BOSTON CASE STUDIES
The City of Boston was the site of twoadditional undulatioin case study applica-
tions. The fact that Boston had pre-
viously applied conventional speed bumpson one public street and had undertaken
80
other extensive residential traffic con-trol measures made it a logical candidatefor the undulation studies. Boston also
supplied exposure to winter snow condi-
tions, a factor absent in the Brea casestudies. Having at least one case study
with snow exposure was judged importantboth to determine the effect on plowingoperations and impacts on control during
icy conditions.
Case Study Streets
Two case study streets were selected
from a list of 10 candidates which hadhistories of speed complaints by resi-
dents. Lochstead Avenue, located in the
Jamaica Plain district, is a single block
street (Tee intersections at each end)extending approximately one quartermile (.4 km) between two arterials, Ja-
maica Way and Centre Street. It is a-
bout twenty-eight feet (8.5m) wide withparking permitted but lightly used onboth sides and has level, tangent align-
ment. It is an established upper middleclass neighborhood of large older homeswhich presents an extremely well main-tained appearance. In a brief speedstudy performed while on the site, it
appeared that most traffic remainedunder 30 miles per hour (48 kmph), butoccasionally fast cars were observedabove 40 miles per hour (64 kmph) andeven one passing above 50 miles an hour(80 kmph) was observed. Much of the
traffic on Lochstead used it as a tran-
sition through route between JamaicaWay and Centre Street.
The other proposed test street, WillowStreet in the West Roxbury district, is aone-way street approximately 21 feet
(6.2m) wide with parking permitted onone side only. The test segment, approx-imately one-third mile (.54 km) long,
serves as a collector for a fairly large
residential area and also a transitional
route between the two arterials whichdefine the limits of the test section,
Weld Street and Centre Street. The
neighborhood appears to be solidly work-ing class and very stable. Most homesappear to be at least sixty years old but
well kept. Horizontal alignment of the
street is tangent but there are signifi-
cant changes in the vertical alignment.
The upper third of the street near Weldis level as is the lower third near Centrewith a fairly steep (up to 5 percentgrade) downhill segment in the direction
of travel from Weld to Centre in the
middle. This hill appears to have muchto do with the speed problem. Vehicles
seem to travel below thirty miles per
hour (48 kmph) on the upper segmentthen speed up on the hill and travel at
five to ten miles per hour (8 to 16 kmph)faster than they were going at the top.
Hence, most of the fast travel on Willowappears inadvertant - drivers just na-turally building up speed on the hill - andit was believed interesting to test whe-ther the undulations were an appropriatecountermeasure for this natural condi-
tion, as well as for the more deliberate
speeding which seems to occur on Loch-stead and La Canada. Resident activity
along the street is quite high with manyadults observed walking along the street
to the street car line on Centre, to local
shops, conversing with neighbors and the
like as well as children walking along or
playing in the street. In an hour's obser-
vation during a morning commute period,
more than two dozen pedestrians wereobserved. In a midafternoon period, sig-
nificant pedestrian activity was also ob-
served along with incidents of street play
by children. This level of pedestrian ac-
tivity along with the close proximity andsense of contact with traffic because of
the narrowness of the street may ac-
count for the resident sensitivity to
traffic speed (note that the observed"before" speeds on Willow indicated onthe Figure are not particularly high).
Case Study Procedure
"Before" data measures were conducted
8
in late October and early November,1979. Simultaneously, through public
meetings and notices, the City insured
that resident concern about speeding wasbroad-based and that there was no strong
opposition to the conduct of the test pro-
grams. The humps were installed on De-cember 6, 1979 by City public workscrews. Interim monitoring took place in
January, 1980 and formal "after" mea-sures were taken in late June, 1980,
approximately 7 months after installa-
tion.
Installation Details
Three humps were constructed on eachstreet. Location and spacing of the
humps is shown in the performancegraphs presented subsequently.
Unlike the Brea installations, in whichthe existing pavement surface was exca-vated to the base before constructing the
humps, the Boston undulations were con-structed by simply overlaying the exist-
ing pavement. Some ravelling of the ed-
ges of the overlays was evident as early
as a month after installation but evenafter 6 months, the deterioration had not
become unreasonable. It appears that
simple overlays are acceptable for test
situations. Excavation to base for the
last 1.5 feet (46 cm) on each edge of the
humps appears desirable on permanentinstallations but complete excavation as
done in the Brea case does not appearnecessary.
Figure 28 shows a typical Boston humpinstallation and signing and marking de-
tails. The only signing is "Bumps Ahead"advance warning signs on the approachesto each test segment. In Brea, whereeach hump was individually signed, re-
sidents complained about the number andappearance of the signs. In Boston, re-
sidents requested individual warningsigns by each hump, though their intent
was not to alert traffic. Rather, they
hoped the signposts would discourage
motorists who allegedly (though this wasnever witnessed by research team per-
sonnel) jumped the curbs to avoid the
humps. The Boston humps were com-pletely painted white and the legend
BUMP was painted on the pavement in 4
foot (1.2m) letters in advance of eachhump. After 6 months the paint hadfaded considerably and was obscured byblack tire marks to a substantial de-
gree. However, these markings still
appear to improve hump conspicuity over
the Brea conditions. It is also noted that
even light snow completely obscures
pavement markings and makes it very
difficult, even for persons familiar with
the humps, to know just where they are.
It is recommended in snow country that
humps be individually signed as an aid to
drivers and plow operators specifically
locating the humps. Paint and signing
should not be considered as alternatives;
both treatments should be applied to
each hump.The humps on Lochstead were termin-
ated abruptly about 4 feet (1.2m) fromthe curb face. Those on Willow termin-
ate about 2 feet (,6m) from curbface.
Both treatments, that on Lochstead par-
ticularly, appear considerably more in-
viting to gutter-runners than the Breatreatment in which the humps were grad-
ually tapered to the curb face. Gutter-
running tendencies are discussed subse-
quently. One further installation detail
is significant. Because the TRRL workgave no indication as to how steep a
slope the undulations could be employedon safely, it was felt prudent that all
humps be placed at relatively level
points on all the case study streets in
these initial U.S. applications. Initial
intent in the Willow Street case was to
place the last (most southerly) hump at a
level point at the tow of the previously
described slope. However, in response to
specific citizen requests, the City act-
ually installed this hump in a more north-
erly position at a point where the slope
approaches 3 percent. (Since the street
82
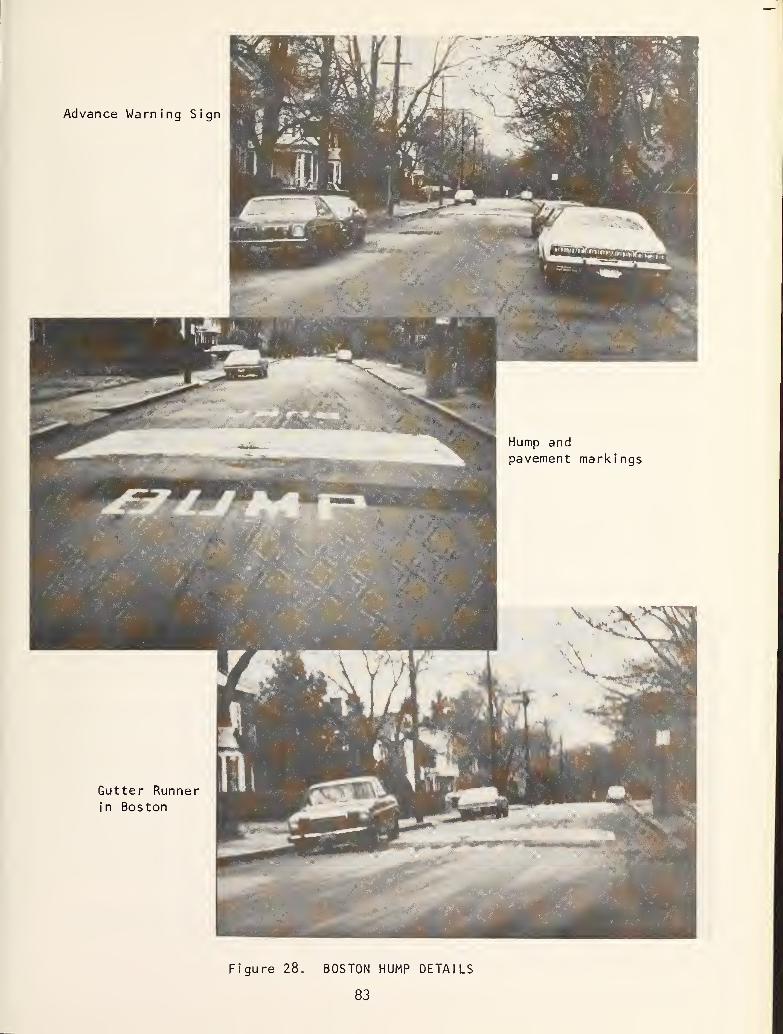
-
Advance Warning Sign
Gutter Runner
in Boston
Figure 28. BOSTON HUMP DETAILS
83
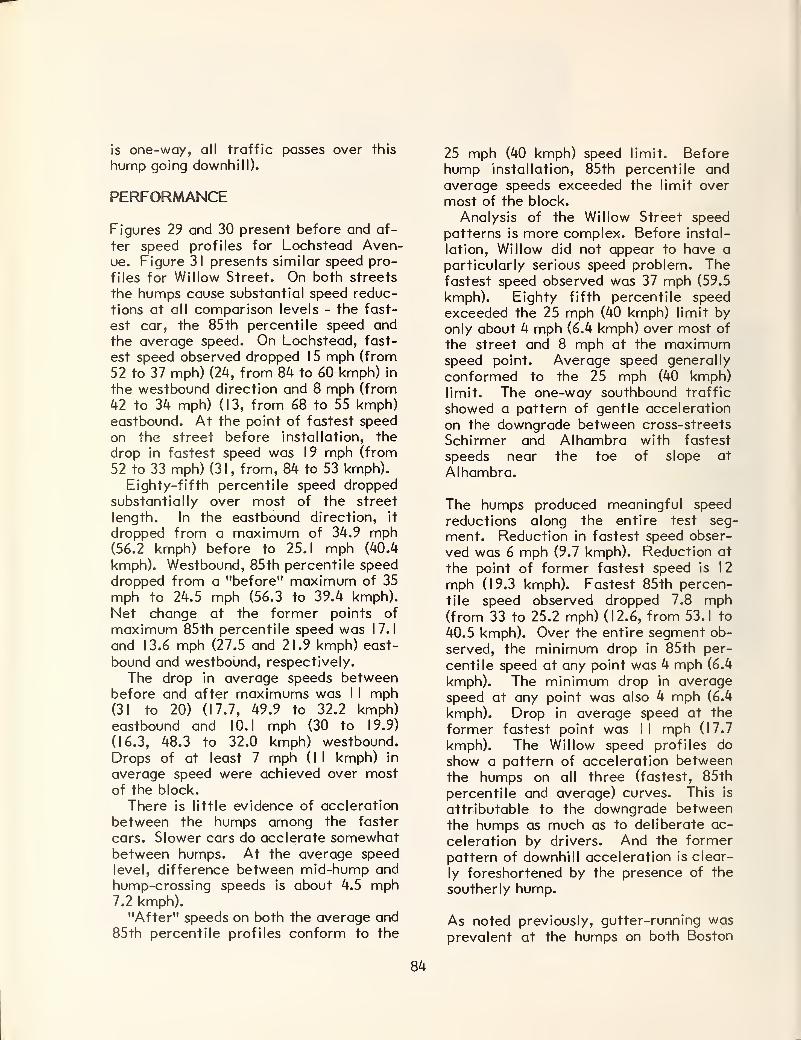
is one-way, all traffic passes over this
hump going downhill).
PERFORMANCE
Figures 29 and 30 present before and af-
ter speed profiles for Lochstead Aven-ue. Figure 31 presents similar speed pro-
files for Willow Street. On both streets
the humps cause substantial speed reduc-
tions at all comparison levels - the fast-
est car, the 85th percentile speed andthe average speed. On Lochstead, fast-
est speed observed dropped 1 5 mph (from
52 to 37 mph) (24, from 84 to 60 kmph) in
the westbound direction and 8 mph (from
42 to 34 mph) (13, from 68 to 55 kmph)eastbound. At the point of fastest speed
on the street before installation, the
drop in fastest speed was 19 mph (from
52 to 33 mph) (31, from, 84 to 53 kmph).
Eighty-fifth percentile speed droppedsubstantially over most of the street
length. In the eastbound direction, it
dropped from a maximum of 34.9 mph(56.2 kmph) before to 25.1 mph (40.4
kmph). Westbound, 85th percentile speeddropped from a "before" maximum of 35
mph to 24.5 mph (56.3 to 39.4 kmph).
Net change at the former points of
maximum 85th percentile speed was 17.1
and 13.6 mph (27.5 and 21.9 kmph) east-
bound and westbound, respectively.
The drop in average speeds betweenbefore and after maximums was I I mph(31 to 20) (17.7, 49.9 to 32.2 kmph)eastbound and 1 0.1 mph (30 to 19.9)
(16.3, 48.3 to 32.0 kmph) westbound.Drops of at least 7 mph (II kmph) in
average speed were achieved over mostof the block.
There is little evidence of accleration
between the humps among the faster
cars. Slower cars do acclerate somewhatbetween humps. At the average speedlevel, difference between mid-hump andhump-crossing speeds is about 4.5 mph7.2 kmph).
"After" speeds on both the average and85th percentile profiles conform to the
25 mph (40 kmph) speed limit. Beforehump installation, 85th percentile andaverage speeds exceeded the limit over
most of the block.
Analysis of the Willow Street speedpatterns is more complex. Before instal-
lation, Willow did not appear to have a
particularly serious speed problem. Thefastest speed observed was 37 mph (59.5
kmph). Eighty fifth percentile speedexceeded the 25 mph (40 kmph) limit byonly about 4 mph (6.4 kmph) over most of
the street and 8 mph at the maximumspeed point. Average speed generally
conformed to the 25 mph (40 kmph)limit. The one-way southbound traffic
showed a pattern of gentle acceleration
on the downgrade between cross-streets
Schirmer and Alhambra with fastest
speeds near the toe of slope at
Alhambra.
The humps produced meaningful speed
reductions along the entire test seg-
ment. Reduction in fastest speed obser-
ved was 6 mph (9.7 kmph). Reduction at
the point of former fastest speed is 12
mph (19.3 kmph). Fastest 85th percen-
tile speed observed dropped 7.8 mph(from 33 to 25.2 mph) (12.6, from 53.1 to
40.5 kmph). Over the entire segment ob-
served, the minimum drop in 85th per-
centile speed at any point was 4 mph (6.4
kmph). The minimum drop in averagespeed at any point was also 4 mph (6.4
kmph). Drop in average speed at the
former fastest point was II mph (17.7
kmph). The Willow speed profiles doshow a pattern of acceleration betweenthe humps on all three (fastest, 85th
percentile and average) curves. This is
attributable to the downgrade betweenthe humps as much as to deliberate ac-
celeration by drivers. And the former
pattern of downhill acceleration is clear-
ly foreshortened by the presence of the
southerly hump.
As noted previously, gutter-running wasprevalent at the humps on both Boston
84
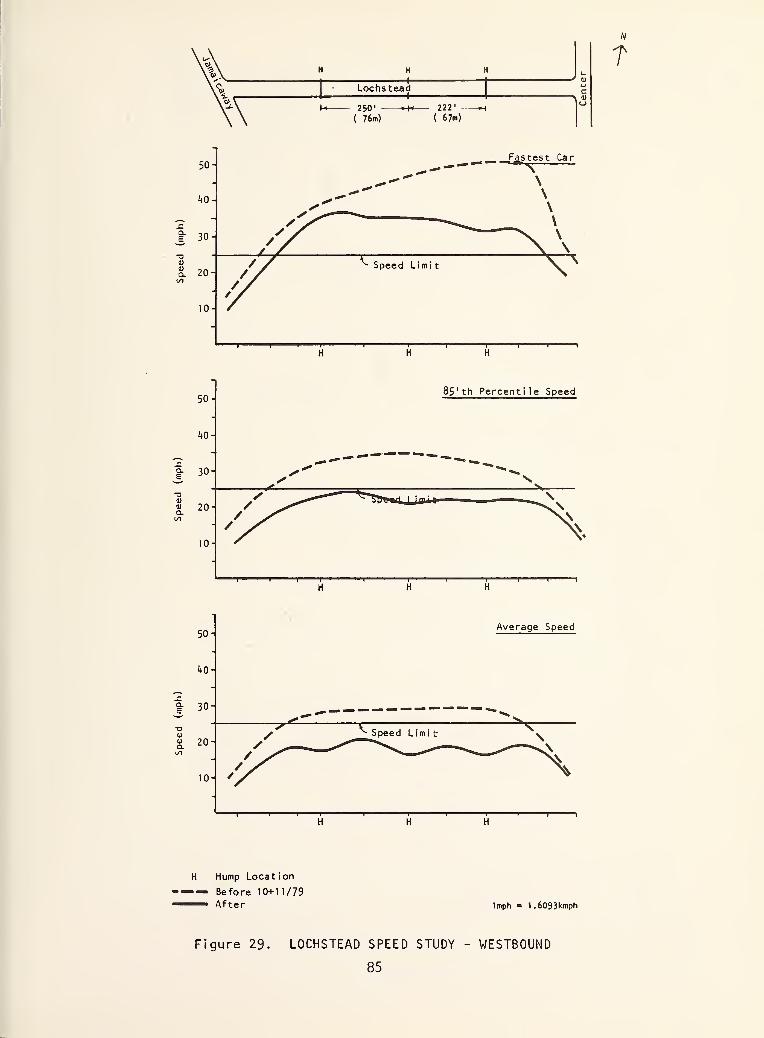
LochsteadV"
250"
( 76m)
222' -
( 67m)
T
H Hump Location
-— Before 10+11/79— After Imph - 1.6093kmpb
Figure 29. LOCHSTEAD SPEED STUDY - WESTBOUND
85
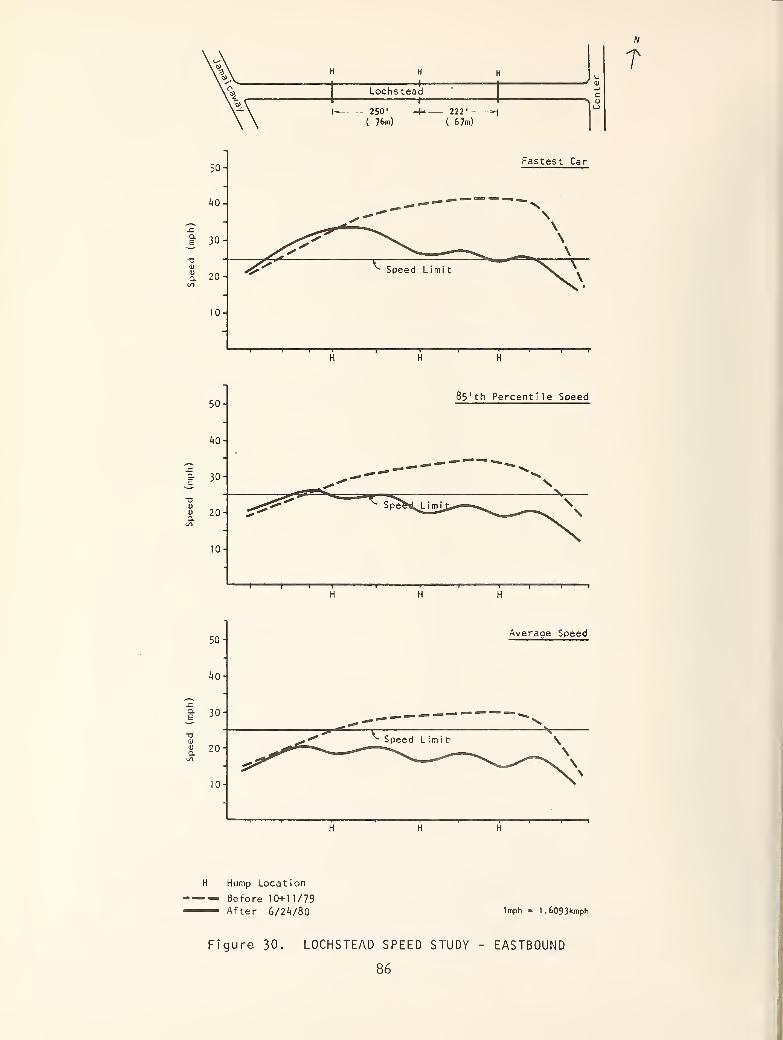
h-Lochstead+250' -
( 76m)
222' *i( 67m)
T
50-
40-
30
20
Fastest Car
\\\\
\ iii
v Speed Limit
85' th Percent i le Speed
50-
40-
30
1
-Average Speed
-
-^ ""
^^^»*"* x Speed Limit \
\
H Hump Location
-— Before 10+11/79— After 6/2V80
Figure 30. LOCHSTEAD SPEED STUDY
86
Imph » 1 .6093kmph
EASTB0UND
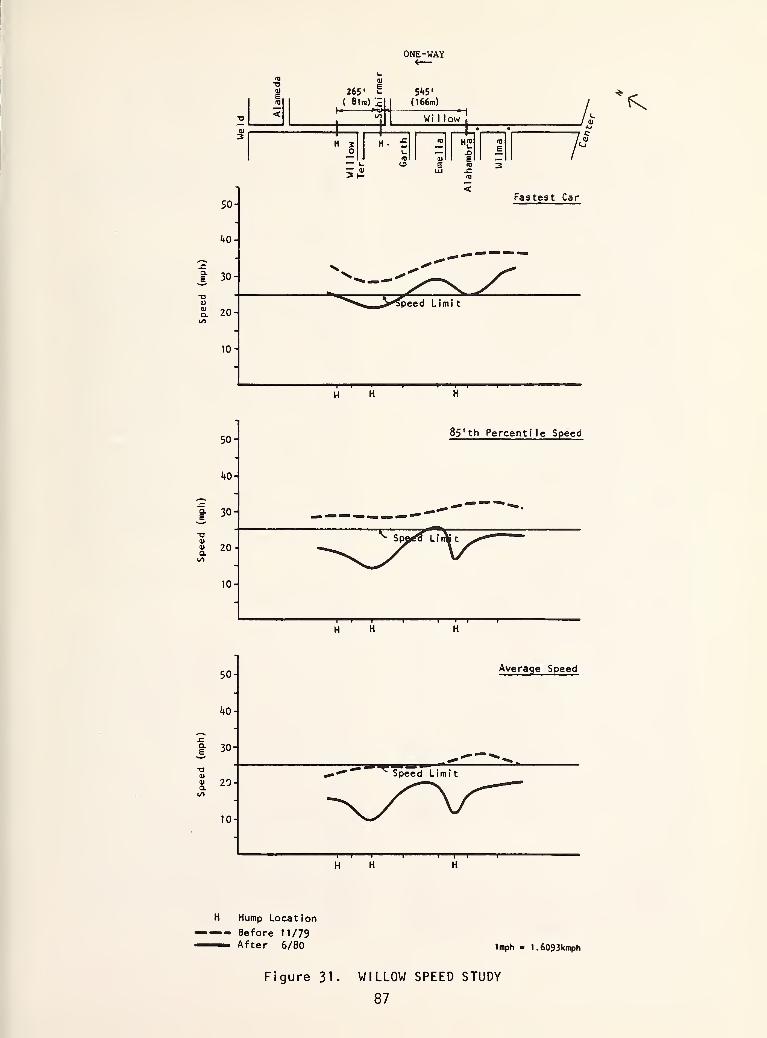
ONE-WAY
265' E 5^5
'
i
( 8l m) 21 I(166m)
H 3O
jL!
w '"°"|
.—
=
normA K
50-Average Speed
40-
Q. 30-
20-
- -» ^""~ ** ^. --a<u
ma
^•""* Speed Limit
10-
H Hump Location
— - Before 11/79— After 6/80 Imph « 1.6093kmph
Figure 31 WILLOW SPEED STUDY
87
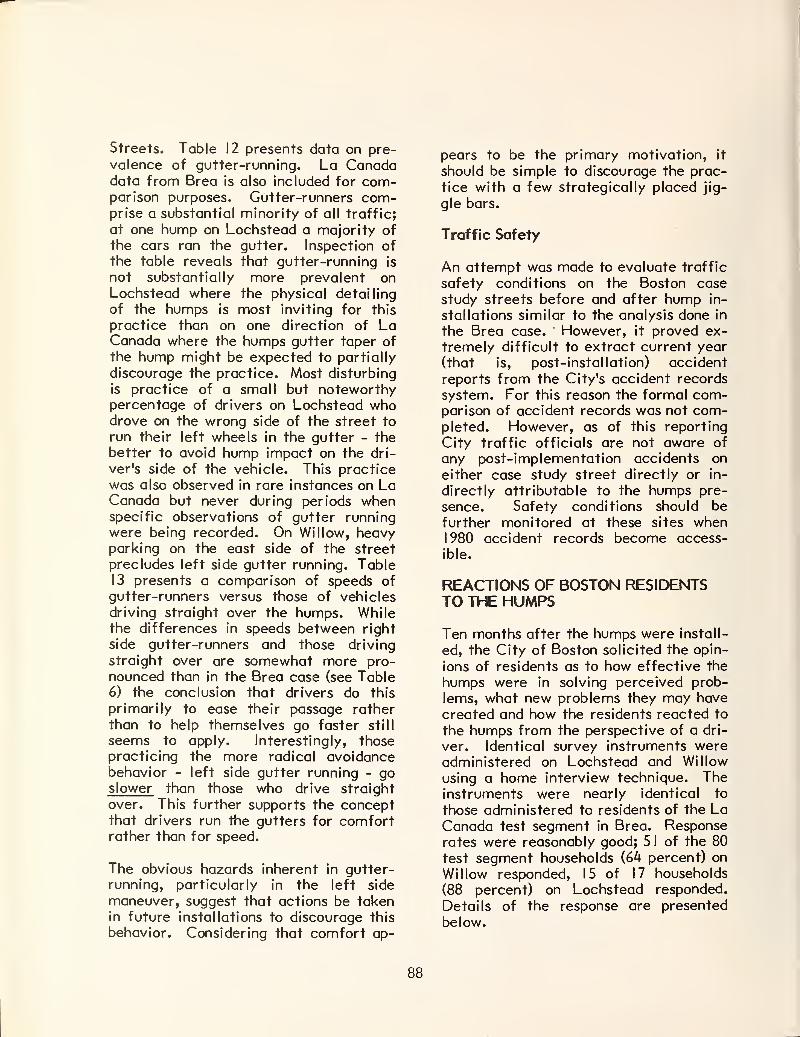
Streets. Table 12 presents data on pre-
valence of gutter-running. La Canadadata from Brea is also included for com-parison purposes. Gutter-runners com-prise a substantial minority of all traffic;
at one hump on Lochstead a majority of
the cars ran the gutter. Inspection of
the table reveals that gutter-running is
not substantially more prevalent onLochstead where the physical detailing
of the humps is most inviting for this
practice than on one direction of LaCanada where the humps gutter taper of
the hump might be expected to partially
discourage the practice. Most disturbing
is practice of a small but noteworthypercentage of drivers on Lochstead whodrove on the wrong side of the street to
run their left wheels in the gutter - the
better to avoid hump impact on the dri-
ver's side of the vehicle. This practice
was also observed in rare instances on LaCanada but never during periods whenspecific observations of gutter runningwere being recorded. On Willow, heavyparking on the east side of the street
precludes left side gutter running. Table13 presents a comparison of speeds of
gutter-runners versus those of vehicles
driving straight over the humps. Whilethe differences in speeds between right
side gutter-runners and those driving
straight over are somewhat more pro-
nounced than in the Brea case (see Table6) the conclusion that drivers do this
primarily to ease their passage rather
than to help themselves go faster still
seems to apply. Interestingly, thosepracticing the more radical avoidancebehavior - left side gutter running - goslower than those who drive straight
over. This further supports the conceptthat drivers run the gutters for comfortrather than for speed.
The obvious hazards inherent in gutter-running, particularly in the left side
maneuver, suggest that actions be takenin future installations to discourage this
behavior. Considering that comfort ap-
pears to be the primary motivation, it
should be simple to discourage the prac-
tice with a few strategically placed jig-
gle bars.
Traffic Safety
An attempt was made to evaluate traffic
safety conditions on the Boston case
study streets before and after hump in-
stallations similar to the analysis done in
the Brea case. However, it proved ex-
tremely difficult to extract current year
(that is, post-installation) accident
reports from the City's accident records
system. For this reason the formal com-parison of accident records was not com-pleted. However, as of this reporting
City traffic officials are not aware of
any post-implementation accidents on
either case study street directly or in-
directly attributable to the humps pre-
sence. Safety conditions should be
further monitored at these sites when1980 accident records become access-
ible.
REACTIONS OF BOSTON RESIDENTSTO THE HUMPS
Ten months after the humps were install-
ed, the City of Boston solicited the opin-
ions of residents as to how effective the
humps were in solving perceived prob-
lems, what new problems they may have
created and how the residents reacted to
the humps from the perspective of a dri-
ver. Identical survey instruments wereadministered on Lochstead and Willow
using a home interview technique. Theinstruments were nearly identical to
those administered to residents of the LaCanada test segment in Brea. Responserates were reasonably good; 51 of the 80
test segment households (64 percent) on
Willow responded, 15 of 17 households
(88 percent) on Lochstead responded.
Details of the response are presented
below.
88
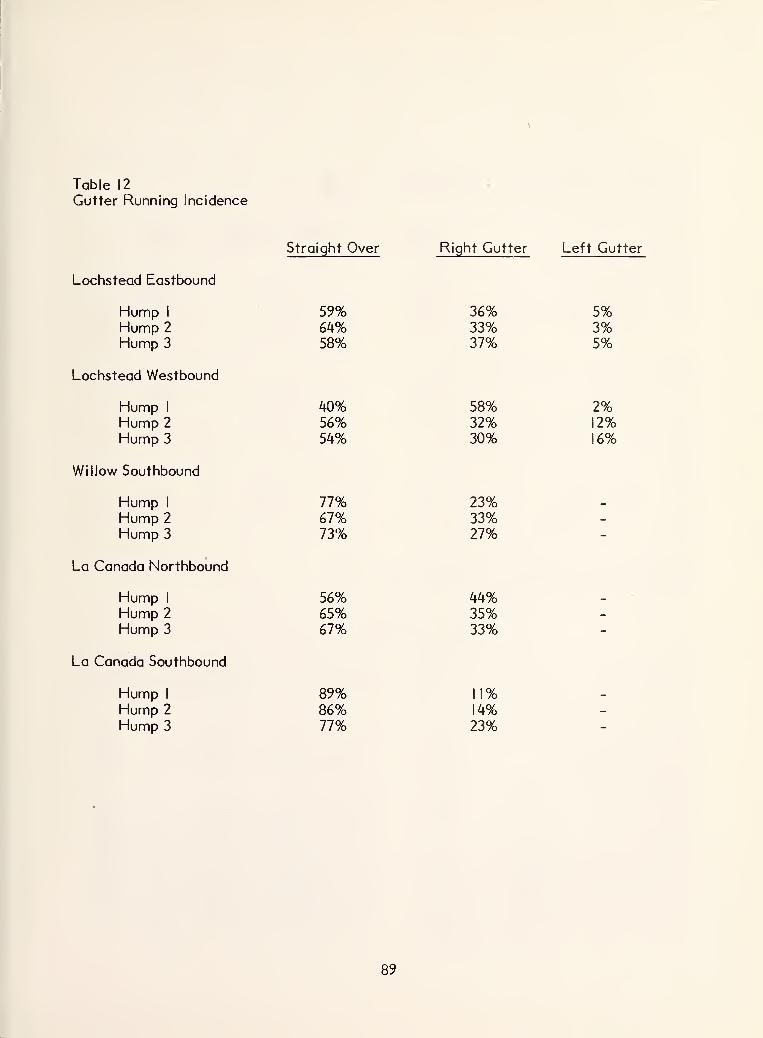
Table 12
Gutter Running Incidence
Lochstead Eastbound
Hump I
Hump 2
Hump 3
Lochstead Westbound
Hump I
Hump 2
Hump 3
Willow Southbound
Hump I
Hump 2
Hump 3
La Canada Northbound
Hump I
Hump 2
Hump 3
La Canada Southbound
Hump I
Hump 2
Hump 3
Straight Over Right Gutter Left Gutter
59%64%58%
36%33%37%
5%3%5%
40%56%54%
58%32%30%
2%12%16%
77%67%73%
23%33%27%
-
56%65%67%
44%35%33%
-
89%86%77%
11%14%23%
-
89
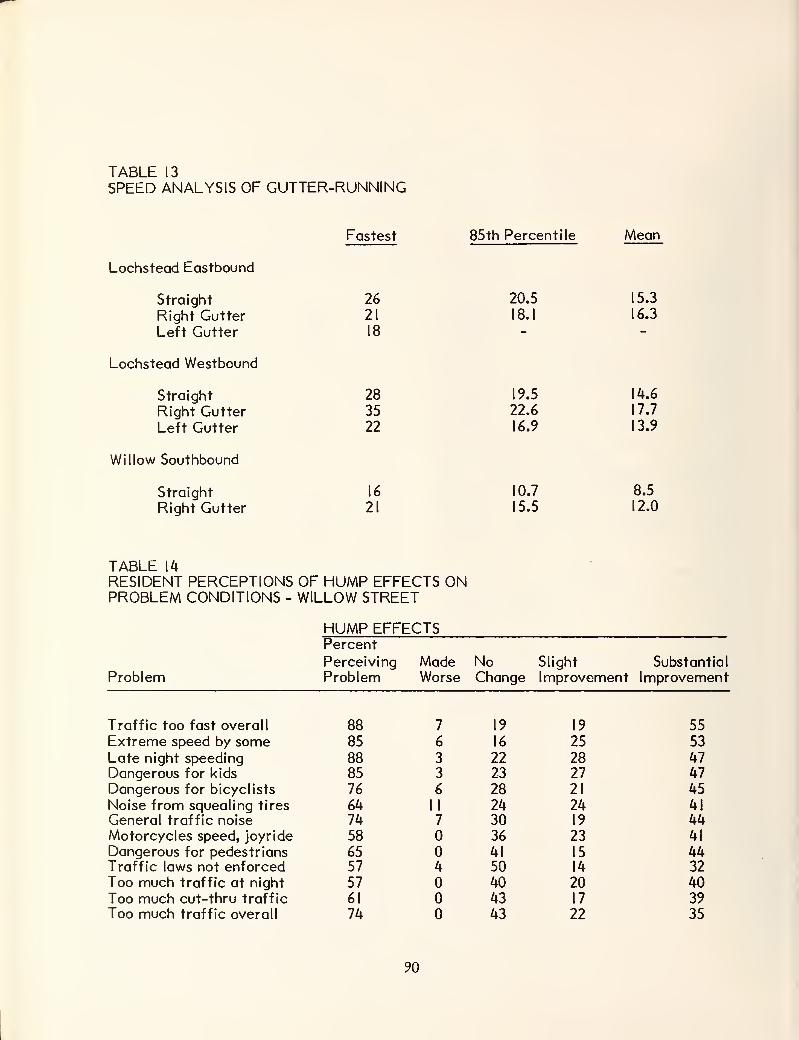
TABLE 13
SPEED ANALYSIS OF GUTTER-RUNNING
Lochstead Eastbound
Straight
Right GutterLeft Gutter
Lochstead Westbound
Straight
Right GutterLeft Gutter
Willow Southbound
Straight
Right Gutter
Fastest 85th Percentile Mean
26
21
18
20.5
18.1
15.3
16.3
28
3522
19.5
22.6
16.9
14.6
17.7
13.9
16
21
10.7
15.5
8.5
12.0
TABLE 14
RESIDENT PERCEPTIONS OF HUMP EFFECTS ONPROBLEM CONDITIONS - WILLOW STREET
HUMP EFFECTSPercent
Perceiving Made No Slight Substantial
Problem Problem Worse Change Improvement Improvement
Traffic too fast overall 88 7 19 19 55Extreme speed by some 85 6 16 25 53
Late night speeding 88 3 22 28 47Dangerous for kids 85 3 23 27 47Dangerous for bicyclists 76 6 28 21 45Noise from squealing tires 64 II 24 24 41
General traffic noise 74 7 30 19 44Motorcycles speed, joyride 58 36 23 41
Dangerous for pedestrians 65 41 15 44Traffic laws not enforced 57 4 50 14 32Too much traffic at night 57 40 20 40Too much cut-thru traffic 61 43 17 39Too much traffic overall 74 43 22 35
90
Willow Street Residents
Table 14 presents Willow Street resident
ratings of problem conditions which mayhave existed before the humps were in-
stalled and how installation of the humpsmay have affected the condition. TheTable clearly indicates a diversity of
opinions as to which conditions wereproblems before and how much improve-ments the humps have brought about.
However, on all conditions which morethan 80 percent of the question respon-dents rated as a problem, more than 70
percent indicated the humps had pro-duced a slight or a significant improve-ment. And these particular conditions -
overall traffic speed, extreme speed bysome drivers, late night speeding anddanger for children - are the ones mostrelated to the obvious purpose of placing
the humps. Furthermore, on all butthree conditions, the numbers reporting
that humps produced some improvementcomprised over 70 percent of those whorated the condition as a concern beforethe humps were installed. On the re-
maining three conditions, more than 60percent of those reporting them a as
concern rated the humps as producingsome degree of improvement. While thenumbers reporting "no change" in someconditions are substantial, no significant
numbers report worsening on any condi-tions except for "noise from squealing
tires" where three respondents (II per-cent) disagree with the majority. Sooverall the humps can be rated as havinga very fair degree of success in respond-ing to conditions of concern to residents.
Relative to post-installation speed con-ditions, 21 percent of respondents indica-
ted overall speeds remained "far toohigh", 23 percent indicated it was now"slightly faster than it should be", 32percent felt speed was "about right" for
the street and 19 percent believed traf-
fic was held to speeds "somewhat slowerthan reasonable." Only 5 percent felt
traffic was confined to speeds "muchslower than reasonable". Twenty-fivepercent felt that the fastest drivers werestill able to travel "any speed they wish",
while 60 percent felt the fastest drivers
had "slowed somewhat, though still tra-
veling too fast." Fifteen percent believe
fastest drivers are now confined to
speeds "not much faster than averagedrivers. These results are quite similar
to the perceptions of residents at the
Brea installation.
Resident perceptions of "gutter-running"
on Willow was also similar to resident
perceptions at the Brea test site.
Twenty-six percent indicated gutter-
running was "so frequent it defeats the
purpose of the humps;" 43 percent in-
dicated that gutter-running "was fairly
frequent, but even gutter-runners slow
down some;" 26 percent said gutter-run-
ning was "not very frequent but those
who do it drive dangerously fast." Only 6
percent thought gutter-running was "too
infrequent to worry about." In the "com-ment" section, several residents suggest-
ed extending the humps to the curb faceas a countermeasure to gutter-running.
After hump installation, only 18 percentof Willow Street residents felt their
street was "still quite dangerous consid-
ering safety from traffic of pedestrians,
bicyclists and kids in general". This is
markedly better than at the Brea site
where 534 percent of the residents felt
their street was still quite dangerous.
Fifty-five percent of Willow Street re-
spondents felt its safety characteristics
were "about average for a residential
street;" 24 percent felt it was "safer
than average" while only one respondentrated it "very safe". Ten percent of the
Willow Street respondents felt that noise
of traffic braking and accelerating nearthe humps was "a severe problem"; 31
percent indicated it was an "occassional
nuisance," 27 percent felt it was "an oc-
casional nuisance but worth it to keep
91
speeds down" while 31 percent indicated
it was "no problem at all." It is unclear
whether those who indicate serious noise
disturbance are those living closest to
the humps (thus, most exposed to the
noise) or whether they are persons whooppose the humps in principle and are
just using the potential noise issue as
another justification for their position.
What is clear is that 50 percent of those
who indicated they did not believe the
humps served a useful purpose and want-ed them removed also indicated noise as
a severe problem. Some 24 percent of
respondents rated the humps "too se-
vere"; 64 percent rated them "about
right to slow traffic safely," 9 percent
rated them "somewhat more gentle than
they should be" and one respondent rated
them "far too gentle to be effective".
This is in marked contrast to the Brea
results where none of the respondents
rated the humps "too severe" and 33 and20 percent rated the humps in the "some-what more gentle than they should be"
and "far too gentle" categories respect-
ively. This difference seems to highlight
the importance of close adherence to the
prescribed TRRL hump shape - the Breahumps tended to be about .5 inch (1.25
cm) lower than the intended 4 inch (10
cm) height projection; the Willow (and
Lochstead) humps tended to be about .5
inch (1.25 cm) high. Residents wereasked to rate the degree of difficulty
they had personally experienced while
driving various vehicle types across the
humps. Expectedly, most experience wasconfied to automobile operation. Eighty
four percent reported "no difficulty"; 8
percent indicated experiences in the
"moderate" and "serious difficulty"
categories. Five respondents reported
experiences as operators of vans or pick-
ups; all reported "no difficulty". Tenrespondents reported on experiences as
bicyclists; 9 reported "no difficulty"
while one reported "serious difficulty".
Joy-riders on the humps do not appear to
be a serious concern. Only two respon-
dents rated it a serious continuing prob-
lem. Sixteen percent said it was "a prob-
lem at first"; 35 percent said it "wasnever a problem". Signing and markingthe humps clearly requires improve-ment. Sixty percent of the respondents
rated current provisions "insufficient to
warn drivers". Only 38 percent felt the
signs and markings were "about right".
Less than 10 percent felt that the signs
and markings were so obtrusive as to de-
tract from the appearance of the neigh-
borhood.
As to spacing between humps, 68 percent
felt the humps were spaced "about
right"; 23 percent thought them "too far
apart" while only 9 percent rated them"too close". On the related question of
the adequancy of the number of humpson the test segment, 53 percent of
Willow Street respondents indicated the
number (3) was "about right" for the test
segment; 39 percent thought there were"too few" humps while 8 percent thought
there were too many. In the commentsection 8 respondents made specific
recommendation for more humps mostsuggesting a location between the last
existing hump and Centre Street.
On the fundamental question of whetherthe humps were good or bad overall, sup-
port for the humps was extremely
strong. The two questions, "do the
humps serve a useful purpose" and,
"should the humps remain on this street
after the test period" received an ident-
ical 88 percent affirmative response.
Eighty-one percent of the respondents
thought the humps should be used on
other streets experiencing similar traffic
problems and 83 percent felt no mea-sures more effective than the humps in
controling traffic speeds existed. Re-sponses in the comment section con-
structively supported the humps by a 22
to I margin.
92
Lochstead Avenue Residents
Lochstead Avenue residents' perceptions
that problems existed before installation
of the humps and their perceptions that
the humps brought about changes closely
paralleled those of Willow Street resi-
dents presented on Table 15. Some 93percent of the repondents felt that "toofast overall traffic speeds," "extremespeeds by some drivers" and "danger to
kids" were problems before the humpswere installed. Of those who expressedconcern on these particular problems,between 62 and 75 percent felt the
humps had caused a significant or at
least a slight improvement.
Relative to post-installation speed con-ditions two respondents felt speeds re-
mained "far too high", 33 percent indi-
cated speed on the street was "slightly
faster than it should be", 40 percent re-
ported speed "about right for this street"
and one respondent each believed traffic
was confined to speeds "somewhat slowerthan reasonable" and "much slower thanreasonable". Twenty percent felt thefastest drivers still traveled "any speedthey wish"; 53 percent felt they "slowedsomewhat though still traveling too fast"
while 27 percent rated the fastest as
"not much faster than average drivers."
Twenty percent felt gutter-running was"so frequent it defeats the purpose of thehumps;" 73 percent felt gutter-runningwas "fairly frequent but even the gutter-
runners slow down some;" one respondentindicated that "gutter-running was notvery frequent, but those who do drive
dangerously fast. In the comment sec-tion 40 percent of the respondents sug-gested extending the humps to the curbface as a countermeasure to gutter-run-ning. An additional measure - bollardsbehind the curb line was suggested as acounter to gutter-runners who mightjump to curb. With the humps installed
only 13 percent of Lochstead respondents
felt their street was "still quite danger-ous"; 47 percent felt it was "about aver-
age for a residential street", 33 pecentfelt it was "safer than average" and onerespondent felt it was "very safe".
One respondent felt that noise of traffic
braking and accelerating near the humpswas "a serious problem"; 33 percent ra-
ted it an "occasional nuisance"; 40 per-
cent said it was "an occasional nuisance
but worth it to keep speed down" while
20 percent indicated it was "no problemat all."
Two-thirds of the respondents rated the
humps severity "about right to slow traf-
fic safetly"; 20 percent felt they were"more gentle than they should be and the
"too severe" and "far too gentle" cat-
egories drew one response. In rating
hump crossing difficulty experienced as adriver of various vehicle types, only the
passenger auto category drew meaningfulresponse. Eighty-seven percent indica-
ted "no problem": crossing the humpswhile 13 percent indicated "moderate-difficulty".
Lochstead residents do not appear dis-
turbed by joy-riders on the humps.Sixty-nine percent indicated this was"never a noticable problem"; 23 percent
rated it a "minor problem" and only onerespondent called it "a serious continuing
problem".
Lochstead respondents perceptions re-
garding the adequancy and aesthetics of
hump signs and markings appears less
pronounced than on the other test
streets. Fourty-three percent thought
the existing provisions were "insuffic-
ient" to warn drivers of the humps pre-
sence; 50 percent thought the signs andmarkings were "about right" while onethought they were "more extensive than
necessary". As to appearance, 3 1 per-
93
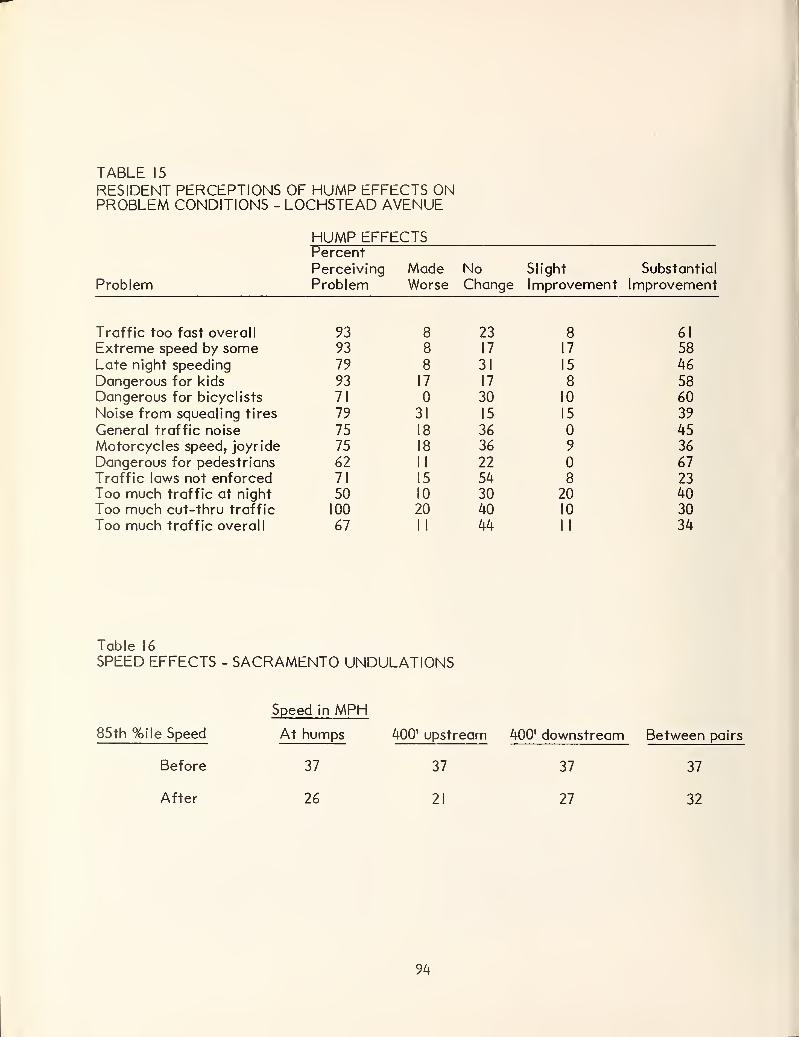
TABLE 15
RESIDENT PERCEPTIONS OF HUMP EFFECTS ONPROBLEM CONDITIONS - LOCHSTEAD AVENUE
HUMP EFFECTSPercent
Perceiving Made No Slight Substantial
Problem Problem Worse Change Improvement Improvement
Traffic too fast overall 93 8 23 8 61
Extreme speed by some 93 8 17 17 58Late night speeding 79 8 31 15 46Dangerous for kids 93 17 17 8 58Dangerous for bicyclists 71 30 10 60Noise from squealing tires 79 31 15 15 39
General traffic noise 75 18 36 45Motorcycles speed, joyride 75 18 36 9 36
Dangerous for pedestrians 62 II 22 67Traffic laws not enforced 71 15 54 8 23Too much traffic at night 50 10 30 20 40Too much cut-thru traffic 100 20 40 10 30Too much traffic overall 67 II 44 II 34
Table 16
SPEED EFFECTS - SACRAMENTO UNDULATIONS
85th %ile Speed
Before
After
Speed in MPH
At humps
37
26
400' upstream 400' downstream Between pairs
37 37 37
21 27 32
94
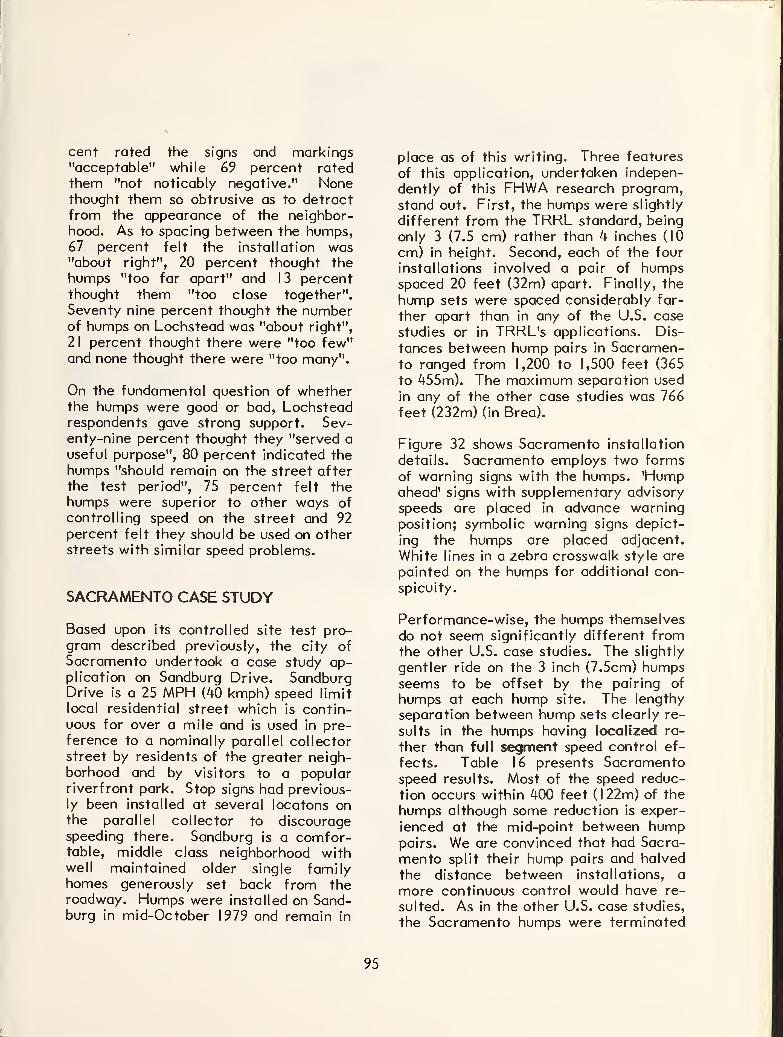
cent rated the signs and markings"acceptable" while 69 percent ratedthem "not noticably negative." Nonethought them so obtrusive as to detractfrom the appearance of the neighbor-hood. As to spacing between the humps,67 percent felt the installation was"about right", 20 percent thought thehumps "too far apart" and 13 percentthought them "too close together".
Seventy nine percent thought the numberof humps on Lochstead was "about right",
21 percent thought there were "too few"and none thought there were "too many".
On the fundamental question of whetherthe humps were good or bad, Lochsteadrespondents gave strong support. Sev-enty-nine percent thought they "served a
useful purpose", 80 percent indicated the
humps "should remain on the street after
the test period", 75 percent felt thehumps were superior to other ways of
controlling speed on the street and 92percent felt they should be used on otherstreets with similar speed problems.
SACRAMENTO CASE STUDY
Based upon its controlled site test pro-gram described previously, the city of
Sacramento undertook a case study ap-plication on Sandburg Drive. SandburgDrive is a 25 MPH (40 kmph) speed limit
local residential street which is contin-uous for over a mile and is used in pre-ference to a nominally parallel collectorstreet by residents of the greater neigh-borhood and by visitors to a popularriverfront park. Stop signs had previous-ly been installed at several locatons onthe parallel collector to discouragespeeding there. Sandburg is a comfor-table, middle class neighborhood withwell maintained older single familyhomes generously set back from theroadway. Humps were installed on Sand-burg in mid-October 1979 and remain in
place as of this writing. Three features
of this application, undertaken indepen-
dently of this FHWA research program,
stand out. First, the humps were slightly
different from the TRRL standard, being
only 3 (7.5 cm) rather than 4 inches (10
cm) in height. Second, each of the four
installations involved a pair of humpsspaced 20 feet (32m) apart. Finally, the
hump sets were spaced considerably far-
ther apart than in any of the U.S. case
studies or in TRRL's applications. Dis-
tances between hump pairs in Sacramen-to ranged from 1,200 to 1,500 feet (365
to 455m). The maximum separation used
in any of the other case studies was 766feet (232m) (in Brea).
Figure 32 shows Sacramento installation
details. Sacramento employs two formsof warning signs with the humps. 'Humpahead' signs with supplementary advisory
speeds are placed in advance warningposition; symbolic warning signs depict-
ing the humps are placed adjacent.
White lines in a zebra crosswalk style are
painted on the humps for additional con-
spicuity.
Performance-wise, the humps themselves
do not seem significantly different fromthe other U.S. case studies. The slightly
gentler ride on the 3 inch (7.5cm) humpsseems to be offset by the pairing of
humps at each hump site. The lengthy
separation between hump sets clearly re-
sults in the humps having localized ra-
ther than full segment speed control ef-
fects. Table 1 6 presents Sacramentospeed results. Most of the speed reduc-
tion occurs within 400 feet (122m) of the
humps although some reduction is exper-
ienced at the mid-point between humppairs. We are convinced that had Sacra-
mento split their hump pairs and halved
the distance between installations, a
more continuous control would have re-
sulted. As in the other U.S. case studies,
the Sacramento humps were terminated
95
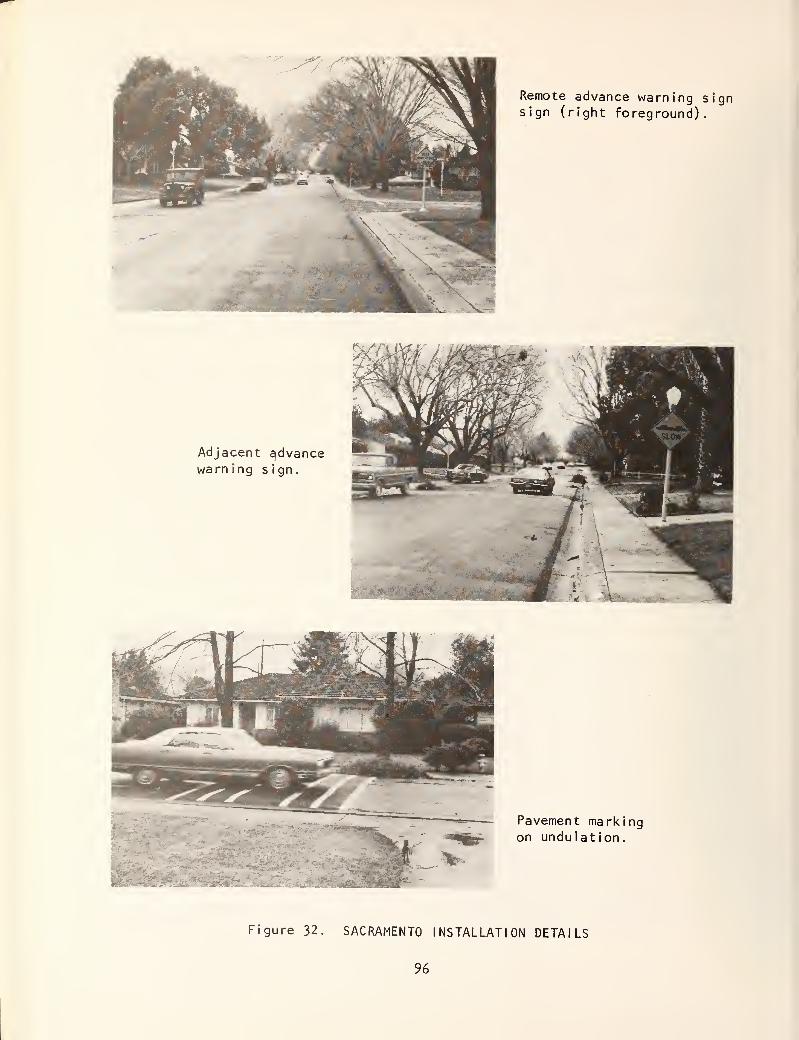
Remote advance warning signsign (right foreground).
Adjacent advancewarning sign.
Pavement markingon undulation.
Figure 32. SACRAMENTO INSTALLATION DETAILS
96
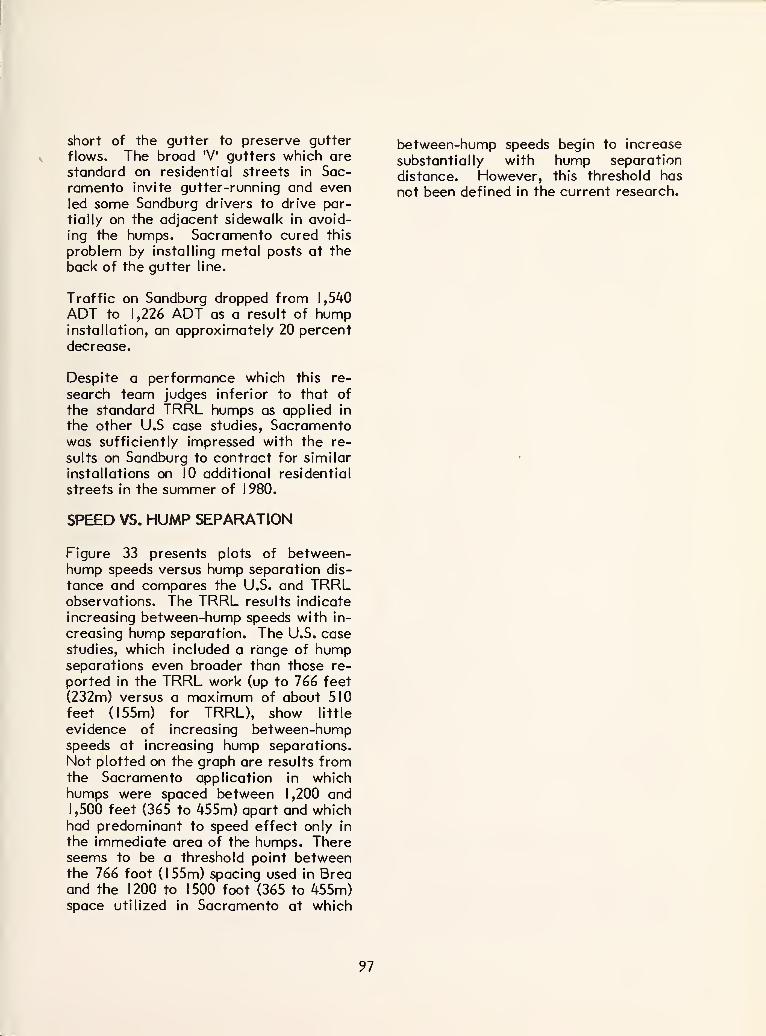
short of the gutter to preserve gutter
flows. The broad 'V gutters which are
standard on residential streets in Sac-ramento invite gutter-running and evenled some Sandburg drivers to drive par-
tially on the adjacent sidewalk in avoid-
ing the humps. Sacramento cured this
problem by installing metal posts at the
back of the gutter line.
Traffic on Sandburg dropped from 1,540
ADT to 1,226 ADT as a result of humpinstallation, an approximately 20 percentdecrease.
Despite a performance which this re-
search team judges inferior to that of
the standard TRRL humps as applied in
the other U.S case studies, Sacramentowas sufficiently impressed with the re-
sults on Sandburg to contract for similar
installations on 10 additional residential
streets in the summer of 1 980.
SPEED VS. HUMP SEPARATION
Figure 33 presents plots of between-hump speeds versus hump separation dis-
tance and compares the U.S. and TRRLobservations. The TRRL results indicate
increasing between-hump speeds with in-
creasing hump separation. The U.S. casestudies, which included a range of humpseparations even broader than those re-
ported in the TRRL work (up to 766 feet
(232m) versus a maximum of about 510feet (155m) for TRRL), show little
evidence of increasing between-humpspeeds at increasing hump separations.
Not plotted on the graph are results fromthe Sacramento application in whichhumps were spaced between 1,200 and
1 ,500 feet (365 to 455m) apart and whichhad predominant to speed effect only in
the immediate area of the humps. Thereseems to be a threshold point betweenthe 766 foot (155m) spacing used in Breaand the 1200 to 1500 foot (365 to 455m)space utilized in Sacramento at which
between-hump speeds begin to increase
substantially with hump separation
distance. However, this threshold has
not been defined in the current research.
97
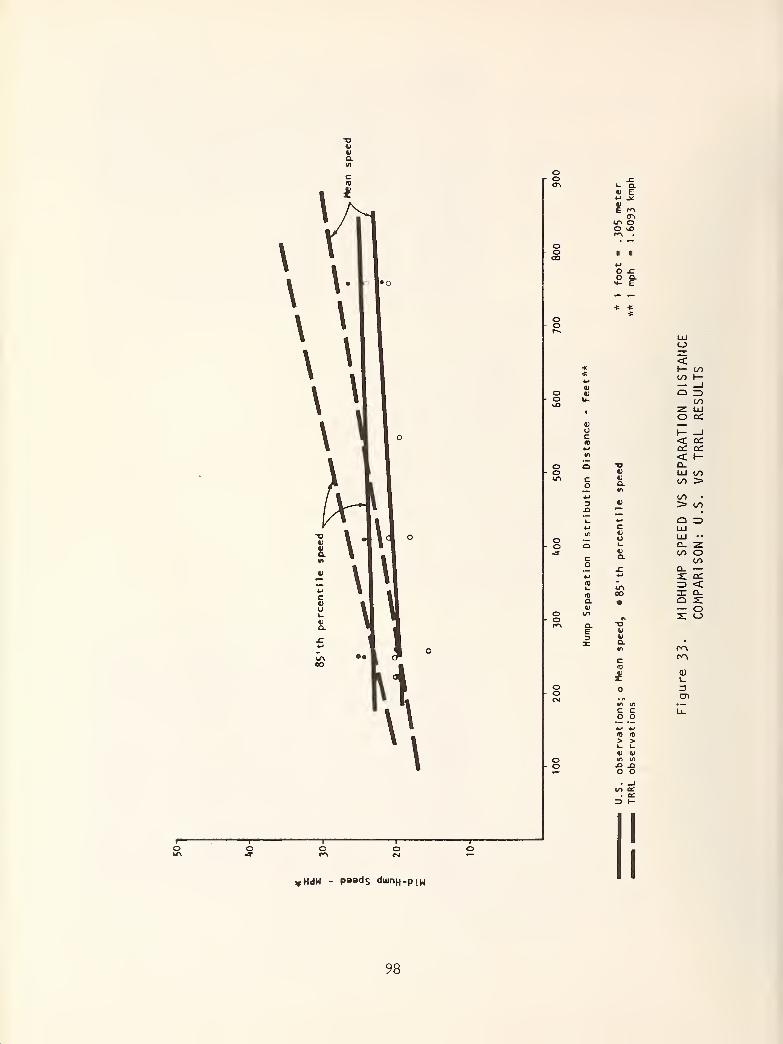
T3«tl
a.
\
\
\
\\
\
-T-o
—r-o
—T—o
ooen
O x:O Q-<«- E
o 8O li.
tl
V
LUo
CO2L LUO c£
< cccc a:< y-Q_LU COco >co •
> CO
o(/)
U LU ••
o O l_ a. z-3-
co
tl
o.
jC
CO oCO
Q_ —+J 4J 2: a:ID
t/\ => <<U CO IE Q_Q- • Q 2:41 — Oooen
* ST O««"> 0- "O
E V3 tl
X o. •
KV mC
(V^
15
i© 3©rsl CT)
o o
> >l. utl tl
«n <n
XI XIO O
3 t-
yHdW - P»»ds duinH -p!W
98
CHAPTER 4IMPLEMENTATION PLAN FOR ROADHUMPS
Applications of the hump on public
streets have been observed in NewZealand (one) and in Toronto, Canada(two locations) and reportedly are
widespread in India, although little
performance evaluation information has
been received from any of these sour-
ces. The device is also commonly used
as a design feature in woonerfs (special
residential streets on which cars are
required to travel slowly) in the Ne-therlands and Germany. This evidence of
proliferating use plus the original TRRLresearch and the case study work re-
ported in Chapter 3 of this report makean implementation plan for applications
of the road hump appropriate.
At this stage of its development, theroad hump cannot be said to have achiev-
ed the status of a standard traffic con-
trol device like a STOP or YIELD sign.
On the other hand, it has performed well
enough and long enough in public street
applications that it cannot be labeled as
raw or untested. It is a device which is
promising and with which further experi-
mentation is both needed and encourag-ed. Hence, the purpose of this imple-
mentation plan is not to endorse blanket
applications of road humps. Rather, re-
cognizing the need for further testing of
road humps under public street condi-
tions, this implementation plan is intend-
ed to encourage, facilitate and guide fur-
ther careful test applications.
SUMMARY OF ROAD HUMPSPERFORMANCE
Substantial reductions in the speeds of
the fastest cars can be expected along
with an 85th percentile speed of about 25
mph (40 kmph). Average speeds of
slightly under 20 mph (32 kmph) can beexpected. While automobiles can cross
the humps safely at high speeds, virtually
all choose to cross them at speeds whichare reasonable for local residential
streets.
Normally a series of humps rather than
a single one are used to control a street
segment. When spaced between from a-
bout 200 to 750 (6 1- 228m) feet apart,
the humps tend to exert speed control
over the entire test segment rather than
just in the immediate vicinity of the
humps. While slowest speeds tend to oc-
cur right at the humps and vehicles doaccelerate somewhat between humps,the humps tend to have a relatively con-
tinuous, segment-long control effect.
Automobiles should not "bottom-out"nor their drivers experience control
difficulties on the humps.The humps have more severe effects
on long wheelbase vehicles than on auto-
mobiles. Potential effects on long
wheelbase vehicles, particularly emer-gency vehicles, are an important con-sideration when determining whether the
humps are an appropriate control for a
particular street. This is discussed in
detail subsequently.
The humps can be crossed by bicyclists
and motorcyclists with no difficulty al-
though both may occasionally use themas an aid in performing "wheelies".
Traffic reductions on the order of 20
percent were experienced on the hump-controlled segments in the case studies.
The extent to which diversion will occurin any application will depend on the
hump-controlled segment's placement in
its area street network and the avail-
ability of other convenient routes for
drivers.
GENERAL CRITERIA FORAPPLICATION
The humps are an extremely restrictive
form of speed control which causes somediscomfort for drivers who are traveling
too fast. For this reason, they should be
99
used only where there is a confirmedspeed problem and where other reason-able speed control measures have failed
or do not appear likely to perform satis-
factorily. Resident concern about speed-
ing should be broad-based; not limited to
a few vocal gadflies.
The humps should be applied only on
local streets where the speed to whichthe humps confine traffic is reasonably
in keeping with the intended functional
role of the street - that is, a street
where a 25 mph ( 40 kmph) speed limit is
reasonable. Most likely the street should
be one intended primarily to provide
local access to residents and be predom-inantly fronted by residential properties
(although use on a local access street in
an industrial park might also be appropri-
ate). A street used somewhat by through
traffic is acceptable but it should beclear that the through service function is
subordinate to the street's basic residen-
tial access character or that through
traffic is undesired on the street. Thehumps should not be used on streets
where the vast majority of the drivers
travel at relatively fast speeds (say, 45
or 50 mph (72 - 80 kmph)) and where the
objective is to limit them to a moremoderate speed (say 35 mph (56 kmph)).
The humps should not be used on
streets which are expected to serve
heavy volumes of truck traffic or whichare on bus routes.
The humps should be used on streets
where traversal by emergency vehicles
will be only in response to an emergencycall in the immediate vicinity - not onroutes commonly used by emergency ve-hicles as access corridors to large areasof the community. The humps should not
be used on immediate egress routes fromfire and ambulance stations or on im-mediate access routes to hospitals andemergency clinics.
No absolute traffic volume limits for
streets on which the humps might be em-ployed are suggested, though streets
carrying under 3000 ADT should general-
ly be accepted. If a candidate streeet
serves a volume which implies a strongcollector or arterial function, the pre-
viously posed question of whether this
restrictive form of speed control is
consistent with the intended functional
role of the particular street must becarefully considered. Where traffic vol-
umes on the candidate street are sub-
stantial, the potential impacts of di-
verted traffic should be considered.
Based on case study experience, a diver-
sion of about 20 percent of the existing
volume might be a reasonable expecta-tion. Humps should not be placed on
streets where diverted traffic wouldcreate intolerable congestion elsewhereor adversely impact adjacent local re-
sidential streets.
Vertical alignment of the segment to
be controlled should be reasonably un-
iform. The humps have been tested in
only one on-grade situation. Placementon long, steep grades or "roller-coaster"
profiles is unacceptable A segmentwhich has one or two short, steep grades
in an otherwise fairly level section might
be acceptable so long as humps are not
placed on the grades.
Horizontal alignment need not neces-
sarily be tangent but should allow for
adequate sight distance to the humps andshould not impose the need to traverse a
hump while engaged in a sharp turning
maneuver.No absolute limits to the length of a
hump controlled street segment are
specified. In the British tests, street
segments up to .52 (.84 km) miles long
have been hump-controlled. The upper
limit to the length of continuous street
to which the humps might reasonably be
applied tends to be a function of the
street's role in the area street networkrather than a length-specific one. That
is to say, streets which are continuous
over long distances tend to have collec-
tor street function and importance as
emergency vehicle routes and the facts
of its service in these roles rather than
100
its absolute length are the dominant cri-
teria. Very short streets rarely havespeed problems. The practical lower
limit to the length of segment on whichhumps could be applied is determined by
the ability to provide adequate advancewarning and sight distance on all ap-
proaches to the humps.A candidate street for application of
the humps should have good pavementsurface quality, reasonably good drainage
and street lighting and be free of unusual
features which might in combination
with the humps, cause some sort of unus-
ual performance effect.
INSTALLATION DETAILS
If a street meets the above general cri-
teria, the formal design and implementa-tion program can proceed. Two majoractivities are involved at this stage:
• Design and constructions
• Dealing with the various people whouse the street.
Design and Construction
Fundamental engineering design require-
ments for a hump control plan are rela-
tively straightforward. But because so
many of the details which affect the suc-
cess of the installation can only be re-
cognized in the field, it is important that
basic decisions relative to hump location
signing and marking be made by a per-
ceptive engineer working on-site. Thefollowing are key considerations in locat-
ing the humps.
• The first hump in a controlled segmentshould be placed such that drivers areunlikely to approach it at high speed.
The British followed the practice of
placing the first hump in a series about50 feet (15m) from a STOP or signal-
controlled intersection or right-angle
turn. The greater offsets of the first
humps used in the U.S. case studies
(160 to 390 feet (49 - 199m)) provided
more room for advance warning andsight distance but also allowed greater
opportunity for drivers to accelerate
before encountering the hump. First
hump location 150 to 200 feet (45 -
60m) from the approach intersection
or turn appears to be sufficiently close
to confront drivers before they can ac-
celerate to high speed yet sufficiently
set back to allow for adequate sight
distance and warnings. Most desirable
location of the first hump will vary
depending on other relevant site de-
tails as discussed below.
• The number of humps required and de-
sirable spacing between humps will
vary from site to site. The British
achieved satisfactory speed control
results with hump spacings ranging
from about 160 to feet 510 (49 -
155m). In the U.S. case studies,
satisfactory control was achieved at
spacings up to 766 feet (231m). Thefollowing general guides should be
considered in determining the numberand placement of humps in a control
segment.
1. Single short blocks (under, say, 400feet (120m)) with speed control
problems are unusual. Where such
blocks must be treated, a single
undulation positioned near mid-block would likely satisfy the "first
hump encountered" placement con-
sideration described above andprovide satisfactory speed control
over the entire block.
2. Where control is required on single
block segments of moderate length,
a two hump configuration should besatisfactory.
3. On very long blocks, 3 or morehumps may be necessary.
101
4. On lengthy continuous segments or
on control segments comprised of a
number of blocks, it appears desir-
able to space interior humps 400 to
600 feet (120 - 180m) apart, al-
though spacings up to 750 feet
(230m) apart may be satisfactory.
At least one hump should be placedin each block of a control segment.
Figure 34 illustrates these spacing con-
cepts.
• Site details should be the dominantconsideration in determining the pre-
cise location of each hump rather than
attempting to provide some uniform
separation distance (like exactly 400
or exactly 500 feet (130 or 153m)) or
some exact offset distance in "first
hump" placement. The "first hump"and separation guidelines above are
flexible should only be used for general
locational guidance. A partial check-
list of site details which should betaken into account in hump location
are as follows.
1
.
Do not locate the humps over man-holes, gate valves utility vault
accesses and similar features.
2. If a drainage inlet is near where a
hump would be placed according to
the general spacing criteria, at-
tempt to locate humps just down-stream of the drainage inlet.
3. Adjust hump placement to take
advantage of the locations of
existing street lighting features.
4. Do not place humps at driveway
access points.
5. Do not place humps at fireplugs.
6. Consider visibility and placementof warning signs when locating the
humps.
7. Attempt to locate the humps on
property lines rather than right in
front of a residence.
8. Adjust placement to assure ade-quate sight distance to the humpsfrom both approach directions.
9. Take into account other unique site
details which may affect humpplacement. For example, do not
locate a hump between ends of a
loop driveway. Otherwise, a fewdefiant motorists are sure to use
the driveway to bypass the hump,producing an irate property owner.
Figure 35 presents the basic cross-sec-
tion of a hump (looking at right angles to
the direction of traffic). The humps are
12 feet (3.65m) long (in the direction of
traffic), have a circular arc cross section
(radius equals 54.22 feet (16.6m)) andproject to a midpoint height of 4 inches
(1 0cm) above the existing pavement sur-
face. Construction of the hump to rea-
sonably precise shape is important.
Humps with maximum heights much less
than 4 inches (1 0cm) are too gentle to be
effective. Humps with maximum heights
much greater than 4 inches (1 0cm) can
cause vehicles to "bottom-out". A tol-
erance of plus or minus .5 inch (1.25cm)
is suggested. In the case study sites,
public works crews were readily able to
construct the humps to these tolerances
using the methods described below. It is
preferable to end up with a hump that is
slightly low rather than one which is too
high.
Humps are constructed of hot rolled
asphalt overlayed on the existing pave-
ment surface. Application of a tack coat
is advisable. To assure against separa-
tion of the tapering edge of the overlay
from the existing pavement surface, the
existing pavement should be excavatedto a depth of 2 inches (5cm) (or to the
base course) along the last 1.5 feet (46
cm) of each hump edge as illustrated on
102
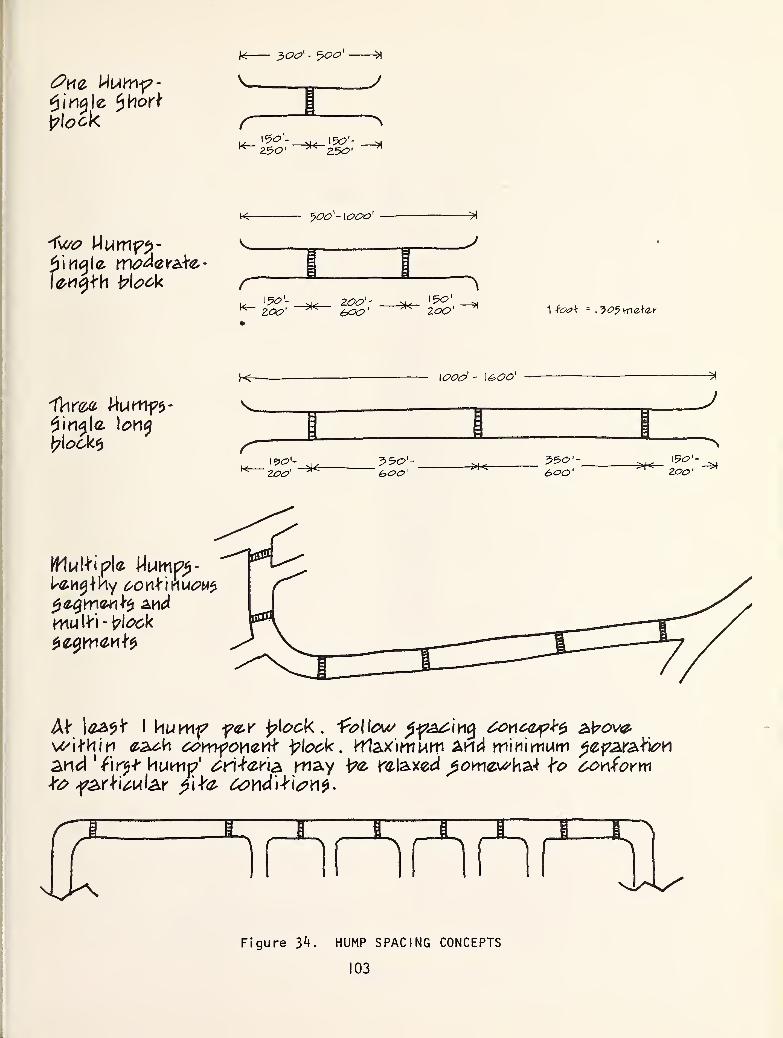
0v\<2, Wwm-p-3 ingle Jihorf
$\ock
k—V
- 30c 1
- ^' - a
-
r^ >»
length \7\0ck
^4^ 500 - \oc*y
^ J:
r \
K- zoo- -*el^ 1
2<?(9' 1 -fc?<?+ = .5<?5tn«+eK
v.
^
l£?<^7 - l<££>£'
-*«- ->Kr-
-J
U^H^ + hy 00Yti\Y\UOU$
Zbqynwfy andttiu Uri - i?l^k
A^ l#a^ I humf f<z>r flock. ^o\\ow ^-psa^ing zoncaspfy &Vov&within ^a^H comyowzYti pbok . rflaximwm Aki«4 minimum ^para-lvriand ' fir^ Hump' ^nteria may t?<& relaxed ^m^^ha-l -fa ^n-form
MTl 1
Figure 3**. HUMP SPACING CONCEPTS
103
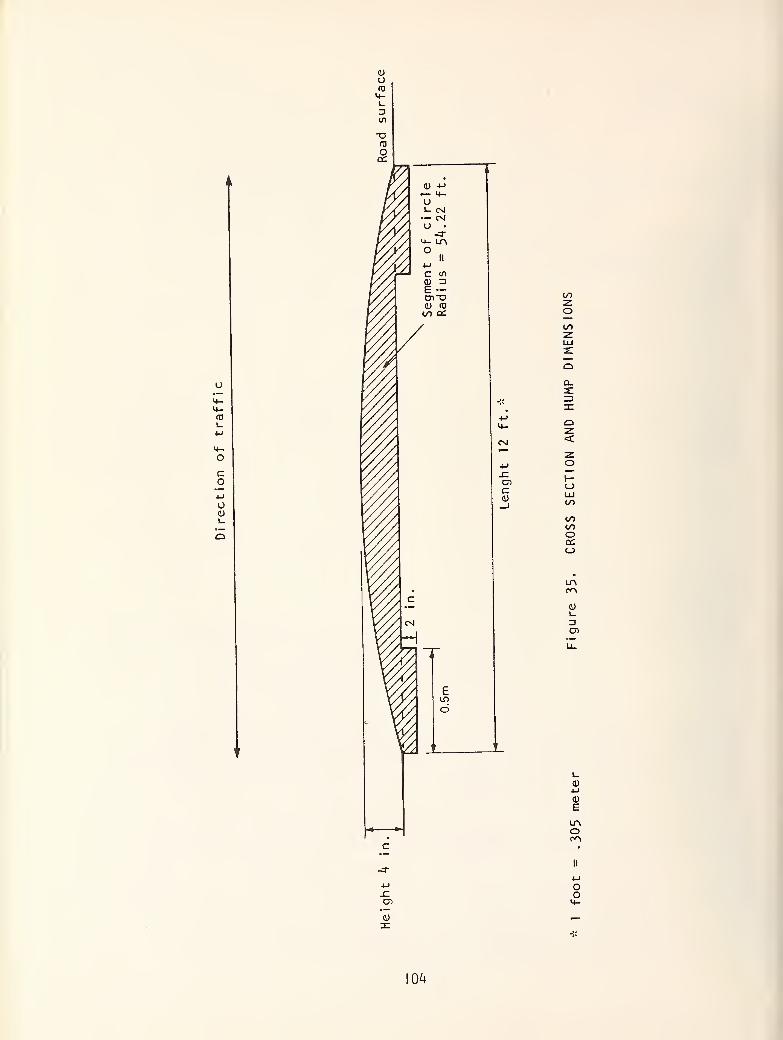
COz.oCO
3:
oz<
OLUto
COCOoq:o
3C71
1_
(Dl-J
EUAOCO
04
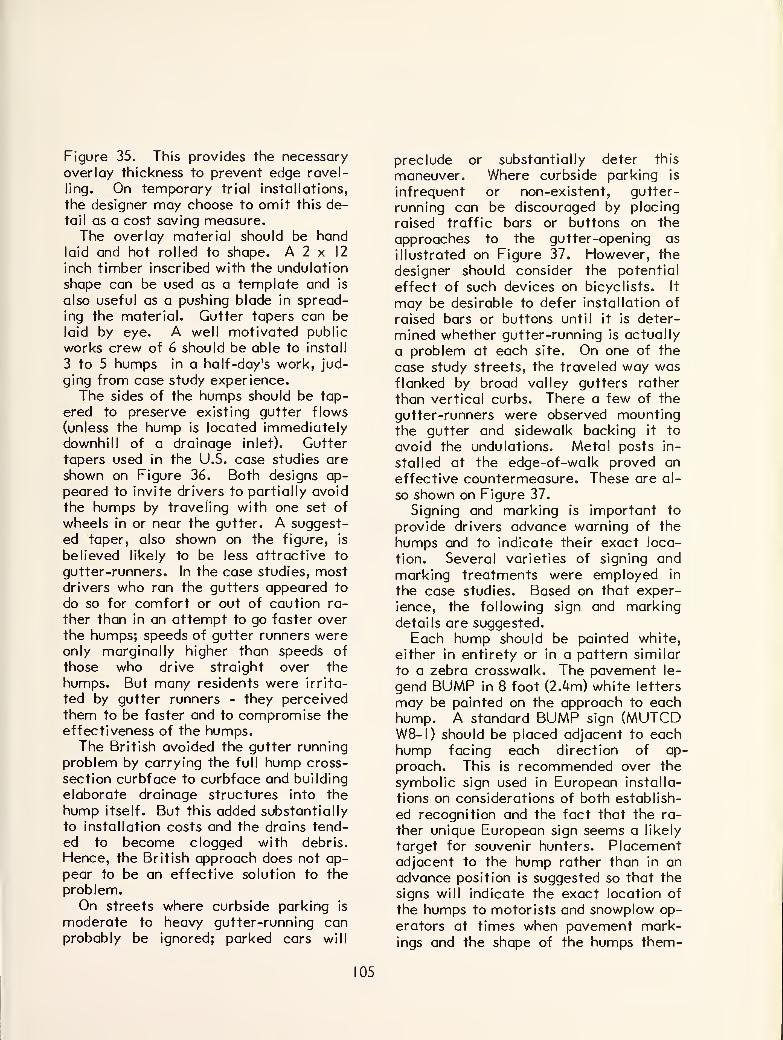
Figure 35. This provides the necessary
overlay thickness to prevent edge ravel-
ling. On temporary trial installations,
the designer may choose to omit this de-
tail as a cost saving measure.The overlay material should be hand
laid and hot rolled to shape. A 2 x 12
inch timber inscribed with the undulation
shape can be used as a template and is
also useful as a pushing blade in spread-
ing the material. Gutter tapers can belaid by eye. A well motivated public
works crew of 6 should be able to install
3 to 5 humps in a half-day's work, jud-
ging from case study experience.The sides of the humps should be tap-
ered to preserve existing gutter flows
(unless the hump is located immediatelydownhill of a drainage inlet). Guttertapers used in the U.S. case studies are
shown on Figure 36. Both designs ap-
peared to invite drivers to partially avoid
the humps by traveling with one set of
wheels in or near the gutter. A suggest-
ed taper, also shown on the figure, is
believed likely to be less attractive to
gutter-runners. In the case studies, mostdrivers who ran the gutters appeared to
do so for comfort or out of caution ra-
ther than in an attempt to go faster over
the humps; speeds of gutter runners wereonly marginally higher than speeds of
those who drive straight over the
humps. But many residents were irrita-
ted by gutter runners - they perceived
them to be faster and to compromise the
effectiveness of the humps.The British avoided the gutter running
problem by carrying the full hump cross-
section curbface to curbface and building
elaborate drainage structures into the
hump itself. But this added substantially
to installation costs and the drains tend-ed to become clogged with debris.
Hence, the British approach does not ap-pear to be an effective solution to the
problem.On streets where curbside parking is
moderate to heavy gutter-running canprobably be ignored; parked cars will
preclude or substantially deter this
maneuver. Where curbside parking is
infrequent or non-existent, gutter-
running can be discouraged by placing
raised traffic bars or buttons on the
approaches to the gutter-opening as
illustrated on Figure 37. However, the
designer should consider the potential
effect of such devices on bicyclists. It
may be desirable to defer installation of
raised bars or buttons until it is deter-
mined whether gutter-running is actually
a problem at each site. On one of the
case study streets, the traveled way wasflanked by broad valley gutters rather
than vertical curbs. There a few of the
gutter-runners were observed mountingthe gutter and sidewalk backing it to
avoid the undulations. Metal posts in-
stalled at the edge-of-walk proved an
effective countermeasure. These are al-
so shown on Figure 37.
Signing and marking is important to
provide drivers advance warning of the
humps and to indicate their exact loca-
tion. Several varieties of signing andmarking treatments were employed in
the case studies. Based on that exper-
ience, the following sign and markingdetails are suggested.
Each hump should be painted white,
either in entirety or in a pattern similar
to a zebra crosswalk. The pavement le-
gend BUMP in 8 foot (2.4m) white letters
may be painted on the approach to eachhump. A standard BUMP sign (MUTCDW8-I) should be placed adjacent to eachhump facing each direction of ap-
proach. This is recommended over the
symbolic sign used in European installa-
tions on considerations of both establish-
ed recognition and the fact that the ra-
ther unique European sign seems a likely
target for souvenir hunters. Placementadjacent to the hump rather than in anadvance position is suggested so that the
signs will indicate the exact location of
the humps to motorists and snowplow op-
erators at times when pavement mark-ings and the shape of the humps them-
105
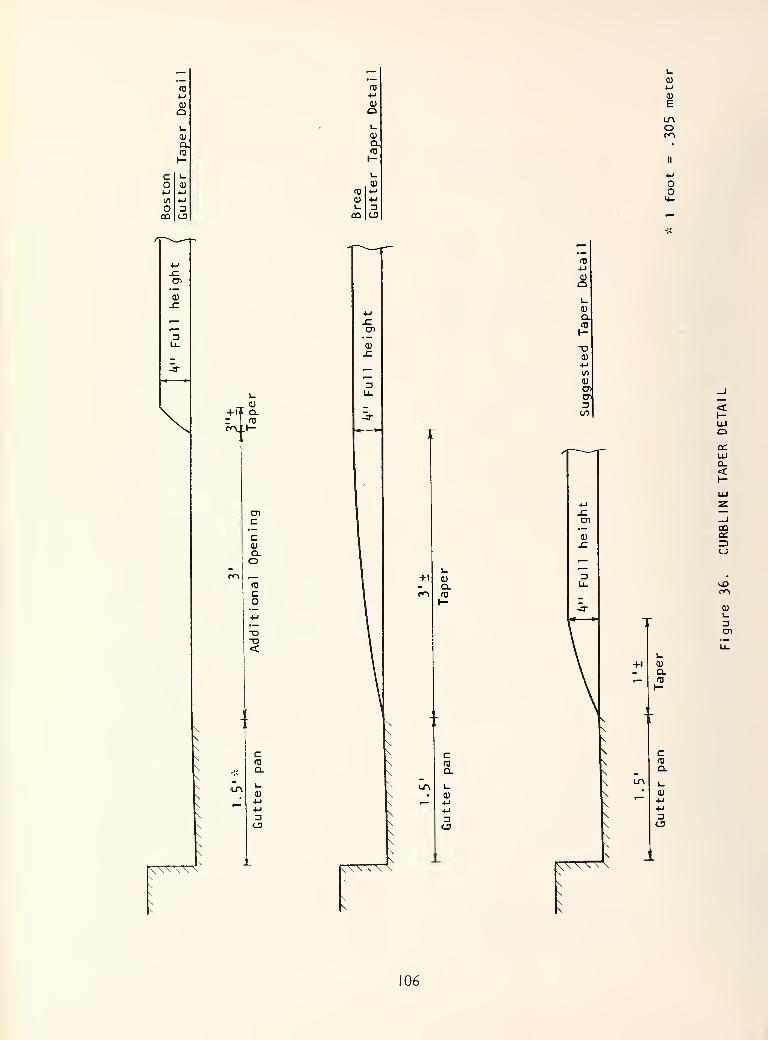
CD
CD
a.
CDo1_
<DQ.
H
L.
a>M<d
E
LTV
OCO
cOi-j
in
oCO
ai
-r<°
oM.1-
cnc
c0)
Q.o
<
\\
\
\\
\\\
CD
-o<D
CD
a)
to
+1 CD
Q.CD
CD
W\ V\ <
c
Q.
i-
CD
DCD
\
CfD
a.
CD
Qa:
<
C7>
+1l_
CD
Q.CD
CCD
Q.
3
tvttv
106
cur\?6>
quarter
Figure 37. GUTTER-RUNNING COUNTERMEASURES
I07
selves are obscured by snow. Each adja-
cent sign should be accompanied by a
supplementary advisory speed plate 25
MPH, TRUCKS 15 (40 and 24 kmph).Additional W8-I signs with the legend
in plural - BUMPS - should be placed in
advance warning position on both ap-
proaches to the street segment controll-
ed by humps. These should be accompan-ied by the supplementary plate "NEXT XXXX FEET" indicating the humpsshould be expected.BUMPS signs (W8-I plural) should also
be placed on the approaches on cross
streets from which significant volumesof traffic turn onto the hump-controlledstreet if not on all cross streets inter-
secting the hump-controlled segment.These should be accompanied by supple-
mentary warning arrow plates (WI-6 R or
L or WI-7) indicating the direction or
directions in which the humps are to beexpected.
Signs and markings should be in place
as soon as the street is opened to traffic
following hump construction.
Figure 23 in Chapter 3 shows some in-
stallation and signing details from the
case study sites
PREPARING THE STREET'S USERS
Three types of user groups need be pre-
pared for installation of the humps:residents of the street; police, fire,
ambulance and refuse collection ser-
vices; and other drivers on the street.
Relative to residents of the street, it
is assumed that there has been an on-
going community involvement process*and that it has been insured that a ma-jority of residents are disturbed enoughabout traffic speed to desire a counter-measure as stringent as the undulations.
At this point, the key task is to notify
residents of the fact and nature of the
installation to take place, the planneddate of installation, the duration of the
trial period (at least 3 months and pre-ferably 6 months to a year) if the instal-
lation is not considered permanent, whatmonitoring measures will be taken andhow residents can communicate their
perceptions of the humps performance,what can ba. expected of the humps andtips for driving various vehicles across
them.For emergency &r\d service operations
special instructions are recommended.For police the following points «hould becovered with «,top officials and> passeddown to the individual patrol officers.
• Indicate location of the humps and in-
stallation date and the objectives of
the installation.
• Advise patrol officers that they cantravel safely over the humps as fast as
they wish in pursuit and emergency re-
sponse situations. Request that patrol
officers not travel over the humps at
high speeds in routine patrol situations
so that other drivers will not emulatetheir behavior
• Request that police undertake no unus-
ual levels of traffic enforcement or
patrol activities near the hump site so
as to avoid biasing the evaluation of
humps performance. Where officers
on normal patrol operations observehazardous or miscreant driver behavior
near the humps, they should take ap-
propriate enforcement action.
• Establish special procedures for bring-
ing accident reports, observations of
unusual driver behavior or problems in-
volving the humps to the attention of
* For guidance in community involvement techniques in residential area traffic
managmenet see IMPROVING THE RESIDENTIAL STREET ENVIRONEMENT STATEOF THE ART, Federal Highway Administration, December, 1980.
108
the immediate attention of the traffic
engineer.
For fire services, the following points
should be covered with top officials andappropriately conveyed down to fire
fighters.
• Indicate the location and installation
date of the humps, nature of the
humps and the objectives of the instal-
lation.
• Advise all drivers that all fire vehicles
(except autos) should traverse thehumps at no faster than 15 MPH.
• Give all drivers in all fire companieswithin whose primary response areathe hump site is located the opportun-ity to drive over the humps during atraining period soon after the humpsare installed.
• Establish special procedures for im-mediate reporting to the traffic en-gineer any problem incidents involving
the humps.
For ambulance services convey the fol-
lowing points through top officials to theindividual drivers.
• Indicate the location and installation
date, nature of the humps and the ob-jectives of the installation.
• Advise all drivers that they may safely
traverse the humps at moderately high
speeds when not transporting patients.
• Advise all drivers that when carryingpatients, they should not traverse thehumps faster than 15 MPH (24 kmph)for the comfort and safety of patientsand attendants.
• Attempt to give all drivers serving thearea an opportunity to pass over the
humps in a training exercise.
• Establish special procedures for bring-
ing any incidents involving the humpsto the immediate attention of the
traffic engineer.
For refuse collection services , conveythe following points through top officials
to the individual drivers.
• Indicate the location, nature and in-
stallation date of the humps.
• Advise drivers to traverse the humpsno faster than 15 MPH, particularly
during collection operations when per-
sonnel may be riding exterior foot-
boards.
• Establish procedures for reporting anyhump - related incidents to the traffic
engineer.
If a school bus route traverses the hump-controlled street, follow the same pro-
cedures as for refuse vehicles above.
Note that humps should not be employedon streets which carry regular transit
routes.
Relative to the general driving public,
the recommended signs and markingspreviously described give adequate warn-ing of the humps presence and indication
of appropriate driving behavior. How-ever, the implementing jurisdiction mayfind it advisable to take special measuresbefore and a few days after installation
to help familiarize regular users of the
street with the devices. One possible ac-
tion is to hand out leaflets to drivers a
few days before installation. The leaf-
lets could also be delivered door-to-door
in areas where substantial numbers of
street users originate or are destined.
The leaflets sfioukd indicate the location,
nature of the humps, date of installation
and suggest appropriate driving behavior
for various types of vehicles.
A week or two in advance, large con-struction warning signs (black on orange)
could be placed at the approaches of the
109
segment to be controlled by humps indi-
cating the date and nature of the con-struction. For the first week or so fol-
lowing installation, temporary flashing
warning lights could be attached to the
standard warning signs recommended a-
bove. However, this seems excessively
cautious, unnecessary and inconsistent
with the character of the streets onwhich undulations would reasonable beapplied.
MONITORING AND EVALUATING THEHUMPS' PERFORMANCE
Given the relatively limited experiencewith public street applications of the
hump devices, it is crucial that local
jurisdictions employing it carefully mon-itor its performance. The following pa-ragraphs provide guidance in conducting'before and after' evaluations of the un-dulations. 'Before' measures should betaken as close to the time of application
as is practical. After measures should betaken in at least two and preferably
three periods - a 'first encounter' period
as soon as the street is reopened fol-
lowing installation, after 2 or 3 monthswhen reaction to the device has stabil-
ized and after 6 to 12 months to detectpossible long-term effects. In commun-ities which experiece radical sensonal
variations in traffic (summer or winterresorts or college towns, for instance)
monitoring periods should be adjusted so
that seasonal variations do not confoundthe interpretation of results. The 'first
encounter' observations are intended to:
• assure general adequacy of the instal-
lation,
• detect the possible need for any addi-
tional temporary or permanent warn-ing devices not included in the initial
installation,
• document any deviant driver behaviorexhibited as a first reaction to the
devices,
110
• develop countermeasures to any devi-
ant behavior Which seems to be unde-sirable, prevalent and likely to berecurrent (such as the possibility of
installing raised bars or dots to thwartgutter-running as described previous-
ly),
• obtain an early evaluation of the
humps performance and a basis for
comparing measures from the later
monitoring period to distinguish be-
tween short-term and long term ef-
fects.
As indicated above, the later monitoring
periods evaluate 'stabilized' and 'long-
term' effects. Measures which should be
taken include the following:
Speed Profiles similar to the examplesshown on Figure 26. It is important to
evaluate speeds of the fastest vehicles as
well as the 85th percentile and meanspeeds normally considered in conven-
tional speed studies. Individual vehicles
should be tracked by radar speed meterthrough the controlled segment andspeeds at selected points at and betweenthe humps recorded. It would be desir-
able to obtain separate speed profiles for
autos, trucks and motorcycles. But since
traffic volumes on the streets wherehumps will be employed tend to be low,
it is probably impractical to obtain
observations of sufficient numbers of
motorcycles and heavy trucks during
monitoring periods of reasonable dura-
tion.
Spot speed studies should be carried
out on parallel streets to detect whethertraffic diverted from the controlled
street changes conditions on these other
streets.
Twenty-four hour machine recorded
counts should be taken on the controlled
segment and on logical diversion routes.
Numers of vehicles which run gutters
versus those which go straight over the
humps should be counted and their speedcharacteristics compared.
Visual observations should be made of
various forms of deviant driver behavior
should be recorded.
Noise conditions should be recorded bysound meter. Procedures should be fol-
lowed to compute an Ljq or similar dura-
tional measure rather than just recording
the sound intensity of vehicles passing
with and without the humps.
Before and after accident experience in
the area should be compared even thoughon the low volume streets where the
humps are likely to be installed accidentstend to be few and are usually randomevents.
Opinions of residents and drivers should
be solicited using survey research tech-
niques. It may not be necessary to inter-
cept drivers on the street to surveythem. A doorstep-delivered question-
naire in an area tributary to the control-
led street can be effective in eliciting
drivers opinions. An examples of a re-
sident and driver questionnaires used at
one of the case study sites is reproducedin Appendix B.
Comments volunteered by the general
public as well as those elicited from the
emergency services should be compiledand analyzed in the evaluation.
Measures of change in street use (do
children play along the street more of-
ten, do pedestrian's habits change, dobicyclists use the street more frequently)
are interesting but difficult to measureobjectively.
Not all of these measures are relevant
to all monitoring periods and to both the
controlled street and parallel streets.
Table 17 summarizes the times and loca-
tions where each measure is appropriate.
FHWA FOLLOW-UP
The Federal Highway Administration is
interested in the results of all applica-
tions of the road hump device Jurisdic-
tions employing road humps are request-
ed to communicate their experiences to
Mr. John Fegan, Department of Trans-portation, Federal Highway Administra-tion, Office of Research, HRS-4h, Wash-ington, D.C. 20590 (Phone 202-426-0257).
II
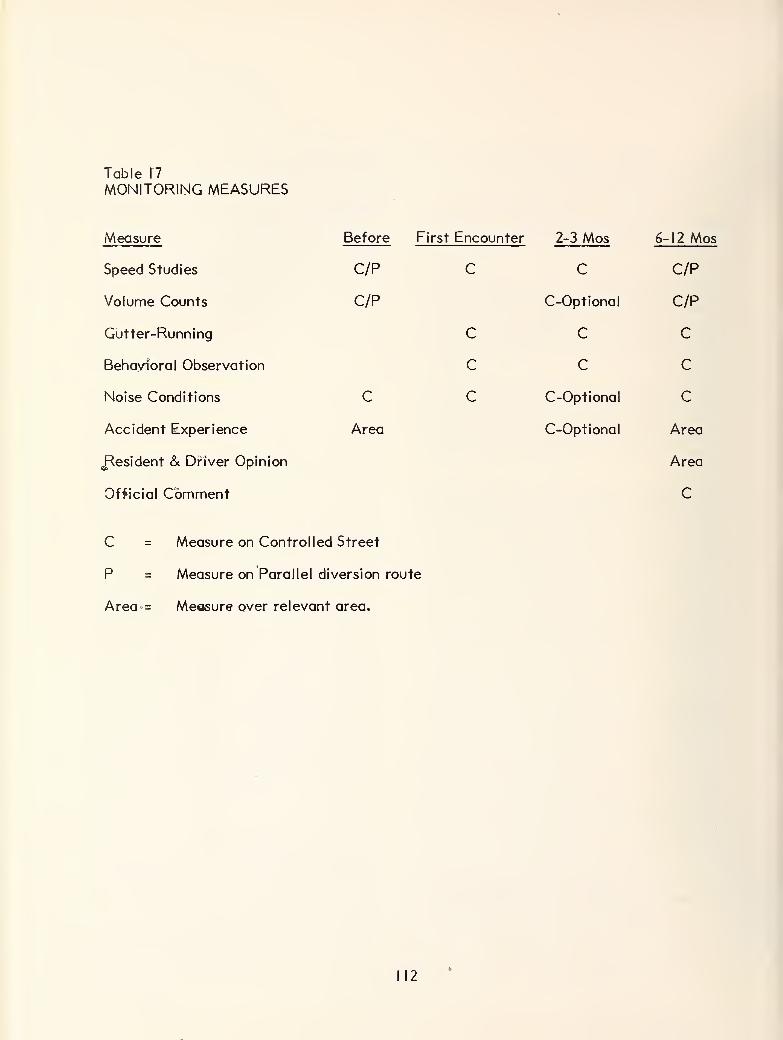
Table f7
MONITORING MEASURES
Measure Before First Encounter 2-3 Mos 6-12 Mos
Speed Studies C/P C C C/P
Volume Counts C/P C-Optional C/P
Gutter-Running C C C
Behavioral Observation C C C
Noise Conditions C C C-Optional C
Accident Experience Area C-Optional Area
.Resident & Driver Opinion Area
Official Comment C
C = Measure on Controlled Street
P = Measure onlParallel diversion route
Area-= Measure over relevant area.
112
CHAPTER 5STUDIES OF SPEED AND VOLUME ONRESIDENTIAL STREETS
THE PROBLEM
At the conclusion of the State-of-the-
Art phase of the project, the following
question was posed:
"A number of devices to control speedand volume on local residential streets
have been identified. Planning proce-
dures for their implementation havebeen outlined. But from a resident's
perspective, just how fast is too fast
for a residential street? How does this
compare with curent speed limits
typical for residential streets? Howmuch traffic is too much?
Appleyard's landmark studies in SanFrancisco of resident satisfaction with
their residential living conditions in
relation to street traffic involved ex-
tremely detailed measures of problemconditions and preferences.(22) But res-
ponses on these measures were comparedacross categorizations of traffic volumeconditions far too bioad to really deter-
mine crucial volume thresholds andwithout reference to any detailed speedcondition data. Still, Appleyard was able
to provide one important insight to the
speed problem - "a single fast car on
relatively lightly traveled streets seemedto be far more disturbing to residents
than steady volumes of relatively fast
traffic on the more heavily traveled
streets. Traffic engineers in local jurisd-
ictions frequently comment on the
residential street speed phenomenon in a
way that supports Appleyard's insight,
though they themselves do not share the
insight:
"That street (one about which resi-
dents are complaining) doesn't really
have a speed problem. There are only
a handful of really fast cars."
While the identification of the influence
of the "single speeding car" on resident
perception of speeding as a problem is animportant finding, it still does not an-
swer the questions "how much traffic is
too much" and "how fast is too fast".
In the State-of-the-Art report, it wasnoted that under 800 ADT residents weregenerally satisfied with traffic volumeson their streets; between 800 ADT and3000 ADT complaints were frequent andintense as residents became conscious of
traffic as an irritant but expected their
street to be a quiet, lighly traveled one;
at traffic levels above 3000 ADT, resi-
dents tend to concede their street to bea busy one and complain less aboutvolume. The report noted that this
pattern can be broken in specific circum-stances. If a high percentage of whattraffic there is on an under-800 ADTstreet is through traffic, residents will
complain. Or if residents of an above-3000 ADT street feel that traffic is
unfairly directed onto their street or if
there is a reasonable way this traffic canbe made to go elsewhere, they, too, will
complain. Unfortunately, the aboveassessment of volume sensitivity is a
judgemental one based upon cases re-
viewed in the state-of-the-art search andprior professional experience; not the
product of a rigorous statistical eva-luation. Available data would not sup-
port such a statistical evaluation.
22. Appleyard, D.A., Liveable Urban Streets,
Washington, D.C., 1976.
U.S. Department of Transportation,
113
Another approach considered was re-
lating speed-volume conditions to estab-
lished criteria for acceptable noise levels
in residential areas using accepted tech-
niques for projecting noise levels.(23)
The results of such an approach are
somewhat satisfying. It can be shownthat at typical residential street traffic
compositions, the combination of traffic
volumes in the 800 to 3000 ADT rangeidentified as critical in the discussion
above and speeds in the 25 to 30 mphrange are at the threshold area at whichnoise levels begin to exceed the criteria
for residential areas. However, tne re-
ferenced noise projection techniques areintended for application to considerably
higher traffic volume conditions andtheir application under these conditions
may be questionable.
Given all of the foregoing, the re-
search team was requested to devote a
modest portion of study resources to
direct measures responding to the ques-
tions 'how fast is too fast' and 'how muchis too much 1
. The sections which follow
detail that research. It must be emphq^sized that this is a modest effort to
"scratch the surface" on this subject
matter. The feasibility of the procedureis as much at interest as the findings.
The results presented are therefore
suggestive of further research rather
than conclusive.
RESEARCH PROCEDURE
The approach taken was to subject panels
of residents observing their own street to
vehicles traveling at different speeds andto platoons of vehicles simulating givenvolume levels. After each vehicle pass
in the speed studies and after each mon-itoring period in the volume studies, each
panelist would independently recordwhether the observed speed or volumewas acceptable or unacceptable. This
panel approach was chosen because it
gave the opportunity to measure resi-
dents' reactions to specific volumes andspeeds. An attempt to corollate resi-
dents' responses on a questionnaire to
traffic conditions naturally occurring ontheir street would have lacked this
specificity. Procedurally, the researchwent as follows:
Two middle income residential
neighborhoods were selected in Berkeley,
California (a San Francisco Bay Areacity of 100,000 population which is
among the frontrunners in traffic
management planning). Streets within
those neighborhoods were then chosen.
Criteria for street selection were that it
be a two-way block, usually experiencing
light traffic, and that it not be a
commercial or arterial route. There also
had to be enough physical room for
stationing 15-20 observers and 10 cars
without disrupting the passage of other
pedestrians and traffic, and there had to
be no stops at either end of the block, so
as to allow cars a safe and orderly run-up
to, and slow-down from, test runs on the
street. Randomly selected residents of
each street were asked to participate in
a traffic experiment in which they wouldspend a Saturday morning observing a
number of cars, noting their impressions
of both speed and volume. Finally, the
procedure was performed on the twostreets using the same protocols on each.
The physical characteristics of the twostreets selected are presented Table 18.
Except for width, the two streets andtheir respective neighborhoods were sim-ilar.
23. Transportation Research Board, NCHRP ReportGuide for Prediction and Control , 1976.
174, Highway Noise, A Design
14
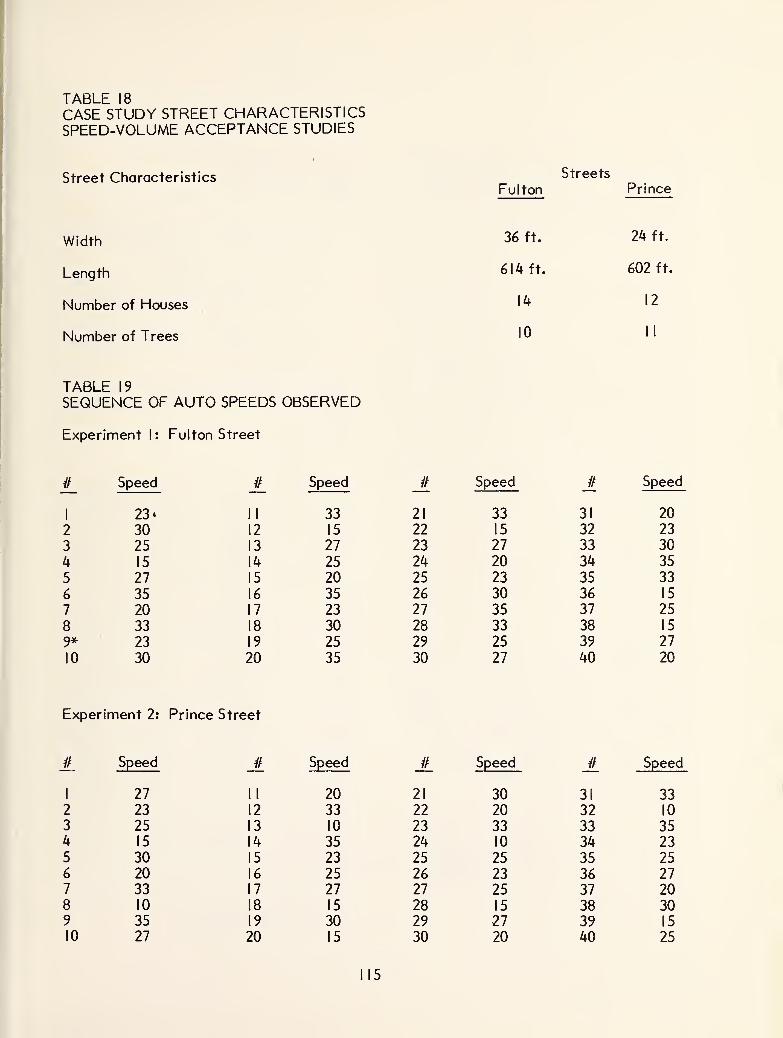
TABLE 18
CASE STUDY STREET CHARACTERISTICSSPEED-VOLUME ACCEPTANCE STUDIES
Street Characteristics
Width
Length
Number of Houses
Number of Trees
Streets
Fulton Prince
36 ft. 24 ft.
614 ft. 602 ft.
14 12
10 II
TABLE 19
SEQUENCE OF AUTO SPEEDS OBSERVED
Experiment I: Fulton Street
# Speed // Speed // Speed // Speed
1 23*
2 30
3 25
4 15
5 27
6 35
7 20
8 339* 23
10 30
II 33
12 15
13 27
14 25
15 20
16 35
17 23
18 30
19 25
20 35
21 33
22 15
23 27
24 20
25 23
26 30
27 35
28 3329 25
30 27
31 2032 23
33 3034 35
35 3336 15
37 25
38 15
39 27
40 20
Experiment 2: Prince Street
# Speed
1 27
2 23
3 254 15
5 306 207 338 10
9 3510 27
// Speed //
II 2012 3313 10
14 35
15 2316 25
17 27
18 15
19 3020 15
Speed // Speed
21 30 31 3322 20 32 10
23 33 33 3524 10 34 2325 25 35 2526 23 36 2727 25 37 2028 15 38 3029 27 39 15
30 20 40 25
115
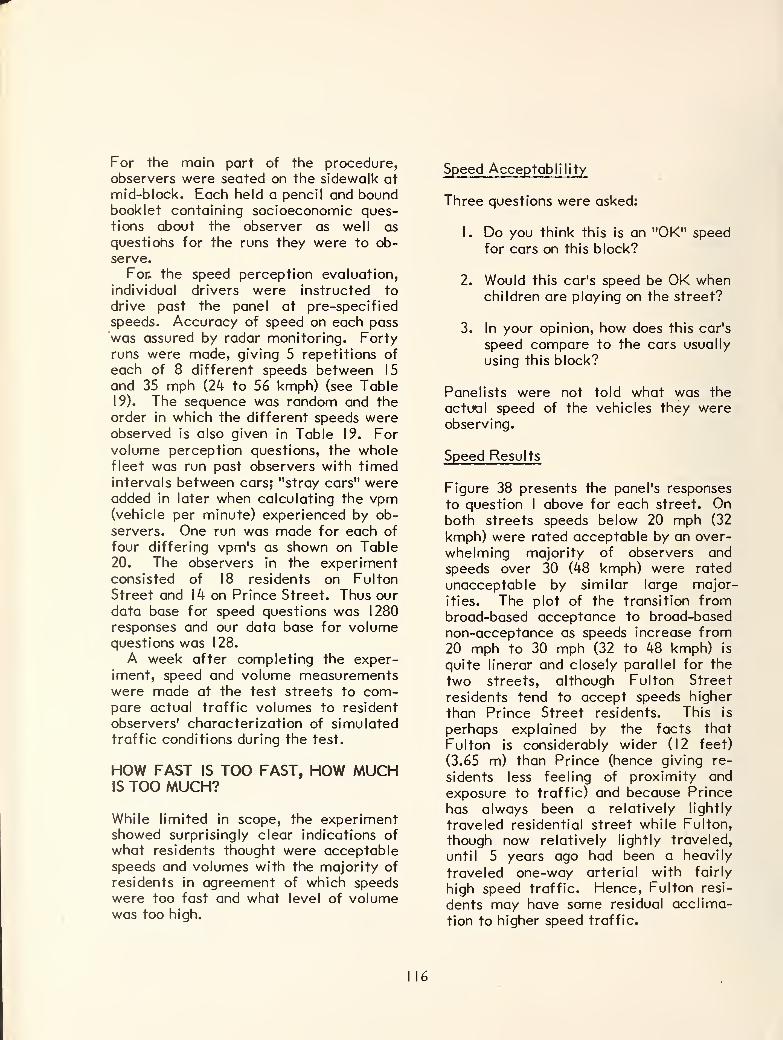
For the main part of the procedure,observers were seated on the sidewalk at
mid-block. Each held a pencil and boundbooklet containing socioeconomic ques-tions about the observer as well as
questions for the runs they were to ob-serve.
For. the speed perception evaluation,
individual drivers were instructed to
drive past the panel at pre-specified
speeds. Accuracy of speed on each pass
was assured by radar monitoring. Fortyruns were made, giving 5 repetitions of
each of 8 different speeds between 15
and 35 mph (24 to 56 kmph) (see Table19). The sequence was random and theorder in which the different speeds wereobserved is also given in Table 19. Forvolume perception questions, the wholefleet was run past observers with timedintervals between cars; "stray cars" wereadded in later when calculating the vpm(vehicle per minute) experienced by ob-
servers. One run was made for each of
four differing vpm's as shown on Table20. The observers in the experimentconsisted of 18 residents on FultonStreet and 14 on Prince Street. Thus our
data base for speed questions was 1280responses and our data base for volumequestions was 128.
A week after completing the exper-iment, speed and volume measurementswere made at the test streets to com-pare actual traffic volumes to resident
observers' characterization of simulatedtraffic conditions during the test.
HOW FAST IS TOO FAST, HOW MUCHIS TOO MUCH?
While limited in scope, the experimentshowed surprisingly clear indications of
what residents thought were acceptablespeeds and volumes with the majority of
residents in agreement of which speedswere too fast and what level of volumewas too high.
Speed Acceptability
Three questions were asked:
1
.
Do you think this is an "OK" speedfor cars on this block?
2. Would this car's speed be OK whenchildren are playing on the street?
3. In your opinion, how does this car's
speed compare to the cars usually
using this block?
Panelists were not told what was the
actual speed of the vehicles they wereobserving.
Speed Results
Figure 38 presents the panel's responses
to question I above for each street. Onboth streets speeds below 20 mph (32
kmph) were rated acceptable by an over-
whelming majority of observers andspeeds over 30 (48 kmph) were rated
unacceptable by similar large major-
ities. The plot of the transition frombroad-based acceptance to broad-based
non-acceptance as speeds increase from20 mph to 30 mph (32 to 48 kmph) is
quite linerar and closely parallel for the
two streets, although Fulton Street
residents tend to accept speeds higher
than Prince Street residents. This is
perhaps explained by the facts that
Fulton is considerably wider (12 feet)
(3.65 m) than Prince (hence giving re-
sidents less feeling of proximity and
exposure to traffic) and because Prince
has always been a relatively lightly
traveled residential street while Fulton,
though now relatively lightly traveled,
until 5 years ago had been a heavily
traveled one-way arterial with fairly
high speed traffic. Hence, Fulton resi-
dents may have some residual acclima-
tion to higher speed traffic.
116
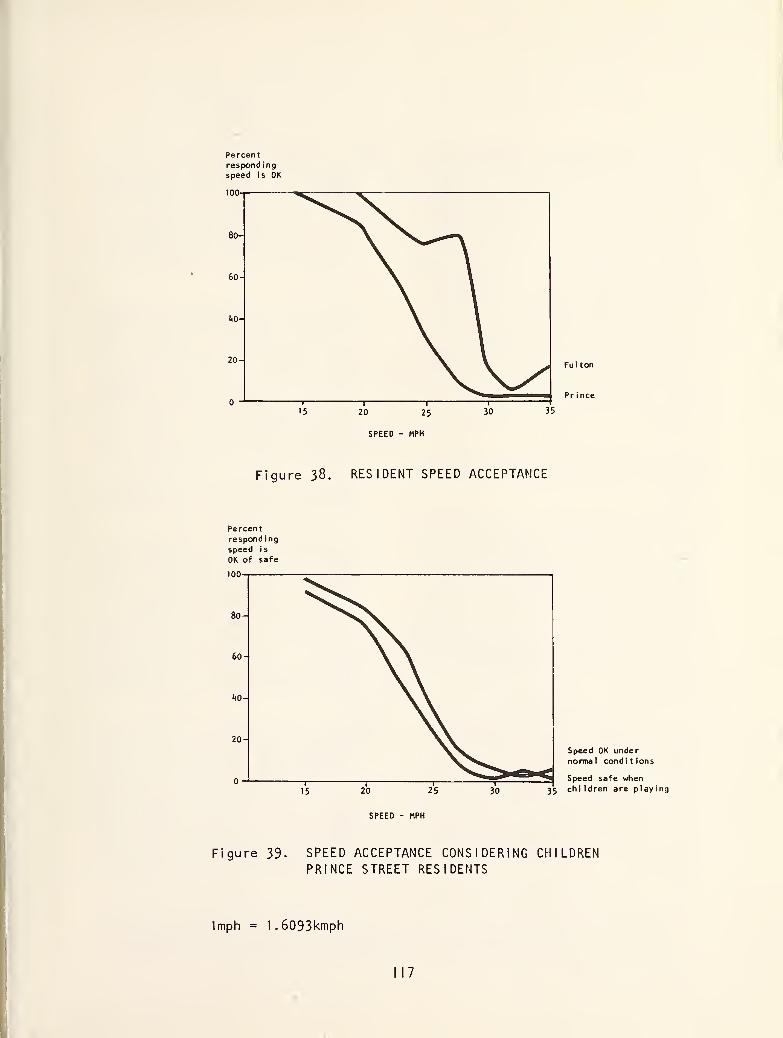
Ful ton
Prince
Figure 38. RESIDENT SPEED ACCEPTANCE
Percentrespond ing
speed is
OK of safe
80-
60-
ItO-
20-
1
151
20i
25 30 33
Speed OK undernormal conditions
Speed safe when
35 children are playing
SPEED - MPH
Figure 39. SPEED ACCEPTANCE CONSIDERING CHILDRENPRINCE STREET RESIDENTS
1mph = 1.6093kmph
II7
When asked question 2 above, resident
acceptance profiles paralleled the res-
ponses to question I but were offset
(lower) by about 2 to 4 miles per hour (3-
6 kmph), as shown on Figures 39 and 40.
Comparisons of the resident panels'
ratings of speed as being "usual" for their
street with distributions of actual traffic
speeds measured on the streets about a
'week after the panel sessions is pre-
sented on Figures 41 and 42. On both
streets large numbers of residents rated
test speeds which were at the upper end
or above the distribution of speeds
actually occurring on their street as
being 'usual' for their street.
Discussion
Significant inferences which might be
drawn from the results include the fol-
lowing:
• Resident opinion as to whether speed
is acceptable or unacceptable changesfrom almost total acceptance to al-
most total non-acceptance over a re-
latively narrow range of speeds - from20 to 30 miles per hour (32 - 48kmph). That is to say, resident opinion
about speed appears extremely sensi-
tive to differences which are quite
small when considered from a driver's
perspective.
• The 25 mile per hour (40 kmph) speedlimit currently most prevalent onresidential streets in the U.S. is
central to the range of speed over
which resident opinion changes fromalmost total acceptance to almost uni-
form non-acceptance and is close to
the speed which about half the resi-
dents consider acceptable, half unac-ceptable.
Even if the vast majority of drivers
conformed to the 25 mph (40 kmph)limit, nearly half the residents of the
street might not be satisfied. If the
street is one along which a substantial
level of childrens' play activity occurs,
a majority of residents may not be sat-
isfied.
Speeds which a predominant share of
residents would consider acceptableare several miles per hour slower than
most drivers choose* to drive on resi-
dential streets. Ineffectiveness of ex-
tremely low speed limits as a control
on residential streets was documentedin the State-of-the-Art report. It
appears that the only effective waysto ensure that speed conditions will
achieve uniform acceptability to re-
sidents is through establishment of
Woonerf-like conditions or installation
of control devices like undulations.
This research is not firm grounds for
advocating lowering of speed limits
now common on residential streets.
First, it provides no indication of howdissatisfied residents are with speedsthey indicate "unacceptable" but whichare within or close to the opinion
transition range described above.
Secondly, it does not consider reason-
ability of speed from a driver perspec-
tive.
Several interpretations may be placed
on the fact that large percentages of
residents rated test speeds as "usual"
for their street which were in fact
rare or not recorded at all in the
observations of traffic actually using
the street. It is possible that a pane-list's assessment of whether a parti-
cular speed is "usual" for the street is
This reference to drivers' speed choice is a generalization postulated upon review
of speed data more extensive than that collected in this portion of the research.
18
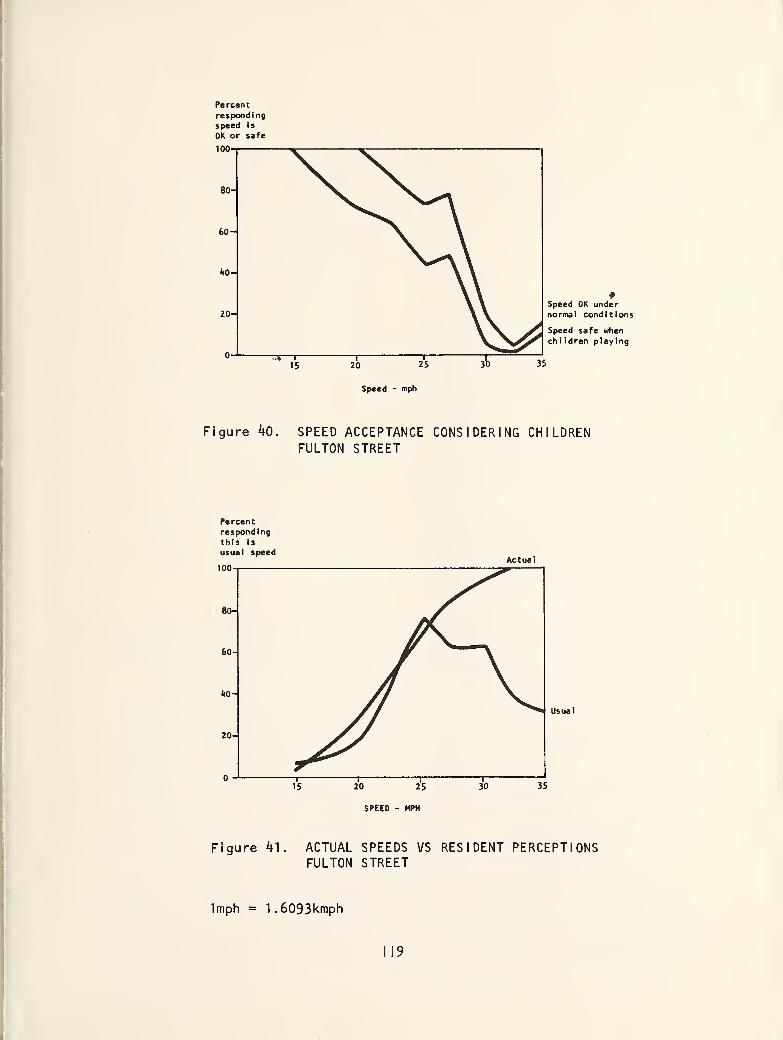
Percentrespondingspeed Is
OK or safe
100
80-
60-
1.0-
20-Speed OK undernormal conditions
Speed safe whenchi Idren playing
Speed - mph
Figure kO. SPEED ACCEPTANCE CONSIDERING CHILDRENFULTON STREET
Percentrespondingthis is
usual speed
100Actual
80-
60-
1,0-
20-
Usual
SPEED - MPH
Figure k\. ACTUAL SPEEDS VS RESIDENT PERCEPTIONSFULTON STREET
1mph = 1.6093kmph
II9
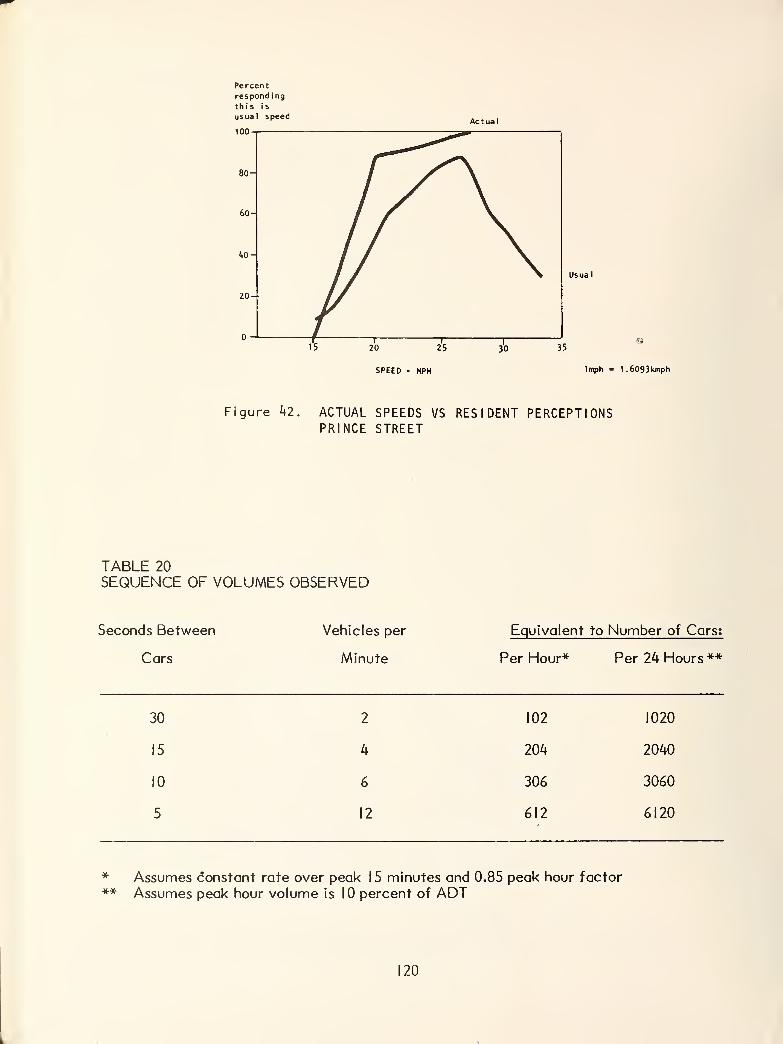
Percentrespondingthis is
usual speed
100
Actual
Usual
SPEED - MPH lmph » 1 .6093kmph
Figure 42. ACTUAL SPEEDS VS RESIDENT PERCEPTIONSPRINCE STREET
TABLE 20
SEQUENCE OF VOLUMES OBSERVED
Seconds Between
Cars
Vehicles per
Minute
Equivalent to Number of Cars:
Per Hour* Per 24 Hours **
30
15
10
5
2
4
6
12
102 1020
204 2040
306 3060
612 6120
* Assumes constant rate over peak 15 minutes and 0.85 peak hour factor** Assumes peak hour volume is 10 percent of ADT
20
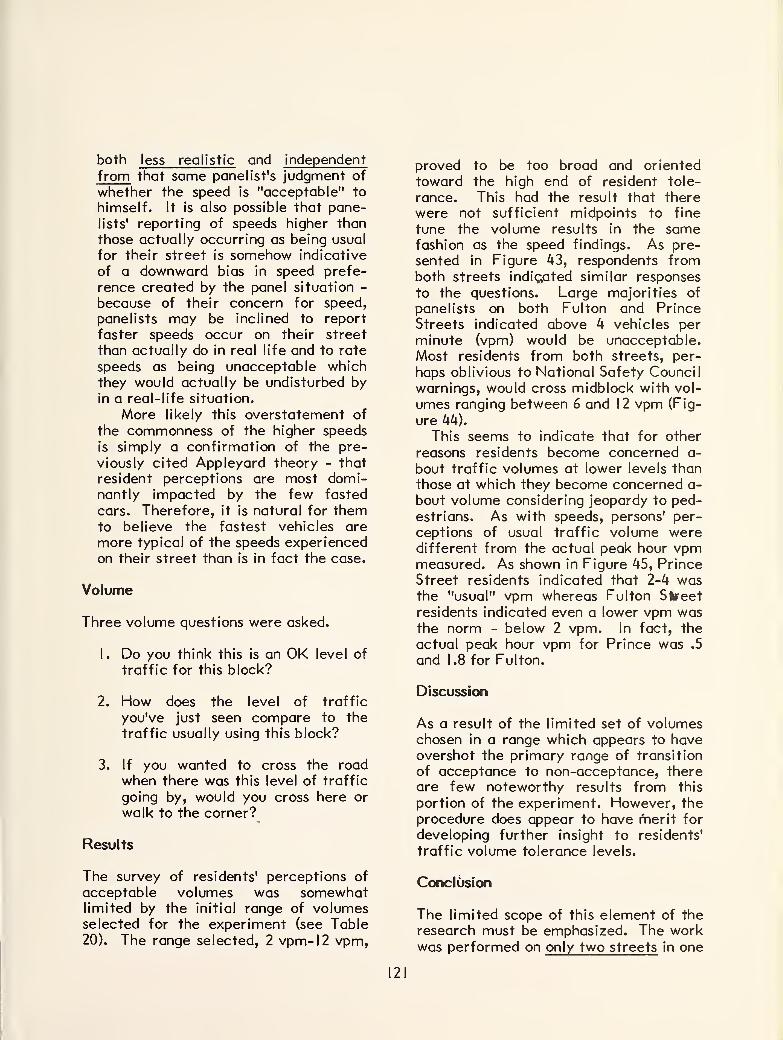
both less realistic and independent
from that same panelist's judgment of
whether the speed is "acceptable" to
himself. It is also possible that pane-lists' reporting of speeds higher than
those actually occurring as being usual
for their street is somehow indicative
of a downward bias in speed prefe-
rence created by the panel situation -
because of their concern for speed,
panelists may be inclined to report
faster speeds occur on their street
than actually do in real life and to rate
speeds as being unacceptable whichthey would actually be undisturbed byin a real-life situation.
More likely this overstatement of
the commonness of the higher speeds
is simply a confirmation of the pre-
viously cited Appleyard theory - that
resident perceptions are most domi-nantly impacted by the few fasted
cars. Therefore, it is natural for themto believe the fastest vehicles are
more typical of the speeds experiencedon their street than is in fact the case.
Volume
Three volume questions were asked.
1. Do you think this is an OK level of
traffic for this block?
2. How does the level of traffic
you've just seen compare to the
traffic usually using this block?
3. If you wanted to cross the road
when there was this level of traffic
going by, would you cross here or
walk to the corner?
Results
The survey of residents' perceptions of
acceptable volumes was somewhatlimited by the initial range of volumesselected for the experiment (see Table20). The range selected, 2 vpm-12 vpm,
proved to be too broad and oriented
toward the high end of resident tole-
rance. This had the result that there
were not sufficient midpoints to fine
tune the volume results in the samefashion as the speed findings. As pre-
sented in Figure 43, respondents fromboth streets indicated similar responses
to the questions. Large majorities of
panelists on both Fulton and Prince
Streets indicated above 4 vehicles per
minute (vpm) would be unacceptable.
Most residents from both streets, per-
haps oblivious to National Safety Councilwarnings, would cross midblock with vol-
umes ranging between 6 and 12 vpm (Fig-
ure 44).
This seems to indicate that for other
reasons residents become concerned a-
bout traffic volumes at lower levels than
those at which they become concerned a-
bout volume considering jeopardy to ped-
estrians. As with speeds, persons' per-
ceptions of usual traffic volume weredifferent from the actual peak hour vpmmeasured. As shown in Figure 45, PrinceStreet residents indicated that 2-4 wasthe "usual" vpm whereas Fulton Street
residents indicated even a lower vpm wasthe norm - below 2 vpm. In fact, the
actual peak hour vpm for Prince was .5
and 1.8 for Fulton.
Discussion
As a result of the limited set of volumeschosen in a range which appears to haveovershot the primary range of transition
of acceptance to non-acceptance, thereare few noteworthy results from this
portion of the experiment. However, the
procedure does appear to have merit for
developing further insight to residents'
traffic volume tolerance levels.
Conclusion
The limited scope of this element of the
research must be emphasized. The workwas performed on only two streets in one
121
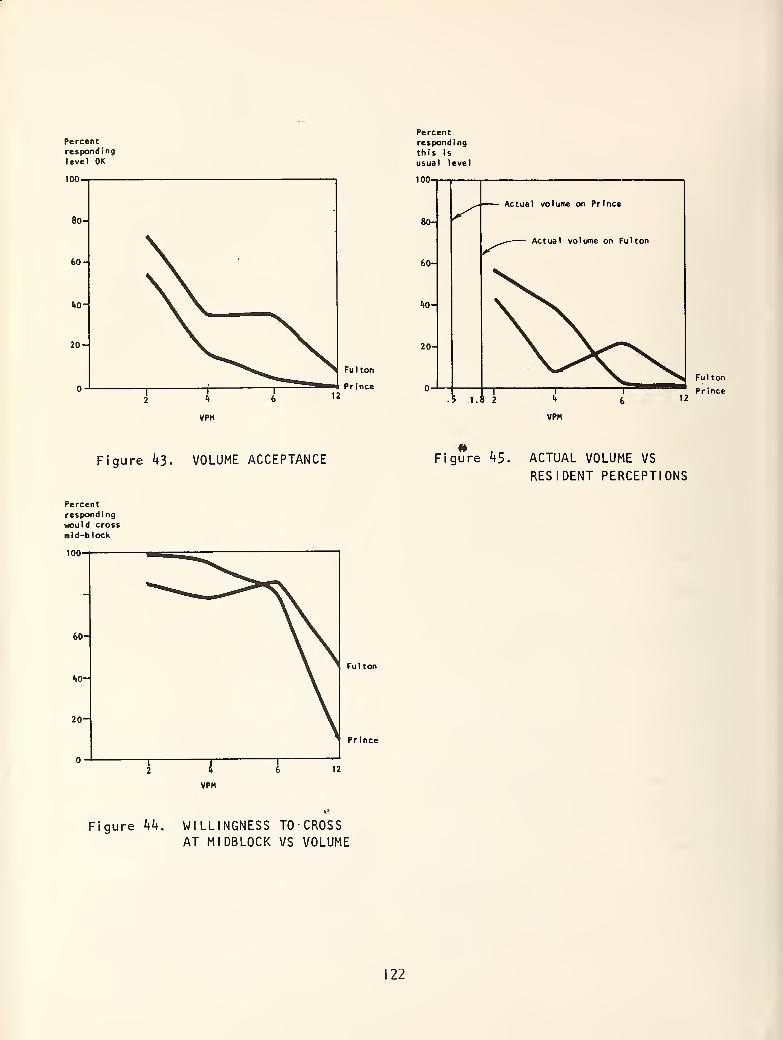
Percentrespondinglevel OK
100
Percentrespondingthis is
usual level
100
VPM VPM
Figure hi. VOLUME ACCEPTANCE Figure k5. ACTUAL VOLUME VS
RESIDENT PERCEPTIONS
Percentrespondingwould cross
mid-block
VPM
Ful ton
Prince
Figure kk. WILLINGNESS TO-CROSSAT MIDBLOCK VS VOLUME
22
particular city. A total of only 32 resi-
dent panelists were involved. In keepingwith the exploratory nature and limited
budget of this activity, no sophisticated
measures were taken to assure that panel
compositions accurately reflected the
overall composition of the entire adult
resident population of their blocks rela-
tive to relevant characteristics (such as
age, sex, whether or not they had chil-
dren at home, owners versus renters,
people who spend a lot of time homeversus those who spend little there, thosewho drive a lot versus those who drive
little or not at all). Given that the
panelists were respondents to a request
for volunteer participants in a traffic
study, it is likely that the panels mayhave been comprised of persons moresensitive to traffic issues than the over-all resident population.
• While the limitations of the current
work must not be overlooked, the results
pose considerable food for thought. If
resident satisfaction with traffic speed is
to be truly achieved, it may be necessaryto create Woonerf-like conditions, not
just substantial conformity to current
speed limits. And despite the cited
limitations, the results appear suffi-
ciently satisfying that it seems reason-able to consider undertaking further
research of this nature. Future research
attempts should include the following
elements:
• Many more streets should be included
in the data base. Streets should bedrawn from large city residential
neighborhoods and from suburban andsmall city neighborhoods. Streets
experiencing a range of volume andspeed conditions should be selected in
each category.
• More rigorous sample control should beexercised over the composition of thepanels.
• The range of volumes tested in future
attempts should be focused at the lowend of that used in the current effort.
EFFECTS OF STREET ENVIRONMENTELEMENTS ON TRAFFIC SPEED
The foregoing research examined resi-
dent preferences with respect to speed.
Another key question is "what is it aboutthe street environment that induces
drivers to travel fast on one particular
street and not on another?". The reasonfor interest in examining effects of
street environmental variables on speedis this: Since direct controls (stop signs,
road humps, rumble strips, diverters)
sometimes arouse drivers' ire and often
create undesired secondary impacts, a
form of control which relied upon the
subtle influences of the surrounding en-
vironment on drivers' behavior might bepreferable to direct controls. However,to do this we must understand what ele-
ments in the residential street environ-
ment exert these subtle influences ondriver behavior. Such an analysis mustscreen-out or neutralize the influence of
pure individual driver motivational fac-
tors (the joyrider, the person late for
work br an engagement). It must also
screen out speed elements introduced bypositioning in the network (the street
used as a cut-through route between twoarterials) and land use patterns.
The following street environmentalvariables are postulated to have poten-tial impact on driver speed behavior.
Alignment :
- horizontal: Relevant conditions in-
clude tangents, long radius curves,
sharp curves and serpentine.
- vertical: Relevant conditions include
level sections, relatively continuousgrades and undulating sections.
123
Block Length :
- A range of conditions from short
blocks (say 200') (61m) to lengthy
segments (quarter to half mile) are
relevant because length affects howlong drivers have to build up speed.
Continuity :
- Relevant characteristics include endconditions of the block (cul-de-sac, T,
L or 4-way intersection) and continuity
of motion (does the vehicle enter theblock from a standing stop or withestablished momentum).
Parking :
- The relevant characteristic is pre-
sence/absence of parked vehicles ra-
ther than permitted/prohibited. Park-ing is relevant as a constraint on theeffective width of the traveled way.Parallel versus angled conditions arealso relevant.
Setbacks :
- A range of building setbacks must beconsidered. The concept is that buil-
dings set close to the street create a
sense of confined space or narrownessof the street while broad setbackscreate a driver impression that thestreet itself is wide and unconstrained.
Structure Type :
- Row houses create a continuous wall
which intensifies the impact of close
setback while the gaps between de-tached houses moderate setback ef-
fects.
Trees :
- Large street trees are hypothesized to
have similar impacts to close building
setbacks - creating a sense of a nar-
rower street. Small trees or absenceof trees create the sense of a widestreet.
Width :
- Only streets of a single lane in eachdirection are considered. Narrowstreets are hypothesized to both' re-
quire greater driver care and create asense that the street is not a place for
fast traffic. Wider streets give the
sense that auto service is the dominantobjective of the street and encouragearterial speed behavior. A range of
widths need be considered.
A thorough research analysis on all of
these environmental conditions is beyondthe resources of this study. Presume 5
values were considered for each of the
above factors for which ranges of condi-
tions are relevant (widths, length, set-
back). Presuming this, we have thenidentified 8 major variables, one with six
subconditions, three with five, two withfour subconditions, one with three, andtwo with two subconditions. Just to ex-amine each variable independently, hold-
ing* the others constant, would require
speed observations on an extremely large
number of streets to achieve statistical
reliability. The necessary number of ob-servations require resources well beyondthose which could be devoted to this fa-
cet of the study. However, a pilot ex-ploration was attempted to examine the
feasibility of a more detailed exploration
of these factors through simple observa-tion of speeds of existing street traffic.
Eleven residential streets in SanFrancisco were selected in the pilot
study. All streets carried traffic light
enough that the speeds of observed ve-
hicles were not constrained by the speedof other vehicles using the street. Thepotential effects of network and land use
factors described above were controlled
by selecting purely residential streets
imbedded in a neighborhood - well away
124
from arterials and divergent land uses.
All streets selected were level tangents
with parallel parking permitted and pre-
sent on both sides. With these factors
held constant, it was possible to performsome limited exploration of the effects
of the others.
RESULTS
Effects of Street Width and Setback onSpeed
The first hypothesis was that actual
pavement and apparent width would both
have an effect on traffic speed, reducing
it as the street and its visual "walls"
narrowed.Table 21 shows correlations between
pavement width and traffic speed. Cor-relations, especially with average speed(r = .62), are very high. They are evenhigher when the setbacks on both sides
are added to the pavement width (r = .84)
with average speed), although setbacks
by themselves account for little (r = .37
with average speed). The correlations
with the 85th percentile speeds, a mea-sure that accounts more for the faster
traffic were slightly less. There is a
close relation, therefore, between both
actual and visual width and traffic speed.
Figure 46 is a set of plots of speedversus width and speed versus width plus
setback. On them the effects of width
and apparent width seem clearer.
Streets of 30 to 35 feet (9.1 - 10.7m)
width were found to have mid-block me-dian speeds under 20 MPH (32 kmph),while those of exactly 40 feet (12.2m)were found to have speeds of 26 and 27
MPH (42 - 43 kmph). Wider streets gen-erally experienced higher speeds. A 45-
foot (13.7m) wide street (600 feet long)
( 1 82m) had average speeds of 26 MPH (42
kmph), as did a short 60-foot (18.2m)wide street (221 feet (63.7m) long).
When setbacks were added to pave-ment width (Figure 46), the pattern of
speeds appeared to vary even more con-
sistently with width between house
frontages. Median speeds of 20 MPH (32
kmph) were measured on streets of
between 60 and 70 feet (18.2 -21.2 m)facade to facade, while two 90-feet
(27.2m) street - width - plus - set - backs
streets experienced speeds of 26 and 27
MPH (42-43 kmph).Eight-fifth percentile speeds were
higher, and since these are the problemspeeds, they demand particular atten-
tion. The 85th percentile speeds on the
30- and 35-feet (9.1 - 10.7m) widestreets were still 23 and 25 MPH (34-40
kmph), within the legal limits. However,on all other streits, 85th percentile
speeds were over 25 MPH (40 kmph).
Those of 38-39 feet ( I 1 .6 - II .9m) were26 to 28 MPH (42 - 46 kmph), those of 40
feet (1 2.1m) were 28 and 30 MPH (46 -
48 kmph). On the widest streets, 85th
percentile speeds ranged from 26.5 MPH(42.6 kmph) (52 feet (16.5m) wide but
only 250 feet (76m) long) to 33 MPH (53
kmph) (46 feet (14m) wide and 622 feet
(190m) long).
Effects of Block Length
The examination of the speed versus
width plots gave some indication of the
importance of block length. Two of the
wider streets which have short block
lengths experienced speeds which appear
lower than what might be expected con-
sidering the rest of the pattern of speedversus width relationship. (A 52-foot
(16.5m) wide street experienced average
speeds of only 21.5 MPH (35 kmph), but
its block length was only 250 feet
(76m). A 60-foot (18.2m) wide street
with a block length of only 220 feet
(63.7m) was found to have averagespeeds of only 26 MPH (42 kmph)).
Direct relationship of block length to
speed showed less correlation than width
but it is nevertheless important. Thehigher correlations of block length are
with the 85th percentile speeds (r = .53)
125
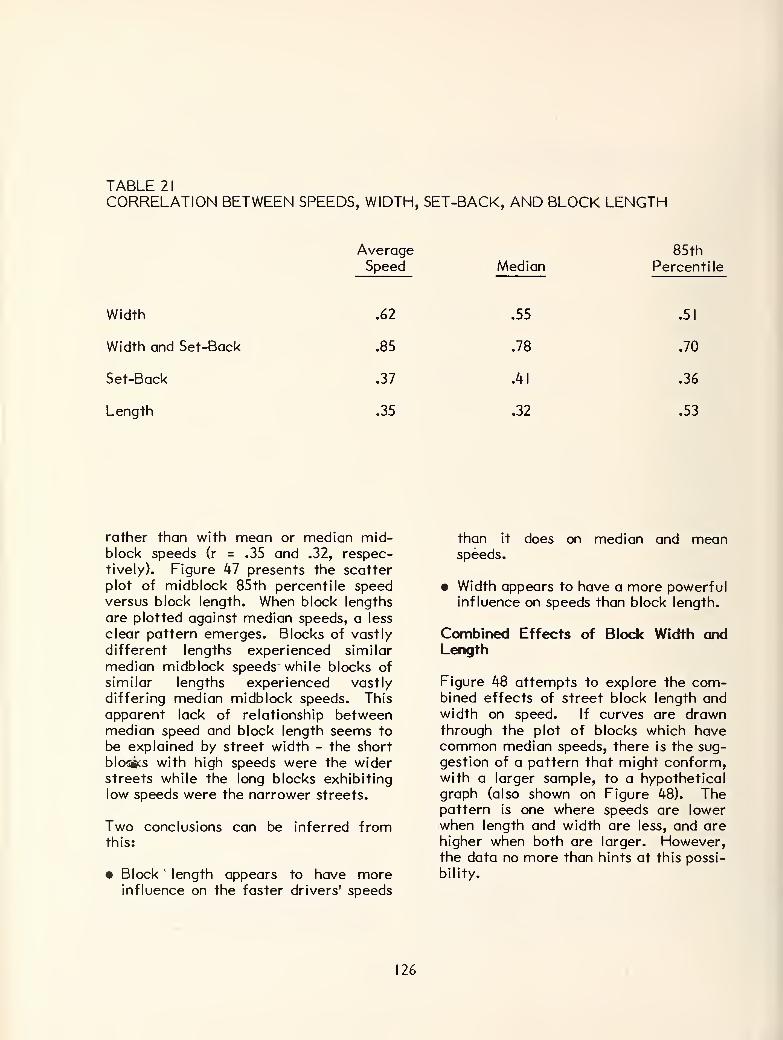
TABLE 2
1
CORRELATION BETWEEN SPEEDS, WIDTH, SET-BACK, AND BLOCK LENGTH
Width
Width and Set-Back
Set-Back
Length
Average 85thSpeed Median Percentile
.62 .55 .51
.85 .78 .70
.37 .41 .36
.35 .32 .53
rather than with mean or median mid-block speeds (r = .35 and .32, respec-tively). Figure 47 presents the scatter
plot of midblock 85th percentile speedversus block length. When block lengths
are plotted against median speeds, a less
clear pattern emerges. Blocks of vastly
different lengths experienced similar
median midblock speeds while blocks of
similar lengths experienced vastly
differing median midblock speeds. This
apparent lack of relationship betweenmedian speed and block length seems to
be explained by street width - the short
blo<5*s with high speeds were the widerstreets while the long blocks exhibiting
low speeds were the narrower streets.
Two conclusions can be inferred fromthis:
• Blockl
length appears to have moreinfluence on the faster drivers' speeds
than it does on median and meanspeeds.
• Width appears to have a more powerfulinfluence on speeds than block length.
Combined Effects of Block Width andLength
Figure 48 attempts to explore the com-bined effects of street block length andwidth on speed. If curves are drawnthrough the plot of blocks which havecommon median speeds, there is the sug-gestion of a pattern that might conform,with a larger sample, to a hypotheticalgraph (also shown on Figure 48). Thepattern is one where speeds are lowerwhen length and width are less, and arehigher when both are larger. However,the data no more than hints at this possi-
bility.
126
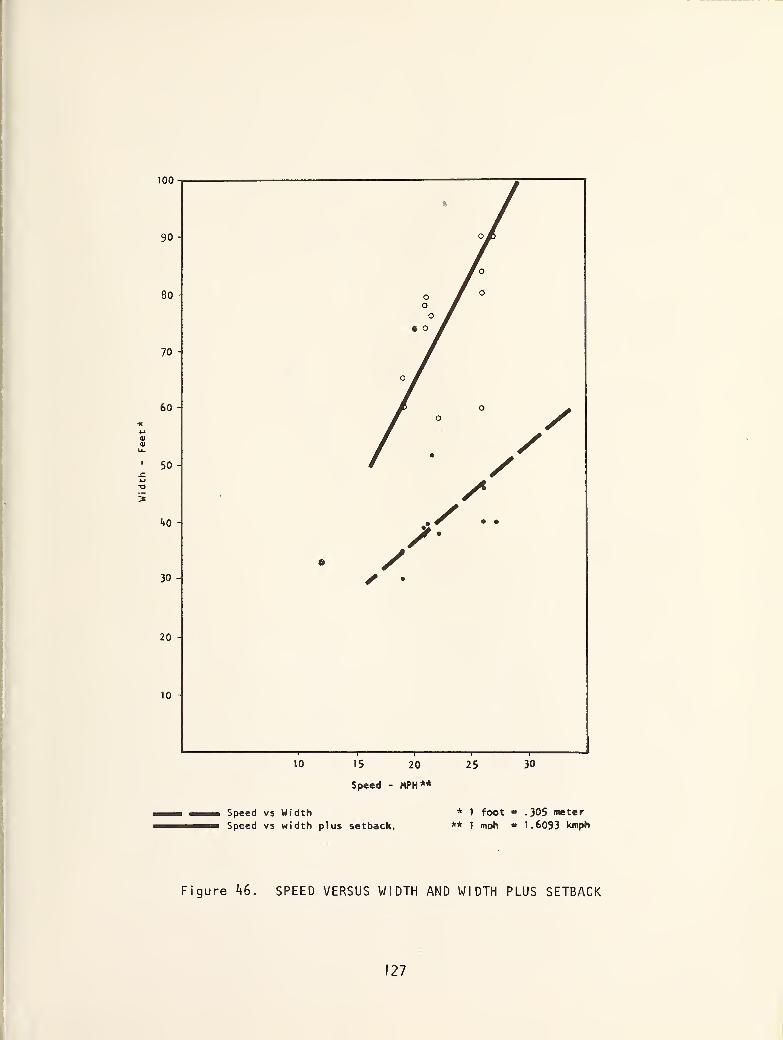
100 -i
90-
80
70 -
60
50 -
kO -
30 -
20 -
10 -
Speed vs WidthSpeed vs width plus setback,
* 1 foot - .305 meter** 1 mt>h - 1.6093 kmph
Figure 46. SPEED VERSUS WIDTH AND WIDTH PLUS SETBACK
127
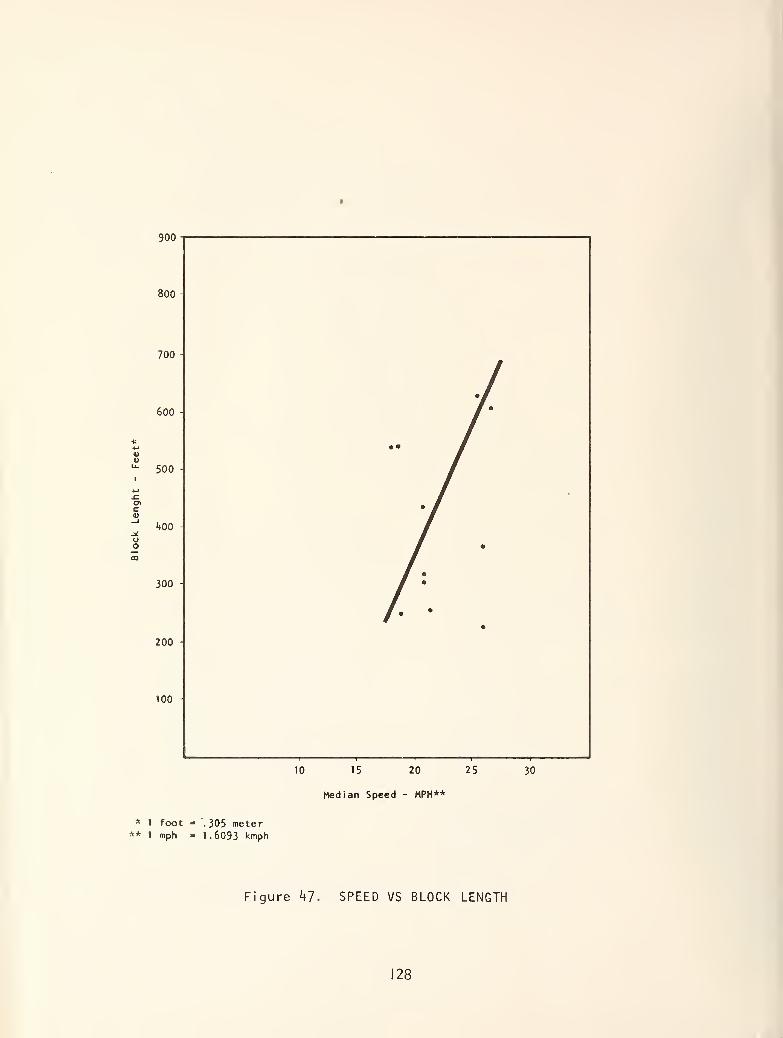
o
900-1
800
700 -
600 -
500
^400
300 -
200 -
100 -
10 15 20 25
Median Speed - MPH**
* 1 foot - .305 meter** 1 mph - 1.6093 kmph
30
Figure kl . SPEED VS BLOCK LENGTH
128
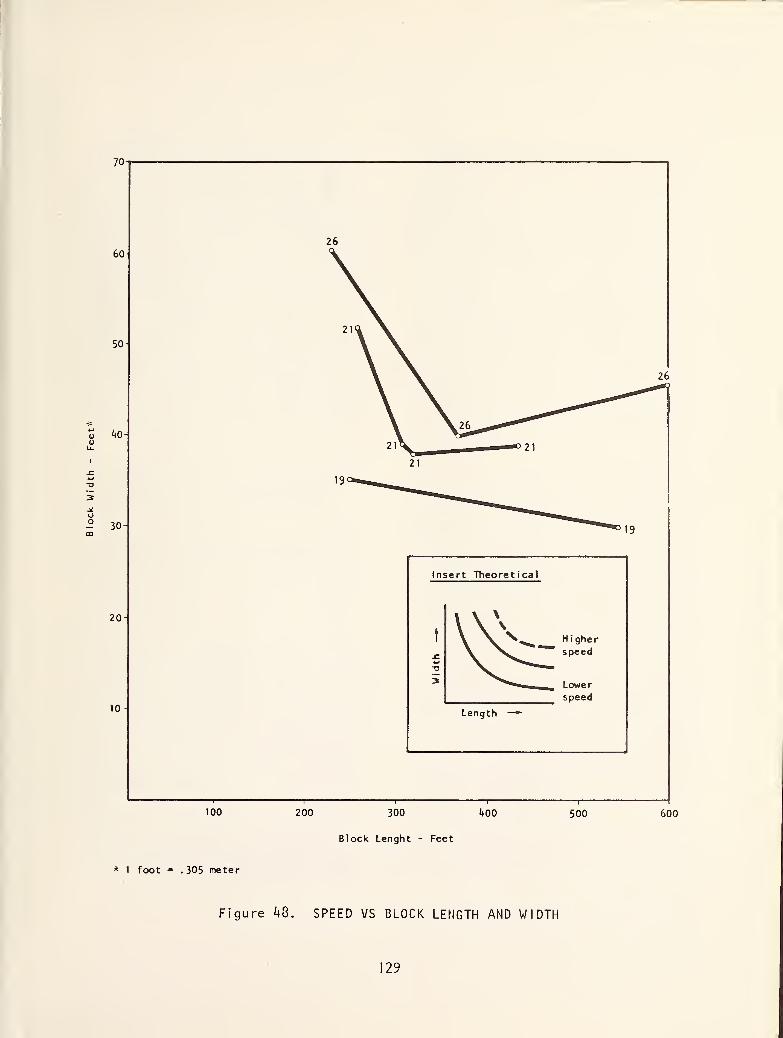
70
60-
50-
ko-
o° 30
20
10
Insert Theoretical
I \ *\ \ ^
t \V
—
Higher
.c \ X. speedw V ^"^D V ^*"3 ^ Lower
speed
Length —*
100 200 300 *»00
Block Lenght - Feet
500 600
* 1 foot - . 305 meter
Figure 48. SPEED VS BLOCK LENGTH AND WIDTH
29
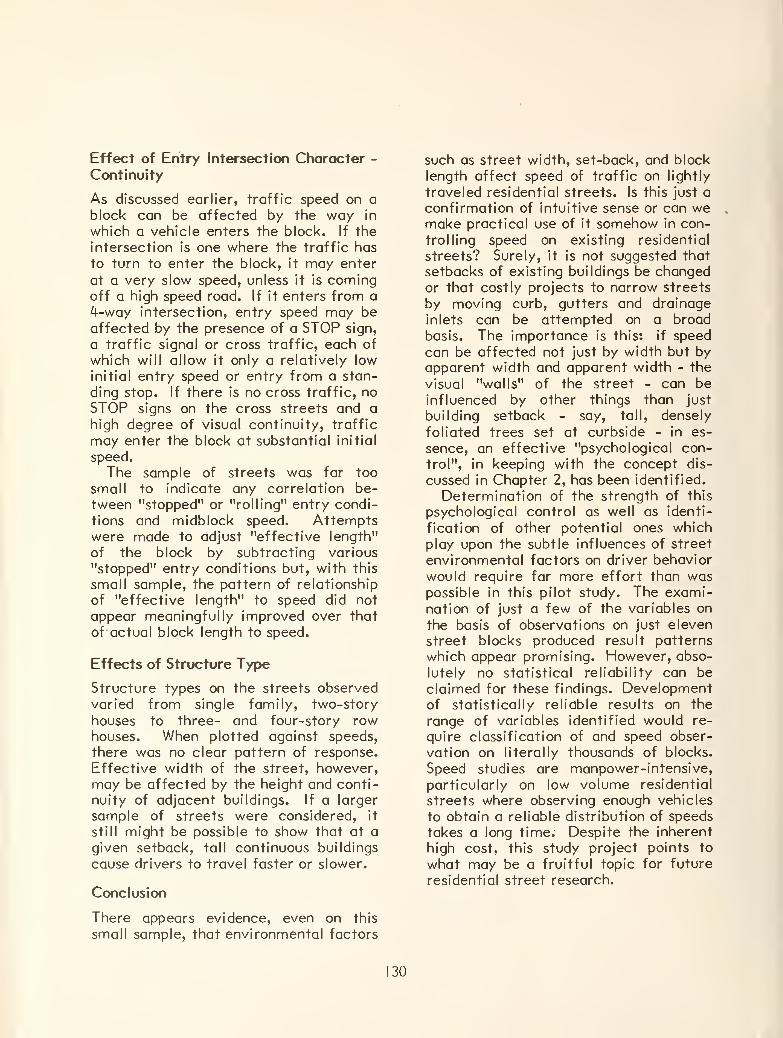
Effect of Entry Intersection Character -
Continuity
As discussed earlier, traffic speed on a
block can be affected by the way in
which a vehicle enters the block. If the
intersection is one where the traffic has
to turn to enter the block, it may enter
at a very slow speed, unless it is comingoff a high speed road. If it enters from a
4-way intersection, entry speed may be
affected by the presence of a STOP sign,
a traffic signal or cross traffic, each of
which will allow it only a relatively low
initial entry speed or entry from a stan-
ding stop. If there is no cross traffic, noSTOP signs on the cross streets and a
high degree of visual continuity, traffic
may enter the block at substantial initial
speed.
The sample of streets was far too
small to indicate any correlation be-
tween "stopped" or "rolling" entry condi-
tions and midblock speed. Attemptswere made to adjust "effective length"
of the block by subtracting various
"stopped" entry conditions but, with this
small sample, the pattern of relationship
of "effective length" to speed did not
appear meaningfully improved over that
of actual block length to speed.
Effects of Structure Type
Structure types on the streets observedvaried from single family, two-story
houses to three- and four-story rowhouses. When plotted against speeds,
there was no clear pattern of response.
Effective width of the street, however,may be affected by the height and conti-
nuity of adjacent buildings. If a larger
sample of streets were considered, it
still might be possible to show that at a
given setback, tall continuous buildings
cause drivers to travel faster or slower.
Conclusion
There appears evidence, even on this
small sample, that environmental factors
such as street width, set-back, and block
length affect speed of traffic on lightly
traveled residential streets. Is this just a
confirmation of intuitive sense or can wemake practical use of it somehow in con-
trolling speed on existing residential
streets? Surely, it is not suggested that
setbacks of existing buildings be changedor that costly projects to narrow streets
by moving curb, gutters and drainage
inlets can be attempted on a broad
basis. The importance is this: if speed
can be affected not just by width but byapparent width and apparent width - the
visual "walls" of the street - can beinfluenced by other things than just
building setback - say, tall, densely
foliated trees set at curbside - in es-
sence, an effective "psychological con-
trol", in keeping with the concept dis-
cussed in Chapter 2, has been identified.
Determination of the strength of this
psychological control as well as identi-
fication of other potential ones whichplay upon the subtle influences of street
environmental factors on driver behavior
would reguire far more effort than waspossible in this pilot study. The exami-nation of just a few of the variables on
the basis of observations on just eleven
street blocks produced result patterns
which appear promising. However, abso-
lutely no statistical reliability can be
claimed for these findings. Developmentof statistically reliable results on the
range of variables identified would re-
guire classification of and speed obser-
vation on literally thousands of blocks.
Speed studies are manpower-intensive,
particularly on low volume residential
streets where observing enough vehicles
to obtain a reliable distribution of speeds
takes a long time. Despite the inherent
high cost, this study project points to
what may be a fruitful topic for future
residential street research.
30
CHAPTER 6
LEGAL ISSUES IN NEIGHBORHOODTRAFFIC MANAGEMENT
The controversial nature of neighborhoodtraffic control and restraint has led to a
number of challenges to neighborhood
traffic management actions. An exten-
sive review of the nature and disposition
of these court challenges has been prepa-
red by Frederick Van Antwerp. (24) This
chapter presents a summary and further
interpretation of the principal findings
and conclusions of Van Antwerp's re-
search. In particular, findings related to
Berkeley, California's traffic manage-ment plan are updated to reflect latest
decisions in the case.
AUTHORITY OF LOCAL JURISDICTIONSTO UNDERTAKE RESIDENTIALAREA TRAFFIC MANAGEMENT
The vast majority of challenges to
neighborhood traffic management ac-
tions have involved the ground that the
local jurisdiction lacked the power to
regulate traffic in such a prohibitory
manner.
The right to regulate and control the
operation of motor vehicles on the public
highways and streets ordinarily rests
with the state under its police power.States routinely delegate this authority
over local streets to the local jurisdic-
tions. Within the limitations of the
delegated authority, local jurisdictions
regulate the use of public streets bypassing ordinances.
Enabling legislation which delegates this
authority to local jurisdictions varies
from state to state. In some it is clear
and strong. In others it may not be spe-
cific enough to cover actions like apply-ing retrofit cul-de-sacs or diagonal di-
verters or other forms of diversionary
channelizations which might be held to
be actions "closing" the streets. In such
cases, the local jurisdictions' powers are
dependent on omnibus clauses which typ-
ically empower them to, in addition to
powers specifically delegated, make, en-
force and maintain such reasonable or-
dinances, rules and regulations with re-
spect to traffic as specific local condi-
tions may require so long as these ac-
tions do not conflict with powers re-
served to the state.
Local communities initiating traffic
management plans should be conscious of
just what legal authority they have. This
is not just a question of whether the en-
abling legislation is weak or strong.
There is the question of whether the ac-
tions will be taken under powers to con-
trol traffic or under the power to close
streets. Both options may be open.
Powers to "close streets" are normallyused when a jurisdiction abandons or
vacates all or apart of a street. In its
application to neighborhood traffic man-agement, the logic is not that the spaceoccupied by a diverter or cul-de-sac is
abondoned or relinquished as a public
right-of-way in the strict sense of the
word. (That space is held to be an areaof the public right-of-way which is de-
clared to be outside the designated tra-
veled way for automobiles.) The logic is
24. Van Antwerp, Frederick, THE RESTRAINT OF THE AUTOMOBILE IN
ESTABLISHED RESIDENTIAL AREAS; AN IMPLEMENTATION POLICYANALYSIS, Pennsylvania State University Transportation Institute, University
Park, Pa., August, 1979.
31
that if jurisdictions have the power to goso far as to completely abandon, vacateor relinquish a street, then the partial
closure which a cul-de-sac. diverter or
other device brings about is simply a less
forceful or partial exercise of that samepower. This interpretation of legality of
diverters and cul-de-sacs as instruments
of "partial closure" under the power to
close streets is a fundamental point in
the ajudication of the Berkeley case dis-
cussed subsequently.
If both powers to control traffic andpower to close streets are available, the
local jurisdiction should choose the
strongest and most convenient. The jur-
isdiction must weigh the strength of the
enabling legislation under each versus
the fairly rigid procedural requirementsand criteria which may accompany the
conveyance of the "power to close
streets" and the potential involvement in
the issue of whether diverters, semi-diverters, retrofit cul-de-sacs and the
like are legitimate traffic control de-
vices or "approved" geometric features
of the road if "powers to control traffic"
are relied upon. Understanding the legal
basis for traffic management actions
from the outset may affect the specific
form of actions taken and will better
prepare the community for legal chall-
enges which may ensue.
While reasonability of actions by the
local jurisdiction is important in all
cases, it is a particular priority wherethe delegation of authority to the local
jurisdiction is weak and unspecific.
Weak or unspecific legislation generally
requires the court to broadly interpret
the local jurisdiction's authority. Will-
ingness of the court to do this may beheavily dependent on demonstration of
reasonable need for action and reason-ableness of the actions taken. The fol-
lowing section expands on the subject of
reasonableness.
REASONABLENESS IN EXERCISE OFTHE POLICE POWER
Whether the authority of the jurisdiction
to act is or is not in doubt, the traffic
management actions taken can be, and in
many cases have been, challenged on the
grounds that they are arbitrary, capric-
ious and unreasonable and therefore not
a legitimate exercise of the police pow-er. The reasonableness test appears to
have been a dominant concern in recentcourt cases. Van Antwerp's study of
traffic management court cases identi-
fies the following factors as being im-portant to the courts in determiningwhether the exercise of police power wasreasonable:
• Evidence of Need for Action - Harm to
Residents
This was not restricted to hard evid-
ence such as traffic accidents or traf-
fic counts, but included noise, air pol-
lution, litter, fear of traffic, child
safety concerns, and general com-plaints of traffic nuisance.
• Traffic Survey
Levels of traffic at all times of the
day, as well as traffic composition(percent of trucks, motorcycles versus
autos; percent of "through" versus
"neighborhood" traffic) were influ-
ential. In at least one case the fact
that the Master Plan for the area in-
cluded a description of the intended
use of the residential street in quest-
ion was a factor. Such Master Plan
statements provide a basis for judging
whether the traffic conditions obser-
ved are or are not consistent with the
intended function of the street and,
hence, whether cause for action exists.
• Alternative Traffic Control Measures,Attempted or Considered
32
The use of stop signs, increased sur-
veillance, and other less severe traffic
control measures were considered evi-
dence that the local jurisdiction wasacting reasonably.
Inconvenience to Residents
It was influential that the municipality
took into consideration the circuity of
alternate routes travelled by residents
of the area.
Integration of the Diversion Strategy
The court in many cases felt it wasvery important that the diversion
scheme be a part of the overall trans-
portation plan for the area. This in-
cluded the idea that through-traffic beprovided with a safe and convenient
route around the "protected" area.
The most important idea here is that
evidence should be shown that the lo-
cal jurisdiction is not simply planning
in response to site- or neighborhood-specific problems with little regard for
consequences outside the residential
area.
Emergency Vehicles
The fact that reasonable access to
emergency vehicles was taken into
consideration when designing the stra-
tegy was considered very important.
Public Hearings
It was influential that the local jur-
isdiction had widely publicized andheld public hearings or other forms of
community involvement in determining
whether and how the strategy was to
be worked out.
These "reasonability conditions" place
heavy emphasis on the importance of a
thorough planning program - not just as a
vehicle for developing the traffic man-agement scheme itself but as a programwhich lays solid groundwork for defenseagainst legal challenges which may en-
sue.
RIGHTS OF ACCESS
The question of "standing before the
court" (the right of the plaintiff to bring
the court challenge) was raised in manycases. Decisions on this issue revolved
around whether the parties in opposition
to the diversion devices had suffered
damage. In most cases the damage cited
was inconvenience caused by the circuity
of the new route. The court has beenfirm and consistent on this issue. Unless
access to the property in question has
been denied completely, the inconven-ience suffered has not been considered
sufficient to challenge the diversion, andthe court has considered the inconven-
ience "an incidental result of a lawful
act". (25)
The U.S. Supreme Court has also
removed any standing on the groundsthat the injured party has been denied
equal protection as provided in the 14th
Amendment of the Constitution, bystating "A community may also decidethat restrictions on the flow of outside
traffic into particular residential areas
would enhance the quality of life,
thereby reducing noise, traffic hazard,and litter. By definition, discrimination
25. Mackie v. City of Seattle , 1978. 576 Pacific Reporter, 2d., 414. For a further
expansion of the concept of injury in traffic management cases as interpreted in
Mackie, see Board of Supervisors vs. Alexandria City Council, 1978. In ChanceryNo. 9708.
133
against non-residents would inhere in
such restrictions". (26)
Strictly speaking, the court's decision
was made solely with respect to theequal rights issue and should not beinterpreted as providing blanket powerfor a community to divert traffic seem-ingly at will. The court seems to besaying that a community may divert
traffic and successfully withstand a legal
challenge based upon charges of discrim-
ination. Tests of sufficient police powerand the reasonable exercise of such pow-er must still be met.
CONFORMANCE TO TRAFFICCONTROL AND DESIGN STANDARDS
In Berkeley, California a challenge to anextensive traffic management plan onthe grounds that the traffic control de-
vices the plan employed did not conformto any specifications for traffic control
devices found in the State's TRAFFICCONTROL MANUAL was initially suc-
cessful. In subsequent appeal, the ap-
pellate court reversed in favor of the
City, ruling that:
• The diverters, cul-de-sacs, et cetera
were indeed "traffic control devices".
• These control devices were not cover-
ed in California's TRAFFIC CONTROLMANUAL.
• That manual is the the State Depart-ment of Transportation's administra-
tive regulation, not a law.
• Since the devices are not covered in
the manual, they are therefore subject
to a catch-all state law which provides
that traffic control devices not spe-
cifically covered by regulations shall
conform to any statutes in effect at
the time of installation.
• The only statutory provision (in Calif-
ornia) operable in this subject areaallows local government to "close" anyhighway to vehicular traffic.
• The closure of streets to through traf-
fic is a proper partial "closure" so long
as the partial closure applies to all
drivers (distinguishing cases whereresidents might otherwise be allowed
to somehow pass through the barriers
while outsiders are denied).
Hence, while the Berkeley case was ulti-
mately decided in favor of the traffic
management plan on the basis of legal
technicalities specific to California, the
case raises issues of importance through-
out the U.S.
In most states traffic control device
compliance with the Manual on UniformTraffic Control Devices (MUTCD) pub-
lished by the U.S Department of Trans-
portation or with parallel state manualsis to some degree required by law. Thereis considerable variation in wording and
intention of legislation across the coun-
try; in some states compliance being
mandatory, in others discretionary.
Many of the devices commonly used in
neighborhood traffic managementschemes-diagonal diverters, semi-diver-
ters, retrofit cul-de-sacs, speed control
circles, undulations-are not addressed in
the MUTCD. Particularly in states
where statutory language regarding com-pliance is mandatory, there is the con-
cern that, upon court challenge, removal
of the devices may be ordered because
they are not found in the MUTCD or pa-
rallel state manuals. There is further
concern that in states where compliance
26. County Board of Arlington v. Richards , 1977. 434 United States Reporter 5.
34
is mandatory, motorists involved in acci-
dents may successfully claim negligence
on the part of the responsible jurisdiction
was contributory to their accident. If
the state statute permits the acting jur-
isdiction to exercise discretion, then the
MUTCD or parallel state manual is ad-
missible only as some evidence of the
standard of care. Study of such cases
showed the MUTCD was considered "as
neither an absolute standard nor as
scientific truth (but as) illustration andexplanatory material along with otherevidence in the case bearing on ordinary
care." (27) The most straightforward
response to this concern is for the
MUTCD and parallel traffic control man-uals published by the states to be upda-ted to include specific standards andguidelines for neighborhood traffic con-trol devices like diverters, semi-diver-
ters, retrofit cul-de-sacs, undulations
and the like. While such action is a re-
commendation of this study, its imple-mentation will take time.
An alternative direction is to define
some of the devices not treated in the
MUTCD as "geometric features of the
road" rather than as "traffic control
devices". There is little fundamentaldifference between retrofit cul-de-sacs
and cul-de-sacs routinely designed into
new residential subdivisions. Likewise,there is little difference between street
patterns created by diagonal diverters
and discontinuous curvilinear street pat-terns commonly employed in new resi-
dential subdivisions. There is little
difference between speed control circles
used in neighborhoods and traffic circles
or rotaries sometimes used to organize
flows at major intersections. There is
little distinction between channelization
designed to force or prohibit turns in
neighborhood situations for traffic man-agement purposes and channelization in-
tended to similarly force or prohibit
turns in arterial situations for traffic
flow improvement purposes.
None of these geometric features in
their conventional applications are treat-
ed as control devices in the MUTCD.They are treated in basic reference texts
on geometric design of streets and high-
ways. However, to date, only one text
regarded as authoritive and broadly used
as a traffic engineering design reference
has covered their application to neigh-
borhood traffic restraint situations (28)
even though their application is extreme-ly pervasive.
The notion that a device like a diverter
is a change is the geometries of the
street rather than a traffic control de-
vice per the MUTCD definition seemsmost clear when permanent features like
curbs, gutters, sidewalks and landscaping
are incorporated in its design. Where the
device is comprised of temporary mater-ials like bollards or barricades, whetherthe device is a traffic control or a geo-metric feature seems much more an openquestion.
Implications of all of the foregoing are:
• While all devices covered in the
MUTCD are traffic control devices
which warn, guide or regulate traffic
it is not true that all devices used by
traffic engineers as common good
27. Thomas, Larry W. Liability of state and local governments for negligence arising
out of the installation and maintenance of warning signs, traffic lights, andpavement markings . NCHRP Research Results Digest No. I 10, April, 1979.
28. Homburger, W.S. and Kell, J.H., Fundamentals of Traffic Engineering , 9th Edition,
Institute of Transportation Studies, Berkeley, California, 1977.
35
practice to warn, guide or regulate
traffic are covered in the MUTCD.Many such devices that control traffic
are geometric features not treated in
the MUTCD but rather in other auth-
oritative references on traffic en-
gineering and geometric design.
Many of the so called "residential
street traffic controls" are geometricfeatures employed for traffic control
purposes and are virtually identical to
geometric features common to approv-
ed design for new residential streets or
for arterial situations.
Authorative reference manuals on geo-
metric design, with one exception,
have as yet not treated the application
of conventional geometric control fea-
tures to residential traffic control
situations. This situation should becorrected.
If a device is considered a geometricfeature, its installation may imply
some sort of change in the use of or a
"closing" of some portion of the
street. If this is the case, local
jurisdictions should follow procedures
specified in legislation delegating the
power to close streets in their particu-
lar state.
Use of permanent materials (like curbs
and gutters) rather than temporarymaterials (like moveable bollards or
barricades) may be important in con-firming the device as a geometricfeature rather than a traffic control.
136
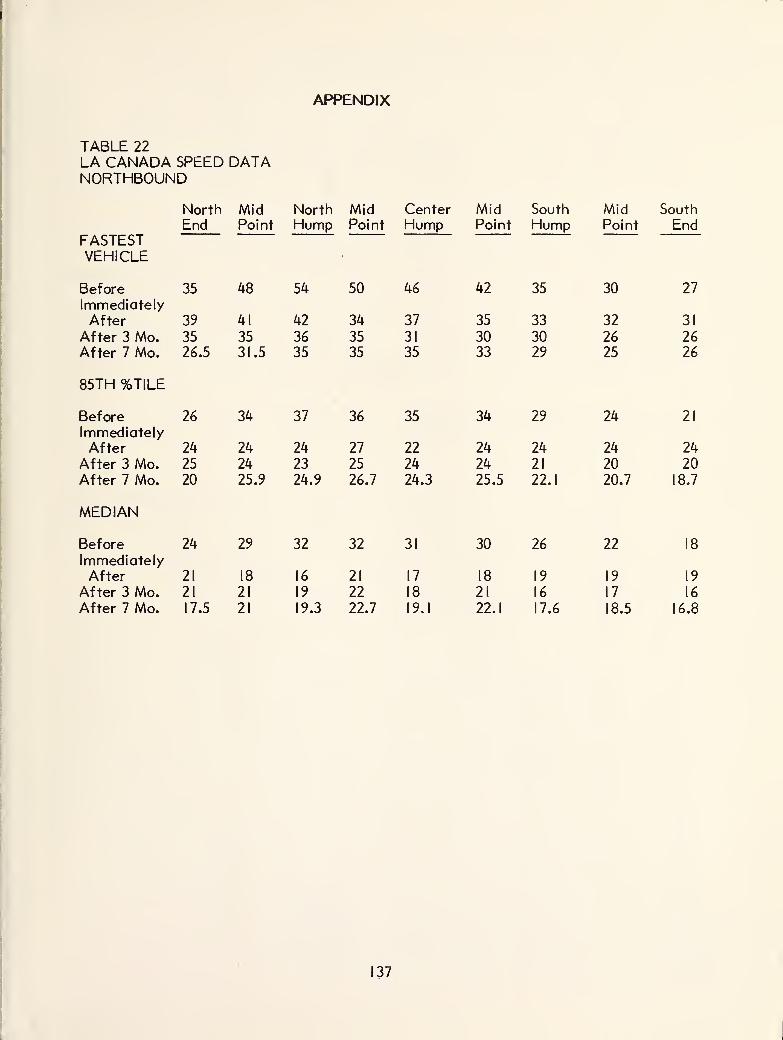
APPENDIX
TABLE 22
LA CANADA SPEED DATANORTHBOUND
North Mid North Mid Center Mid South Mid SouthEnd Point Hump Point Hump Point Hump Point End
FASTESTVEHICLE ?
Before 35 48 54 50 46 42 35 30 27
ImmediatelyAfter 39 41 42 34 37 35 33 32 31
After 3 Mo. 35 35 36 35 31 30 30 26 26After 7 Mo. 26.5 31.5 35 35 35 33 29 25 26
85TH %TILE
Before 26 34 37 36 35 34 29 24 21
ImmediatelyAfter 24 24 24 27 22 24 24 24 24
After 3 Mo. 25 24 23 25 24 24 21 20 20After 7 Mo. 20 25.9 24.9 26.7 24.3 25.5 22.1 20.7 18.7
MEDIAN
Before 24 29 32 32 31 30 26 22 18
ImmediatelyAfter 21 18 16 21 17 18 19 19 19
After 3 Mo. 21 21 19 22 18 21 16 17 16
After 7 Mo. 17.5 21 19.3 22.7 19.1 22.1 17.6 18.5 16.8
137
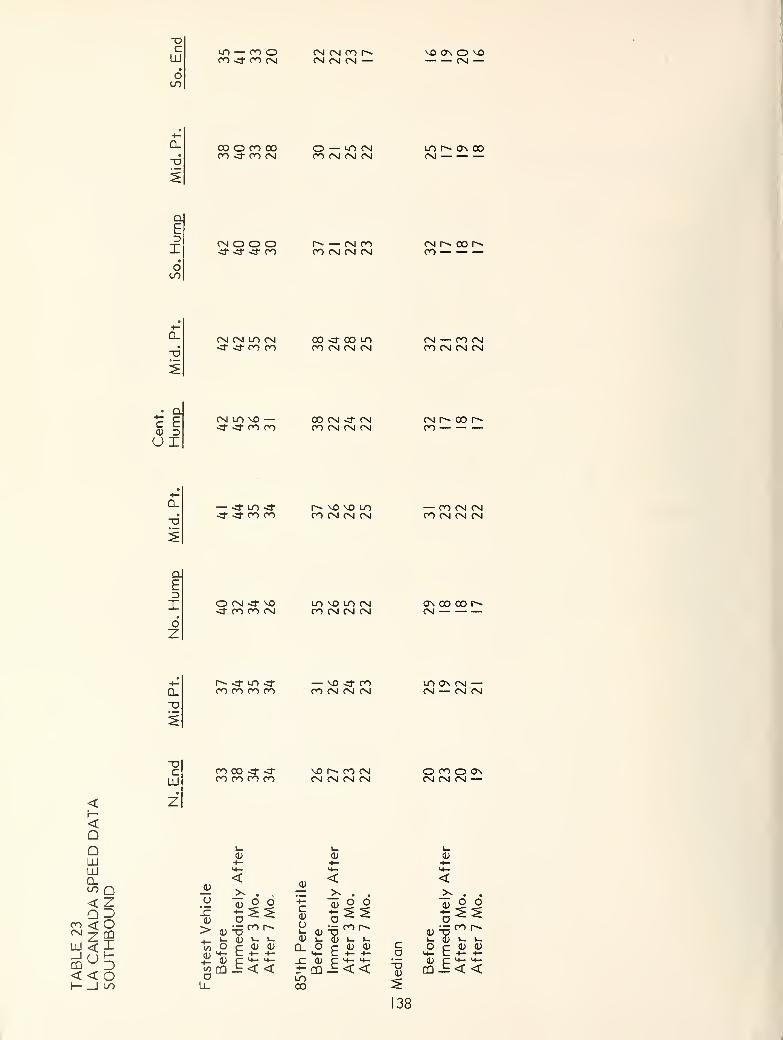
ocUJ
d
lo — co oco <t en cn CN CN CN — VO On O VO
CN —
CL
Xoo o m ooen <t en cn
o — lo CNOO CN CN CN
lo r^ on co
Q.
E
IoLO
CN O O Od- «d- -d- en
r- — cn coen cn cn cn
cn r^ oo r-»en
Q_
-6
CN CN LT) CN-d- -d- en en
oo -3- oo U-)CO CN CN CN
cn — en cnCO CN CN CN
(NLOVO —-d- o- co oo
00 CN -d" CNCO CN CN CN
cn r^- oo r~cn
0-
X<f LO <f-
•d- «d- en enr»» ko vo u~>
CO CN CN CN— CO CN CNen cn cn cn
aE
Idz
O CN -d" M3-d- oo en cn
LO V0 LO CNCO CN CN CN
on co oo r~CN
Q_
XI
r^ <f LO <tCO CO CO CO
— VO <f COCO CN CN CN
LO ON CN —CN — CN CN
<I—<OQLUUJQ_<S) Q<
cnCM
LU_lCD
<
DoCDXI—DoLO
XcUJ
co oo -d- -d-CO CO CO CO
VO 1^ CO CNCN CN CN CN
o co o onCN CN CN —
1_0>+- +- +-<+- L»- H-<
(D< <
£ >- . « x . . X . .
M "5 9 o +-a;
o o 0)OOg o^ C
a; ^s ^ss> ux 00 ^ o
o>t <1)=5"^
j_ h> (L) V- i- a> u 1) 1- l_ i_ <L) l_ L.
Fastesl
Befo Afte Afte
Q_ o E££ c oE a; £<-t- D <+-
•4-
LO00
0)
COC "4- *+-
J=<< X5
0)
CO J=<<
38
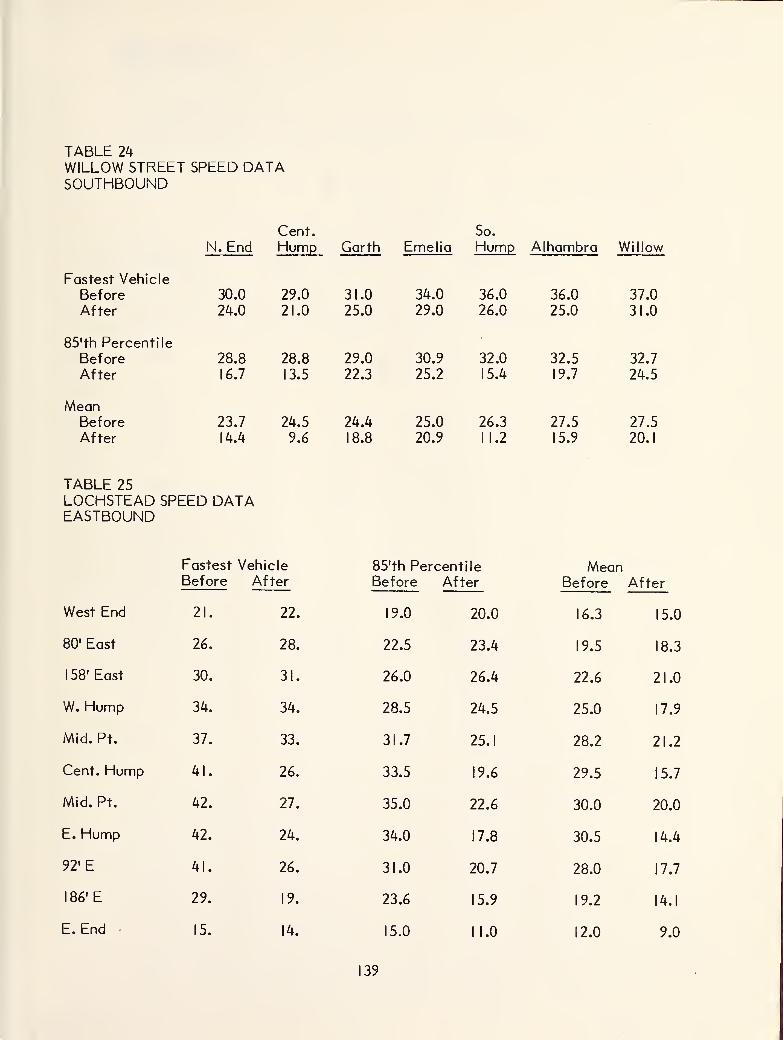
TABLE 24
WILLOW STREET SPEED DATASOUTHBOUND
N. EndCent.Hump Garth Emelia
So.
Hump Alhambra Willow
Fastest VehicleBeforeAfter
30.0
24.0
29.0
21.0
31.0
25.0
34.0
29.0
36.0
26.0
36.0
25.0
37.0
31.0
85'th Percentile
BeforeAfter
28.8
16.7
28.8
13.5
29.0
22.3
30.9
25.2
32.0
15.4
32.5
19.7
32.7
24.5
MeanBeforeAfter
23.7
14.4
24.5
9.6
24.4
18.8
25.0
20.9
26.3
11.2
27.5
15.9
27.5
20.1
TABLE 25
LOCHSTEAD SPEED DATAEASTBOUND
Fastest VehicleBefore After
West End
80' East
158' East
W. Hump
Mid. Pt.
Cent. Hump
Mid. Pt.
E. Hump
92'
E
186'
E
E. End
21.
26.
30.
34.
37.
41.
42.
42.
41.
29.
15.
22.
28.
31.
34.
33.
26.
27.
24.
26.
19.
14.
85'th Percentile
Before After
19.0 20.0
22.5 23.4
26.0 26.4
28.5 24.5
31.7 25.1
33.5 19.6
35.0 22.6
34.0 17.8
31.0 20.7
23.6 15.9
15.0 11.0
MeanBefore After
16.3 15.0
19.5 18.3
22.6 21.0
25.0 17.9
28.2 21.2
29.5 15.7
30.0 20.0
30.5 14.4
28.0 17.7
19.2 14.1
12.0 9.0
39
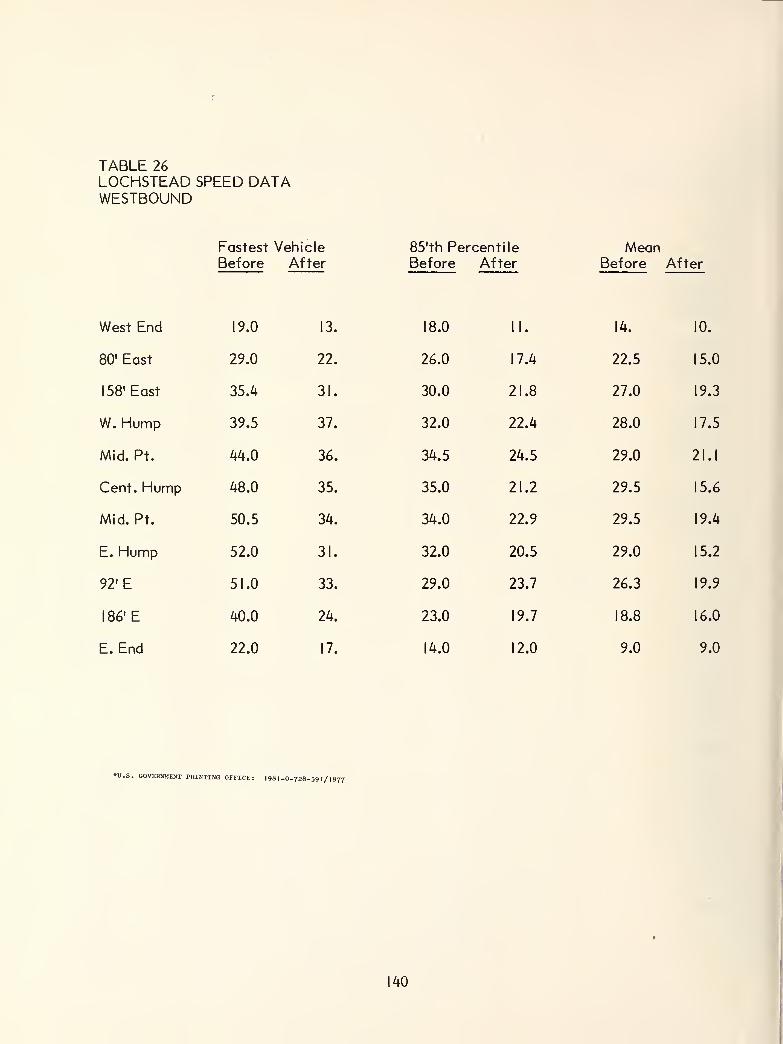
TABLE 26
LOCHSTEAD SPEED DATAWESTBOUND
Fastest Vehicle
Before After85'th Percentile
Before AfterMean
Before After
West End 19.0 13. 18.0 II. 14. 10.
80' East 29.0 22. 26.0 17.4 22.5 15.0
158' East 35.4 31. 30.0 21.8 27.0 19.3
W. Hump 39.5 37. 32.0 22.4 28.0 17.5
Mid. Pt. 44.0 36. 34.5 24.5 29.0 21.1
Cent. Hump 48.0 35. 35.0 21.2 29.5 15.6
Mid. Pt. 50.5 34. 34.0 22.9 29.5 19.4
E. Hump 52.0 31. 32.0 20.5 29.0 15.2
92'
E
51.0 33. 29.0 23.7 26.3 19.9
186'
E
40.0 24. 23.0 19.7 18.8 16.0
E. End 22.0 17. 14.0 12.0 9.0 9.0
U.S. GOVERNMENT PRINTING OFFICE: 1981-0-728-591/1877
140
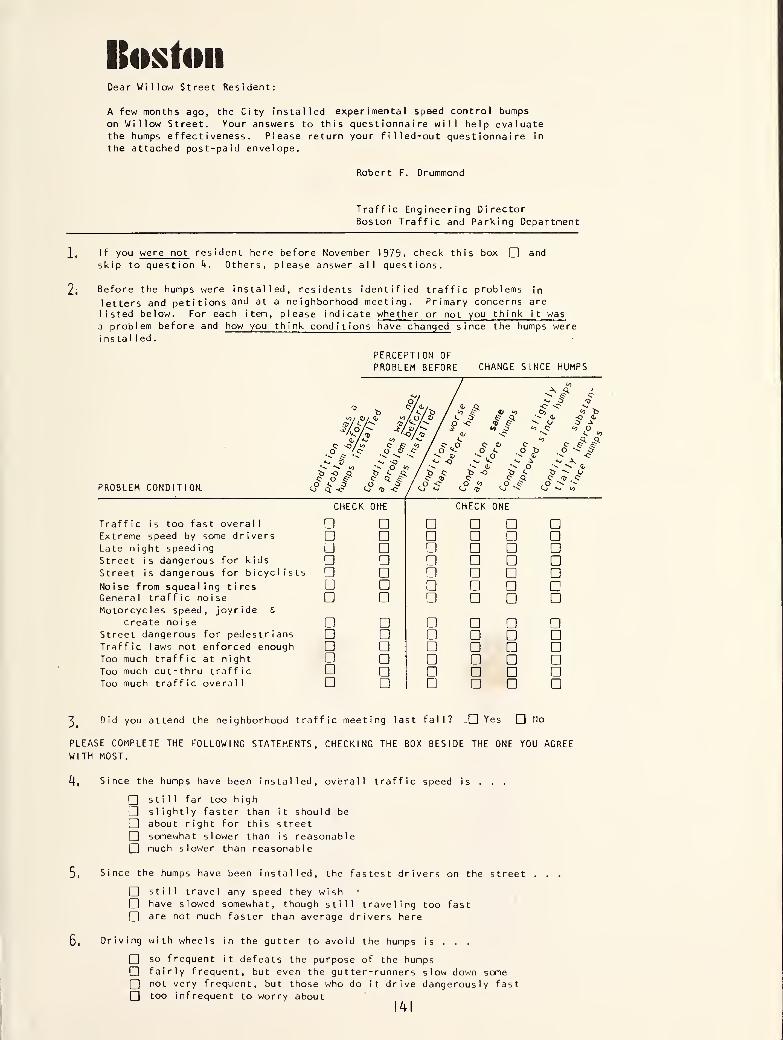
ItostoiiDear Willow Street Resident:
A few months ago, the City installed experimental speed control bumps
on Willow Street. Your answers to this questionnaire will help evaluatethe humps effectiveness. Please return your filled-out questionnaire in
the attached post-paid envelope.
Robert F. Drummond
Traffic Engineering DirectorBoston Traffic and Parking Department
2, If you were not resident here before November 1979, check this box Q and
skip to question k. Others, please answer all questions.
2; Before the humps were installed, residents identified traffic problems in
letters and pet i t ions and at a neighborhood meeting. Primary concerns are
listed below. For each item, please indicate whether or not you think it was
3 problem before and how you think conditions have changed since the humps werei nsta 1 led .
PERCEPTION OF
PROBLEM BEFORE CHANGE SINCE HUMPS
PROBLEM CONDITION.
A <i '
~N ^ C<* O 13
Hi q -c < <- -oo ^ <u to 0} <o b. ^ i? Q •- i/ O dJ
-c * e* *«. o O -2>
1 c? <o C "J O<u <r <. ":
I. "> S .9.3 CO C c ^ "5
sO <- O b •*
'", * O -« -C
>. V <- A «~ -\•~ Hj '^ O "~- "•» <U
t> -o b <~ b "N OC CO c n> cO <0 ,0 £• '~- •>
<o <6 tj "» <o «- ">
CHECK ON-E CHECK ONE
Traffic is too fast overall a a a dExtreme speed by some drivers a a a a a aLate night speeding G a a a a aStreet is dangerous for kids a a a a aStreet is dangerous for bicyclists a a a a DNoise from squealing tires D D a a a DGeneral traffic noise a a D D aMotorcycles speed, joyride &
create noise D a a a a aStreet dangerous for pedestrians a a a aTraffic laws not enforced enough a aToo much traffic at night a a aToo much cut-thru traffic a a a a a aToo much traffic overall a a a
Did /ou attend the neighborhood traffic meeting last fall? .Q Yes No3.
PLEASE COMPLETE THE FOLLOWING STATEMENTS, CHECKING THE BOX BESIDE THE ONE YOU AGREEWITH MOST.
L\, Since the humps have been installed, overall traffic speed is . . .
still far too h igh
slightly faster than it should be
G about right for this streetsomewhat slower than is reasonable
G much slower than reasonable
5, Since the humps have been installed, the fastest drivers on the street . . .
still travel any speed they wish J
G have slowed somewhat, though still traveling too fastare not much faster than average drivers here
5, Driving with wheels in the gutter to avoid the humps is . . .
so frequent it defeats the purpose of the humpsfairly frequent, but even the gutter-runners slow down some
Q not very frequent, but those who do it drive dangerously fasttoo infrequent to worry about
141
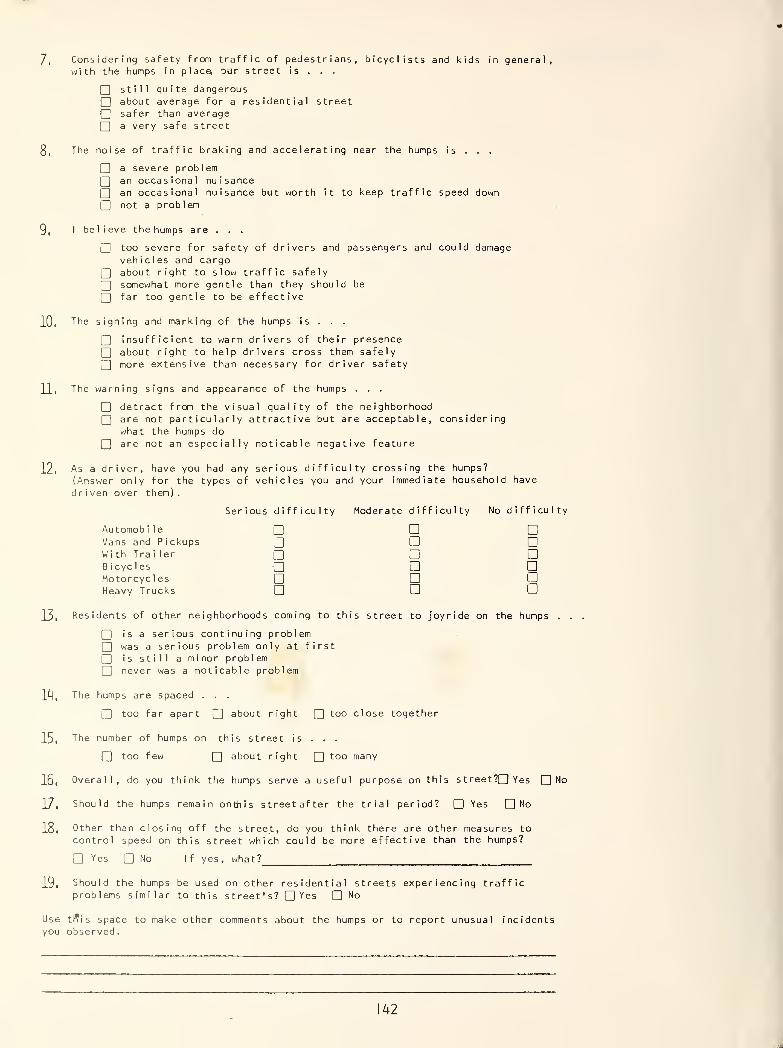
7, Considering safety from traffic of pedestrians, bicyclists and kids in general,with the humps in place, our street is . . .
still quite dangerousabout average for a residential streetsafer than averagea very safe street
3, The noise of traffic braking and accelerating near the humps is . . .
a severe problem
Q an occasional nuisancean occasional nuisance but worth it to keep traffic speed downnot a problem
9, I believe the humps are . . .
l] too severe for safety of drivers and passengers and could damagevehicles and cargo
Q about right to slow traffic safely
Q somewhat more gentle than they should be
[J far too gentle to be effective
Id The signing and marking of the humps is . . .
Q insufficient to warn drivers of their presence
Q about right to help drivers cross them safely
Q more extensive than necessary for driver safety
1 1
,
The warning signs and appearance of the humps . . .
O detract from the visual quality of the neighborhood
Q are not particularly attractive but are acceptable, consideringwhat the humps do
Q] are not an especially noticable negative feature
12, As a driver, have you had any serious difficulty crossing the humps?
(Answer only for the types of vehicles you and your immediate household have
dr i ven over them)
.
Serious difficulty Moderate difficulty No difficulty
Automobile D DVans and Pickups 3D D DWith Trailer D DBicycles Q Q DMotorcyclesHeavy Trucks D
13, Residents of other neighborhoods coming to this street to joyride on the humps . .
Q is a serious continuing problem
Q was a serious problem only at first
Q is still a minor problem
Q never was a noticable problem
14, The humps are spaced . . .
[~J too far apart j~J about right too close together
15, The number of humps on this street is . . .
too few Q about right Q too many
16, Overall, do you think the humps serve a useful purpose on this streetTQ Yes O No
17, Should the humps remain onthis streetafter the trial period? (~J Yes No
18, Other than closing off the street, do you think there are other measures to
control speed on this street which could be more effective than the humps?
Yes No If yes, what?
19, Should the humps be used on other residential streets experiencing trafficproblems similar to this street's? O Yes Q No
Use tffis space to make other comments about the humps or to report unusual incidentsyou observed.
142
1
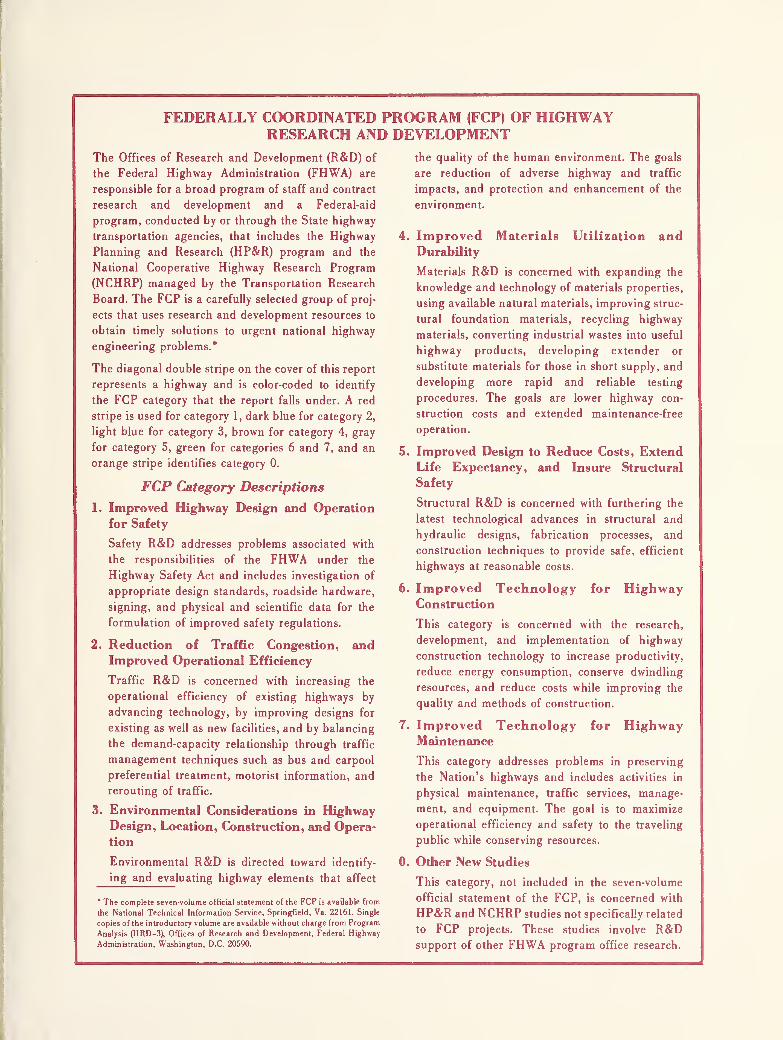
FEDERALLY COORDINATED PROGRAM (FCP) OF HIGHWAYRESEARCH AND DEVELOPMENT
The Offices of Research and Development (R&D) of
the Federal Highway Administration (FHWA) are
responsible for a broad program of staff and contract
research and development and a Federal-aid
program, conducted by or through the State highway
transportation agencies, that includes the Highway
Planning and Research (HP&R) program and the
National Cooperative Highway Research Program
(NCHRP) managed by the Transportation Research
Board. The FCP is a carefully selected group of proj-
ects that uses research and development resources to
obtain timely solutions to urgent national highway
engineering problems.*
The diagonal double stripe on the cover of this report
represents a highway and is color-coded to identify
the FCP category that the report falls under. A red
stripe is used for category 1, dark blue for category 2,
light blue for category 3, brown for category 4, gray
for category 5, green for categories 6 and 7, and an
orange stripe identifies category 0.
FCP Category Descriptions
1. Improved Highway Design and Operation
for Safety
Safety R&D addresses problems associated with
the responsibilities of the FHWA under the
Highway Safety Act and includes investigation of
appropriate design standards, roadside hardware,
signing, and physical and scientific data for the
formulation of improved safety regulations.
2. Reduction of Traffic Congestion, andImproved Operational Efficiency
Traffic R&D is concerned with increasing the
operational efficiency of existing highways by
advancing technology, by improving designs for
existing as well as new facilities, and by balancing
the demand-capacity relationship through traffic
management techniques such as bus and carpool
preferential treatment, motorist information, and
rerouting of traffic.
3. Environmental Considerations in HighwayDesign, Location, Construction, and Opera-
tion
Environmental R&D is directed toward identify-
ing and evaluating highway elements that affect
* The complete seven-volume official statement of the FCP is available from
the National Technical Information Service, Springfield, Va. 22161. Single
copies of the introductory volume are available without charge from Program
Analysis (HRD-3), Offices of Research and Development, Federal Highway
Administration, Washington, D.C. 20590.
the quality of the human environment. The goals
are reduction of adverse highway and traffic
impacts, and protection and enhancement of the
environment.
4. Improved Materials Utilization andDurability
Materials R&D is concerned with expanding the
knowledge and technology of materials properties,
using available natural materials, improving struc-
tural foundation materials, recycling highway
materials, converting industrial wastes into useful
highway products, developing extender or
substitute materials for those in short supply, and
developing more rapid and reliable testing
procedures. The goals are lower highway con-
struction costs and extended maintenance-free
operation.
5. Improved Design to Reduce Costs, ExtendLife Expectancy, and Insure Structural
Safety
Structural R&D is concerned with furthering the
latest technological advances in structural and
hydraulic designs, fabrication processes, and
construction techniques to provide safe, efficient
highways at reasonable costs.
6. Improved Technology for HighwayConstruction
This category is concerned with the research,
development, and implementation of highway
construction technology to increase productivity,
reduce energy consumption, conserve dwindling
resources, and reduce costs while improving the
quality and methods of construction.
7. Improved Technology for HighwayMaintenance
This category addresses problems in preserving
the Nation's highways and includes activities in
physical maintenance, traffic services, manage-
ment, and equipment. The goal is to maximize
operational efficiency and safety to the traveling
public while conserving resources.
0. Other New Studies
This category, not included in the seven-volume
official statement of the FCP, is concerned with
HP&R and NCHRP studies not specifically related
to FCP projects. These studies involve R&Dsupport of other FHWA program office research.

DOT LIBRARY
DD 7fiSflE