Embed Size (px)
Citation preview
IEA Bioenergy: ExCo: 2018:04
IEA Bioenergy Countries’ Report – Update 2018Bioenergy policies and status of implementation
IEA Bioenergy Countries’ Report – Update 2018Bioenergy policies and status of implementation
Edited by Luc Pelkmans, Technical Coordinator IEA Bioenergy
Copyright © 2018 IEA Bioenergy. All rights Reserved
Published by IEA Bioenergy
IEA Bioenergy, also known as the Technology Collaboration Programme (TCP) for a Programme of Research, Development and Demonstration on Bioenergy, functions within a Framework created by the International Energy Agency (IEA). Views, findings and publications of IEA Bioenergy do not necessarily represent the views or policies of the IEA Secretariat or of its individual Member countries.
INTRODUCTION TO NATIONAL COUNTRY REPORTS
This report, together with the separate country
reports, was prepared from IEA statistical data1,
combined with data and information provided
by the IEA Bioenergy Executive Committee
and its Tasks. All individual country reports
were reviewed by the national delegates to the
IEA Bioenergy Executive Committee, who have
approved the content.
The individual country reports are available
as separate reports. Reports are available for
Australia, Austria, Belgium, Brazil, Canada,
Croatia, Denmark, Estonia, Finland, France,
Germany, Ireland, Italy, Japan, South Korea,
the Netherlands, New Zealand, Norway, South
Africa, Sweden, Switzerland, the United
Kingdom, the United States, as well as the
European Union (as a whole, with 28 member
countries).
In the first section of each country report,
national renewable energy targets are presented
(first table in each country report), and the main
pieces of national legislation are discussed.
In the second section of each country report the
total primary energy supply (TPES) by resources
and the contribution of bioenergy are presented.
All data is taken from IEA statistics for the
year 2016. It is worth noting that data reported
in national statistics can differ from the IEA
data presented, as the reporting categories and
definitions may be different.
1 World Energy Balances – 2018 Edition © OECD/IEA IEA statistical data is collated from national bodies on a joint annual questionnaire (with Eurostat and the United Nations), so that the data is the same as reported in e.g. Eurostat. However, data is presented as summarised data, and the way it is displayed or categorised differs from the way in which Eurostat and others display their data. The details of how IEA data is collated and displayed are explained in the IEA Energy Statistics Manual which is available from the IEA website in many different languages. Also available on the IEA website are the balance definitions, part of which are displayed in Annex. For more definitions please check http://www.iea.org/statistics/resources/balancedefinitions/.
The first figure presents the total primary
energy supply by source. TPES is defined
as production plus imports minus exports
minus marine and aviation bunkers and plus/
minus stock changes (see definition section).
Thus, according to the IEA definition of
TPES, because of imports, both primary
and secondary energy carriers are displayed.
Nevertheless, this figure depicts the share of
fossil energy carriers in the country’s energy
mix, with the drawback that the source of
imported electricity is unknown. Resource
categories displayed include coal and coal
products; crude oil, natural gas liquid (NGL)
and oil products; natural gas; nuclear; waste
(non-renewable); renewable energy-bioenergy;
renewable energy-other; and electricity
(imported minus exported).
The second figure focuses on the share that
different renewable energy sources provide
to the total primary energy supply. Several
renewable sources such as hydropower;
geothermal; solar PV; solar thermal; tidal,
wave and ocean; wind; and bioenergy are
taken into consideration.
In the third figure, the contribution of
different bioenergy carriers is presented in
detail. These include primary solid biofuels,
renewable municipal wastes (MSW),
biogases, biogasoline, biodiesels and other
liquid biofuels. It is worth noting that
biogasoline includes all types of biofuels being
used in Otto engines, and biodiesel includes all
types of biofuels being used in Diesel engines,
see definitions in next section for details.
The fourth figure presents the trend in the
evolution of bioenergy for each country from the
year 1990 to 2016. Values presented are total
primary energy supply in each of the categories
solid biofuels, renewable municipal wastes,
biogases and liquid biofuels. The share of
bioenergy is calculated from the total TPES
as depicted in Figure 1 of the country report.
1
The second table presents Total Primary
Energy Supply in 2016 per unit population,
as well as the energy that bioenergy in total
and solid biofuels, renewable MSW, biogas
and liquid biofuels provide to this.
The third table presents the share of
bioenergy and other renewable energy in
national electricity production, in transport
energy consumption, and in the overall
consumption of fuels and heat2.
For European countries, the renewable energy
shares in gross final energy consumption for
heating and cooling, electricity and transport,
as reported in Eurostat, are also mentioned.
In the third section of each country report, the
research focus related to bioenergy is discussed.
Relevant funding programs, major research
institutes and projects are described.
In the fourth section, recent major bioenergy
developments are described.
Finally, in the fifth section, links to sources of
information are provided.
All individual country reports are available at:
https://www.ieabioenergy.com/iea-publications/
country-reports/2018-country-reports/
The following paragraph presents a comparative
overview of the results for the different countries
for the role of bioenergy in TPES (relative and
expressed per capita), in electricity production, in
transport energy consumption and in total heat/
fuel consumption.
2 This includes fuels and heat in industry, the residential sector, commercial and public services and agriculture/forestry. Transport fuels are excluded. Energy used for transformation and for own use of energy producing industries is also excluded.
2
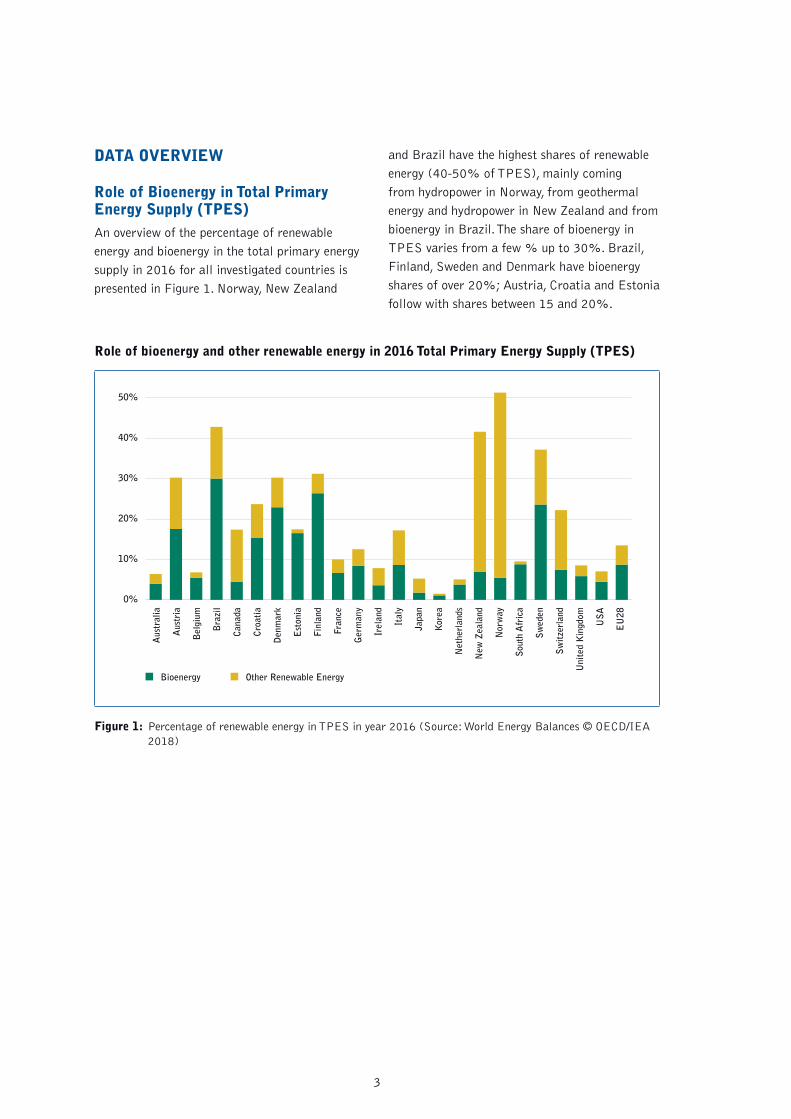
DATA OVERVIEW
Role of Bioenergy in Total Primary Energy Supply (TPES)An overview of the percentage of renewable
energy and bioenergy in the total primary energy
supply in 2016 for all investigated countries is
presented in Figure 1. Norway, New Zealand
and Brazil have the highest shares of renewable
energy (40-50% of TPES), mainly coming
from hydropower in Norway, from geothermal
energy and hydropower in New Zealand and from
bioenergy in Brazil. The share of bioenergy in
TPES varies from a few % up to 30%. Brazil,
Finland, Sweden and Denmark have bioenergy
shares of over 20%; Austria, Croatia and Estonia
follow with shares between 15 and 20%.
Role of bioenergy and other renewable energy in 2016 Total Primary Energy Supply (TPES)
0%
10%
20%
30%
40%
50%
Aus
tral
ia
Aus
tria
Bel
gium
Bioenergy Other Renewable Energy
Bra
zil
Can
ada
Cro
atia
Den
mar
k
Est
onia
Finl
and
Fran
ce
Ger
man
y
Irel
and
Ital
y
Japa
n
Kor
ea
Net
herl
ands
New
Zea
land
Nor
way
Sou
th A
fric
a
Sw
eden
Sw
itze
rlan
d
Uni
ted
Kin
gdom
US
A
EU
28
Figure 1: Percentage of renewable energy in TPES in year 2016 (Source: World Energy Balances © OECD/IEA 2018)
3
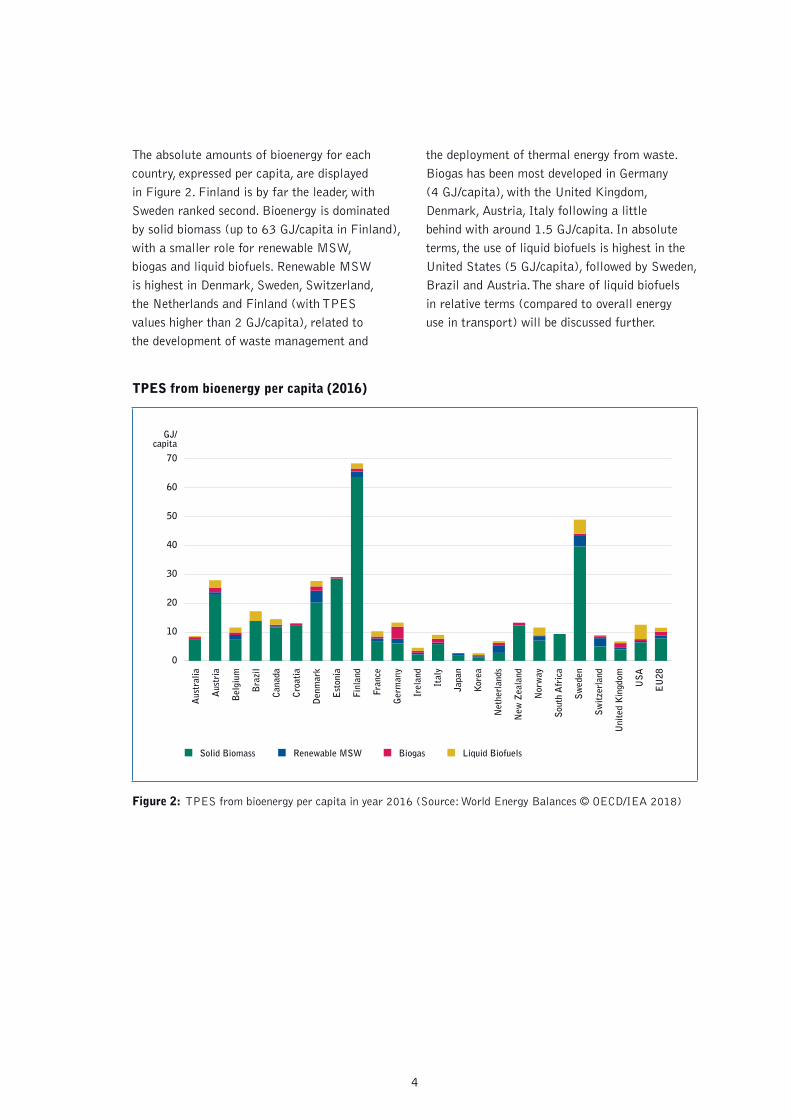
The absolute amounts of bioenergy for each
country, expressed per capita, are displayed
in Figure 2. Finland is by far the leader, with
Sweden ranked second. Bioenergy is dominated
by solid biomass (up to 63 GJ/capita in Finland),
with a smaller role for renewable MSW,
biogas and liquid biofuels. Renewable MSW
is highest in Denmark, Sweden, Switzerland,
the Netherlands and Finland (with TPES
values higher than 2 GJ/capita), related to
the development of waste management and
the deployment of thermal energy from waste.
Biogas has been most developed in Germany
(4 GJ/capita), with the United Kingdom,
Denmark, Austria, Italy following a little
behind with around 1.5 GJ/capita. In absolute
terms, the use of liquid biofuels is highest in the
United States (5 GJ/capita), followed by Sweden,
Brazil and Austria. The share of liquid biofuels
in relative terms (compared to overall energy
use in transport) will be discussed further.
TPES from bioenergy per capita (2016)
0
30
20
10
40
50
60
70
Aus
tral
ia
Aus
tria
Bel
gium
Solid Biomass Renewable MSW
Bra
zil
Can
ada
Cro
atia
Den
mar
k
Est
onia
Finl
and
Fran
ce
Ger
man
y
Irel
and
Ital
y
Japa
n
Kor
ea
Net
herl
ands
New
Zea
land
Nor
way
Sou
th A
fric
a
Sw
eden
Sw
itze
rlan
d
Uni
ted
Kin
gdom
US
A
EU
28
Biogas Liquid Biofuels
GJ/capita
Figure 2: TPES from bioenergy per capita in year 2016 (Source: World Energy Balances © OECD/IEA 2018)
4
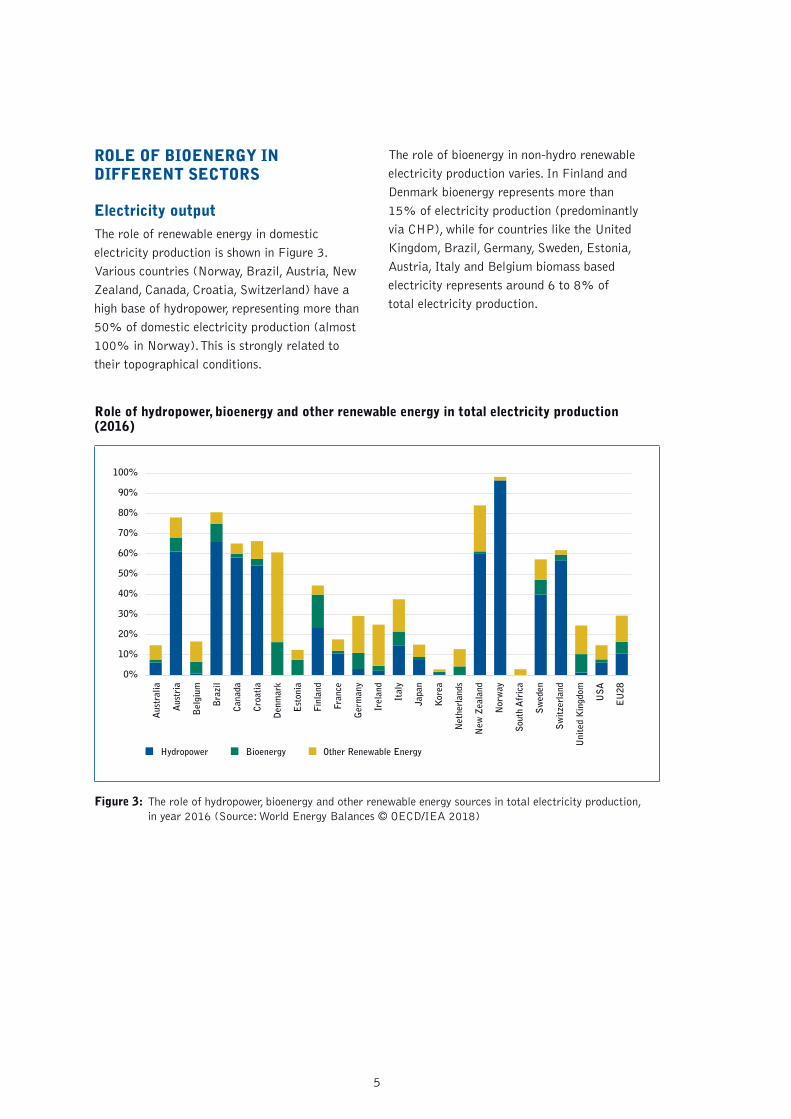
ROLE OF BIOENERGY IN DIFFERENT SECTORS
Electricity outputThe role of renewable energy in domestic
electricity production is shown in Figure 3.
Various countries (Norway, Brazil, Austria, New
Zealand, Canada, Croatia, Switzerland) have a
high base of hydropower, representing more than
50% of domestic electricity production (almost
100% in Norway). This is strongly related to
their topographical conditions.
The role of bioenergy in non-hydro renewable
electricity production varies. In Finland and
Denmark bioenergy represents more than
15% of electricity production (predominantly
via CHP), while for countries like the United
Kingdom, Brazil, Germany, Sweden, Estonia,
Austria, Italy and Belgium biomass based
electricity represents around 6 to 8% of
total electricity production.
Role of hydropower, bioenergy and other renewable energy in total electricity production (2016)
0%
60%
50%
40%
30%
20%
10%
70%
80%
90%
100%
Aus
tral
ia
Aus
tria
Bel
gium
Hydropower Other Renewable Energy
Bra
zil
Can
ada
Cro
atia
Den
mar
k
Est
onia
Finl
and
Fran
ce
Ger
man
y
Irel
and
Ital
y
Japa
n
Kor
ea
Net
herl
ands
New
Zea
land
Nor
way
Sou
th A
fric
a
Sw
eden
Sw
itze
rlan
d
Uni
ted
Kin
gdom
US
A
EU
28
Bioenergy
Figure 3: The role of hydropower, bioenergy and other renewable energy sources in total electricity production, in year 2016 (Source: World Energy Balances © OECD/IEA 2018)
5
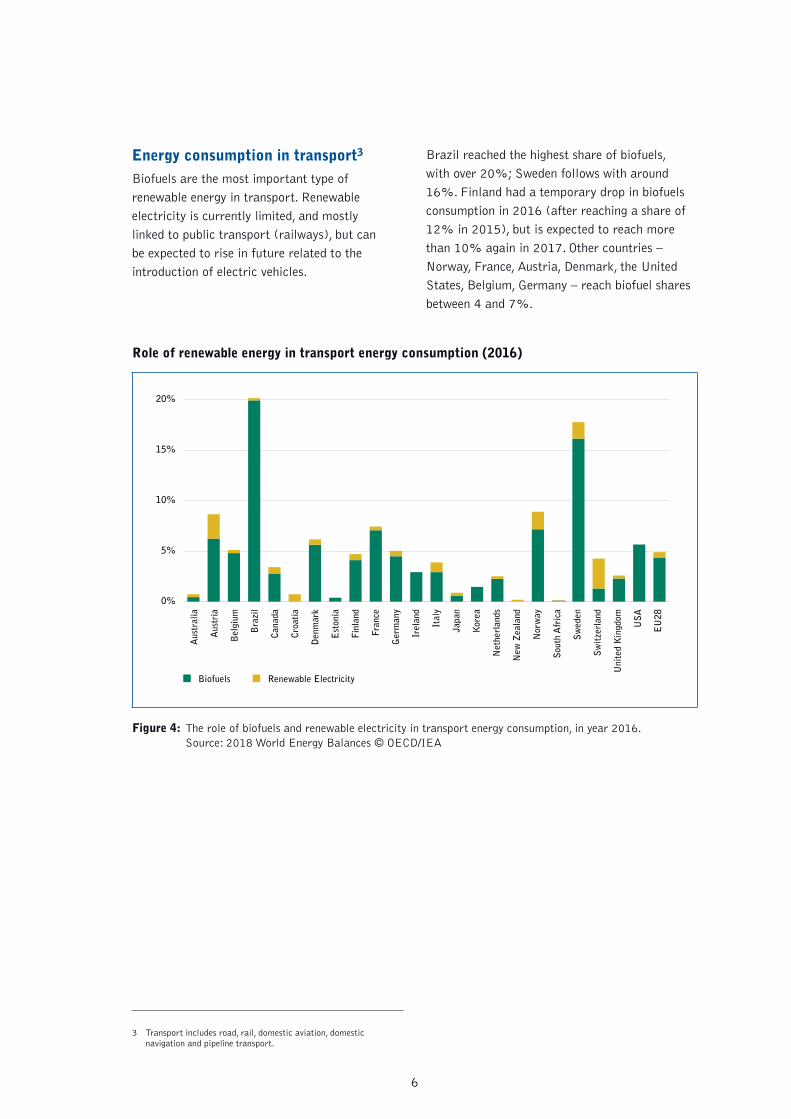
Energy consumption in transport3
Biofuels are the most important type of
renewable energy in transport. Renewable
electricity is currently limited, and mostly
linked to public transport (railways), but can
be expected to rise in future related to the
introduction of electric vehicles.
Role of renewable energy in transport energy consumption (2016)
0%
5%
10%
15%
20%
Aus
tral
ia
Aus
tria
Bel
gium
Biofuels Renewable Electricity
Bra
zil
Can
ada
Cro
atia
Den
mar
k
Est
onia
Finl
and
Fran
ce
Ger
man
y
Irel
and
Ital
y
Japa
n
Kor
ea
Net
herl
ands
New
Zea
land
Nor
way
Sou
th A
fric
a
Sw
eden
Sw
itze
rlan
d
Uni
ted
Kin
gdom
US
A
EU
28
Figure 4: The role of biofuels and renewable electricity in transport energy consumption, in year 2016. Source: 2018 World Energy Balances © OECD/IEA
3 Transport includes road, rail, domestic aviation, domestic navigation and pipeline transport.
Brazil reached the highest share of biofuels,
with over 20%; Sweden follows with around
16%. Finland had a temporary drop in biofuels
consumption in 2016 (after reaching a share of
12% in 2015), but is expected to reach more
than 10% again in 2017. Other countries –
Norway, France, Austria, Denmark, the United
States, Belgium, Germany – reach biofuel shares
between 4 and 7%.
6
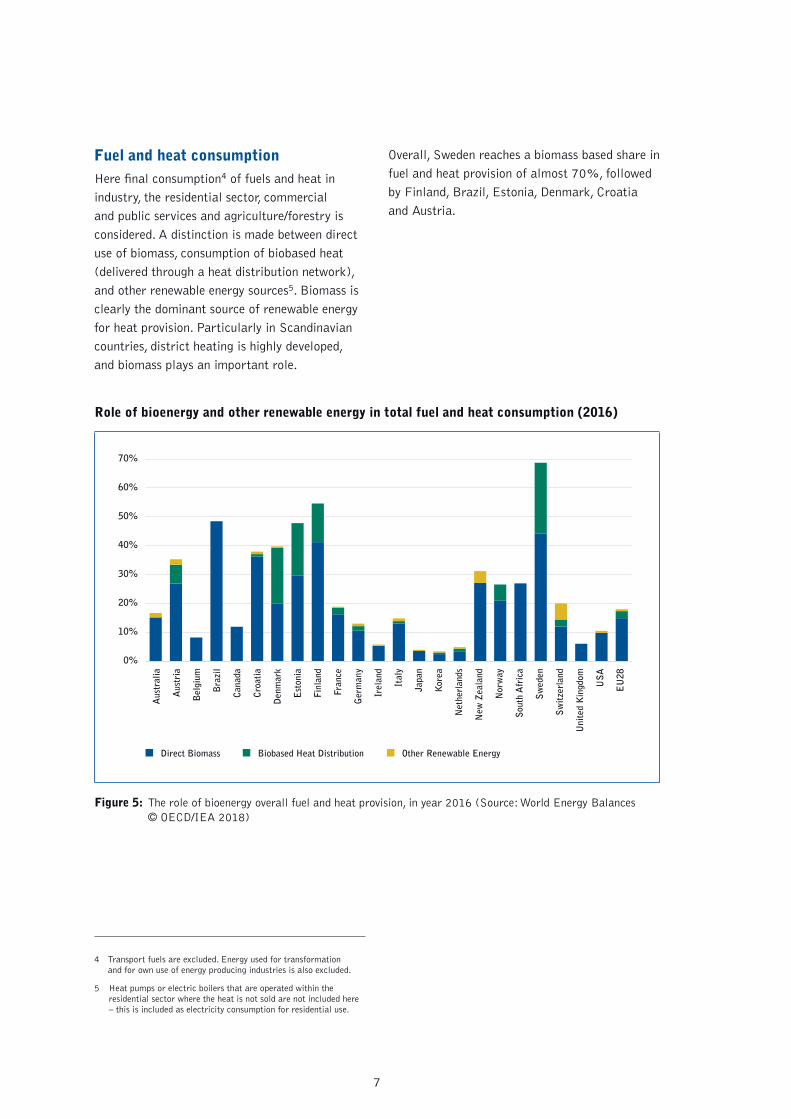
Fuel and heat consumptionHere final consumption4 of fuels and heat in
industry, the residential sector, commercial
and public services and agriculture/forestry is
considered. A distinction is made between direct
use of biomass, consumption of biobased heat
(delivered through a heat distribution network),
and other renewable energy sources5. Biomass is
clearly the dominant source of renewable energy
for heat provision. Particularly in Scandinavian
countries, district heating is highly developed,
and biomass plays an important role.
Role of bioenergy and other renewable energy in total fuel and heat consumption (2016)
0%
10%
50%
40%
30%
20%
60%
70%
Aus
tral
ia
Aus
tria
Bel
gium
Direct Biomass Biobased Heat Distribution
Bra
zil
Can
ada
Cro
atia
Den
mar
k
Est
onia
Finl
and
Fran
ce
Ger
man
y
Irel
and
Ital
y
Japa
n
Kor
ea
Net
herl
ands
New
Zea
land
Nor
way
Sou
th A
fric
a
Sw
eden
Sw
itze
rlan
d
Uni
ted
Kin
gdom
US
A
EU
28
Other Renewable Energy
Figure 5: The role of bioenergy overall fuel and heat provision, in year 2016 (Source: World Energy Balances © OECD/IEA 2018)
4 Transport fuels are excluded. Energy used for transformation and for own use of energy producing industries is also excluded.
5 Heat pumps or electric boilers that are operated within the residential sector where the heat is not sold are not included here – this is included as electricity consumption for residential use.
Overall, Sweden reaches a biomass based share in
fuel and heat provision of almost 70%, followed
by Finland, Brazil, Estonia, Denmark, Croatia
and Austria.
7
ANNEX
DefinitionsIEA statistical data is collated from national
bodies on a joint annual questionnaire (with
Eurostat and the United Nations), so that the
data is the same as reported in e.g. Eurostat.
However, data is presented as summarised
data, and the way it is displayed or categorised
differs from the way in which Eurostat and
others display their data. The details of how
IEA data is collated and displayed are explained
in the IEA Energy Statistics Manual which is
available from the IEA website in many different
languages. Also available on the IEA website
are the balance definitions, part of which are
displayed below. For more definitions please
check http://www.iea.org/statistics/resources/
balancedefinitions/.
Total Primary Energy Supplyis made up of:
+ Indigenous production
+ imports
– exports
– international marine bunkers
– international aviation bunkers
+/– stock changes.
Production
Production refers to the production of primary
energy, i.e. hard coal, lignite, peat, crude oil,
NGL, natural gas, combustible renewables and
waste, nuclear, hydro, geothermal, solar and the
heat from heat pumps that is extracted from the
ambient environment6. Production is calculated
after removal of impurities (e.g. sulphur from
natural gas).
6 Heat pumps that are operated within the residential sector where the heat is not sold are not considered a transformation process and are not included here – the electricity consumption appears as residential use.
Calculation of production of hydro, geothermal,
etc. and nuclear electricity is explained in the
Energy Statistics Manual available for free
download on the IEA website.
Imports and Exports
Imports and exports comprise amounts having
crossed the national territorial boundaries of the
country, whether or not customs clearance has
taken place.
International marine bunkers
International marine bunkers covers those
quantities delivered to ships of all flags that
are engaged in international navigation. The
international navigation may take place at sea,
on inland lakes and waterways, and in coastal
waters. Consumption by ships engaged in
domestic navigation is excluded. The domestic/
international split is determined on the basis of
port of departure and port of arrival, and not by
the flag or nationality of the ship. Consumption
by fishing vessels and by military forces is also
excluded.
International aviation bunkers
International aviation bunkers includes deliveries
of aviation fuels to aircraft for international
aviation. Fuels used by airlines for their road
vehicles are excluded. The domestic/international
split should be determined on the basis of
departure and landing locations and not by the
nationality of the airline. For many countries this
incorrectly excludes fuel used by domestically
owned carriers for their international departures.
Stock Changes
Stock changes reflect the difference between
opening stock levels at the first day of the year
and closing levels on the last day of the year of
stocks on national territory held by producers,
importers, energy transformation industries and
large consumers. A stock build-up is shown as
a negative number, and a stock drawdown as a
positive number.
8
Biofuels and WasteBiofuels & waste is comprised of solid biofuels,
liquid biofuels, biogases, industrial waste
and municipal waste. Note that for biomass
commodities, only the amounts specifically
used for energy purposes (a small part of the
total) are included in the energy statistics.
Therefore, the non-energy use of biomass is
not taken into consideration and quantities are
null by definition. Data under this heading are
often based on small sample surveys or other
incomplete information. Thus the data give
only a broad impression of developments, and
are not strictly comparable between countries.
In some cases complete categories of vegetal
fuel are omitted through lack of information.
For more information on a fuel type, please
see the following list:
Biogases
Biogases are gases arising from the anaerobic
fermentation of biomass and the gasification
of solid biomass (including biomass in wastes).
The biogases from anaerobic fermentation are
composed principally of methane and carbon
dioxide and comprise landfill gas, sewage
sludge gas and other biogases from anaerobic
fermentation.
Biogases can also be produced from thermal
processes (by gasification or pyrolysis) of
biomass and are mixtures containing hydrogen
and carbon monoxide (usually known as syngas)
along with other components. These gases may
be further processed to modify their composition
and to produce substitute natural gas.
Liquid biofuels
Liquid biofuels includes biogasoline, biodiesel
and other liquid biofuels. It does not include the
total volume of gasoline or diesel into which the
biofuels are blended.
Biogasoline includes bioethanol (ethanol
produced from biomass and/or the biodegradable
fraction of waste), biomethanol (methanol
produced from biomass and/or the biodegradable
fraction of waste), bio-ETBE (ethyl-tertio-
butyl-ether produced on the basis of bioethanol;
the percentage by volume of bio-ETBE that is
calculated as biofuel is 47%) and bio-MTBE
(methyl-tertio-butyl-ether produced on the basis
of biomethanol: the percentage by volume of bio-
MTBE that is calculated as biofuel is 36%).
Biodiesels includes biodiesel (a methyl-ester
produced from vegetable or animal oil, of diesel
quality), bio-DME (dimethylether produced
from biomass), Fischer Tropsh (Fischer Tropsh
produced from biomass), cold pressed bio-oil
(oil produced from oil seed through mechanical
processing only) and all other liquid biofuels
which are added to, blended with or used straight
(unblended) as transport diesel.
Other liquid biofuels includes liquid biofuels not
reported in either biogasoline or biodiesels.
Industrial waste
Industrial waste of non-renewable origin
consists of solid and liquid products (e.g. tyres)
combusted directly, usually in specialised plants,
to produce heat and/or power. Renewable
industrial waste is not included here, but with
solid biofuels, biogas or liquid biofuels.
Municipal waste
Municipal waste consists of products that are
combusted directly to produce heat and/or power
and comprises wastes produced by households,
industry, hospitals and the tertiary sector that
are collected by local authorities for incineration
at specific installations.
9
Primary solid biofuels and charcoal
Primary solid biofuels and charcoal are defined
as any plant matter used directly as fuel or
converted into other forms before combustion.
This covers a multitude of woody materials
generated by industrial processes or provided
directly by forestry and agriculture (firewood,
wood chips, bark, sawdust, shavings, chips,
sulphite lyes also known as black liquor, animal
materials/wastes and other solid biomass).
Charcoal produced from solid biomass is also
included here. Since charcoal is a secondary
product, its treatment is slightly different
than that of the other primary solid biofuels.
Production of charcoal (an output in the
transformation process) is offset by the inputs
of primary solid biofuels into the charcoal
production process. The losses from this process
are included in the row ‘other transformation’.
Other supply (e.g. trade and stock changes) as
well as consumption are aggregated directly with
the primary solid biofuels. In most countries, only
the primary solid biofuels are reported.
Hydro/solar PV/wind energy/tide, wave, ocean
For hydro, solar, wind and tide/wave/ocean energy,
the energy content of the electricity produced
is considered in TPES*. Other sources for
electricity also have waste heat which is counted
in the TPES (e.g. ‘Nuclear’ shows the primary
heat equivalent of the electricity produced by
a nuclear power plant with an average thermal
efficiency of 33%). So care should be taken
when using TPES to compare the role of the
different energy sources as this overestimates the
role of resources producing electricity with a high
share of unused waste heat.
* When it comes to electricity from non-combustible sources, the IEA, in line with IRES, adopts a coherent principle across sources – the “physical content method” – by measuring the primary energy equivalent at the first point downstream in the production process for which multiple energy uses are practical. This means that hydro, wind and solar become “energy products” in the statistical sense at the point of generation of electricity, and that their “primary energy equivalent” is computed as the electricity generated in the plant, while the kinetic energy of the wind or the water does not enter the “energy balance”, although being “energy” in a scientific sense.
The IEA had at a point used the “partial
substitution method”, based on the assumption
that hydro, wind, solar electricity had displaced
thermal generation. This involved using an
average thermal conversion efficiency (e.g. 36%)
to back-compute their corresponding “primary
energy equivalent”. This made their shares in
the primary energy supply greater (around three
times as much). However, the principle was
abandoned as it relied on arbitrary conversion
factors and was creating some transformation
losses inside the energy balance that did not
really exist.
https://www.iea.org/newsroom/news/2017/
september/commentary-understanding-and-using-
the-energy-balance.html
10
UNITS
The standard unit converter of the International
Energy Agency was used. (https://www.iea.org/
statistics/resources/unitconverter/)
kilo (k): 103
mega (M): 106
giga (G): 109
tera (T): 1012
peta (P): 1015
exa (E): 1018
Most figures in the country reports are expressed
in PJ (petajoule).
1 PJ = 23884.6 toe (tonne of oil equivalent)
= 0.2778 TWh (terawatt hour) (mostly relevant for electricity production)
= 947817.12 million Btu (British
thermal unit) (commonly used in the United States)
SYMBOLS AND ABBREVIATIONS
CHP: Combined Heat and Power
CO2: carbon dioxide
DME: dimethylether
ETBE: ethyl-tertio-butyl-ether
ETS: Emission Trading System
EU: European Union
GHG: Greenhouse gases
IEA: International Energy Agency
IRES: International Recommendations
for Energy Statistics
MSW: municipal solid waste
MTBE: methyl-tertio-butyl-ether
NGL: natural gas liquid
NREAP: National Renewable Energy Action
Plans
OECD: Organisation for Economic Co-operation
and Development
RES: Renewable Energy Sources
TPES: total primary energy supply
US/USA: United States of America
11
Further Information
IEA Bioenergy Website www.ieabioenergy.com
Contact us: www.ieabioenergy.com/contact-us/