Embed Size (px)
Citation preview
1
Center for Immigration Studies
1629 K Street, NW, Suite 600, Washington, DC 20006 • Phone 202.466.8185 • Fax 202.466.8076 • www.cis.org
C I S
CIS Letterhead_Layout 1 7/26/12 4:34 PM Page 1
January 2017
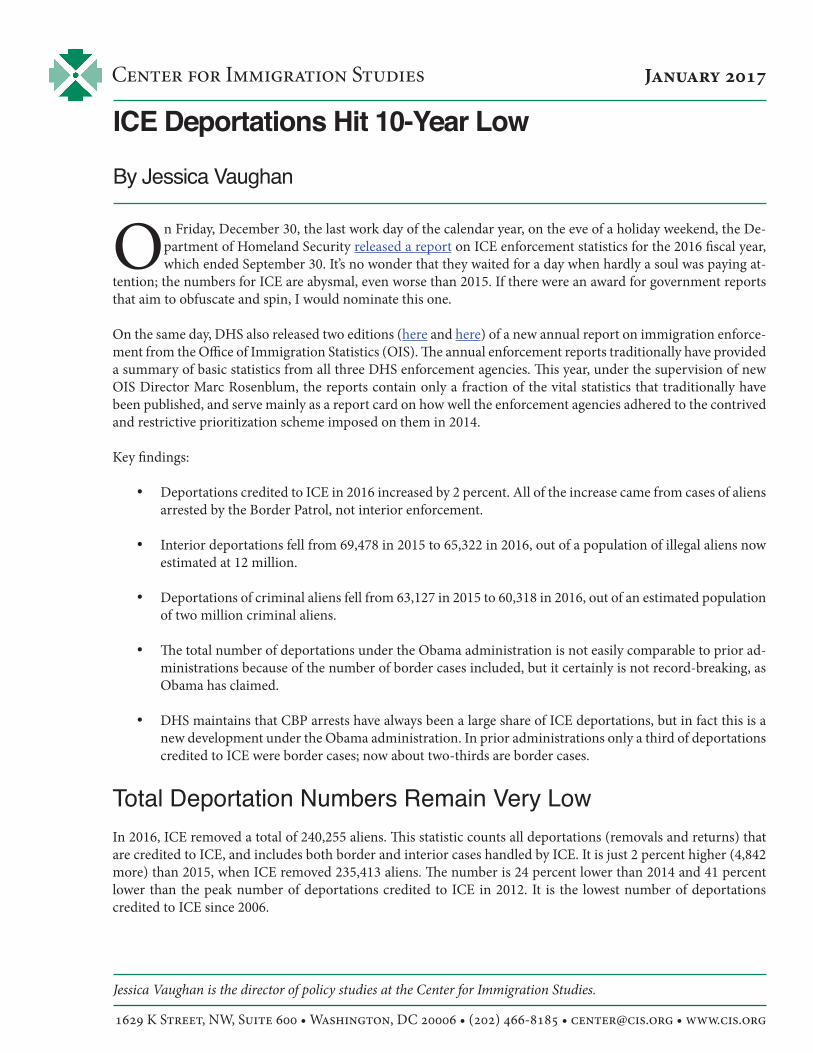
On Friday, December 30, the last work day of the calendar year, on the eve of a holiday weekend, the De-partment of Homeland Security released a report on ICE enforcement statistics for the 2016 fiscal year, which ended September 30. It’s no wonder that they waited for a day when hardly a soul was paying at-
tention; the numbers for ICE are abysmal, even worse than 2015. If there were an award for government reports that aim to obfuscate and spin, I would nominate this one.
On the same day, DHS also released two editions (here and here) of a new annual report on immigration enforce-ment from the Office of Immigration Statistics (OIS). The annual enforcement reports traditionally have provided a summary of basic statistics from all three DHS enforcement agencies. This year, under the supervision of new OIS Director Marc Rosenblum, the reports contain only a fraction of the vital statistics that traditionally have been published, and serve mainly as a report card on how well the enforcement agencies adhered to the contrived and restrictive prioritization scheme imposed on them in 2014.
Key findings:
• Deportations credited to ICE in 2016 increased by 2 percent. All of the increase came from cases of aliens arrested by the Border Patrol, not interior enforcement.
• Interior deportations fell from 69,478 in 2015 to 65,322 in 2016, out of a population of illegal aliens now estimated at 12 million.
• Deportations of criminal aliens fell from 63,127 in 2015 to 60,318 in 2016, out of an estimated population of two million criminal aliens.
• The total number of deportations under the Obama administration is not easily comparable to prior ad-ministrations because of the number of border cases included, but it certainly is not record-breaking, as Obama has claimed.
• DHS maintains that CBP arrests have always been a large share of ICE deportations, but in fact this is a new development under the Obama administration. In prior administrations only a third of deportations credited to ICE were border cases; now about two-thirds are border cases.
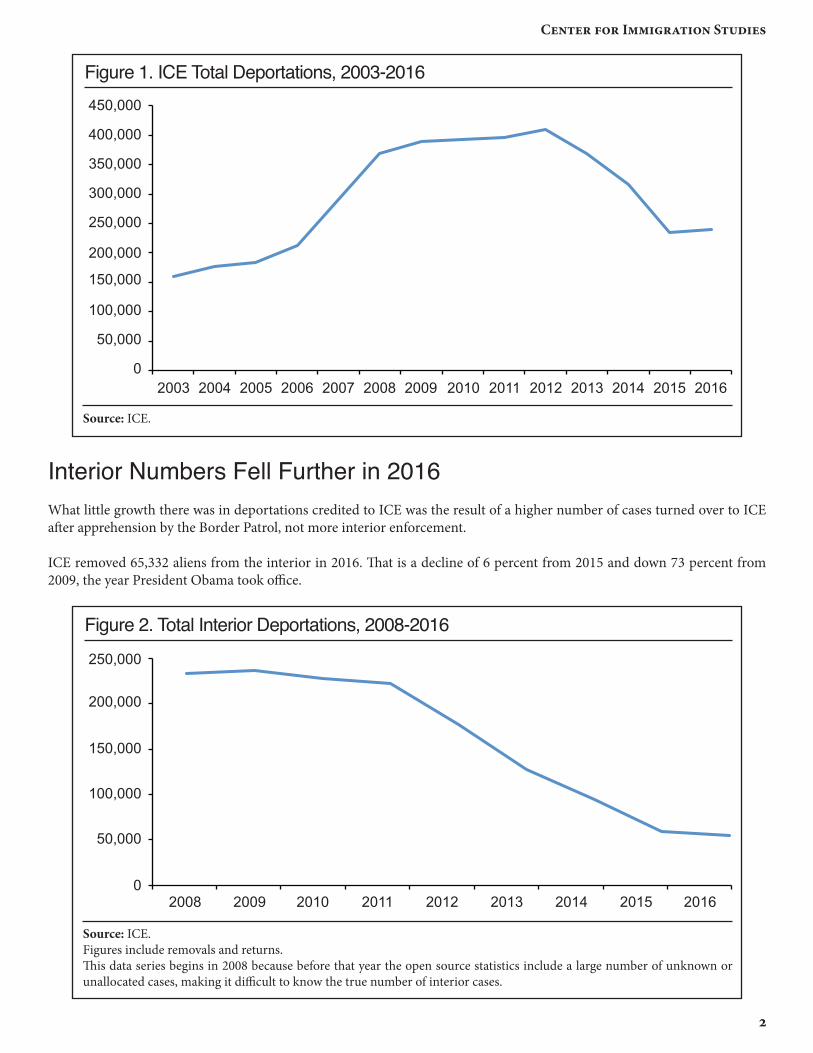
Total Deportation Numbers Remain Very LowIn 2016, ICE removed a total of 240,255 aliens. This statistic counts all deportations (removals and returns) that are credited to ICE, and includes both border and interior cases handled by ICE. It is just 2 percent higher (4,842 more) than 2015, when ICE removed 235,413 aliens. The number is 24 percent lower than 2014 and 41 percent lower than the peak number of deportations credited to ICE in 2012. It is the lowest number of deportations credited to ICE since 2006.
ICE Deportations Hit 10-Year Low
By Jessica Vaughan
Jessica Vaughan is the director of policy studies at the Center for Immigration Studies.
1629 K Street, NW, Suite 600 • Washington, DC 20006 • (202) 466-8185 • [email protected] • www.cis.org
2
Center for Immigration Studies
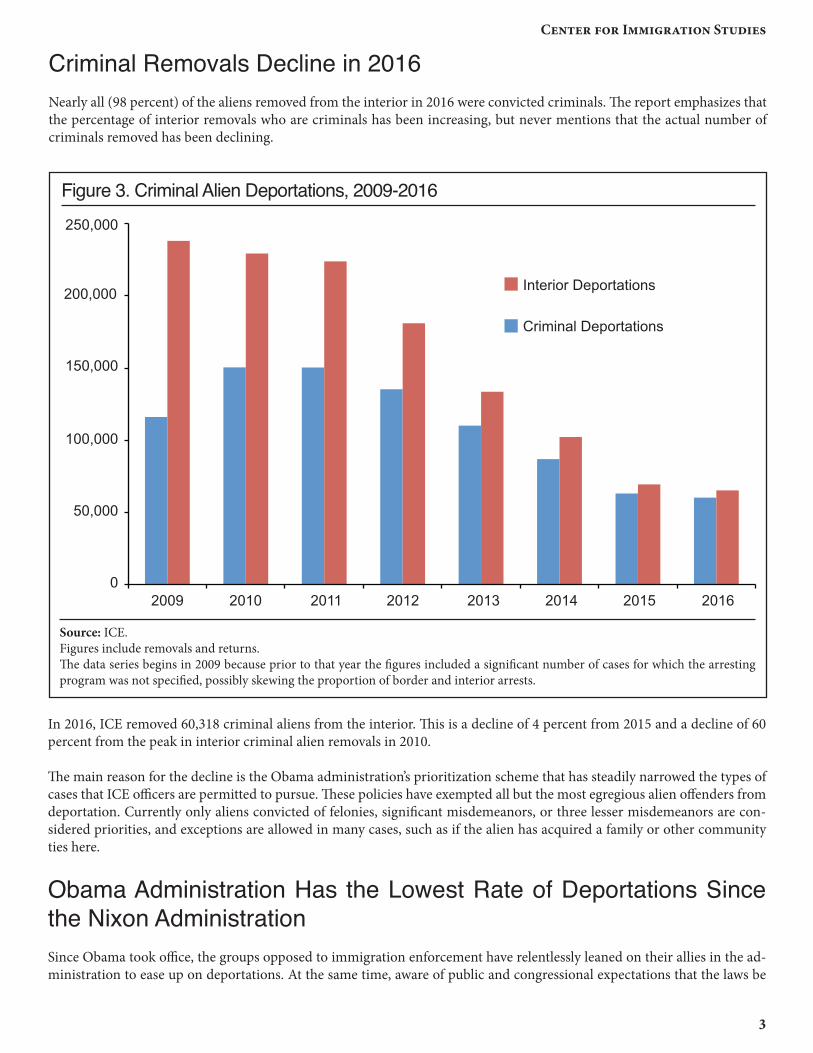
Interior Numbers Fell Further in 2016What little growth there was in deportations credited to ICE was the result of a higher number of cases turned over to ICE after apprehension by the Border Patrol, not more interior enforcement.
ICE removed 65,332 aliens from the interior in 2016. That is a decline of 6 percent from 2015 and down 73 percent from 2009, the year President Obama took office.
Figure 1. ICE Total Deportations, 2003-2016
Source: ICE.
2003 2004 2005 2006 2007 2008 2009 2010 2011 2012 2013 2014 2015 2016
450,000
400,000
350,000
300,000
250,000
200,000
150,000
100,000
50,000
0
Figure 2. Total Interior Deportations, 2008-2016
Source: ICE.Figures include removals and returns.This data series begins in 2008 because before that year the open source statistics include a large number of unknown or unallocated cases, making it difficult to know the true number of interior cases.
2008 2009 2010 2011 2012 2013 2014 2015 2016
250,000
200,000
150,000
100,000
50,000
0
3
Center for Immigration Studies
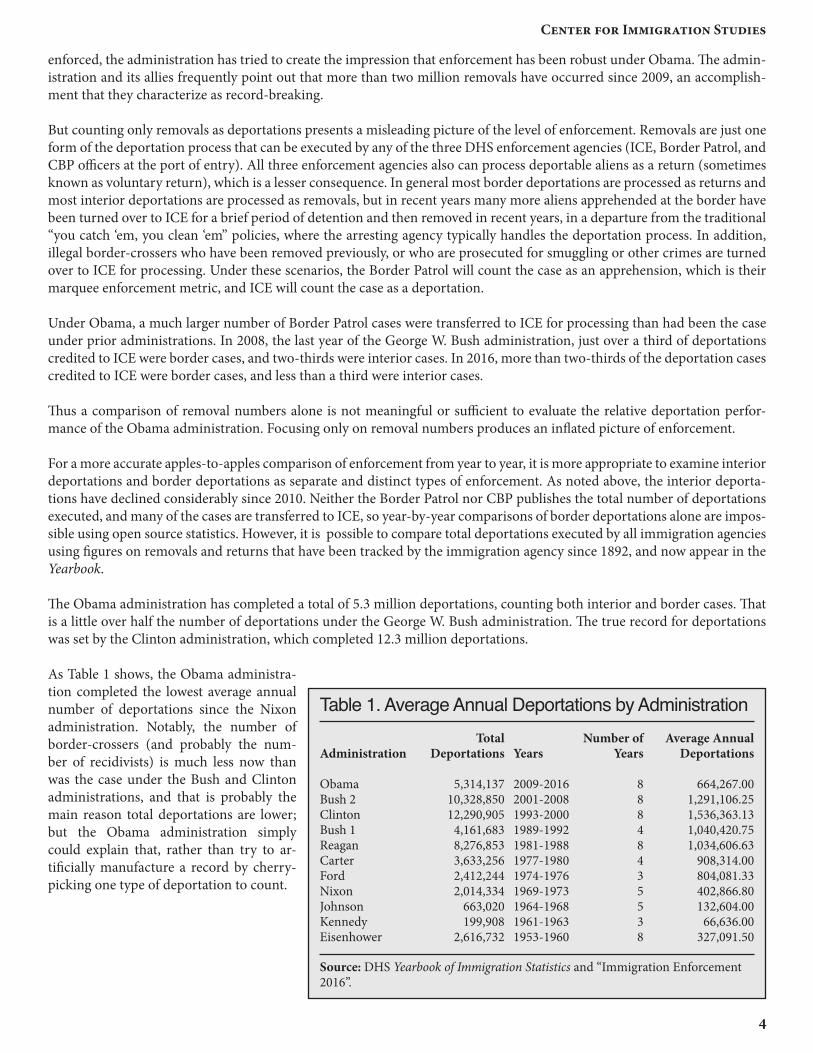
Criminal Removals Decline in 2016Nearly all (98 percent) of the aliens removed from the interior in 2016 were convicted criminals. The report emphasizes that the percentage of interior removals who are criminals has been increasing, but never mentions that the actual number of criminals removed has been declining.
Figure 3. Criminal Alien Deportations, 2009-2016
Source: ICE.Figures include removals and returns.The data series begins in 2009 because prior to that year the figures included a significant number of cases for which the arresting program was not specified, possibly skewing the proportion of border and interior arrests.
2009 2010 2011 2012 2013
Interior Deportations
Criminal Deportations
2014 2015 2016
250,000
200,000
150,000
100,000
50,000
0
In 2016, ICE removed 60,318 criminal aliens from the interior. This is a decline of 4 percent from 2015 and a decline of 60 percent from the peak in interior criminal alien removals in 2010.
The main reason for the decline is the Obama administration’s prioritization scheme that has steadily narrowed the types of cases that ICE officers are permitted to pursue. These policies have exempted all but the most egregious alien offenders from deportation. Currently only aliens convicted of felonies, significant misdemeanors, or three lesser misdemeanors are con-sidered priorities, and exceptions are allowed in many cases, such as if the alien has acquired a family or other community ties here.
Obama Administration Has the Lowest Rate of Deportations Since the Nixon AdministrationSince Obama took office, the groups opposed to immigration enforcement have relentlessly leaned on their allies in the ad-ministration to ease up on deportations. At the same time, aware of public and congressional expectations that the laws be
4
Center for Immigration Studies
enforced, the administration has tried to create the impression that enforcement has been robust under Obama. The admin-istration and its allies frequently point out that more than two million removals have occurred since 2009, an accomplish-ment that they characterize as record-breaking.
But counting only removals as deportations presents a misleading picture of the level of enforcement. Removals are just one form of the deportation process that can be executed by any of the three DHS enforcement agencies (ICE, Border Patrol, and CBP officers at the port of entry). All three enforcement agencies also can process deportable aliens as a return (sometimes known as voluntary return), which is a lesser consequence. In general most border deportations are processed as returns and most interior deportations are processed as removals, but in recent years many more aliens apprehended at the border have been turned over to ICE for a brief period of detention and then removed in recent years, in a departure from the traditional “you catch ‘em, you clean ‘em” policies, where the arresting agency typically handles the deportation process. In addition, illegal border-crossers who have been removed previously, or who are prosecuted for smuggling or other crimes are turned over to ICE for processing. Under these scenarios, the Border Patrol will count the case as an apprehension, which is their marquee enforcement metric, and ICE will count the case as a deportation.
Under Obama, a much larger number of Border Patrol cases were transferred to ICE for processing than had been the case under prior administrations. In 2008, the last year of the George W. Bush administration, just over a third of deportations credited to ICE were border cases, and two-thirds were interior cases. In 2016, more than two-thirds of the deportation cases credited to ICE were border cases, and less than a third were interior cases.
Thus a comparison of removal numbers alone is not meaningful or sufficient to evaluate the relative deportation perfor-mance of the Obama administration. Focusing only on removal numbers produces an inflated picture of enforcement.
For a more accurate apples-to-apples comparison of enforcement from year to year, it is more appropriate to examine interior deportations and border deportations as separate and distinct types of enforcement. As noted above, the interior deporta-tions have declined considerably since 2010. Neither the Border Patrol nor CBP publishes the total number of deportations executed, and many of the cases are transferred to ICE, so year-by-year comparisons of border deportations alone are impos-sible using open source statistics. However, it is possible to compare total deportations executed by all immigration agencies using figures on removals and returns that have been tracked by the immigration agency since 1892, and now appear in the Yearbook.
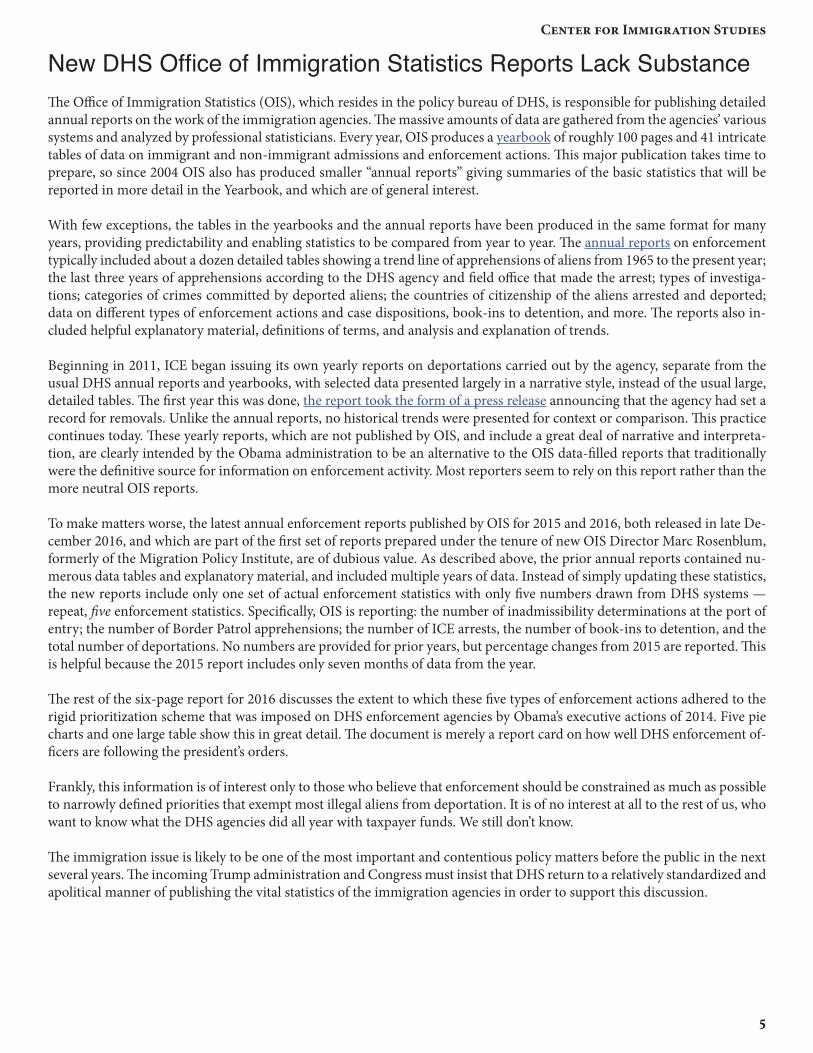
The Obama administration has completed a total of 5.3 million deportations, counting both interior and border cases. That is a little over half the number of deportations under the George W. Bush administration. The true record for deportations was set by the Clinton administration, which completed 12.3 million deportations.
As Table 1 shows, the Obama administra-tion completed the lowest average annual number of deportations since the Nixon administration. Notably, the number of border-crossers (and probably the num-ber of recidivists) is much less now than was the case under the Bush and Clinton administrations, and that is probably the main reason total deportations are lower; but the Obama administration simply could explain that, rather than try to ar-tificially manufacture a record by cherry-picking one type of deportation to count.
Table 1. Average Annual Deportations by Administration
Administration
ObamaBush 2ClintonBush 1ReaganCarterFordNixonJohnsonKennedyEisenhower
Total Deportations
5,314,13710,328,85012,290,905
4,161,683 8,276,853 3,633,2562,412,2442,014,334
663,020199,908
2,616,732
Number of Years
88848435538
Average Annual Deportations
664,267.00 1,291,106.25 1,536,363.13 1,040,420.75 1,034,606.63
908,314.00 804,081.33 402,866.80 132,604.00
66,636.00 327,091.50
Years
2009-20162001-20081993-20001989-19921981-19881977-19801974-19761969-19731964-19681961-19631953-1960
Source: DHS Yearbook of Immigration Statistics and “Immigration Enforcement 2016”.
5
Center for Immigration Studies
New DHS Office of Immigration Statistics Reports Lack SubstanceThe Office of Immigration Statistics (OIS), which resides in the policy bureau of DHS, is responsible for publishing detailed annual reports on the work of the immigration agencies. The massive amounts of data are gathered from the agencies’ various systems and analyzed by professional statisticians. Every year, OIS produces a yearbook of roughly 100 pages and 41 intricate tables of data on immigrant and non-immigrant admissions and enforcement actions. This major publication takes time to prepare, so since 2004 OIS also has produced smaller “annual reports” giving summaries of the basic statistics that will be reported in more detail in the Yearbook, and which are of general interest.
With few exceptions, the tables in the yearbooks and the annual reports have been produced in the same format for many years, providing predictability and enabling statistics to be compared from year to year. The annual reports on enforcement typically included about a dozen detailed tables showing a trend line of apprehensions of aliens from 1965 to the present year; the last three years of apprehensions according to the DHS agency and field office that made the arrest; types of investiga-tions; categories of crimes committed by deported aliens; the countries of citizenship of the aliens arrested and deported; data on different types of enforcement actions and case dispositions, book-ins to detention, and more. The reports also in-cluded helpful explanatory material, definitions of terms, and analysis and explanation of trends.
Beginning in 2011, ICE began issuing its own yearly reports on deportations carried out by the agency, separate from the usual DHS annual reports and yearbooks, with selected data presented largely in a narrative style, instead of the usual large, detailed tables. The first year this was done, the report took the form of a press release announcing that the agency had set a record for removals. Unlike the annual reports, no historical trends were presented for context or comparison. This practice continues today. These yearly reports, which are not published by OIS, and include a great deal of narrative and interpreta-tion, are clearly intended by the Obama administration to be an alternative to the OIS data-filled reports that traditionally were the definitive source for information on enforcement activity. Most reporters seem to rely on this report rather than the more neutral OIS reports.
To make matters worse, the latest annual enforcement reports published by OIS for 2015 and 2016, both released in late De-cember 2016, and which are part of the first set of reports prepared under the tenure of new OIS Director Marc Rosenblum, formerly of the Migration Policy Institute, are of dubious value. As described above, the prior annual reports contained nu-merous data tables and explanatory material, and included multiple years of data. Instead of simply updating these statistics, the new reports include only one set of actual enforcement statistics with only five numbers drawn from DHS systems — repeat, five enforcement statistics. Specifically, OIS is reporting: the number of inadmissibility determinations at the port of entry; the number of Border Patrol apprehensions; the number of ICE arrests, the number of book-ins to detention, and the total number of deportations. No numbers are provided for prior years, but percentage changes from 2015 are reported. This is helpful because the 2015 report includes only seven months of data from the year.
The rest of the six-page report for 2016 discusses the extent to which these five types of enforcement actions adhered to the rigid prioritization scheme that was imposed on DHS enforcement agencies by Obama’s executive actions of 2014. Five pie charts and one large table show this in great detail. The document is merely a report card on how well DHS enforcement of-ficers are following the president’s orders.
Frankly, this information is of interest only to those who believe that enforcement should be constrained as much as possible to narrowly defined priorities that exempt most illegal aliens from deportation. It is of no interest at all to the rest of us, who want to know what the DHS agencies did all year with taxpayer funds. We still don’t know.
The immigration issue is likely to be one of the most important and contentious policy matters before the public in the next several years. The incoming Trump administration and Congress must insist that DHS return to a relatively standardized and apolitical manner of publishing the vital statistics of the immigration agencies in order to support this discussion.