Embed Size (px)
Citation preview
IBRACON 2008500 Congresso Brasileiro do ConcretoSeptember 5, 2008
RECENT ADVANCES IN CONCRETE AND APPLICATION OF NANOTECHNOLOGY
Surendra P. ShahWalter P. Murphy Professor and Director
Center for Advanced Cement-Based MaterialsNorthwestern University
Evanston, IL 60208, USA

Congratulations to the Brazilian Concrete Congress on the 50th Session
Contributing Researchers• Liberato Ferrara, Politecnico di Milano• Raissa Ferron, Northwestern University• Amedeo Gregori, University of L’Aquila• Seung Hee Kwon, Northwestern University• Jean-Juste Mbele, Schlaumberger• Paramita Mondal, Northwestern University• Yon-Dong Park, Daegu Haany University• Zhihui Sun, University of Louisville • Nathan Tregger, Northwestern University• Thomas Voigt, USG
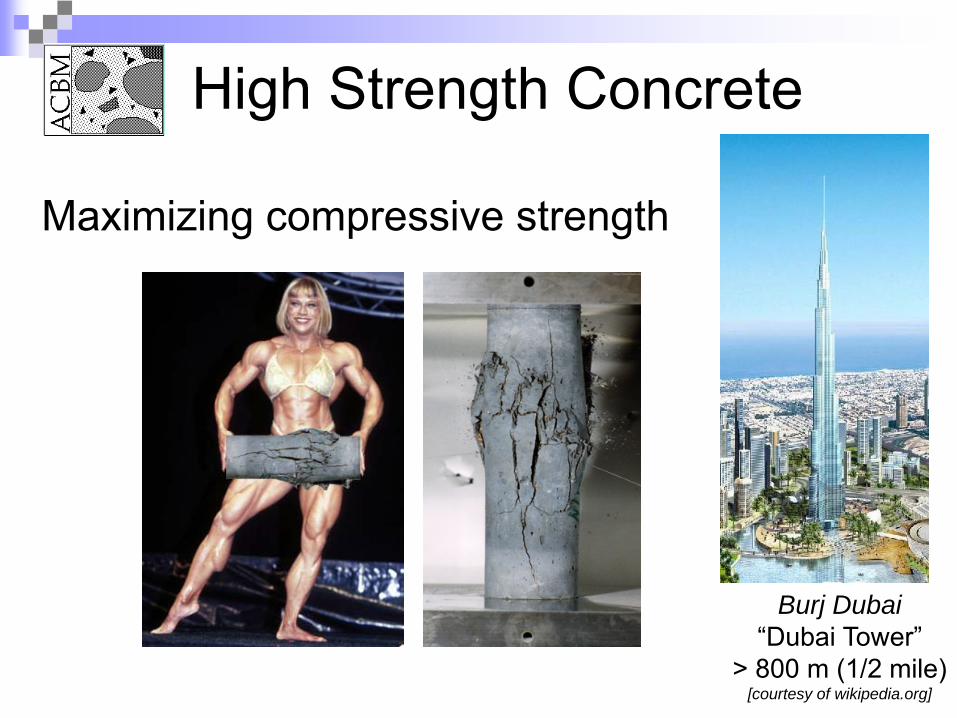
High Strength Concrete
Maximizing compressive strength
Burj Dubai“Dubai Tower”
> 800 m (1/2 mile)[courtesy of wikipedia.org]

High Performance Concrete
Maximizing durability
ASR
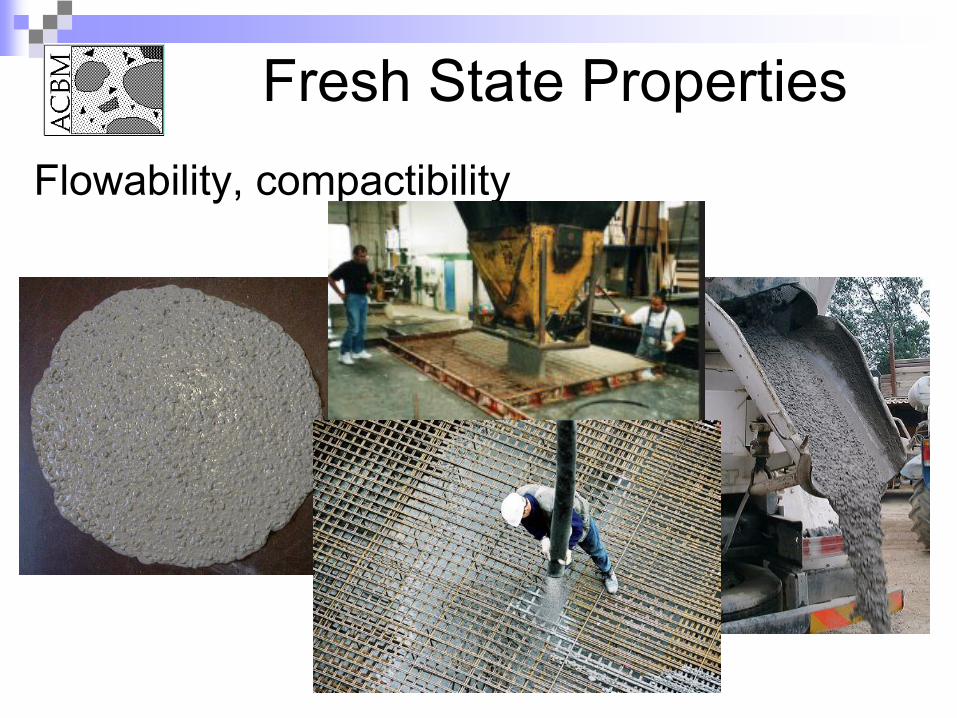
Fresh State PropertiesFlowability, compactibility
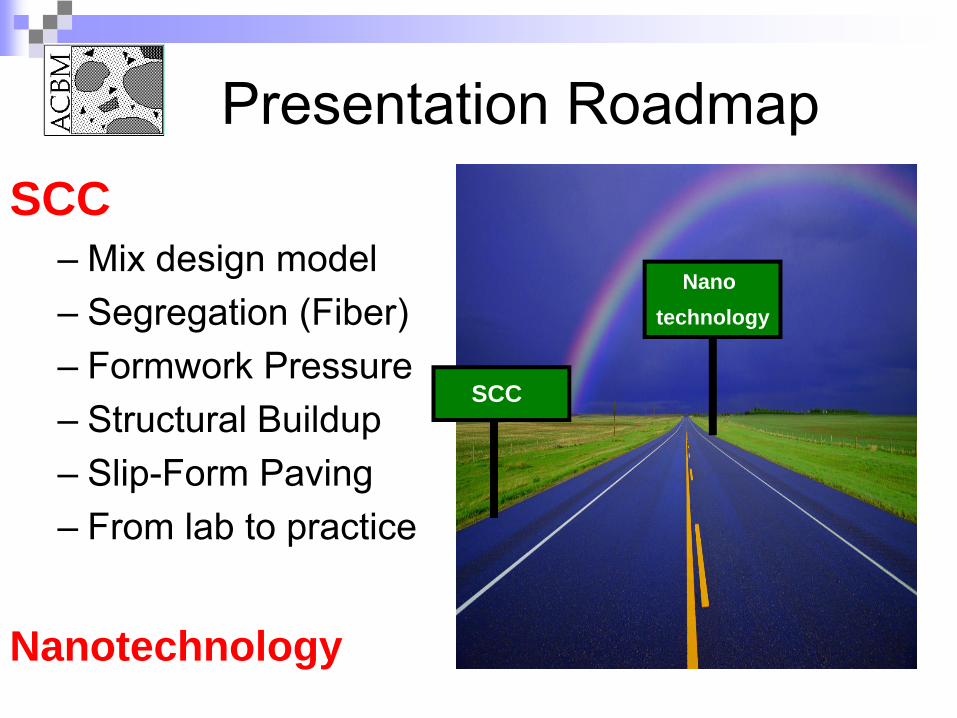
Presentation RoadmapSCC
– Mix design model– Segregation (Fiber)– Formwork Pressure– Structural Buildup– Slip-Form Paving– From lab to practice
Nanotechnology
SCC
Nanotechnology
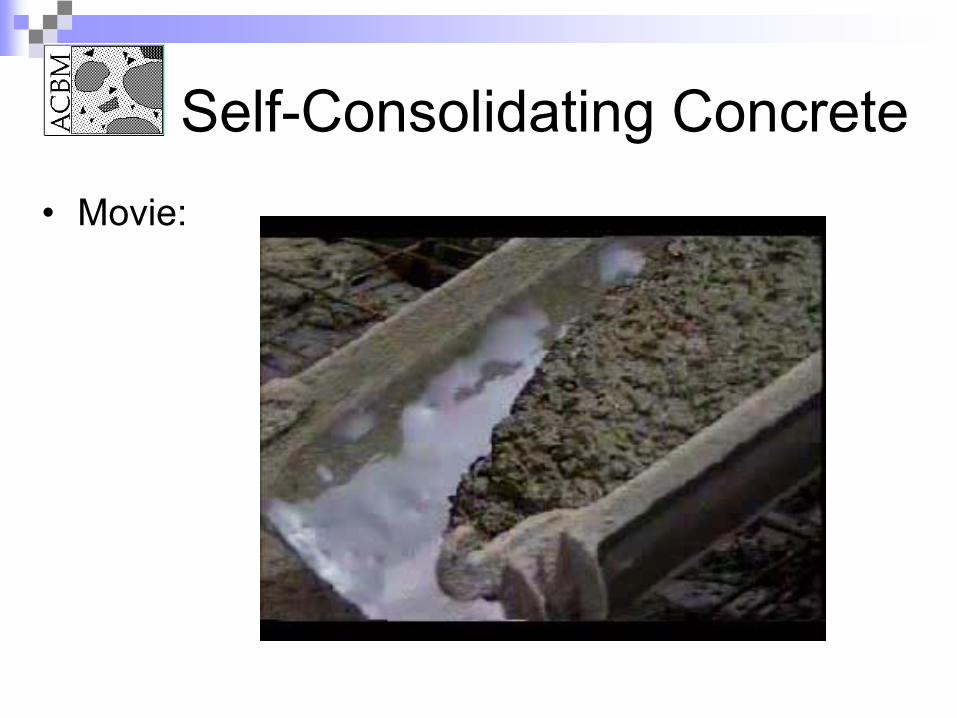
Self-Consolidating Concrete• Movie:
stre
ss (τ
)
τy
γshear rate ( )
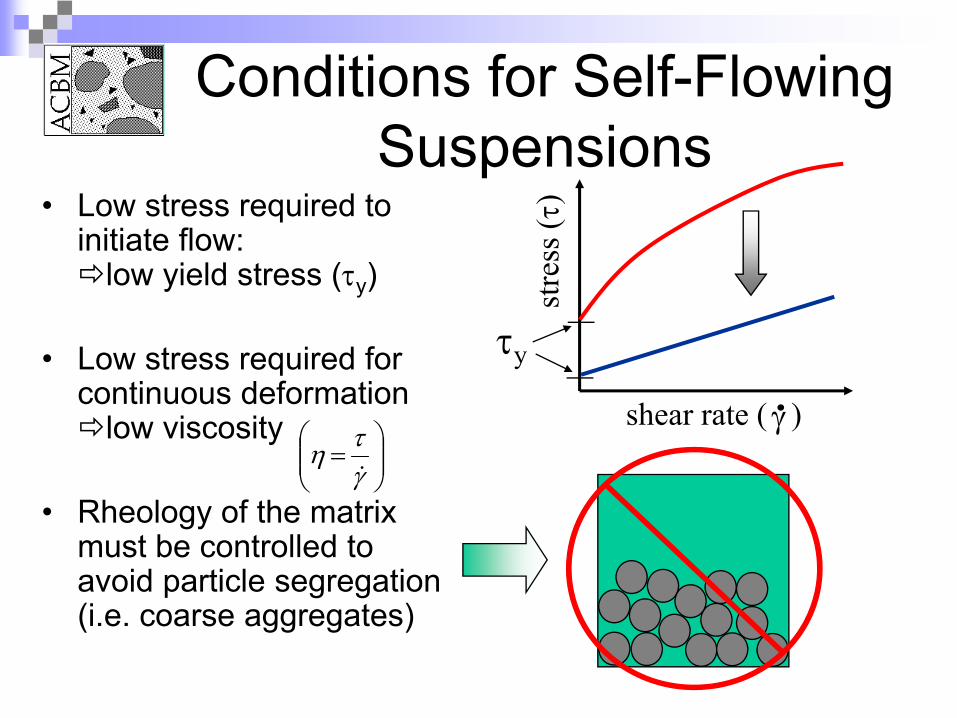
Conditions for Self-Flowing Suspensions
• Low stress required to initiate flow:
low yield stress (τy)
• Low stress required for continuous deformation
low viscosity
• Rheology of the matrix must be controlled to avoid particle segregation (i.e. coarse aggregates)
⎟⎟⎠
⎞⎜⎜⎝
⎛=γτη&
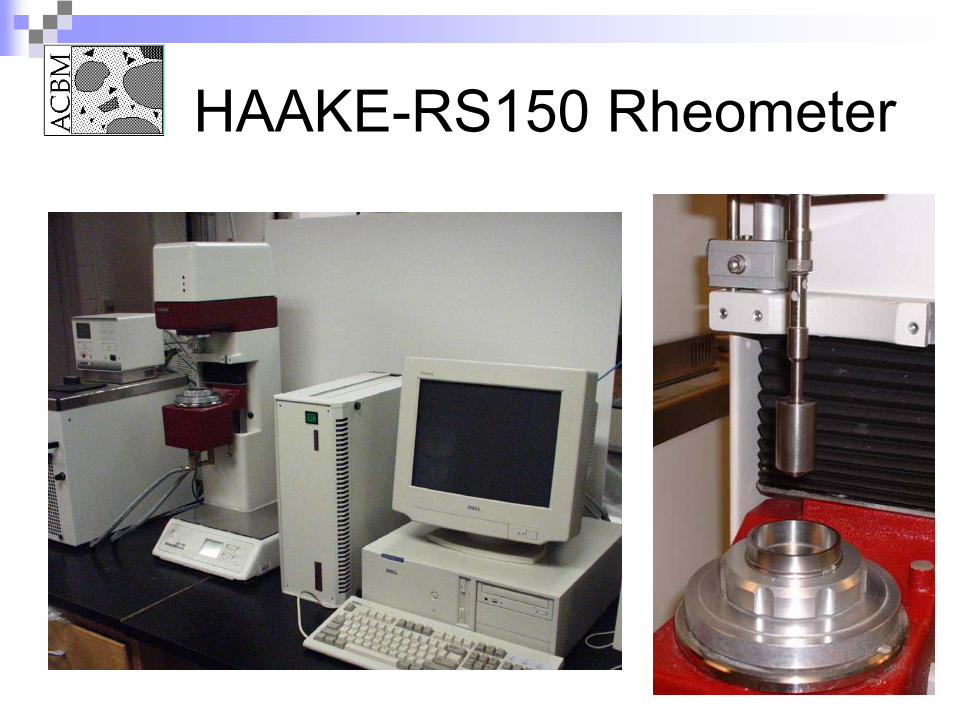
HAAKE-RS150 Rheometer
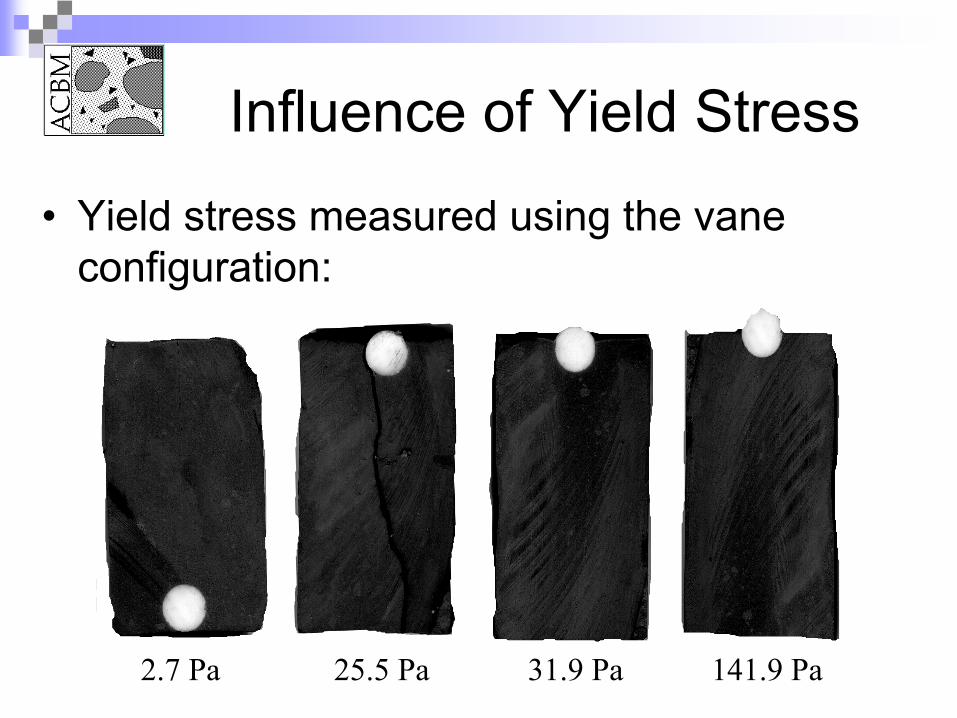
2.7 Pa 25.5 Pa 141.9 Pa31.9 Pa
Influence of Yield Stress
• Yield stress measured using the vane configuration:
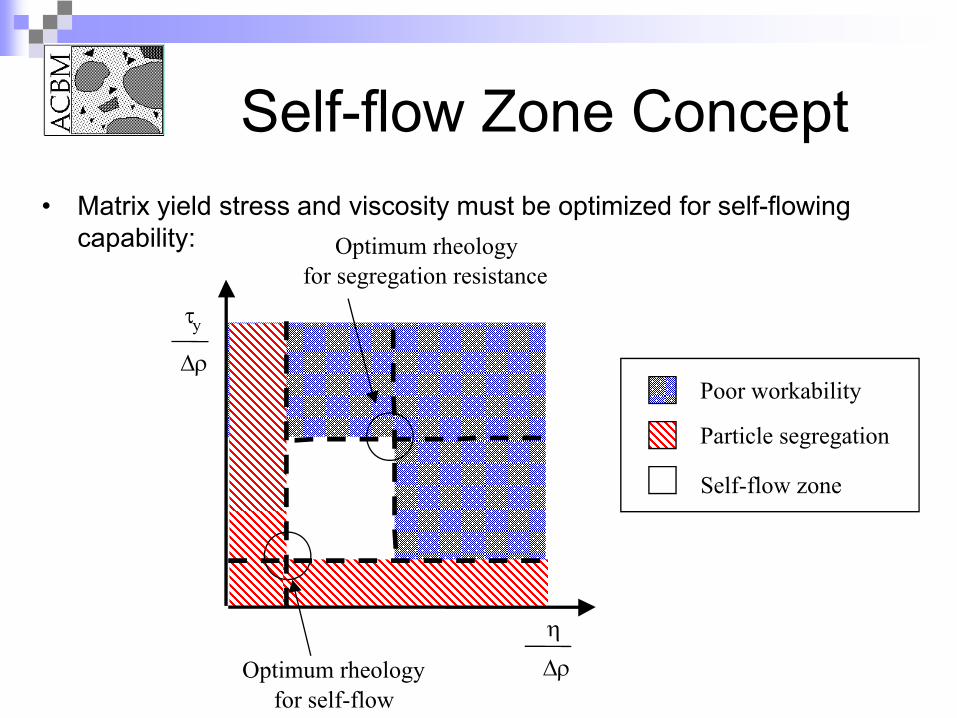
Self-flow Zone Concept• Matrix yield stress and viscosity must be optimized for self-flowing
capability:
Self-flow zone
Poor workability
Particle segregation
Optimum rheologyfor self-flow
η
Δρ
τy
Δρ
Optimum rheologyfor segregation resistance
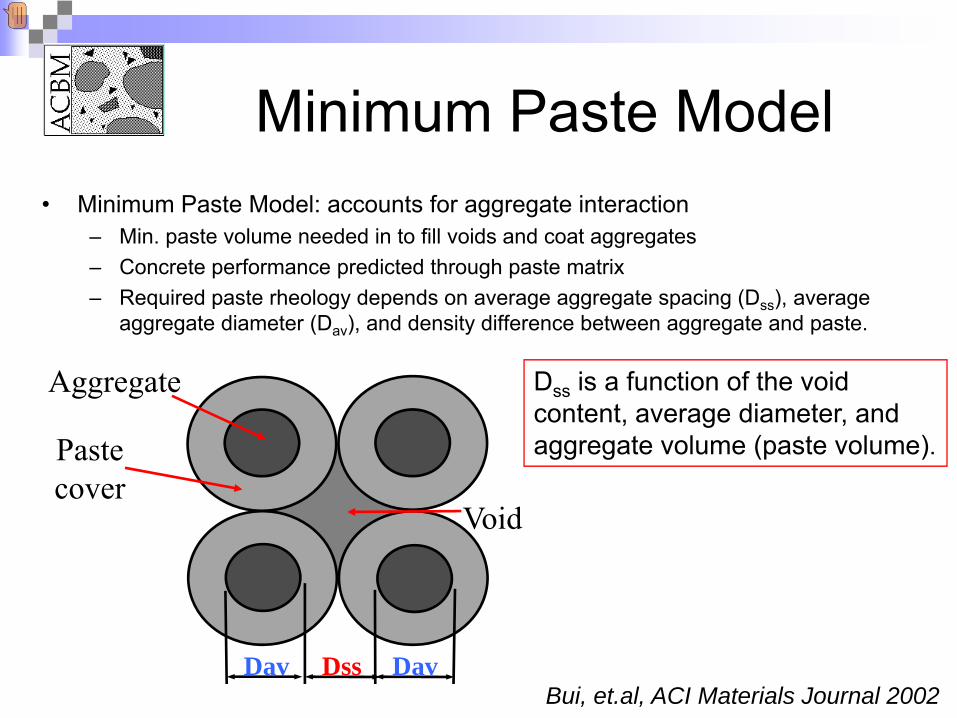
Minimum Paste Model• Minimum Paste Model: accounts for aggregate interaction
– Min. paste volume needed in to fill voids and coat aggregates– Concrete performance predicted through paste matrix– Required paste rheology depends on average aggregate spacing (Dss), average
aggregate diameter (Dav), and density difference between aggregate and paste.
Bui, et.al, ACI Materials Journal 2002
Dss is a function of the void content, average diameter, and aggregate volume (paste volume).
Paste
Dav
Void
Aggregate
Paste cover
Dss Dav
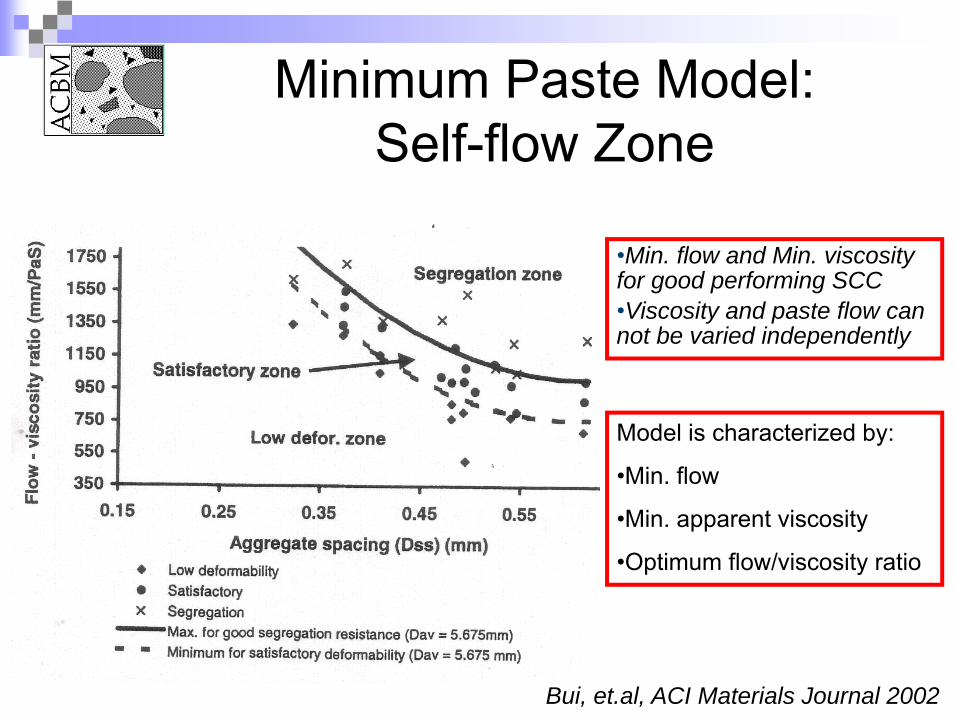
Minimum Paste Model: Self-flow Zone
Model is characterized by:
•Min. flow
•Min. apparent viscosity
•Optimum flow/viscosity ratio
Bui, et.al, ACI Materials Journal 2002
•Min. flow and Min. viscosity for good performing SCC•Viscosity and paste flow can not be varied independently
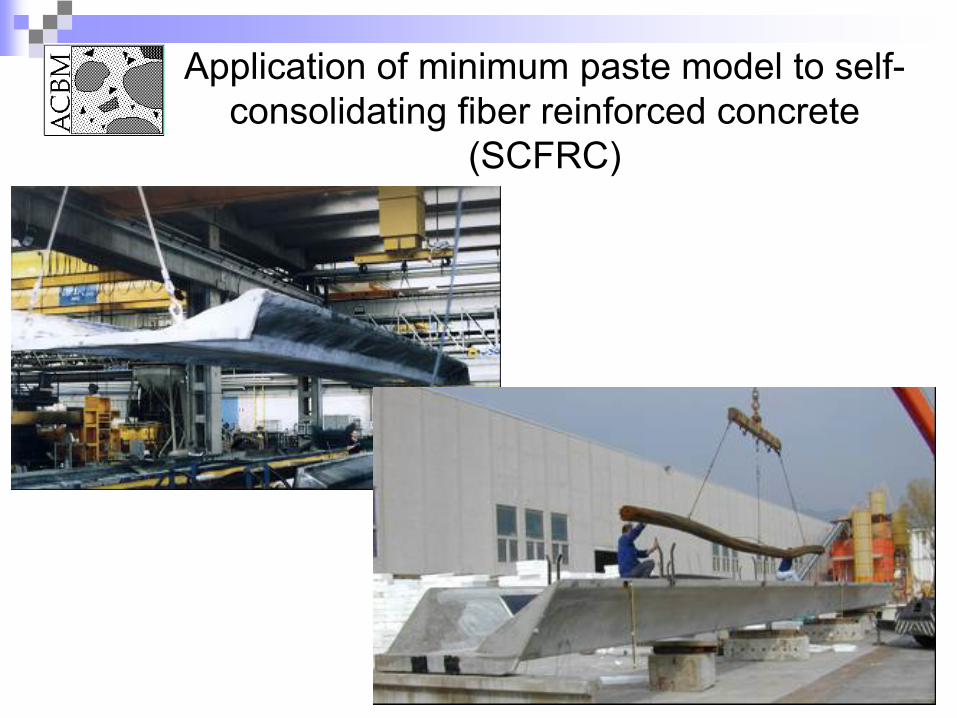
Application of minimum paste model to self-consolidating fiber reinforced concrete
(SCFRC)
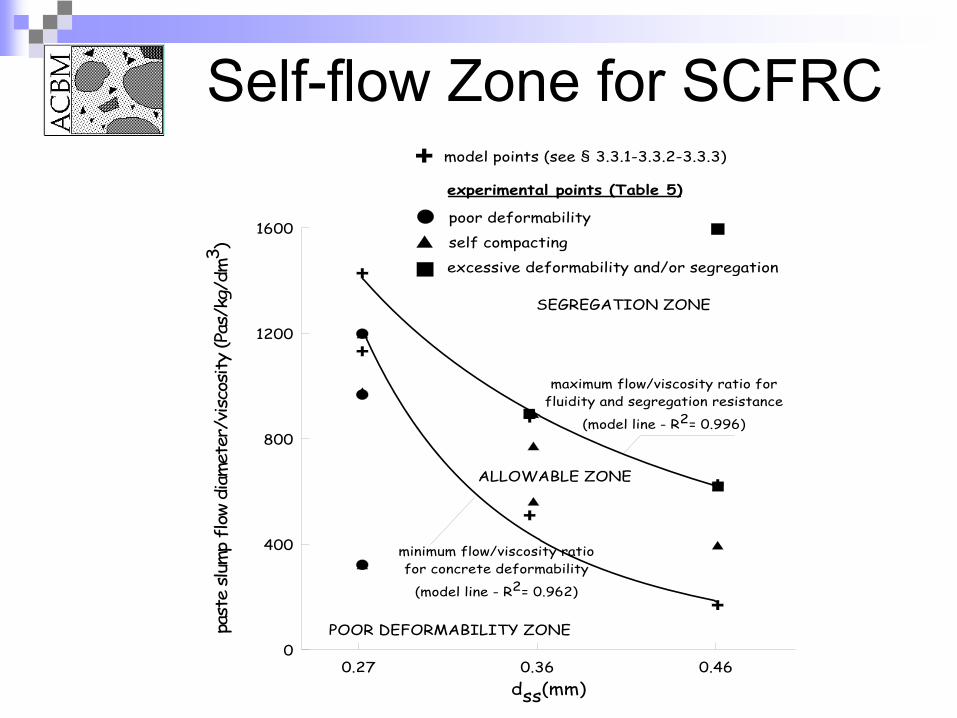
0.27 0.36 0.46dss(mm)
0
400
800
1200
1600pa
ste
slum
p fl
ow d
iam
eter
/vis
cosi
ty (P
as/k
g/dm
3 )
SEGREGATION ZONE
POOR DEFORMABILITY ZONE
ALLOWABLE ZONE
maximum flow/viscosity ratio forfluidity and segregation resistance
(model line - R2= 0.996)
minimum flow/viscosity ratiofor concrete deformability
(model line - R2= 0.962)
model points (see § 3.3.1-3.3.2-3.3.3)
poor deformability
self compacting
experimental points (Table 5)
excessive deformability and/or segregation
Self-flow Zone for SCFRC
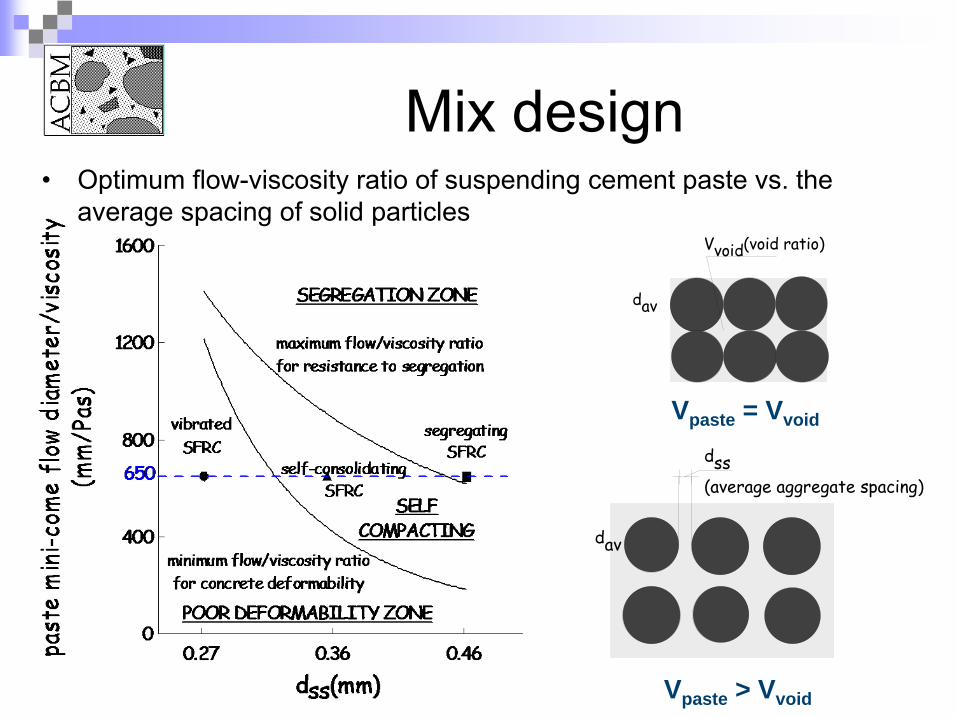
Vvoid(void ratio)
dav
dss(average aggregate spacing)
dav
Vpaste = Vvoid
Vpaste > Vvoid
Mix design• Optimum flow-viscosity ratio of suspending cement paste vs. the
average spacing of solid particles
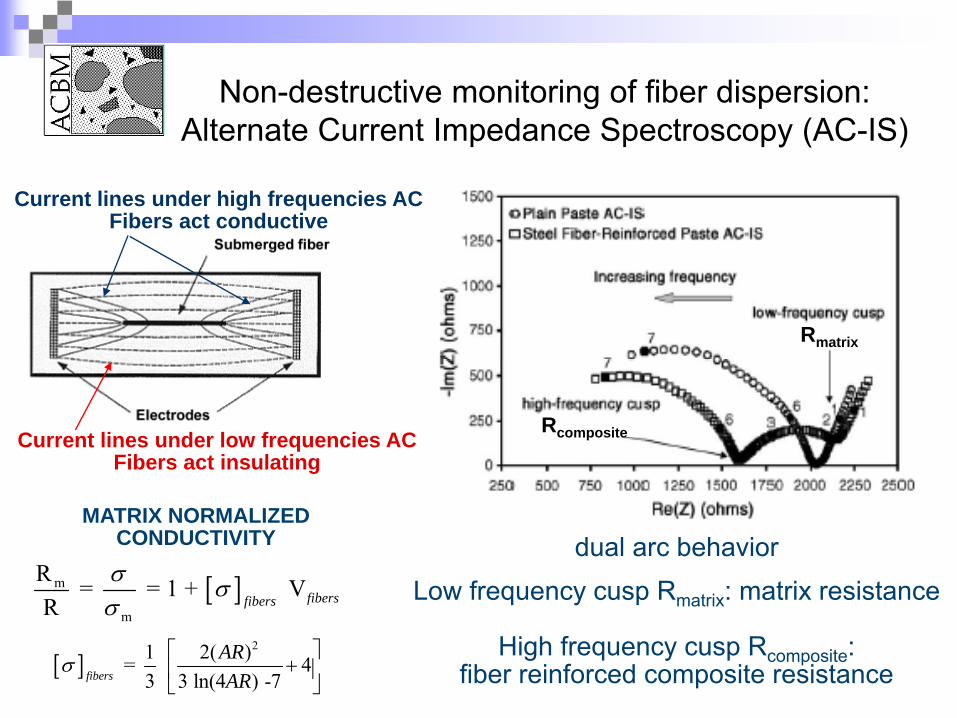
dual arc behaviorLow frequency cusp Rmatrix: matrix resistance
High frequency cusp Rcomposite:fiber reinforced composite resistance
[ ]m
m
R = = 1 + VR fibersfibers
σ σσ
[ ]21 2( )= 4
3 3 ln(4 ) -7fibers
ARAR
σ⎡ ⎤
+⎢ ⎥⎣ ⎦
MATRIX NORMALIZED CONDUCTIVITY
Current lines under low frequencies ACFibers act insulating
Current lines under high frequencies ACFibers act conductive
Rmatrix
Rcomposite
Non-destructive monitoring of fiber dispersion: Alternate Current Impedance Spectroscopy (AC-IS)
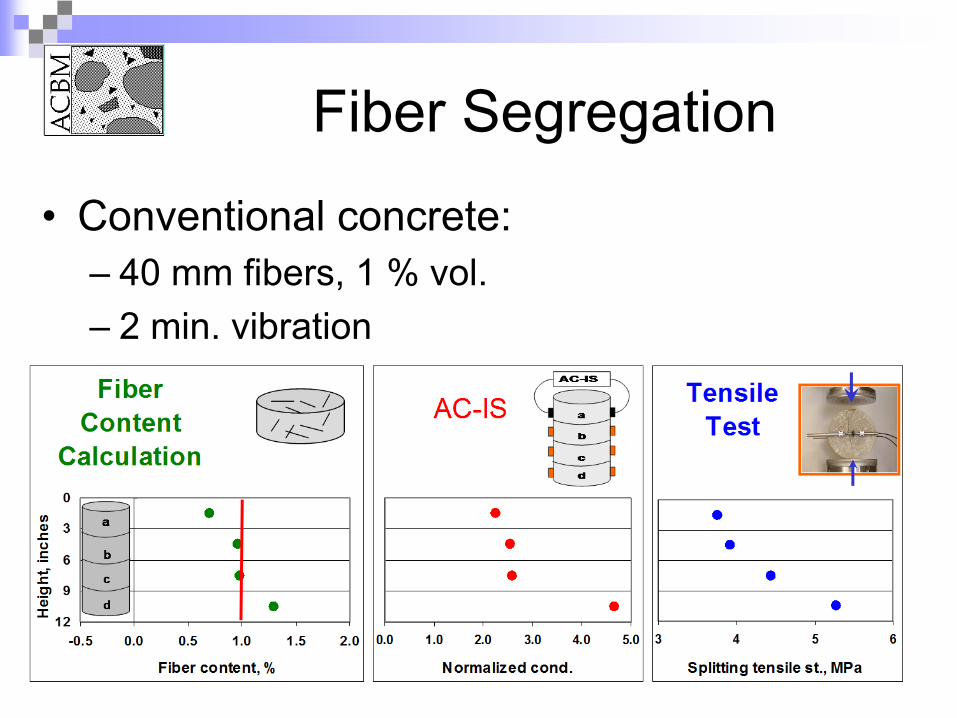
Fiber Segregation
• Conventional concrete:– 40 mm fibers, 1 % vol. – 2 min. vibration
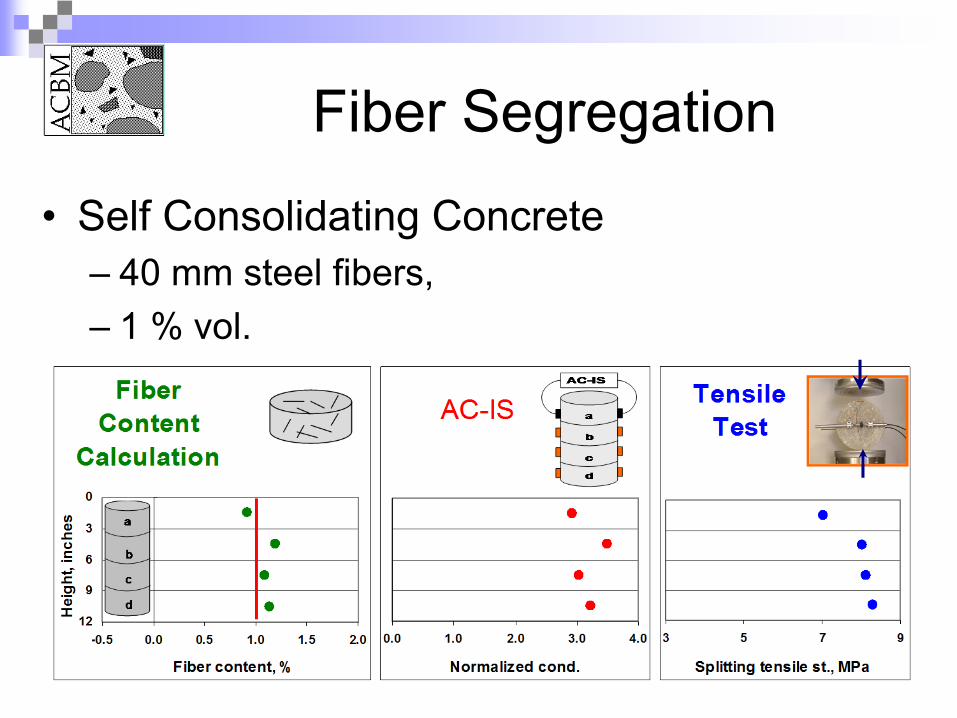
Fiber Segregation
• Self Consolidating Concrete– 40 mm steel fibers, – 1 % vol.
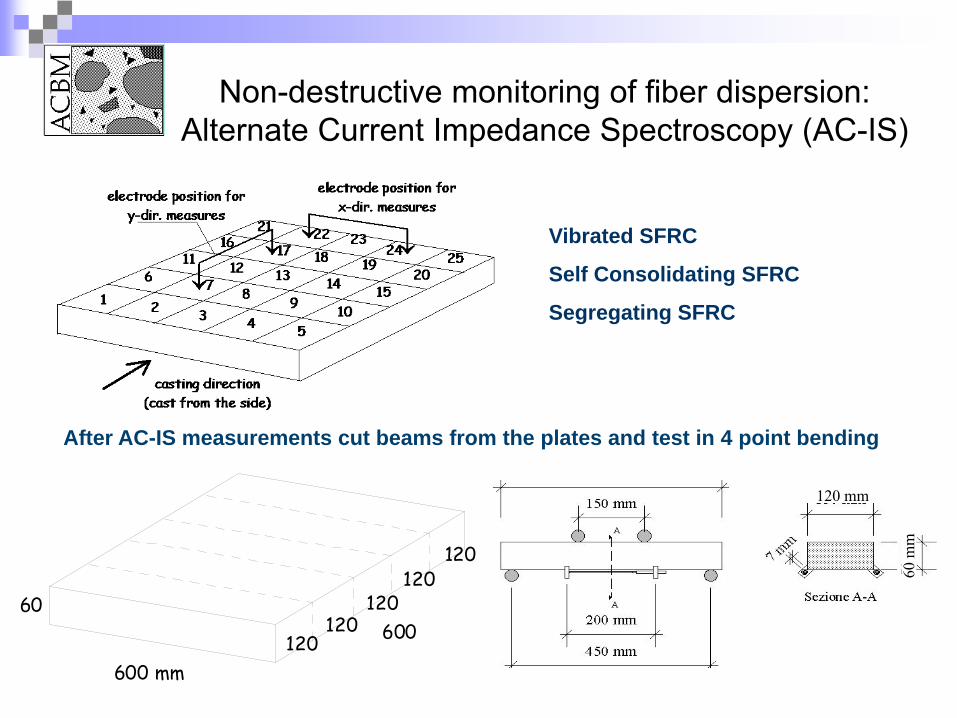
120 mm
60 m
m
Non-destructive monitoring of fiber dispersion: Alternate Current Impedance Spectroscopy (AC-IS)
600 mm
600120120
12060 120
120
After AC-IS measurements cut beams from the plates and test in 4 point bending
Vibrated SFRC
Self Consolidating SFRC
Segregating SFRC
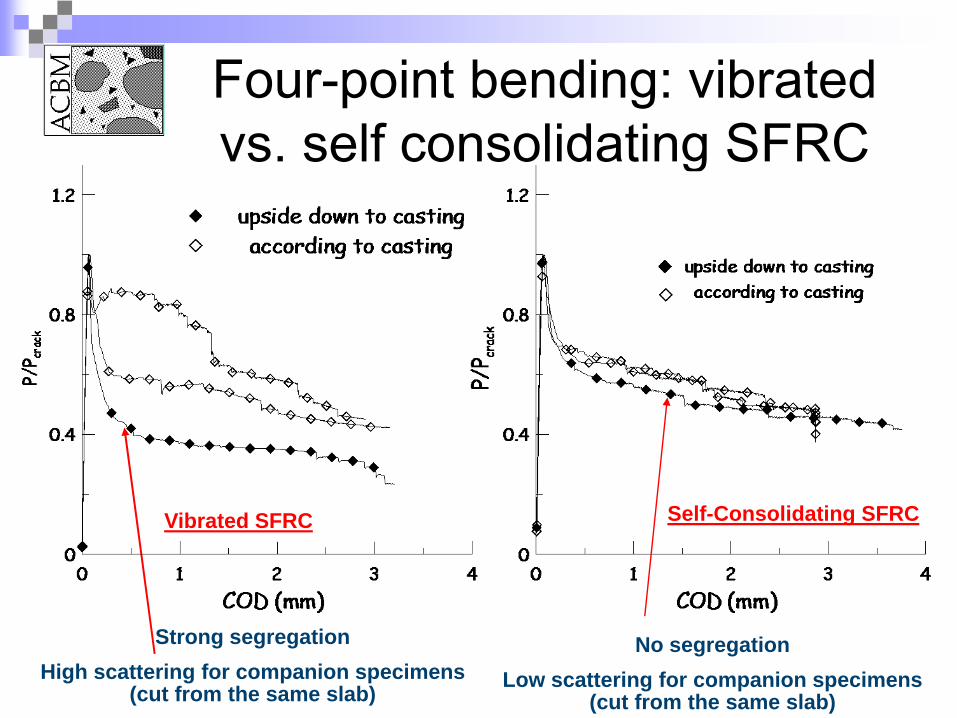
Strong segregationHigh scattering for companion specimens
(cut from the same slab)
No segregationLow scattering for companion specimens
(cut from the same slab)
Four-point bending: vibrated vs. self consolidating SFRC
Vibrated SFRC Self-Consolidating SFRC
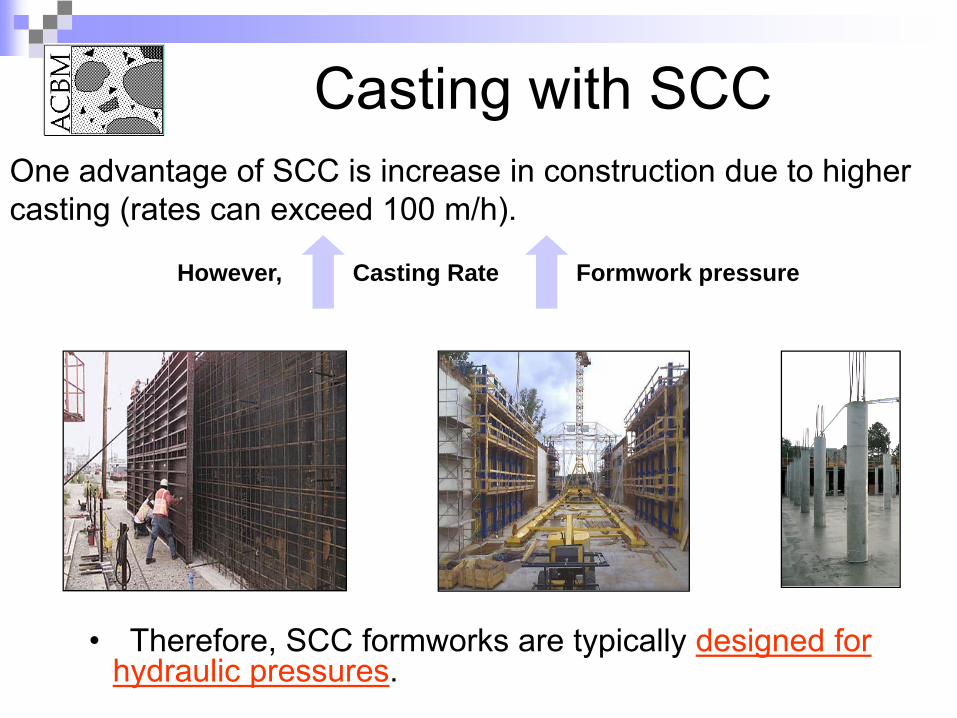
Casting with SCC
Casting Rate Formwork pressure
One advantage of SCC is increase in construction due to higher casting (rates can exceed 100 m/h).
• Therefore, SCC formworks are typically designed for hydraulic pressures.
However,
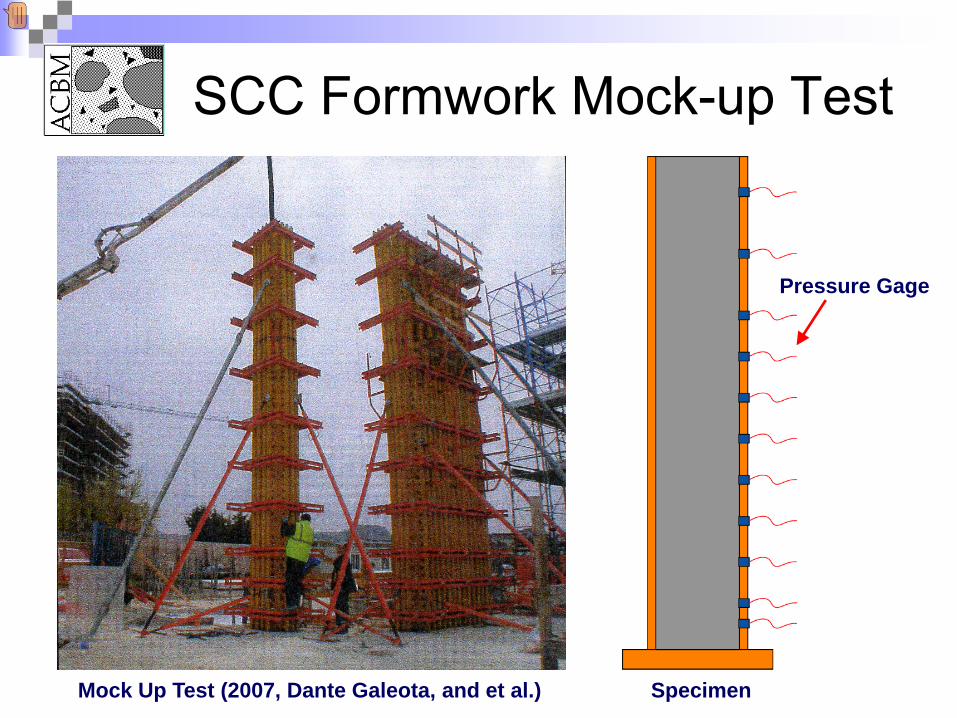
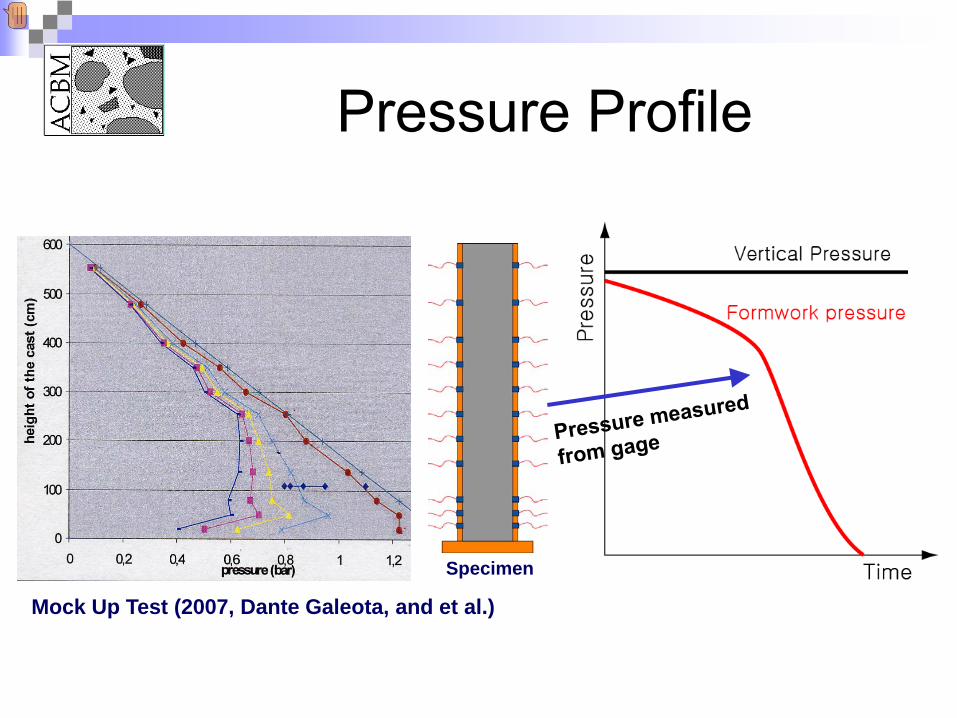
Mock Up Test (2007, Dante Galeota, and et al.)
Pressure Gage
Specimen
SCC Formwork Mock-up Test
Specimen
Mock Up Test (2007, Dante Galeota, and et al.)
Pressure Profile

Reduction of the formwork pressure• Reduce the initial formwork pressure
• Decrease the cancellation time of formwork pressure
Goal
Understanding of Fundamental Mechanisms• Develop protocol to evaluate structural rebuilding
• Understand effect of material constituents on rheology and flocculation
• Simulation of flow behavior
Application in Practice• Development of test method and laboratory test apparatus
• Development of prediction model for formwork pressure
Research Branch
Research Program
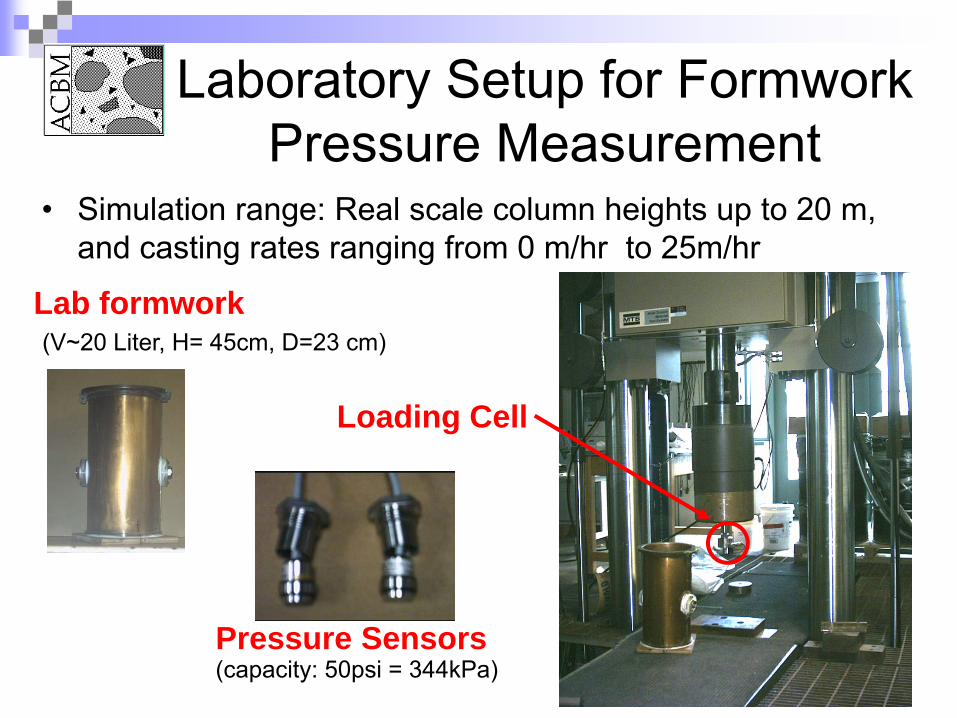
Laboratory Setup for Formwork Pressure Measurement
• Simulation range: Real scale column heights up to 20 m, and casting rates ranging from 0 m/hr to 25m/hr
Pressure Sensors(capacity: 50psi = 344kPa)
Lab formwork(V~20 Liter, H= 45cm, D=23 cm)
Loading Cell
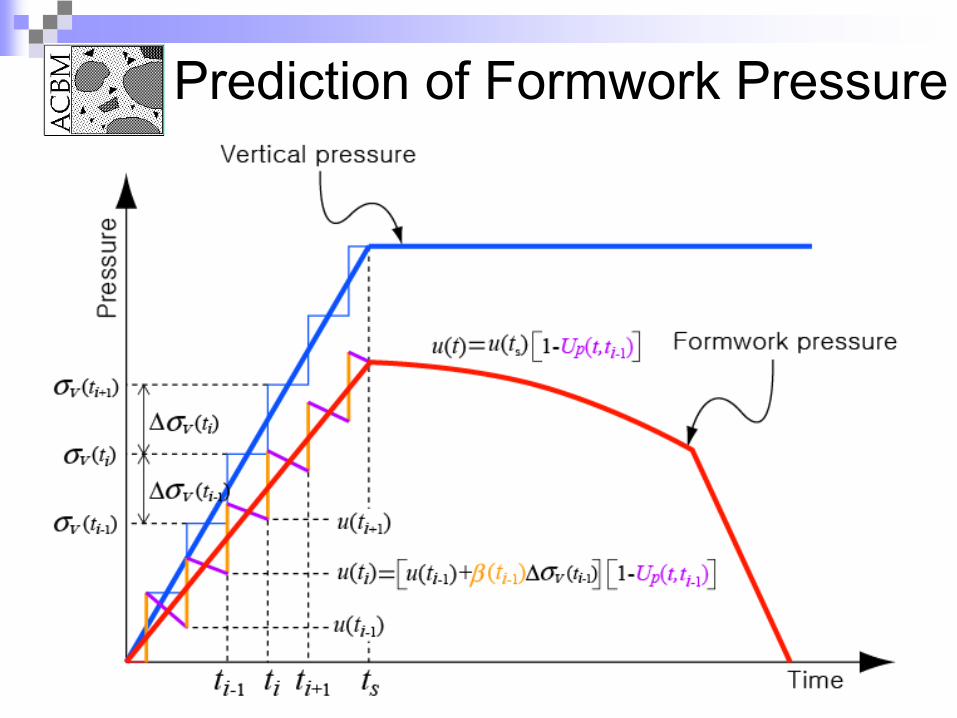
Prediction of Formwork Pressure
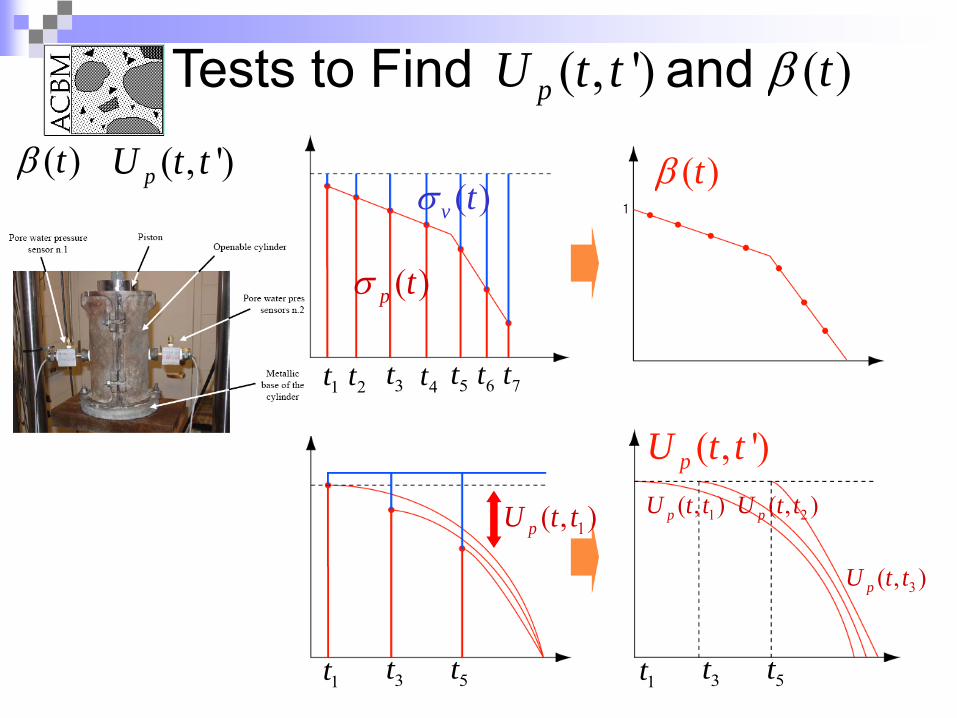
Tests to Find and
1( , )pU t t
( )v tσ
( )p tσ
1t 2t 3t 4t 5t 6t 7t
1t 3t 5t
1( , )pU t t
3( , )pU t t
2( , )pU t t
1t 3t 5t
( , ')pU t t( )tβ
( , ')pU t t
( )tβ
( , ')pU t t ( )tβ
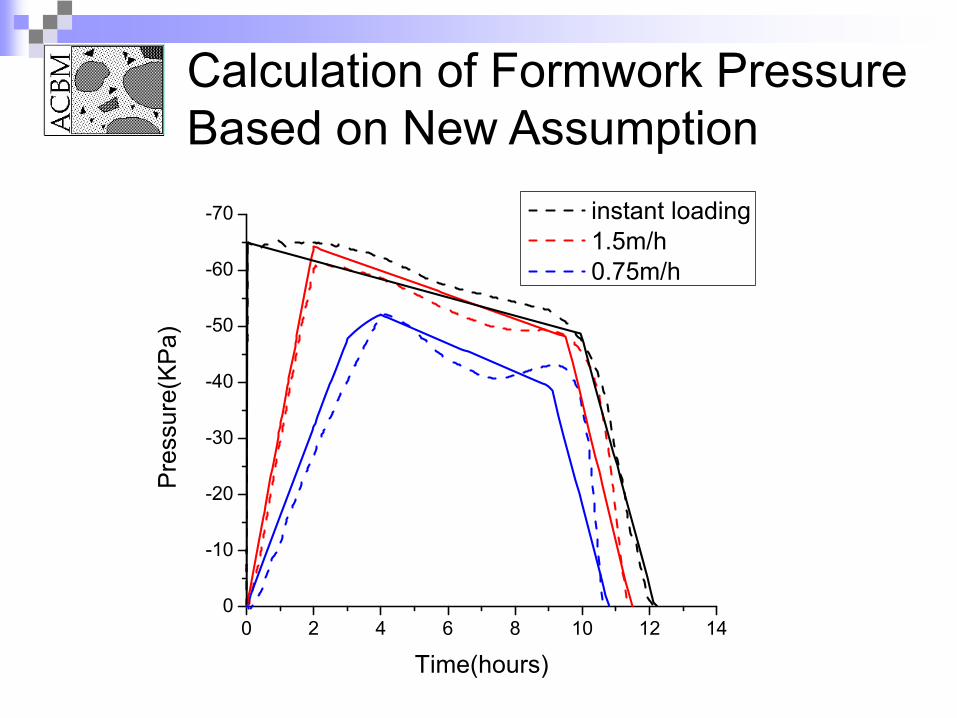
Calculation of Formwork Pressure Based on New Assumption
0 2 4 6 8 10 12 140
-10
-20
-30
-40
-50
-60
-70 instant loading 1.5m/h 0.75m/h
Pre
ssur
e(K
Pa)
Time(hours)
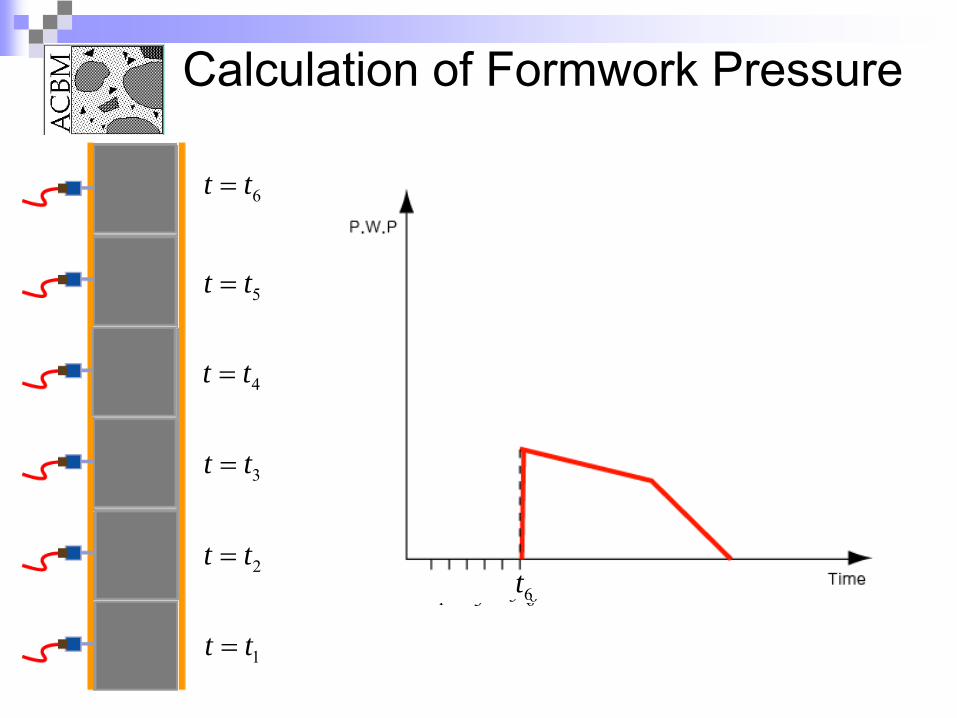
1t t=
1t 6t2t t=
2t 6t
3t t=
3t 6t
4t t=
4t 6t
5t t=
5t 6t
6t t=
6t
Calculation of Formwork Pressure
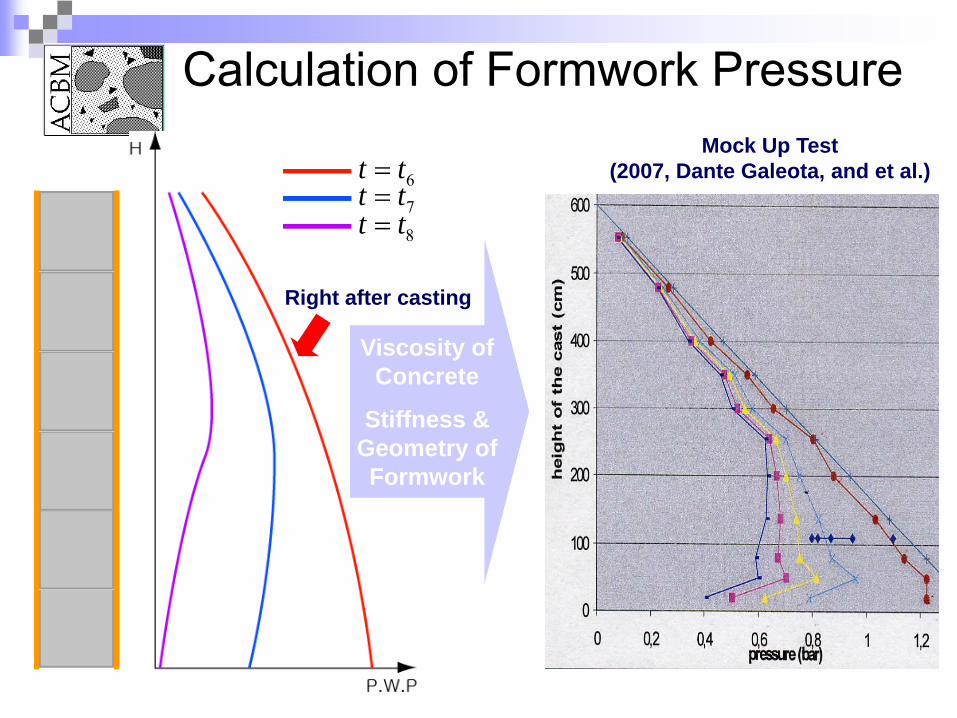
6t t=7t t=8t t=
Viscosity of Concrete
Stiffness & Geometry of Formwork
Right after casting
Mock Up Test(2007, Dante Galeota, and et al.)
Calculation of Formwork Pressure
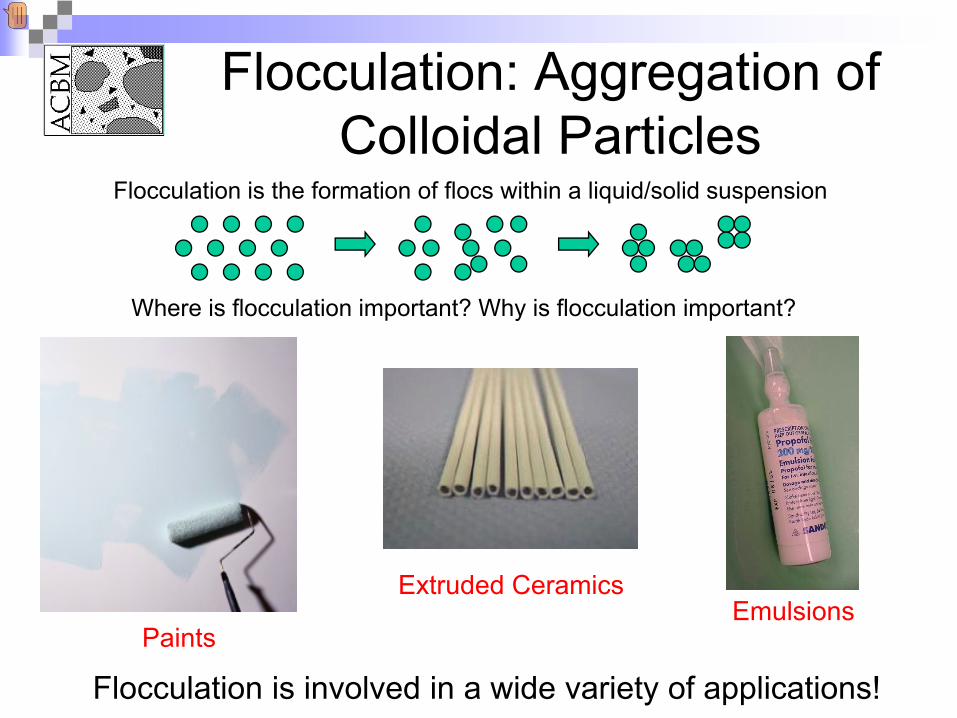
Flocculation: Aggregation of Colloidal Particles
Flocculation is involved in a wide variety of applications!Paints
Extruded CeramicsEmulsions
Where is flocculation important? Why is flocculation important?
Flocculation is the formation of flocs within a liquid/solid suspension
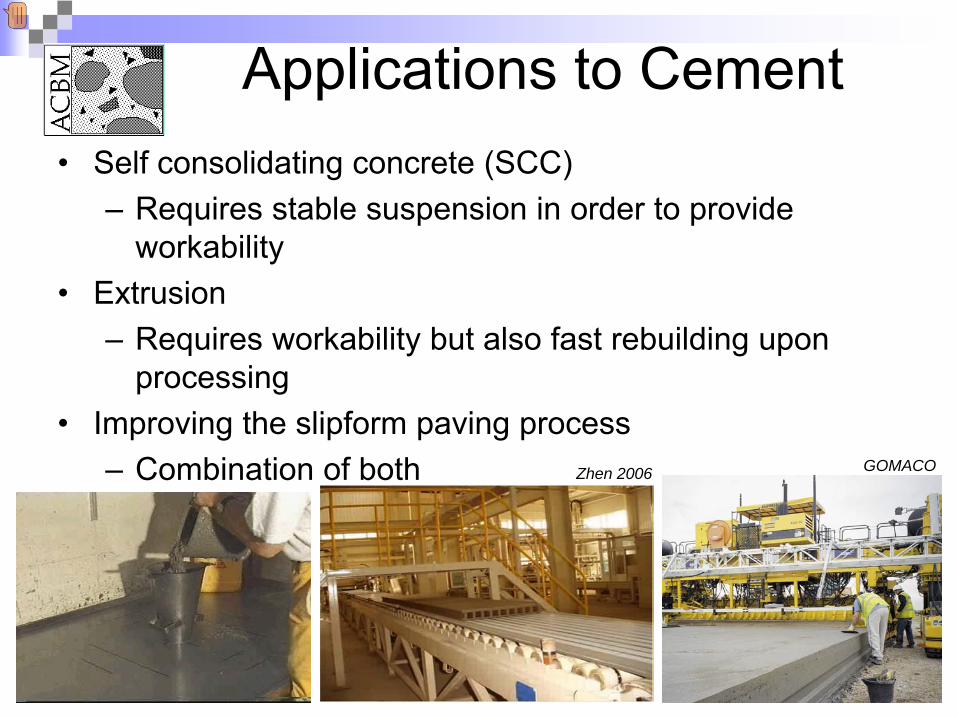
Applications to Cement• Self consolidating concrete (SCC)
– Requires stable suspension in order to provide workability
• Extrusion– Requires workability but also fast rebuilding upon
processing• Improving the slipform paving process
– Combination of both GOMACOZhen 2006
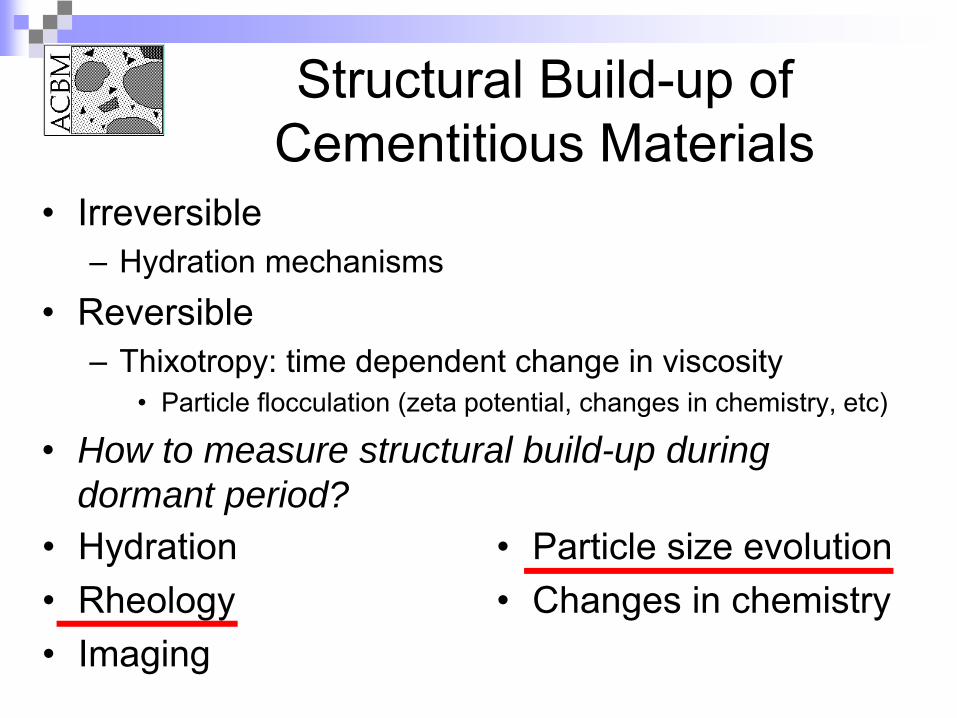
Structural Build-up of Cementitious Materials
• Irreversible– Hydration mechanisms
• Reversible– Thixotropy: time dependent change in viscosity
• Particle flocculation (zeta potential, changes in chemistry, etc)
• How to measure structural build-up during dormant period?
• Particle size evolution• Changes in chemistry
• Hydration• Rheology• Imaging
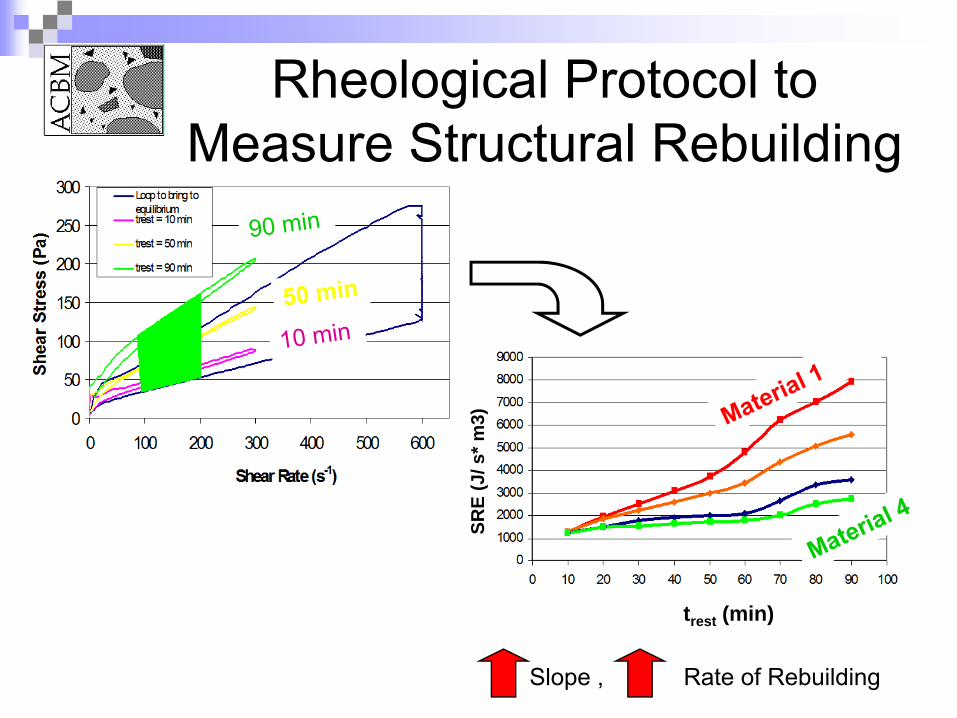
Rheological Protocol to Measure Structural Rebuilding
Slope , Rate of Rebuilding
SRE
(J/ s
* m3)
trest (min)
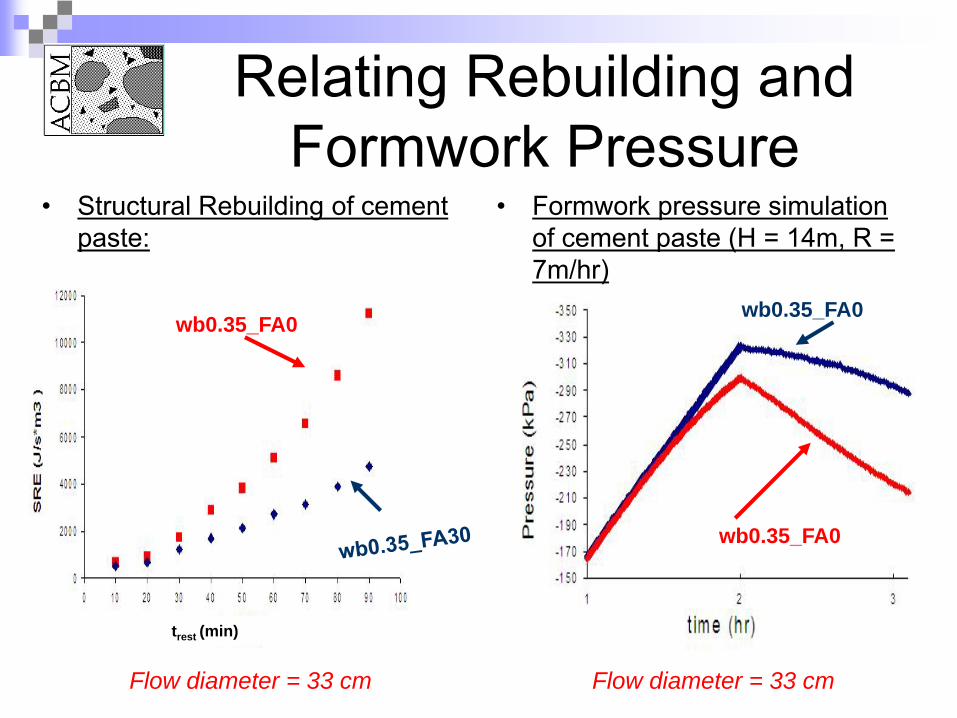
• Formwork pressure simulation of cement paste (H = 14m, R = 7m/hr)
Flow diameter = 33 cm Flow diameter = 33 cm
Relating Rebuilding and Formwork Pressure
• Structural Rebuilding of cement paste:
wb0.35_FA0
trest (min)
wb0.35_FA0
wb0.35_FA0
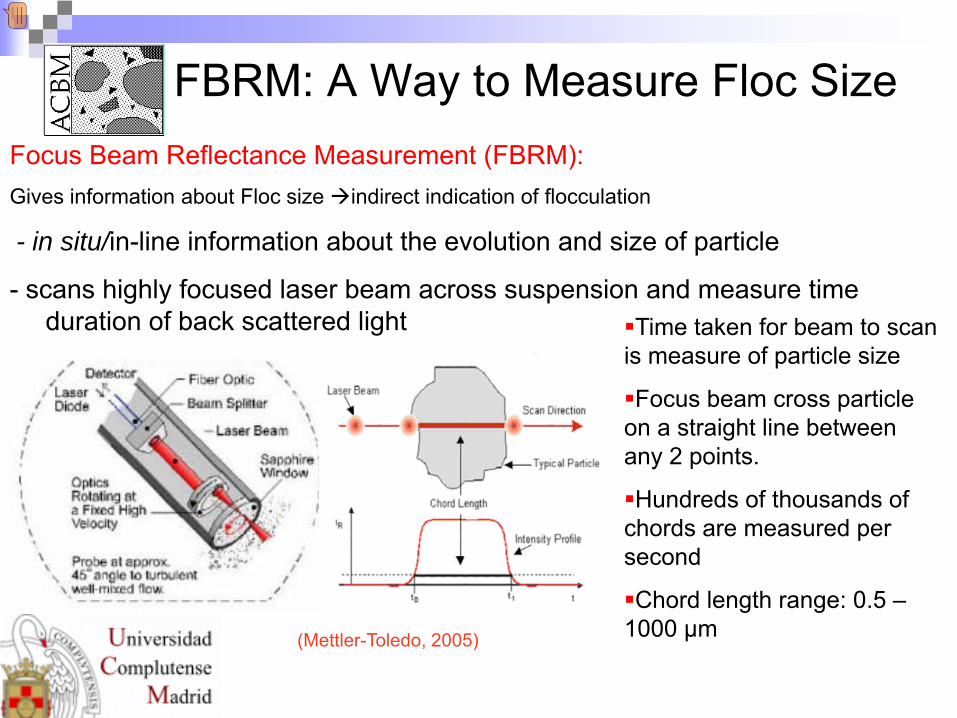
Focus Beam Reflectance Measurement (FBRM):Gives information about Floc size indirect indication of flocculation
- in situ/in-line information about the evolution and size of particle
- scans highly focused laser beam across suspension and measure time duration of back scattered light Time taken for beam to scan
is measure of particle size
Focus beam cross particle on a straight line between any 2 points.
Hundreds of thousands of chords are measured per second
Chord length range: 0.5 –1000 μm
FBRM: A Way to Measure Floc Size
(Mettler-Toledo, 2005)
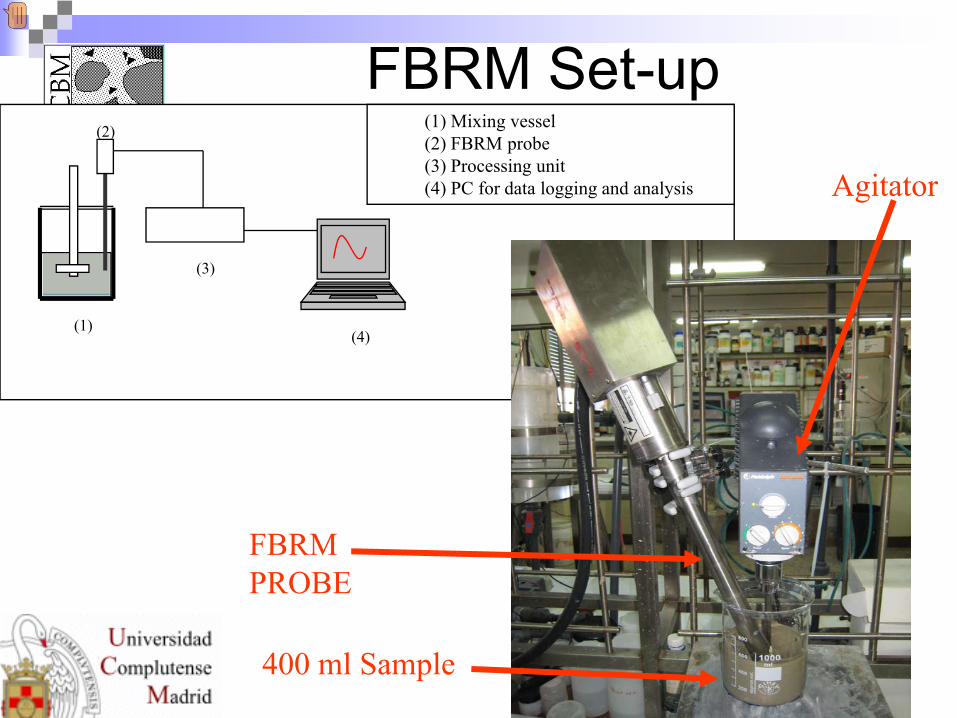
(4)(1)
(3)
(2) (1) Mixing vessel(2) FBRM probe(3) Processing unit(4) PC for data logging and analysis
FBRM PROBE
Agitator
400 ml Sample
FBRM Set-up
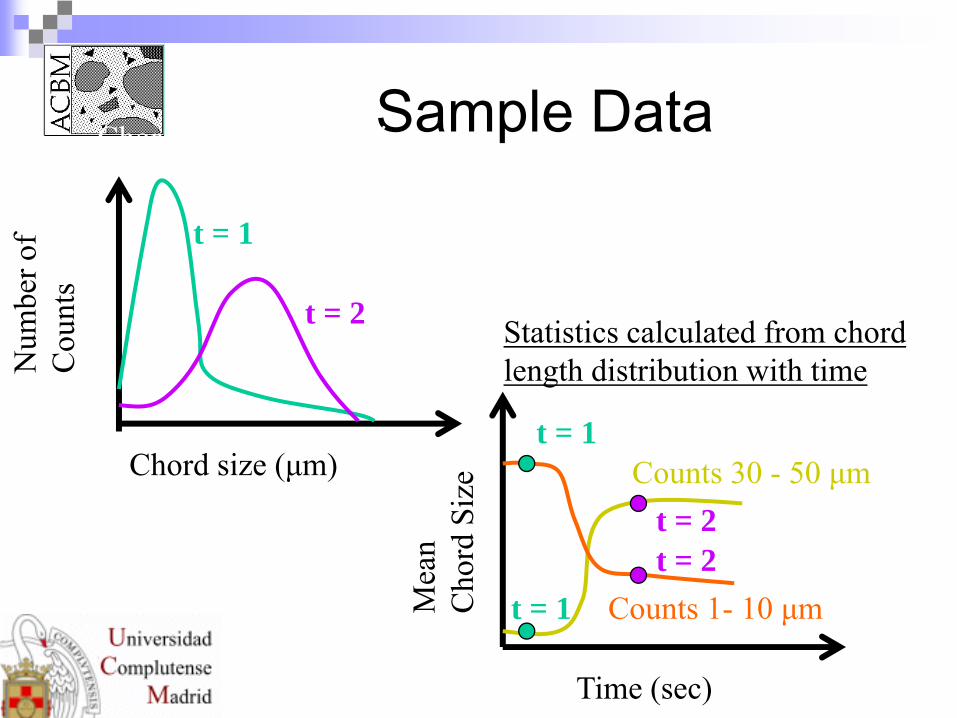
Sample Data
Chord size (μm)
Num
ber o
f C
ount
s
Time (sec)
Mea
n C
hord
Siz
e
Counts 1- 10 μm
Counts 30 - 50 μm
t = 1
t = 2
t = 1
t = 2t = 2
t = 1
Statistics calculated from chord length distribution with time
Chord length distribution
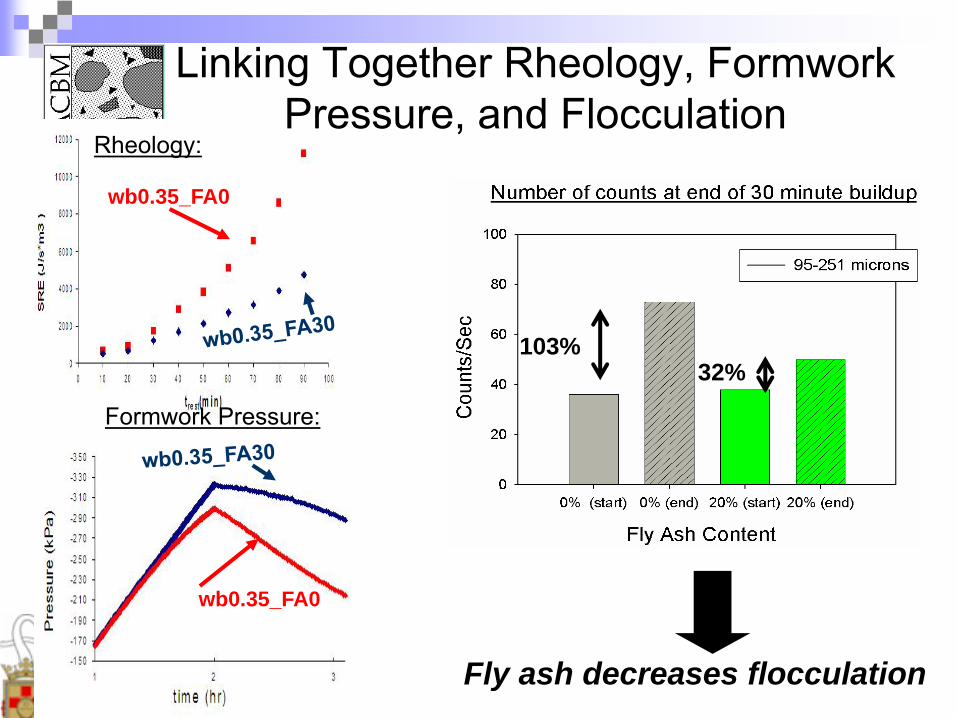
Fly ash decreases flocculation
103%32%
wb0.35_FA0
wb0.35_FA0
Linking Together Rheology, Formwork Pressure, and Flocculation
Rheology:
Formwork Pressure:
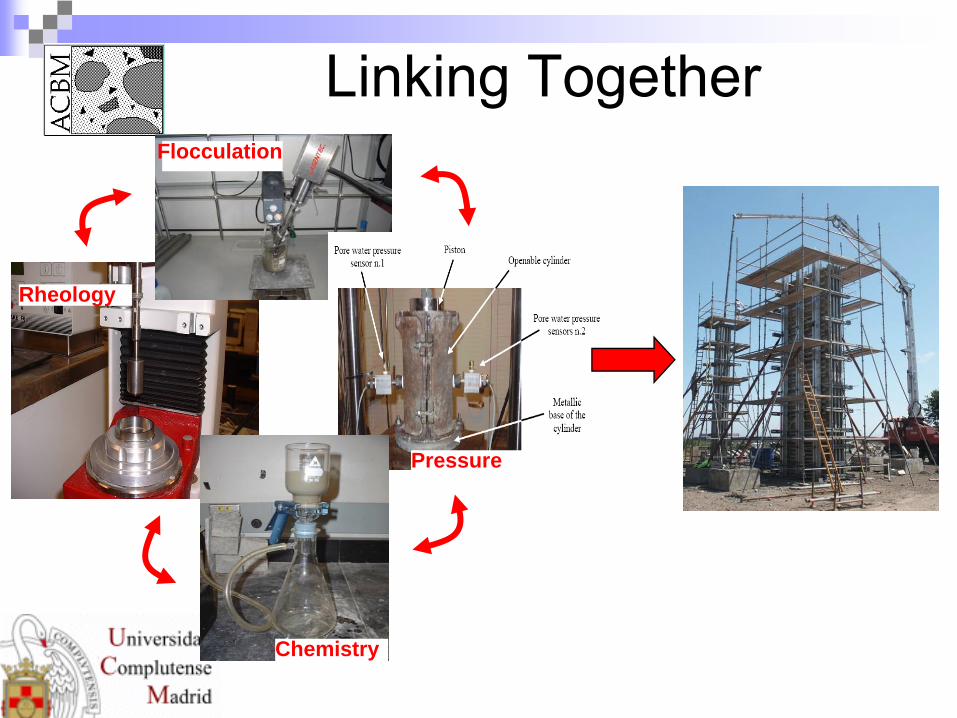
Linking TogetherFlocculation
Rheology
Chemistry
Pressure
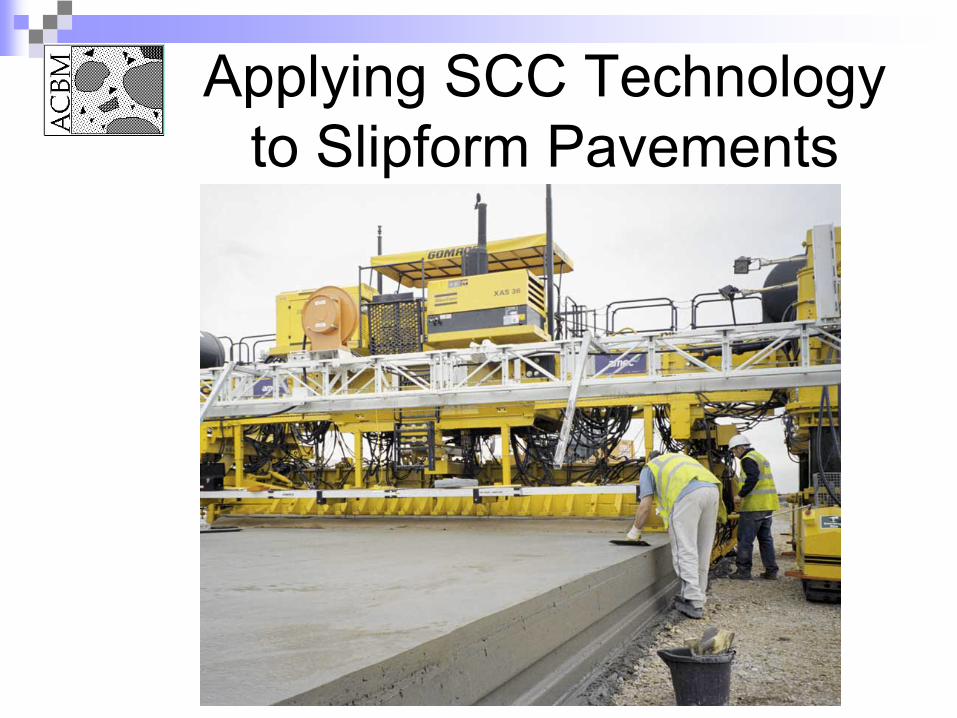
Applying SCC Technology to Slipform Pavements
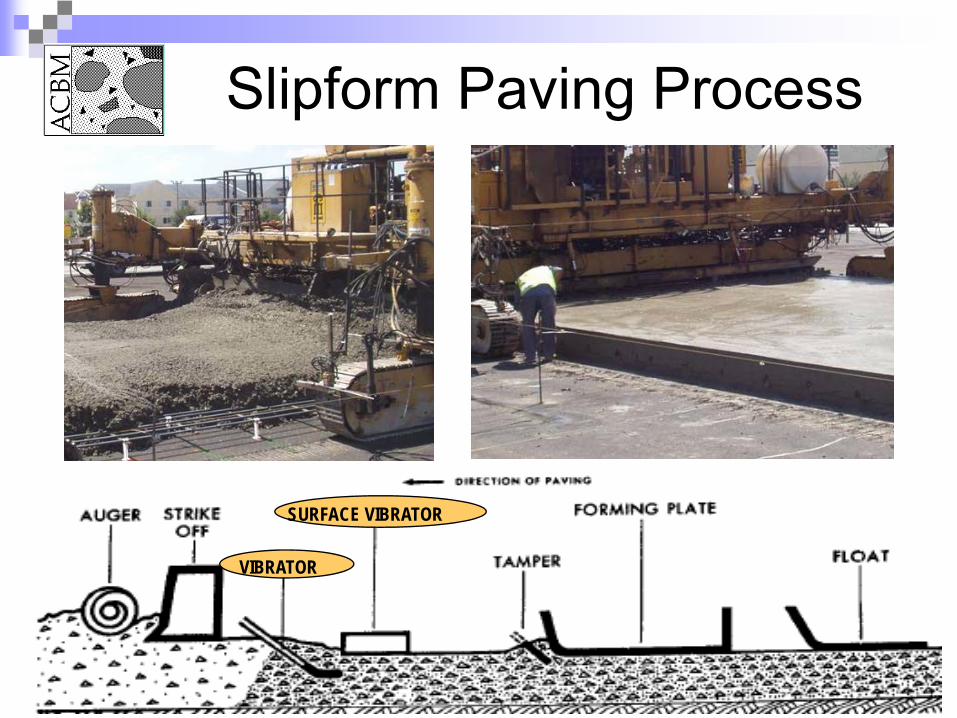
Slipform Paving Process
VIBRATOR
SURFACE VIBRATOR
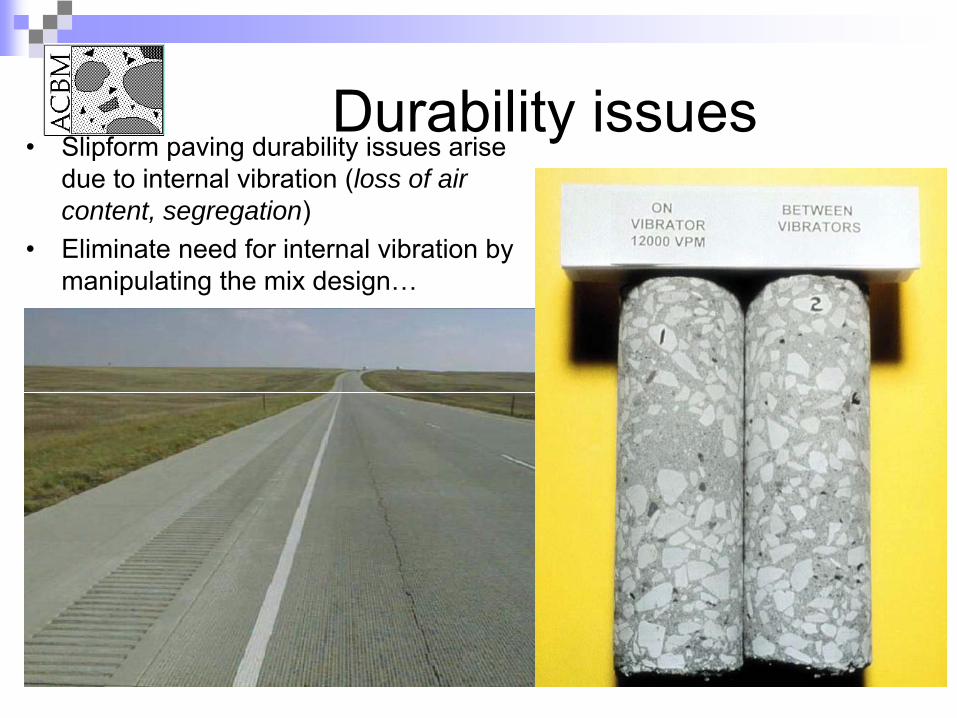
Durability issues• Slipform paving durability issues arise
due to internal vibration (loss of air content, segregation)
• Eliminate need for internal vibration by manipulating the mix design…
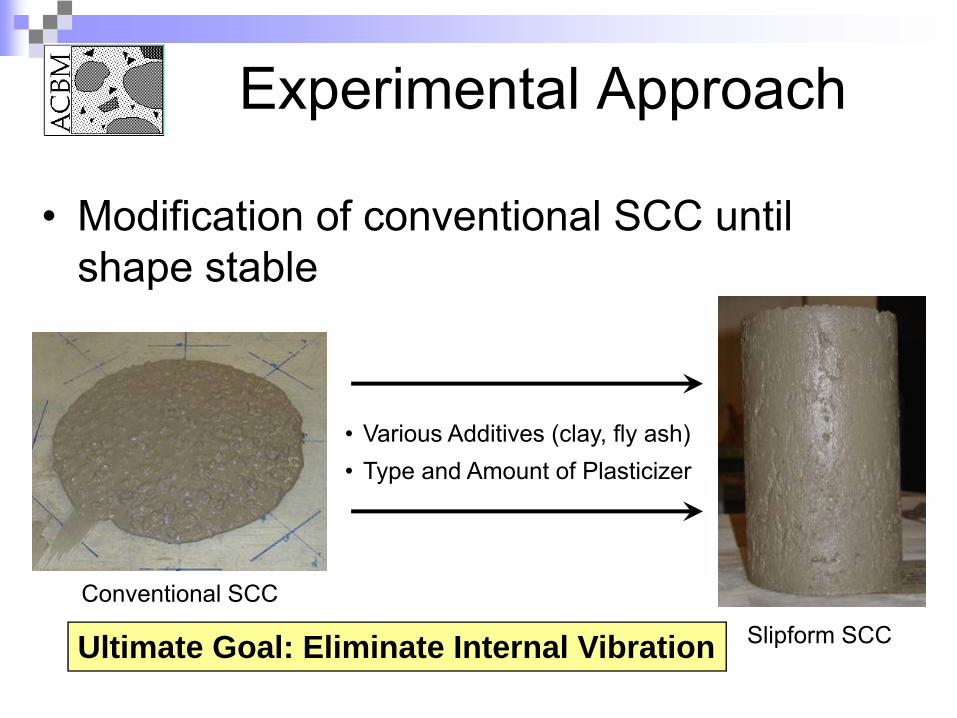
Experimental Approach
• Modification of conventional SCC until shape stable
Conventional SCC
Slipform SCC
• Various Additives (clay, fly ash)• Type and Amount of Plasticizer
Ultimate Goal: Eliminate Internal Vibration
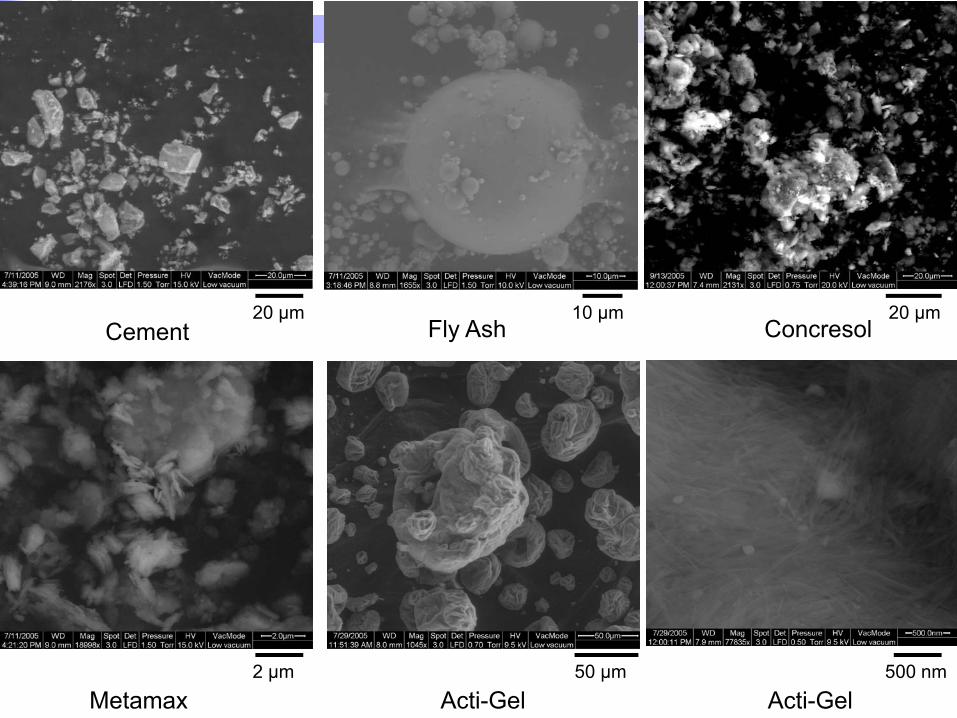
Cement Fly Ash Concresol
Metamax Acti-Gel
20 μm 20 μm
2 μm 50 μmActi-Gel
500 nm
10 μm
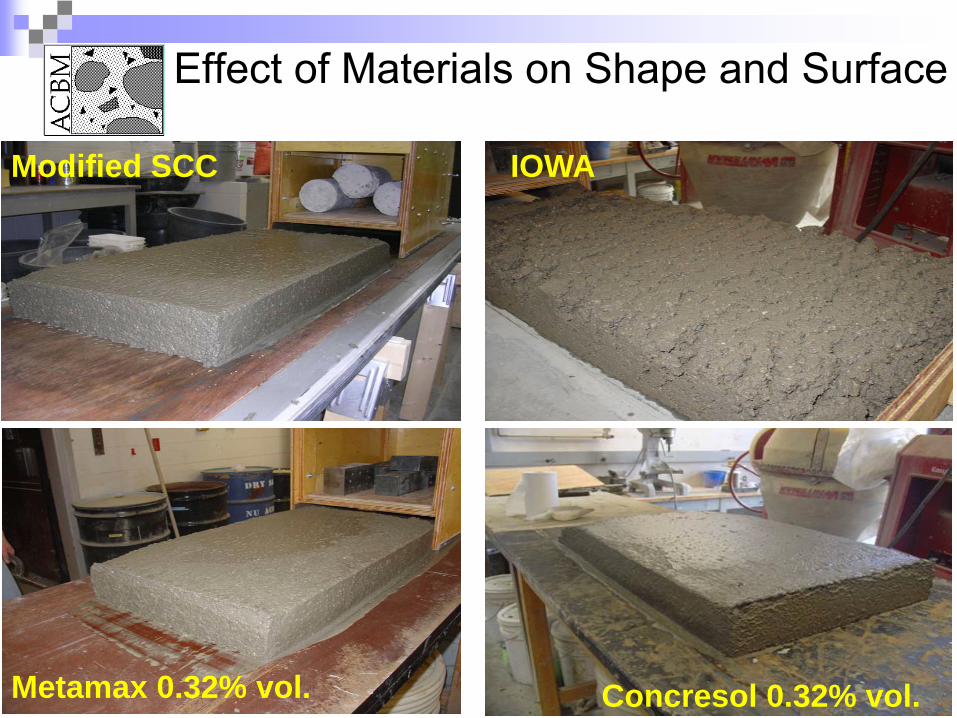
Modified SCC IOWA
Metamax 0.32% vol. Concresol 0.32% vol.
Effect of Materials on Shape and Surface
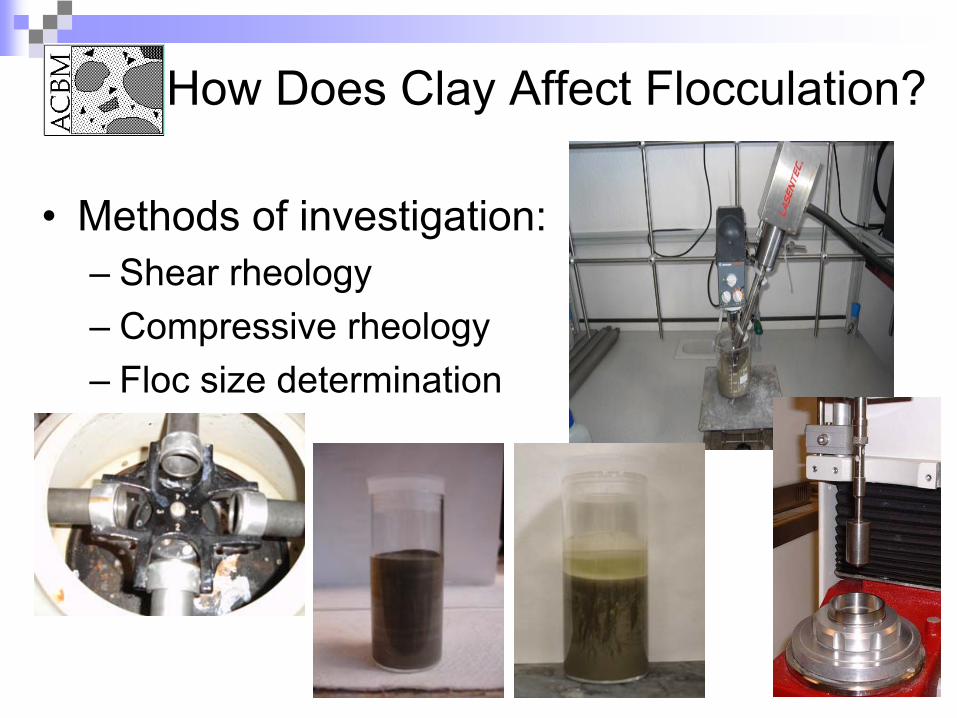
How Does Clay Affect Flocculation?
• Methods of investigation:– Shear rheology– Compressive rheology– Floc size determination
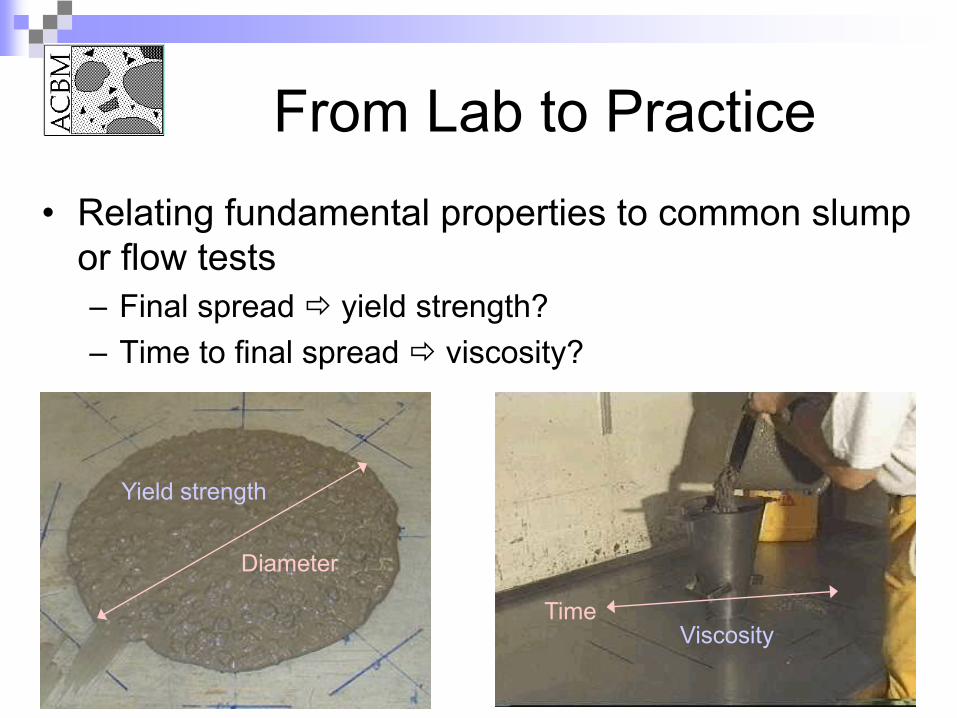
From Lab to Practice• Relating fundamental properties to common slump
or flow tests– Final spread yield strength?– Time to final spread viscosity?
Yield strength
ViscosityTime
Diameter

Experimental Setup
• Measuring final diameter and time it takes to reach a given diameter for cement paste
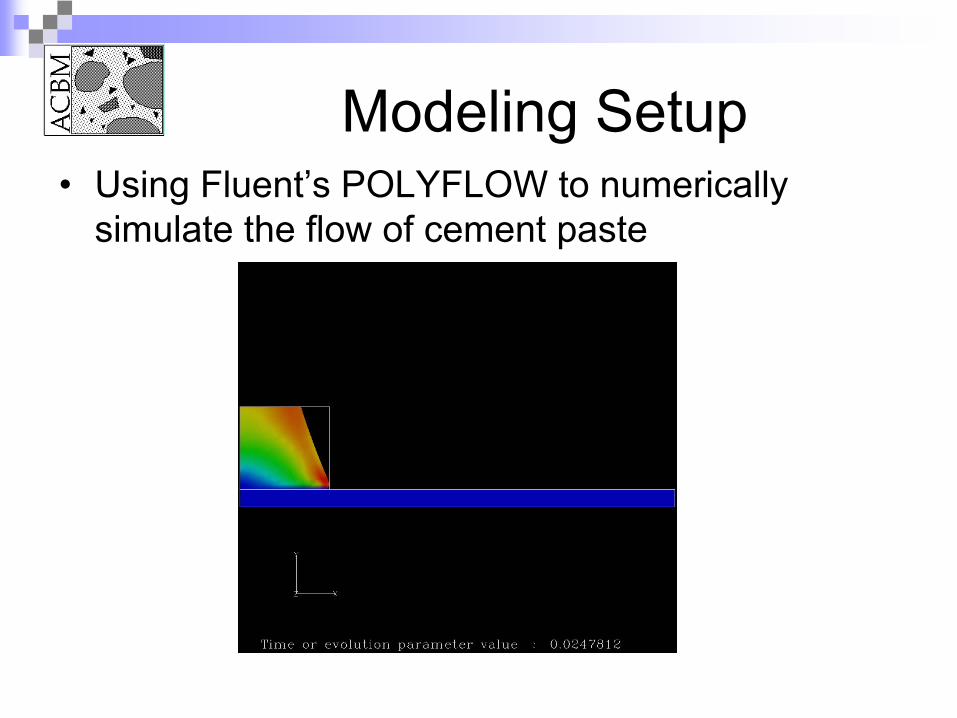
Modeling Setup• Using Fluent’s POLYFLOW to numerically
simulate the flow of cement paste
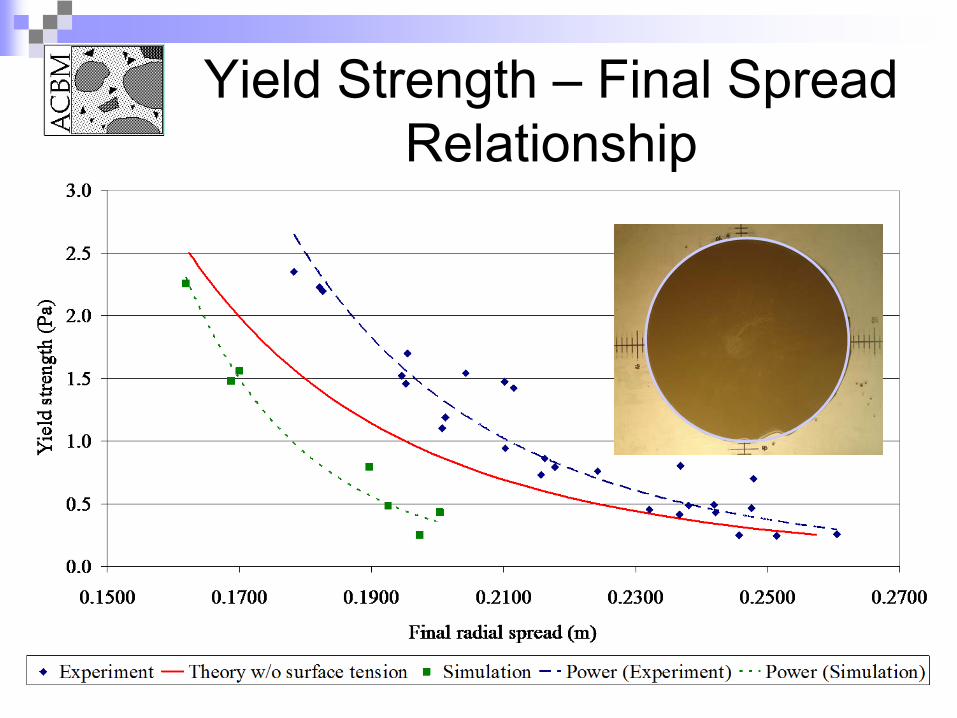
Yield Strength – Final Spread Relationship
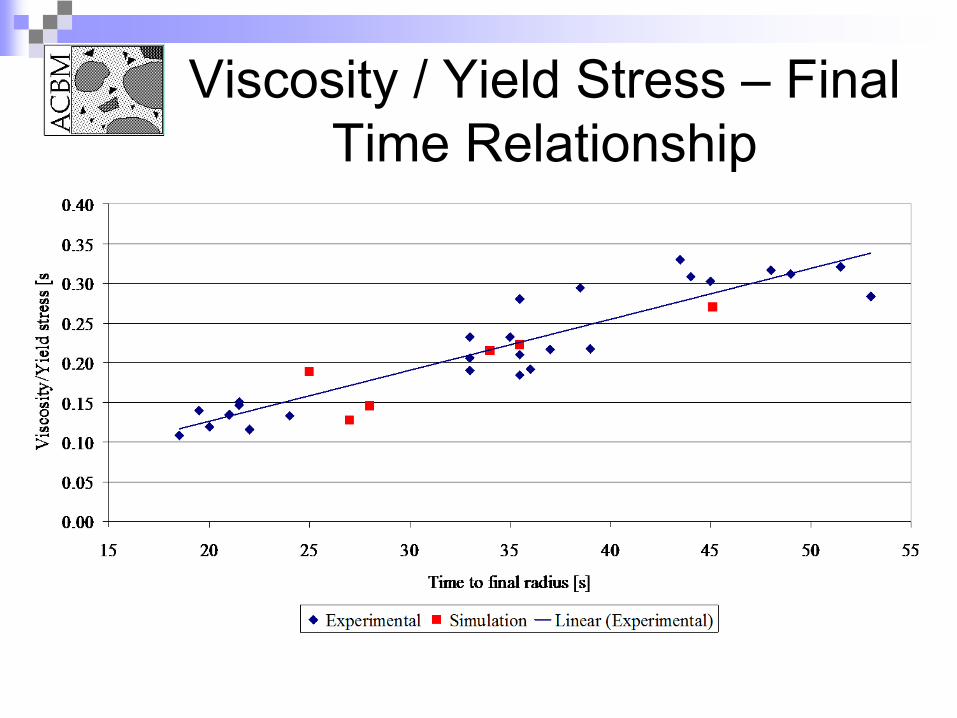
Viscosity / Yield Stress – Final Time Relationship
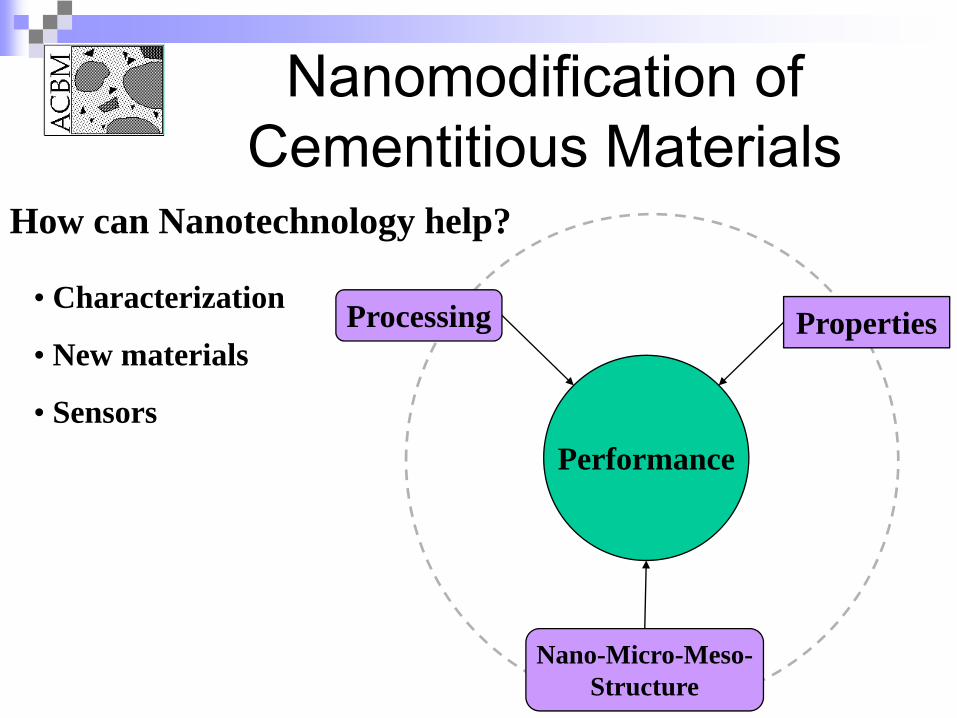
Performance
Properties
Nano-Micro-Meso-Structure
Processing• Characterization
• New materials
• Sensors
How can Nanotechnology help?
Nanomodification of Cementitious Materials
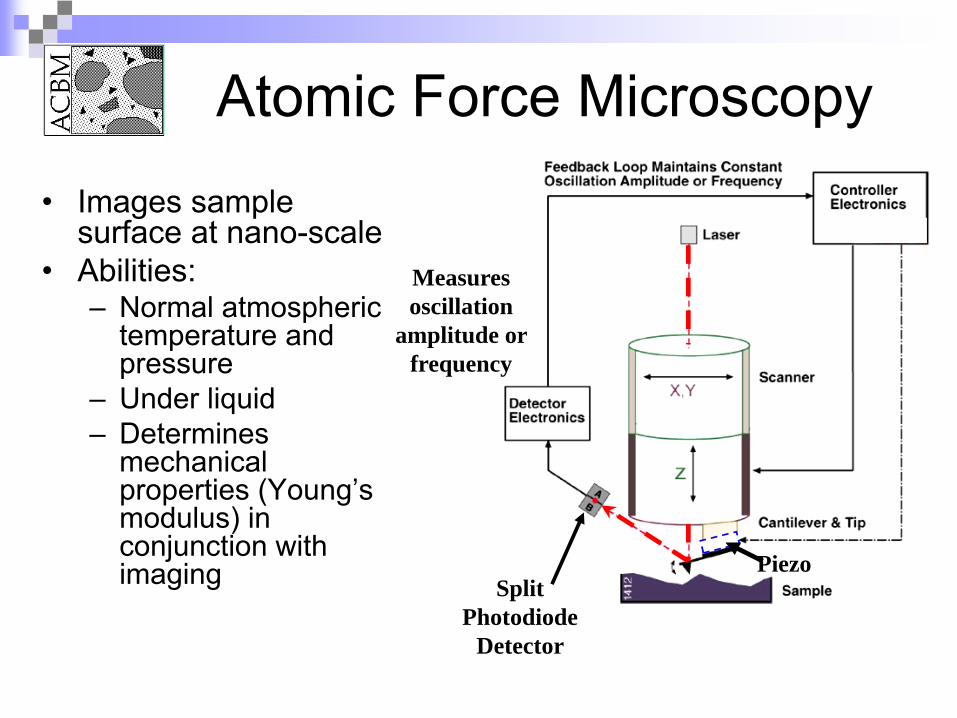
Piezo
Atomic Force Microscopy• Images sample
surface at nano-scale• Abilities:
– Normal atmospheric temperature and pressure
– Under liquid– Determines
mechanical properties (Young’s modulus) in conjunction with imaging
Measures oscillation
amplitude or frequency
Split Photodiode
Detector
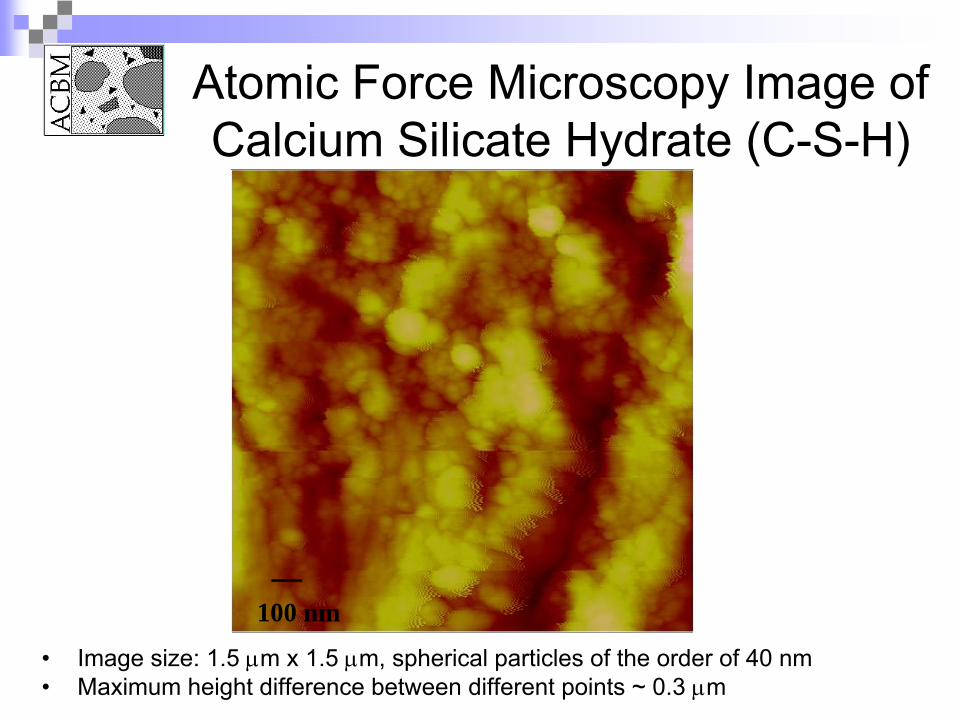
100 nm
Atomic Force Microscopy Image of Calcium Silicate Hydrate (C-S-H)
• Image size: 1.5 μm x 1.5 μm, spherical particles of the order of 40 nm• Maximum height difference between different points ~ 0.3 μm
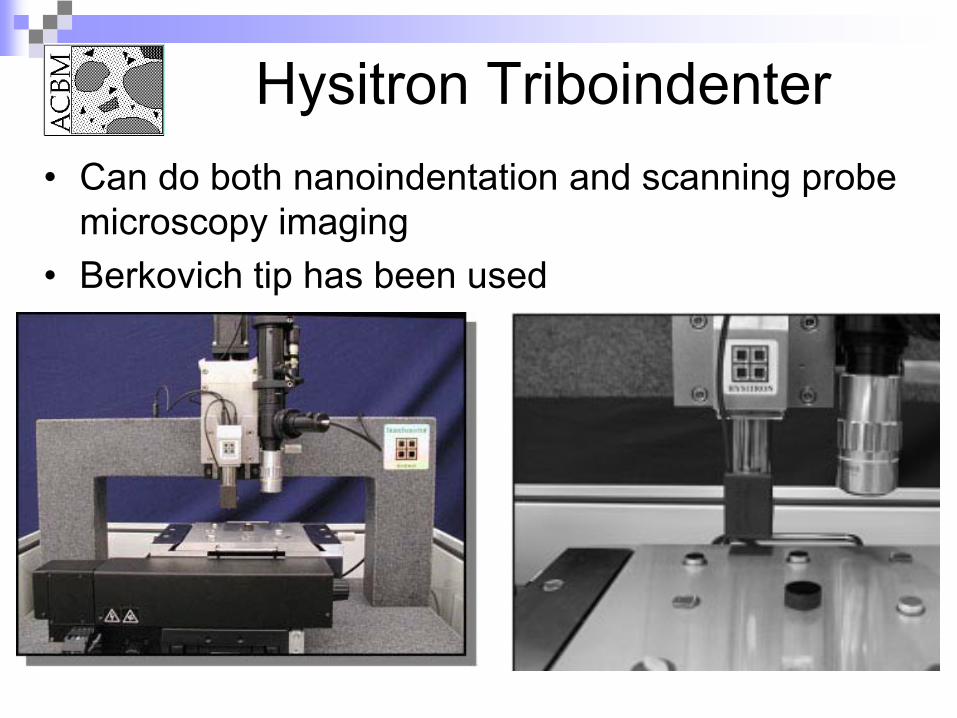
Hysitron Triboindenter• Can do both nanoindentation and scanning probe
microscopy imaging• Berkovich tip has been used
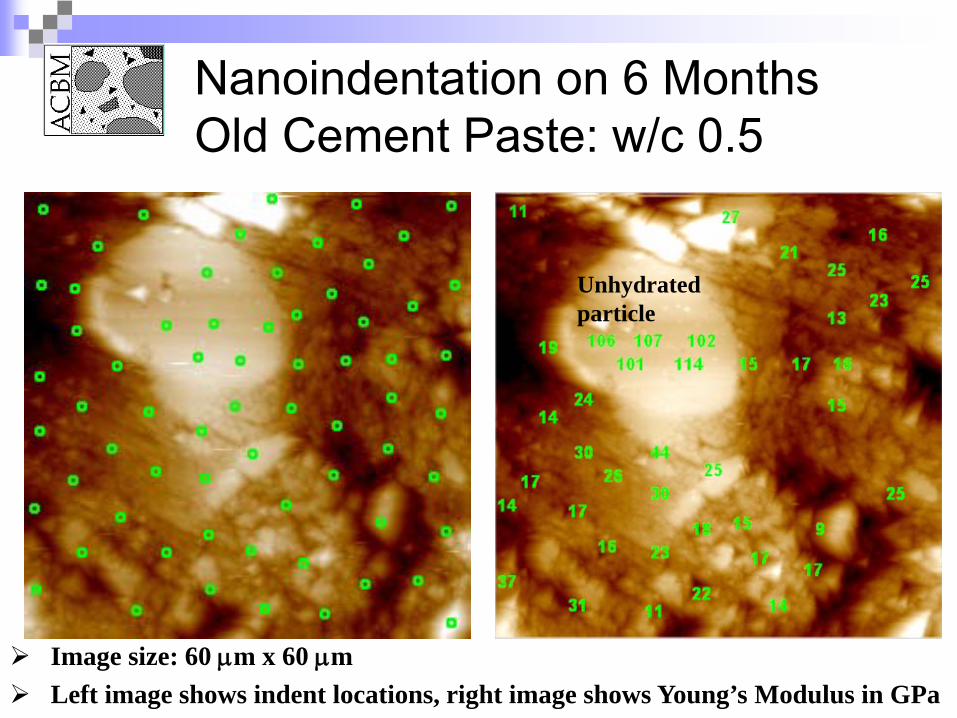
Nanoindentation on 6 Months Old Cement Paste: w/c 0.5
Image size: 60 μm x 60 μmLeft image shows indent locations, right image shows Young’s Modulus in GPa
Unhydrated particle
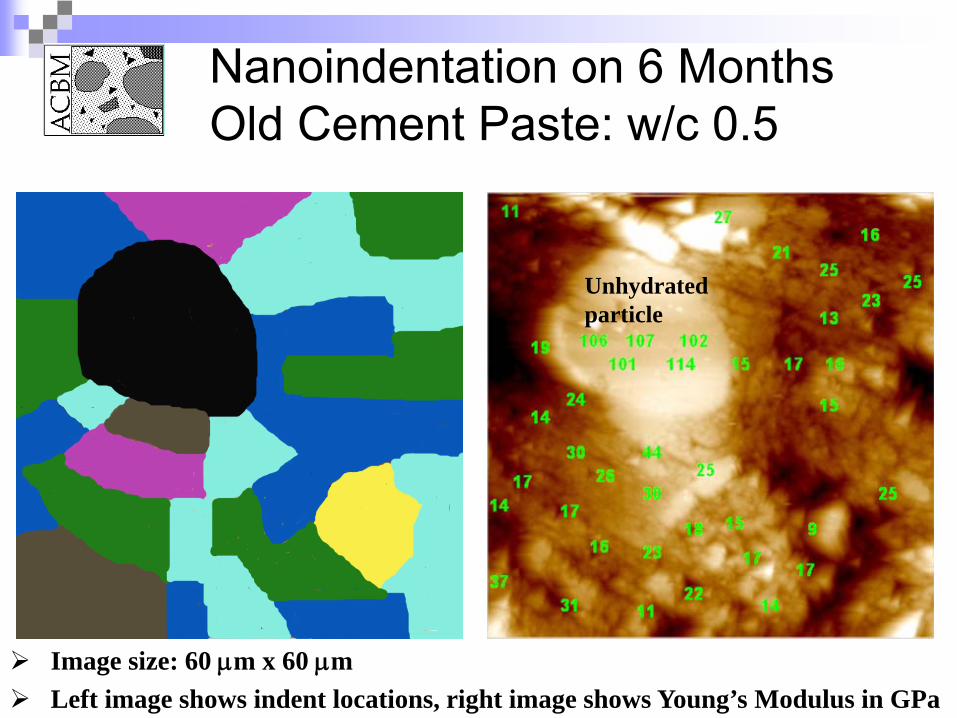
Nanoindentation on 6 Months Old Cement Paste: w/c 0.5
Image size: 60 μm x 60 μmLeft image shows indent locations, right image shows Young’s Modulus in GPa
Unhydrated particle

Nanoindentation on Sand, ITZ and Paste Matrix
• Image size: 60 μm x 60 μm• Left image shows indent locations, right image shows Young’s Modulus in GPa

Sensors
• Impedance Spectroscopy• Ultrasonic Sensing System• Nuclear Magnetic Resonance• Dielectric Measurements with Microwaves
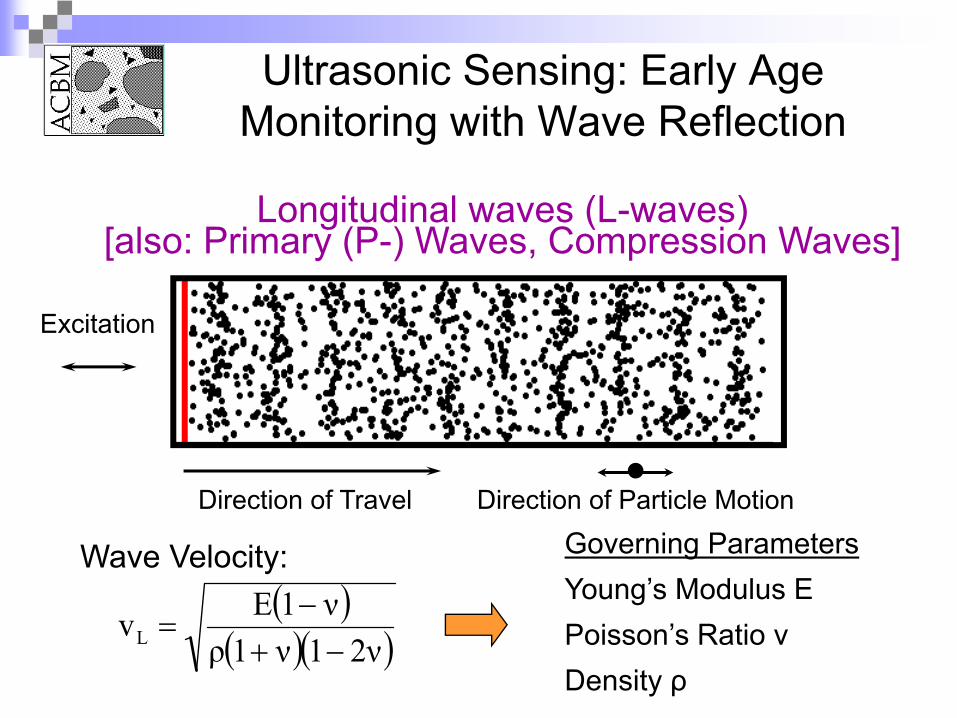
Ultrasonic Sensing: Early Age Monitoring with Wave Reflection
Direction of Travel
Excitation
Direction of Particle Motion
Longitudinal waves (L-waves)[also: Primary (P-) Waves, Compression Waves]
( )( )( )2ν1ν1ρ
ν1EvL −+−
=
Wave Velocity: Governing ParametersYoung’s Modulus EPoisson’s Ratio vDensity ρ
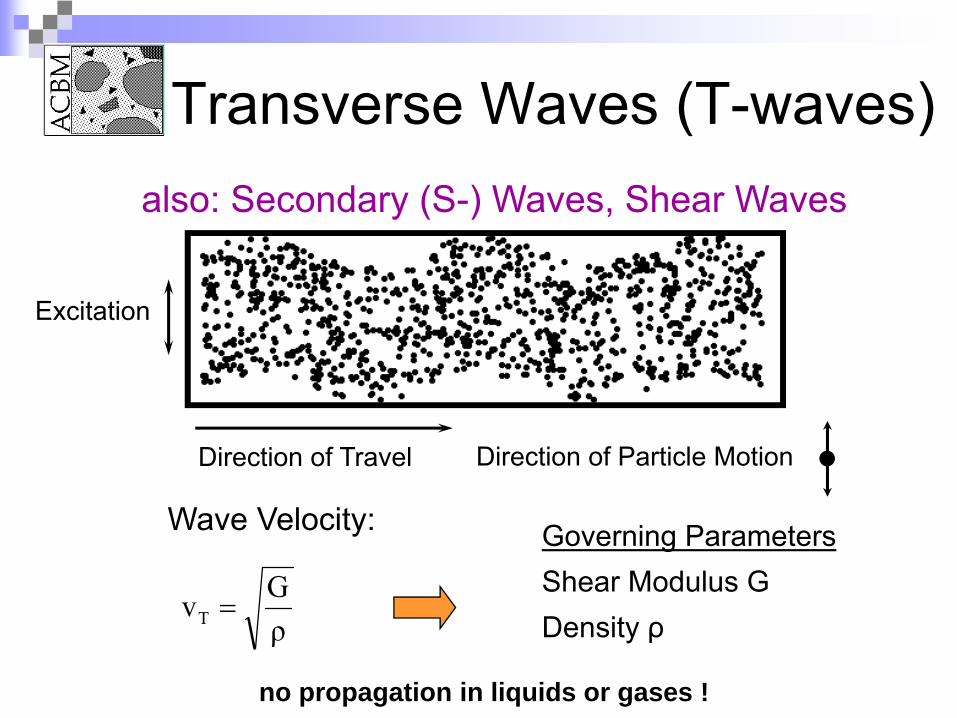
Transverse Waves (T-waves)
Direction of Travel
Excitation
Direction of Particle Motion
ρGvT =
Wave Velocity: Governing ParametersShear Modulus GDensity ρ
no propagation in liquids or gases !
also: Secondary (S-) Waves, Shear Waves
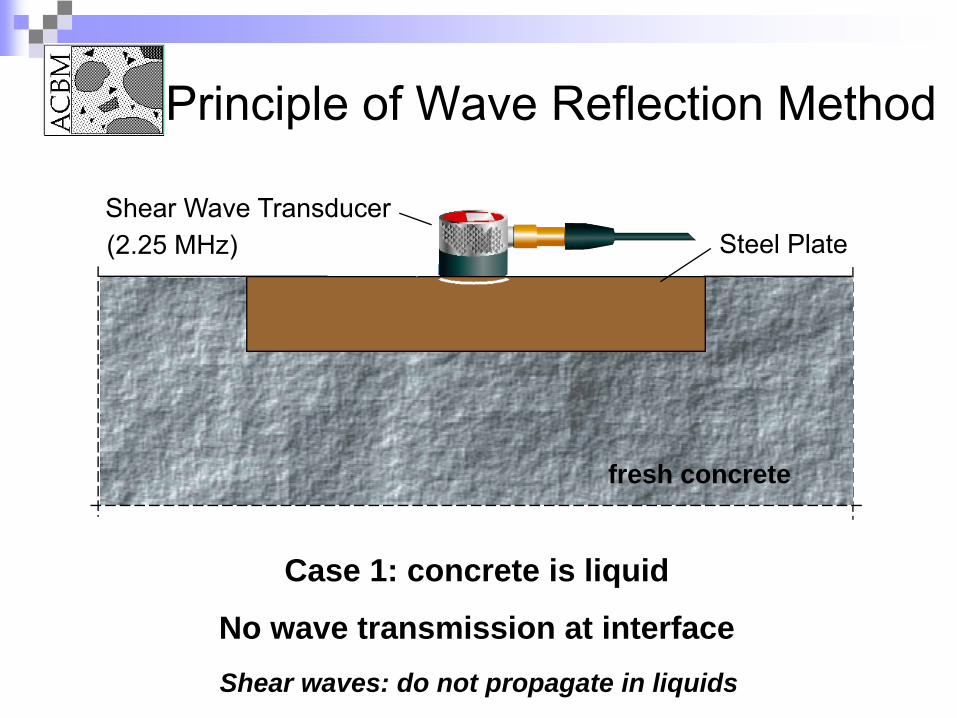
Principle of Wave Reflection Method
Shear waves: do not propagate in liquids
Case 1: concrete is liquid
No wave transmission at interface
fresh Concrete
Steel PlateShear Wave Transducer (2.25 MHz)
fresh concrete
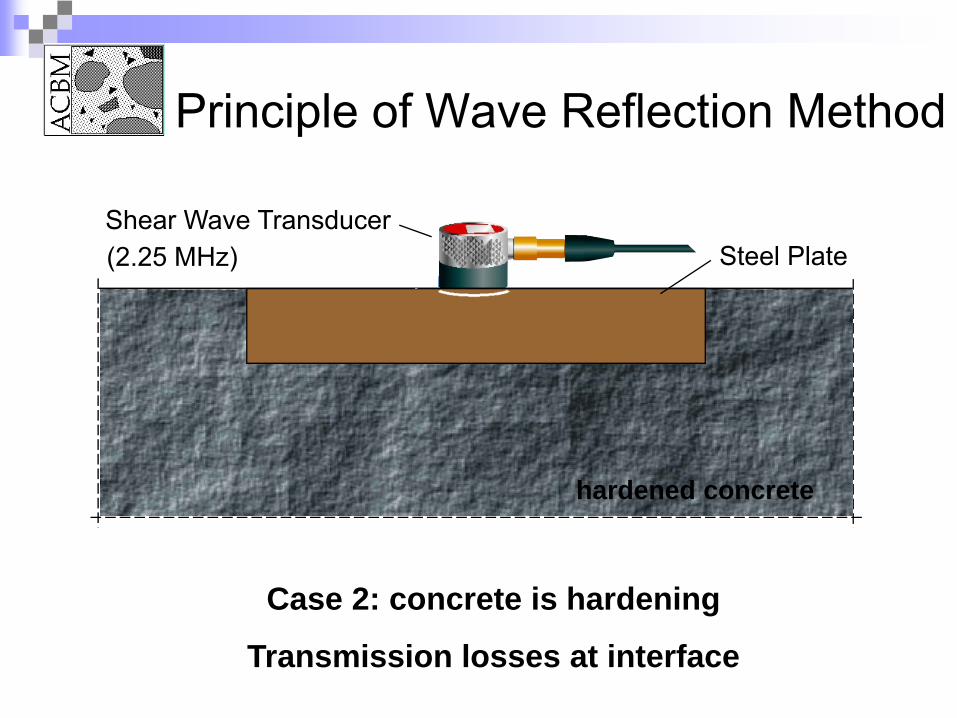
Principle of Wave Reflection Method
Case 2: concrete is hardening
Transmission losses at interface
Steel PlateShear Wave Transducer (2.25 MHz)
hardened concrete
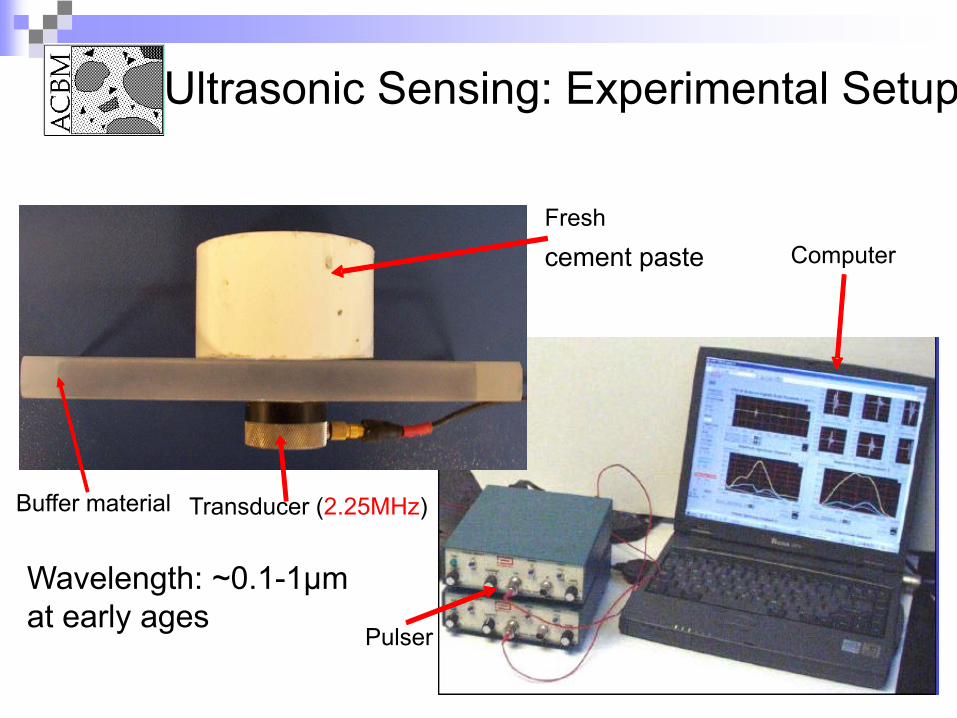
Transducer (2.25MHz)Buffer material
Fresh
cement paste Computer
Pulser
Wavelength: ~0.1-1μm at early ages
Ultrasonic Sensing: Experimental Setup
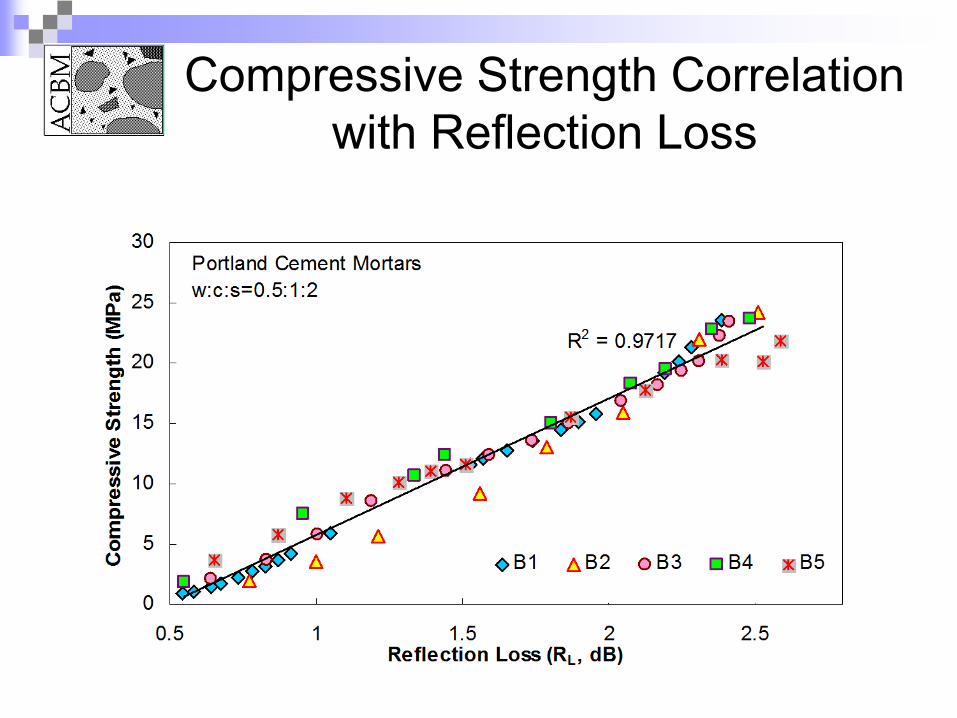
Compressive Strength Correlation with Reflection Loss
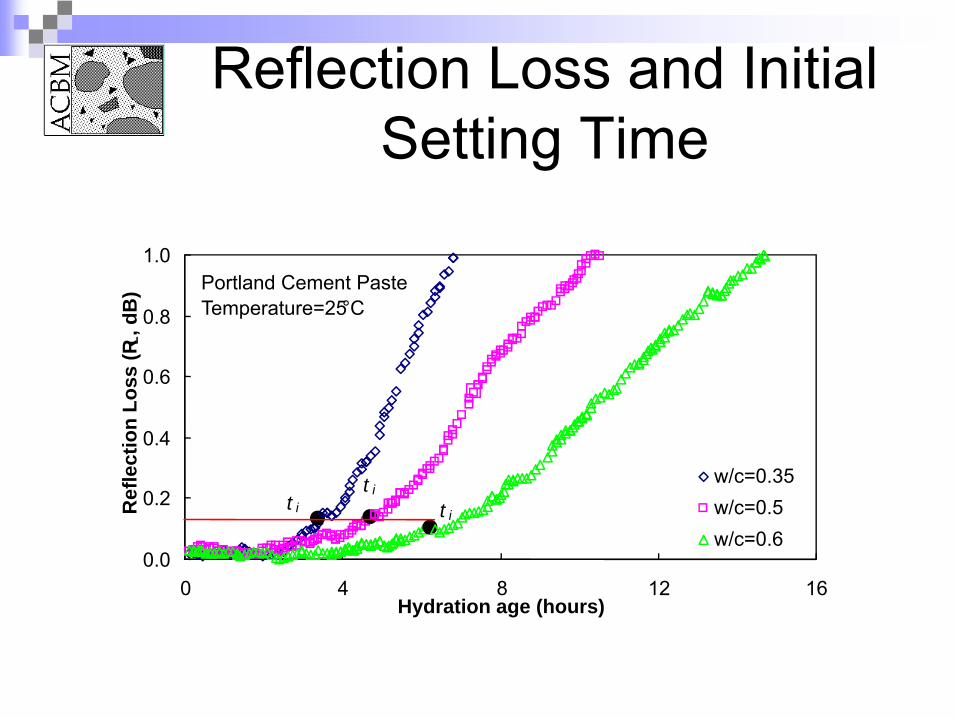
Reflection Loss and Initial Setting Time
0.0
0.2
0.4
0.6
0.8
1.0
0 4 8 12 16Hydration age (hours)
Ref
lect
ion
Loss
(RL,
dB
)
w/c=0.35w/c=0.5w/c=0.6
Portland Cement PasteTemperature=25°C
tt
tii
i
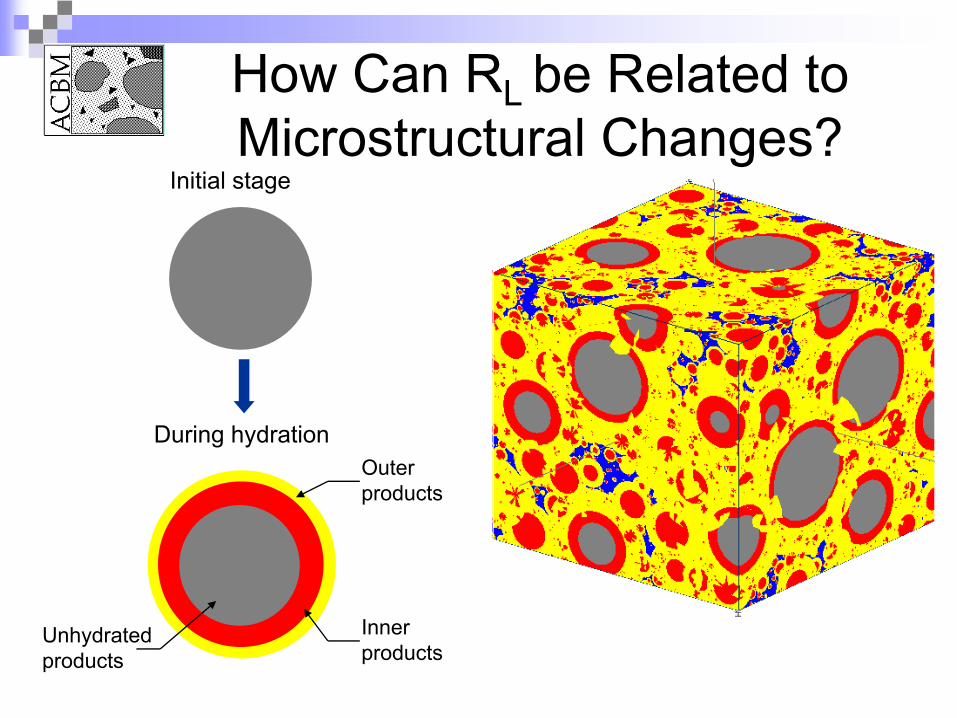
How Can RL be Related to Microstructural Changes?
Initial stage
During hydrationOuter products
Inner products
Unhydrated products
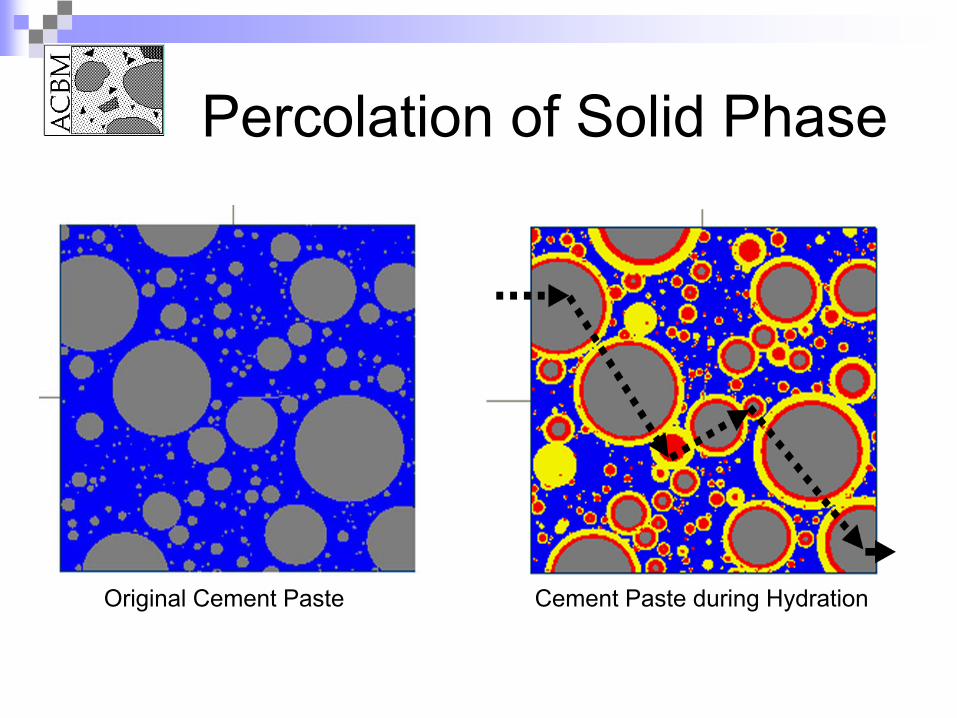
Percolation of Solid Phase
Original Cement Paste Cement Paste during Hydration
New Materials: Photocatalysis• A new and innovative approach shows that
photocatalytic activity may be conferred to cementitious construction materials such as paints, mortars, concrete, roads etc.
• TiO2 is effective in reducing pollutants such as NOx, aromatics, ammonia, and aldehydes
• TiO2 in combination with cementitious materials has shown a favorable synergistic effect in the reduction of pollutants
L. Cassar, CTG Italcementi Group, Italy2nd International Symposium on Nanotechnology in Construction, Nov 2005, Bilbao, Spain
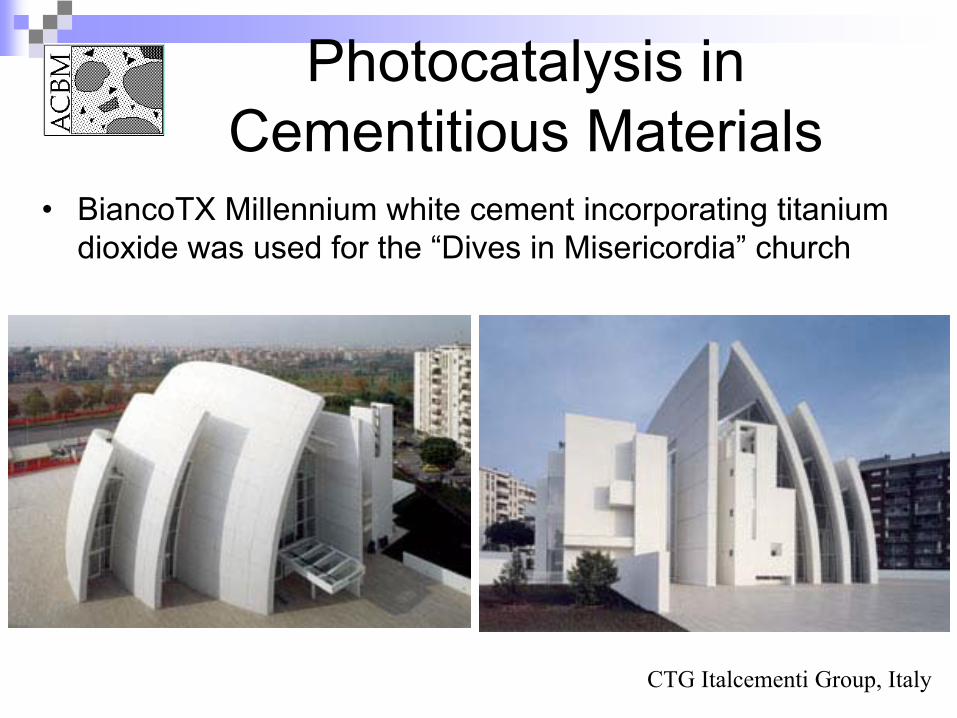
CTG Italcementi Group, Italy
Photocatalysis in Cementitious Materials
• BiancoTX Millennium white cement incorporating titanium dioxide was used for the “Dives in Misericordia” church
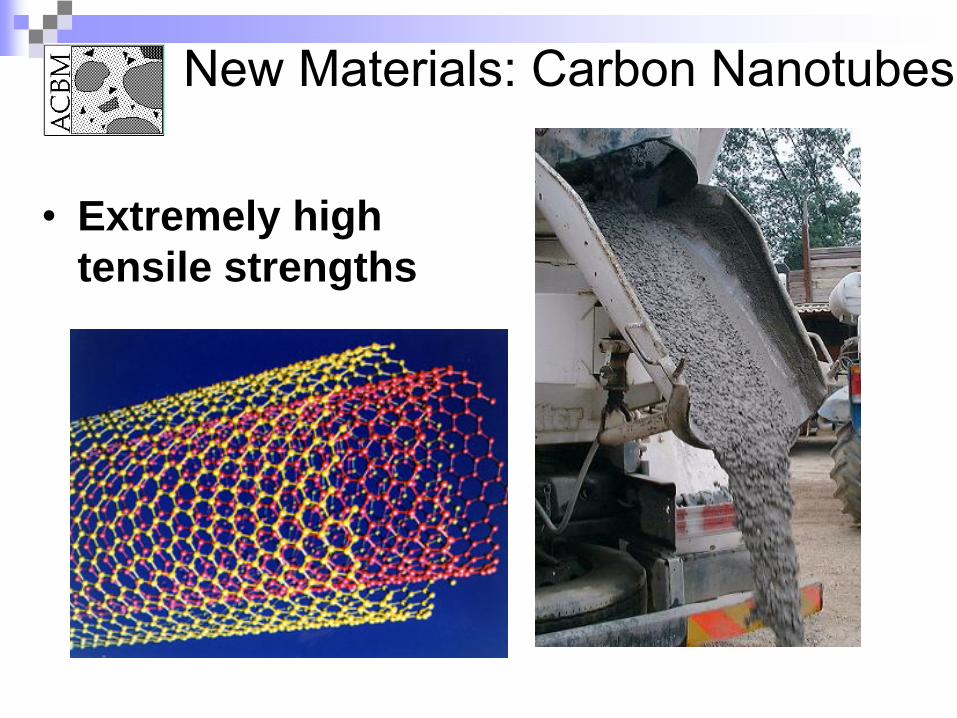
• Extremely hightensile strengths
New Materials: Carbon Nanotubes
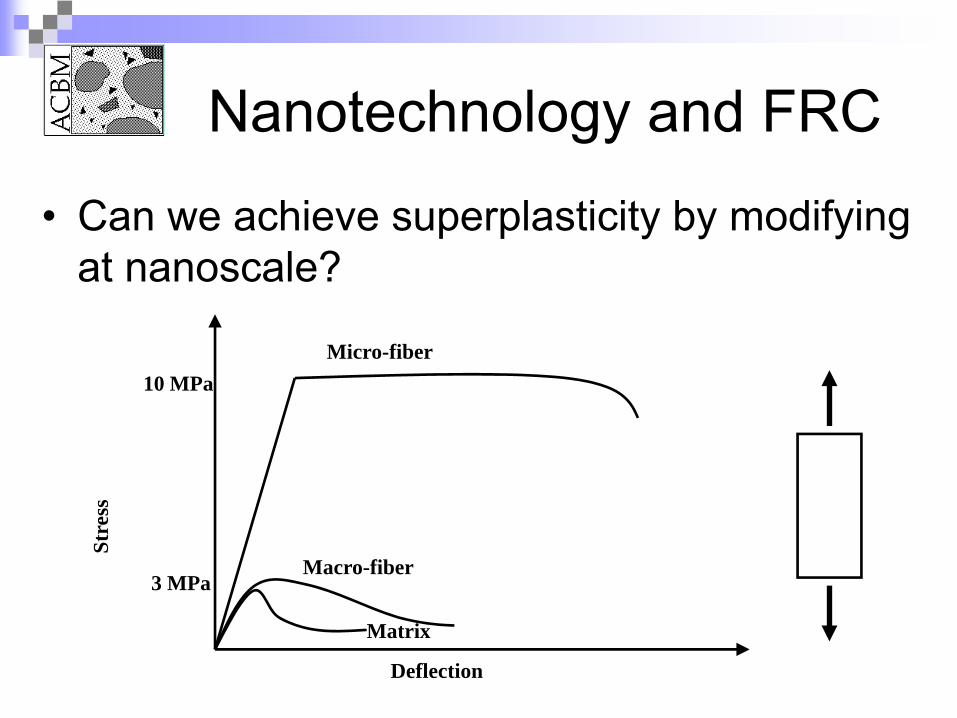
Deflection
Macro-fiber
Micro-fiber
Matrix
10 MPa
3 MPa
Stre
ssNanotechnology and FRC
• Can we achieve superplasticity by modifying at nanoscale?
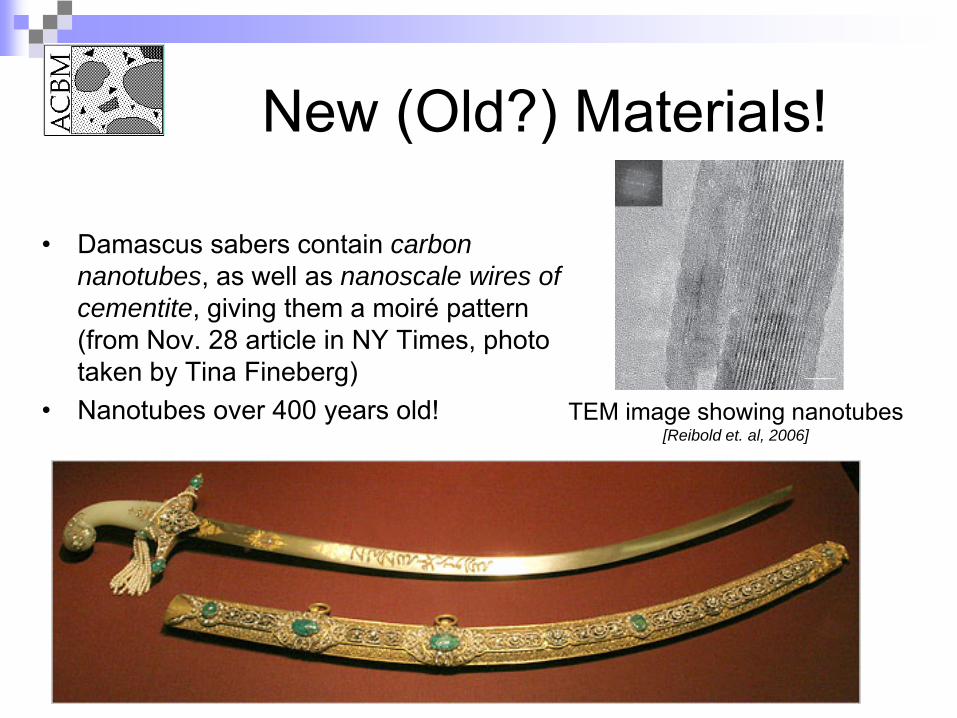
New (Old?) Materials!
• Damascus sabers contain carbon nanotubes, as well as nanoscale wires of cementite, giving them a moiré pattern (from Nov. 28 article in NY Times, photo taken by Tina Fineberg)
• Nanotubes over 400 years old! TEM image showing nanotubes[Reibold et. al, 2006]

Thank you!

Acknowledgements


![Advances in Cancer Research [Vol 99] (Elsevier, 2008) WW](https://img.pdfslide.us/doc/110x75/613caa549cc893456e1e96f6/advances-in-cancer-research-vol-99-elsevier-2008-ww.jpg)