Embed Size (px)
Citation preview
Contents
October, 2016
ISSN 1983-4195
Volume 9, Number 5
REVISTA IBRACON DE ESTRUTURAS E MATERIAISIBRACON STRUCTURES AND MATERIALS JOURNAL
Experimental evaluation of the interaction between strength concrete block walls under vertical loadsL. O. CASTRO, R. C. S. S. ALVARENGA, R. M. SILVA and J. C. L. RIBEIRO
Safety variability assessment of reinforced concrete beams subjected to bending moment considering the NBR 6118:2014 safety partial factorsC. G. NOGUEIRA and M. D. T. PINTO
Behavior predictions of deep beams with short straight bar anchorages using strut-and-tie models and nonlinear analysisR. A. SOUZA and S. BREÑA
A survey of the mechanical properties of concrete for structural purposes prepared on construction sitesR. R. J. RIBEIRO, H. J. F. DIÓGENES, M. V. NÓBREGA and A. L. H. C. EL DEBS
The bond stress x slipping relationshipM. T. G. BARBOSA and E. S. SÁNCHEZ FILHO
Mortar modified with sulfonated polystyrene produced from waste plastic cupsL. A. C. MOTTA, J. G. VIEIRA, T. H. OMENA, F. A. C. FARIA, G. RODRIGUES FILHO and R. M. N. ASSUNÇÃO
Influence of the cable´s layout on the shearing resistance of prestressed concrete beamsO. A. SOUZA JUNIOR and D. R. C. OLIVEIRA
Experimental analysis of reinforcing columns of reinforced concrete, with anchor steel boltsA. C. MESQUITA, A. S. ROCHA, R. G. DELALIBERA and W. A. DA SILVA
0
5
25
75
95
100
Capa
sexta-feira, 23 de setembro de 2016 11:44:50
© 2016 IBRACON
Volume 9, Number 5 (October 2016) p. 710 - 721 • ISSN 1983-4195http://dx.doi.org/10.1590/S1983-41952016000500004
© 2016 IBRACON
Behavior predictions of deep beams with short straight bar anchorages using strut-and-tie models and nonlinear analysis
Previsão do comportamento de vigas-parede com comprimentos reduzidos de ancoragem utilizando modelos de escoras e tirantes e análises não-lineares
a State University of Maringá, Department of Civil Engineering, , Maringá, PR;b University of Massachusetts Amherst, Department of Civil and Environmental Engineering, Amherst, MA, United States of America.
Received: 09 Jun 2015 • Accepted: 14 Apr 2016 • Available Online: 23 Sep 2016
R. A. SOUZA a
S. BREÑA b
Abstract
Resumo
This paper investigates the laboratory test results of 12 deep beams available in the literature, where the longitudinal reinforcement was anchored into the support using short straight bar anchorages. Four different specimen groups with three different shear span-to-depth ratios (a/d) were selected and most of the deep beams failed by strut crushing after yielding of the main longitudinal reinforcement. In order to investigate the be-havior of the selected deep beams, an enhanced strut-and-tie model assuming geometrical adaptability (possibility of update in the dimensions of the struts and ties as the main tie starts to yield) is proposed. The analytical results obtained using this approach may be considered as much as accurate than some conducted complex nonlinear analysis considering smeared fixed cracking model and bond-slip behavior. However, an improvement on the effective strength factor of bottle-shaped struts by means of an iterative strut-and-tie model is needed, once the effective strength factor prescribed by NBR6118 (2014) has shown to be over conservative for all ranges of span-to-depth ratio (a/d) investigated. Finally, the obtained results indicated that short bar anchorages did not seem to influence significantly the shear strength of the deep beams investigated, especially the strength of bottled-shaped struts when appropriate crack control reinforcement is present.
Keywords: deep-beams, strut-and-tie model, nonlinear analysis.
O presente artigo tem por objetivo investigar os resultados experimentais de 12 vigas-parede em que as armaduras longitudinais foram ancora-das com comprimentos reduzidos de ancoragem junto aos apoios. Quatro grupos de testemunhos com três relações distintas entre o vão e a al-tura útil (a/d) foram selecionados, observando que a maioria das vigas-parede chegaram à ruína devido ao esmagamento das escoras logo após o escoamento das armaduras longitudinais. De modo a investigar o comportamento das vigas-parede selecionadas, um modelo aperfeiçoado de escoras e tirantes assumindo adaptabilidade geométrica (possibilidade de atualização das dimensões das escoras e dos tirantes conforme a ar-madura principal começa a escoar) foi desenvolvido. As respostas analíticas obtidas utilizando o procedimento proposto podem ser consideradas tão apuradas quanto respostas numéricas obtidas utilizando análises não-lineares com o modelo de fissuração distribuída acoplado a relações constitutivas para aderência/escorregamento entre concreto e armaduras. No entanto, apesar das respostas analíticas obtidas serem apuradas, observou-se que há necessidade de melhoria no parâmetro que afeta a resistência efetiva de escoras garrafa pela NBR6118 (2014), uma vez que o parâmetro atualmente prescrito pela norma brasileira revelou-se muito conservativo para todas as relações a/d investigadas. Finalmente, os resultados obtidos indicam que os comprimentos reduzidos de ancoragem utilizados aparentemente não influenciaram de maneira significativa a resistência ao cisalhamento das vigas-parede investigadas, especialmente se as escoras garrafas encontravam-se adequadamente controladas por armaduras de controle de fissuração.
Palavras-chave: vigas-parede, modelos de escoras e tirantes, análise não-linear.
1. Introduction
Schlaich et al. [1] suggested the idea of subdividing a struc-ture into ‘‘B-Regions’’ and ‘‘D-Regions’’, in order to develop a rational procedure to design reinforced/prestressed concrete structures. On the one hand, ‘‘B-Regions’’ are those areas in a structural element where one can follow the ‘‘Bernoulli Hypoth-esis’’, i.e., the hypothesis that linear strains can be assumed through the whole cross section, from the beginning of the load-ing to the failure of the section. On the other hand, ‘‘D-Regions’’ are areas where non-linear deformations occur throughout the cross section and the usual design procedures based on the ‘‘Beam Theory’’ become inadequate and even unsafe if applied. In these regions, usually corresponding to sudden changes in geometry or loading, there is a complex stress state mainly gen-erated by shear deformations. As examples of ‘‘D-Regions’’ the following parts of a structure may be mentioned: pile caps, foot-ings, deep beams, corbels, dapped end beams, areas around openings or changes in depth, and prestressing reinforcement anchorage zones.Generally, ‘‘D-Regions’’ are produced by concentrated and/or geo-metric perturbations, and the length of these discontinuity regions may be found using the Saint Venant’s Principle, i.e., the zones of dissipation of perturbations are usually defined based on the height of the member. In this way, deep beams may be considered discontinuity regions (‘‘D Regions’’) entirely, and the application of the Beam Theory is not adequate.Based on the fact that the Beam Theory is not appropriate for de-signing “D Regions”, NBR6118 [2] has positively introduced some important guidance and parameters for the appropriate develop-ment of strut-and-tie models. Strut-and-tie models are constructed using an assembly of compression (struts) and tension (ties) mem-bers connected at joints (nodes) to represent the real stress field in a structural member (or a portion of it) in a simplified manner. The parameters included in NBR6118 [2] mainly pertain to the effective strength to be assumed for concrete struts under different stress levels. The introduction of this minimum guidance follows provi-sions contained in other structural codes around the world, as for example: ACI318-14 [3], EC2 [4] and FIB MC [5]. The effective strength of concrete recommended by the Brazilian code may be considered as the product of an effective factor (n) by the design compressive strength of the concrete (fcd). Further-more, the effective factor (n) may be defined as the product of a variable parameter m (based on the type of strut or node) and the fragility parameter av2 (based on the compressive strength of the concrete). In the Brazilian Code, the parameter m may assume three different values (0,85; 0,72; and 0,60) depending on the kind of strut or node to be designed. As the level of transverse tensile stress increases in the strut/node the parameter m decreases. For prismatic struts or nodes where only struts meet (CCC nodes), i.e., elements where the level of transverse tensile stress may be neglected, Brazilian code suggests the following effective strength for design:
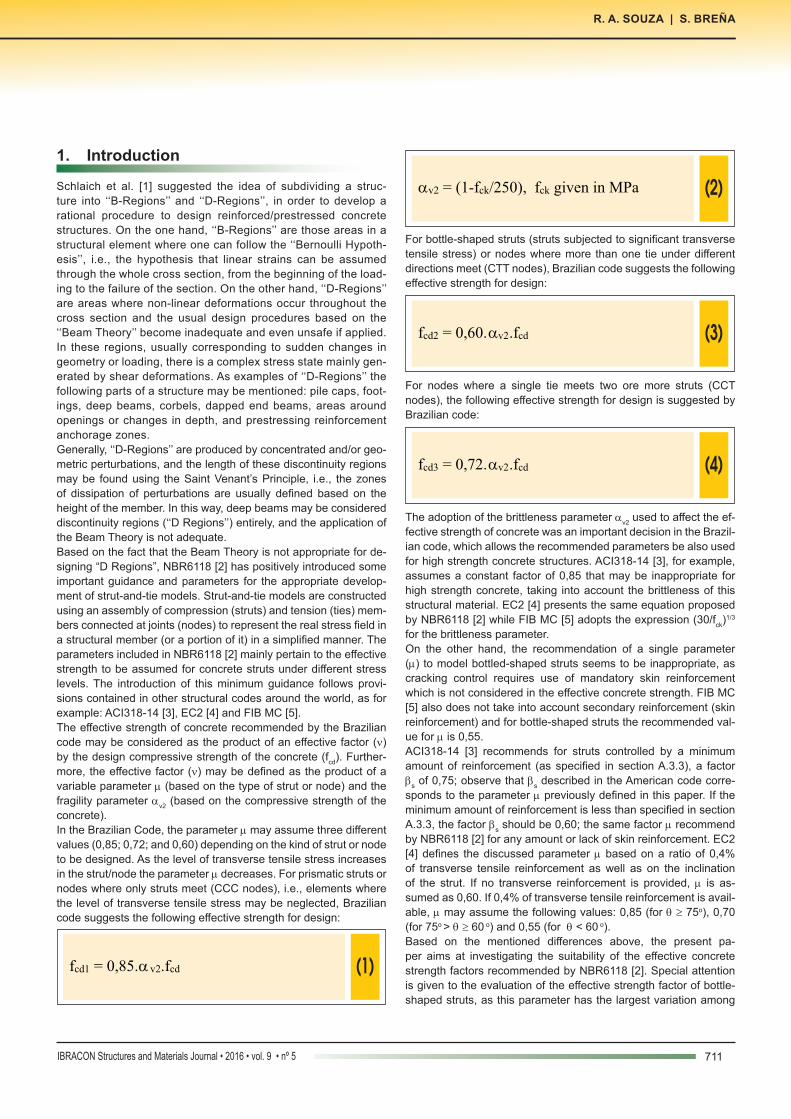
(1)fcd1 = 0,85.a v2.fcd
(2)av2 = (1-fck/250), fck given in MPa
For bottle-shaped struts (struts subjected to significant transverse tensile stress) or nodes where more than one tie under different directions meet (CTT nodes), Brazilian code suggests the following effective strength for design:
(3)fcd2 = 0,60.av2.fcd
For nodes where a single tie meets two ore more struts (CCT nodes), the following effective strength for design is suggested by Brazilian code:
(4)fcd3 = 0,72.av2.fcd
The adoption of the brittleness parameter av2 used to affect the ef-fective strength of concrete was an important decision in the Brazil-ian code, which allows the recommended parameters be also used for high strength concrete structures. ACI318-14 [3], for example, assumes a constant factor of 0,85 that may be inappropriate for high strength concrete, taking into account the brittleness of this structural material. EC2 [4] presents the same equation proposed by NBR6118 [2] while FIB MC [5] adopts the expression (30/fck)1/3 for the brittleness parameter.On the other hand, the recommendation of a single parameter (m) to model bottled-shaped struts seems to be inappropriate, as cracking control requires use of mandatory skin reinforcement which is not considered in the effective concrete strength. FIB MC [5] also does not take into account secondary reinforcement (skin reinforcement) and for bottle-shaped struts the recommended val-ue for m is 0,55.ACI318-14 [3] recommends for struts controlled by a minimum amount of reinforcement (as specified in section A.3.3), a factor bs of 0,75; observe that bs described in the American code corre-sponds to the parameter m previously defined in this paper. If the minimum amount of reinforcement is less than specified in section A.3.3, the factor bs should be 0,60; the same factor m recommend by NBR6118 [2] for any amount or lack of skin reinforcement. EC2 [4] defines the discussed parameter m based on a ratio of 0,4% of transverse tensile reinforcement as well as on the inclination of the strut. If no transverse reinforcement is provided, m is as-sumed as 0,60. If 0,4% of transverse tensile reinforcement is avail-able, m may assume the following values: 0,85 (for q ≥ 75o), 0,70 (for 75o > q ≥ 60 o) and 0,55 (for q < 60 o).Based on the mentioned differences above, the present pa-per aims at investigating the suitability of the effective concrete strength factors recommended by NBR6118 [2]. Special attention is given to the evaluation of the effective strength factor of bottle-shaped struts, as this parameter has the largest variation among
711IBRACON Structures and Materials Journal • 2016 • vol. 9 • nº 5
R. A. SOUZA | S. BREÑA

712 IBRACON Structures and Materials Journal • 2016 • vol. 9 • nº 5
Behavior predictions of deep beams with short straight bar anchorages using strut-and-tie models and nonlinear analysis
all the possible parameters. In order to conduct this evaluation, laboratory test results of 12 deep beams in which the longitudinal reinforcement was anchored into the support using short straight bar anchorages were selected. The tests are fully described by Roy & Breña [6] and Breña & Roy [7].
The obtained results show that behavior predictions of deep beams using the recommendations of NBR6118 [2] may be compared to simulations applying complex nonlinear analysis. However, the ef-fective strength factor to be applied to bottle-shaped struts con-trolled with crack control reinforcement must be updated, once the
Figure 1 – Specimen geometry, reinforcement and experimental test setup for the deep beams tested by BREÑA & ROY (2009)
Side viewBA
Group 1.0 and 1.0L Group 1.5 Group 2.0B B BB C D

713IBRACON Structures and Materials Journal • 2016 • vol. 9 • nº 5
R. A. SOUZA | S. BREÑA
actual proposed value seems to be more appropriate for bottle-shaped struts with no reinforcement or skin reinforcement below a minimum ratio.
2. Selected results of deep beams with short anchorages
Twelve simply supported deep beams subjected to a single con-centrated load at midspan, having three different shear span to effective depth ratios (a/d) and at least three different anchorage lengths of the main longitudinal reinforcement at the support for each a/d were selected from the researches described by Roy & Breña [6] and Breña & Roy [7]. The beams were divided into four groups depending on their a/d (1,0; 1,5 or 2,0) and size of main longitudinal reinforcing bars (bar #5 corresponding to a diameter of about 16 mm and bar #6 corresponding to a diameter of about 19 mm). The span in all beams was equal to 1,22 m and specimens were subjected to a single concentrated force at midspan. Thick steel plates (25 mm) were placed below the loading point and above reaction points to avoid localized crushing at the nodal zones. The beam supports consisted of a pin (test end of beam; straight an-chorage) and a roller (far end of beam; hooked anchorage) in all tests. A 445 kN (100 kip) load cell was placed underneath each support to measure reactions throughout the tests and external/internal instrumentation was placed at selected locations in the specimens. The main variable in each group of beams was the anchorage con-dition of longitudinal bars over one of the supports. On the test side (left side), the longitudinal reinforcement was continued for different distances past the support node in the various specimens (straight bar anchorage). Longitudinal reinforcement on the far side (right side) of the beams was anchored past the support using a standard 90-degree hook to preclude anchorage failures on that end of the specimens.
Specimen designation was developed to identify the four different groups of beams according to their a/d, longitudinal reinforcing bar size, and straight bar anchorage length on the test end of the beams. The first two digits in the beam designation correspond to the a/d of each beam (1,0; 1,5 or 2,0), and the last three digits correspond to the ratio of provided anchorage length and calcu-lated development length on the test side according to provisions in Chapter 12 of ACI 318-05 [8].Specimen nominal dimensions and reinforcing patterns are shown in Figure [1]. All beams had a nominal width of 152 mm and total depths of 635, 457 or 356 mm for beams with a/d of 1,0; 1,5 or 2,0, respectively. Ten of the 12 specimens had two #5 bars as bot-tom longitudinal reinforcement (Groups 1.0, 1.5 and 2.0), and the remaining two were reinforced with two No. 6 bars (Group 1.0L). The average yield stress measured for #5 and #6 bars was 492 and 469 MPa, respectively. An average peak stress measured for #5 and #6 bars was 758,5 and 709,5 MPa, respectively. Top re-inforcement for all beams consisted of two #3 bars used for con-structability of the beam reinforcing cage.Longitudinal reinforcement was anchored past the support plate using either a straight bar anchorage or a hooked bar anchorage as shown in Figure [1]. Anchorage length of the longitudinal rein-forcement was measured as the distance between the point where the bars leave the extended nodal zone (Fig. RA.1.6 in ACI 318-05 [8]), and the end of the bar as required in Section A.4.3.2 of ACI 318-05 [8]. The length of the beam extending past the support on the left side varied depending on the provided anchorage length of longitudinal reinforcement. This distance, labeled as O1 in Figure [1], is listed in Table [1] for all specimens.Web reinforcement conformed with requirements in section A.3.3 of ACI 318-05 [08] and consisted of vertical stirrups and horizontal bars formed using deformed D4 wire (this bar corresponds to a diameter of about 5,7 mm) with an average measured yield stress equal to 605 MPa and average measured peak stress equal to 643,2 MPa. Horizontal secondary reinforcement corresponded to
Table 1 – Specimen geometry and reinforcement of the deep beams
a/d Specimen fcm (MPa) ftm
b(cm)
As,long (cm2)
As,vert(cm2/m)
O1 (mm)
Pyield(kN)
Ppeak(kN)
Failuremode
1.0
DB1.0-1.00 33,3 2,4 16,5 4,00 4,65 54,6 471 677 Strut-S
DB1.0-0.75 31,7 2,7 17,3 4,00 4,65 38,7 480 743 Strut-H
DB1.0-0.50 30,6 2,4 15,7 4,00 4,65 22,2 476 729 Strut-H
DB1.0-0.32 27,0 2,3 15,2 4,00 4,65 7,0 467 667 Strut-S
1.0LDB1.0-0.75L 29,9 2,7 15,5 5,68 4,65 41,3 645 741 Strut-H
DB1.0-0.28L 29,4 2,8 15,5 5,68 4,65 7,6 - 642 Anchorage
1.5
DB1.5-0.75 32,7 2,3 15,5 4,00 3,80 29,5 307 459 Strut-S
DB1.5-0.50 34,1 2,4 15,2 4,00 3,80 16,5 294 423 Strut-H
DB1.5-0.38 33,8 2,1 15,2 4,00 3,80 7,0 294 427 Anchorage
2.0
DB2.0-0.75 34,7 2,9 15,5 4,00 3,80 26,0 200 313 Strut-H
DB2.0-0.50 33,0 3,1 15,5 4,00 3,80 11,4 214 297 Strut-H
DB2.0-0.43 35,6 2,6 15,5 4,00 3,80 7,0 209 266 Anchorage
Note: S is strut crushing observed on test end (straight anchorage) of specimen; and H is strut crushing observed on far end (hooked anchorage) of specimen.

714 IBRACON Structures and Materials Journal • 2016 • vol. 9 • nº 5
Behavior predictions of deep beams with short straight bar anchorages using strut-and-tie models and nonlinear analysis
Figure 2 – Suggested strut-and-tie model for strength evaluation (BREÑA & ROY (2009))
Strut geometry and forcesBA
Bottom node detail Top node detailB BB C

715IBRACON Structures and Materials Journal • 2016 • vol. 9 • nº 5
R. A. SOUZA | S. BREÑA
a reinforcement ratio of about 0,16% for group 1.0 and 1.0L, 0,15% for group 1.5 and 0,09% for group 2.0. By another hand, vertical secondary reinforcement corresponded to a reinforcement ratio of 0,37% for groups 1.0 and 1.0L and 0,25% for groups 1.5 and 2.0.Just before testing each beam, specimen dimensions were veri-fied and companion concrete cylinders were tested to determine the as-built geometry of the beams and the actual strength of concrete. Due to formwork flexibility, the actual width of the beams varied slightly from the nominal value of 15,2 cm. The measured concrete compressive/tensile strength along with the as-built width of each specimen at the time of testing is listed in Table [1]. This table also shows reinforcement configuration, pro-vided anchorage length on the test side of the beams, yielding/peak loads and failure modes observed in the tests.
3. Evaluationoftheeffectivestrength factor of bottle-shaped struts
As mentioned before, NBR6118 [2] does not make a distinction in the effective strength of bottle-shaped struts that contain or lack minimum skin reinforcement. Therefore, the effective strength proposed (fcd2) for this kind of strut may be underestimated when adequate skin reinforcement is provided. Based on this fact, the present section aims to evaluate the accuracy of the effective strength factor for bottle-shaped struts proposed by NBR6118 [2] taking into account the experimental results obtained by Roy & Breña [6] and Breña & Roy [7].A tied-arch strut and tie model consistent with the peak measured loads and based on the procedure proposed by Wight & Parra-Montesinos [9], was slightly modified in order to estimate the ef-fective strength of the bottle-shaped struts using the parameters recommend in NBR6118[2]. In this model, the strut inclination angle and width are determined iteratively. The geometry of the tied-arch model was established so that node strength was ob-served in the nodal region of the beam, as shown in Figure [2]. For compatibility between code and experimental results, fck is as-sumed equal to fcm, since the partial safety factor (γc) is assumed equal to 1,0.From symmetry of the test setup, the total applied force on the beams resulted in equal shear force transferred to each support. The force in the direct strut forming between load and support in the tied-arch model is FS = V/sina, where a is the angle of inclina-tion of the strut with the tie. The angle a depends on the horizon-tal distance between the resultant of one-half of the applied force and the support (56 cm) and the vertical distance between the top and bottom chords in the model (z), Figure [2]. The top-node height hnode-top was initially assumed equal to 5,0 cm to initiate iterations. After determining FS (force acting in the diagonal strut) for the initial a, the top horizontal compressive force (FC) was calculated as FC = FS.cosa. This force (Equation [4]) was then equated to the nominal strength of the top node (Fnn) required to solve for the top-node height (Equation [5]) to avoid node crushing:
(5)Fnn = fcd1.Anz = 0,85.av2.fcd.Anz =
0,85.av2.b.hnode-top = FC
(6)a
a
...85,0
cos
. 21 bf
F
bf
Fh
cdv
S
cd
Ctopnode
aa
ga
a
tan....85,0...85,0
cos
22
bf
V
bf
F
cmv
c
ckv
S =
===-
The depth from top to bottom chords in the model, z, was then revised and a new strut angle a was determined to avoid nodal failure:
(7)2
topnodehdz --=
Iterations were conducted until hnode-top was approximately the same in three subsequent calculation cycles. In all iterations, the height of the bottom node was assumed equal to 102 mm, twice the distance between the bottom face of the beams and the cen-troid of the bottom longitudinal reinforcement. Once convergence was achieved and an appropriate strut inclination was found, the top and bottom widths of the diagonal strut were determined using Equation [7], based on ACI 318-14 [3]:
(8)wstrut = Lplate.sina + hnode.cosa
where the plate widths and node heights used for the top and bot-tom nodes in the previous equation corresponded to those shown in Figure [2]. Because the bottom plate is wider than half the top plate, the top end of the diagonal strut ended up governing strut strength in all the specimens. This is consistent with the location of observed concrete spalling near the top of the struts in all speci-mens that failed by strut crushing (Roy & Breña [6], Breña & Roy [7]). The stress at the top end of the diagonal strut was then calcu-lated using Equation [8]:
(9)
bw
Ff
tops
Sstrut
-
=
where the as-built width of the specimens, b, was used and ws-top is the width of the strut determined before at the top node. Table 2 presents the effective strength of the diagonal bottle-shaped struts according to NBR6118[2] and also based on the test results. As one can see, the effective strength (fcd2 = 0,60.av2.fcd) recommended by NBR6118 [2] is significantly lower than the aver-age effective strength derived from the experimental results (fce = m.av2.fcd = 0,82.av2.fcd). The effective strength of the tested bottle-shaped struts has an average value 35% higher than the effective strength proposed by NBR6118[2].

716 IBRACON Structures and Materials Journal • 2016 • vol. 9 • nº 5
Behavior predictions of deep beams with short straight bar anchorages using strut-and-tie models and nonlinear analysis
The obtained results indicate that the parameter m = 0,60 as-sumed by NBR6118 [2] for bottled-shaped struts, underestimates the strength of diagonal struts that contain crack control reinforce-ment, being more appropriate for situations where bottle-shaped struts are not controlled by minimum skin reinforcement specified in ACI 318-14 [3]. In this way, Brazilian code could introduce an additional value for fcd2 (0,80.av2.fcd, for example), intended for situ-ations where bottle-shaped struts are controlled by minimum crack control reinforcement. Ratios of 0,15%, for vertical and horizontal directions, seems to be appropriate, taking into account the ob-tained results and additional information provided in ACI 318-14 [3] and EC2 [4].
4. Strut-and-tie model to predict yielding and failure loads
In order to extend the investigation of the experimental results, the simple strut-and-tie model presented in Figure [2.a] is again required. Using the procedures recommend by NBR6118[2] it is possible to obtain the analytical yielding and failure loads of the tested deep beams. However, improved procedures based on a better estimation of the effective strength of bottle-shaped struts are needed as discussed below.The strut-and-tie model presented in Figure [2.a] is slightly modified in order to permit defining variable dimensions for the struts and nodal regions. In this reformulated model, the major challenge is the determination of the height of the top horizontal strut (hnode,top). Once this value is known all the other parameters may be easily found using geometry and equilibrium conditions. Assuming that the force in the top strut (FC) must be equal to the maximum force in the main tie (FT), it is possible to determine the height (hnode,top) of the top node and the shear force (V) that generates yielding of the main tie.
Once hnode,top is determined, it is possible to verify strength in all components of the model (nodes, struts, etc.) using the effective strengths recommended by NBR6118 [2]. In this way, estimates of the maximum loads in each component can be obtained by deter-mining the maximum nominal forces acting at the boundaries of the following: top horizontal strut (“prismatic strut”), diagonal strut (“bottle-shaped strut”), bottom node (“CCT node”) and top node (“CCC node”).It must be highlighted that the maximum loads obtained for the di-agonal and horizontal struts as well as some nodes may be not re-alistic in some situations, especially if they are dependent on hnode-
top. For simplicity, hnode,top is now determined based on the nominal yield force acting in the main tie. However, for a real situation, the value of hnode,top can be larger if needed based on development of higher forces in the main reinforcement because of strain harden-ing; this increased height can only be developed if enough space is available in the deep beam. Assuming a bilinear behavior for the reinforcement, after the main tie yields, the height of the top node (hnode-top) may increase to sat-isfy equilibrium with the main tie if bars are stressed to their peak stress. In this way, it is of interest to calculate the maximum bound-ary forces when the main tie is subjected to the rupture force. This procedure gives rise to an enhanced strut-and-tie model and pro-vides more realistic failure loads for struts and nodes whose di-mensions are dependent on hnode-top. Using the maximum stress of the reinforcement to determine tie forces is valid as long as the material has sufficient deformation capacity beyond its peak stress to avoid brittle failure that would violate a basic principle in the theory of plasticity upon which strut and tie models are based. It must also be highlighted that components of the strut and tie model that are not dependent on hnode-top (maximum reaction in the load bearing plates and maximum force in the main tie, for example),
Table 2 – Bottle-shaped strut strength evaluation according to NBR6118 (2014)
a/d Specimen av2
V(kN)
b(cm)
a(o)
hnode,top(cm)
ws,top(cm)
fcd2(MPa)
fe(MPa)
fe/fcd2
m
1.0
DB1.0-1.00 0,87 338 16,5 44,20 7,30 12,27 17,32 23,94 1,38 0,83
DB1.0-0.75 0,87 371 17,3 44,01 8,02 12,79 16,61 24,14 1,45 0,87
DB1.0-0.50 0,88 365 15,7 43,74 9,05 13,52 16,11 24,87 1,54 0,93
DB1.0-0.32 0,89 334 15,2 43,60 9,58 13,90 14,45 22,92 1,59 0,95
1.0LDB1.0-0.75L 0,88 371 15,5 43,61 9,55 13,88 15,79 25,01 1,58 0,95
DB1.0-0.28L 0,88 320 15,5 43,95 8,26 12,95 15,57 22,97 1,48 0,89
1.5
DB1.5-0.75 0,87 229 15,2 33,06 8,14 12,34 17,05 22,39 1,31 0,79
DB1.5-0.50 0,86 211 15,2 33,41 7,15 11,53 17,67 21,87 1,24 0,74
DB1.5-0.38 0,86 214 15,2 33,35 7,32 11,67 17,54 21,95 1,25 0,75
2.0
DB2.0-0.75 0,86 156 15,5 25,57 7,04 10,71 17,93 21,77 1,21 0,73
DB2.0-0.50 0,87 149 15,5 25,58 7,01 10,68 17,19 20,84 1,21 0,73
DB2.0-0.43 0,86 133 15,5 26,10 5,74 9,60 18,32 20,33 1,11 0,67
Mean 1,35 0,82
SD 0,16 0,10
CV 0,12 0,12

717IBRACON Structures and Materials Journal • 2016 • vol. 9 • nº 5
R. A. SOUZA | S. BREÑA
may end up governing the strength of the model if they reach the limiting stress at a lower load than one obtained for components that are affected by hnode,top. Table [3] summarizes the maximum analytical loads using the pro-posed strut and tie-model, taking into account that the height of the top horizontal strut (hnode,top) is determined based on yielding (lower bound value for hnode,top) or maximum force in the main tie (upper bound value for hnode,top). For convenience, again fck was assumed as fcm and the partial safety factor (γc) was assumed as equal 1,0. As one can see, if the parameter m = 0,60 is used for the bottle-shaped strut, the average failure load calculated using the pro-posed methodology and NBR6118 [2] will be conservative and will present an average value of 0,77 between the predicted failure loads and the experimental failure loads (please refer to column (6) of Table [3]). On the other hand, if a higher value m = 0,80 is selected (based on the results discussed in the previous section), the failure predictions will also be conservative, but now with an average value of 0,81 between the predicted failure loads and the experimental failure loads (please refer to column (8) of Table [3]). The yield load of the specimens is independent of the parameter m, and the proposed model resulted in a conservative prediction of yield force as an average ratio of 0,89 between the predicted yield-ing loads and the experimental yielding loads indicates.As an example, Appendix A presents the detailed calculations for specimen DB1.0-1.00 using the proposed strut-and tie model, ob-serving that the proposed routine was programmed in the pack-age software MATLAB in order to provide fast responses for the tested specimens.
5. Nonlinear analysis
The deep beams tested by Roy & Breña [6] and Breña & Roy [7] were also studied using nonlinear finite element analysis using the software package ATENA2D. Several models and solvers were tested and the best results were obtained using the model SBETA for concrete that uses a fixed crack assumption. The default pa-rameters defined in the software were assumed, in order to check the real performance of the software without calibration of the large list of parameters available in the tool. More information regarding the software selected may be found in Cervenka [10,11].Tested deep beams were modeled using macroelements dis-cretized by CCIsoQuad type elements. Vertical point load was applied at the top of the deep beam and pinned supports were defined at the bottom in order to simulate the experimental setup. Vertical loading and support conditions were applied in the support steel plates that have a Young’s modulus of 210 GPa and Pois-son’s ratio of 0,3. Reinforcement properties were defined based on the experimen-tal results using a bilinear model. In most practical cases, bond is not a significant effect because the bond strength is only seldom reached. However, in the present investigation, reduced anchor-age length was used and bond strength was supposed to affect the final strength of the specimens. For this reason, adherence based on the bond model of Bigaj [12] was defined only for the main tie (bars # 5 and #6) while the other reinforcement in the beams was defined assuming perfect adherence.
Table 3 – Comparison between experimental results and the proposed strut-and-tie model
a/d Specimen
Yielding Failure
Py,EXP (kN)(1)
Py,NBR (kN)(2)
Py,NBR/ Py,EXP(3)
Pu,EXP (kN)(4)
m = 0,60 m = 0,80
a(o)
hnode,top(cm)
ws,top(cm)
fcd2(MPa)
1.0
DB1.0-1.00 471 392 0,83 677 472 0,70 518 0,77
DB1.0-0.75 480 392 0,82 743 471 0,63 518 0,70
DB1.0-0.50 476 389 0,82 729 434 0,60 513 0,70
DB1.0-0.32 467 386 0,83 667 395 0,59 507 0,76
1.0LDB1.0-0.75L 645 – – 741 627 0,85 627 0,85
DB1.0-0.28L – – – 642 617 0,96 617 0,96
1.5
DB1.5-0.75 307 266 0,87 459 331 0,72 348 0,76
DB1.5-0.50 294 267 0,91 423 339 0,80 350 0,83
DB1.5-0.38 294 267 0,91 427 337 0,79 350 0,82
2.0
DB2.0-0.75 200 196 0,98 313 253 0,81 255 0,81
DB2.0-0.50 214 195 0,91 297 247 0,83 253 0,85
DB2.0-0.43 209 196 0,94 266 254 0,95 255 0,96
Mean 0,88 Mean 0,77 Mean 0,81
SD 0,06 SD 0,12 SD 0,08
CV 0,06 CV 0,16 CV 0,10
Note: S is strut crushing observed on test end (straight anchorage) of specimen; and H is strut crushing observed on far end (hooked anchorage) of specimen.
718 IBRACON Structures and Materials Journal • 2016 • vol. 9 • nº 5
Behavior predictions of deep beams with short straight bar anchorages using strut-and-tie models and nonlinear analysis
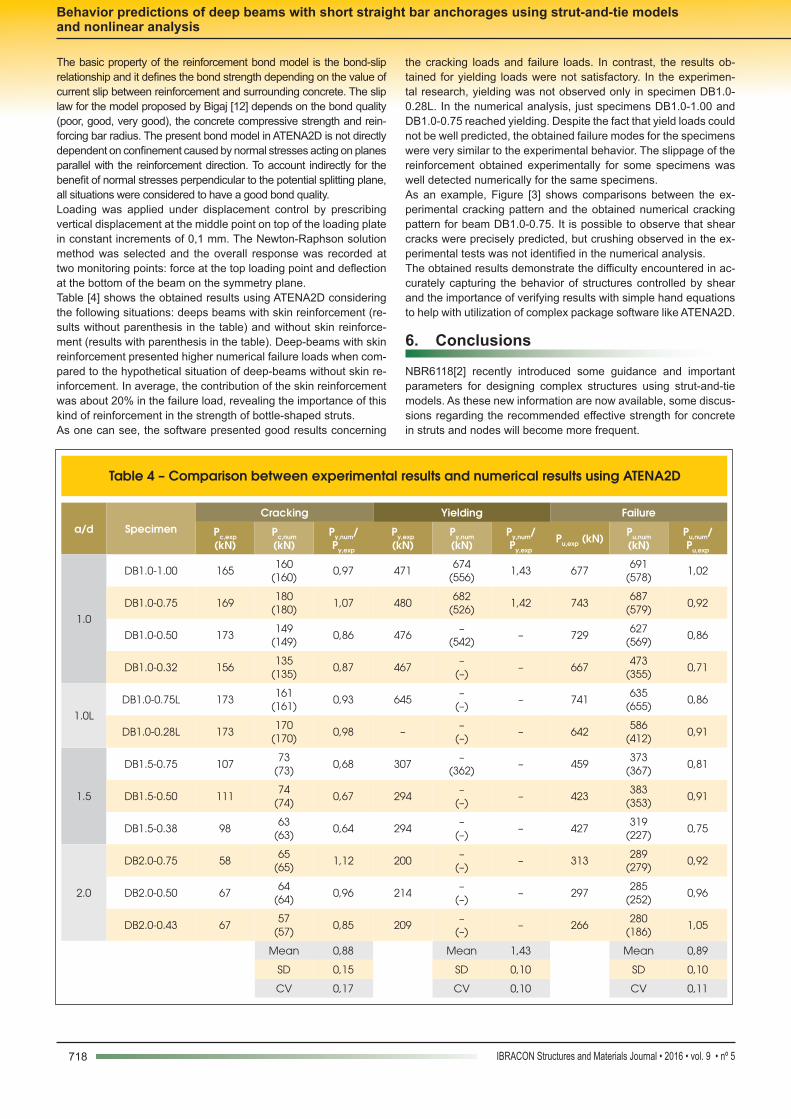
The basic property of the reinforcement bond model is the bond-slip relationship and it defines the bond strength depending on the value of current slip between reinforcement and surrounding concrete. The slip law for the model proposed by Bigaj [12] depends on the bond quality (poor, good, very good), the concrete compressive strength and rein-forcing bar radius. The present bond model in ATENA2D is not directly dependent on confinement caused by normal stresses acting on planes parallel with the reinforcement direction. To account indirectly for the benefit of normal stresses perpendicular to the potential splitting plane, all situations were considered to have a good bond quality. Loading was applied under displacement control by prescribing vertical displacement at the middle point on top of the loading plate in constant increments of 0,1 mm. The Newton-Raphson solution method was selected and the overall response was recorded at two monitoring points: force at the top loading point and deflection at the bottom of the beam on the symmetry plane.Table [4] shows the obtained results using ATENA2D considering the following situations: deeps beams with skin reinforcement (re-sults without parenthesis in the table) and without skin reinforce-ment (results with parenthesis in the table). Deep-beams with skin reinforcement presented higher numerical failure loads when com-pared to the hypothetical situation of deep-beams without skin re-inforcement. In average, the contribution of the skin reinforcement was about 20% in the failure load, revealing the importance of this kind of reinforcement in the strength of bottle-shaped struts.As one can see, the software presented good results concerning
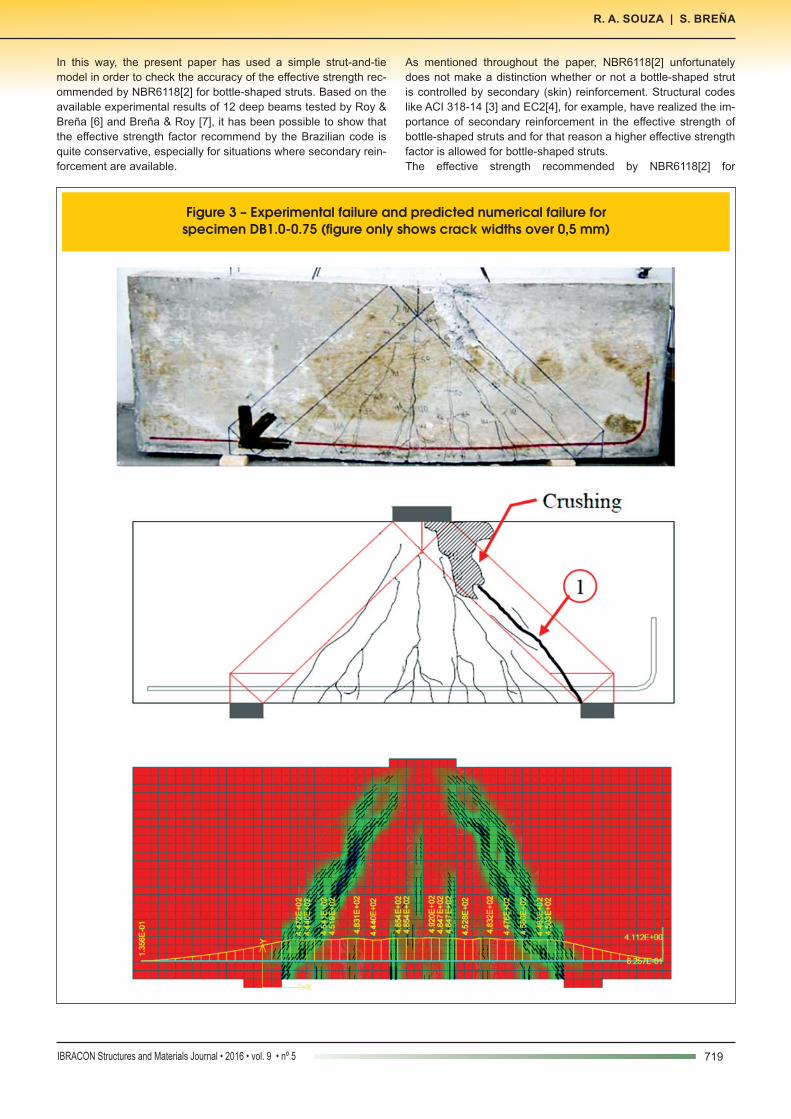
the cracking loads and failure loads. In contrast, the results ob-tained for yielding loads were not satisfactory. In the experimen-tal research, yielding was not observed only in specimen DB1.0-0.28L. In the numerical analysis, just specimens DB1.0-1.00 and DB1.0-0.75 reached yielding. Despite the fact that yield loads could not be well predicted, the obtained failure modes for the specimens were very similar to the experimental behavior. The slippage of the reinforcement obtained experimentally for some specimens was well detected numerically for the same specimens.As an example, Figure [3] shows comparisons between the ex-perimental cracking pattern and the obtained numerical cracking pattern for beam DB1.0-0.75. It is possible to observe that shear cracks were precisely predicted, but crushing observed in the ex-perimental tests was not identified in the numerical analysis. The obtained results demonstrate the difficulty encountered in ac-curately capturing the behavior of structures controlled by shear and the importance of verifying results with simple hand equations to help with utilization of complex package software like ATENA2D.
6. Conclusions
NBR6118[2] recently introduced some guidance and important parameters for designing complex structures using strut-and-tie models. As these new information are now available, some discus-sions regarding the recommended effective strength for concrete in struts and nodes will become more frequent.
Table 4 – Comparison between experimental results and numerical results using ATENA2D
a/d SpecimenCracking Yielding Failure
Pc,exp (kN)
Pc,num (kN)
Py,num/ Py,exp
Py,exp (kN)
Py,num (kN)
Py,num/ Py,exp
Pu,exp (kN) Pu,num (kN)
Pu,num/ Pu,exp
1.0
DB1.0-1.00 165160
(160)0,97 471
674(556)
1,43 677691
(578)1,02
DB1.0-0.75 169180
(180)1,07 480
682(526)
1,42 743687
(579)0,92
DB1.0-0.50 173149
(149)0,86 476
–(542)
– 729627
(569)0,86
DB1.0-0.32 156135
(135)0,87 467
–(–)
– 667473
(355)0,71
1.0L
DB1.0-0.75L 173161
(161)0,93 645
–(–)
– 741635
(655)0,86
DB1.0-0.28L 173170
(170)0,98 –
–(–)
– 642586
(412)0,91
1.5
DB1.5-0.75 10773
(73)0,68 307
–(362)
– 459373
(367)0,81
DB1.5-0.50 11174
(74)0,67 294
–(–)
– 423383
(353)0,91
DB1.5-0.38 9863
(63)0,64 294
–(–)
– 427319
(227)0,75
2.0
DB2.0-0.75 5865
(65)1,12 200
–(–)
– 313289
(279)0,92
DB2.0-0.50 6764
(64)0,96 214
–(–)
– 297285
(252)0,96
DB2.0-0.43 6757
(57)0,85 209
–(–)
– 266280
(186)1,05
Mean 0,88 Mean 1,43 Mean 0,89
SD 0,15 SD 0,10 SD 0,10
CV 0,17 CV 0,10 CV 0,11
719IBRACON Structures and Materials Journal • 2016 • vol. 9 • nº 5
R. A. SOUZA | S. BREÑA
In this way, the present paper has used a simple strut-and-tie model in order to check the accuracy of the effective strength rec-ommended by NBR6118[2] for bottle-shaped struts. Based on the available experimental results of 12 deep beams tested by Roy & Breña [6] and Breña & Roy [7], it has been possible to show that the effective strength factor recommend by the Brazilian code is quite conservative, especially for situations where secondary rein-forcement are available.
As mentioned throughout the paper, NBR6118[2] unfortunately does not make a distinction whether or not a bottle-shaped strut is controlled by secondary (skin) reinforcement. Structural codes like ACI 318-14 [3] and EC2[4], for example, have realized the im-portance of secondary reinforcement in the effective strength of bottle-shaped struts and for that reason a higher effective strength factor is allowed for bottle-shaped struts. The effective strength recommended by NBR6118[2] for
Figure 3 – Experimental failure and predicted numerical failure for specimen DB1.0-0.75 (figure only shows crack widths over 0,5 mm)

720 IBRACON Structures and Materials Journal • 2016 • vol. 9 • nº 5
Behavior predictions of deep beams with short straight bar anchorages using strut-and-tie models and nonlinear analysis
bottle-shaped struts is given by fcd2 = m.av2.fcd = 0,60.av2.fcd. Based on the experimental results, the applied strut-and-tie model has shown that for bottle-shaped struts controlled by skin reinforcement (horizontal and vertical mesh) higher than 0,10%, the strength factor m would be about 0,80. Despite the fact that more data are needed in order to certify the findings of this paper, it is recommended the inclusion of a more appropriate effective strength for bottle-shaped struts controlled by cracking control reinforcement in NBR6118[2]. As the secondary reinforcement is mandatory in wall-type struc-tures, the effective strength of bottle-shaped struts should be more flexible.The enhanced strut-and-tie model proposed in this paper has shown to be as powerful as nonlinear analysis using bond mod-els with the package software ATENA2D. Despite the fact that nonlinear analysis was very effective to predict the global be-havior of the beams, accurately predicting the cracking pattern and positions of slippage of the reinforcement, the obtained re-sults regarding yielding of the reinforcement were not accurate.It should be highlighted that the proposed strut-and-tie model has a small enhancement when compared to the usual strut-and-tie models developed for predicting behavior of deep beams. The proposed strut-and-tie model takes into account the effect of strain hardening of the reinforcement on governing dimensions of struts and ties in the selected model. Unless the main reinforcement suffers rupture at low strains, a force higher than the yielding force is still possible. After yielding, a new arrangement for the dimensions of struts and nodes is possible in the proposed model, simulating in that way the stress redistribution of the structure. The limit for the dimensions of struts and nodes is based on the rupture force of the main tie and a more accurate procedure may be obtained for predicting the peak load after the yielding of the main tie. The classical approach used in the strut-and-tie assumes that when yielding is reached, failure is obtained, and for that reason over conservative results are usually obtained.Basically, the height of the upper horizontal strut is defined based on the force acting in the main tie, i.e., the force sup-posed to cause yielding or rupture of the reinforcement. By consequence, all other necessary dimensions can be automati-cally calculated. With this assumption in hand it is possible to check whether or not the structure will fail by the reinforcement or by the struts or nodes. This very simple procedure has been programmed in MATLAB and conducted to very good accuracy predicting yielding and failure loads of the tested specimens. Finally, the present paper reveals that short bar anchorages did not seem to influence significantly the strength of the deep beams tested experimentally, especially the strength of bottle-shaped struts. Also, the present paper shows that hand calcula-tions based on strut-and-tie models can be very effective with some adaptations, providing fast results and invaluable guid-ance for applying nonlinear analysis with confidence.
7. Acknowledgements
The authors would like to acknowledge the Brazilian govern-ment agency CNPq for the financial support and the University of Massachusetts Amherst by the support during the Post-Doc-toral stage of the first author. The authors also would like to acknowledge Nathan C. Roy who performed the experimental work described within this paper as part of his Masters thesis at the University of Massachusetts Amherst during 2006. The conclusions and opinions expressed in this paper are the au-thors’ responsibility and do not reflect the points of view of the sponsors.
8. References
[1] SCHLAICH, J.; SCHAFER, K.; JENNEWEIN, M.. “Toward a consistent design of reinforced concrete structures”. Jour-nal of Prestressed Concrete Structures, v.32, n.3, pp.74-150, 1987.
[2] ASSOCIAÇÃO BRASILEIRA DE NORMAS TÉCNICAS. “NBR 6118 – Projeto de Estruturas de Concreto - Procedi-mento”, Rio de Janeiro, 2014.
[3] ACI COMMITTEE 318, “Building Code Requirements for Structural Concrete (ACI 318-2014) and Commentary (ACI 318R-2014), APPENDIX A: Strut-And-Tie Models”. American Concrete Institute, Detroit, 2014.
[4] EUROPEAN COMMITTEE STANDARDIZATION. “Eurocode 2 - Design of concrete structures - Part 1-1: General rules and rules for buildings”. London: BSI; 230p, 2004.
[5] FÉDÉRATION INTERNATIONALE DU BÉTON (FIB). “fib Model Code for Concrete Structures 2010”, Lausanne, 402 pp, 2013.
[6] ROY, N. C.; BREÑA, S. F.. “Behavior of Deep Beams with Short Longitudinal Bar Anchorages”, ACI Structural Journal, v.105, n.104, 2008.
[7] BREÑA, S. F.; ROY, N. C.. “Evaluation of Load Transfer and Strut Strength of Deep Beams with Short Longitudinal Bar Anchorages”, ACI Structural Journal, v.106, n.05, 2009.
[8] ACI COMMITTEE 318, “Building Code Requirements for Structural Concrete (ACI 318-2005) and Commentary (ACI 318R-2005), APPENDIX A: Strut-And-Tie Models”. American Concrete Institute, Detroit, 2005.
[9] WIGHT, J. K.; PARRA-MONTESINOS, G.. “Strut and Tie Model for Deep Beam Design,” Concrete International, v. 25, n. 5, May, pp. 63-70, 2003.
[10] CERVENKA, V. & CERVENKA, J.. “ATENA Program Docu-mentation – Part 2-1: User’s Manual for ATENA2D”, Prague, 2003.
[11] CERVENKA, V. & CERVENKA, J.. “ATENA Program Docu-mentation – Part 2-2: User’s Manual for ATENA3D”, Prague, 2005.
[12] BIGAJ, A.. “Structural Dependence of Rotation Capacity of Plastic Hinges in RC Beams and Slabs”. Phd, Delft Univer-sity of Technology, 1999.
9. APPENDIX A
A.1) Initial data for deep beam DB1-1.00:As = 4,0 cm2 (longitudinal steel area of the main tie)fy = 492 MPa (yielding strength of the main reinforcement)fu = 758,5 MPa (ultimate strength of the main reinforcement)b = 16,5 cm (width of the deep beam)d = 58,1 cm (effective depth of the deep beam)fcm = 33,3 MPa (compressive strength of the concrete)hnode-bott = 2.(h-d) = 2.5,40 = 10,80 cm (estimated width of the main tie)Lplate,bott = 11,4 cm (length of the support plate used in the top)Lplate,top = 20,3 cm (length of the support plate used in the bottom)Lbeam = 122 cm (spam of the deep beam between supports)
A.2) Yielding of the main tie (assuming fck = fcm and gc = 1,0):FT = As.fy = 4.49,2 = 196,80 kNFT = FC = 196,80 kNav2 = (1 - fck/250) = (1 - 33,3/250) = 0,87Fns = fcd1.Acs = 0,85.av2.fcd.b.htop,min = FChnode-top = FC /(0,85.av2.fcd.b) = 196,80 / (0,85.0,87.3,33.16,5) = 4,84 cm (minimum height needed)

721IBRACON Structures and Materials Journal • 2016 • vol. 9 • nº 5
R. A. SOUZA | S. BREÑA
z = d - hnode-top/2 = 58,1 - 4,84/2 = 55,68 cma = (Lbeam/2) - (Lplate,top /4) = (122/2) - (20,3/4) = 55,93 cma = arc tg (z/a) = arc tg (55,68/55,93) = 44,87o
FT = FS.cosa → FS = FT/cosa = 196,80/cos 44,87o = 277,68 kNFS = Q/sina → Q = FS.sina = 277,68.sin 44,87o = 195,90 kNQ1y = P1y/2 → P1y = Q1y.2 = 195,63.2 = 391,80 kN (Yielding load for the main reinforcement)
A.3) Failure of the CCT bottom node (m = 0,72 according to NBR6118[2]):Failure due to the reaction force → Q2y,a = fcd3.Anz = 0,72.av2.fcd.b.Lplate,bott = 0,72.0,87.3,33.16,5.11,4 = 392,36 kNP2y,a = 2.Q2y,a = 784,72 kNFailure due to the tie force → Q2y,b = fcd3.Anz = 0,72.av2.fcd.b.hnode,bott = 0,72.0,87.3,33.16,5.10,80 = 371,70 kNP2y,b = 2.Q2y,b = 743,40 kNFailure due to the diagonal force → ws,bott = Lplate-bott.sina + hnode-bott.cosa = 11,4.sin 44,87o + 10,80.cos 44,87o = 15,69 cmP2y,c = fcd3.Anz = 0,72.av2.fcd.b.ws,bott = 0,72.0,87.3,33.16,5.15,69 = 540,01 kNP2y,c = 2.Q2,c = 1080,02 kN
A.4) Failure of the CCC top node (m = 0,85 according to NBR6118[2]):Failure due to the reaction force → Q3y,a = fcd1.Anz = 0,85.av2.fcd.b.(0,5.Lplate,top) = 0,85.0,87.3,33.16,5.10,15 = 412,41 kNP3y,a = 2.Q3y,a = 824,82 kNFailure due to the horizontal force in the strut → Q3y,b = fcd1.Anz = 0,85.av2.fcd.b.hnode-top = 0,85.0,87.3,33.16,5.4,84 = 196,65 kNP3y,b = 2.Q3y,b = 393,30 kN (Observe that this value depends on minimum hnode,top and may be neglected)
Failure due to the diagonal force → ws,top = 0,5.Lplate-top.sina + hnode-top.cosa = 10,15.sin 44,87o + 4,84.cos 44,87o = 10,59 cmQ3y,c = fcd1.Anz = 0,85.av2.fcd.b.ws,top = 0,85.0,87.3,33.16,5.10,59 = 430,29 kNP3y,c = 2.Q3y,c = 860,58 kN (Observe that this value depends on minimum hnode,top and may be neglected)
A.5) Failure of the diagonal bottle-shaped strut (m = 0,60 ac-cording to NBR6118[2]):
îíì
=
=£
cm15,69w
cm10,59ww
botts,
tops,s
FS = fcd2.Ans = 0,60.av2.fcd.b.ws = 0,60.0,87.3,33.16,5.10,59 = 303,73 kNQ4,y = FS.sina = 303,73.sin 44,87o = 214,28 kNP4,y = 2.Q4,y = 428,56 kN (Observe that this value depends on mini-mum hnode,top and may be neglected)
A.6) Failure of the horizontal top strut (m = 0,85 according to NBR6118[2])FC = fcd1.Ans = 0,60.av2.fcd.b.hnode,top = 0,85.0,87.3,33.16,5.4,84 = 196,65 kNQ5,y = FC.sina/cos a = 196,65.sin 44,83o/cos 44,83o = 195,48 kNP5,y = 2.Q5,y = 390,96 kN (Observe that this value depends on mini-mum hnode,top and may be neglected)
A.7) Selection of the prediction loadsRepeating the previous calculations considering the rupture of the main reinforcement, Table [A.1] may be constructed and load val-ues may be organized in crescent order to determine the interest loads. Based on this crescent sequence is possible to realize that deep beam DB1-1.00 will yield for P = 391,80 kN and will fail for P =471,76 kN (due to the failure of the diagonal strut).
Table A.1 – Predicted loads for deep beam DB1-1.00 using the proposed strut and tie model
Position Predicted loads considering yielding of the main reinforcement
Predicted loads considering rupture of the main reinforcement
Main tie P1,y = 391,80 kN P1,r = 595,16 kN
CCT node
ïî
ïí
ì
=
=
=
kN1080,02P
kN743,40P
kN784,72P
c2y,
b2y,
a2y,
ïî
ïí
ì
=
=
=
kN1080,02P
kN743,40P
kN784,72P
c2r,
b2r,
a2r,
CCC node
ïî
ïí
ì
=
=
=
)(neglected kN860,58P
)(neglected kN393,30P
kN824,82P
c3y,
b3y,
a3y,
ïî
ïí
ì
=
=
=
kN954,45P
kN597,22P
kN824,82P
c3r,
b3r,
a3r,
Diagonal strut P4y = 427,86 kN (neglected) P4,r = 471,76 kN
Horizontal strut P5y = 390,96 kN (neglected) P5,r = 517,79 kN