Embed Size (px)
Citation preview
December 2012
IAEA
SAFETY
REPORTS
SERIES
Generic Post-Closure Safety Assessment for
Borehole Disposal of Disused Sealed Sources
(Draft 0.10)
DRAFT SAFETY REPORT
INTERNATIONAL ATOMIC ENERGY AGENCY
VIENNA

FOREWORD
Today radioactive sources are used in a wide range of applications. The beneficial applications of
radioactive sources in nuclear research and in industrial, medical areas have been a genuine
breakthrough in our modern scientific endeavours. Notwithstanding this, radioactive waste generated
in these nuclear fields has over the past decades been a matter of great concern at the same time. The
use of radioactive sources (e.g. disused radioactive sources from industrial and medical uses)
generates small but significant volumes of radioactive waste, some of which are potentially highly
radioactive. However, compared with waste from nuclear fuel cycle and nuclear power generation, in
some countries less awareness has been given to the management of limited amounts of radioactive
waste and particularly disused sealed radioactive sources in these areas. Consequently, accidents
ensued from misuse of such waste types, in particular, in countries with no suitable disposal options.
In the aftermath of these setbacks, growing concerns have gradually come to call on the international
community to develop a safe and cost effective disposal solution for disused radioactive sources. As a
result, various actions have been implemented by international technical community and the IAEA to
improve the safe management of disused sealed radioactive sources and especially, to provide options
for their safe disposal. For multiple reasons, disposal of disused sources in borehole facilities has in
recent years been recognized as an effective solution for the disposal of disused sealed radioactive
sources. In line with increasing attention to borehole disposal, the IAEA has developed the Borehole
Disposal of Sealed Sources (BOSS concept) in an effort to assist developing Member States in the
management of sealed sources. In addition, the IAEA has developed the Safety Guide on Borehole
Disposal Facilities for Radioactive Waste (Safety Standards Series No. SSG-1), which provides
specific guidance on the design, construction, operation and closure of boreholes disposal facilities.
This Safety Guide mainly focuses on boreholes having a diameter of not more than few hundred
millimetres and a depth beyond a few tens of metres and up to a few hundred metres.
In accordance with the relevant IAEA Safety Standards, this safety report is intended to complement
the aforementioned safety guide by elaborating on a generic post-closure safety assessment (GSA) for
this borehole disposal concept. Information is particularly given in this report for performing post-
closure safety assessment for the disposal of disused radioactive sources in narrow diameter boreholes.
All the steps required to carry out such an assessment are covered in the report by providing safety
elements that need to be considered to ensure safety in borehole disposal sites. The report documents a
GSA for the BOSS concept, with the purpose of identifying the concept’s key safety features, under
varying disposal system conditions, in order to support the concept design and licensing processes, and
facilitate its site-specific implementation. This report is therefore intended for use primarily by
technical audience in developing or in regulating the disposal of disused radioactive sources to
borehole facilities. It is also considered that the publication will be particularly useful to those
countries that have disused radioactive sources and no suitable disposal options at present
Some of the references in this document may be outdated but are kept as they have been used in the
development of the document. Nitwithstanding this the reader should also be aware of the following
new documents:
Disposal of Radioactive Waste Specific Safety Requirements (SSR-5)
Geological Disposal Facilities for Radioactive Waste Specific Safety Guide (SSG-14)
The Safety Case and Safety Assessment for the Disposal of Radioactive Waste ( SSG-23)
The IAEA wishes to express its gratitude to all those who assisted in the drafting and review of the
report. The IAEA officer responsible for this publication where P.Metcalf and Gerard Bruno of the
Division of Radiation, Transport and Waste Safety.
EXECUTIVE SUMMARY
Many countries now have radioactive sources that need to be managed and disposed of carefully and
in a safe and secure manner. These sources contain different radionuclides in highly variable
quantities. Many sources are small in physical size. However they can contain very high activities,
with typical levels in the megabecquerel (106 Bq) to petabequerel (1015 Bq) range. Therefore, if they
are not managed properly, radioactive sources can represent a significant hazard to human health and
to the environment. Storage in a secure facility can be considered as an adequate final management
option for sources containing quantities of short lived radionuclides, which decay to harmless levels
within a few years. However, for most other sources, a suitable disposal option is required.
Many countries have existing or proposed near surface radioactive waste disposal facilities for low and
intermediate level waste. However, the specific activity of many sources exceeds the waste acceptance
criteria for such facilities since the source constitutes a high, localized concentration in the facility.
Deep geological disposal offers the highest level of isolation available within disposal concepts
currently being actively considered. Such facilities are under consideration for the disposal of spent
nuclear fuel, high level waste and intermediate level waste in a number of countries. However, they
are expensive to develop and only viable for countries with extensive nuclear power programmes.
Therefore, increasing attention has been given to the disposal of disused sources in borehole facilities
with a view to providing a safe and cost effective disposal option for limited amounts of radioactive
waste and, particularly, disused sources.
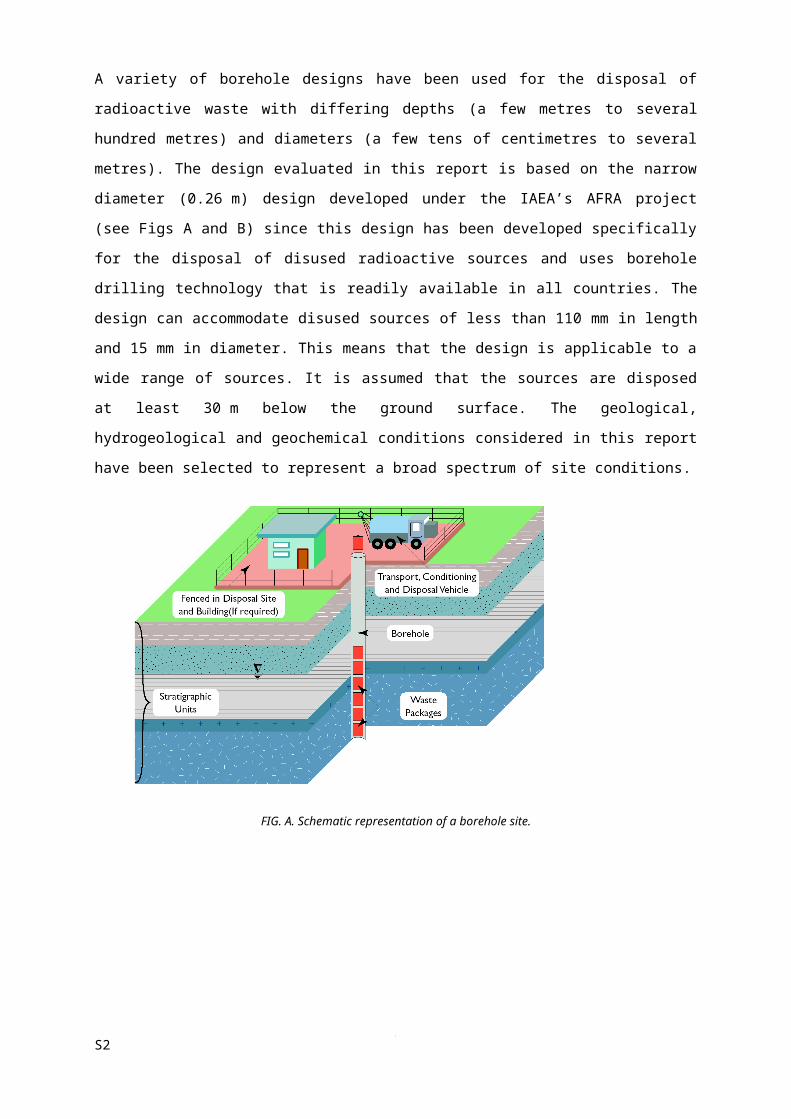
A variety of borehole designs have been used for the disposal of radioactive waste with differing
depths (a few metres to several hundred metres) and diameters (a few tens of centimetres to several
metres). The design evaluated in this report is based on the narrow diameter (0.26 m) design
developed under the IAEA’s AFRA project (see Figs A and B) since this design has been developed
specifically for the disposal of disused radioactive sources and uses borehole drilling technology that
is readily available in all countries. The design can accommodate disused sources of less than 110 mm
in length and 15 mm in diameter. This means that the design is applicable to a wide range of sources.
It is assumed that the sources are disposed at least 30 m below the ground surface. The geological,
hydrogeological and geochemical conditions considered in this report have been selected to represent
a broad spectrum of site conditions.
S1

FIG. A. Schematic representation of a borehole site.
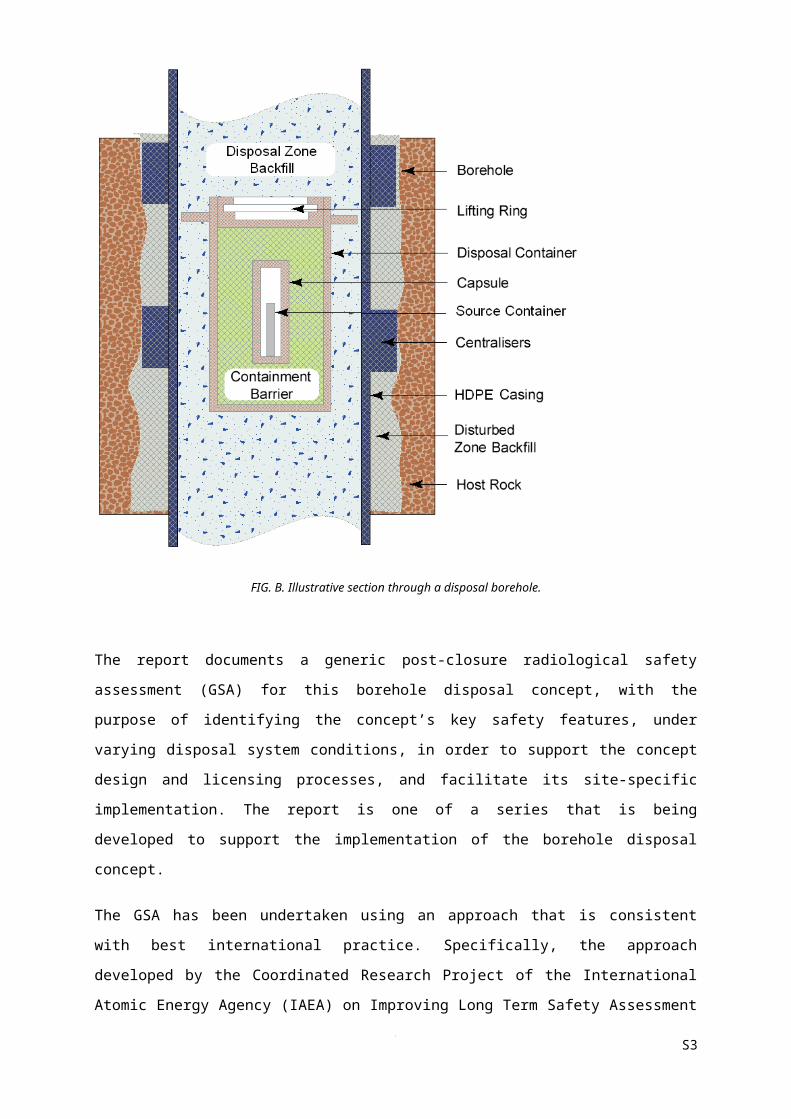
FIG. B. Illustrative section through a disposal borehole.
S22
The report documents a generic post-closure radiological safety assessment (GSA) for this borehole
disposal concept, with the purpose of identifying the concept’s key safety features, under varying
disposal system conditions, in order to support the concept design and licensing processes, and
facilitate its site-specific implementation. The report is one of a series that is being developed to
support the implementation of the borehole disposal concept.
The GSA has been undertaken using an approach that is consistent with best international practice.
Specifically, the approach developed by the Coordinated Research Project of the International Atomic
Energy Agency (IAEA) on Improving Long Term Safety Assessment Methodologies for Near Surface
Radioactive Waste Disposal Facilities (the ISAM Safety Assessment Approach) has been used, with
the aim of ensuring that the assessment is undertaken and documented in a consistent, logical and
transparent manner. The ISAM Safety Assessment Approach consists of the following key steps:
Specification of the assessment context;
Description of the disposal system;
Development and justification of scenarios;
Formulation and implementation of models; and
Presentation and analysis of results.
Each of these steps is applied to the GSA of the borehole disposal concept and the application is
described in this report.
The main report is supported by a series of appendices that provide detailed information relating to
specific aspects of the assessment study, namely:
(a) The selection of the radionuclides and geochemical conditions assessed in the GSA;
(b) The approach used to identify scenarios and conceptual models for consideration in the GSA
and the screening of associated features, events and processes (in particular those associated
with the borehole itself);
(c) The detailed models used to undertake the calculations of cement degradation and the corrosion
of stainless steel waste capsules and disposal containers in the different environmental
conditions considered;
(d) The assessment level models and data used to calculate the impacts of disposals to the borehole
disposal concept;
(e) The results of the associated calculations.
The GSA has been developed so that it can serve as the primary post-closure safety assessment for
specific disposal sites that lie within the envelope of conditions assessed in this report. For situations
falling outside the envelope, additional calculations ranging from minor variations of the GSA to a full
S33
site-specific safety assessment may be required. In such cases, the GSA could be used to guide and
support the development of the site-specific assessment. Furthermore, the derived generic reference
activity values could be used as a benchmark against which to compare values derived from the site
specific assessment.
The results show that with a suitable combination of inventory, near-field design and geological
environment, the borehole disposal concept is capable of providing a safe solution for the disposal of
both long lived and short lived radionuclides. For most radionuclides, including longer-lived
radionuclides such as Ra-226, post-closure safety places no limit on the radionuclide inventory that
could be disposed of using the borehole disposal concept. Even for radionuclides such as Pu-238, Pu-
239 and Am-241 with exceedingly long daughters (i.e. half-lives in excess of 100 000 a), the concept
has the potential to dispose around 1 TBq in a single borehole.
S44
CONTENTS1 INTRODUCTION.......................................................................................................................1
1.1 Background 1
1.2 Objective 2
1.3 Scope 2
1.4 Structure 4
2 SPECIFICATION OF ASSESSMENT CONTEXT...................................................................6
2.1. Purpose and scope 6
2.2. Target audience 7
2.3. Regulatory framework 7
2.4. End points 8
2.5. Philosophy 9
2.6. Timeframes 10
3 DESCRIPTION OF DISPOSAL SYSTEMS............................................................................14
3.1 Near field 14
3.2 Geosphere 26
3.3 Biosphere 31
3.4 Disposal systems of interest 37
4 DEVELOPMENT AND JUSTIFICATION OF SCENARIOS.................................................42
4.1 Approach 42
4.2 design scenario 44
4.3 Defect scenario 53
4.4 Unexpected geological characteristics scenario 57
4.5 Changing environmental conditions scenario 57
4.6 Borehole disturbance scenario 57
5 FORMULATION AND IMPLEMENTATION OF MODELS................................................59
5.1 Approach 59
5.2 Conceptual models60
5.3 Mathematical models 71
5.4 Reference calculation cases 74
5.5 data 74
5.6 Implementation 75
6 PRESENTATION AND ANALYSIS OF RESULTS...............................................................78
6.1 Results for the reference calculations 80
6.2 Results for variant calculations 95
6.3 What-if calculations 98
6.4 Analysis of uncertainties 106
6.5 Building of confidence 108
7 CONCLUSIONS.....................................................................................................................112
REFERENCES.....................................................................................................................................114
APPENDIX I: RADIONUCLIDE SCREENING................................................................................120
I.1 Preliminary screening 120
I.2 Main screening 125
APPENDIX II: GEOCHEMICAL CONDITIONS CONSIDERED....................................................132
II.1. Requirements of specifications for geochemical conditions 132
II.2. Approach to defining geochemical conditions 132
II.3. Bounding groundwater compositions 133
II.4. Reference groundwater compositions 135
APPENDIX III: SCENARIO GENERATION APPROACH..............................................................151
APPENDIX IV: SCREENED FEP LIST FOR THE DESIGN SCENARIO.......................................155
APPENDIX V: DETAILED NEAR-FIELD FEP LIST.......................................................................164
APPENDIX VI: SCREENED FEP LIST FOR THE DEFECT SCENARIO......................................202
APPENDIX VII: APPROACH FOR CONCEPTUAL MODEL DEVELOPMENT..........................210
VII.1. Near-field components 210
VII.2. Geosphere components 211
VII.3. Biosphere components 211
VII.4. Interactions between components 212
APPENDIX VIII: CEMENT DEGRADATION MODEL...................................................................215
VIII.1. Important impacts of cement evolution 215
VIII.2. Processes controlling cement degradation 215
VIII.3. Available cement degradation models 217
VIII.4. Representation of cement degradation in the GSA 220
VIII.5. cement degradation times for the reference cases in the GSA 224
APPENDIX IX: CORROSION OF STAINLESS STEEL WASTE CAPSULES
AND DISPOSAL CONTAINERS.......................................................................................................227
IX.1. introduction 227
IX.2. literature review and summary of data 227
IX.3. target lifetimes 235
IX.4. corrosion model 235
IX.5. ailure times and corrosion maps for the GSA243
IX.6. summary and conclusions 245
APPENDIX X: CALCULATION OF SOLUBILITY CONDITIONS................................................294
APPENDIX XI: ASSESSMENT MODEL..........................................................................................309
XI.1. Design scenario 309
7
XI.2. Defect scenario 325
XI.3. Representing near-field degradation 325
APPENDIX XII: ASSESSMENT DATA............................................................................................330
Xii.1 Inventory and radionuclide data 334
XII.2 Element-dependent data 339
XII.3 Near-field element-independent data 349
XII.4 Geosphere element-independent data 366
XII.5 Biosphere element-independent data 377
APPENDIX XIII: ASSESSMENT RESULTS.....................................................................................385
CONTRIBUTORS TO THE DRAFTING AND REVIEW OF THE DOCUMENT...........................442
1. INTRODUCTION
1.1. BACKGROUND
The application of radioactive sources in medicine, research, industry, agricultural and consumer
products is a world-wide phenomenon. Consequently, many countries now have sources that need to
be managed and disposed of carefully and in a safe and secure manner. These sources contain different
radionuclides in highly variable quantities. In some cases, the activity of a source decays to a level
below which the source is no longer suitable for its original purpose, in others the associated
equipment may become obsolete, worn out, or damaged, and in others the source may develop a leak
and so is no longer used. In all these circumstances, the radioactive sources are referred to as ‘disused’
or ‘spent’1, even though their activity could still be very high.
The majority of sources are small in physical size (e.g. Ra-226 needles), with the only items of
significant size being some industrial radiography units and commercial irradiators. Despite their
predominately small physical size, radioactive sources can contain very high activities, with typical
levels in the MBq (106 Bq) to PBq (1015 Bq) range [2]. Therefore, if they are not managed properly,
radioactive sources can represent a significant hazard to human health and the environment, which is
evident from the number of accidents that have taken place world-wide as a result of the
mismanagement of such sources [3]. Some sources can be returned to their manufacturers and
recycled, but for many users of sources it is impractical or uneconomical to recycle all sources, and
many sources end up being stored for long periods of time. Storage in a secure facility can be
considered as an adequate final management option for sources containing quantities of short-lived
radionuclides, which decay to harmless levels within a few years. However, for most other sources a
suitable disposal option is required.
Many countries have existing or proposed near-surface radioactive waste disposal facilities for low
and intermediate level waste. However, the specific activity of many sources exceeds the waste
acceptance criteria for such facilities since the source constitutes a high, localized concentration in the
facility and could give rise to unacceptable radiation doses in the event of human intrusion or other
causes of facility disruption. Safety cases for many near-surface disposal facilities assume a period of
institutional control (typically a few tens to hundreds of years) during which disruption of the waste is
assumed to be unlikely. However, even within these, and particularly for longer timeframes, it is
possible that such control will no longer be fully in place and thus disruption of the waste cannot be
ruled out. Consequently, disused sources that will not decay to negligible levels within a few tens to
hundreds of years need to be disposed of in facilities that will provide higher levels of isolation than
provided by surface storage or near-surface facilities. 1 According to Ref. [1], subtle differences can be noted between the terms ‘spent’ and ‘disused’. A disused source differs from a spent source in that it may still be capable of performing its function, even though it is no longer used for that purpose. To be consistent, the broader ‘disused’ term is used in this document.
1
Deep geological disposal offers the highest level of isolation available within disposal concepts
currently actively considered. Such facilities are under consideration for the disposal of spent nuclear
fuel, high level waste and intermediate level waste in a number of countries. However, they are
expensive to develop and only viable for countries with extensive nuclear power programmes. It is
unlikely that such an option will become available in many countries since they have no nuclear power
programme requiring such resources. In particular, some countries in Africa, Asia, South America, and
the former Soviet Union have limited infrastructure or administrative capability to manage or dispose
radioactive waste in their country. Therefore increasing attention has been given in recent years to the
disposal of disused sources in narrow diameter (a few tens of centimetres) borehole facilities with a
view to providing a safe and cost effective disposal option for limited amounts of radioactive waste
and particularly disused sources [4].
1.1.1.ObjectiveThe objective of this report is to document a GSA for this borehole disposal concept, with the purpose
of identifying the concept’s key safety features, under varying disposal system conditions, in order to
support the concept design and licensing processes, and facilitate its site-specific implementation. The
GSA has been developed so that it can serve as the primary post-closure safety assessment for specific
disposal sites that lie within the envelope of assessed conditions.
1.1.2.ScopeThe focus of the work described in this report is the post-closure, radiological safety assessment of the
disposal of disused radioactive sources. The report considers exposure of humans due to natural
processes and human intrusion, but excludes intrusion that can be considered as deliberate
(i.e. intrusion by a human when the intruder knows that the facility is a radioactive waste disposal
facility). Consistent with Ref. [5], the impact of deliberate human intrusion is considered to be the
responsibility of those intruding and is beyond the scope of the current assessment, as are malicious
acts that might arise from deliberate human intrusion.
A variety of borehole designs have been used for the disposal of radioactive waste with differing
depths (a few metres to several hundred metres) and diameters (a few tens of centimetres to several
metres) (see Ref. [4] for details). The design evaluated in the GSA is based on the narrow diameter
(0.26 m) design developed under the IAEA’s AFRA project [6] since this design has been developed
specifically for the disposal of disused radioactive sources and uses borehole drilling technology that
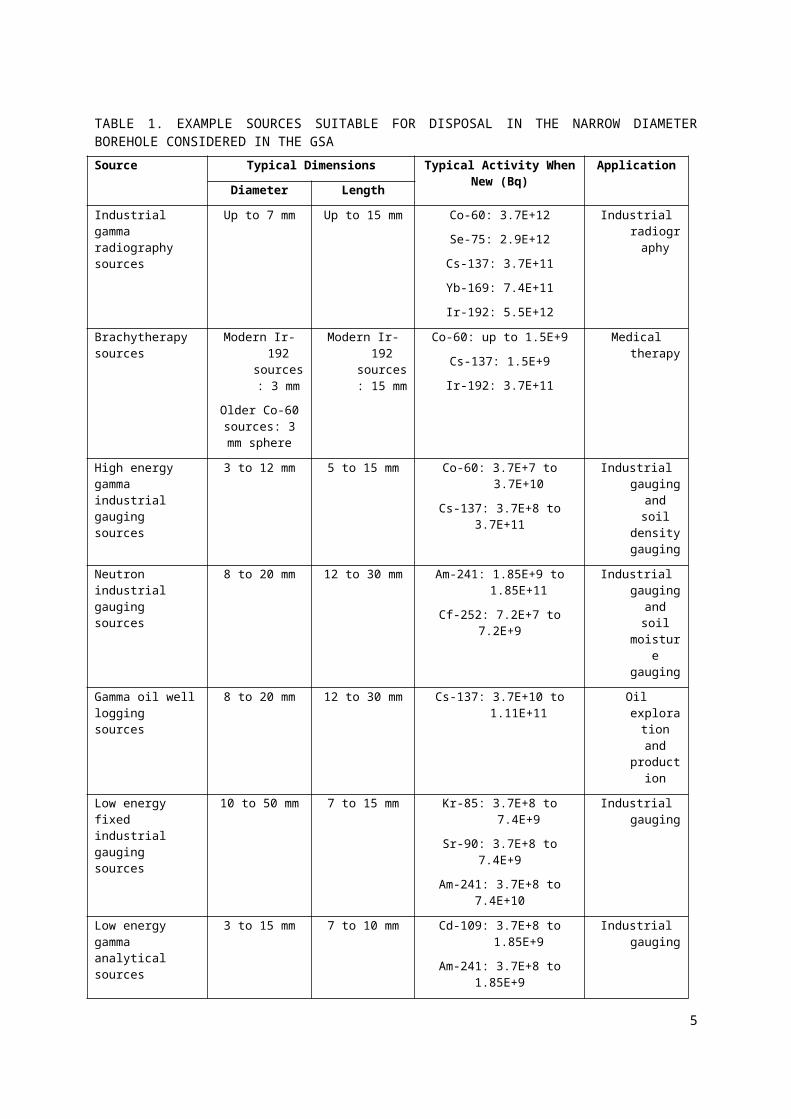
is readily available in all countries. The design can accommodate disused sources of less than 110 mm
in length and 15 mm in diameter. This means that the design is applicable to a wide range of sources;
Table 1 provides some examples taken from Ref. [23]. It is assumed that the sources are disposed at
least 30 m from the ground surface. The geological, hydrogeological and geochemical conditions
considered in this report have been selected to represent a broad spectrum of site conditions.
222
It is considered that the reference activity values derived are applicable to situations in which the
inventory, design and site conditions fall within the envelope of assumptions and data used in the
GSA. In such cases, rather than developing a site-specific safety assessment, it could be sufficient to
undertake site-specific investigations to confirm that the site conditions, design and inventories fall
within the GSA’s envelope of assumptions and data. For situations falling outside the envelope
defined by the GSA, additional calculations ranging from minor variations of the GSA to a full site-
specific safety assessment may be required. In such cases, the GSA could be used to guide and support
the development of the site-specific assessment. In many cases it should be possible to transfer some
of the assumptions, models and results directly into the site-specific assessment. Furthermore, the
derived generic reference activity values could be used as a benchmark against which to compare
values derived from the site-specific assessment.
TABLE 1. EXAMPLE SOURCES SUITABLE FOR DISPOSAL IN THE NARROW DIAMETER BOREHOLE CONSIDERED IN THE GSA Source Typical Dimensions Typical Activity When New
(Bq)Application
Diameter Length
Industrial gamma radiography sources
Up to 7 mm Up to 15 mm Co-60: 3.7E+12
Se-75: 2.9E+12
Cs-137: 3.7E+11
Yb-169: 7.4E+11
Ir-192: 5.5E+12
Industrial radiograp
hy
Brachytherapy sources
Modern Ir-192 sources: 3
mm
Older Co-60 sources: 3 mm
sphere
Modern Ir-192 sources: 15 mm
Co-60: up to 1.5E+9
Cs-137: 1.5E+9
Ir-192: 3.7E+11
Medical therapy
High energy gamma industrial gauging sources
3 to 12 mm 5 to 15 mm Co-60: 3.7E+7 to 3.7E+10
Cs-137: 3.7E+8 to 3.7E+11
Industrial gauging and soil density gauging
Neutron industrial gauging sources
8 to 20 mm 12 to 30 mm Am-241: 1.85E+9 to 1.85E+11
Cf-252: 7.2E+7 to 7.2E+9
Industrial gauging and soil moisture gauging
Gamma oil well logging sources
8 to 20 mm 12 to 30 mm Cs-137: 3.7E+10 to 1.11E+11 Oil exploration and
production
Low energy fixed industrial gauging sources
10 to 50 mm 7 to 15 mm Kr-85: 3.7E+8 to 7.4E+9
Sr-90: 3.7E+8 to 7.4E+9
Am-241: 3.7E+8 to 7.4E+10
Industrial gauging
3
Low energy gamma analytical sources
3 to 15 mm 7 to 10 mm Cd-109: 3.7E+8 to 1.85E+9
Am-241: 3.7E+8 to 1.85E+9
Industrial gauging
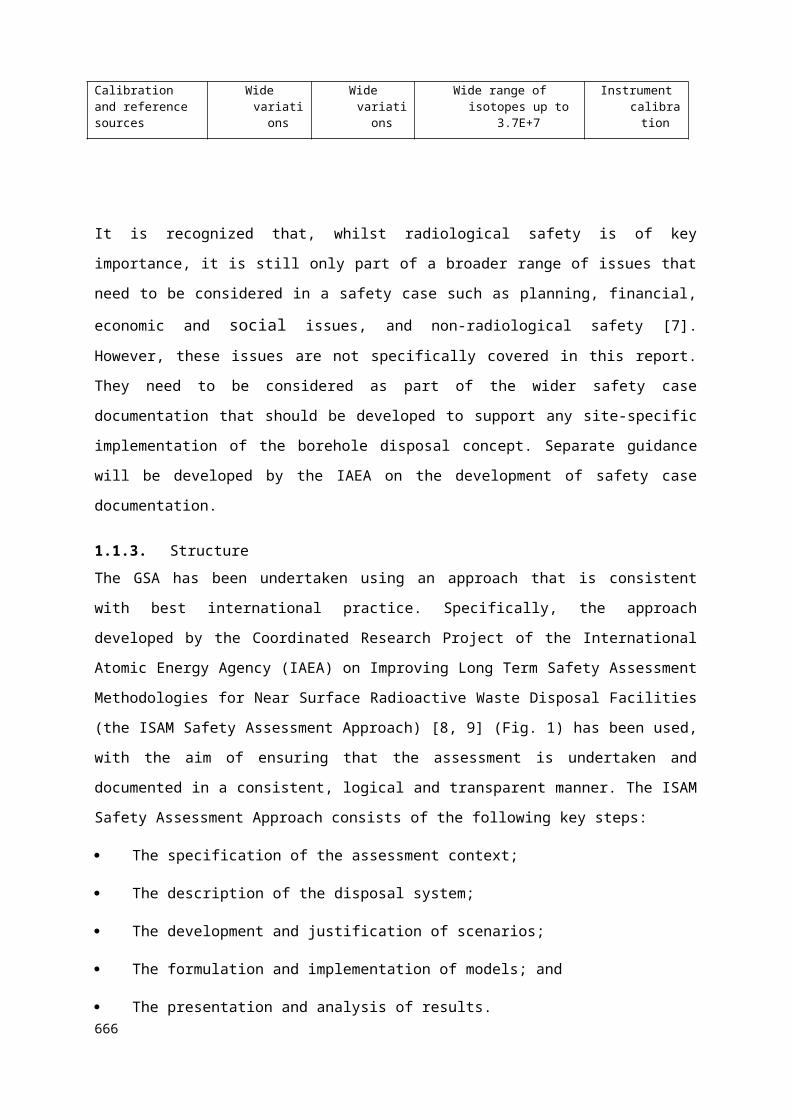
Calibration and reference sources
Wide variations Wide variations Wide range of isotopes up to 3.7E+7
Instrument calibration
It is recognized that, whilst radiological safety is of key importance, it is still only part of a broader
range of issues that need to be considered in a safety case such as planning, financial, economic and
social issues, and non-radiological safety [7]. However, these issues are not specifically covered in
this report. They need to be considered as part of the wider safety case documentation that should be
developed to support any site-specific implementation of the borehole disposal concept. Separate
guidance will be developed by the IAEA on the development of safety case documentation.
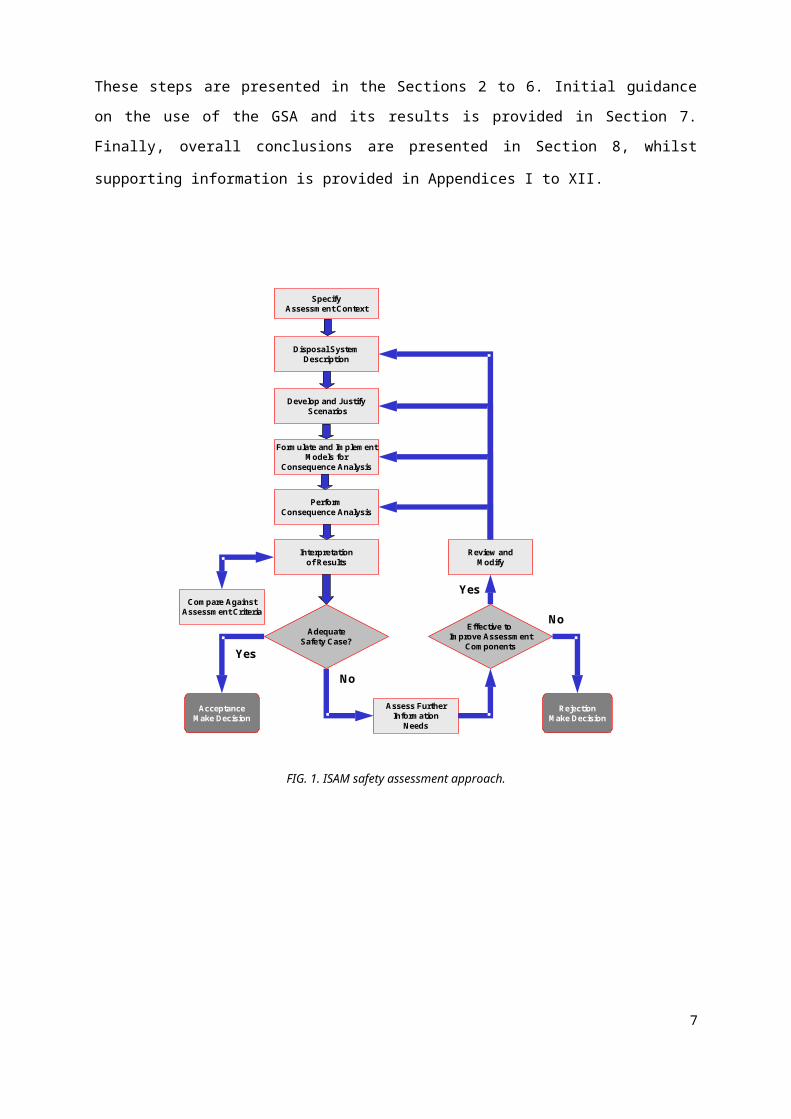
1.1.3.StructureThe GSA has been undertaken using an approach that is consistent with best international practice.
Specifically, the approach developed by the Coordinated Research Project of the International Atomic
Energy Agency (IAEA) on Improving Long Term Safety Assessment Methodologies for Near Surface
Radioactive Waste Disposal Facilities (the ISAM Safety Assessment Approach) [8, 9] (Fig. 1) has
been used, with the aim of ensuring that the assessment is undertaken and documented in a consistent,
logical and transparent manner. The ISAM Safety Assessment Approach consists of the following key
steps:
The specification of the assessment context;
The description of the disposal system;
The development and justification of scenarios;
The formulation and implementation of models; and
The presentation and analysis of results.
These steps are presented in the Sections 2 to 6. Initial guidance on the use of the GSA and its results
is provided in Section 7. Finally, overall conclusions are presented in Section 8, whilst supporting
information is provided in Appendices I to XII.
444
SpecifyAssessment Context
Disposal SystemDescription
Develop and Justify Scenarios
Formulate and Implement Models for
Consequence Analysis
Interpretationof Results
AcceptanceMake Decision
Assess Further Information
Needs
Effective to Improve Assessment
Components
RejectionMake Decision
PerformConsequence Analysis
Compare AgainstAssessment Criteria
Yes
Yes
No
No
Review andModify
AdequateSafety Case?
FIG. 1. ISAM safety assessment approach.
5
2. SPECIFICATION OF ASSESSMENT CONTEXT
2.1. BACKGROUND
The assessment context defines the scope and content of the safety assessment. Specifically, it
specifies the assessment’s:
Purpose and scope (Section 2.1);
Target audience (Section 2.2);
Regulatory framework (Section 2.3);
End-points (Section 2.4);
Philosophy (Section 2.5); and
Timeframes (Section 2.6).
2.1.1. Purpose and ScopeThe GSA has five main purposes:
1. To demonstrate and build confidence in the use of narrow diameter boreholes as a safe disposal
concept for disused radioactive sources of less than 110 mm in length and 15 mm in diameter.
2. To produce a GSA that can be used to define an envelope of disposal system conditions and
assumptions against which a specific disposal system can be compared by identifying:
Inventories suitable for disposal using the borehole disposal concept;
Suitable levels of engineering;
Suitable site characteristics;
The need for and duration of the institutional control period required to provide adequate
safety; and
The half-life around which there is no practical limit for disposal from a post-closure
perspective.
3. To serve potentially as the primary post-closure safety assessment for specific disposal sites that
lie within the envelope of assessed conditions.
4. To identify the key parameters that need to be characterized for a specific site.
5. To provide the basis for any site-specific confirmation that might be required.
The GSA’s scope is the assessment of the post-closure (i.e. once the waste has been emplaced and the
borehole backfilled and closed) radiological impacts on humans arising from the disposal of disused
radioactive sources at least 30 m below the ground surface in a narrow diameter borehole.
666
2.1.2. Target audienceThis report is a technical report and as such is written primarily for a technical audience whose prime
interest is in the regulation and implementation of safe radioactive waste disposal2. The report is
considered to be of particular interest to those countries that have disused radioactive sources and no
suitable disposal options at present.
Two main technical audiences can be identified.
‘Developers’ including those individuals and organizations that have a direct interest in the
disposal of disused radioactive sources to borehole facilities. This group could include not only
any organization directly involved in pursuing a disposal facility development programme, but
also other nuclear industry organizations and radioactive waste producers.
‘Regulators’ including those organizations who would have a direct responsibility to decide
whether to grant a ‘licence to operate’ a borehole disposal facility. In addition, there could be a
wider range of organizations, such as local authority and other governmental organizations,
which would need to be consulted if a borehole facility were to be developed for the disposal of
disused sources.
Included in both these groups are the scientists who would provide technical support to the developers
and regulators.
It is recognized that there is a range of other audiences that could be interested in the borehole disposal
of disused sources (for example the media, politicians, and the public). However, given its technical
focus, this report is not specifically aimed at these audiences. It is recognized that additional data will
have to be developed that is tailored to the specific interests and needs of these other audiences.
2.1.3. Regulatory framework The assessment is not related to any specific site, organization or country, and so it is considered
inappropriate to use a particular country’s regulatory framework. Furthermore, few countries have
national requirements for the safe disposal of disused radioactive sources that can be used as
regulatory framework for the assessment, and where frameworks do exist, for example in South Africa
[10], guidance provided related to issues influencing the post-closure safety of a borehole disposal
facility is relatively limited. Given this, it is considered appropriate to use the recommendations of the
IAEA draft safety guide [11]. This draft safety guide provides post-closure protection objectives and
criteria which in turn are based on the recommendations of IAEA [12] and ICRP [5].
2 The report assumes that the reader is familiar with the technical terms used in safety assessment. Key technical terms are defined in Ref. [1].
7
Consistent with Ref. [11], the GSA adopts an individual effective dose constraint of 0.3 mSv y-1 for
adult3 members of the public for all potential future exposures other than those arising from human
intrusion.
2.1.4. End points In most post-closure safety assessments some measure of impact on humans or the environment is the
calculation end point. The waste activity concentrations and total activity levels (i.e. the facility
inventory) are usually the starting points of the assessment. In contrast, in this report, the calculation
end points are the reference activity levels for disposal to a borehole, which can be expressed as total
activity values and per waste package activity values for each radionuclide, and the measure of impact
(the annual individual effective dose), can be seen as the starting point of this calculation. However, in
practice, the calculation of reference activity levels first requires a unit inventory for a borehole
(1 TBq of each radionuclide per waste package in a borehole) to be assumed for which the dose is
calculated. Assuming a linear relationship between the inventory and the dose4, total and per waste
package activity levels that meet the appropriate radiological protection criteria can then be derived for
each radionuclide disposed in the borehole. Further details concerning the calculation of reference
activity levels are provided in Section 5.3.
Radiological impacts on non-human biota are not considered in this report since it is assumed that if
individual humans are shown to be adequately protected, then non-human biota will also be protected,
at least at the species level [15]. The basis of this assumption is currently being investigated by various
international organizations such as the International Commission on Radiological Protection (ICRP),
the IAEA and the European Commission (see for example Refs [16, 17, 18]). However, in the absence
of any, as yet, clear consensus and guidance on the assessment of radiological impacts on non-human
biota, the recommendations of ICRP Publication 60 [15] are adopted.
Non-radiological impacts, which might arise from the content of chemically or biologically toxic
materials in the waste (for example beryllium in some Am-241 sources) or engineered barrier
materials, are considered to be beyond the scope of the GSA given its emphasis on radiological
impacts.
2.1.5. Philosophy Different approaches can be applied to the assessment of the end points discussed in Section 2.4.
Whilst the nature of the end points may have been clearly defined, the nature of the approach used to
3 Doses to children and infants could also be calculated, especially if there was a need to demonstrate consideration of a wide range of calculation end points. However, various post-closure assessment studies, such as Refs [13, 14], have demonstrated that the differences between adult, child and infant doses are usually less than a factor of two. Therefore, for the purposes of the GSA, consideration will be limited to adult doses as an indicator of impacts.
4 The limitations of this assumption are discussed in Section 5.3.888
calculate the end points also needs to be made clear. From this perspective, the assessment philosophy
is an expression of the approach that is applied to the assessment.
Consistent with best international practice, the ISAM Safety Assessment Approach (Fig. 1) is used to
undertake the assessment with the aim of ensuring that the assessment is undertaken and documented
in a consistent, logical and transparent manner.
2.1.5.1. Nature of Assumptions Adopted
In undertaking an assessment, various assumptions have to be adopted. Assumptions are often
categorized as ‘realistic’5 or ‘conservative’6, although, as noted in Ref. [19], care needs to taken when
using such terms. An approach that balances simplicity, conservatism and realism is likely to be the
best starting point for assessments [20]. Thus, a mixture between a realistic and a conservative
approach is applied to the GSA. As noted in Ref. [19], the key issue is to document and justify the
nature of each assumption in the assessment (see Section 8.1). Typically, realistic assumptions are
used where information is available and the associated uncertainty is relatively well known, whilst
conservative assumptions are used where the information is highly uncertain.
2.1.5.2. Data Availability
The assessment is not related to any specific location and, consequently, is carried out using well-
justified values for the defined disposal systems derived from a range of national and international
literature. All data sources are documented. The near-field conditions are based on parameter values
obtained as part of the development of the borehole disposal concept under the IAEA’s AFRA
project [6], supplemented by generic data available from literature where necessary.
Since the assessment is generic, no site characterization studies are undertaken to supplement existing
available information.
2.1.5.3. Treatment of Uncertainties
The treatment of uncertainty should be a key component of any assessment to establish the safety of a
radioactive waste disposal facility. Uncertainties require consideration in a variety of ways and
assimilation into the structure of the assessment as appropriate. They arise from three main
sources [21]:
5 Realism can be defined as “the representation of an element of the system (scenario, model or data), made in light of the current state of system knowledge and associated uncertainties, such that the safety assessment incorporates all that is known about the element under consideration and leads to an estimate of the expected performance of the system attributable to that element” [19].
6 Conservatism can be defined as “the conscious decision, made in light of the current state of system knowledge and associated uncertainties, to represent an element of the system (scenario, model or data) such that it provides an under-estimate of system performance attributable to that element and thereby an over-estimate of the associated radiological impact (i.e. dose or risk)” [19].
9
uncertainty in the evolution of the disposal system over the timescales of interest (scenario
uncertainty);
uncertainty in the conceptual, mathematical and computer models used to simulate the
behaviour and evolution of the disposal system (e.g. owing to the inability of models to
represent the system completely, approximations used in solving the model equations, and
coding errors); and
uncertainty in the data and parameters used as inputs in the modelling.
In addition, Ref. [8] suggests that a further type of uncertainty, subjective uncertainty (uncertainty due
to reliance on expert judgement), is also linked with the above sources of uncertainty.
The uncertainty in the future evolution of the site is treated using a transparent and comprehensive
scenario development and justification methodology (Section 4). Data and parameter uncertainty that
exist are treated using a deterministic sensitivity analysis, whilst model uncertainties are treated using
alternative conceptualizations and mathematical representations of the system (Section 6). Subjective
uncertainties can be managed by using a systematic and transparent assessment approach which allows
subjective judgements to be document, justified and quantified (as far as possible).
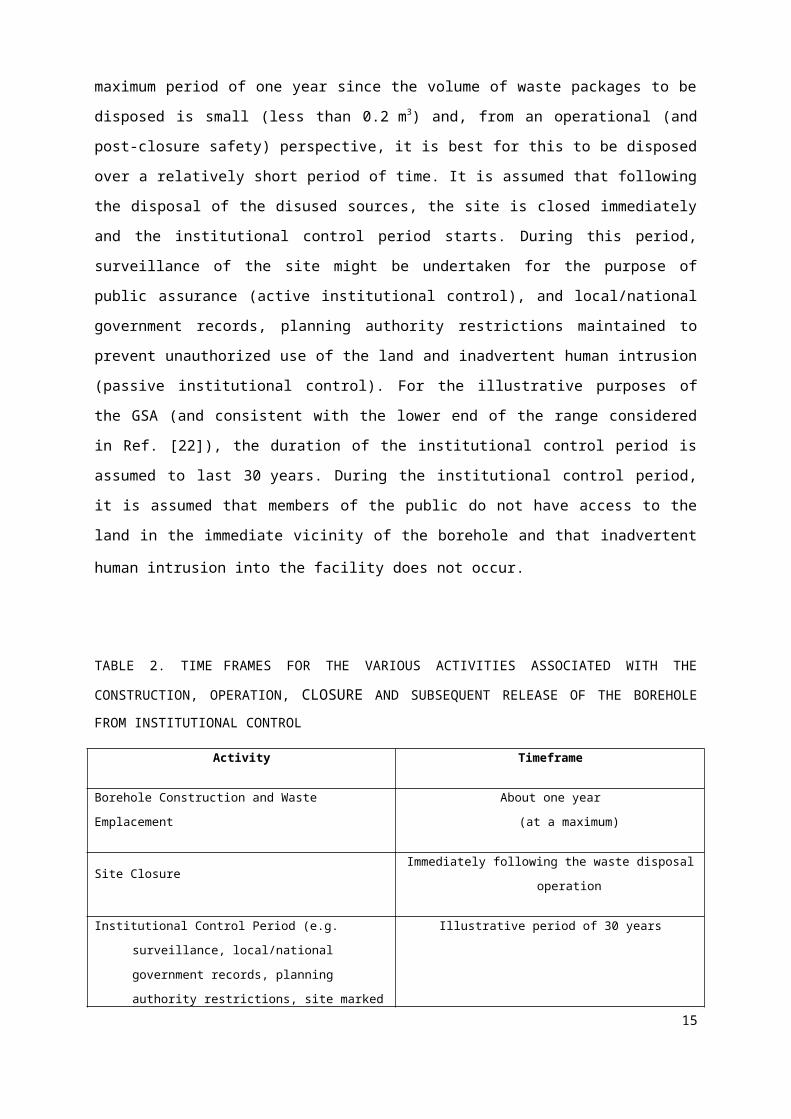
2.1.6. Time frames Table 2 summarizes the time frames for the various activities associated with the construction,
operation, closure and subsequent release of the borehole from institutional control. It is assumed that
following construction of the borehole, waste is disposed for a maximum period of one year since the
volume of waste packages to be disposed is small (less than 0.2 m3) and, from an operational (and
post-closure safety) perspective, it is best for this to be disposed over a relatively short period of time.
It is assumed that following the disposal of the disused sources, the site is closed immediately and the
institutional control period starts. During this period, surveillance of the site might be undertaken for
the purpose of public assurance (active institutional control), and local/national government records,
planning authority restrictions maintained to prevent unauthorized use of the land and inadvertent
human intrusion (passive institutional control). For the illustrative purposes of the GSA (and
consistent with the lower end of the range considered in Ref. [22]), the duration of the institutional
control period is assumed to last 30 years. During the institutional control period, it is assumed that
members of the public do not have access to the land in the immediate vicinity of the borehole and that
inadvertent human intrusion into the facility does not occur.
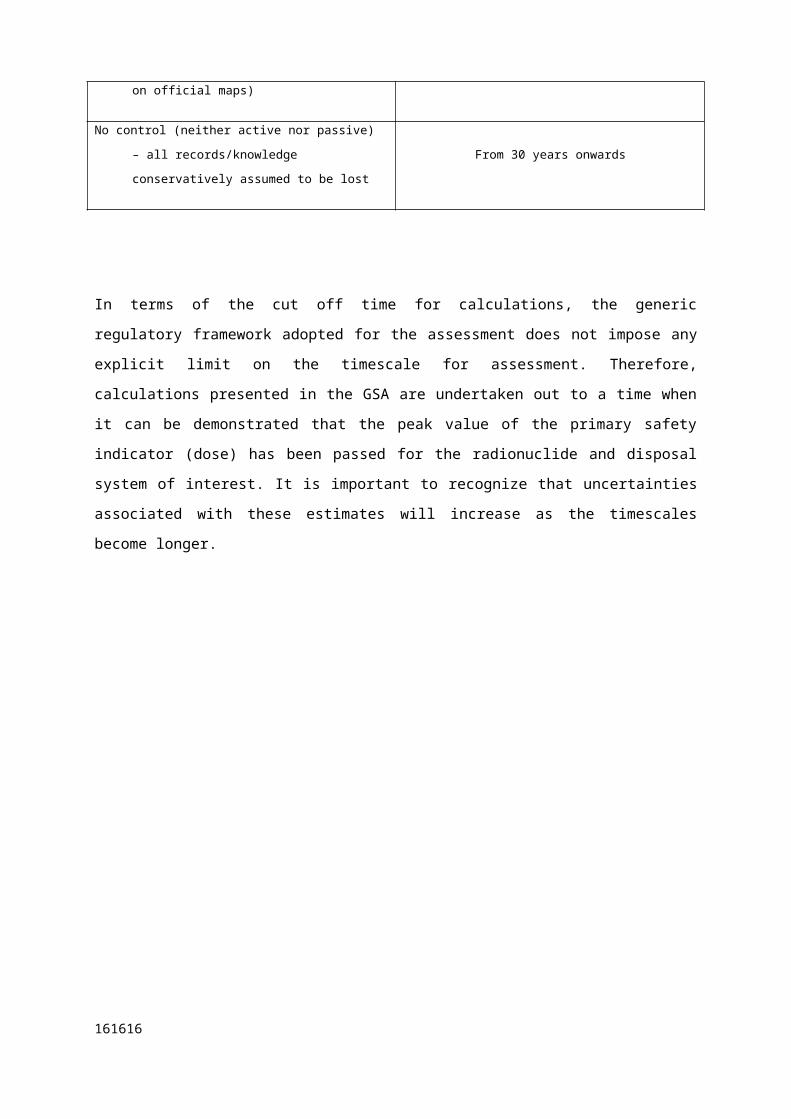
TABLE 2. TIME FRAMES FOR THE VARIOUS ACTIVITIES ASSOCIATED WITH THE
CONSTRUCTION, OPERATION, CLOSURE AND SUBSEQUENT RELEASE OF THE BOREHOLE
FROM INSTITUTIONAL CONTROL101010
Activity Timeframe
Borehole Construction and Waste EmplacementAbout one year
(at a maximum)
Site Closure Immediately following the waste disposal operation
Institutional Control Period (e.g. surveillance, local/national
government records, planning authority restrictions,
site marked on official maps)
Illustrative period of 30 years
No control (neither active nor passive) – all
records/knowledge conservatively assumed to be lostFrom 30 years onwards
In terms of the cut off time for calculations, the generic regulatory framework adopted for the
assessment does not impose any explicit limit on the timescale for assessment. Therefore, calculations
presented in the GSA are undertaken out to a time when it can be demonstrated that the peak value of
the primary safety indicator (dose) has been passed for the radionuclide and disposal system of
interest. It is important to recognize that uncertainties associated with these estimates will increase as
the timescales become longer.
11
3. DESCRIPTION OF DISPOSAL SYSTEMS
3.1. BACKGROUND
Together with the assessment context, the disposal system description provides the necessary basis to
develop a well-justified set of exposure scenarios (Section 4). The disposal system can be divided into:
the near field - the waste, the disposal zone, the engineered barriers of the borehole plus the
disturbed zone of the natural barriers that surround the borehole;
the geosphere - the rock and unconsolidated material that lies between the near field and the
biosphere. It can consist of both the unsaturated or vadose zone (which is above the
groundwater table) and the saturated zone (which is below the groundwater table); and
the biosphere - the physical media (atmosphere, soil, sediments and surface waters) and the
living organisms (including humans) that interact with them.
These descriptions are provided in Sections 3.1 to 3.3. The near-field, geosphere and biosphere
characteristics are then combined in Section 3.4 and resulting disposal systems identified.
3.1.1.Near fieldFor the purposes of the GSA calculations presented in Section 6, it is assumed that there is a single
disposal borehole and that the design assessed is based on the narrow diameter borehole design
developed under the IAEA’s AFRA project [6]. Alternative borehole designs could be considered (see
for example Ref. [4]), but these would have to be evaluated using a separate, design-specific safety
assessment.
It is assumed that the disposal zone in the borehole is at least 30 m from the ground surface thereby
significantly reducing the probability of the waste being disturbed by human intrusion or other
disruptive events and processes [4]. The disposal zone could extend down to around 100 m, although
depths of several hundred metres could be considered if geological conditions were found to be more
appropriate at such depths [4].
3.1.1.1. Inventory
Since the 1940s, there has been a considerable increase in the number of disused radioactive sources,
the range of radionuclides that they contain and the diversity of their application in medicine, research,
industry, agricultural and consumer products. The application of sources in these sectors, the range of
radionuclides that they contain, their expected maximum activity and the application associated with
the maximum activity are summarized in various publications such as Refs [2, 4, 23].
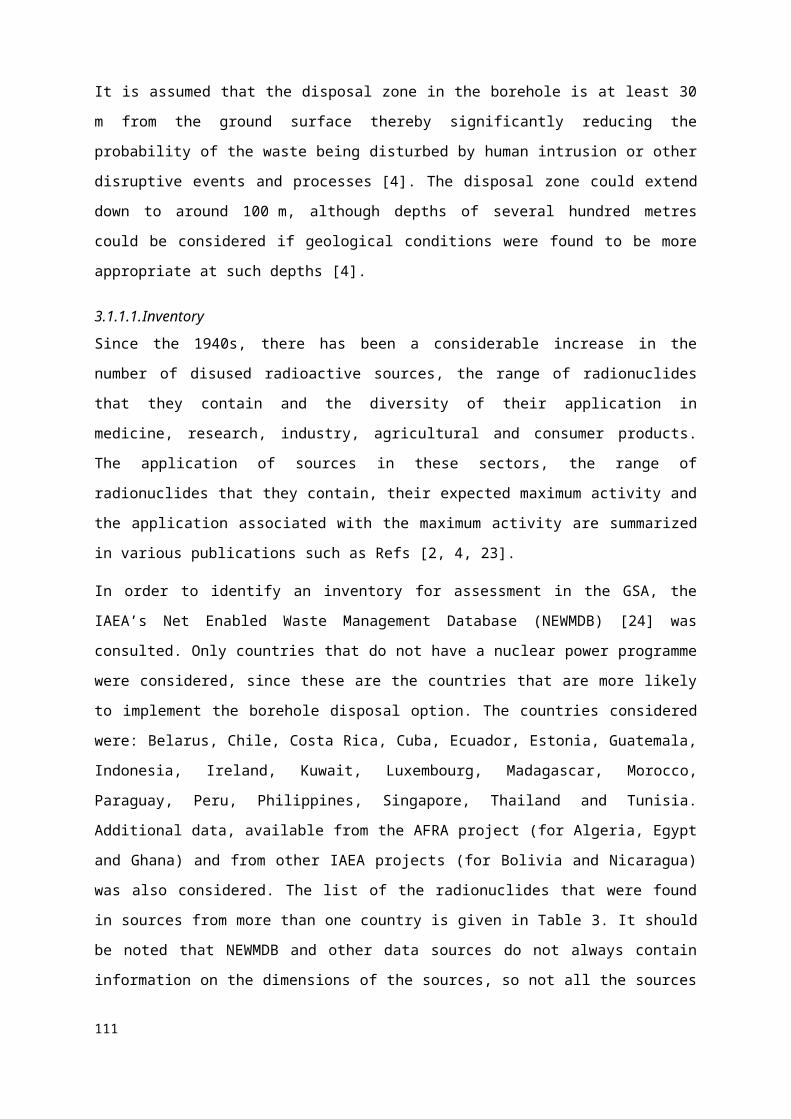
In order to identify an inventory for assessment in the GSA, the IAEA’s Net Enabled Waste
Management Database (NEWMDB) [24] was consulted. Only countries that do not have a nuclear
power programme were considered, since these are the countries that are more likely to implement the 0
borehole disposal option. The countries considered were: Belarus, Chile, Costa Rica, Cuba, Ecuador,
Estonia, Guatemala, Indonesia, Ireland, Kuwait, Luxembourg, Madagascar, Morocco, Paraguay, Peru,
Philippines, Singapore, Thailand and Tunisia. Additional data, available from the AFRA project (for
Algeria, Egypt and Ghana) and from other IAEA projects (for Bolivia and Nicaragua) was also
considered. The list of the radionuclides that were found in sources from more than one country is
given in Table 3. It should be noted that NEWMDB and other data sources do not always contain
information on the dimensions of the sources, so not all the sources listed might be suitable for
disposal in a narrow diameter borehole. Nevertheless, the list of radionuclides is considered to be a
representative estimate of the radionuclides that might need to be disposed of.
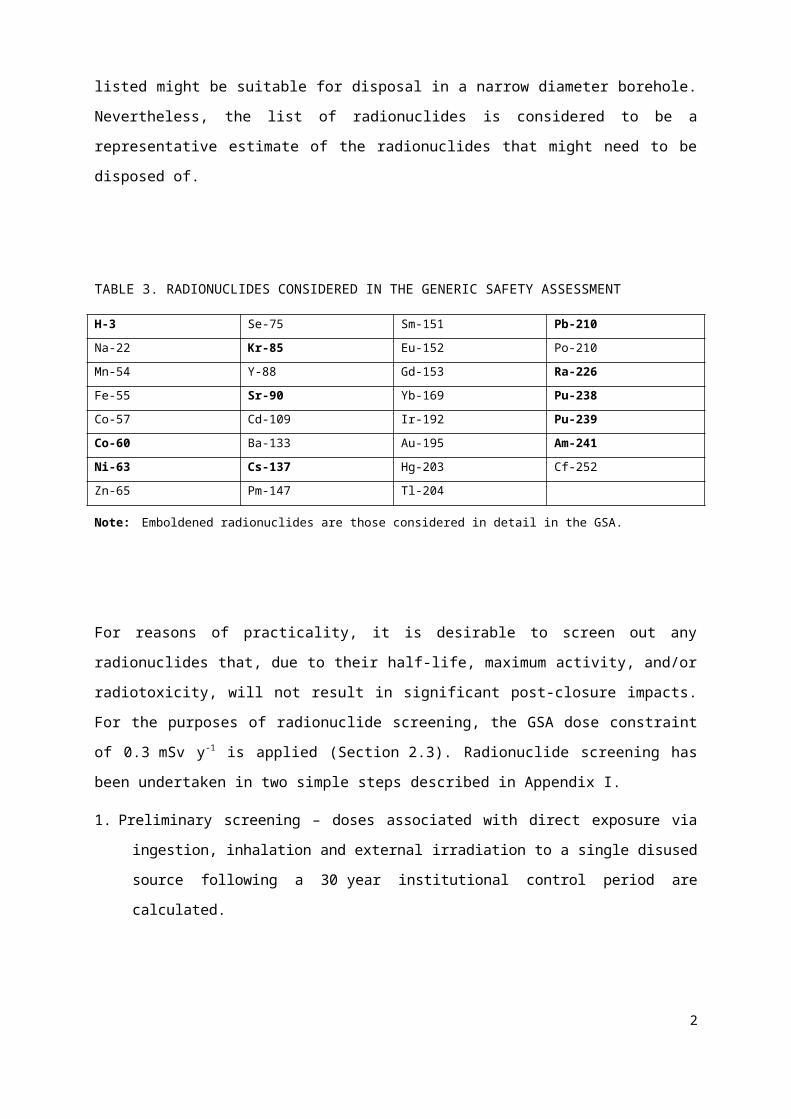
TABLE 3. RADIONUCLIDES CONSIDERED IN THE GENERIC SAFETY ASSESSMENT
H-3 Se-75 Sm-151 Pb-210
Na-22 Kr-85 Eu-152 Po-210
Mn-54 Y-88 Gd-153 Ra-226
Fe-55 Sr-90 Yb-169 Pu-238
Co-57 Cd-109 Ir-192 Pu-239
Co-60 Ba-133 Au-195 Am-241
Ni-63 Cs-137 Hg-203 Cf-252
Zn-65 Pm-147 Tl-204
Note: Emboldened radionuclides are those considered in detail in the GSA.
For reasons of practicality, it is desirable to screen out any radionuclides that, due to their half-life,
maximum activity, and/or radiotoxicity, will not result in significant post-closure impacts. For the
purposes of radionuclide screening, the GSA dose constraint of 0.3 mSv y-1 is applied (Section 2.3).
Radionuclide screening has been undertaken in two simple steps described in Appendix I.
1. Preliminary screening – doses associated with direct exposure via ingestion, inhalation and external
irradiation to a single disused source following a 30 year institutional control period are calculated.
2. Main screening – for those radionuclides remaining after Step 1, a simple assessment of doses
associated with the groundwater and gas pathways is undertaken.
The screening process has resulted in the identification of 11 radionuclides for consideration in the
GSA. These radionuclides are emboldened in Table 3. For the purpose of the activity level
calculations presented in Section 6, it is assumed that a unit inventory of 1 TBq per waste package of
each of the radionuclides in Table 3 is disposed in the borehole. For those 20 radionuclides that have 111
been screened out from consideration (i.e. those that are not emboldened in Table 3), it is considered
that their presence in disused sealed sources at the activity levels identified in Table A.1 does not
result in significant post-closure impacts. Borehole disposal could be considered for such
radionuclides. However, other management options might be more appropriate such as surface storage
or disposal in a surface disposal facility.
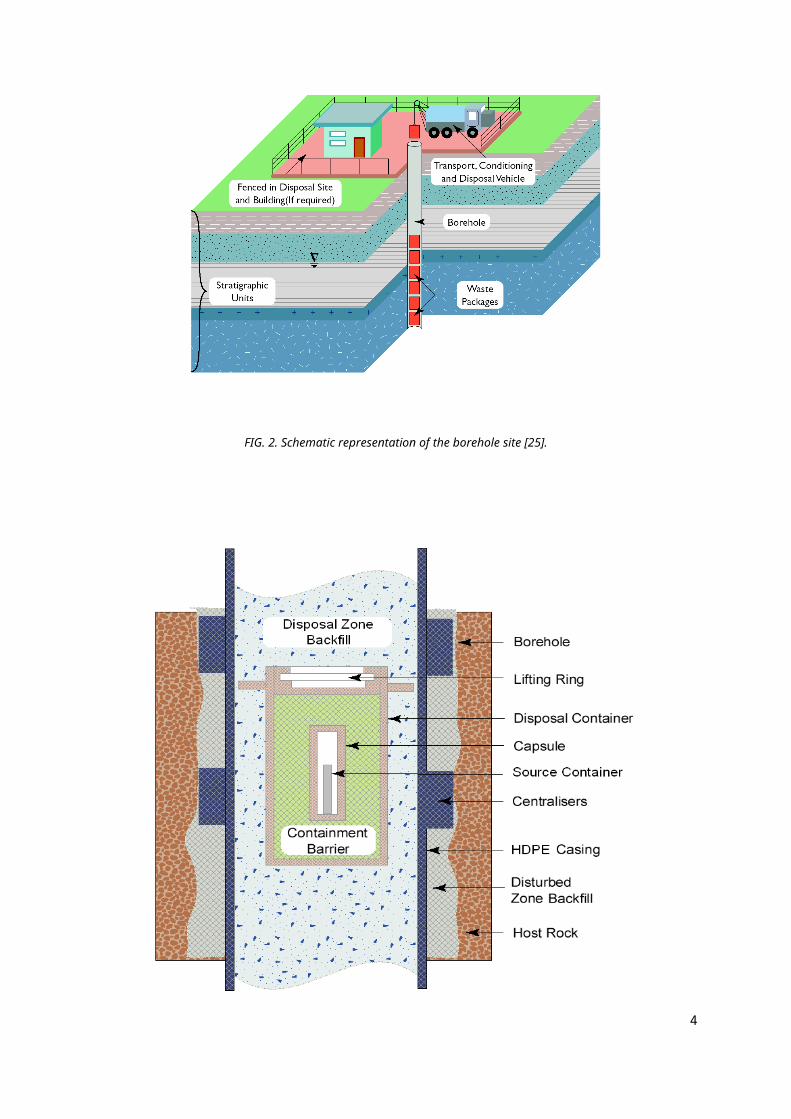
3.1.1.2. Engineering
Based on the narrow diameter design developed under the IAEA’s AFRA project [6], the reference
design for the near field is assumed to comprise a series of engineered components which are
described below, illustrated in Figs 2 to 4, and summarized, together with their post-closure safety
related functions, in Table 4. Alternative dimensions to those given below are considered in the variant
calculations presented in Section 6.2.
2
FIG. 2. Schematic representation of the borehole site [25].
333
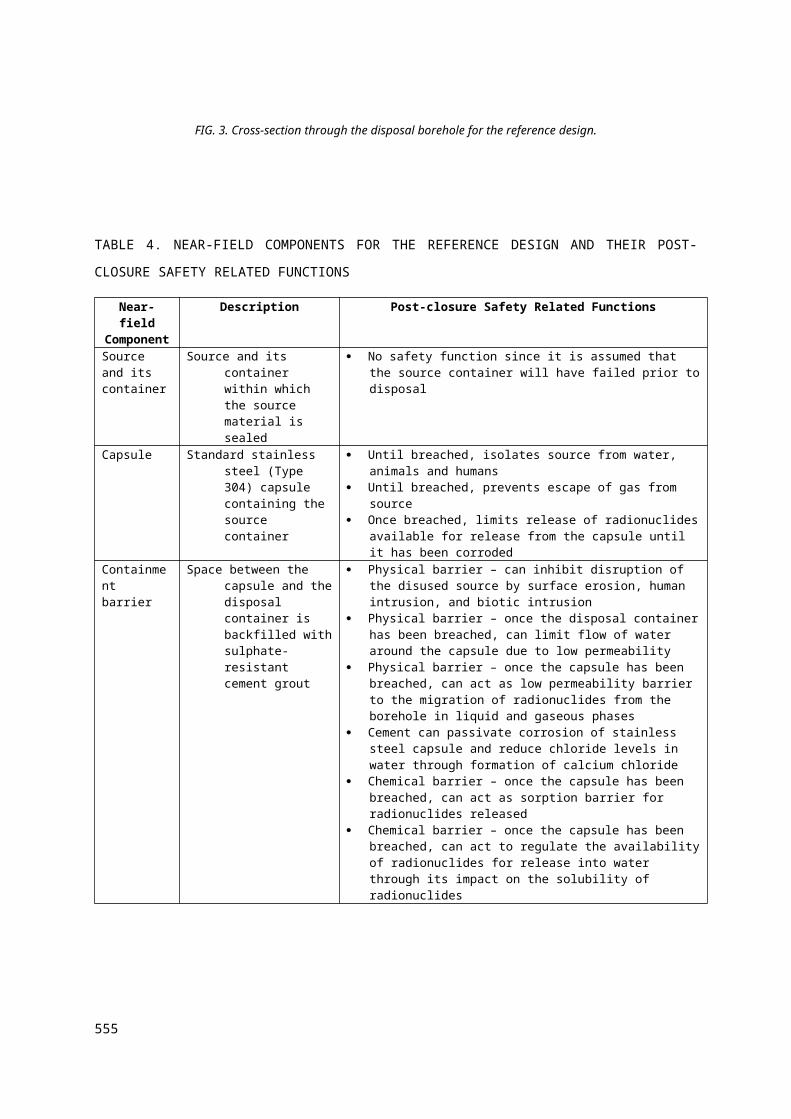
FIG. 3. Cross-section through the disposal borehole for the reference design.
TABLE 4. NEAR-FIELD COMPONENTS FOR THE REFERENCE DESIGN AND THEIR POST-CLOSURE
SAFETY RELATED FUNCTIONS
Near-field Component
Description Post-closure Safety Related Functions
Source and its container
Source and its container within which the source material is sealed
No safety function since it is assumed that the source container will have failed prior to disposal
Capsule Standard stainless steel (Type 304) capsule containing the source container
Until breached, isolates source from water, animals and humans Until breached, prevents escape of gas from source Once breached, limits release of radionuclides available for release
from the capsule until it has been corrodedContainment barrier
Space between the capsule and the disposal container is backfilled with sulphate-resistant cement grout
Physical barrier – can inhibit disruption of the disused source by surface erosion, human intrusion, and biotic intrusion
Physical barrier – once the disposal container has been breached, can limit flow of water around the capsule due to low permeability
Physical barrier – once the capsule has been breached, can act as low permeability barrier to the migration of radionuclides from the borehole in liquid and gaseous phases
Cement can passivate corrosion of stainless steel capsule and reduce chloride levels in water through formation of calcium chloride
Chemical barrier – once the capsule has been breached, can act as sorption barrier for radionuclides released
Chemical barrier – once the capsule has been breached, can act to regulate the availability of radionuclides for release into water through its impact on the solubility of radionuclides
Disposal container
Type 316 L stainless steel Until breached, isolates source container, capsule and containment barrier from water, animals and humans
Once it and the capsule are both breached, the disposal container can limit the fraction of radionuclides available for release into the borehole until the entire container has been corroded
Disposal zone backfill
Sulphate-resistant cement grout used to separate disposal containers in vertical dimension from one another, and in the horizontal dimension from the borehole casing
Physical barrier – can inhibit disruption of the disused source by surface erosion, human intrusion, and biotic intrusion
Physical barrier – can limit the flow of water around the disposal container due to low permeability
Physical barrier – once the disposal container and capsule have been breached, can act as low permeability barrier to the migration of radionuclides from the borehole in liquid and gaseous phases
Cement can passivate corrosion of stainless steel capsule and reduce chloride levels in water through formation of calcium chloride
Chemical barrier – once the disposal container and capsule have been breached, can act as sorption barrier for radionuclides released
Chemical barrier – once the capsule has been breached, can act to regulate the availability of radionuclides for release into water through its impact on the solubility of radionuclides
Disposal zone plug
Sulphate-resistant cement grout plug at base of borehole
For unsaturated systems: Physical barrier – once the disposal container and capsule have been
breached, can act as low permeability barrier to the migration of radionuclides from the borehole in liquid phase
Chemical barrier – once the disposal container and capsule have been breached, can act as sorption barrier for radionuclides released
Chemical barrier – once the disposal container and capsule has been breached, can act to regulate the availability of radionuclides for release into water through its impact on the solubility of radionuclides
For saturated systems: Physical barrier – until the casing starts to degrade will limit the flow
of water up into borehole due to low permeability
4
Near-field Component
Description Post-closure Safety Related Functions
Casing High-density polyethylene (HDPE) casing emplaced at time of drilling. Top sections withdrawn at closure of borehole down to 1 m of the disposal zone
Until degraded, restricts the flow of water into the disposal zone in saturated systems
Disturbed zone backfill
Sulphate-resistant cement grout used to fill the gap between the casing and the host rock and any voids/cracks in the host rock immediately adjacent to the borehole
Physical barrier – limits the flow of water into the borehole due to low permeability
Physical barrier – once the disposal container and capsule have been breached, can act as low permeability barrier to the migration of radionuclides from the borehole in liquid and gaseous phases
Chemical barrier – once the disposal container and capsule have been breached, can act as sorption barrier for radionuclides released from the borehole
Chemical barrier – once the capsule has been breached, can act to regulate the availability of radionuclides for release into water through its impact on the solubility of radionuclides
Cement can passivate corrosion of stainless steel capsule and reduce chloride levels in water through formation of calcium chloride
Closure zone backfill
Assume that the first 5 m from the ground surface is native soil/crushed rock and the remainder is sulphate-resistant cement grout
Physical barrier – limits the flow of water into the borehole due to low permeability
Physical barrier – inhibits disruption of the disused source by surface erosion, human intrusion, and biotic intrusion
Physical barrier – once the disposal container and capsule have been breached, can act as low permeability barrier to the migration of radionuclides from the borehole in liquid and gaseous phases
Chemical barrier – once the disposal container and capsule have been breached, can act as sorption barrier for radionuclides released from the borehole
Chemical barrier – once the capsule has been breached, can act to regulate the availability of radionuclides for release into water through its impact on the solubility of radionuclides
Cement can help maintain high pH conditions which then passivate corrosion of stainless steel capsule and reduce chloride levels in water through formation of calcium chloride
3.1.1.2.1. Waste Package
The waste package used for the disposal of disused radioactive sources in the borehole disposal
concept comprises the following components (see Fig. 3). It is assumed for the purposes of the
derivation of the reference activity levels presented in Section 6 that a total of 50 waste packages are
disposed in the borehole.
The source and its container – the radioactive source material and its container (for example,
the radium needles containing the radium salt, or the Pyrex tubes containing tritium gas or
tritium oxide). The dimensions of the reference capsule (Table 5) limit the source and its
container to be less than 110 mm in length and 15 mm in diameter.
555
The capsule – assumed to be a standard stainless steel capsule (Type 304)7. The disused source
and its associated container are emplaced in the capsule and sealed. No backfill material is used,
which means that apart from the disused source and its container, the capsule is empty. The
dimensions for the capsule are presented in Table 5 (alternative dimensions are considered in
variant calculations presented in Section 6.2).
The containment barrier – assumed to be a backfill, comprising sulphate-resistant
cementgrout, filling the void between the capsule and the disposal container. The dimensions
for the containment barrier are presented in Table 5.
The disposal container – assumed to be manufactured from Type 316 L stainless steel with the
reference dimensions given in Table 5. Alternative dimensions for the disposal container are
considered in variant calculations presented in Section 6.2. These would allow the disposal of
source containers of less than 160 mm in length and 140 mm in diameter directly into the
disposal container (i.e. with no capsule). As shown in Fig. 3, the container is equipped with a
lifting ring to facilitate waste emplacement in the borehole. There are also three centralisers that
help to ensure that the container is emplaced centrally and vertically. The centralisers are thin
(<10 mm) and do not inhibit the flow of cement grout past the top of the disposal container.
TABLE 5. DIMENSIONS OF THE CAPSULE, CONTAINMENT BARRIER AND DISPOSAL CONTAINER
FOR THE REFERENCE DESIGN
Waste Package
Component
Length (mm) Inside Diameter
(mm)
Outside Diameter
(mm)
Thickness8 (mm)
Capsule 110 15 21 3
Containment Barrier 186 21 103 41
Disposal Container 250 103 115 6
3.1.1.2.2. Disposal Borehole
7 Stainless steels are chromiun-containing steels where the Cr provides resistance to corrosion through the formation of a protective (”passive”) Cr(III) oxide or hydroxide film. There are various classes of stainless steel, a common class being the so-called 300-series austenitic alloys. Two of these alloys have been selected for the waste capsule and disposal container. Type 304 stainless steel has the nominal composition 18-20 wt.%Cr, 8-10.5 wt.%Ni, 1 wt.%Si, 2 wt.%Mn, 0.08 wt.%C, 0.045 wt.%P, and 0.03 wt.%S. Type 316L stainless steel has the nominal composition 16-18 wt.%Cr, 10-14 wt.%Ni, 1 wt.%Si, 2 wt.%Mn, 0.03 wt.%C, 0.045 wt.%P, 0.03 wt.%S, and 2-3 wt.% Mo, where the addition of Mo improves the resistance to localized corrosion and the reduced C content improves resistance to intergranular attack.8 As used here thickness refers to the wall thickness of the capsule and disposal containers as well as the thickness of the containment barrier.
6
The disposal borehole is 260 mm in diameter and is drilled to a depth of over 80 m. The borehole is
fitted with a high-density polyethylene (HDPE) casing for the reference design, although potentially
more durable alternative casings such as steel could be considered if it was considered necessary to
introduce an additional longer-term isolation barrier. The inner and outer diameters of the casing are
140 mm and 160 mm, respectively, giving a casing thickness of 10 mm.
Three distinct zones can be defined in the disposal borehole (see Fig. 4).
FIG. 4. Illustration of the borehole zones for the reference design.
777
The disposal zone – the zone inside the casing in which the waste packages are disposed. The
base of the disposal zone is assumed to be at least 80 m from the ground surface. A 0.5 m thick
‘plug’ of backfill slurry is emplaced at the base of the borehole. The borehole backfill slurry is
assumed to be sulphate-resistant cement grout. Once the plug material is set, the waste packages
are lowered into the borehole, one at a time. After the emplacement of each waste package,
backfill material is poured over the waste packages to fill the 12.5 mm thick void between the
waste package and the casing wall, as well as a volume on top of the waste package. The layer
of backfill on top of the waste package should be in the order of 700 mm to 800 mm deep.
Together with the waste package, this constitutes a pitch height of about 1 m per waste package.
Given that it is assumed that there are 50 waste packages to be disposed, the total thickness of
the disposal zone is about 50 m.
The closure zone – the zone between the disposal zone and the ground surface. Once the waste
packages have been emplaced in the borehole, it is assumed that the casing in the closure zone
is withdrawn from the borehole from a depth 1 m above the disposal zone. This removes a
potential fast transit pathway to and from the disposal zone which might arise once the casing
has degraded. An anti-intrusion barrier (for example a metallic ‘drill deflector’) is placed above
the disposal zone in order to deter/prevent human intrusion. The closure zone is then backfilled
to a depth 5 m below the ground surface with the same backfill material used for the disposal
zone. The final 5 m of the closure zone is then backfilled with native soil and/or crushed rock to
the ground surface. It is assumed that the total depth of the closure zone is at least 30 m, which
is considered to be a depth beyond which human intrusion is limited to drilling [11].
The disturbed zone – the zone between the casing and the wall of the borehole. Voids and
cracks in the host geology immediately adjacent to the borehole are assumed to be grouted and
sealed during the drilling process with the same slurry used for the backfilling of the disposal
and closure zones. In addition, an average gap of 50 mm between the casing and the borehole
wall is backfilled with the slurry using a pressure grouting technique [26]. As shown in Fig. 3,
the casing is fitted with centralisers to ensure that the casing is in the middle of the borehole.
These centralisers are made of thin mild steel plates inserted vertically to ensure that they do not
hamper the flow of the backfill slurry.
The design of the borehole disposal concept is a final disposal concept that is not designed to facilitate
the retrieval of waste packages once disposed since, once each waste package has been lowered into
the borehole, it is backfilled into the borehole with sulphate-resistant cement grout. Following the
emplacement of the final waste package, the closure zone above the waste package is also backfilled
with sulphate-resistant cement grout. This greatly reduces the possibility of sabotage or theft of the
disposed disused radioactive sources.
8
3.1.1.3. Hydrology and Chemistry
Disposal in either saturated or unsaturated conditions is considered in the GSA. However, conditions
where the disposal zone is in both the saturated and unsaturated zones are not considered in the GSA
and should be avoided for a number of reasons. The waste may undergo cyclical changes in chemical,
hydraulic, and microbiological environments due to fluctuating groundwater levels. Such cyclical
changes could enhance releases from waste packages, compared to less dynamic conditions. These
dynamic conditions could enhance degradation of engineered barriers in the borehole, which would
tend to further aggravate the tendency to increase release rates from the borehole. Also, this dynamic
system would be difficult to evaluate from a safety assessment perspective. Rather than using a long-
term average hydraulic system, on which transport analyses are conducted, one would have to evaluate
the influences of short-term dynamic processes on release and transport phenomena. For a real site, it
is considered that it could be both difficult and costly to develop a robust and defensible assessment of
such a system.
Geochemical conditions in the borehole will be determined by the interaction of the borehole
engineering and the host groundwater. A range of geochemical conditions is identified in Section 3.2
for analysis. Their impact on near-field geochemistry is considered in Section 5.2.
3.1.2.GeosphereThe geosphere has a number of safety related functions; these are summarized in Table 6.
For a site-specific assessment, site-specific data relating to the geosphere can be collected and
collated. However, for a site-generic assessment, it can be helpful to consider a range of ‘synthesised’
geospheres, which are not based on specific geospheres. Instead, the synthesised geospheres are
representative of potential conditions that might be found in reality, thereby helping to ensure that the
GSA and its findings are relevant to realistic geosphere conditions. By considering more than one
synthesised geosphere, the performance of the borehole can be evaluated under a range of geosphere
conditions thereby helping to define the envelope of site conditions for which the GSA and its results
are applicable.
TABLE 6. GEOSPHERE COMPONENTS AND THEIR SAFETY RELATED FUNCTIONS
System Component Post-closure Safety Related Functions
999
Unsaturated Zone Physical barrier for disposal in the unsaturated zone – can delay the migration of radionuclides from the near field to the saturated zone due to slow percolation rate and/or thick unsaturated zone. This will cause greater radionuclide decay in the unsaturated zone and so lower concentrations reaching the watertable.
Physical barrier for disposal in the unsaturated zone – lower radionuclide concentrations in percolating water due to dispersion and diffusion.
Physical barrier for disposal in the unsaturated and saturated zones – can isolate the waste from intrusion (human and animal) and geomorphological processes such as surface erosion.
Chemical barrier for disposal in the unsaturated zone – can retard the migration of radionuclides from the near field to the saturated zone due to sorption of radionuclides. This will cause greater radionuclide decay in the unsaturated zone and so lower concentrations reaching the watertable.
Saturated Zone Physical barrier for disposal in the unsaturated and saturated zones – can delay the migration of radionuclides to the geosphere-biosphere interface (assumed to be a water abstraction borehole for the GSA) due to slow travel times (in turn determined by hydraulic conductivity, hydraulic gradient and porosity of the saturated zone, and the distance to the geosphere-biosphere interface). This will cause greater radionuclide decay in the saturated zone and so lower concentrations reaching the abstraction borehole.
Physical barrier for disposal in the unsaturated and saturated zones – lower radionuclide concentrations in groundwater due to dispersion and diffusion.
Physical barrier for disposal in the saturated zone – can isolate the waste from intrusion (human and animal) and geomorphological processes such as surface erosion.
Chemical barrier for disposal in the unsaturated and saturated zones – can retard the migration of radionuclides to the geosphere-biosphere interface (assumed to be a water abstraction borehole for the GSA) due to sorption of radionuclides. This will cause greater radionuclide decay in the unsaturated zone and so lower concentrations reaching the watertable.
Dilution for disposal in the unsaturated and saturated zones – groundwater flow in the saturated zone will dilute the concentration of radionuclides leaving the near field/unsaturated zone by mixing and dispersion. In low flow groundwater systems dilution might also occur due to blending of contaminated groundwater with groundwater abstracted from uncontaminated horizons.
Before specifying reference conditions for disposal in the unsaturated zone (Section 3.2.1) and
saturated zone (Section 3.2.2), consideration needs to be given to a number of common issues.
Variability in the geosphere characteristics – for the GSA, it is assumed that, consistent with
the recommendations of the IAEA draft safety guide for the disposal of radioactive waste in
borehole facilities [11], there is an absence of geological complexity in the synthetic geosphere
(for example alternating aquitards and confined aquifers). This does not mean that the geology
in each reference geosphere and its hydrological and geochemical characteristics are
homogeneous; there can be variation. However, it is assumed that, for any given geosphere, this
variation can be adequately represented through the use of averaged hydrological and
geochemical parameter values for the geosphere.
Nature of water flow – reflecting the variation seen in reality, consideration is given to flow in
both porous and fractured systems. In porous systems, different pore geometries and flow fields
exist on microscopic scales but the existence of a representative elementary volume (REV) over
which such microscopic variations can be averaged is assumed. In fractured systems, flow is
10
considered to be confined to well-defined fractures or fracture zones. The intervening blocks are
often considered to be impermeable or contain only static water in pore spaces.
Nature of the Geosphere-Biosphere Interface (GBI) – a range of potential GBIs could be
considered for the GSA (for example a terrestrial or marine water body and/or its associated
sediment, and/or soil). The nature of GBI will affect the amount of dilution that occurs at the GBI.
For the purpose of the GSA, it is assumed that the GBI is a borehole, which is used to abstract
water to meet a demand of 266 m3 y-1 (see Section 3.3). This is considered to be a conservative
assumption since dilution at the GBI is small compared with other potential GBIs, such as a river9,
and it allows a short distance to be specified between the disposal borehole and the GBI.
Geochemistry – a range of geochemical conditions are considered. These are discussed in
Appendix II.
Geological stability – consistent with the general IAEA guidelines for the siting of radioactive
waste disposal facilities [27, 28], it is assumed that the disposal borehole is located in an area
which is geologically stable and is believed to have no, or extremely limited, tectonic and
seismic activity, and limited regional and local surface erosion and deposition which could
disturb the disposal borehole (see Section 3.3).
Natural resources – it is assumed that the disposal borehole is located in an area that has no
natural resources requiring excavation by extensive surface excavation or underground mining.
There are assumed to be no significant sources of geothermal heat or gas in the vicinity of the
disposal borehole.
When considering the migration of radionuclides in water through the unsaturated and/or
saturated zones, it is helpful to consider a number of inter-related parameters (see for example
Ref. [29]).
Flux of water through the near field. This influences the release rate of radionuclides from the
near field into the geosphere. If the disposal zone is in the unsaturated zone, this is determined
by the cross-sectional area of water flow through the near field and the percolation rate through
the near field (which in turn depends on factors such as: the infiltration rate of rainwater into the
unsaturated zone and near field; the hydraulic conductivity of the unsaturated zone and near
field; and moisture content of the unsaturated zone and near field). If the disposal zone is in the
saturated zone, it is determined by the cross-sectional area of groundwater flow through near
field, plus the hydraulic gradient, hydraulic conductivity, and porosity of the saturated zone and
near field.
9 By comparison, a small stream with a cross-sectional area of 0.5 m2 and a flow rate of 0.1 m s-1 would have a discharge of more than 1.5E6 m3 y-1 resulting in a dilution factor more than three orders of magnitude greater than the water abstraction borehole.111111
Travel time of a conservative (non-sorbed) contaminant through the geosphere, from its
interface with the near field to its interface with the biosphere (the GBI). This, together with a
radionuclide’s half-life and sorption coefficient (see below), determines the amount of
radioactive decay that occurs during transport through the geosphere, which in turn will
influence the concentration of the radionuclide in geosphere water. In the unsaturated zone, the
travel time is determined by the depth of the unsaturated zone beneath the disposal borehole and
the percolation rate through the unsaturated zone. In the saturated zone, it is determined by the
hydraulic gradient, hydraulic conductivity, porosity and distance to the GBI.
Distance to the GBI. This will affect not only the geosphere travel time, but also the amount of
dispersion and hence lowering in radionuclide concentrations in the geosphere.
Flux of water in the geosphere, especially at the GBI. This influences the dilution of
radionuclides released into the biosphere. If the disposal zone is in the unsaturated zone,
dilution in the unsaturated zone is determined by: the cross-sectional area of the unsaturated
zone through which the radionuclides are transported; and the percolation rate through the
unsaturated zone (which in turn depends on factors such as: the infiltration rate of rainwater into
the unsaturated zone; the hydraulic conductivity of the unsaturated zone; and moisture content
of the unsaturated zone). In the saturated zone, it is determined by: the cross-sectional area of
the saturated zone through which the radionuclides are transported; the hydraulic gradient; and
the hydraulic conductivity.
Sorption coefficients of the radionuclides in the geosphere, which determine the extent to
which radionuclides are retarded within the geosphere, resulting in for increased decay and
lowering of concentrations in geosphere water. Sorption coefficients can vary according to the
nature of the unconsolidated and consolidated materials that form the geosphere, and the
geochemical conditions in the geosphere.
For the GSA, consideration is given to a range of synthetic geospheres with differing averaged values
for the key parameters identified above. These are summarized in Tables 7 and 8, and discussed below
for disposal in the unsaturated zone (Section 3.2.1) and for disposal in the saturated zone
(Section 3.2.2). Alternative values for the parameters used are considered in the variant calculations
presented in Section 6.2.
3.1.2.1. Disposal in the Unsaturated Zone
3.1.2.1.1. Unsaturated Zone Characteristics
For the case with a disposal zone in the unsaturated zone, an unsaturated zone of 10 m below the base
of the disposal borehole is assumed, giving a total depth of unsaturated zone of 90 m (30 m closure
zone, 50 m disposal zone and 10 m of unsaturated zone below the disposal borehole). Such depths to
groundwater can be found in arid and semi-arid zones but are uncommon in humid zones. A reference
12
percolation rate of 5E-2 m y-1 and an associated water-filled porosity of 5E-2 are assumed (these are
considered to be values that are consistent with an unsaturated zone depth of 90 m, a total porosity of
1.5E-1 and degree of saturation of 3.3E-1), resulting in an unsaturated zone travel time of 10 years for
a conservative (non-sorbed) contaminant from the base of the borehole to the watertable. Assuming
that the flux is not limited by the engineered barriers of the near field10, this results in a flux through
the near field of about 3E-3 m3 y-1.
The geochemical parameters for the water percolating into the borehole are based on water No. 1
presented in Appendix II and summarized in Table 8. This is considered representative of an
oxidising, meteoric water with a low pH. Selecting a low pH is conservative in that it will promote
corrosion of the steel containers and the enhanced degradation of the cement grout.
3.1.2.1.2. Saturated Zone Characteristics
On reaching the saturated zone, it is assumed that the radionuclides migrate through the saturated
geosphere to the water abstraction borehole. An illustrative travel distance of 100 m to the abstraction
borehole is considered. Alternative distances are considered in the variant calculations in Section 6.2.
Four different sets of reference travel times, groundwater fluxes and associated hydraulic parameter
values are considered (see Table 7). These have been selected to represent saturated porous geospheres
with high, medium and low flow rates and a fractured geosphere with a high flow rate in the fractures.
These are considered to represent a realistic range of conditions that might be found in the field. For
the medium and low flow geospheres, the rate of flow of contaminated water into the abstraction
borehole is less than the demand and so it is assumed that the additional water required is abstracted
from uncontaminated horizons that the abstraction borehole also intercepts.
Geochemical parameters for the porewater in the saturated zone are summarized in Table 8. For the
high and medium flow systems, the parameter values are based on water No. 5 presented in Appendix
II, which is considered to be representative of fresh groundwater with a relatively short residence time
in the geosphere. For the low flow system, they are based on water No. 6 presented in Appendix II,
which is representative of groundwater with a relatively long residence time.
3.1.2.2. Disposal in the Saturated Zone
For disposal in the saturated zone, explicit consideration does not need to be given to the unsaturated
zone, other than recognizing its role in isolating waste from intrusion and providing recharge to the
saturated zone. The characteristics of the saturated zone are generally the same as the saturated
geosphere assumed for disposal in the unsaturated zone (see Section 3.2.1 and Tables 7 and 8).
However, an allowance is made for the cross-sectional area of contaminated flow being greater since it
is conservatively assumed that the water abstraction borehole intercepts the contaminated plume along
the full length of the disposal zone (50 m).
10 Account is taken of the effect of engineered barriers on water flux through the near field in the mathematical model presented in Appendix XI.131313
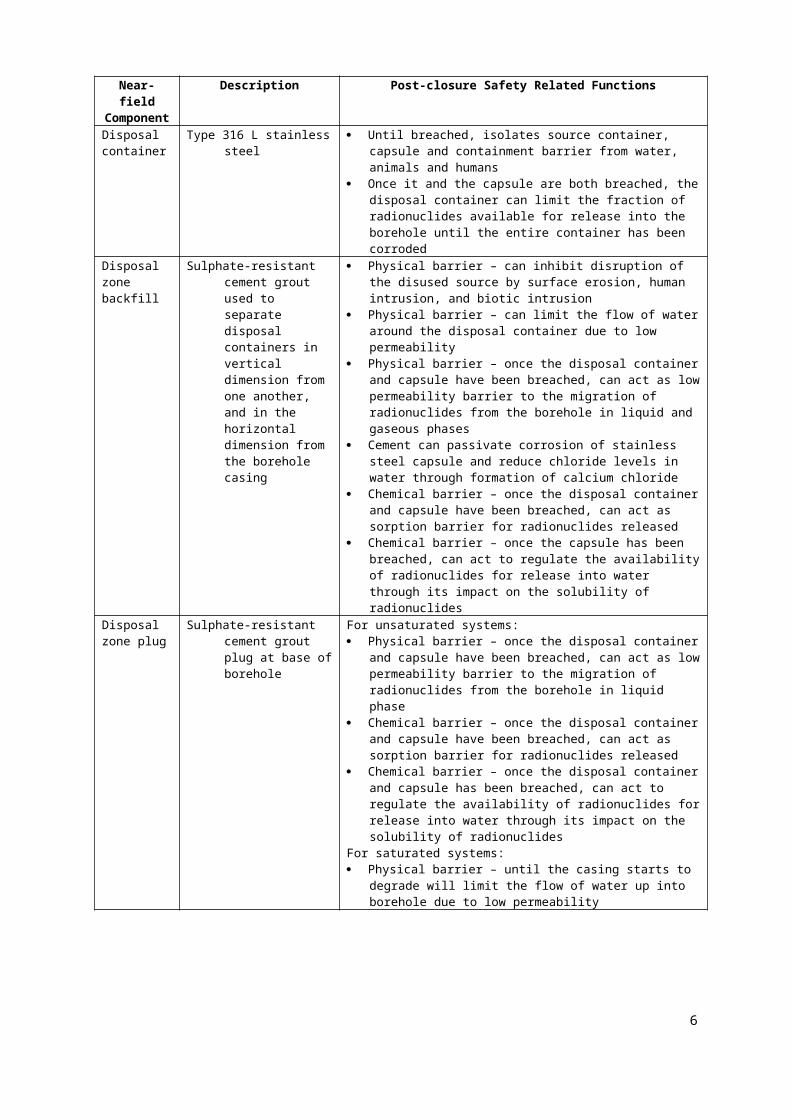
3.1.3.BiosphereFor a site-specific assessment, site-specific data relating to the biosphere can be collected and collated.
However, for a site-generic assessment, a range of ‘synthesised’ biospheres could be considered or a
single biosphere system could be developed applicable to a wide range of differing biosphere
conditions. In order to keep the number of calculations to a manageable level, the approach of using a
single biosphere has been adopted for the GSA. This reference biosphere assumes the use of
contaminated water direct from the abstraction borehole for domestic (drinking) and agricultural
purposes (watering of cattle and irrigation of green and root vegetables), resulting in a water
abstraction rate of 2.66 x 10² m3 y-1 (see Table L.22 in Appendix XII). It is recognized that
additional/alternative uses of the water could be envisaged and so these are considered in the variant
calculations in Section 6.2. BIOMASS recommended that, when describing a biosphere system, it is
important to consider: climate; surface water bodies; human activity; biota; near-surface
lithostratigraphy; topography; geographical extent; and location [13]. A brief description of each of
these features is given below for the reference biosphere considered in the GSA.
14
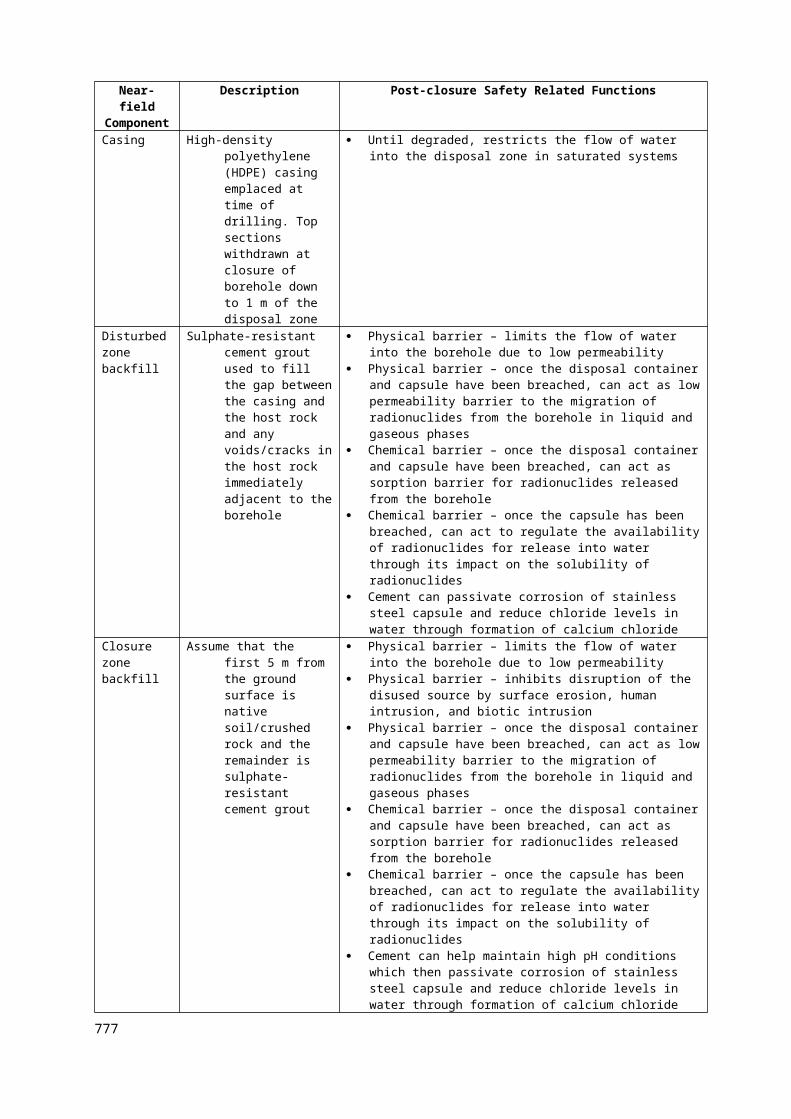
TABLE 7. HYDROGEOLOGICAL PARAMETER VALUES FOR THE REFERENCE GEOSPHERES’ SATURATED ZONEDistance to Abstraction
Borehole(m)
Hydraulic Conductivity
(m y-1)
Hydraulic Gradient
(-)
Water-filled
Porosity(-)
Cross-sectional Area of
Contaminated Plume (m2)
Water Flux in which Contaminated
Plume is Mixed(m3 y-1)f
Travel Time in Saturated Geosphere to Abstraction Borehole
(y)g
Fraction of Water Demand Supplied by Contaminated Water
(-)h
Disposal in unsaturated zoneHigh flow rate system: porous system 1E+2 1E+3 1E-2 1E-1 1E+0b 1E+1 1E+0 3.76E-2
High flow rate system: fractured system 1E+2 1E+3 1E-2 1E-1a 1E+0c 1E+1 1E+0 3.76E-2
Medium flow rate system 1E+2 1E+1 1E-2 1E-1 1E+0b 1E-1 1E+2 3.76E-4Low flow rate system 1E+2 1E-1 1E-2 1E-2 1E+0b 1E-3 1E+4 3.76E-6Disposal in saturated zoneHigh flow rate system: porous system 1E+2 1E+3 1E-2 1E-1 5E+1d 5E+2 1E+0 1.00E+0
High flow rate system: fractured system 1E+2 1E+3 1E-2 1E-1a 5E+1e 5E+2 1E+0 1.00E+0
Medium flow rate system 1E+2 1E+1 1E-2 1E-1 5E+1d 5E+0 1E+2 1.88E-2Low flow rate system 1E+2 1E-1 1E-2 1E-2 5E+1d 5E-3 1E+4 1.88E-5
Notes: a Water-filled porosity in fracture in saturated zone (matrix porosity is given in Table L.18).
b For disposal in the unsaturated zone, it is assumed that the radionuclides enter the saturated zone and then are horizontally and vertically dispersed, transverse to the direction of
flow. The degree of horizontal and vertical dispersion is assumed to be 1% of the distance to the abstraction borehole, consistent with Ref. [30], resulting in a plume cross-sectional
area of 1 m2.
c It is assumed that there is a fracture zone 0.1 m deep within the top 1 m of the saturated zone along which the contaminated water travels. The degree of transverse dispersion is
assumed to be 10% of the distance to the abstraction borehole (as opposed to the 1% value used for the porous system; reflecting the more open nature of the fracture), resulting in a
plume cross-sectional area of 1 m2.
d For disposal in the saturated zone, it is assumed that the radionuclides enter the saturated zone over the entire length of the disposal zone (50 m) and then are dispersed
transverse to the direction of flow. The degree of transverse dispersion is assumed to be 1% of the distance to the abstraction borehole, consistent with Ref. [31], resulting in a plume
cross-sectional area of 50 m2.
e It is assumed that 10% of the disposal zone length (i.e. 5 m) is intersected by fractures along which contaminated groundwater flows from the disposal borehole to the
abstraction borehole. The degree of transverse dispersion is assumed to be 10% of the distance to the abstraction borehole (as opposed to the 1% value used for the porous system;
reflecting the more open nature of the fracture), resulting in a plume cross-sectional area of 50 m2.
f Derived by multiplying the cross-sectional area of the plume by the hydraulic gradient and hydraulic conductivity.
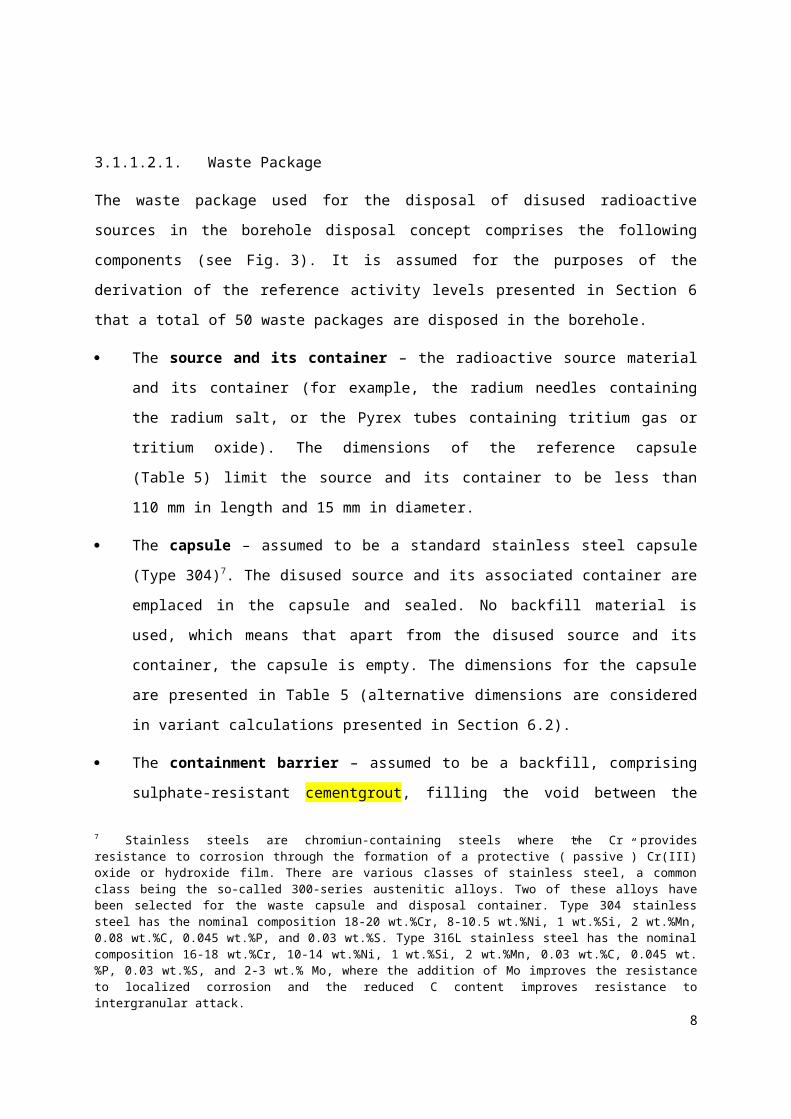
g Travel time for a non-sorbed radionuclide. Derived by multiplying the distance to the abstraction borehole by the water-filled porosity and dividing by product of the hydraulic
gradient and hydraulic conductivity.
h The minimum value of unity and the result of dividing the water flux, in which the contaminated plume is mixed, by the assumed abstraction rate (266 m3 y-1).
16
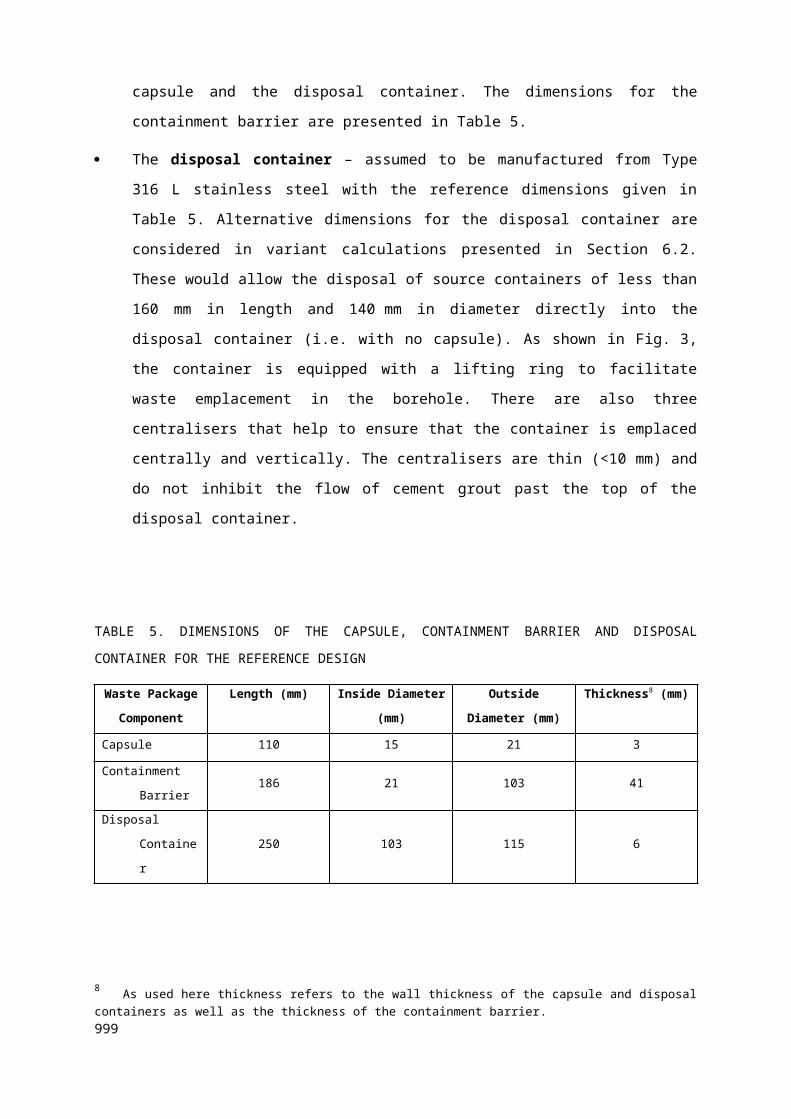
TABLE 8. GEOCHEMICAL PARAMETERS FOR POREWATER FROM UNSATURATED AND
SATURATED ZONES FOR THE REFERENCE GEOSPHERES
Determinand UnitsReference Water for Unsaturated
System a
Reference Water for High and Medium Flow
Saturated Systems b
Reference Water for Low Flow Saturated
Systems c
pH pH 4.1 8.46 7.95
Eh mV 996 -281 -303
Dissolved O2 mg l-1 12.0 - -
Na mg l-1 0.11 81.61 14185
K mg l-1 0.08 2.40 414.5
Mg mg l-1 0.05 1.22 6.05
Ca mg l-1 0.16 4.37 13.39
Si mg l-1 - 9.52 8.29
Al mg l-1 - 0.01 0.0001
Fe mg l-1 - 0.0001 0.0022
Mn mg l-1 - - -
Cl mg l-1 0.53 0.52 20917
SO4 mg l-1 2.88 10.66 2891
H2S mg l-1 - - -
N mg l-1 0.34 0.32 72.13
TIC mg l-1 0.23 42.52 415.58
Notes: a Values for water No. 1 presented in Appendix II.
b Values for water No. 5 presented in Appendix II.
c Values for water No. 6 presented in Appendix II.
Climate – it is assumed that the climate is consistent with the assumption of subsistence
agriculture land use (see below) and with the assumed geosphere characteristics (see Section
3.2). It is only in extreme climates (intense heat or cold) that subsistence agriculture cannot be
practiced for at least part of the year and that the geosphere characteristics are inconsistent with
those assumed in Section 3.2 (e.g. permafrost, glaciation, high salinity). Therefore, it is
considered that the generic biosphere is applicable to the majority of climates.
Surface water bodies – it is assumed that there are no significant surface water bodies in the
vicinity, consistent with the use of the abstraction borehole as a source of water.
Human activity – it is assumed that the abstraction borehole is drilled at the end of the
institutional control period (assumed to be 30 years – see Section 2.7) and that the abstracted
water is used for domestic (drinking) and agricultural purposes (watering of cattle and irrigation
171717
of green and root vegetables). It is assumed that the land is used for subsistence agriculture. In
the variant calculations in Section 6.2, consideration is given to other uses of the contaminated
water and land. It is also assumed that a dwelling can be constructed above the disposal
borehole at the end of the institutional control period. Consistent with the recommendations of
ICRP [5], no consideration is given to the development of new societal structures and
technologies.
Biota – it is assumed that cattle are raised and root and green vegetables grown, consistent with
the assumption of subsistence agriculture. Alternative livestock and crops are considered in the
variant calculations in Section 6.2.
Near-surface lithostratigraphy – it is assumed that there is a soil cover that is capable of
supporting the growth of root and green vegetables.
Topography – it is assumed that the topography is “subdued”11 and so is not subjected to
significant erosive or depositional processes that might affect the ability of the disposal system
to isolate the waste. This assumption is also consistent with the assumption that the hydraulic
gradient in the saturated geosphere is relatively shallow (1 in 100) (see Table 7) and that the
biosphere is used for subsistence agriculture. A surface erosion rate of 3 x 10⁻⁴ m y-1 is assumed
[13], consistent with the subdued topography of the site, which would result in the disposal zone
being uncovered by erosion after 100 000 years (assuming a disposal zone depth of 30 m – see
Section 2.2.3). The effect of alternative assumptions for surface erosion rates is considered in
the variant calculations in Section 6.2.
Geographical extent – it is assumed that the area of interest is limited to the area in the
immediate vicinity of the disposal and water abstraction boreholes, and the land used for raising
crops and animals.
Location – consistent with IAEA guidelines for the siting of radioactive waste disposal
facilities [27], it is assumed that the borehole disposal facility is not located in an area of
significant geomorphological activity (including flooding). Furthermore, it is assumed that the
site is located in a position that will not be susceptible to coastal processes and possible future
sea level rises.
3.1.4.Disposal systems of interestThe reference near-field, geosphere and biosphere characteristics for the GSA have been described in
Sections 3.1, 3.2 and 3.3, respectively. Further relevant information is provided in Appendix X for use
11 Used to imply that the land immediately in the vicinity of the disposal borehole is relatively flat, although there are some slopes (it could also be described as gently undulating or rolling). Thus the land does not have steep slopes nor, on the other hand, is it totally flat. The term is taken from the BIOMASS Theme 1 landform category described in Ref. [14] (the other categories are “plain” and “marked slope”).
18
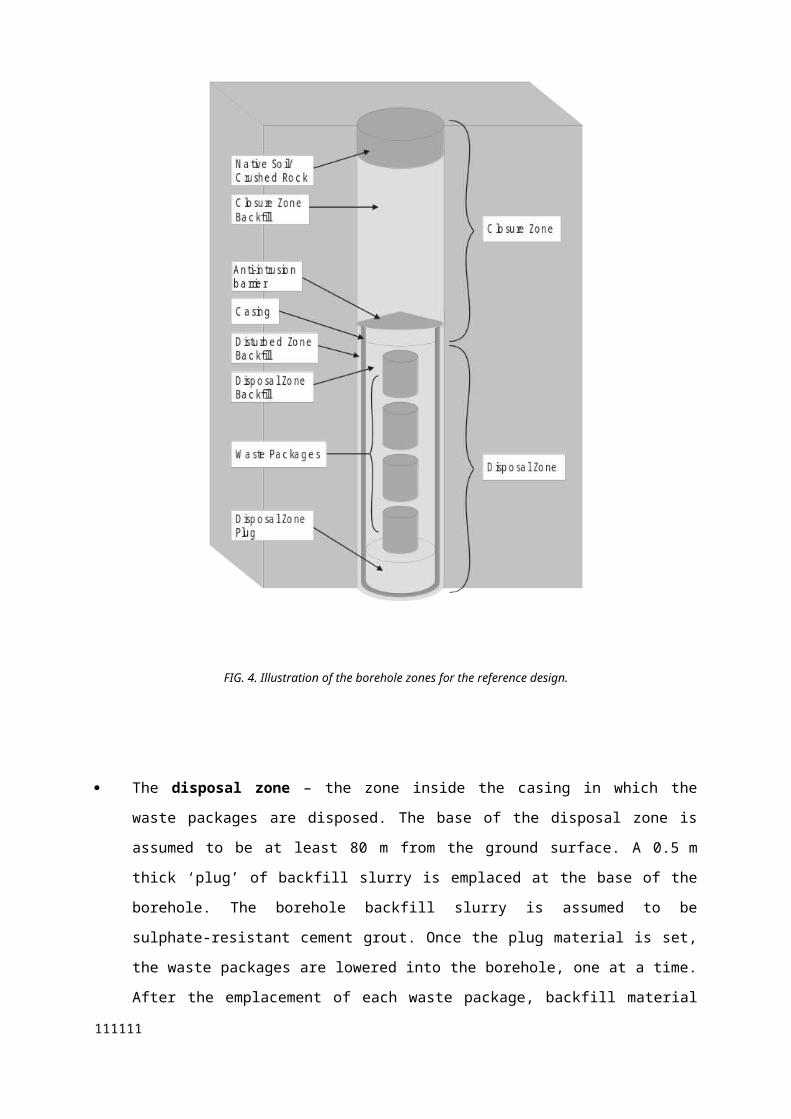
in the mathematical models used to represent each component of the disposal system in the GSA
calculations that are identified in Section 5. Note that information and calculations for variant
characteristic for the near field, geosphere and biosphere are presented in Section 6.2.
For certain near-field and geosphere characteristics, more than one reference option is considered in
order to allow the results of the GSA to be applicable to a range of conditions. The various options are:
disposal in either the unsaturated or saturated geosphere;
the assumption of either low, medium or high flow rates in the saturated geosphere; and
the assumption of either porous or fracture flow in the saturated (and unsaturated) geosphere.
Therefore eight potential disposal systems can be identified (Table 9).
TABLE 9. DIFFERING CHARACTERISTICS OF DISPOSAL SYSTEMS CONSIDERED
Near Field Saturated Geosphere
Disposal Zone Flow Rate Flow Type
Unsaturated
HighPorous
Fractured
Medium Porous
Low Porous
Saturated
HighPorous
Fractured
Medium Porous
Low Porous
191919
4. DEVELOPMENT AND JUSTIFICATION OF SCENARIOS
As used in this report, a scenario is a hypothetical sequence of processes and events, and is one of a set
devised for the purpose of illustrating the range of future behaviours and states of a disposal system,
for the purposes of evaluating a safety case [8]. Scenarios handle future uncertainties associated with
the processes and events by describing alternative future evolutions of the disposal system and allow
for a mixture of quantitative analysis and qualitative judgements. The purpose of scenario
development is not to try and predict the future; rather, it is to use scientifically informed expert
judgement to guide the development of descriptions of possible future evolution of the disposal system
to assist in making safety related decisions.
4.1. APPROACH
The approach to scenario development and justification used for the GSA is shown in Fig. 5 and
described in Appendix III. Using information relating to the assessment context (Section 2), the
system description (Section 3) and the status of scenario-generating external factors12, a ‘Design
Scenario’ was identified. The scenario represents how the disposal system can be expected to evolve
assuming the boreholes design functions as planned and provides a benchmark against which
alternative scenarios can be compared.
Alternative scenarios were then identified by considering possible alternative conditions for the
scenario-generating external factors, consistent with the assessment context and system description
(Table 10). The following four alternative scenarios were identified.
‘The Defect Scenario’ – it is assumed that not all components of the near field perform as
envisaged in the Design Scenario due to either defective manufacturing of waste packages (e.g.
welding defects), or defective implementation in the borehole (e.g. improper emplacement of
cement grout). This results in the earlier release of radionuclides from the near field.
12 Sub-divided into repository factors, geological processes and events, climate processes and events, and future human actions and behaviours.
20
FIG. 5. Scenario development and justification approach used.
TABLE 10. STATUS OF EXTERNAL FACTORS FOR ALTERNATIVE SCENARIOSExternal Factors
Alternative ScenariosDefect Unexpected Geological
CharacteristicsChanging
Environmental Conditions
Borehole Disturbance
Repository Factors
Not all near-field components perform as envisaged in the Design Scenario
Borehole constructed, operated and closed as designed and planned
Borehole constructed, operated and closed as designed and planned
Borehole constructed, operated and closed as designed and planned
Geological Processes and Events
No unexpected features, processes or events
Unexpected features, processes or events
No unexpected features, processes or events
No unexpected features, processes or
212121
eventsClimate Processes and Events
Constant climate conditions with continuous, gradual surface erosion
Constant climate conditions with continuous, gradual surface erosion
Changing climate conditions with more rapid surface erosion
Constant climate conditions with continuous, gradual surface erosion
Future Human Actions and Behaviours
Domestic and agricultural use of water from an abstraction borehole sunk at the end of the institutional control period.
Construction of a dwelling above the disposal borehole at the end of the institutional control period
Domestic and agricultural use of water from an abstraction borehole sunk at the end of the institutional control period.
Construction of a dwelling above the disposal borehole at the end of the institutional control period
Domestic and agricultural use of water from an abstraction borehole sunk at the end of the institutional control period.
Construction of a dwelling above the disposal borehole at the end of the institutional control period
Disturbance of the disposal borehole by human intrusion at the end of the institutional control period.
Domestic and agricultural use of water from an abstraction borehole sunk immediately adjacent to the disturbed disposal borehole.Construction of a dwelling above the disturbed disposal borehole.
Note: External factors in italic bold differ from those assumed for the Design Scenario.
‘The Unexpected Geological Characteristics Scenario’ – it is assumed that the actual
performance of the geosphere from a safety perspective is worse than the expected performance
(e.g. the geosphere is subjected to an unexpected seismic event resulting in the reactivation of
high permeability fractures and modification of associated sorption properties).
‘The Changing Environmental Conditions Scenario’ – it is assumed that the disposal system is
affected by climate change resulting in modifications to certain geosphere characteristics (e.g.
groundwater recharge rates) and biosphere characteristics (e.g. water demand, surface erosion
rates).
‘The Borehole Disturbance Scenario’ – it is assumed that drilling of a water abstraction
borehole immediately adjacent to the disposal borehole results in the disturbance of the disposal
borehole and the earlier release of radionuclides from the near field and subsequent exposure of
humans to radionuclides (e.g. due to the use of contaminated water from the abstraction
borehole).
On the basis of information provided in the assessment context and system description and in light of
the assumed status of the EFEPs, each of the above basic scenario descriptions is developed further in
the following sub-sections.
22
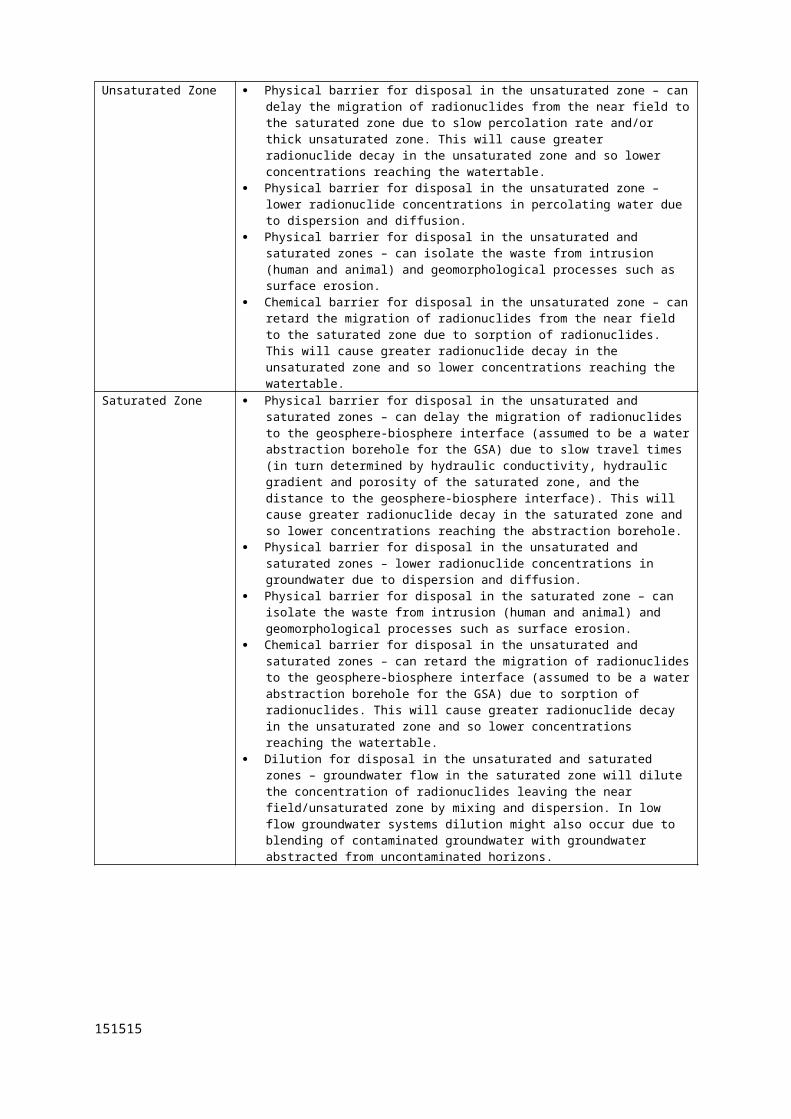
4.2. DESIGN SCENARIO
4.2.1.DescriptionThe first stage in the further development of the Design Scenario description is to consider the
temporal evolution of the disposal system (i.e. the near field, geosphere and biosphere). Each
component of the disposal system is considered in turn.
The near field has been sub-divided into a series of components based on the system description
(Table 4) and the temporal evolution of each component considered. The temporal evolution of each
near-field component is documented in Table 11 together with the associated assumptions.
For the geosphere component of the disposal system, it is assumed that there is no evolution over the
assessment period since the scope of the assessment is restricted to exclude those site conditions that
would reasonably be excluded based on the general IAEA guidelines for the siting of radioactive
waste disposal facilities [27, 28]. Geologically, this means that the site is located in a geologically
stable area with no or extremely limited tectonic and seismic activity (see Section 3.2).
TABLE 11. TEMPORAL EVOLUTION OF THE NEAR-FIELD COMPONENTS FOR THE DESIGN SCENARIO
Near-field Component
Temporal Evolution
Source container
In many cases the source container will still be intact at the time of disposal, due to proper quality control and quality assurance procedures during the conditioning of the sources. However, this cannot be guaranteed, nor can the longevity of the source container be guaranteed. Consequently, it is assumed that the source container will have failed prior to disposal. It is assumed that the radionuclides in the source container are available for potential release only once the capsule that surrounds the source container is breached.
Capsule A number of different types of corrosion can occur including general and localized (e.g. pitting and crevice). These mechanisms can be enhanced by high chloride concentrations in water and oxidising conditions. More rapid breaching of the capsule can be expected to result from localized corrosion in unsaturated conditons. Corrosion of capsule is assumed to start only once the disposal container and the associated containment barrier has been breached by water (see below).
Containment barrier
Physical and chemical degradation of the cement grout will start only once the disposal container has been breached and the cement grout is contacted by water. Initially the hydraulic conductivity might decrease due to carbonation, however with time it will increase due to the physical (e.g. cracking) and chemical (e.g. calcium leaching and sulphate attack) degradation of the cement grout due to contact with flowing water. Chemical degradation generally results in a decrease in the cement grout’s sorption capacity.
Disposal container
See discussion concerning capsule for corrosion mechanisms. Corrosion of disposal container is assumed to start before the corrosion of the capsule.
Disposalzone backfill
It is assumed that any shrinkage or jointing cracks that might form in the cement grout backfill do not act as significant water flow and hence radionuclide migration pathways. Initially the hydraulic conductivity might decrease due to carbonation, however with time it will increase due to the physical (e.g. cracking) and chemical (e.g. calcium leaching and sulphate attack) degradation of the cement grout due to contact with flowing water, especially once the borehole casing starts to fail (see below). Chemical degradation generally results in a decrease in the sorption capacity of the cement grout.
Disposalzone plug
Assumed to behave in the same manner as the disposal zone backfill.
Casing Processes such as embrittlement, cracking and biodegradation are assumed to result in the failure of the HDPE casing. References [32, 33] suggest HDPE lifetimes in the region 100 to 400 years. However, there is considerable uncertainty over lifetimes and it is therefore conservatively assumed that the casing fails immediately following closure
232323
Disturbed zone backfill
Assumed to behave in the same manner as the disposal zone backfill.
Closurezone backfill
The closure zone backfill will be subjected to surface erosion at a rate of 3 x 10⁻⁴ m y-1. The characteristics of the native soil/crushed rock used to fill the first 5 m of the closure zone from the ground surface is assumed to remain constant. The cement grout used to fill the remainder of the closure zone is assumed to behave in the same manner as in the disposal zone.
For the biosphere component of the disposal system, it is recognized that certain changes might occur
due, in the short term, to the effects of global warming and, in the longer term, due to global
glacial/inter-glacial cycling. However, it is considered that such changes will not have significant
impacts on the water uses considered in the GSA since they are applicable to a wide range of climatic
conditions (see Section 3.3). Consistent with the recommendations of ICRP [5], no consideration is
given to the development of new societal structures and technologies. Furthermore, consistent with
IAEA guidelines for the siting of radioactive waste disposal facilities [27], it is assumed that the
borehole disposal facility is not located in an area of significant geomorphological activity (including
flooding), although a constant rate of surface erosion is assumed (Section 3.3).
Consistent with the above discussion and the information in the assessment context and system
description, the following description of the Design Scenario can be developed.
4.2.1.1. Construction, Operation and Closure Periods
The current assessment only assesses post-closure safety. This section is included to clarify the status
of the facility following construction, operation and closure. It is assumed that the borehole is
constructed, operated and closed as designed and planned (see Section 3.1.2) with appropriate quality
assurance and no accidents or unplanned events.
During operations, measures are assumed to be taken to ensure that the waste packages are emplaced
in a dry environment, even if the disposal zone is below the watertable and that shrinkage cracks in the
backfill are minimized. The whole site area is controlled to prevent animal and unauthorized human
access. All site investigation activities are managed with the intention to ensure that there are no
adverse effects on post-closure safety.
4.2.1.2. Institutional Control Period
During the institutional control period, the emphasis is on passive rather than active control measures.
However, a limited level of environmental monitoring may be performed for the purpose of public
assurance. All monitoring activities are managed with the intention to ensure that there are no adverse
effects on post-closure performance.
At closure, it is assumed that no markers, which might encourage deliberate human intrusion, are fixed
at the site to reveal the location of a radioactive waste disposal facility. However, a detailed record of
24
the disposal site as well as the disposal facility and its content is available at the local authority. This
means that during the institutional control period certain land use controls are enforced. These land use
controls are related to the erection of buildings at the site and drilling of boreholes. After the
institutional control period (assumed to last 30 years for the Design Scenario – see Table 2), all
societal memory of the site is assumed to be lost.
Following construction, it is assumed that moisture starts to enter the borehole from above and/or
below and some corrosion of the stainless steel disposal containers begins. Nevertheless, the
containers remain intact and ensure that water does not come into contact with the waste. They also
ensure that there are no releases of gases for a period of at least 30 years.
4.2.1.3. Post-Institutional Control Period
Due to the corrosion of the stainless steel disposal containers and the subsequent corrosion of the
capsules, water eventually contacts the waste in source container, which in turn is assumed to have
failed prior to disposal. The radionuclides in the source container could be in a number of different
physical and chemical forms (Table 12) and so release of radionuclides could occur in the liquid or gas
phase.
For radionuclides released in the liquid phase, transport from the source container through the various
components of the near field can occur by advection, dispersion and diffusion. The relative importance
of these processes depends upon the hydrogeological conditions at the site. Migration through the near
field is limited by decay/in-growth, and sorption of the radionuclides onto the cement grout in the near
field. On leaving the near field, the radionuclides migrate through the geosphere by advection,
dispersion and diffusion and are subject to decay/in-growth, and retardation due to sorption onto the
rocks. Flow can be through pores or fractures and diffusion can occur into stagnant water in the rock
matrix depending upon the characteristics of the geosphere (Section 3.2). Again the relative
importance of these geosphere processes depends on the hydrogeological conditions at the site. The
groundwater is assumed to be abstracted from the geosphere via an abstraction borehole that is drilled
at the start of the post-institutional control period. The borehole is assumed to be 100 m down the
hydraulic gradient from the disposal borehole (Section 3.2) and used for domestic purposes (drinking)
and agricultural purposes (watering of cows and irrigation of root and green vegetables) (Section 3.3).
The water is not treated or stored before use. The main features of the Design Scenario for
radionuclides released in the liquid phase into the unsaturated and saturated disposal zones are
summarized in Figs 6 and 7, respectively.
252525
W a s te D is p o s a lZ o n e
C lo s u re Z o n e
W a te r ta b le
1 0 0 m
> 3 0 m
5 0 m
1 0 m
G ro u n d w a te r F lo w D ire c tio n
C o n ta m in a n t M ig ra te s th ro u g h th e U n sa tu ra te d Z o n e v ia P e rc o la tin g M e te o ric W a te r
D is p o s a lB o re h o le
W a te r A b s tra c tio n f ro m B o re h o le a t 2 6 6 m y
C o n ta m in a n tP lu m e
W a te r A b s tra c t io n B o re h o le
3 -1
FIG. 6. Design scenario: liquid releases for unsaturated disposal zone.
W a s te D is p o s a lZ o n e
C lo s u re Z o n e
1 0 0 m
> 3 0 m
D is p o s a lB o re h o le
W a te r A b s tra c t io n fro m B o re h o le a t 2 6 6 m y
G ro u n d w a te r F lo wD ire c tio n
W a te r ta b le
3 -1
C o n ta m in a n t P lu m e
5 0 m
W a te r A b s tra c t io n B o re h o le
FIG. 7. Design scenario: liquid releases for saturated disposal zone.
26
TABLE 12. PHYSICAL AND CHEMICAL FORMS OF RADIONUCLIDES IN DISUSED SOURCES
Radionuclide Physical/Chemical Form
H-3 Often tritium gas or liquid as H2 O
Co-60 Metallic form in thin discs or small cylindrical pellets. Very low solubility.
Ni-63 Solid, electrical deposition on metal foil
Kr-85 Gas
Sr-90 Oxide or titanate form.
Often silver plated for medical applications.
Ceramic or glass bead or rolled silver foil for other applications
Cs-137 Only used as a salt (often caesium chloride).
Sometimes ceramic form for weak sources (very low solubility)
Pb-210 Solid, mainly carbonate, and sulphate
Ra-226 (+ Rn gas) Very reactive alkaline earth metal in form of salts (e.g. bromides, chlorides, sulphates or carbonates). All soluble
Pu-238 (+ Rn gas) Used in RTGs, and for neutron generators and calibration. Sources typically have Pu oxide in ceramic.
Pu-239
Am-241 Chemical characteristics similar to rare earth metals. Americium oxides normally used.
For neutron sources, fine americium oxide powder used mixed with beryllium powder. Often in pellet form.
Sometimes in sintered form.
The failure of the containers and capsules allows radioactive gases to be released, which is assumed to
migrate up the borehole through the closure zone into the biosphere. It is conservatively assumed that
a dwelling is constructed on top of the borehole (without intruding into the disposal zone of the
borehole) at the start of the post-institutional control period, resulting in the gases migrating directly
into the dwelling and being inhaled by the occupants. The main features of the Design Scenario for
radionuclides released in the gas phase into the unsaturated and saturated disposal zones are
summarized in Figs 8 and 9, respectively.
272727
C lo s u re Z o n e
W a s teD isp o s a lZ o n e 5 0 m
> 3 0 m
W a te r ta b le
D isp o s a lB o re h o le
D w e l lin g C o n s tru c te d a f te rL o ss o f In s ti tu t io n a l C o n tro l
U p w a rd M ig ra t io n o f G a s e sin to D w e llin g
FIG. 8. Design scenario: gas releases for unsaturated
disposal zone.
C lo s u re Z o n e
W a steD is p o s a lZ o n e
5 0 m
> 3 0 m
W a te r ta b le
D is p o s a lB o r e h o le
D w e llin g C o n s tr u c te d a f te rL o ss o f In s ti tu tio n a l C o n t ro l
U p w a rd M ig ra tio n o f G a s e sin to D w e llin g
28
FIG. 9. Design scenario: gas releases for saturated
disposal zone.
The combination of the assumed surface erosion rate (3 x 10⁻⁴ m y-1 – see Section 3.3) and the depth of
the disposal zone from the ground surface (30 m – see Section 3.1.2) results in the waste being
uncovered after 100 000 years. The main features of the Design Scenario for radionuclides released in
the solid phase are summarized in Fig. 10.
O rig in a l G ro u n d S u r fa c e
C lo su re Z o n eE ro d e d
W a s teD is p o s a lZ o n e
D is p o s a l B o re h o le
S o il C o n ta m in a te d b y M a te r ia l f ro m E ro d e d B o re h o le
FIG. 10. Design scenario: solid releases.
4.2.2.FEP ScreeningAs a check to ensure that all potentially relevant FEPs have been considered in the scenario, a list of
potentially relevant FEPs has been selected and screened for the scenario, on the basis of information
provided in the assessment context, system description and the scenario description. A FEPs list based
292929
on that developed in the ISAM programme [8] and subsequently updated13 has been used. The
screened FEP list for the Design Scenario is presented in Appendix IV. Text is provided to explain
why each FEP has been included (indicated by a ‘Yes’) or excluded (indicated by a ‘No’) from
consideration in the Design Scenario based on information from the assessment context, system
description and/or scenario description.
Since the near field (i.e. waste, waste form and engineered features) is a significant component of the
borehole disposal system and its evolution, the relevant FEPs identified in the FEP list (i.e. FEP 2.1.1
to 2.1.5) have been further broken down into 53 FEPs. These are presented and screened in
Appendix V.
4.3. DEFECT SCENARIO
4.3.1.DescriptionThe scenario assumes that a properly qualified team applies appropriate quality assurance and quality
control (QA/QC) to the construction, operation and closure activities. For example radiographic and
other post-weld inspection procedures are expected to be part of the waste capsule and container
fabrication process. This assumption of appropriate QA/QC limits the extent of the defects that might
arise. However, as in any engineering system, some defects may arise despite best efforts to eliminate
them. Furthermore, maintaining quality during field welding, as is envisaged for the borehole disposal
concept, is generally more challenging than during shop welding.
Therefore the scenario assumes that not all components of the near field perform as envisaged in the
Design Scenario, resulting in the earlier release of radionuclides from the near field.
A range of possible defects involving one or more of the near-field barriers (i.e. capsule, containment
barrier, disposal container, disposal and disturbed zone backfill and casing) can be identified. These
are summarized and screened in Table 13. Four Defect Scenario variants are identified:
D1: all welds are satifactory due to QA/QC except for the closure weld in one 316 L waste
container. All other near-field barriers as per Design Scenario.
D2: All welds are satifactory due to QA/QC except for the closure weld in one 304 waste
capsule. All other near-field barriers as per Design Scenario.
D3: degraded/incomplete disposal/disturbed zone cement grout. All other near-field barriers
as per Design Scenario.
13 INTERNATIONAL ATOMIC ENERGY AGENCY, A Generic List of Features, Events and Processes (FEPs) for Near Surface Radioactive Waste Disposal Facilities, Draft TECDOC, IAEA, Vienna (2004).
30
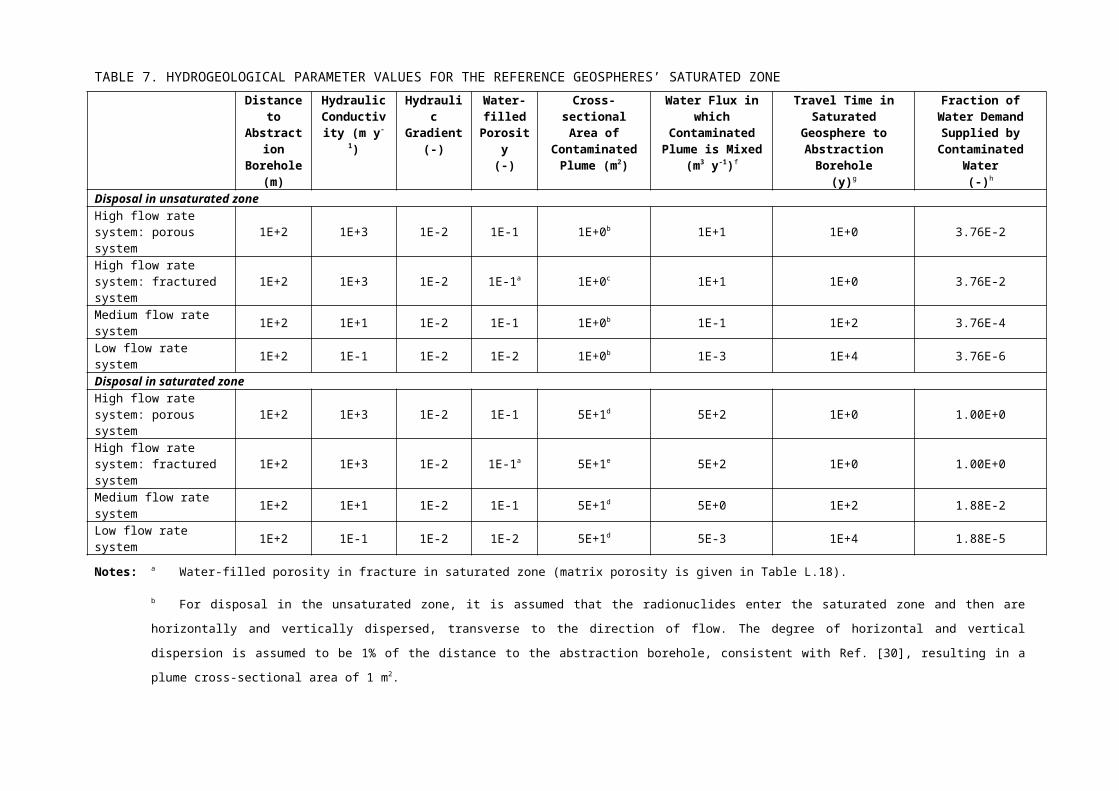
D4: all welds are satifactory due to QA/QC except for the closure weld in one 316 L waste
container and one 304 waste capsule. The faulty capsule is in the faulty container. All other
near-field barriers as per Design Scenario.
4.3.2.FEP ScreeningThe screened FEP list for the Defect Scenario is presented in Appendix VI. Text is provided to explain
why each FEP has been included (indicated by a ‘Yes’) or excluded (indicated by a ‘No’) from
consideration in the Defect Scenario based on information from the assessment context, system
description and/or scenario description. In addition the detailed near-field FEPs are presented and
screened in Appendix V.
313131
TABLE 13. POSSIBLE DEFECTS CONSIDERED
Description Considered in Defect Scenario Calculations (Variant Number)
Justification
All welds okay due to QA/QC except for the closure weld in one 316 L disposal container.
All other near-field barriers as per Design Scenario.
Yes (D1) Cannot be ruled out.
For the mass production of welded structures under strict QA/QC procedures, the probability of an individual undetected, through-wall defect is of the order of 10-3-10 -4 [35]. Because of the potential for more challenging conditions for welding and inspecting the waste container, the higher end of this range (10-3) is assumed for the GSA. The probability that the weld on 1 of the 50 disposal containers in the borehole contains a defect can be estimated based on a binomial distribution, and is found to be 0.05 for an individual probability of 10-3. The probability that 2 out of the 50 disposal containers in a borehole will contain defects is 0.0012 and is considered to be too small to be of concern here.
All welds okay due to QA/QC except for the closure weld in one 304 waste capsule.
All other near-field barriers as per Design Scenario.
Yes (D2) Feasible although considered to be lower consequence than D1. A similar probability for an individual defect (i.e., 10-3) is assumed, and for the probability that only 1 out of the 50 waste capsules will contain a defect.
Missing/degraded/incomplete containment barrier cement grout.
All other near-field barriers as per Design Scenario.
No, but missing cement grout is covered by a “What-if” calculation to be presented separately from the Defect Scenario results
It is considered that the absence of cement grout would be noted due to the reduced weight of the container and the rattling of the capsule in the container (so multiple incompetence would be required for this case to arise).
Degraded/incomplete is feasible but considered to be low consequence in comparison to D3.
Missing/degraded/incomplete disposal/disturbed zone cement grout.
All other near-field barriers as per Design Scenario.
Yes (D3) Cannot be ruled out. Probability assumed to be c. 1%.
Consider more rapid chemical and physical degradation of cement grout than for Design Scenario.
Case of missing cement grout is covered under “What-if” calculation presented separately from the Defect Scenario results.
Missing casing.
All other near-field barriers as per Design Scenario.
No No credit is taken for the casing in the Design Scenario
All engineering barriers are missing. No, but to be covered by “What-if” calculations presented separately from the Defect Scenario results
Very low probability
All welds okay due to QA/QC except for the closure weld in one 316 L disposal container and one 304 waste capsule. The faulty capsule is in the faulty container.
All other near-field barriers as per Design Scenario.
Yes (D4) Based on probabilities of 10-3 for individual weld defects and of 0.05 that 1 out of the 50 disposal containers and waste capsules contain a defect, the probability that the defected waste capsule is inside the defected disposal container is 0.05 x 0.05 50 = 5 x 10⁻⁵. Although of low probability, the consequences of this scenario could be high (since there could be immediate release from the waste package) and warrants analysis.
This is considered to be the most likely two-barrier failure scenario.
All welds okay due to QA/QC except for the closure weld in one 316 L disposal container and degraded/incomplete
No, but covered by “What-if” calculations presented
Considered to be low probability since it requires two independent failure events.
32
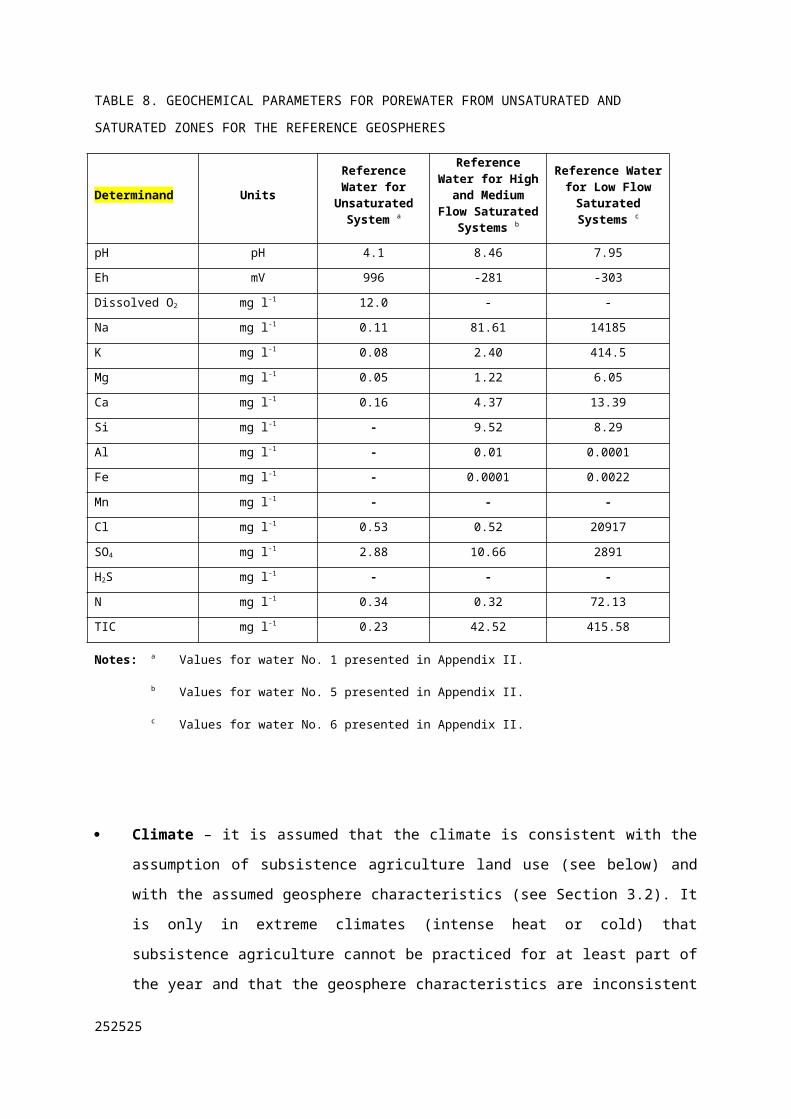
Description Considered in Defect Scenario Calculations (Variant Number)
Justification
disposal/disturbed zone cement grout.
All other near-field barriers as per Design Scenario.
separately from the Defect Scenario results
333333
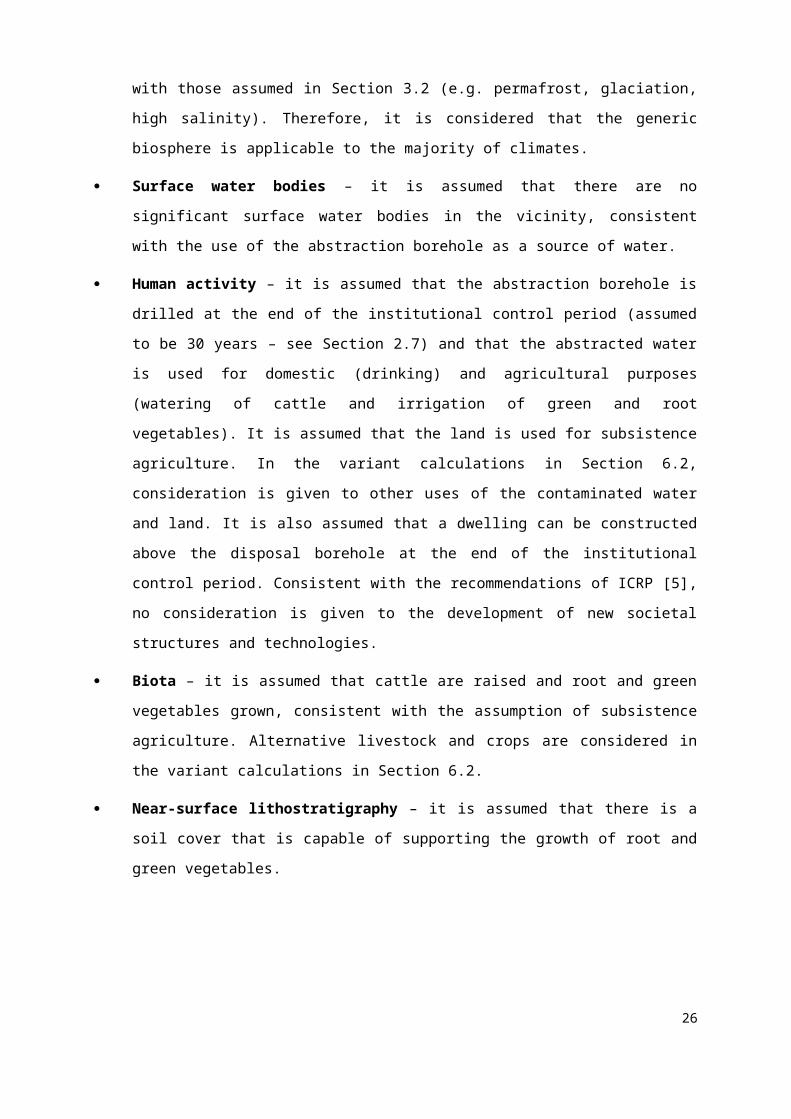
4.4. UNEXPECTED GEOLOGICAL CHARACTERISTICS SCENARIO
This scenario assumes that the actual performance of the geosphere from a safety perspective is worse
than its expected performance, resulting in the more rapid transport of radionuclides through the
geosphere. This could be due to a number of factors such as: higher hydraulic conductivities than
anticipated; lower geosphere sorption coefficients than anticipated; the presence of undetected high
permeability zone(s); and the reactivation of high permeability zone(s) due, for example, to
unexpected seismic activity.
It is not necessary to develop a separate scenario, as the range of geosphere characteristics (considered
in Section 3.2) combined with the additional geosphere parameter sensitivity analysis (presented in
Section 6.2) bound the consequences of this scenario. For example, Table 7 shows that a four order of
magnitude range of geosphere travel times is considered. Results from a previous GSA, that did
consider a seismic event scenario [36], further support the screening out of the scenario.
4.5. CHANGING ENVIRONMENTAL CONDITIONS SCENARIO
This scenario assumes that the disposal system is affected by climate changes caused by the effects of
global warming in the short term, and global glacial/inter-glacial cycling in the longer term. These
changes will result in modifications to certain geosphere characteristics (e.g. groundwater recharge
rates) and biosphere characteristics (e.g. water demand, surface erosion rates).
It is not necessary to develop a separate scenario, as the range of geosphere characteristics (considered
in Section 3.2) combined with the additional geosphere and biosphere parameter sensitivity analysis
(presented in Section 6.2) bound the consequences of this scenario. Furthermore, such changes will
not have significant impacts on the water uses considered in the GSA since they are applicable to a
wide range of differing climatic conditions (see Section 3.3). Results from a previous GSA, that did
consider an environmental change scenario [36], further support the screening out of this scenario.
4.6. BOREHOLE DISTURBANCE SCENARIO
The impact of deliberate human intrusion is considered to be beyond the scope of the GSA (see
Section 1.3).
The depth of the disposal zone (at least 30 m from the ground surface), the small footprint of the
disposal borehole, and its location in an area that has no natural resources requiring excavation by
extensive surface excavation or underground mining (Section 3.2), all mean that the likelihood of
inadvertent human intrusion directly affecting the disposal borehole is extremely low. Even if the site
were to be developed, given the disposal borehole’s narrow cross-sectional area (about 5E-2 m2) and a
site investigation borehole density of 1 per 1000 m2 [37], the likelihood of an investigation borehole
34
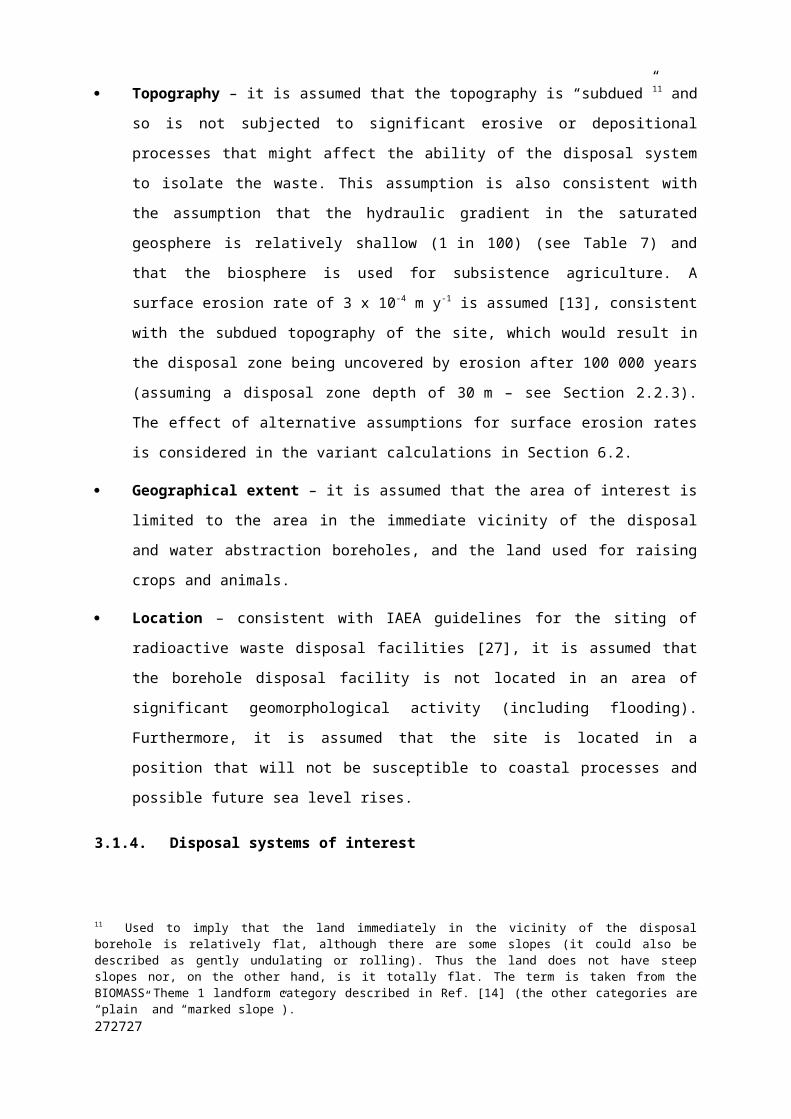
being within the footprint of the disposal borehole is around 1 in 20 000. Furthermore, even if the
investigation borehole were to be within the footprint of the disposal borehole, the various components
of the near field, such as the steel of the disposal container and the capsule and the anti-intrusion
barrier above the disposal zone (see Section 3.1.2), could be expected to deter direct intrusion into the
disposal zone. Due to these reasons, further consideration is not given to the borehole disturbance
scenario.
353535
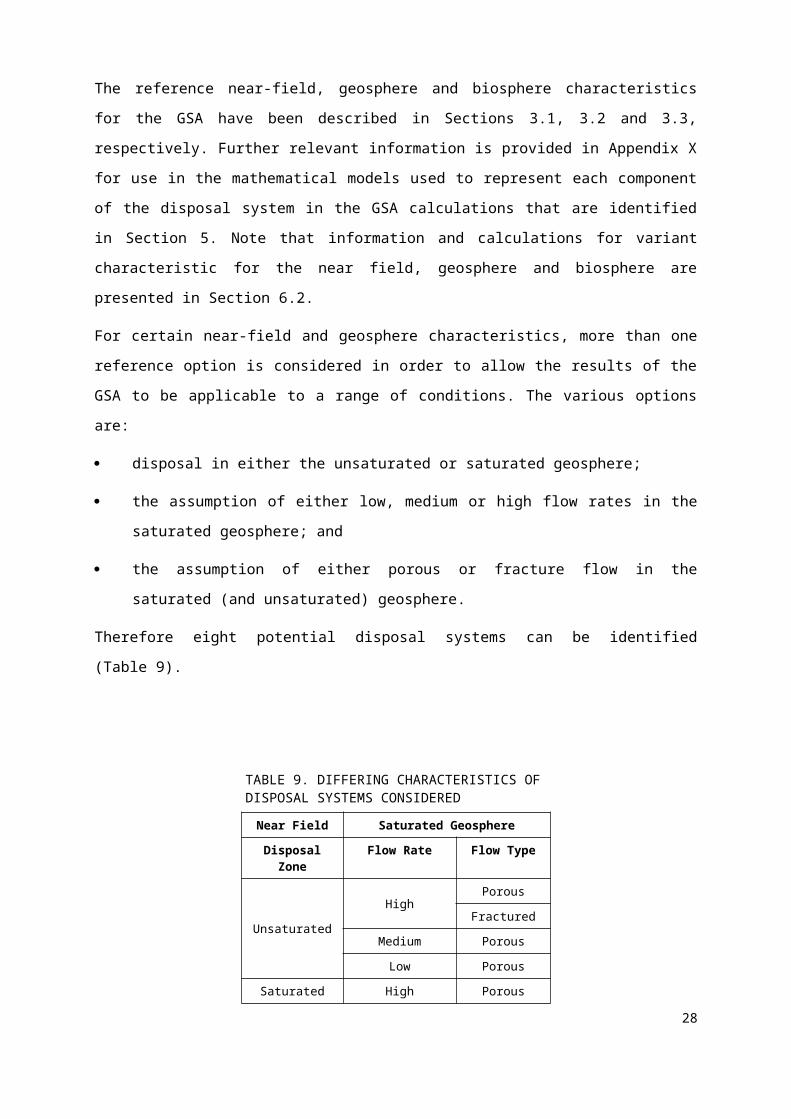
5. FORMULATION AND IMPLEMENTATION OF MODELS
5.1. APPROACH
The model formulation and implementation process is shown in Fig. 11. Information from the
assessment context, system description and scenario development steps of the safety assessment
approach can be used to help generate conceptual models of the disposal system for the scenarios to be
assessed (i.e. the Design and Defect Scenarios). These conceptual models and their associated
processes are represented in mathematical models that are then implemented in computer codes.
Throughout this process, data are used to help develop the conceptual and mathematical models and as
input to the computer codes.
FIG. 11. Model formulation and implementation process used.
36
Assessment
Context
System Description
Scenarios
System Data and
Understanding
Model Parameter
Values
Conceptual Models
Mathematical Models
Implementation of Mathematical
Models in Computer Tool(s)
Model Formulation
and Implementation (Step 4 of the ISAM Safety Assessment Approach)

5.2. CONCEPTUAL MODELS
The Interaction Matrix approach has been used to help identify the main components of the disposal
system and the processes that result in the release and migration of radionuclides through the system
(Appendix VII). The conceptual model for each of the system’s main components (near field,
geosphere and biosphere) is summarized below.
5.2.1.Near FieldThe near field is comprised of a series of engineering barriers. Working from the outside inwards,
these comprise (see Fig. 3):
the disturbed zone cement grout backfill;
the HDPE casing;
the disposal zone cement grout backfill;
the stainless steel disposal container;
the cement grout containment barrier inside the disposal container;
the stainless steel capsule; and
the source container.
The HDPE casing and source container are assumed to have failed by closure of the borehole
(Table 11). Therefore, the migration of radionuclides from the near field is controlled by the
degradation of the cement grout and stainless steel barriers and the release of radionuclides from the
disused source into the borehole. The models for cement grout and stainless steel degradation adopted
for the GSA are described in detail in Appendices H and I, respectively, and summarized below. The
release and transport models are also presented below. Further information concerning the role of
specific near-field FEPs is provided in Appendix V.
373737
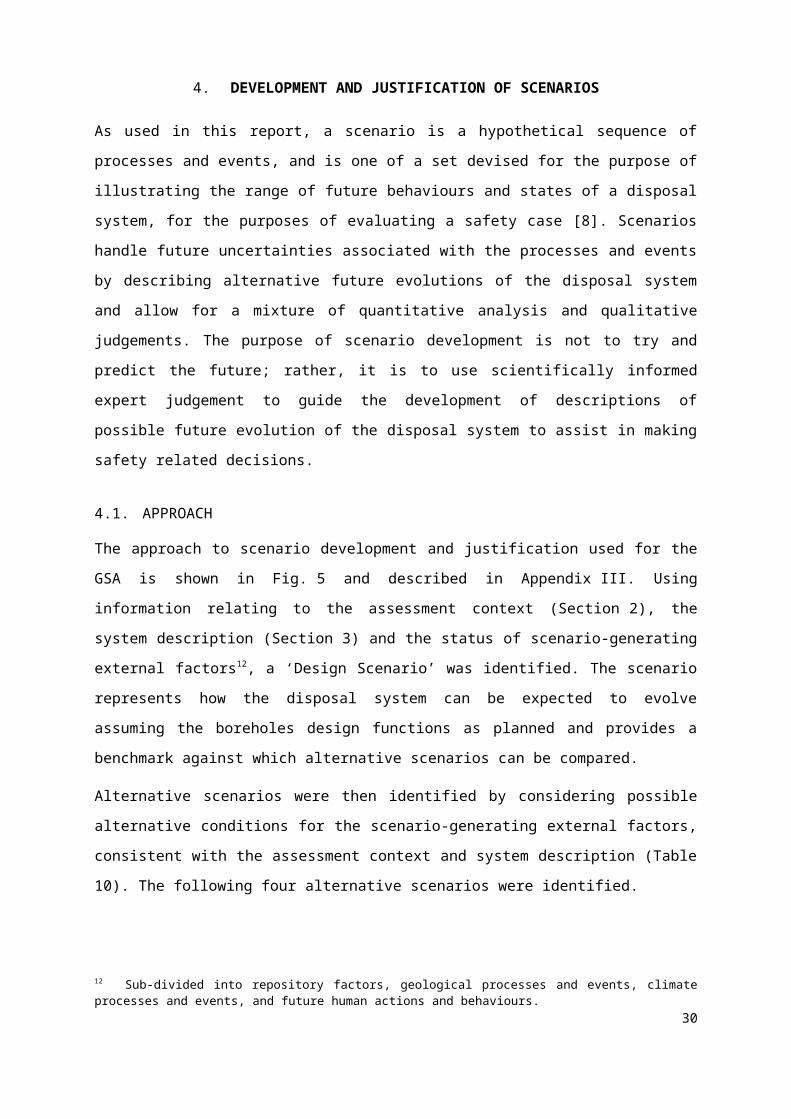
5.2.1.1. Cement Grout Degradation
The various alteration processes discussed in Appendices E and H (e.g. chloride binding, carbonation,
ettringite precipitation, expansion caused by corrosion) will affect the chemical and physical
degradation of the cement grout. Four stages of degradation are considered based on the work reported
in Refs [38, 39].
Stage 1 – porewater pH is around 13.5, owing to the presence of significant NaOH and KOH and
such high pHs can persist during flushing by about 100 pore volumes of water. It is assumed
that the values for chemical and physical parameters such as sorption coefficient, porosity and
hydraulic conductivity are comparable with those for undegraded cement grout.
Stage 2 – porewater pH has fallen slightly to about 12.5, owing to buffering by Ca(OH)2 and this
pH can persist during flushing by an additional 900 pore volumes. Although pH has declined
slightly, it is assumed that the chemical and physical parameter values are the same as for
Stage 2.
Stage 3 – porewater pH diminishes steadily from 12.5 to about background groundwater pH,
owing to buffering with C-S-H phases having progressively decreasing Ca/Si ratios. This stage
can persist during flushing by approximately an additional 4000 to 9000 pore volumes. There is
significant chemical and physical degradation of the cement grout resulting in changes in
chemical and physical parameter values. It is assumed that there is a linear change during Stage
3 in parameter values from the start value (i.e. value for undegraded conditions) to the end value
(i.e. value for degraded conditions).
Stage 4 – porewater pH returns to that of the background waters and the cement grout is fully
degraded. The chemical and physical parameter values are the same as those at the end of
Stage 3 (i.e. degraded values).
As discussed in Appendix VIII, the exact duration of each stage depends on the composition of
groundwater (in particular groundwater pH), the rate of groundwater flow (the higher the flow, the
more rapid the pore flushes and the more rapid the degradation) and the nature of the scenario
assessed. Shorter stages are assumed for the Defect Scenario Variant D3 ( incomplete or degraded
disposal zone cement grout) (see Section 4.3).
5.2.1.2. Stainless Steel Corrosion
A review of the literature indicates that, for the expected environmental conditions, Types 304 and
316L stainless steel will be subject to general corrosion and, under aerobic conditions only, localized
corrosion in the form of crevice corrosion or pitting, the probability of which increases as near-field
pH decreases. Although stress corrosion cracking (SCC) is also possible in aerobic environments, it
occurs under more aggressive conditions than localized corrosion and, as such, will be preceded by
38
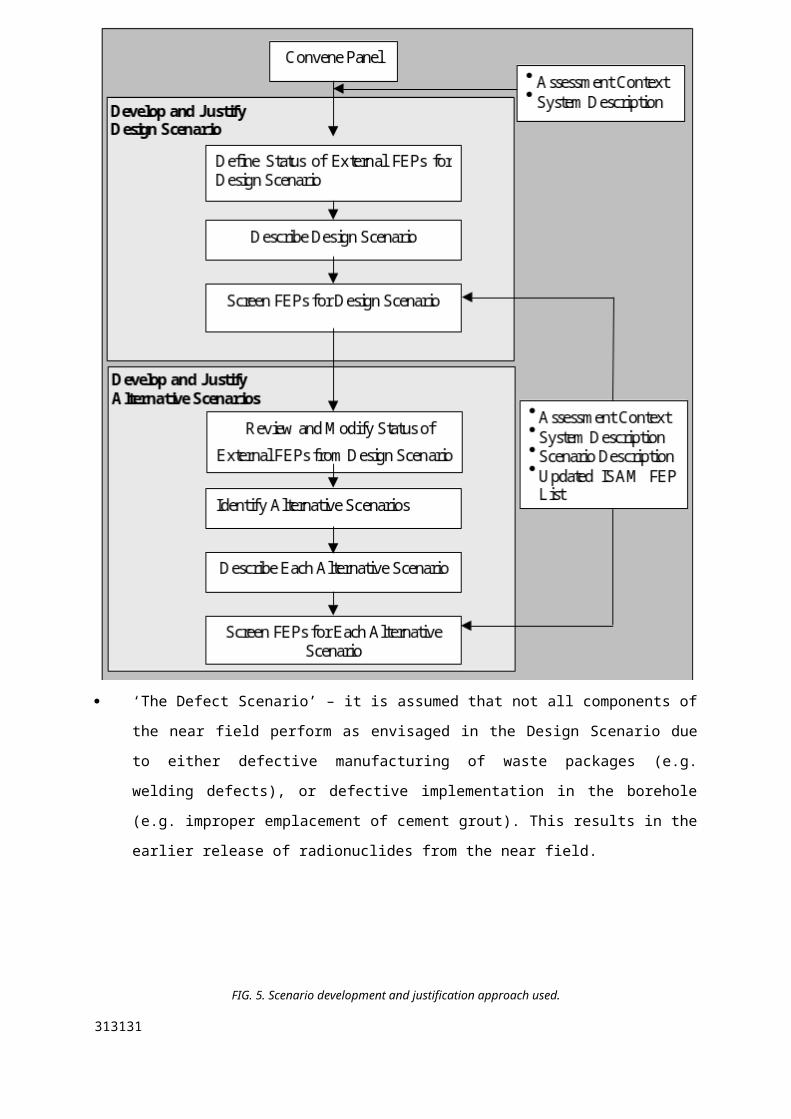
localized attack. Therefore, failure by SCC is not explicitly included in the corrosion model.
Microbiologically influenced corrosion (MIC) of stainless steel is also possible in natural
groundwaters, but because of the conditioning of the near-field pH by the cementitious materials,
microbial activity will be limited until such time that the near-field pH drops below ~pH 10. Since the
majority of containers are calculated to have failed by general corrosion before the pH drops below
this value, MIC has not been explicitly included in the corrosion model developed for the GSA.
For the corrosion model, a four-stage time-dependent evolution of the near-field chemistry has been
used. The evolution of the cement grout porewater pH is assumed to evolve through the stages defined
above. Table 14 provides a summary of the corrosion processes included in the model for each stage in
the evolution of the environment and for both aerobic and anaerobic groundwaters (details are
provided in Appendix I). Since general corrosion dominates in all conditions, the corrosion model
assumes instantaneous complete failure of the containers rather than gradual failure. It is also assumed
that internal corrosion of the disposal containers and capsules is not significant and is therefore not
considered.
The corrosion model assumes that the corrosion rate is a function of not only pH but also chloride
concentration and redox potential (reducing low chloride conditions give lower corrosion rates than
oxidising high chloride conditions) (Appendix I). The porewater chloride concentration and redox
potential are assumed to be spatially and temporally constant and to be determined by the groundwater
properties.
The four Defect Scenario variants identified in Section 4.3 will reduce the lifetimes of the affected
containers due to the earlier onset of corrosion, although the processes will be the same as the Design
Scenario (see Appendix I). Variant D3 (incomplete or degraded disposal and disturbed zone cement
grout) compromises the ability of the cement grout to condition the near-field pH and can result in
substantially shorter lifetimes in aerobic environments because of the possibility of rapid localized
corrosion failure of the disposal container.
TABLE 14. SUMMARY OF THE GSA CORROSION MODEL
pH Aerobic conditions Anaerobic conditions
Stage 1 (pH 13.5) General corrosion only General corrosion only
Stage 2 (pH 12.5) General corrosion only General corrosion only
Stage 3(a) (pHCRIT < pH < 12.5) General corrosion only General corrosion only
Stage 3(b) (pHGW < pH pHCRIT) General and localized corrosion General corrosion only
Stage 4 (pHGW) General and localized corrosion General corrosion only
Note: pHCRIT is defined as pH 10 for Type 316 stainless steel and pH 11 for Type 304 (see Appendix I).
393939
Anaerobic corrosion is accompanied by the generation of hydrogen gas. The most aggressive rates of
general corrosion are predicted in aerobic waters, in which corrosion is supported by the cathodic
reduction of O2 and does not lead to H2 generation. In contrast, the rates of anaerobic corrosion are
lower and are estimated to be in the range 0.01-1 m y-1, the lower end of the range corresponding to
fresh, high-pH conditions and the upper end of the range to saline, near-neutral pH waters. Because
the disposal containers tend to fail prior to the establishment of near-neutral pH conditions, the
predicted maximum rate of H2 generation is of the order of 4-8 ml y-1 per disposal container, or 200-
400 ml y-1 per borehole. Following failure of the disposal containers, the rate of gas production will
decrease by a factor of ~12 (for the same corrosion rate), as the surface area of the waste capsule is
much smaller than that of the disposal container. It is likely that H2 generated at these rates will be
transported away from the borehole and that a separate gaseous H2 phase is unlikely to develop within
the borehole.
5.2.1.3. Release of Radionuclides
Due to the corrosion of the stainless steel disposal containers and the subsequent corrosion of the
capsules, water eventually contacts the waste in source container, which is assumed to have failed
prior to disposal. The radionuclides in the source container could be in a number of different physical
and chemical forms and release of radionuclides could occur on breaching of the waste capsule due to
the following mechanisms (Table 15).
Instantaneous release of gas for radionuclides that are in gaseous form (H-3 and Kr-85) or
which have gas phase progeny (Rn-222 for Ra-226 and Pu-238).
Instantaneous dissolution of radionuclides that are in a form that would result in immediate
release to water (e.g. liquid, soluble solid, surface contamination) (H-3, Ni-63, Sr-90, Cs-137,
Pb-210, Ra-226 and Am-241).
Congruent release of radionuclides that are in a form that would result in slow release to water
(e.g. solid with low solubility) (Co-60, Pu-238 and Pu-239).
It is recognized that the instantaneous dissolution and congruent release mechanisms could, under
certain circumstances, be solubility limited (see Table 15 and Appendix X). No solubility limitation is
considered for the reference case calculations (a conservative assumption).
5.2.1.4. Migration of Radionuclides
For radionuclides released in the liquid phase, transport from the source container through the various
components of the near field can occur by advection, dispersion and diffusion. The relative importance
of these processes depends upon the hydrogeological conditions at the site. Migration through the near
40
field is limited by decay/in-growth, and sorption of the radionuclides onto the cement grout in the near
field. It is assumed that the migration is not solubility limited (see Appendix X).
For radionuclides released in the gas phase, it is assumed that, if the disposal zone is in the saturated
zone, H-3 gas is dissolved in the groundwater, whilst Kr-85 and Rn-222 remain in the gas phase. It is
conservatively assumed that the Kr-85 will migrate directly up into the unsaturated zone and then into
the biosphere via the closure zone. The very short half-life of Rn-222 (around 3 days) means that there
likely to be significant decay within the saturated zone, although some will reach the unsaturated zone
and might eventually discharge into the biosphere via the closure zone. If the disposal zone is in the
unsaturated zone, it is assumed that the H-3, Kr-85 and Rn-222 gases remain in the gas phase and
migrate up the borehole through the closure zone and into the biosphere.
414141
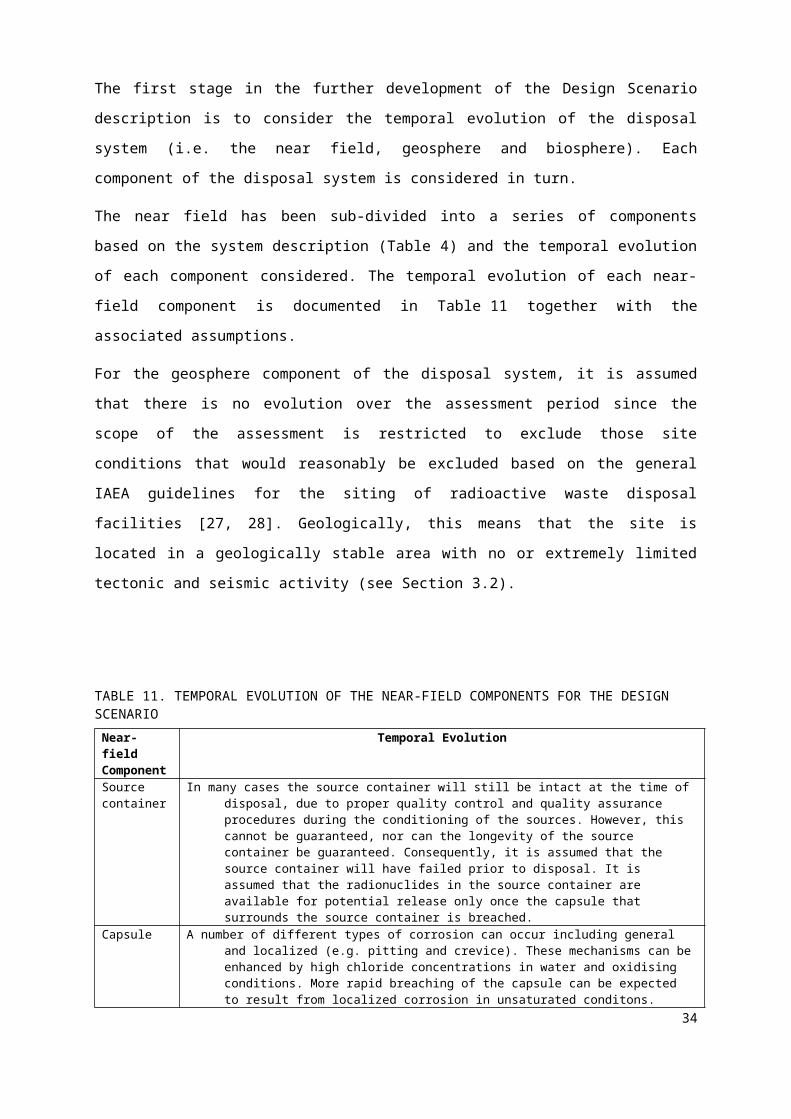
TABLE 15. PHYSICAL AND CHEMICAL FORMS OF RADIONUCLIDES IN DISUSED SOURCESRadionuclide Physical/Chemical Form Release Mechanism
(release only occurs once capsule is breached
Scope for solubility limitation in cement-buffered porewater (based on calculation results in Appendix X)
Scope for solubility limitation in groundwater (based on calculation results in Appendix X)
H-3 Often tritium gas or liquid as H2O Instantaneous release to air or water (depending upon form of H-3) No No
Co-60 Metallic form in thin discs or small cylindrical pellets. Very low solubility
Congruent release (slow rate of release due to low solubility and metallic form)
No No
Ni-63 Solid, electrical deposition on metal foil
Conservatively assume instantaneous release to groundwater since the Ni-63 is on the surface of the metal foil
Yes Yes
Kr-85 Gas Instantaneous release to air No No
Sr-90 Oxide or titanate form
Often silver plated for medical applications
Ceramic or glass bead or rolled silver foil for other applications
The oxide is likely to be soluble in all waters. There is less information concerning the titanate form, but this is likely to be much less soluble than the oxide
Conservatively assume soluble and instantaneous release to groundwater
Yes Yes
Cs-137 Only used as a salt (often caesium chloride)
Sometimes ceramic form for weak sources (very low solubility)
Conservatively assume instantaneous release to groundwater No No
Pb-210 Solid, mainly carbonate, and sulphate Depending upon the water composition the carbonate and sulphate could be very soluble or poorly soluble
Conservatively assume soluble and instantaneous release to groundwater
Yes Yes
Ra-226 (+ Rn gas)
Very reactive alkaline earth metal in form of salts (e.g. bromides, chlorides, sulphates or carbonates). All soluble
Instantaneous release to groundwater. Instantaneous release of radon gas to air
Yes Yes
Pu-238 (+ Rn gas)
Used in RTGs, and for neutron generators and calibration. Sources typically have Pu oxide in ceramic
PuO2 is only poorly soluble
Assume a congruent release with a slow rate of release to groundwater
Yes Yes
Pu-239
42
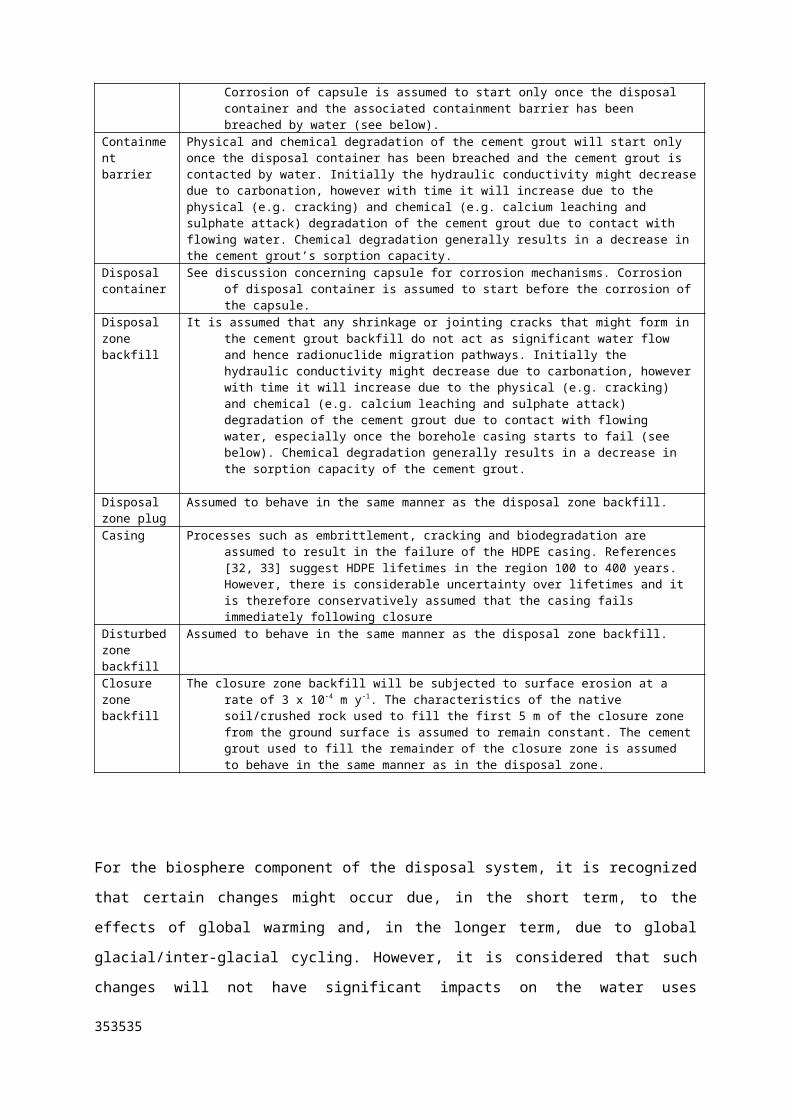
Radionuclide Physical/Chemical Form Release Mechanism
(release only occurs once capsule is breached
Scope for solubility limitation in cement-buffered porewater (based on calculation results in Appendix X)
Scope for solubility limitation in groundwater (based on calculation results in Appendix X)
Am-241 Chemical characteristics similar to rare earth metals. Americium oxides normally used
For neutron sources, fine americium oxide powder used mixed with beryllium powder. Often in pellet form
Sometimes in sintered form
AmO2 is very soluble
Consequently, it is conservative to assume instantaneous release to groundwater
Under high pH, oxidising conditions Am-241 could have low solubility and so a congruent release with a slow rate of release to groundwater would be appropriate
Yes Yes
434343
For radionuclides released in the solid phase due to erosion of the closure zone, it is assumed that the
radionuclide in the topmost container is transferred directly into the soil.
The associated near field migration processes are summarized in the yellow boxes in Figs 12 and 13
for the saturated and unsaturated zones, respectively. Note that the processes considered for the Defect
Scenario are the same as those for the Design Scenario since the faster degradation rates, earlier failure
times, and faster radionuclide migration times of the Defect Scenario can be accounted for by
modifying the associated parameters in the mathematical model (e.g. container degradation rates)
rather than considering different processes. For release in the liquid phase, it is assumed that the
defective capsule/container is at the base of the disposal zone for disposal in the unsaturated zone,
thereby minimizing the travel distance to the saturated zone. For disposal in the saturated zone, the
position of the defective capsule/container is not important since the flow from the disposal borehole
to the abstraction borehole is assumed to be horizontal. For gas releases, it is assumed that the
defective capsule/container is at the top of the borehole for disposals in both the unsaturated and
saturated zones.
5.2.2.GeosphereOn leaving the near field, the radionuclides in groundwater migrate through the geosphere by
advection, dispersion and diffusion and are subject to decay/in-growth, and retardation due to sorption
onto the rocks. Depending upon the characteristics of the geosphere, flow can be through pores or
fractures and diffusion can occur into the rock matrix. The relative importance of these geosphere
processes depends on the hydrogeological conditions at the site (Section 3.2). The groundwater is
assumed to be abstracted from the geosphere via an abstraction borehole that is drilled 100 m down
the hydraulic gradient from the disposal borehole once institution controls are assumed to be no longer
effective (i.e. 30 years after closure). The associated geosphere migration processes are summarized in
the blue boxes in Figs 12 and 13 for the saturated and unsaturated zones, respectively.
5.2.3.BiosphereThe groundwater abstraction borehole is assumed to be used for domestic purposes (drinking) and
agricultural purposes (watering of cows and irrigation of root and green vegetables) (Section 3.3). The
water is not treated or stored before use. Humans are exposed via ingestion of water, animal products
and crops, inadvertent ingestion of soil, external irradiation from soil, and inhalation of dust.
For radionuclides released from the disposal borehole in the gas phase, it is conservatively assumed
that a dwelling is constructed on top of the disposal borehole (without intruding into the disposal zone
of the borehole) once institution controls are assumed to be no longer effective (i.e. 30 years after
closure). Radioactive gases are assumed to migrate directly into the dwelling and be inhaled by the
occupants.
44
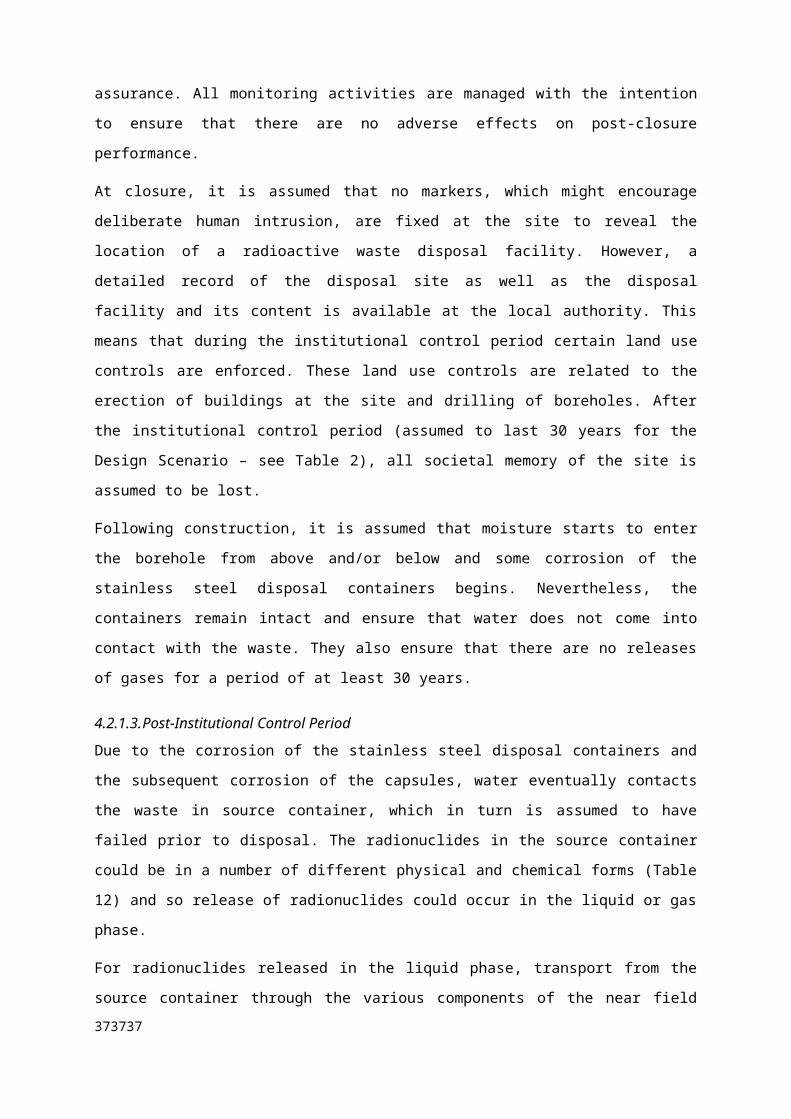
For radionuclides released in the solid phase due to erosion of the closure zone, it is assumed that the
contaminated soil is used for the growing of vegetables by a site dweller. Humans are exposed via
ingestion of vegetables, inadvertent ingestion of soil, external irradiation from soil, and inhalation of
dust.
The associated biosphere migration processes are summarized in the green boxes in Figs 12 and 13 for
the saturated and unsaturated zones, respectively.
454545
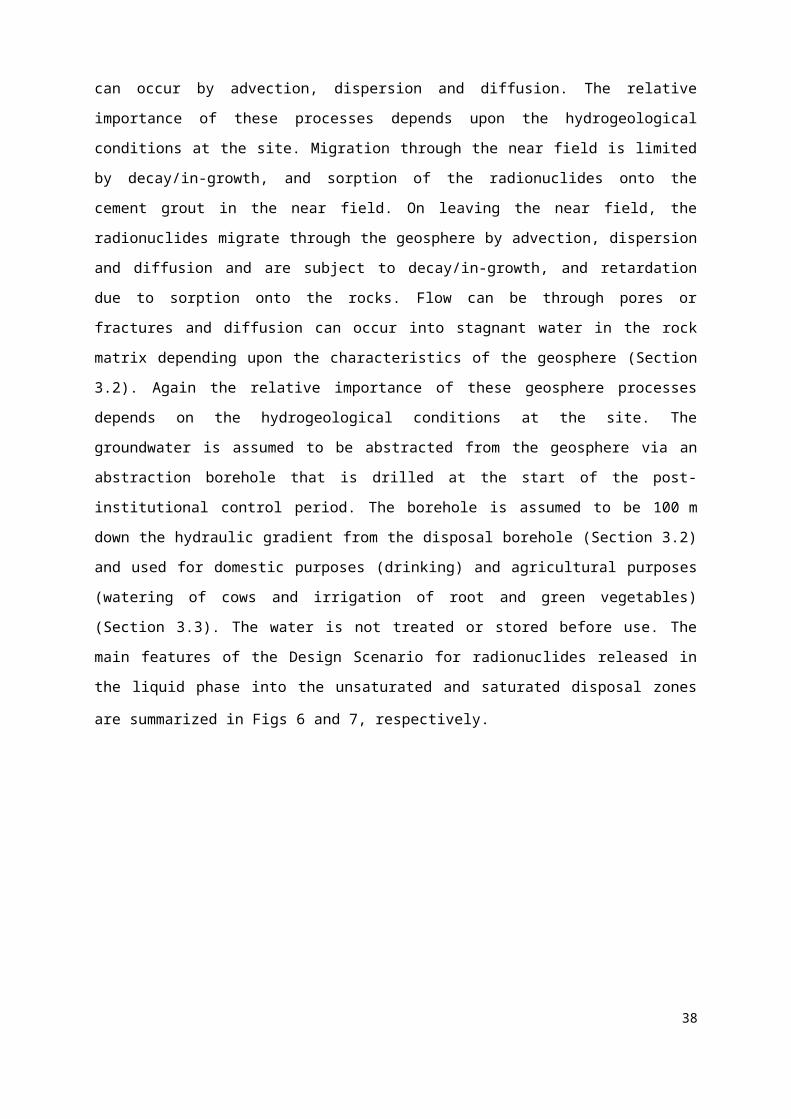
1 2 3 4 5 6 7 8 9 10 11 12 13
A
Source(degradation,
gas release, dissolution, decay)
AdvectionDispersion
Diffusion
Gas migration
(only once capsule is breached)
Transfer into soil due to erosion of closure zone
B
Groundwater flow(only once capsule is breached)
Containment Barrier (degradation, sorption, decay)
AdvectionDispersion
Diffusion
Gas migration
CGroundwater flow (only
once disposal container is breached)
Disposal Zone (degradation,sorption, decay)
DiffusionGas migration
AdvectionDispersionDiffusion
D
Closure Zone(degradation,sorption, decay)
AdvectionDispersionDiffusion
Gas migration
E
Groundwater flow Disturbed Zone and Plug
(degradation, sorption, decay)
AdvectionDispersion Diffusion
F UnsaturatedZone
Recharge
G
Groundwater flow
Saturated Zone(advection, dispersion, diffusion, sorption, decay)
Irrigation Irrigation Ingestion Ingestion AdvectionDispersion Diffusion
HPercolation Soil
(sorption, decay)
Suspension Root uptake External irradiationIngestion
ErosionPercolation
I PrecipitationDeposition
Atmosphere Deposition Inhalation Dispersion
JDeath and decay
Crops(translocation)
Ingestion Food preparation losses
K Excretion Bioturbation
Animals Ingestion
46
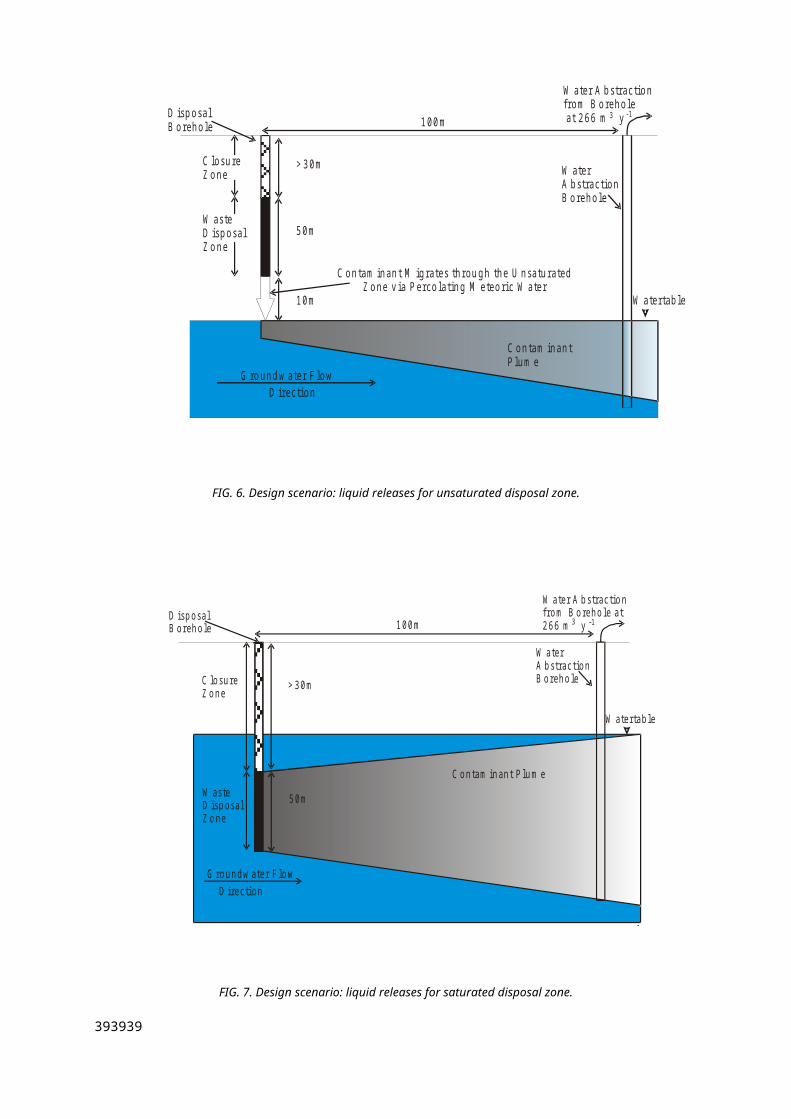
L Abstraction Ploughing CultivationHarvesting
Rearing Humans Excretion
M Elsewhere(decay)
FIG. 12. Interaction matrix for the saturated disposal zone.
1 2 3 4 5 6 7 8 9 10 11 12 13
A
Source(degradation,gas release, dissolution,decay)
AdvectionDispersionDiffusionGas migration(only once capsule is breached)
Transfer into soil due to erosion of closure zone
BPercolation(only once capsule is breached)
Containment Barrier
(degradation, sorption, decay)
AdvectionDispersionDiffusionGas migration
CPercolation(only once disposal container is breached)
Disposal Zone(degradation, sorption, decay)
Gas migration AdvectionDispersionDiffusion
D
Percolation Closure Zone(degradation,decay)
Percolation Gas migration
E
Percolation Disturbed Zoneand Plug(degradation, sorption, decay)
AdvectionDispersionDiffusion
FPercolation Unsaturated
Zone(sorption, decay)
AdvectionDispersionDiffusion
G
Saturated Zone(advection, dispersion, diffusion, sorption, decay)
Irrigation Irrigation Ingestion Ingestion AdvectionDispersion Diffusion
H Percolation Soil(sorption, decay)
Suspension Root uptake External irradiation
ErosionPercolation
474747
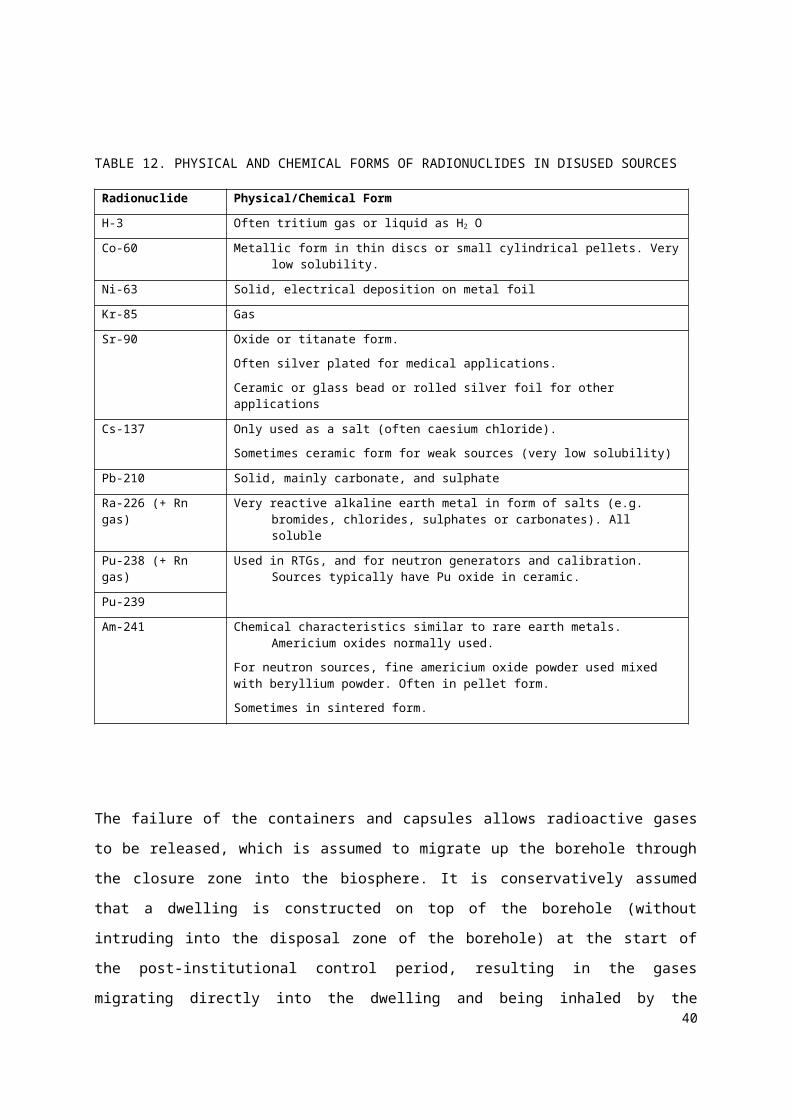
Ingestion
I Precipitation PrecipitationDeposition
Atmosphere
Deposition Inhalation Dispersion
J
Death and decay
Crops(translocation)
Ingestion Food preparation losses
K
Excretion Bioturbation
Animals Ingestion
L Abstraction Ploughing CultivationHarvesting
Rearing Humans Excretion
M Elsewhere(decay)
FIG. 13. Interaction matrix for the unsaturated disposal zone.
48
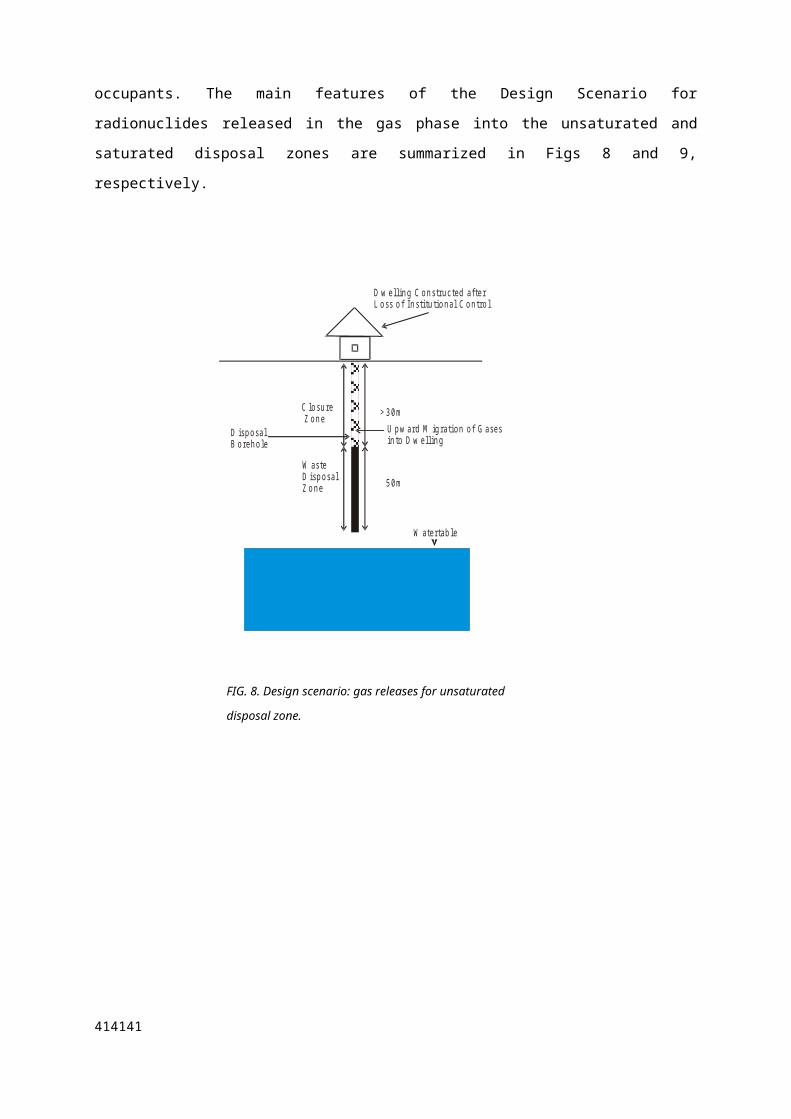
5.3. MATHEMATICAL MODELS
Mathematical models translate the assumptions of a conceptual model into the formalism of
mathematics, usually sets of coupled algebraic, differential and/or integral equations with appropriate
initial and boundary conditions in a specified domain. These equations are solved by computer
software to give the temporal and spatial dependence of the quantities of interest (such as radionuclide
concentrations and doses to humans).
For the GSA, an assessment model has been developed to allow the calculation of the end points
identified in Section 2.4. In addition, two supporting models have been developed to represent the
degradation of the cement grout and the corrosion of the containers in detail and to provide associated
input into the assessment model. The assessment and supporting models are discussed in turn below.
5.3.1.Assessment ModelIt was decided to implement the assessment model in the most recent version of the AMBER software
tool (version 5) [40] since it is a suitable tool in which to implement the conceptual models developed
in Section 5.2. Furthermore, it has been used to develop models for a wide range of safety
assessments14 (for example Refs [9, 22]), including a previous assessment of the borehole disposal
concept for disused radioactive sources [36]. AMBER uses a compartment model approach to
represent the migration and fate of contaminants in the disposal system. The use of AMBER places
two main conditions on the mathematical representation of a disposal system.
The first condition is that the system has to be discretized into a series of compartments. Using the
compartment modelling approach, a disposal system may be represented by discretizing it into
compartments that can correspond to the components identified in the conceptual model. It is assumed
that either uniform mixing occurs over the timescales of interest, or the distribution of the contaminant
within the compartment is not important so that a uniform concentration over the whole compartment
can be used either for subsequent transport or for deriving end points of interest. Therefore each
compartment should be chosen to represent a system component for which one or other of these
assumptions is reasonable.
The second condition is that processes resulting in the transfer of contaminants from one compartment
(the donor compartment) to another (the receptor compartment) need to be expressed as transfer
coefficients that represent the fraction of the activity in a particular compartment transferred from the
donor compartment to the receptor compartment per unit time. The mathematical representation of the
inter-compartmental transfer processes takes the form of a matrix of transfer coefficients that allow the
compartmental amounts to be represented as a set of first order linear differential equations. For the ith
14 INTERNATIONAL ATOMIC ENERGY AGENCY, Handbook of Parameter Values for the Prediction of Radionuclide Transfer in Temperate Environments, IAEA Technical Reports Series No. 364, IAEA, Vienna (1994).
494949
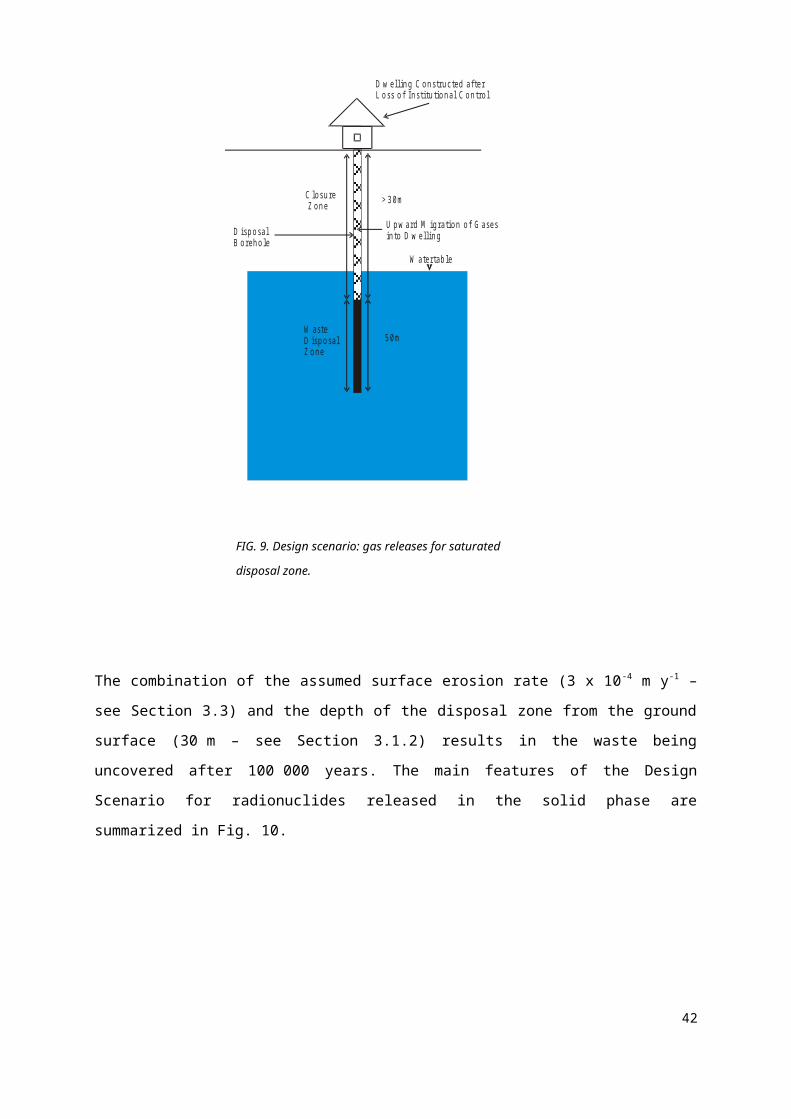
compartment, the rate at which the inventory of radionuclides in a compartment changes with time is
given by:
Equation 1
dN i
dt=(∑j≠i
λ ji N j+ λN M i+Si ( t ))−(∑j≠iλij N i+λN N i)
where i and j indicate compartments, N and M are the amounts (Bq) of radionuclides N and M in a
compartment (M is the precursor of N in a decay chain). S(t) is a time dependent external source of
radionuclide N (Bq y-1). Transfer and loss rates are represented by λ. λN is the decay constant for
radionuclide N (y-1) and λji and λij are transfer coefficients (y-1) representing the gain and loss of
radionuclide N from compartments i and j. For simplicity, the above equation assumes a single parent
and daughter. However, AMBER allows the representation of multiple parents and daughters.
The solution of the matrix of equations given above provides the time-dependent inventory of each
compartment. Assumptions for compartment sizes then result in estimates of concentrations in the
corresponding media from which doses/intakes can be estimated.
The mathematical equations used to represent the release and migration processes and the exposure
mechanisms identified in the Interaction Matrices are described in Appendix XI. Two further
equations are used for the activity limit calculations. A total activity limit is derived based on:
Equation 2
Ati =Doselim ⋅ Ai⋅N p
MaxDose i
where Ati is the total activity limit of radionuclide i for the scenario (Bq), Doselim is the relevant dose
limit for the scenario (Sv y-1) (assumed to be 0.3 mSv y-1 see Section 2.3), Ai is the initial activity of
radionuclide i in each waste package (Bq) (assumed to be 1 TBq – see Section 2.4), Np is the number
of packages in the borehole (assumed to be 50 – see Section 3.1.2), MaxDosei is the peak dose
resulting from the total activity of radionuclide i in the waste (Sv y-1).
A per package activity limit is derived based on:
Equation 3
Api =Ati
N p
where Api is the per package activity limit of radionuclide i for the scenario (Bq).
50
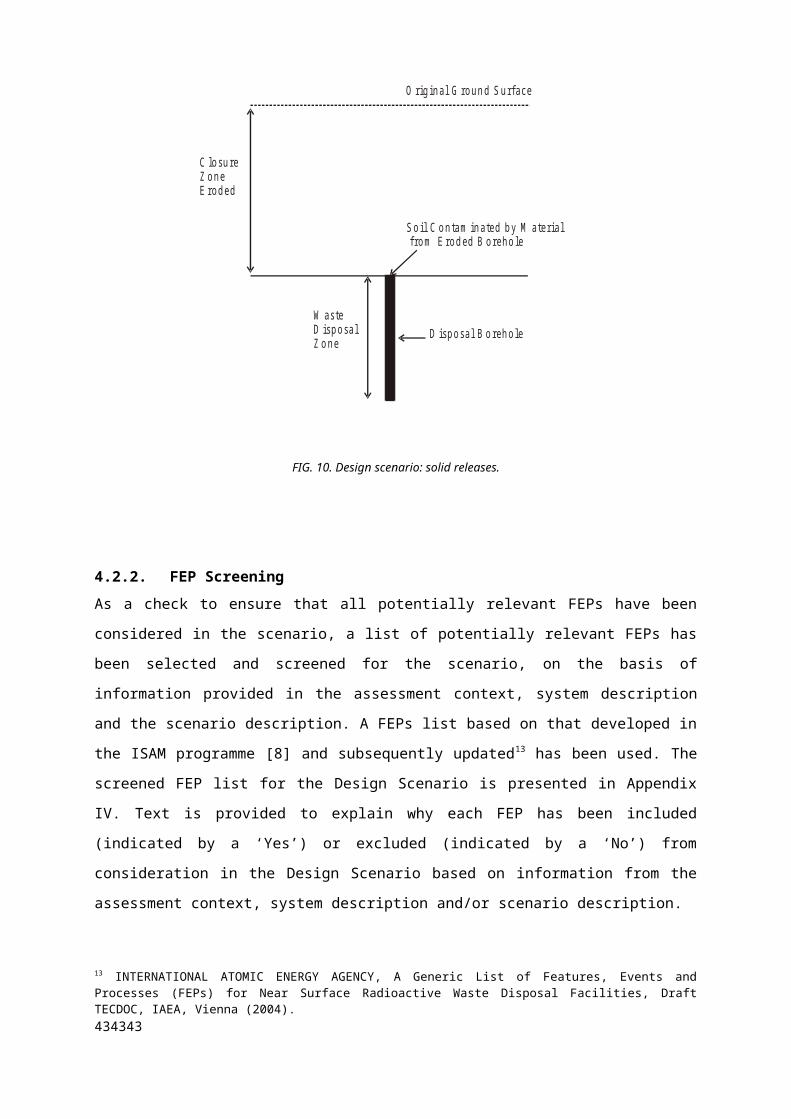
Equation 2 and 3 assume that there is a linear relationship between dose and the radionuclide
inventory disposed in the borehole. This is not the case when the release of radionuclides is solubility
limited. However, for the reference calculations in Section 6.1, it is conservatively assumed that the
liquid release is not solubility limited (resulting in a more restrictive reference activity level for the
liquid release).
For the calculation of the activity levels presented in Section 6, the radionuclides have been considered
independently of each other (except for the decay chains), i.e. as only one radionuclide was present in
the disused radioactive sources. When managing a spectrum of several radionuclides, as it is most
often the case for inventories of disused radioactive sources, it is necessary to combine the impacts of
the various radionuclides (summation rule) in order to ensure that the dose constraint is not exceeded
for any given scenario. This is achieved by the following limiting condition:
Equation 4
∑i
Qi
Qi , l≤1
where Qi is the actual activity of radionuclide i to be disposed (Bq), and Qi,l is the activity limit for
radionuclide i from the limiting scenario, assuming radionuclide i is the only radionuclide
disposed (Bq).
Any application of this summation rule would be conservative. It would be more appropriate to
recognize the time dependent nature of the impacts (i.e. peak doses for the different radionuclides do
not all occur at the same time).
5.3.2.Supporting ModelsAs noted above, two supporting model have been developed to provide input data for use in the
assessment model.
The first has been developed in an Excel spreadsheet and has been used to calculate the duration of
each of the cement grout degration stages identified in Section 5.2.1 for the various hydrogeological
and geochemical conditions considered in the GSA. The model, as applied to the three reference
groundwaters (waters Nos 1, 5 and 6), is described in Appendix VIII.
The second supporting model has also been developed in an Excel spreadsheet and used to calculate
the failure times of the disposal container and the waste capsule for the various hydrogeological,
geochemical and cement grout degradation conditions considered in the GSA. The model is described
in Appendix I.
5.4. REFERENCE CALCULATION CASES
515151
The cases for which reference calculations need to be undertaken using the assessment model have to
be identified (variant calculations are identified in Section 6.2 in light of the results obtained for the
reference calculations). In defining the reference calculation cases, it is necessary to consider the range
of disposal systems and range of scenarios of interest.
Disposal systems: as noted in Section 3.4, a total of 8 different disposal systems can be
identified (see Table 9).
Scenarios: From consideration of the scenarios considered in Section 4, 15 calculations need to
be considered (liquid, gas and solid releases for the Design Scenario and the four Design
Scenario variants).
Thus there could be a potential total of 120 reference calculation cases. However, this number can be
reduced because:
the gas release calculations are independent of the geosphere since it is assumed that the gas is
released up the borehole from the disposal zone into the closure zone and then into a house built
above the borehole;
the solid release calculations are independent of the geosphere since it is assumed that the rate
of erosion is the same for all geospheres;
only one calculation case (based on the unsaturated disposal zone) needs to be undertaken for
the gas release calculations for each scenario since this is considered to be the more restrictive
case (i.e. the case that gives rise to the highest impacts) and can conservatively be applied to the
saturated disposal zone; and
the solid release calculations for the Design and Defect Scenarios are the same (since the same
surface erosion rate is assumed for both scenarios) and only one calculation case (based on the
unsaturated disposal zone) needs to be undertaken since, by definition, the disposal zone will be
in the unsaturated zone at the time that the exposure arises.
Thus, in total, there are 46 reference calculation cases to be considered. These are identified in Table 16.
5.5. DATA
The tables in Appendix XII provide data for each of the parameters of the assessment model described
in Appendix XI. Data relating to the inventory, borehole and its design and the associated geosphere
and biosphere characteristics have been drawn from the system description (Section 3). Other
radionuclide/element dependent and independent data have been drawn from a number of relevant
sources such as previous safety assessments (e.g. Ref. [36]) and data compilations (e.g. Ref. [42]).
Source references are given at the end of each table in Appendix XII.
52
5.6. IMPLEMENTATION
As mentioned in Section 5.3, the AMBER software tool was used to implement the assessment model.
The mathematical model and data described in Appendix XII and K were encoded directly into
AMBER and quality assurance checks undertaken to ensure that the implementation was correctly
performed. The time dependent solution method used by AMBER is described in Refs [43, 44]. The
verification of the solution is discussed in Ref. [45].
In implementing the models and data in AMBER, the aim was to minimise the number of input files
that needed to be created and thereby reduce input error, facilitate checking and updating, and avoid
the replication of data needed by all or most calculation cases (e.g. decay rates and dose coefficients).
This was achieved through the use of a series of “literal” parameters as switches to allow variant cases
to be easily set up from a common “source” file. Literal parameters used include:
TypeScenario – can be set to ‘Design’, ‘DefectD1’, ‘DefectD2’, ‘DefectD3’or ‘DefectD4’; and
TypeGeosphere – can be set to ‘LowFlowRate’, ‘MediumFlowRate’, ‘HighFlowRatePorous’
and ‘HighFlowRateFractured’.
Given that different conceptual models were developed for unsaturated and saturated conditions
(Section 5.2), two separate AMBER “source” files were developed:
Unsat_Casev4.cse – for unsaturated cases; and
Sat_Casev4.cse – for saturated cases.
The same saturated geosphere was used for the two source files, but different near fields were
implemented. The data that were common were copied and pasted from one file into the other.
By changing the value taken by each literal parameter, all case files for all scenarios could be directly
created in batch mode from the two Unsat_Casev4.cse and Sat_Casev4.cse “source” files.
TABLE 16. REFERENCE CALCULATION CASES CONSIDERED
Scenario Exposure Group Release Phase Near Field Saturated GeosphereDisposal Zone Flow Rate Flow Type
Design Farmer Liquid
Unsaturated
High PorousFractured
Medium Porous
Low PorousSaturated High Porous
Fractured
Medium Porous
Low Porous
535353
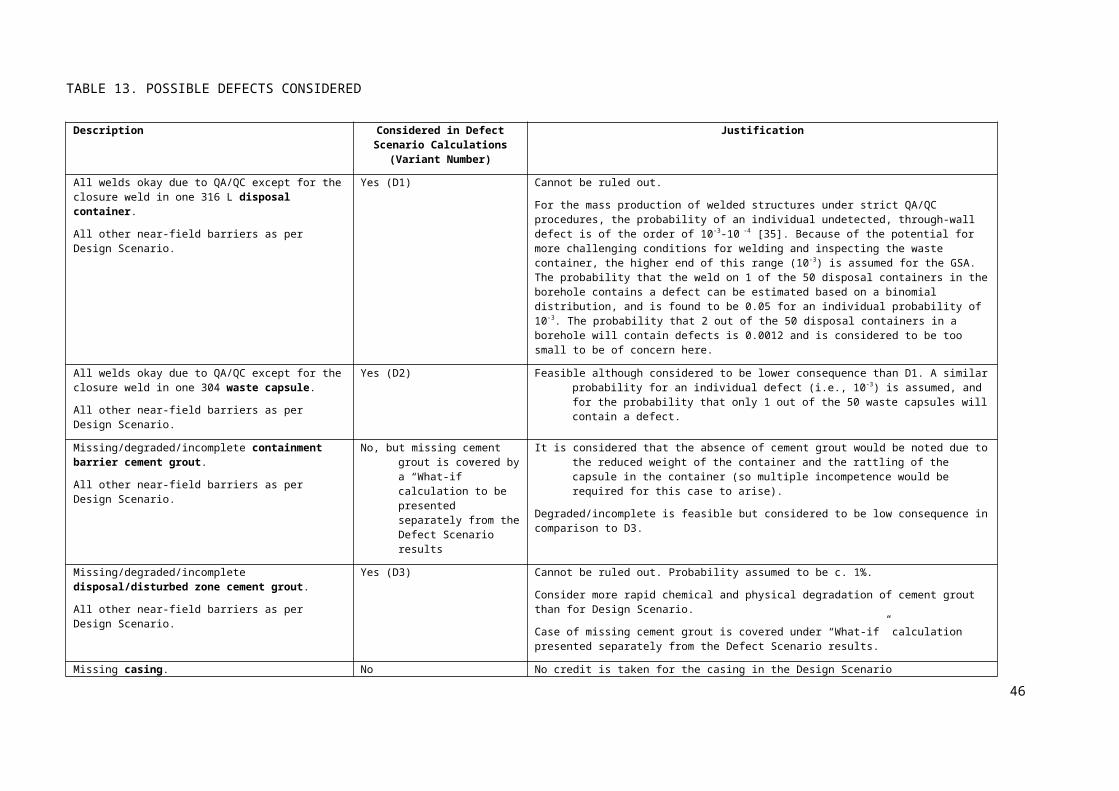
Scenario Exposure Group Release Phase Near Field Saturated GeosphereDisposal Zone Flow Rate Flow Type
House dweller Gas Unsaturated Not relevant Not relevant
Site dweller Solid Unsaturated Not relevant Not relevant
Defect Variant D1
Farmer Liquid
Unsaturated
High PorousFractured
Medium Porous
Low Porous
Saturated
High PorousFractured
Medium Porous
Low Porous
House dweller Gas Unsaturated Not relevant Not relevant
Defect Variant D2
Farmer Liquid
Unsaturated
High PorousFractured
Medium Porous
Low Porous
Saturated
High PorousFractured
Medium Porous
Low Porous
House dweller Gas Unsaturated Not relevant Not relevant
Defect Variant D3
Farmer Liquid
Unsaturated
High PorousFractured
Medium Porous
Low Porous
Saturated
High PorousFractured
Medium Porous
Low Porous
House dweller Gas Unsaturated Not relevant Not relevant
Defect Variant D4
Farmer Liquid
Unsaturated
High PorousFractured
Medium Porous
Low Porous
Saturated
High PorousFractured
Medium Porous
Low Porous
House dweller Gas Unsaturated Not relevant Not relevant
54
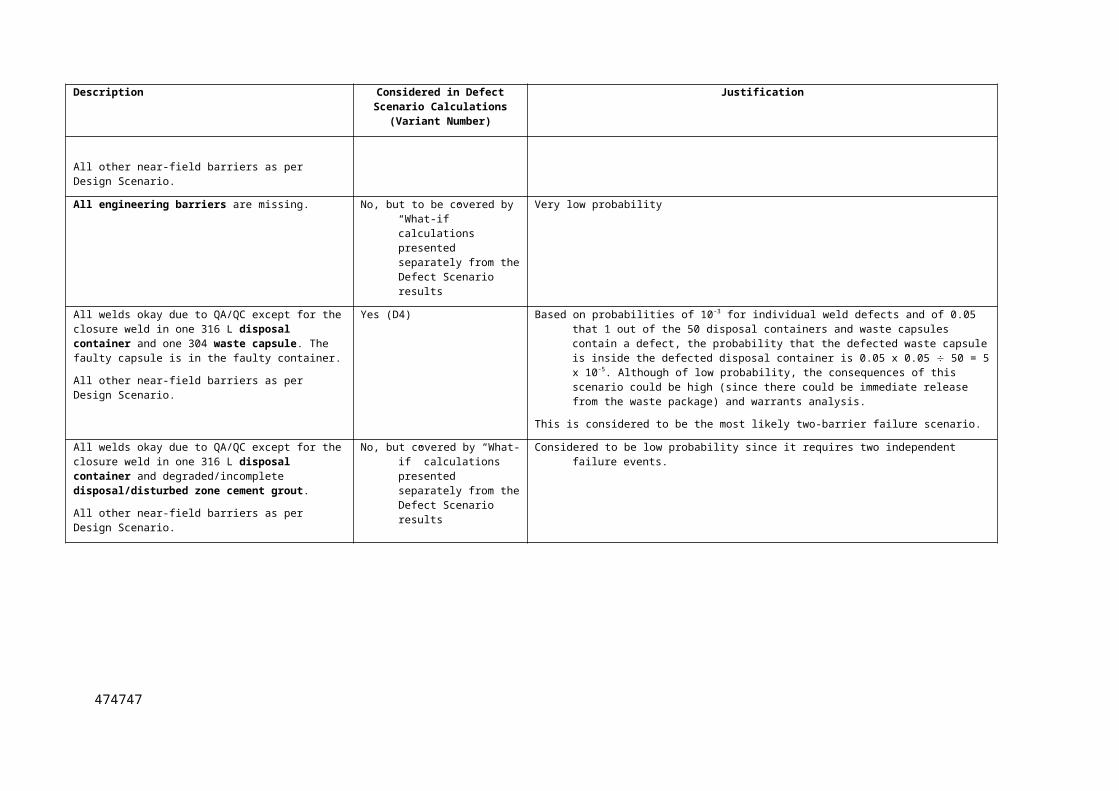
6. PRESENTATION AND ANALYSIS OF RESULTS
Before presenting and analysing the results of the GSA, it is important to summarise the main
assumptions that have been adopted. This ensures that the reader is aware of these assumptions and
can review their appropriateness when applying the GSA and its results to a specific disposal system.
The main assumptions are summarized in the first column of Table 17 (those appearing in italics relate
to parameters that are site-specific). These assumptions have been identified by reviewing each step of
the approach used in the GSA (i.e. the specification of the assessment context (Section 2), the
description of the disposal system (Section 3), the development and justification of the scenarios
(Section 4), and the formulation and implementation of models (Section 5)). Where appropriate, each
assumption has been classified (in the second and third columns) as to whether it is considered to be
conservative or realistic, consistent with the definitions of these terms provided in Section 2.6.2. The
sections of this report that provide the justification for each assumption are listed in the fourth column.
TABLE 17. KEY ASSUMPTIONS MADE IN THE GSA
Assumption Conservative Realistic JustificationAssessment Context
1. Narrow diameter borehole (up to 50 cm) and so small diameter sources (up to 15 mm)
n.a. n.a. Sections 1.3 and 2.1
2. Disused sealed sources n.a. n.a. Sections 1.3, 2.1 and 2.13. Only consider post-closure
issuesn.a. n.a. Sections 1.3 and 2.1
4. Exclude deliberate human intrusion
n.a. n.a. Section 1.3
5. Depth of cover at least 30 m n.a. n.a. Sections 1.3 and 2.16. Assume that the derived
reference activity values are total values applicable to an entire site
Yes - Section 2.1
7. Only consider radiological impacts on humans
n.a. n.a. Section 2.1
8. Regulatory framework and associated end points
n.a. n.a. Sections 2.3 and 2.4
9. No explicit consideration of radiolysis, criticality and thermal effects
No No Such effects are considered to be insignificant for
the typical inventories to be
disposed10. Borehole operated only for
one year and then closed- Yes Section 2.6
11. Period of institutional control
- Yes Section 2.6
12. No cut-off time for calculation of dose
n.a. n.a. Section 2.6
System Description
555555
Assumption Conservative Realistic Justification1. The selected radionuclides
are representative of those that can be found in sealed sources
- Yes Section 3.1.1 and Appendix I
2. Sources have been appropriately conditioned prior to disposal
- Yes Section 3.1.2
3. Using borehole disposal concept design and materials broadly similar to that defined in Section 3.1
n.a. n.a. Section 3.1
4. 50 waste packages n.a. n.a. Section 3.1.2
5. Borehole located in either unsaturated or saturated zone but not straddling the two zones
n.a. n.a. Section 3.1.3
6. Absence of geological complexity and variability can be averaged
n.a. n.a. Section 3.2
7. Water abstraction borehole as GBI (drilled at end of institutional control period)
Yes - Section 3.2
8. Geological stability (tectonic and seismic)
n.a. n.a. Section 3.2
9. No natural resources requiring excavation
n.a. n.a. Section 3.2
10. Flux and travel time through geosphere and distance to GBI
n.a. n.a. Sections 3.2.1 and 3.2.2
11. Sorption coefficients n.a. n.a. Sections 3.3.1 and 3.3.212. Climatic conditions n.a. n.a. Section 3.313. Soils capable of supporting
cropsn.a. n.a. Section 3.3
14. Subdued relief n.a. n.a. Section 3.315. Limited geomorphological
activity (e.g. no coastal processes)
n.a. n.a. Section 3.3
Scenarios1. Identified scenarios
adequately illustrate the range of future behaviours and states of the disposal system
- Yes Section 4
2. Unexpected geological conditions and environmental change scenarios are adequately covered by the other scenarios and associated variant calculations
- Yes Sections 4.4 and 4.5
Models1. Use of the compartment
modelling approach is appropriate for the problem
- Yes Section 5.3
2. Linear relationship between activity and dose
Yes(for liquid release of
certain solubility limited radionuclides)
Yes(for most radionuclides
and releases)
Section 5.3
3. Activity levels derived by considering radionuclides independently
No - Section 5.3
4. Assume that the data used are appropriate
Some Some Section 5.5
56

6.1. RESULTS FOR THE REFERENCE CALCULATIONS
6.1.1.Design Scenario The assessment results for liquid releases for the Design Scenario are presented in Table 18 in terms
of the maximum activity of a given radionuclide that can be disposed safely (i.e. without the dose
criterion of 0.3 mSv y-1 being exceeded) for each geosphere considered (per package activity limits are
provided in Table M.2). For all radionuclides, other than those with long-lived daughters (i.e. Pu-238,
Pu-239 and Am-241), the total inventory that can safely be exposed exceeds 1 x10¹⁸ Bq. For these
radionuclides a specific disposal limit has not been given, only an indication that the limit exceeds
1 x10¹⁸ Bq 15. Total activity limits for Pu-238, Pu-239 and Am-241 are summarized in Fig. 11 for
liquid releases. They show disposal in the unsaturated zone generally allows higher activity levels by
up to three orders of magnitude due to the increased travel time to the geosphere-biosphere interface
(the water abstraction borehole). Similarly, the low flow saturated geosphere increased travel time and
so allows higher activity levels by up to five orders of magnitude. The higher activity levels for the
fractured high flow system compared to the porous high flow system are a consequence of matrix
diffusion which results in additional retardation of radionuclides.
Total activity results for gas releases are provided in Table 19 (per package activity limits are
provided in Table M.4). They show that the release of gaseous radionuclides, either disposed or in-
grown in-situ, does not impose any radionuclide disposal limits.
Total activity results for solid releases are provided in Table 20 (per package activity limits are
provided in Table M.6). They show that for all radionuclides, other than those with long-lived
daughters (i.e. Pu-238, Pu-239 and Am-241), the total inventory that can safely be exposed exceeds
1 x10¹⁸ Bq.
15 This value has been chosen for a number of reasons. At such high activities worker doses will become an issue and the engineering design considered in the GSA is unlikely to afford sufficient shielding. In addition heat generation, helium generation and radiolysis are likely to be significant, in contrast to the assumptions used in the GSA, such that the results of the GSA are unlikely to be valid. Furthermore, it is at least three orders of magnitude higher than the maximum inventory available for disposal of any given radionuclide (see Appendix I).
575757
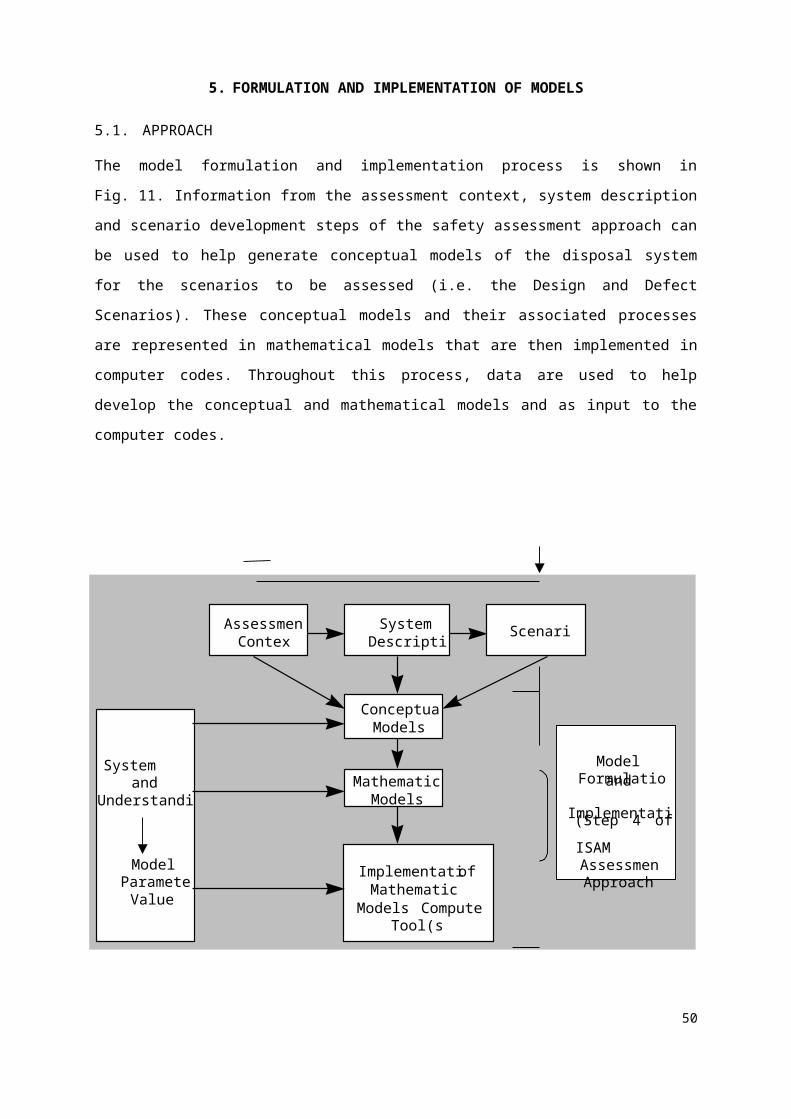
TABLE 18. TOTAL ACTIVITY LEVELS FOR LIQUID RELEASE FOR THE DESIGN SCENARIO
Near Field Saturated Geosphere Total Activity Level (Bq)
Disposal Zone
Flow Rate Flow Type H-3 Co-60 Ni-63 Kr-85 Sr-90 Cs-137 Pb-210 Ra-226 Pu-238 Pu-239 Am-241
Unsaturated
HighPorous * * * * * * * * 1E+14 9E+13 9E+13
Fractured * * * * * * * * * 3E+16 5E+15
Medium Porous * * * * * * * * 3E+15 9E+13 3E+14
Low Porous * * * * * * * * * 9E+16 *
Saturated
HighPorous * * * * * * * * 4E+12 9E+13 5E+12
Fractured * * * * * * * * 3E+14 8E+15 2E+14
Medium Porous * * * * * * * * 2E+15 7E+14 5E+14
Low Porous * * * * * * * * * * *
* denotes a total activity level that is greater than 1 x10¹⁸ Bq.
58

FIG. 14. Pu-238, Pu-239 and Am-241 total activity levels for the design scenario: liquid releases.
595959
Pu-238, Pu-239, Am-241Design Scenario
Pu-2
38
Pu-2
38
Pu-2
38
Pu-2
38
Pu-2
38
Pu-2
38
Pu-2
38
Pu-2
39
Pu-2
39
Pu-2
39
Pu-2
39
Pu-2
39
Pu-2
39
Pu-2
39
Pu-2
39
Am
-241
Am
-241
Am
-241
Am
-241
Am
-241
Am
-241
Am
-241
Am
-241
Pu-2
38
1E+6
1E+7
1E+8
1E+9
1E+10
1E+11
1E+12
1E+13
1E+14
1E+15
1E+16
1E+17
1E+18
Unsaturated HighFlow Porous
Unsaturated HighFlow FlowFractured
UnsaturatedMedium Flow
Porous
Unsaturated LowFlow Porous
Saturated HighFlow Porous
Saturated HighFlow Fractured
Saturated MediumFlow Porous
Saturated LowFlow Porous
TO
TA
L A
CT
IVIT
Y L
EV
EL
S FO
R L
IQU
ID R
EL
EA
SE
1E+6
1E+7
1E+8
1E+9
1E+10
1E+11
1E+12
1E+13
1E+14
1E+15
1E+16
1E+17
1E+18
TABLE 19. TOTAL ACTIVITY LEVELS FOR GASEOUS RELEASE FOR THE DESIGN SCENARIO
Total Activity Level (Bq)
H-3 Co-60 Ni-63 Kr-85 Sr-90 Cs-137 Pb-210 Ra-226 Pu-238 Pu-239 Am-241
* n.a. n.a. * n.a. n.a. n.a. * * n.a. n.a.
* denotes a total activity level that is greater than 1 x10¹⁸ Bq.
TABLE 20. TOTAL ACTIVITY LEVELS FOR SOLID RELEASE FOR THE DESIGN SCENARIO
Total Activity Level (Bq)
H-3 Co-60 Ni-63 Kr-85 Sr-90 Cs-137 Pb-210 Ra-226 Pu-238 Pu-239 Am-241
* * * * * * * * 2E+12 5E+11 4E+13
* denotes a total activity level that is greater than 1 x10¹⁸ Bq.
60

The results for the Design Scenario show that if the system performs to its design specification then
the chemical and physical barriers provided by the near-field engineering are such that limits on the
total activity which can be disposed are only required for those radionuclides with long-lived
daughters, i.e. Pu-238, Pu-239 and Am-241.
6.1.2.Defect ScenarioThe results for liquid releases for the Defect Scenario are presented in Figs 15 to 17 in terms of the
maximum activity of Pu-238, Pu-239 and Am-241 that can safely be disposed for each scenario
variant. All other radionuclides have a maximum activity of greater than 1 x10¹⁸ Bq. Complete results
are provided in Tables M.7 to M.14 in Appendix XIII. Figures 15 to 17 show that there is little or no
variation in the activity levels for a given radionuclide between the Design and Defect Scenario
variants for a given geosphere. This emphasizes the multiple barrier nature of the near field that
ensures defects in the performance of one barrier do not compromise the performance of the near field.
Results for gas releases show that the release of gaseous radionuclides, either disposed or in-grown in-
situ, does not impose any radionuclide disposal limits for Defect Scenario D1, D2 and D3 since
adequate containment is provided by the non-failed barriers. However, Defect Scenario D4 (which
involves a failed waste capsule being within a failed disposal container) does result in a total activity
limit of 6 x10¹² Bq for H-3 and 1 x10¹⁴ Bq for Kr-85 (Table 21).
Results for solid releases are the same as for the Design Scenario (Table 20) since the same surface
erosion rate (the key factor determining the time of release of contamination to the soil) is assumed for
both scenarios.
616161
Pu-238Reference cases
Des
ign
Scen
ario
Des
ign
Scen
ario
Des
ign
Scen
ario
Des
ign
Scen
ario
Des
ign
Scen
ario
Des
ign
Scen
ario
Des
ign
Scen
ario
D1
D1
D1
D1
D1
D1
D1
D1
D2
D2
D2
D2
D2
D2
D2
D2
D3
D3
D3
D3
D3
D3
D3
D3
D4
D4
D4
D4
D4
D4
D4
D4
Des
ign
Scen
ario
1E+6
1E+7
1E+8
1E+9
1E+10
1E+11
1E+12
1E+13
1E+14
1E+15
1E+16
1E+17
1E+18
Unsaturated HighFlow Porous
Unsaturated HighFlow Fractured
Unsaturated MediumFlow Porous
Unsaturated LowFlow Porous
Saturated High FlowPorous
Saturated High FlowFractured
Saturated MediumFlow Porous
Saturated Low FlowPorous
TO
TA
L A
CTI
VIT
Y L
EV
EL
S FO
R L
IQU
ID R
EL
EA
SE
1E+6
1E+7
1E+8
1E+9
1E+10
1E+11
1E+12
1E+13
1E+14
1E+15
1E+16
1E+17
1E+18
FIG. 15. Pu-238 total activity levels for the design and defect scenarios: liquid releases.
62
Pu-239Reference cases
Des
ign
Scen
ario
Des
ign
Scen
ario
Des
ign
Scen
ario
Des
ign
Scen
ario
Des
ign
Scen
ario
Des
ign
Scen
ario
Des
ign
Scen
ario
D1
D1
D1
D1
D1
D1
D1
D1
D2
D2
D2
D2
D2
D2
D2
D2
D3
D3
D3
D3
D3
D3
D3
D3
D4
D4
D4
D4
D4
D4
D4
D4
Des
ign
Scen
ario
1E+6
1E+7
1E+8
1E+9
1E+10
1E+11
1E+12
1E+13
1E+14
1E+15
1E+16
1E+17
1E+18
Unsaturated HighFlow Porous
Unsaturated HighFlow Fractured
Unsaturated MediumFlow Porous
Unsaturated LowFlow Porous
Saturated High FlowPorous
Saturated High FlowFractured
Saturated MediumFlow Porous
Saturated Low FlowPorous
TO
TA
L A
CTI
VIT
Y L
EV
EL
S FO
R L
IQU
ID R
EL
EA
SE
1E+6
1E+7
1E+8
1E+9
1E+10
1E+11
1E+12
1E+13
1E+14
1E+15
1E+16
1E+17
1E+18
FIG. 16. Pu-239 total activity levels for the design and defect scenarios: liquid releases.
636363
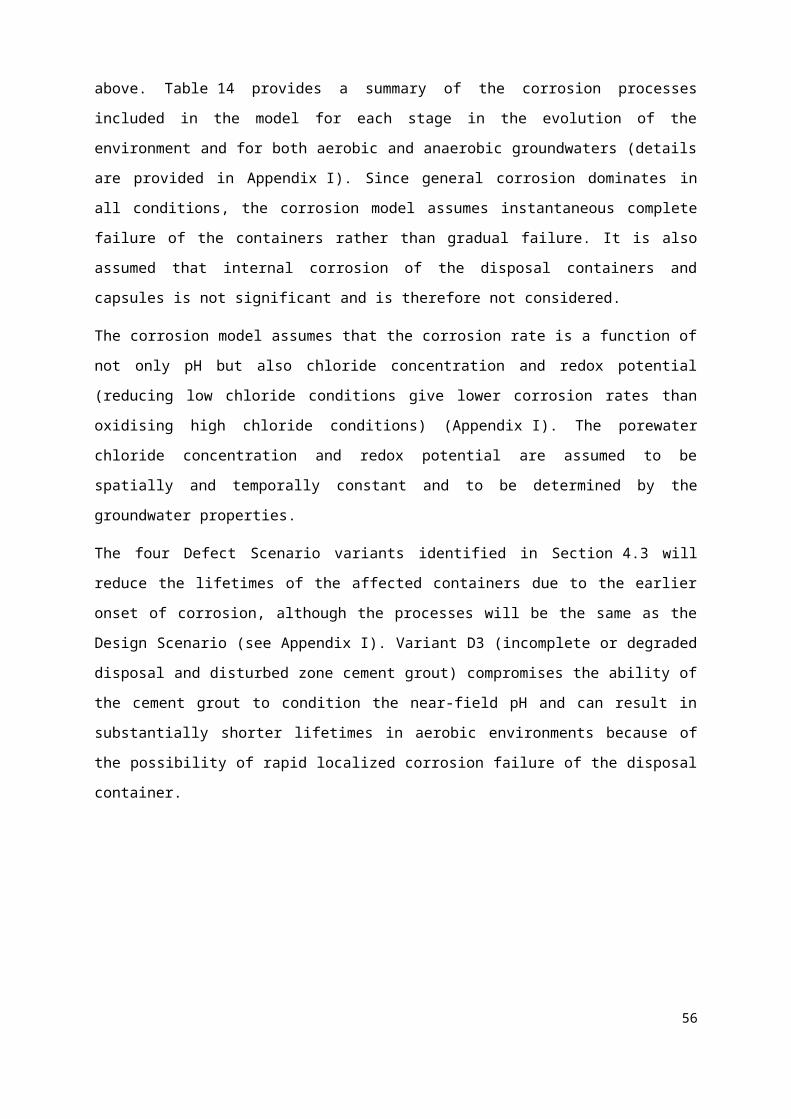
Am-241Reference cases
Des
ign
Scen
ario
Des
ign
Scen
ario
Des
ign
Scen
ario
Des
ign
Scen
ario
Des
ign
Scen
ario
Des
ign
Scen
ario
Des
ign
Scen
ario
D1
D1
D1
D1
D1
D1
D1
D1
D2
D2
D2
D2
D2
D2
D2
D2
D3
D3
D3
D3
D3
D3
D3
D3
D4
D4
D4
D4
D4
D4
D4
D4
Des
ign
Scen
ario
1E+6
1E+7
1E+8
1E+9
1E+10
1E+11
1E+12
1E+13
1E+14
1E+15
1E+16
1E+17
1E+18
Unsaturated HighFlow Porous
Unsaturated HighFlow Fractured
Unsaturated MediumFlow Porous
Unsaturated LowFlow Porous
Saturated High FlowPorous
Saturated High FlowFractured
Saturated MediumFlow Porous
Saturated Low FlowPorous
TO
TA
L A
CTI
VIT
Y L
EV
EL
S FO
R L
IQU
ID R
EL
EA
SE
1E+6
1E+7
1E+8
1E+9
1E+10
1E+11
1E+12
1E+13
1E+14
1E+15
1E+16
1E+17
1E+18
FIG. 17. Am-241 total activity levels for the design and defect scenarios: liquid releases.
64
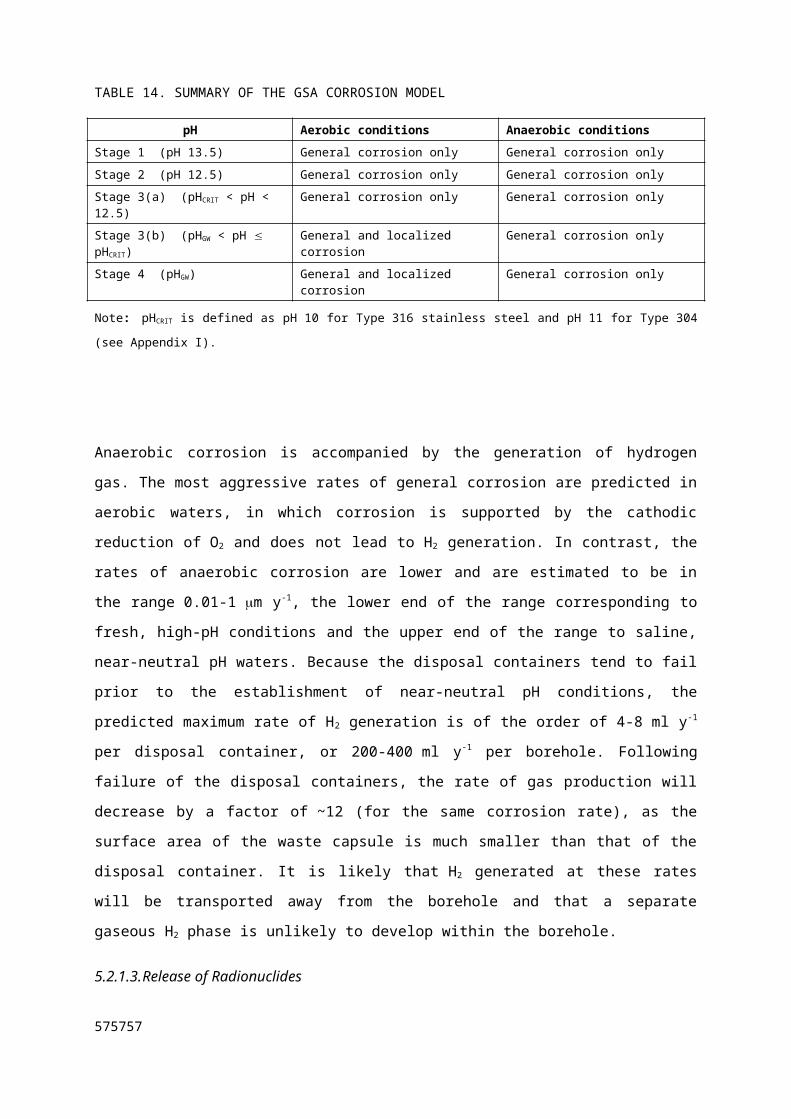
TABLE 21. TOTAL ACTIVITY LEVELS FOR GASEOUS RELEASE FOR DEFECT SCENARIO D4
Total Activity Level (Bq)
H-3 Co-60 Ni-63 Kr-85 Sr-90 Cs-137 Pb-210 Ra-226 Pu-238 Pu-239 Am-241
6E+12 16 n.a. n.a. 1E+14 n.a. n.a. n.a. * * n.a. n.a.
* denotes a total activity level that is greater than 1 x 10¹⁸ Bq.
16 Only applicable to unsaturated disposal zone. H-3 in saturated disposal zone is assumed to be dissolved in the groundwater.
656565
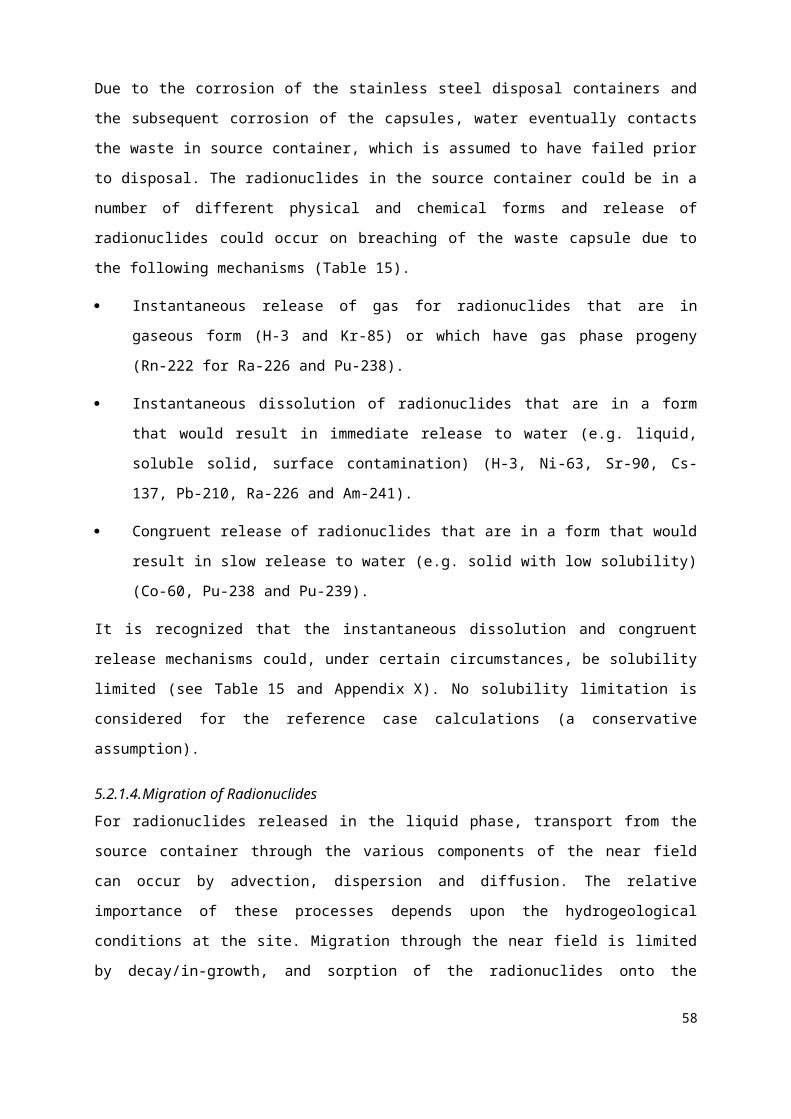
6.1.3.Disposal Limits Considering Design and Defect ScenariosThe actual disposal limit should be based on a combination of the consequences of the Design and
Defect Scenarios. As noted in Table 13, in a given borehole containing 50 waste packages, there is
a 5% probability that one disposal container will be defected, a 5% probability that one waste capsule
will be defected, a 0.005% probability that both the waste capsule and disposal container will be
defected in the same waste package, and a 90% probability that the waste packages will perform
according to the Design Scenario. (The probability of two defected disposal containers or waste
capsules in a borehole is 0.1%, and <0.002% for three defects in a borehole. Since the probability of
multiple defects of a given kind in a borehole is small, only the case of single defects need be
considered when estimating the overall disposal limit). The overall disposal limit, L, is given by:
Equation 5
L = PDSLDS + P1D1LD1 + P1
D2LD2 + PD3LD3 + P1D4LD4
where PDS, P1D1, P1
D2, PD3, and P1D4 are the probabilities for the Design Scenario (i.e., no defected waste
packages in a borehole) and for the Defect Scenario variants (considering only a single defect for Defect
Scenarios D1, D2, and D4), respectively, and LDS, LD1, LD2, LD3, and LD4 are the corresponding
radionuclide disposal limits. Since the disposal limits for most radionuclides are similar for each of the
Design and Defect Scenarios considered and since the sum of the individual probabilities equals one,
the overall disposal limit can be conservatively estimated from the lowest disposal limit for a given
Design or Defect Scenario. The exceptions are H-3 and Kr-85 for which Defect Scenario D4 yields
significantly more restrictive activities. Therefore the probability of Defect Scenario D4 (0.005% - see
above) is taken into account when deriving the activities for H-3 and Kr-85.
Tables 22 and 23 summarise the limiting total and per package activities. The tables show that the
borehole disposal system is potentially suitable for disposal of a wide range of radionuclides in a wide
range of different geosphere environments. The multi-barrier near-field engineering is such that even
accounting for reduced performance of a given barrier the overall performance is little affected.
Table 24 shows the maximum sealed source inventories that the countries identified in Section 3.1.1
have for disposal and the activity limit calculated from the GSA. As noted in Section 3.1.1,
NEWMDB and the other data sources used to derive the inventory do not always contain information
on the dimensions of the sources, so not all the sources listed in the data sources might be suitable for
disposal in a narrow diameter borehole. Therefore the inventory given in Table 24 is considered to be
an upper estimate of the inventory that might need to be disposed using the borehole disposal concept.
It can be seen that all the systems assessed in the GSA provide adequate safety for all the
radionuclides of interest with the exception of Pu-239 and Am-241, for which the large number of
66
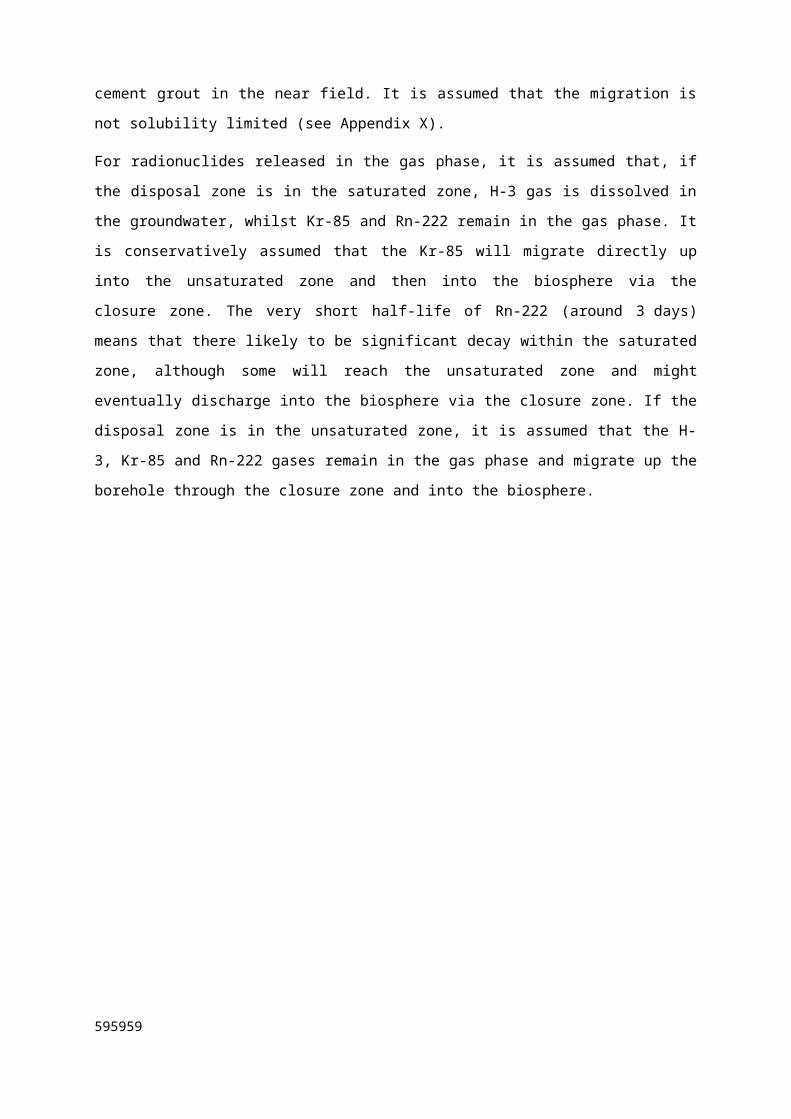
sources to be disposed distorts the value of the total activity for disposal. Even so, the calculated limits
for these two radionuclides are less than a factor of four lower than maximum activity to be disposed.
Table 24 also provides information on the maximum number of sources in a country. It can be seen
that the number of sources for the vast majority of radionuclides can be accommodated in a single
borehole (assuming 50 sources per borehole), further underlining the practicability of the borehole
disposal concept as an option for the management of disused sealed sources.
676767
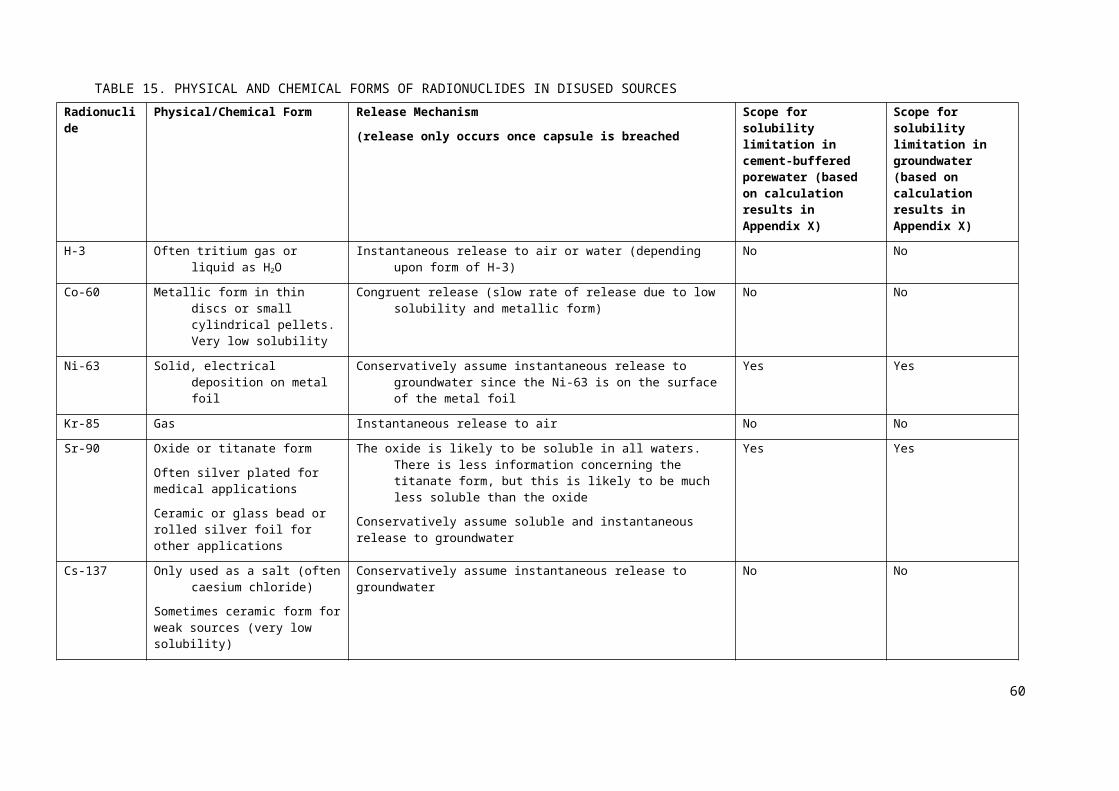
TABLE 22. TOTAL ACTIVITY LIMITS
Near Field Saturated Geosphere Total Activity Level (Bq)
Disposal Zone
Flow Rate Flow Type H-3 Co-60 Ni-63 Kr-85 Sr-90 Cs-137 Pb-210 Ra-226 Pu-238 Pu-239 Am-241
Unsaturated
HighPorous * * * * * * * * 2E+12 5E+11 3E+13
Fractured * * * * * * * * 2E+12 5E+11 4E+13
Medium Porous * * * * * * * * 2E+12 5E+11 4E+13
Low Porous * * * * * * * * 2E+12 5E+11 4E+13
Saturated
HighPorous * * * * * * * * 2E+12 5E+11 3E+12
Fractured * * * * * * * * 2E+12 5E+11 4E+13
Medium Porous * * * * * * * * 2E+12 5E+11 4E+13
Low Porous * * * * * * * * 2E+12 5E+11 4E+13
* denotes a total activity level that is greater than 1 x 10¹⁸ Bq.
68
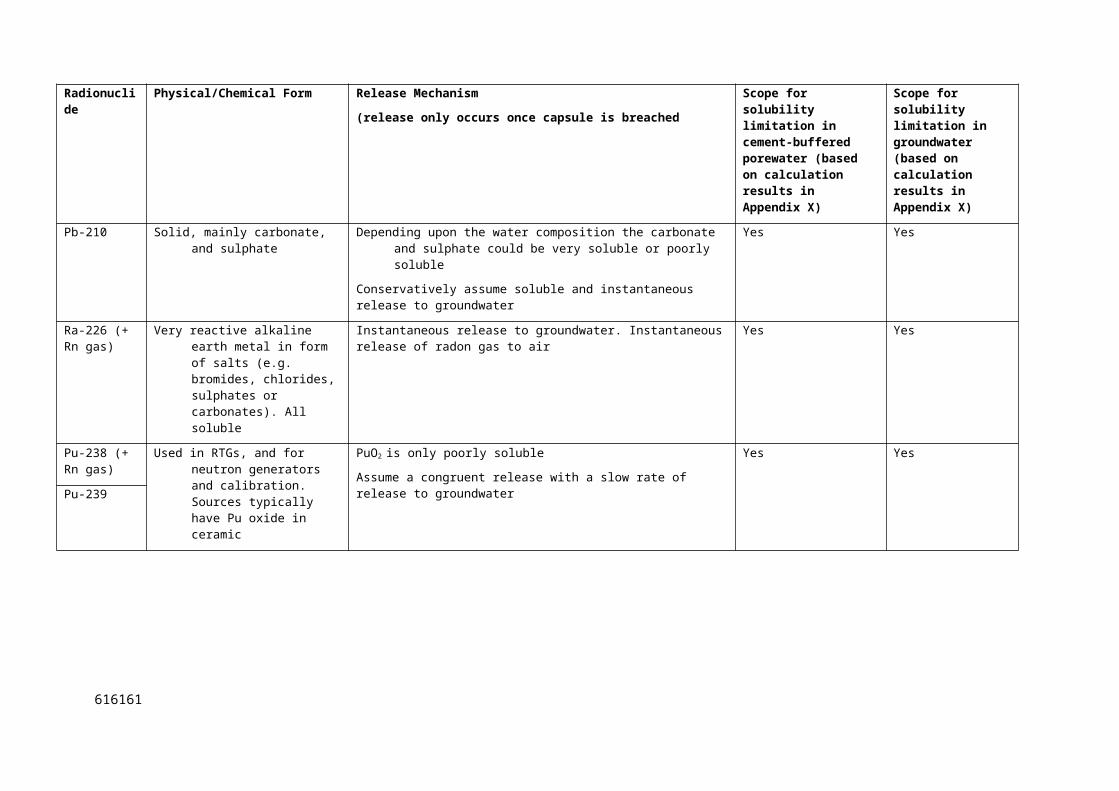
TABLE 23. PER PACKAGE ACTIVITY LIMITS
Near Field Saturated Geosphere Per Package Activity Level (Bq)
Disposal Zone
Flow Rate Flow Type H-3 Co-60 Ni-63 Kr-85 Sr-90 Cs-137 Pb-210 Ra-226 Pu-238 Pu-239 Am-241
Unsaturated
HighPorous * * * * * * * * 4E+10 1E+10 7E+11
Fractured * * * * * * * * 4E+10 1E+10 9E+11
Medium Porous * * * * * * * * 4E+10 1E+10 9E+11
Low Porous * * * * * * * * 4E+10 1E+10 9E+11
Saturated
HighPorous * * * * * * * * 4E+10 1E+10 5E+10
Fractured * * * * * * * * 4E+10 1E+10 9E+11
Medium Porous * * * * * * * * 4E+10 1E+10 9E+11
Low Porous * * * * * * * * 4E+10 1E+10 9E+11
* denotes a per package activity level that is greater than 2 x 10¹⁶ Bq.
696969
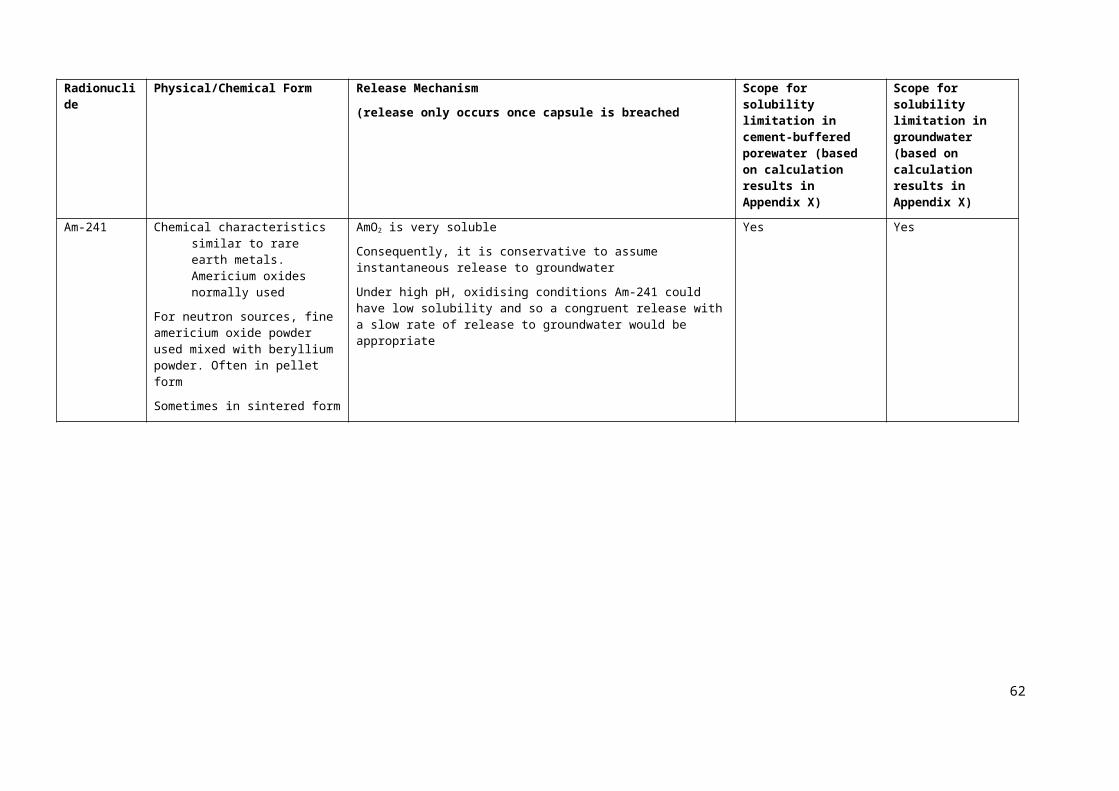
TABLE 24. COMPARISON OF INVENTORIES FOR DISPOSAL AND CALCULATED ACTIVITY LIMITS
Radionuclide Maximum Inventory for Disposal in a Country (Bq)
Calculated Activity Limit (Bq)
Maximum Number of Sources in a Country
H-3 2.8E+14 * 303
Na-22 3.4E+06 * 2
Mn-54 1.0E+05 *
Fe-55 9.9E+09 * 4
Co-57 1.7E+10 * 75
Co-60 2.9E+15 * 158
Ni-63 2.1E+10 * -b
Zn-65 3.7E+05 * 1
Se-75 3.0E+11 * -b
Kr-85 6.3E+11 * 21
Y-88 1.0E+05 * -b
Sr-90 5.3E+11 * 135
Cd-109 3.1E+09 * 3
Ba-133 3.3E+08 * 1
Cs-137 7.5E+14 * 1500
Pm-147 2.7E+11 * 8
Sm-151 7.8E+09 * 3
Eu-152 4.0E+08 * -b
Gd-153 1.5E+11 * 36
Yb-169 2.2E+11 * -b
Ir-192 9.3E+14 * 29
Au-195 4.0E+07 * -b
Hg-203 1.5E+06 * 1
Tl-204 5.0E+08 * 9
Pb-210 1.0E+07 * -b
Po-210 1.0E+10 * 4
Ra-226 2.6E+13 * 912
Pu-238 2.0E+10 2E+12 44
Pu-239 6.7E+11 5E+11 12 918
Am-241 1.2E+13 3E+12a 2274
Cf-252 4.1E+09 * 4
NOTES: * Denotes a total activity level that is greater than 1 x 10¹⁸ Bq (see text in Section 6.1.1).
a Most limiting value for the geospheres considered. Other geospheres give values that are less restrictive by about
an order of magnitude.
b No information available.
70
6.2. RESULTS FOR VARIANT CALCULATIONS
In order to investigate the sensitivity of the results presented in Section 6.1 to conceptual model and
data assumptions, eight variant cases were identified and associated calculations undertaken. The cases
considered:
no congruent release of Co-60, Pu-238 and Pu-239 (Section 6.2.1);
accelerated cement grout degradation in the near field (Section 6.2.2)
accelerated stainless steel corrosion (Section 6.2.3);
decreased and increased cement grout sorption (Section 6.2.4);
decreased and increased geosphere pathlength (Section 6.2.5);
decreased and increased geosphere sorption (Section 6.2.6);
alternative uses of abstracted groundwater (Section 6.2.7); and
decreased and increased erosion rates (Section 6.2.8).
These cases are presented and discussed below. Tables of total and per package activity levels for each
variant are provided in Appendix XIII (Tables M.17 to M.44). The results for the key radionuclides
(Pu-238, Pu-239 and Am-241) are graphically summarized for each geosphere system using a
“tornado plot” (see Figs M.1 to M.6). Each tornado plot shows the associated geosphere system’s total
activity limit for the Design Scenario for the liquid and solid releases. The total activity limit for the
liquid release is shown by the solid vertical line, whilst the limit for the solid release is shown by the
horizontal bar marked ‘Erosion’. The total activity limits for the variant calculations are shown by the
series of horizontal bars.
6.2.1.No Congruent ReleaseFor the reference case, the physical form of the radionuclides within the sealed source was taking into
consideration (Section 5.2.1). It was identified that for Co-60, Pu-238 and Pu-239, the physical form
of the source is such that the entire inventory would not be available once the capsule has failed and
congruent release would occur. This variant examines the impact of ignoring congruent release and
assuming instantaneous dissolution of the radionuclides on contact with water. The results
(Tables M.17 and M.18) are not altered for Co-60 because its half life is so short relative to the time
for failure of the capsule. For Pu-238 and Pu-239, the activity levels actually increase for the vast
majority of geosphere systems by up to an order of magnitude when congruent release is ignored. The
reason for this is that there is less time for decay and ingrowth of more radiologically significant
daughters.
6.2.2.Accelerated Cement Grout Degradation
717171
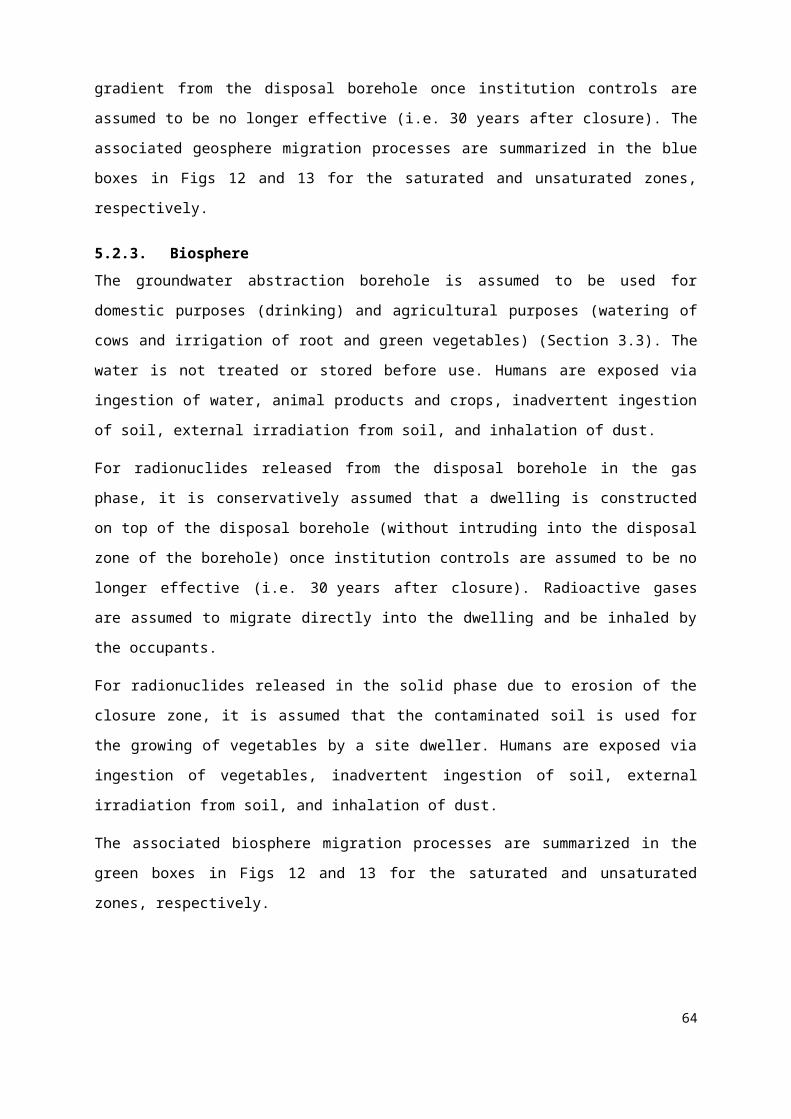
Increasing the rate at which the cement grout degrades by an order of magnitude causes the activity
levels to reduced by less than a factor of two (Tables M.19 and M.20). This is due to the relative
unimportance of the cement grout as a barrier, and the adequate performance of the other near-field
barriers than compensate for the more rapid degradation of the grout.
6.2.3.Accelerated Stainless Steel CorrosionIncreasing the corrosion rate by an order of magnitude, has little or no effect on activity levels for
disposals in the unsaturated zone since the more rapid failure of the stainless steel is compensated for
by the performance of other barriers such as the unsaturated zone that retards the migration of the
radionuclides (Tables M.21 and M.22). For disposals in the saturated zone, the increased corrosion
rate decreases the activity levels that can be disposed in most geosphere systems by an order of
magnitude for Pu-238 and two orders of magnitude for Pu-239. However, activity levels for Am-241
actually increase for some saturated geosphere systems since less time is available for the in-growth of
radiologically significant daughters.
6.2.4.Decreased and Increased Cement Grout Sorption The results are relatively insensitive to decreasing/increasing cement grout sorption values by two
orders of magnitude. This is especially the case for the saturated zone due to the short (<0.25 m)
horizontal travel distance through the grout meaning that the role of the grout in sorbing the
radionuclides is not significant (Tables M.23 to M.26). For the unsaturated zone, activity levels vary
by up to an order of magnitude between the values for the decreased and increased sorption cases, due
to the longer (50 m) vertical travel distance through the grout.
6.2.5.Decreased and Increased Geosphere PathlengthDecreasing/increasing the pathlength through the saturated geosphere to the water abstraction well by
an order of magnitude from the reference case of 100 m has a significant impact on the activity levels
for most geosphere systems (Tables M.27 to M.30). The longer pathlength generally increases the
levels due to the greater opportunity for retardation and decay, whilst the converse is true for the short
pathlength. Varying the pathlength between 10 and 1000 m typically results in activity levels varying
by two or three orders of magnitude.
6.2.6.Decreased and Increased Geosphere SorptionDecreasing/increasing sorption in the geosphere by two orders of magnitude has a similar effect to
decreasing/increasing the geosphere pathlength, since it affects the travel time in the geosphere which
in turn affect the extent of decay (Tables M.31 to M.34).
6.2.7.Alternative Uses of Abstracted GroundwaterCalculations for the liquid release have been undertaken assuming that the abstracted water is used by
humans for domestic (drinking) and agricultural purposes (watering of cattle and irrigation of green
72

and root vegetables). It is recognized that alternative uses could be envisaged. Therefore three sets of
variant calculations have been undertaken (Tables M.35 to M.40).
The first assumes that the water is used solely for meeting the drinking water demand of four people
(2 l day-1 person-1). Results show that for the high flow saturated geospheres, the resulting activity
values are up to an order of magnitude less restrictive than for the equilavent reference calculations
due to the limitation of the exposure pathway to just ingestion of drinking water. However, for the
saturated medium and low flow systems, and disposal in the unsaturated zone, the activity values are
more restrictive by up to two orders of magnitude than for the equilavent reference calculations since
there is less dilution at the GBI as a consequence of the lower abstraction rate.
The second set of calculations assumes that the water abstracted from the saturated geospheres is
solely used to supply water for a fish farm. The annual individual effective dose to a human from the
consumption of fish (DFish, in Sv y-1) is given by:
Equation 6
DFish=CW CF Fish IngFish DC Ing
where CW is the radionuclide concentration in the abstracted water in which the fish are farmed (Bq m-3)
(calculated using Equation ), CFFish is the concentration factor for fish (m3 kg-1) (given in Table L.12),
IngFish is the individual ingestion rate of fish (kg y-1) (given in Table L.23), and DCIng is the dose
coefficient for ingestion (Sv Bq-1) (given in Table L.5). The results show that, in comparison with the
activity levels for the equivalent reference calculations, levels increase by between one and two orders
of magnitude. So consideration of fish farming does not result in more restrictive activity levels.
The third set of calculation assumes that the water abstracted from the saturated geosphere systems is
used solely for bathing. The annual individual dose to a human from external irradiation from water
(DExWat, in Sv y-1) is given by:
Equation 7
DExWat=CW OWat DC Extw
where CW is the concentration in the water (Bq m-3) (calculated using Equation ), OWat is the individual
occupancy in the contaminated water (h y-1) (given in Table L.23), and DCExtw is the dose coefficient
for external irradiation from water (Sv h-1/Bq m-3) (given in Table L.5). The resulting activity levels
are less restrictive by at least three orders of magnitude than for the reference calculation. This
demonstrates the relative unimportance of this exposure pathway.
6.2.8.Decreased and Increased Erosion Rates
737373
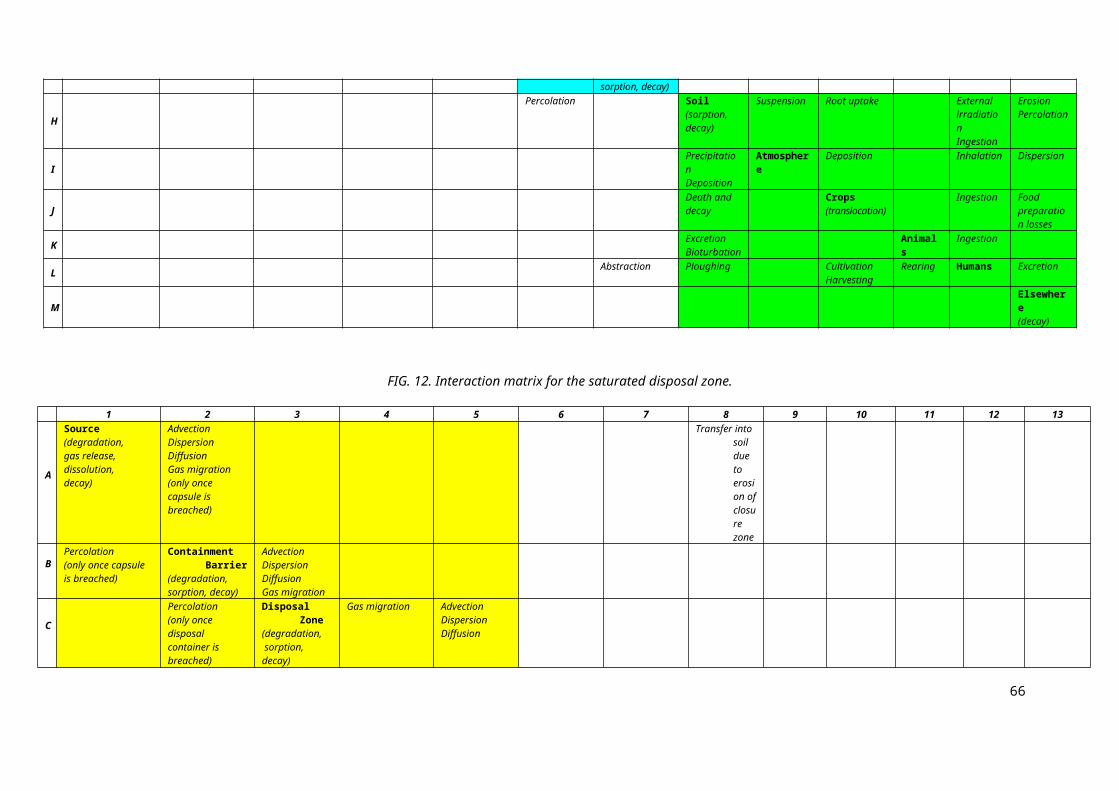
The effect of decreasing/increasing erosion rates by an order of magnitude varies between the
radionuclides considered (Tables M.41 to M.44). The increased rate results in the earlier exposure of
the disposal zone (after 10 000 years) which in turn results in a Ra-226 activity level of 3 x 10¹⁰ Bq.
For Pu-239 there is a two order of magnitude range in the activity level with the higher erosion rate
resulting in a lower activity level due to the earlier exposure of the disposal zone. The results for Pu-
238 and Am-241 are affected by the in-growth of radiologically significant daughters, which means
that the lower erosion rate gives a more restrictive activity level for Am-241 than the higher rate.
6.3. WHAT-IF CALCULATIONS
In order to investigate the role of the engineered and natural barriers in providing safety, a series of
“what-if” calculations have been undertaken in which various barriers have been removed from the
modelled system.
6.3.1.No Near-Field BarriersA series of calculation cases were undertaken that removed each near-field barrier in turn, i.e.:
no capsule but all other near-field barriers in place (Tables M.45, M.46):
no containment barrier but all other near-field barriers in place (Tables M.47, M.48):
no disposal container but all other near-field barriers in place (Tables M.49, M.50): and
no backfill but all other near-field barriers in place (Tables M.51, M.52).
In addition, a further case was considered in which all near-field barriers were removed (Tables M.53,
M.54).
The results of these cases are summarized in Figs 18, 19 and 20 for Pu-238, Pu-239 and Am-241,
respectively for liquid releases. They show that, for disposal of these radionuclides in the unsaturated
zone, removing near-field barriers has no significant effect on activity levels that can be disposed and
in certain cases activity limits increase marginally due to the reduced time for the in-growth of
radiologically significant daughters. More significant (order of magnitude) effects are generally seen
for disposals in the saturated zone, reflecting the absence of the unsaturated zone below the disposal
borehole to “buffer” the effects of the barrier failure17, and emphasizing the importance of the near-
field barriers to limit releases of radionuclides. It is important to note that not all radionuclides show a
decrease in activity levels for cases with barriers removed (e.g. Pu-239 for the saturated medium flow
system). This is due to the complex interplay between release mechanisms, migration times through
the geosphere and the in-growth/decay of daughters. In the case of Pu-239, the release rate is
congruent (rather than instantaneous) and the medium flow geosphere provides sufficient retardation
17 Similar behaviour can be seen for the accelerated stainless steel corrosion variant case discussed in Section 6.2.3.
74
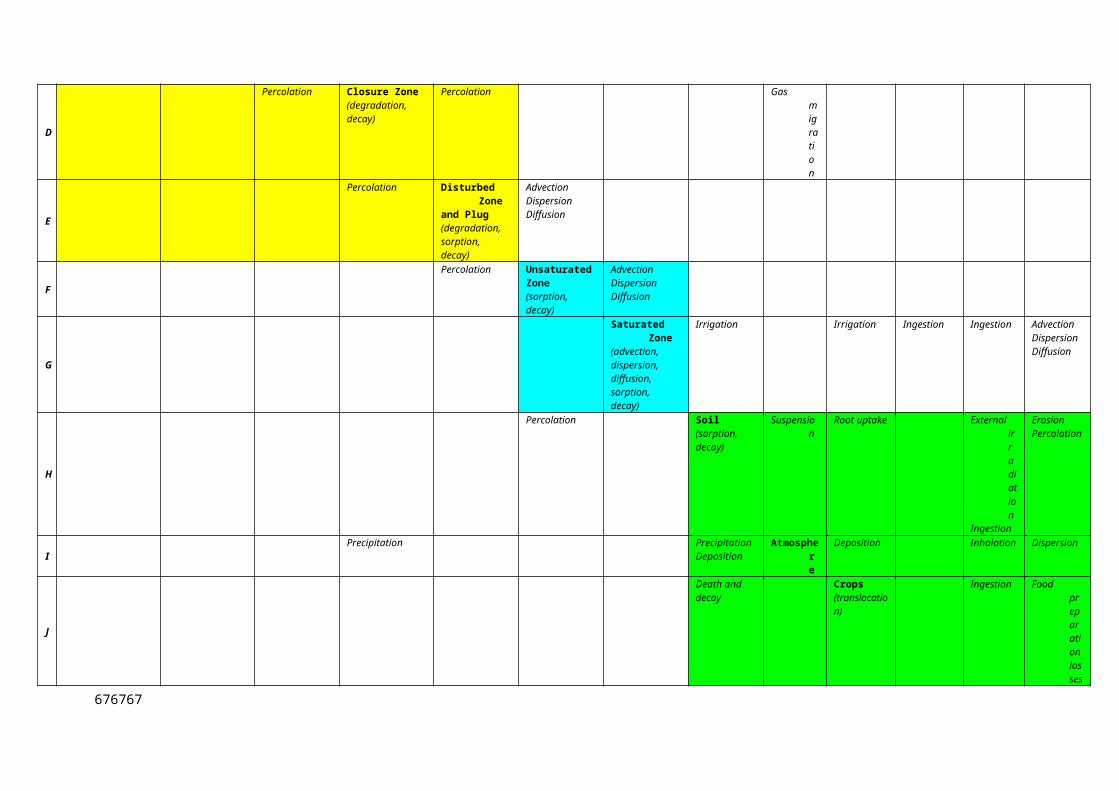
to allow the in-growth of the radiologically significant daughters. Thus, in this case, the absence of
near-field barriers is not significant.
Assuming that there are no near-field barriers, results in significant increase in the number of
radionuclides and geospheres for which the activity levels are less than 1 x 10¹⁸ Bq (compare Table 25
with Table 18). This emphasizes the importance of the near-field barriers for many of the
radionuclides and geospheres considered. Figure 21 compares the activity levels for the Design
Scenario with the case with no near-field barriers for H-3, Sr-90 and Ra-226 for liquid releases. The
figure illustrates the significant (many orders of magnitude) reductions in activity levels for the case
with no near-field barriers, especially for the comparatively short-lived H-3. Figure 21 also illustrates:
the “buffering” effect of the unsaturated zone below the disposal borehole, especially for the
longer-lived Ra-226; and
the retarding effect of the medium and low flow geospheres which therefore allow the disposal
of higher activity levels, even for the case of no near-field barriers.
The absence of near-field barriers also reduces the total activity levels for H-3 and Kr-85 gases from in
excess of 1 x 10¹⁸ Bq for the Design Scenario (Table 19) down to 1 x 10¹¹ Bq and 2 x 10¹² Bq,
respectively (Table 26).
757575
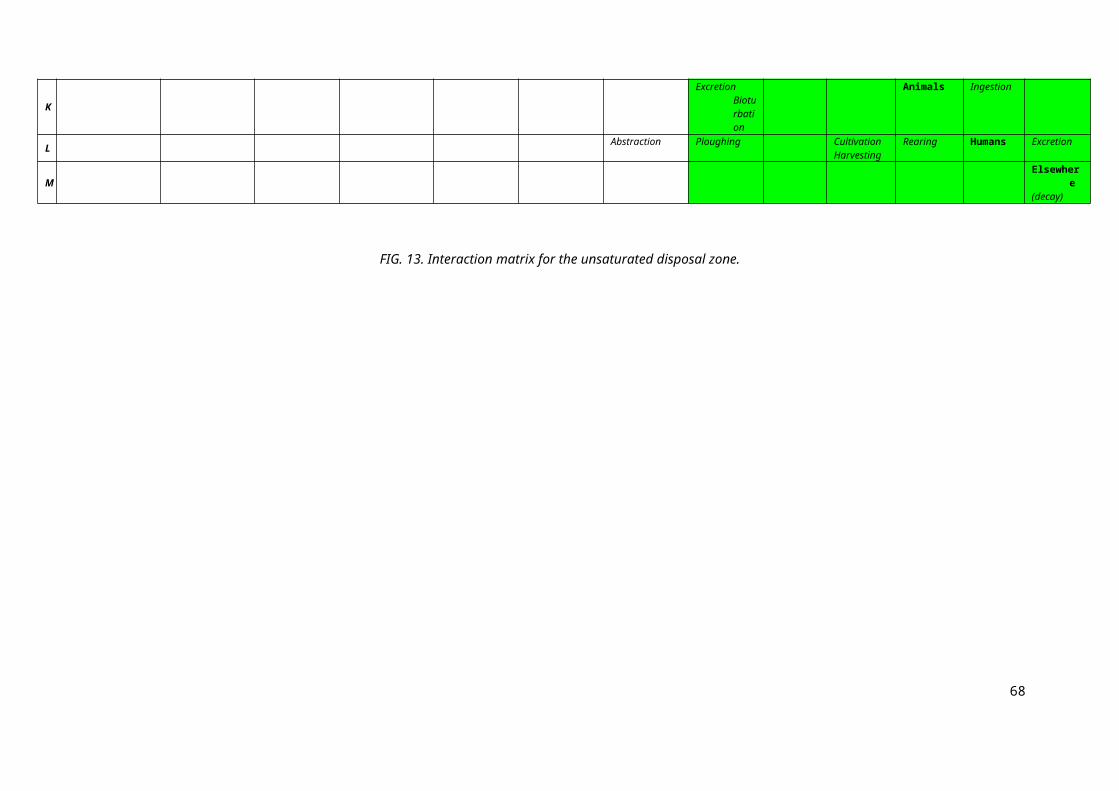
Pu-238What If Cases
Des
ign
Scen
ario
Des
ign
Scen
ario
Des
ign
Scen
ario
Des
ign
Scen
ario
Des
ign
Scen
ario
Des
ign
Scen
ario
Des
ign
Scen
ario
No
Cap
sule
No
Cap
sule
No
Cap
sule
No
Cap
sule
No
Cap
sule
No
Cap
sule
No
Cap
sule
No
Cap
sule
No
Con
tain
men
t Bar
rier
No
Con
tain
men
t Bar
rier
No
Con
tain
men
t Bar
rier
No
Con
tain
men
t Bar
rier
No
Con
tain
men
t Bar
rier
No
Con
tain
men
t Bar
rier
No
Con
tain
men
t Bar
rier
No
Con
tain
men
t Bar
rier
No
Dis
posa
l Con
tain
er
No
Dis
posa
l Con
tain
er
No
Dis
posa
l Con
tain
er
No
Dis
posa
l Con
tain
er
No
Dis
posa
l Con
tain
er
No
Dis
posa
l Con
tain
er
No
Dis
posa
l Con
tain
er
No
Dis
posa
l Con
tain
er
No
Bac
kfil
l
No
Bac
kfil
l
No
Bac
kfil
l
No
Bac
kfil
l
No
Bac
kfil
l
No
Bac
kfil
l
No
Bac
kfil
l
No
Bac
kfil
l
No
Nea
r-fi
eld
Bar
rier
s
No
Nea
r-fi
eld
Bar
rier
s
No
Nea
r-fi
eld
Bar
rier
s
No
Nea
r-fi
eld
Bar
rier
s
No
Nea
r-fi
eld
Bar
rier
s
No
Nea
r-fi
eld
Bar
rier
s
No
Nea
r-fi
eld
Bar
rier
s
No
Nea
r-fi
eld
Bar
rier
s
No
Geo
sphe
re B
arri
er
No
Geo
sphe
re B
arri
er
No
Geo
sphe
re B
arri
er
No
Geo
sphe
re B
arri
er
No
Geo
sphe
re B
arri
er
No
Geo
sphe
re B
arri
er
No
Geo
sphe
re B
arri
er
No
Geo
sphe
re B
arri
er
Des
ign
Scen
ario
1E+6
1E+7
1E+8
1E+9
1E+10
1E+11
1E+12
1E+13
1E+14
1E+15
1E+16
1E+17
1E+18
Unsaturated High FlowPorous
Unsaturated High FlowFractured
Unsaturated Medium FlowPorous
Unsaturated Low FlowPorous
Saturated High Flow Porous Saturated High FlowFractured
Saturated Medium FlowPorous
Saturated Low Flow Porous
TO
TA
L A
CT
IVIT
Y L
EV
EL
S FO
R L
IQU
ID R
EL
EA
SE
1E+6
1E+7
1E+8
1E+9
1E+10
1E+11
1E+12
1E+13
1E+14
1E+15
1E+16
1E+17
1E+18
FIG. 18. Pu-238 total activity levels for the design scenario and what-if calculations: liquid releases.
76
Pu-239What If Cases
Des
ign
Scen
ario
Des
ign
Scen
ario
Des
ign
Scen
ario
Des
ign
Scen
ario
Des
ign
Scen
ario
Des
ign
Scen
ario
Des
ign
Scen
ario
No
Cap
sule
No
Cap
sule
No
Cap
sule
No
Cap
sule
No
Cap
sule
No
Cap
sule
No
Cap
sule
No
Cap
sule
No
Con
tain
men
t Bar
rier
No
Con
tain
men
t Bar
rier
No
Con
tain
men
t Bar
rier
No
Con
tain
men
t Bar
rier
No
Con
tain
men
t Bar
rier
No
Con
tain
men
t Bar
rier
No
Con
tain
men
t Bar
rier
No
Con
tain
men
t Bar
rier
No
Dis
posa
l Con
tain
er
No
Dis
posa
l Con
tain
er
No
Dis
posa
l Con
tain
er
No
Dis
posa
l Con
tain
er
No
Dis
posa
l Con
tain
er
No
Dis
posa
l Con
tain
er
No
Dis
posa
l Con
tain
er
No
Dis
posa
l Con
tain
er
No
Bac
kfill
No
Bac
kfill
No
Bac
kfill
No
Bac
kfill
No
Bac
kfill
No
Bac
kfill
No
Bac
kfill
No
Bac
kfill
No
Nea
r-fi
eld
Bar
rier
s
No
Nea
r-fi
eld
Bar
rier
s
No
Nea
r-fi
eld
Bar
rier
s
No
Nea
r-fi
eld
Bar
rier
s
No
Nea
r-fi
eld
Bar
rier
s
No
Nea
r-fi
eld
Bar
rier
s
No
Nea
r-fi
eld
Bar
rier
s
No
Nea
r-fi
eld
Bar
rier
s
No
Geo
sphe
re B
arrie
r
No
Geo
sphe
re B
arrie
r
No
Geo
sphe
re B
arrie
r
No
Geo
sphe
re B
arrie
r
No
Geo
sphe
re B
arrie
r
No
Geo
sphe
re B
arrie
r
No
Geo
sphe
re B
arrie
r
No
Geo
sphe
re B
arrie
r
Des
ign
Scen
ario
1E+6
1E+7
1E+8
1E+9
1E+10
1E+11
1E+12
1E+13
1E+14
1E+15
1E+16
1E+17
1E+18
Unsaturated High FlowPorous
Unsaturated High FlowFractured
Unsaturated Medium FlowPorous
Unsaturated Low FlowPorous
Saturated High Flow Porous Saturated High FlowFractured
Saturated Medium FlowPorous
Saturated Low Flow Porous
TOT
AL
AC
TIV
ITY
LE
VE
LS F
OR
LIQ
UID
RE
LEA
SE
1E+6
1E+7
1E+8
1E+9
1E+10
1E+11
1E+12
1E+13
1E+14
1E+15
1E+16
1E+17
1E+18
FIG. 19. Pu-239 total activity levels for the design scenario and what-if calculations: liquid releases.
777777
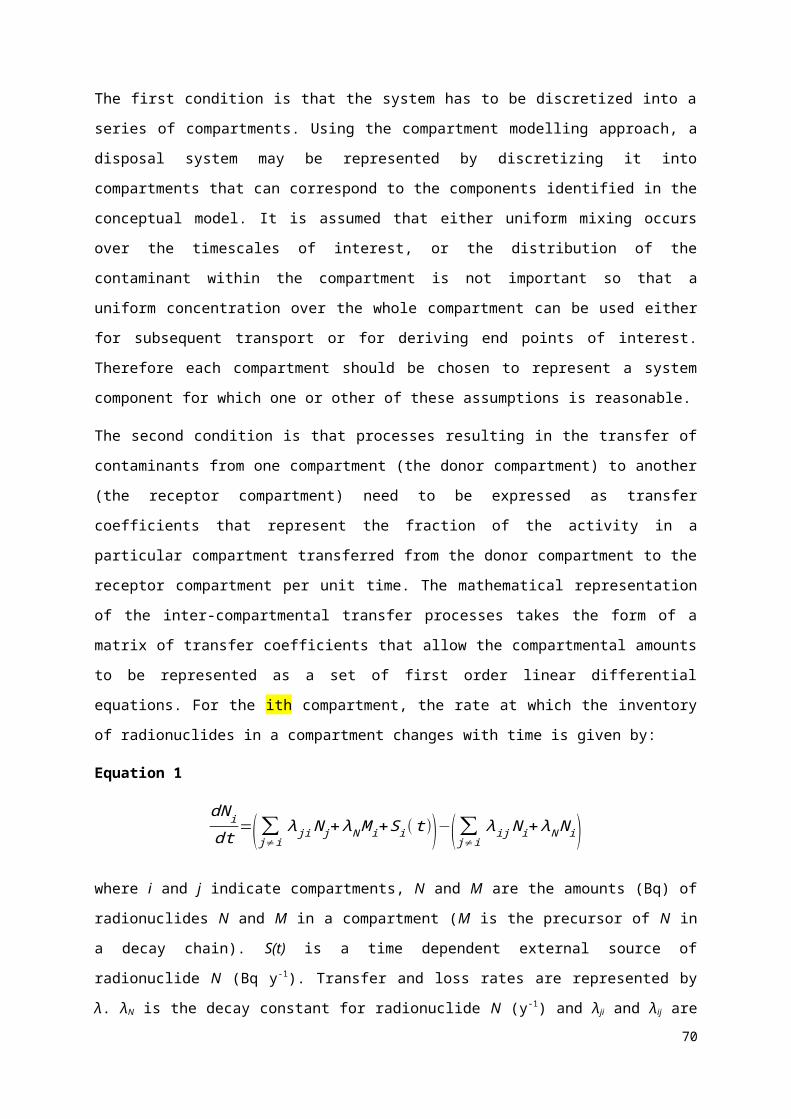
Am-241What If Cases
Des
ign
Scen
ario
Des
ign
Scen
ario
Des
ign
Scen
ario
Des
ign
Scen
ario
Des
ign
Scen
ario
Des
ign
Scen
ario
Des
ign
Scen
ario
No
Cap
sule
No
Cap
sule
No
Cap
sule
No
Cap
sule
No
Cap
sule
No
Cap
sule
No
Cap
sule
No
Cap
sule
No
Con
tain
men
t Bar
rier
No
Con
tain
men
t Bar
rier
No
Con
tain
men
t Bar
rier
No
Con
tain
men
t Bar
rier
No
Con
tain
men
t Bar
rier
No
Con
tain
men
t Bar
rier
No
Con
tain
men
t Bar
rier
No
Con
tain
men
t Bar
rier
No
Dis
posa
l Con
tain
er
No
Dis
posa
l Con
tain
er
No
Dis
posa
l Con
tain
er
No
Dis
posa
l Con
tain
er
No
Dis
posa
l Con
tain
er
No
Dis
posa
l Con
tain
er
No
Dis
posa
l Con
tain
er
No
Dis
posa
l Con
tain
er
No
Bac
kfil
l
No
Bac
kfil
l
No
Bac
kfil
l
No
Bac
kfil
l
No
Bac
kfil
l
No
Bac
kfil
l
No
Bac
kfil
l
No
Bac
kfil
l
No
Nea
r-fi
eld
Bar
rier
s
No
Nea
r-fi
eld
Bar
rier
s
No
Nea
r-fi
eld
Bar
rier
s
No
Nea
r-fi
eld
Bar
rier
s
No
Nea
r-fi
eld
Bar
rier
s
No
Nea
r-fi
eld
Bar
rier
s
No
Nea
r-fi
eld
Bar
rier
s
No
Nea
r-fi
eld
Bar
rier
s
No
Geo
sphe
re B
arri
er
No
Geo
sphe
re B
arri
er
No
Geo
sphe
re B
arri
er
No
Geo
sphe
re B
arri
er
No
Geo
sphe
re B
arri
er
No
Geo
sphe
re B
arri
er
No
Geo
sphe
re B
arri
er
No
Geo
sphe
re B
arri
er
Des
ign
Scen
ario
1E+6
1E+7
1E+8
1E+9
1E+10
1E+11
1E+12
1E+13
1E+14
1E+15
1E+16
1E+17
1E+18
Unsaturated High FlowPorous
Unsaturated High FlowFractured
Unsaturated Medium FlowPorous
Unsaturated Low FlowPorous
Saturated High Flow Porous Saturated High FlowFractured
Saturated Medium FlowPorous
Saturated Low Flow Porous
TO
TA
L A
CT
IVIT
Y L
EV
EL
S FO
R L
IQU
ID R
EL
EA
SE
1E+6
1E+7
1E+8
1E+9
1E+10
1E+11
1E+12
1E+13
1E+14
1E+15
1E+16
1E+17
1E+18
FIG. 20. Am-241 total activity levels for the design scenario and what-if calculations: liquid releases.
78
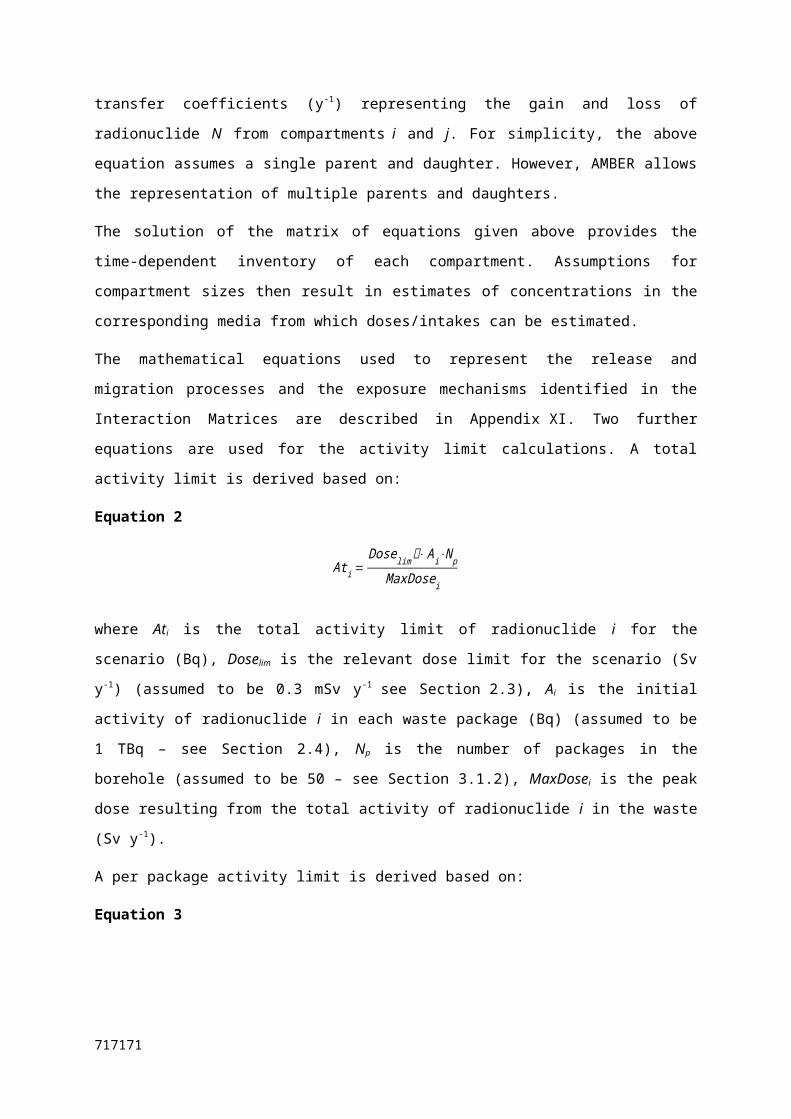
TABLE 25. TOTAL ACTIVITY LEVELS FOR LIQUID RELEASE FOR CASE WITH NO NEAR-FIELD BARRIERS
Near Field Saturated Geosphere Total Activity Level (Bq)
Disposal Zone
Flow Rate Flow Type H-3 Co-60 Ni-63 Kr-85 Sr-90 Cs-137 Pb-210 Ra-226 Pu-238 Pu-239 Am-241
Unsaturated
HighPorous 2E+12 * * * 1E+17 * * 9E+16 8E+13 9E+13 5E+13
Fractured 2E+12 * * * 3E+17 * * * * 3E+16 5E+15
Medium Porous 8E+13 * * * * * * * 3E+15 9E+13 2E+14
Low Porous * * * * * * * * * 9E+16 *
Saturated
HighPorous 2E+09 * 2E+14 * 7E+08 5E+12 3E+12 6E+08 2E+12 7E+10 2E+13
Fractured 2E+09 * 3E+14 * 1E+09 8E+13 3E+12 1E+10 1E+14 2E+14 1E+16
Medium Porous 2E+12 * * * 9E+16 * * 2E+17 1E+14 6E+14 4E+14
Low Porous * * * * * * * * * * *
* denotes a total activity level that is greater than 1 x 10¹⁸ Bq.
797979
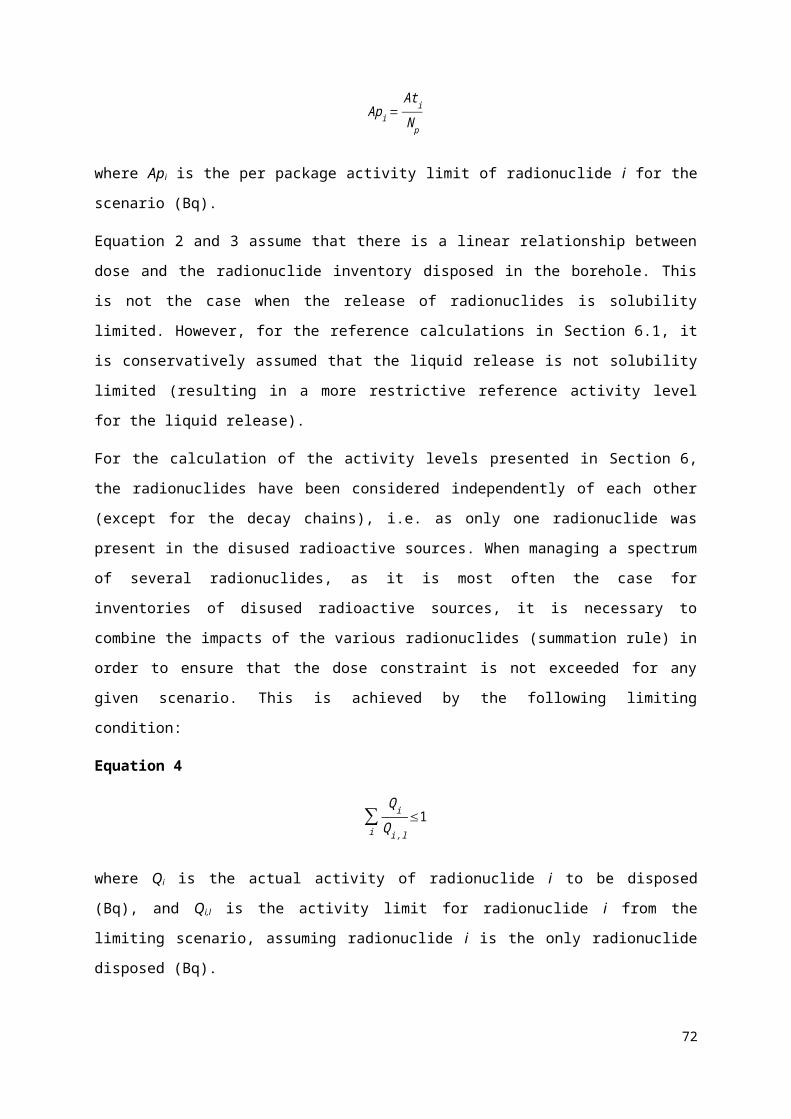
H3, Sr90, Ra226No Near-field Barriers
Des
ign
Scen
ario
: H3
Des
ign
Scen
ario
: H3
Des
ign
Scen
ario
: H3
Des
ign
Scen
ario
: H3
Des
ign
Scen
ario
: H3
Des
ign
Scen
ario
: H3
Des
ign
Scen
ario
: H3
No
Nea
r-fi
eld
Bar
rier
s: H
3
No
Nea
r-fi
eld
Bar
rier
s: H
3
No
Nea
r-fi
eld
Bar
rier
s: H
3
No
Nea
r-fi
eld
Bar
rier
s: H
3
No
Nea
r-fi
eld
Bar
rier
s: H
3
No
Nea
r-fi
eld
Bar
rier
s: H
3
No
Nea
r-fi
eld
Bar
rier
s: H
3
No
Nea
r-fi
eld
Bar
rier
s: H
3
Des
ign
Scen
ario
: Sr-
90
Des
ign
Scen
ario
: Sr-
90
Des
ign
Scen
ario
: Sr-
90
Des
ign
Scen
ario
: Sr-
90
Des
ign
Scen
ario
: Sr-
90
Des
ign
Scen
ario
: Sr-
90
Des
ign
Scen
ario
: Sr-
90
Des
ign
Scen
ario
: Sr-
90
No
Nea
r-fi
eld
Bar
rier
s: S
r-90
No
Nea
r-fi
eld
Bar
rier
s: S
r-90
No
Nea
r-fi
eld
Bar
rier
s: S
r-90
No
Nea
r-fi
eld
Bar
rier
s: S
r-90
No
Nea
r-fi
eld
Bar
rier
s: S
r-90
No
Nea
r-fi
eld
Bar
rier
s: S
r-90
No
Nea
r-fi
eld
Bar
rier
s: S
r-90
No
Nea
r-fi
eld
Bar
rier
s: S
r-90
Des
ign
Scen
ario
: Ra-
226
Des
ign
Scen
ario
: Ra-
226
Des
ign
Scen
ario
: Ra-
226
Des
ign
Scen
ario
: Ra-
226
Des
ign
Scen
ario
: Ra-
226
Des
ign
Scen
ario
: Ra-
226
Des
ign
Scen
ario
: Ra-
226
Des
ign
Scen
ario
: Ra-
226
No
Nea
r-fi
eld
Bar
rier
s: R
a-22
6
No
Nea
r-fi
eld
Bar
rier
s: R
a-22
6
No
Nea
r-fi
eld
Bar
rier
s: R
a-22
6
No
Nea
r-fi
eld
Bar
rier
s: R
a-22
6
No
Nea
r-fi
eld
Bar
rier
s: R
a-22
6
No
Nea
r-fi
eld
Bar
rier
s: R
a-22
6
No
Nea
r-fi
eld
Bar
rier
s: R
a-22
6
No
Nea
r-fi
eld
Bar
rier
s: R
a-22
6
Des
ign
Scen
ario
: H3
1E+6
1E+7
1E+8
1E+9
1E+10
1E+11
1E+12
1E+13
1E+14
1E+15
1E+16
1E+17
1E+18
Unsaturated High Flow Porous Unsaturated High FlowFractured
Unsaturated Medium FlowPorous
Unsaturated Low Flow Porous Saturated High Flow Porous Saturated High Flow Fractured Saturated Medium FlowPorous
Saturated Low Flow Porous
TO
TA
L A
CT
IVIT
Y L
EV
EL
S FO
R L
IQU
ID R
EL
EA
SE
1E+6
1E+7
1E+8
1E+9
1E+10
1E+11
1E+12
1E+13
1E+14
1E+15
1E+16
1E+17
1E+18
FIG. 21. H-3, Sr-90 and Ra-226 total activity levels for the design scenario and no near-field barriers calculation: liquid releases.
80
TABLE 26. TOTAL ACTIVITY LEVELS FOR GASEOUS RELEASE FOR CASE WITH NO NEAR-FIELD BARRIERS
Total Activity Level (Bq)
H-3 Co-60 Ni-63 Kr-85 Sr-90 Cs-137 Pb-210 Ra-226 Pu-238 Pu-239 Am-241
1E+11 18 n.a. n.a. 2E+12 n.a. n.a. n.a. * * n.a. n.a.
* denotes a total activity level that is greater than 1 x 10¹⁸ Bq.
18 Only applicable to unsaturated disposal zone. H-3 in saturated disposal zone is assumed to be dissolved in the groundwater.
818181
6.3.2.No Geosphere BarrierIn order to quantify the contribution of the geosphere to safety, a variant case was considered in which
the flux from the near field was assumed to discharge directly into the compartment from which the
groundwater was abstracted (hence bypassing the geosphere). Due to the performance of the near-
field engineering activity levels are above 1 x 10¹⁸ Bq for all radionuclides except Pu-238, Pu-239 and
Am-241 (Tables M.56 and M.57). For these three radionuclides, the activity levels are generally
reduced by at least two orders of magnitude compared with the Design Scenario indicating the value
of the geosphere as a natural barrier, especially in the case of disposal in the unsaturated zone and in
the low flow saturated geosphere (Figs 18, 19 and 20).
6.4. ANALYSIS OF UNCERTAINTIES
When undertaking a long-term safety assessment of a radioactive waste disposal system, it is
important to be aware of and to manage, as far as possible, the various sources of uncertainty that
arise. In addition, appropriate steps should be taken to build confidence in the assessment and its
results. Various measures have been implemented as part of the current assessment to address
uncertainties and build confidence.
Uncertainties can be considered to arise from three sources [21].
First there is uncertainty in the evolution of the disposal system over the timescales of interest
(scenario uncertainty). This has been accounted for in the current assessment by considering five
scenarios, two of which have been evaluated quantitatively (Design and Defect Scenarios). The
development and justification of these scenarios is discussed in Section 4. For a given disposal system,
the range in associated activity levels for the two scenarios assessed quantitatively is generally small
(much less than an order of magnitude). However, Defect Scenario D4 (which involves a failed waste
capsule being within a failed disposal container) does result in a total activity limit of 6 x 10¹² Bq for
H-3 and 1 x 10¹⁴ Bq for Kr-85 compared with values in excess of 1 x 10¹⁸ Bq for the Design Scenario.
The second source of uncertainty is uncertainty in the conceptual, mathematical and computer models
used to simulate the behaviour and evolution of the disposal system (e.g. owing to the inability of
models to represent the system completely, approximations used in solving the model equations, and
coding errors) (model uncertainty). Various quality assurance checks have been undertaken to ensure
that the mathematical model and data specified in Appendices XI and XII have been correctly
implemented in the AMBER software tool and, as discussed in Section 5.6, independent verification
tests for AMBER have been undertaken. Different concepts for the release of radionuclides from the
near field and the use of abstracted water have been considered in Sections 6.1.2 and 6.2.7,
respectively, indicating that differences of up to one to two orders of magnitude can arise compared to
the reference assumptions.
82
The GSA considers that the GBI to be a water abstraction borehole (see Section 3.2). Alternative
interfaces could be considered that might result in the accumulation of certain long-lived radionuclides
(e.g. groundwater discharge into lake sediment). This sediment could subsequently be uncovered
resulting in the exposure of humans to the accumulated radionuclides. Table 27 summarizes the peak
activity of radionuclides in soil contaminated by irrigation water from the water abstraction borehole
for the Design Scenario, and for lake sediment contaminated by direct groundwater discharge, for both
high and low flow geospheres.
TABLE 27. PEAK ACTIVITY LEVELS FOR SOIL AND LAKE SEDIMENT
Radionuclide High Flow Porous Geosphere Low Flow Porous GeosphereParent Daughter Peak Amount
in Soil (Bq)Peak Amount
in Sediment (Bq)
Peak Amount in Soil (Bq)
Peak Amount in Sediment (Bq)
Pu-238 0E+00 0E+00 0E+00 0E+00U-234 1E+06 1E+06 3E-09 7E-12Th-230 2E+06 5E+06 5E-09 1E-11Ra-226 3E+06 1E+07 9E-08 1E-11Pb-210 4E+06 1E+07 8E-08 1E-11Po-210 4E+06 1E+07 8E-08 1E-11
Pu-239 1E+01 2E+01 1E-13 2E-19U-235 1E+06 9E+05 3E+01 1E+06Pa-231 1E+06 2E+06 4E+01 1E+06Ac-227 1E+06 2E+06 3E+01 1E+06
Am-241 0E+00 0E+00 0E+00 0E+00Np-237 2E+07 1E+06 1E-05 9E-06Pa-233 2E+07 1E+06 1E-05 9E-06U-233 4E+07 3E+07 3E-05 1E-05Th-229 4E+07 9E+07 3E-05 1E-05
It can be seen that activity amounts for the lake sediment are generally either lower or only marginally
greater than for the soil. Given that the area affected by groundwater discharge into the lake sediment
can be expected to be larger than the area of irrigated soil (361 m2), it is considered that the
concentration will be lower than in the soil and so the dose consequences will be lower. The only
exception is for the daughters of Pu-239 discharged from the low flow geosphere for which the peak
activity is more than four orders of magnitude higher than for the soil. Activities are comparable to
those for the high flow system and so disposal levels can be expected to be broadly comparable.
The third source of uncertainty is uncertainty in the data and parameters used as inputs in the
modelling (data and parameter uncertainty). Such uncertainties can be assessed through
deterministic and/or probabilistic sensitivity analysis if resources allow. The range of different near
fields and geospheres considered in the current assessment allows an initial assessment of the impact
838383
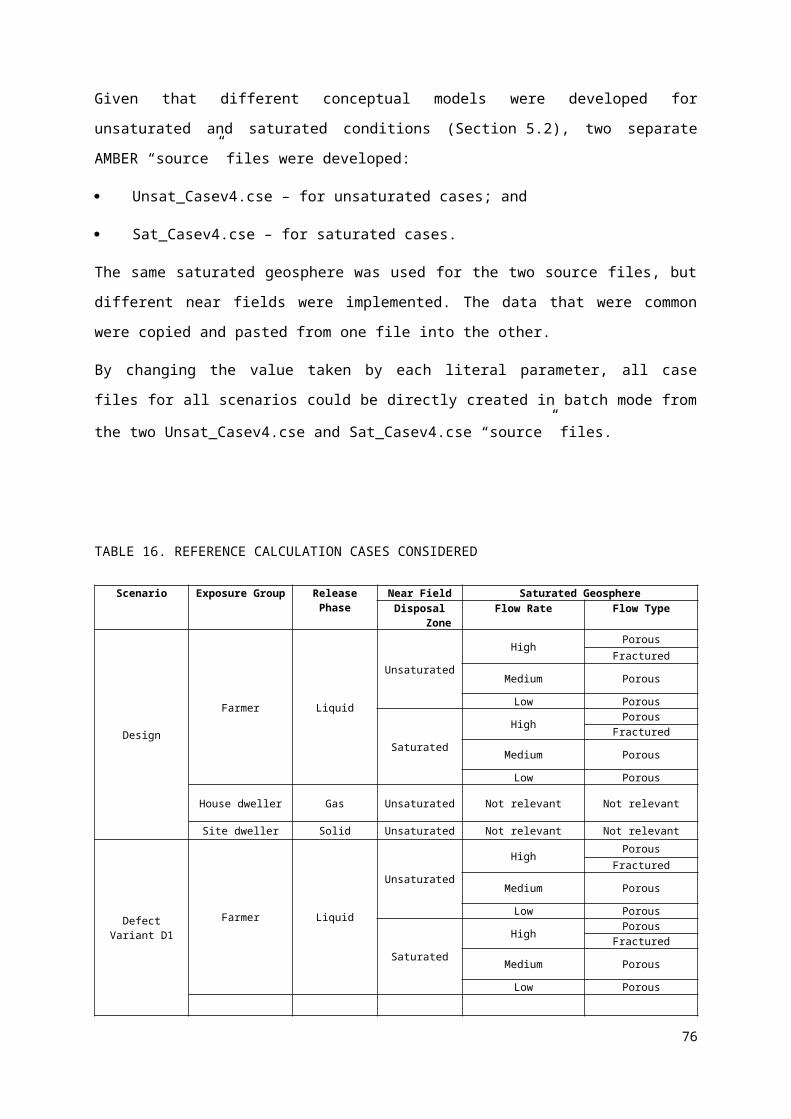
of different parameter values (e.g. different corrosion and degradation rates, sorption coefficients, and
hydraulic conductivities). Table 18 shows, that for liquid releases, differences of many orders of
magnitude can arise in activity levels for the different systems considered due to the differences in key
parameters such as sorption coefficients and travel times in the saturated zone. In addition,
deterministic calculations have been reported in Section 6.2 that illustrate the sensitivity of the results
to different parameter values. Differences of up to three orders of magnitude are observed for certain
radionuclides for some parameters (e.g. geosphere pathlength and sorption coefficient). But for other
parameters, the differences are significantly less than an order of magnitude.
In addition to the above sources of uncertainty, a further type of uncertainty, subjective uncertainty
(uncertainty due to reliance on expert judgement), is also linked with the above sources of uncertainty [8].
In common with many other assessments, expert judgement has been used at many stages during the
current assessment due to a variety of reasons such as a lack of knowledge concerning current and
future conditions, conceptual models and data/parameter values (and distributions). Where such
judgements have been made in the current assessment, they have been documented and, as far as
practicable, justified – see for example Section 4 for the scenario development and justification
process and Appendix XII for the data values.
6.5. BUILDING OF CONFIDENCE
Through discussions within various international fora (such as the Nuclear Energy Agency (NEA) [46,
47] and the IAEA [8, 48]), it is becoming increasingly recognized that building confidence in the long-
term safety of a radioactive waste repository is an increasingly important issue. To undertake a safety
assessment and present the results is not sufficient. Confidence needs to be built in the safety
assessment and its results. There is also a need to have confidence in other aspects of the long-term
safety of the repository in order to build confidence to the satisfaction of all stakeholders (i.e.
regulators, the public, wider scientific community, political decision makers etc.). In particular,
confidence in the long-term safety needs to be promoted and communicated through a more broadly
based ‘safety case’ [48]. The safety case puts the findings of the safety assessment into a broader
context with other factors and considerations that are relevant to the decision making process and are
important for the stakeholders involved.
Given that the focus of the current document is the safety assessment rather than the broader based
safety case, the emphasis of this sub-section is on measures that have been taken to building
confidence in the safety assessment and its results. Confidence in the safety assessment should be
established at two levels [48]. The first level involves establishing confidence within each stage of the
safety assessment process (i.e. assessment context, system description, development and justification
of scenarios, formulation and implementation of models, analysis of the results, and review,
modification and subsequent iterations). The second level involves gaining an overall confidence,
84
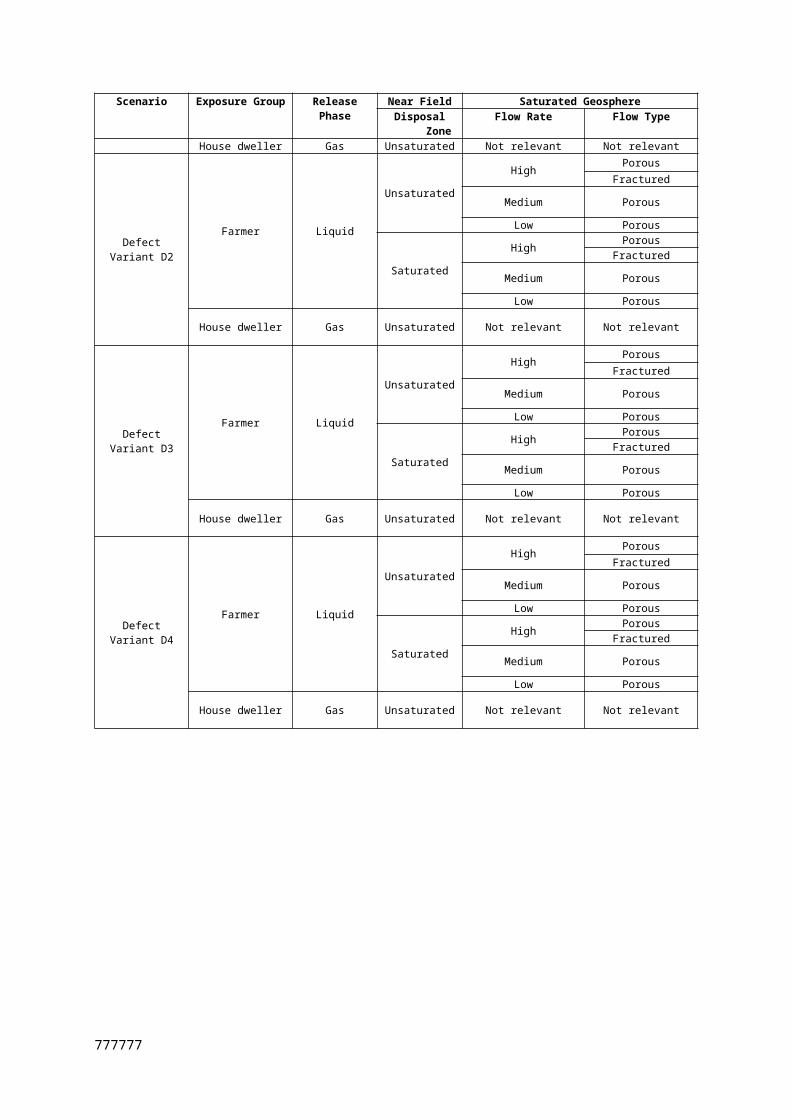
which involves gaining confidence in the overall safety assessment methodology, safety assessment
approach and the safety assessment findings through the use of a range of techniques [48]. The
measures undertaken within the current assessment to building confidence at these two stages are
summarized in Tables 28 and 29.
858585
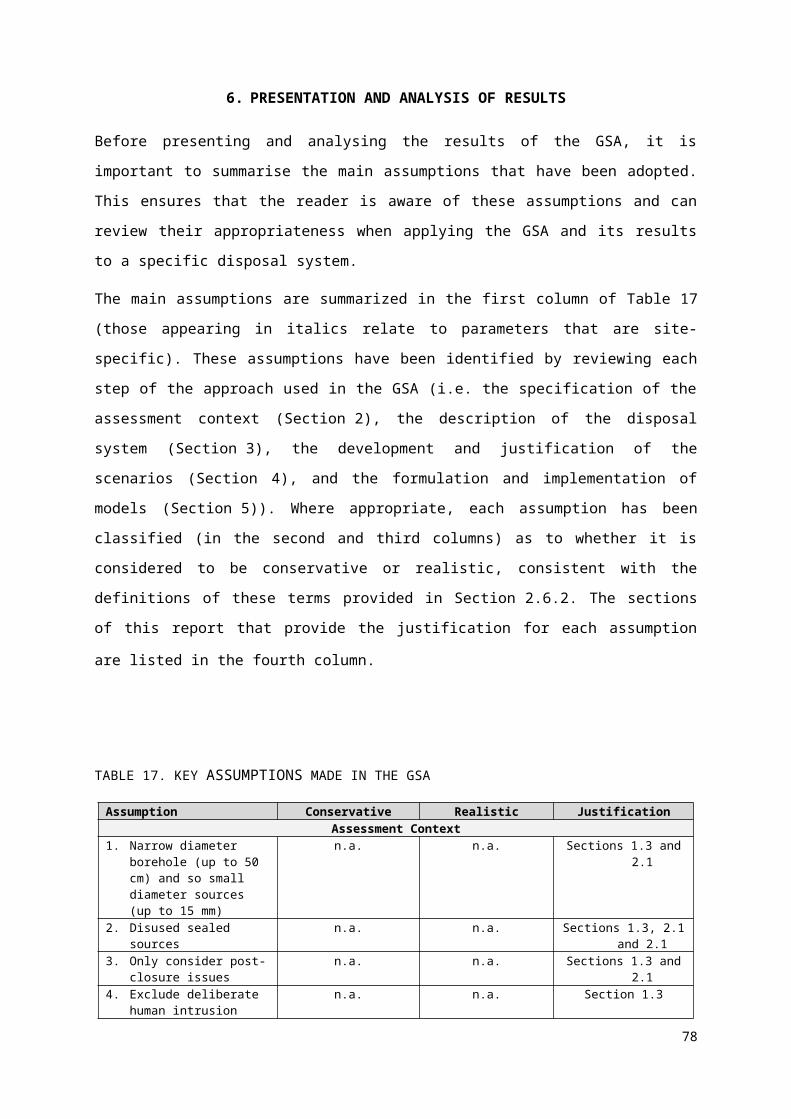
TABLE 28. MEASURES TAKEN TO BUILD CONFIDENCE IN EACH STAGE OF THE SAFETY ASSESSMENT
Stage of the Assessment Confidence Building Measures taken in the GSASpecification of assessment context
The assessment context for the GSA of the borehole disposal concept is explained and justified in detail in Section 2. Each of the components of the context (purpose and scope, regulatory framework, end points, philosophy, and timeframes) is discussed in turn.
Description of the system The GSA is site generic (rather than site specific) and a wide range of differing disposal systems have been considered and are documented in Section 3. Different engineered barriers (cement grout, stainless steel, HDPE) and geospheres (unsaturated, saturated, low flow, medium flow, high flow, porous and
fractured) are considered. The approach used is consistent with that used in a previous IAEA study to derive generic activity levels [22] and a previous generic safety assessment of a
borehole disposal concept [36]. Representative information has been taken from a range of relevant sources documented in Section 3 and Appendix XII.
Development and justification of scenarios
A set of five scenarios has been developed and justified in Section 4. It is considered to be a credible and comprehensive set and to have been developed in a systematic, transparent and traceable manner using an international
panel of experts with differing fields of expertise. The approach and screening criteria used to exclude or include scenarios has been justified and documented.
Formulation and implementation of models
The development of conceptual models, consistent with the assessment context, the disposal systems and with the scenarios to be investigated, has been undertaken in a systematic manner consistent with best international practice (Section 5).
The mathematical models used are consistent with those used in previous assessments such as IAEA [9, 22, 36] and data are derived from a wide range of published and internationally recognized references.
The software tool in which the mathematical models are encoded (AMBER) has been used in a variety of assessments (see for example Refs [9, 22, 36, 49, 50]). The verification of the time dependent solution method used by AMBER solution is discussed in Ref. [45]. The implementation of the models in the software has been audited.
Consideration has been given to the use of alternative conceptual models and data.Analysis of the results The results obtained for the wide range of disposal systems and scenarios have been presented in Sections 3 and 4 and compared against the relevant
regulatory criteria. Both reference, variant and what-if calculations have been considered. Consideration has been given in Section 6.4 to the various sources of uncertainty (scenario, model and data/parameter).
Review, modification and subsequent iterations
Drafts of the GSA were peer reviewed at an IAEA technical meetings in 2004, 2005 and 2007 and revisions incorporated into the current version.
86
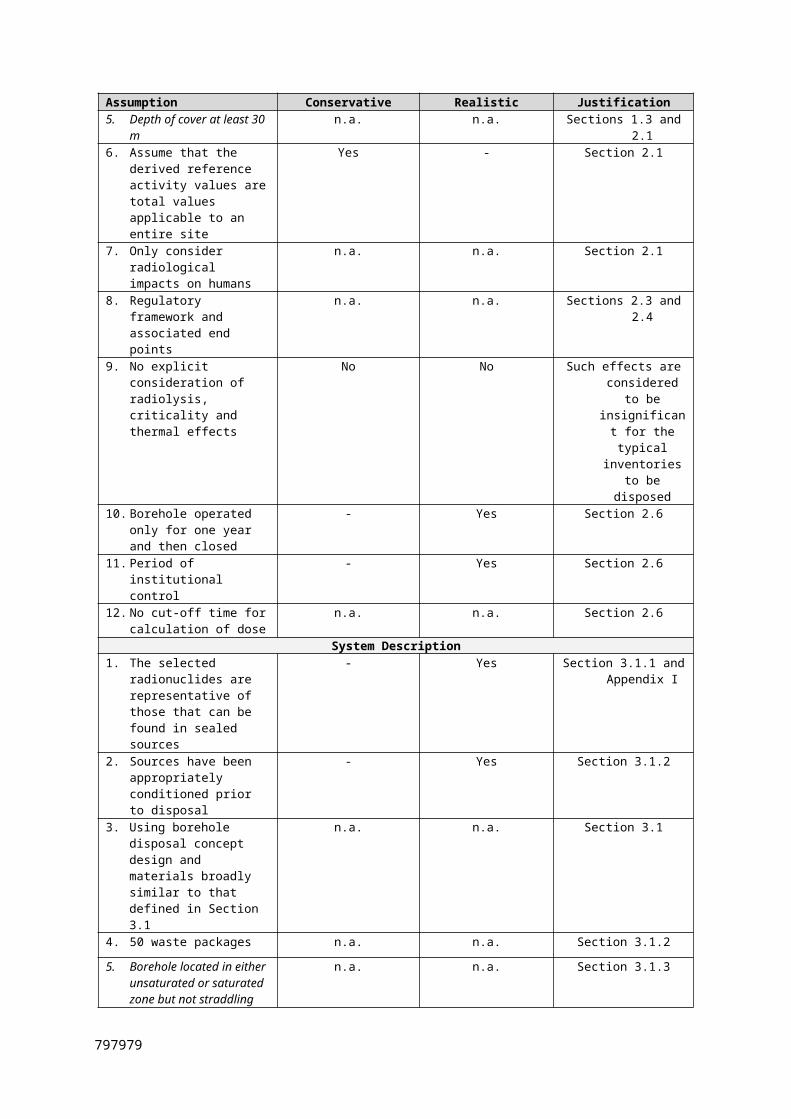
TABLE 29. MEASURES TAKEN TO BUILD CONFIDENCE IN THE OVERALL SAFETY ASSESSMENT
Confidence Building Measures
Application to the GSA
Use of a systematic approach
An approach based upon the internationally recognized ISAM Safety Assessment Approach [8, 9] has been used. The approach allows the GSA and its associated assumptions to be documented in a clear manner.
Peer review The GSA was peer reviewed at IAEA technical meetings in 2004, 2005 and 2007.
Quality assurance The assessment has been carried out under Quintessa’s Quality Management System, which is compliant with the ISO 9001:2000 standard [51].
Verification, calibration and, if possible, validation of models
The verification of the time dependent solution method used by AMBER solution is discussed in Ref. [45]. Due to the generic nature of the GSA and its long timescales, validation of the models is not considered to be possible.
Consideration of relevant analogues
No consideration has been given to this issue in the GSA.
Involvement of stakeholders IAEA staff and participants from three Member States have been involved in the development of the approach followed and the identification and justification of the scenarios for assessment. Participants from a wider range of Member States were involved in the review meetings 2004, 2005 and 2007.
Consideration and treatment of uncertainties
This is discussed in Section 6.4.
Presentation of the assessment and its results
The results are presented in Sections 6.1, 6.2 and 6.3. The other components of the assessment are discussed in Sections 2 to 5 and the supporting appendices.
878787
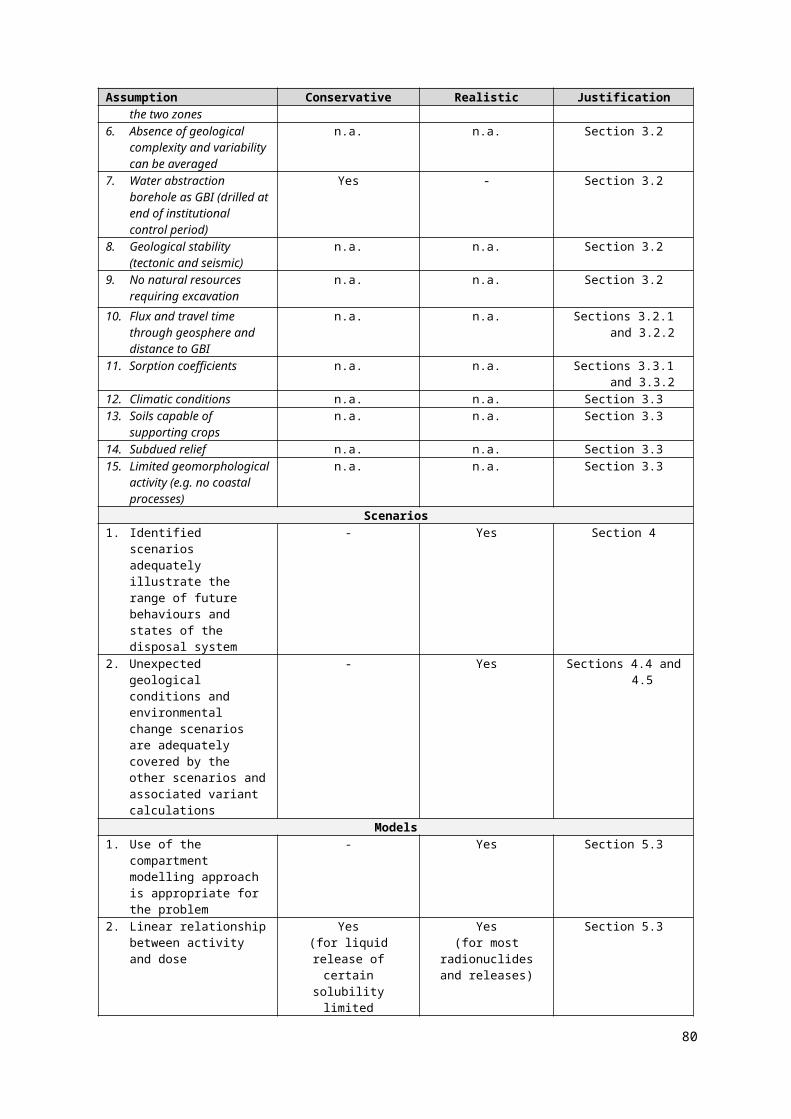
7. CONCLUSIONS
This report presents a GSA for a concept that would allow the disposal of disused sealed radioactive
sources in narrow diameter boreholes. The GSA takes a design concept and, imagining it to be placed
in a range of geological environments, assesses the question of post-closure safety for a variety of
representative radionuclides.
The outcome of the GSA shows that, with a suitable combination of inventory, near-field design and
geological environment, the borehole disposal concept is capable of providing a safe solution for the
disposal of both long-lived and short-lived radionuclides. For most radionuclides, including longer-
lived radionuclides such as Ra-226, post-closure safety places no limit on the radionuclide inventory
that could be disposed of in this way. Even for radionuclides with exceedingly long daughters (with
half-lives in excess of 100 000 years), such as Pu-238, Pu-239 and Am-241, the concept has the
potential to dispose around 1 TBq in a single borehole.
The GSA examines a series of reference geological environments. These are characterized by their
geochemistry and hydrogeology. For each reference environment, the GSA derives corresponding
reference activity levels of radionuclides that could, in terms of a post-closure safety, be disposed of
safely. The reference inventory that is assessed in detail is limited to 11 radionuclides. However, it is
considered that the borehole disposal concept is suitable for the disposal of other radionuclides of
similar half-lives, mobility and radiotoxicity as demonstrated by the scoping calculations presented in
Appendix I.
It is expected that in cases where the inventory to be disposed of falls below the GSA reference
activity levels and the proposed geological environment can be shown to be at least as favourable as
one of the GSA reference environments, then the site-specific safety assessment could be limited to a
simple confirmation of these facts.
The GSA does not consider operational and pre-operational safety. Consequently, Whilst large
quantities of some radionuclides could, in principle, be disposed of using the borehole concept, the
practical difficulties associated with handling large inventory sources could make it necessary to
dispose of the source along with its shielding so that disposal in larger diameter boreholes might be
more appropriate.
88
REFERENCES
[1] INTERNATIONAL ATOMIC ENERGY AGENCY, IAEA Safety Glossary: Terminology Used
in Nuclear Safety and Radiological Protection, 2007 Edition, IAEA, Vienna (2007).
[2] INTERNATIONAL ATOMIC ENERGY AGENCY, Categorization of Radioactive Sources
(Revision of IAEA-TECDOC-1191), IAEA-TECDOC-1344, IAEA, Vienna (2003).
[3] INTERNATIONAL ATOMIC ENERGY AGENCY, Management for the Prevention of
Accidents from Disused Sealed Sources, IAEA-TECDOC-1205, IAEA, Vienna (2001).
[4] INTERNATIONAL ATOMIC ENERGY AGENCY, Disposal Options for Disused Radioactive
Sources, IAEA Technical Reports Series No. 436, IAEA, Vienna (2005).
[5] INTERNATIONAL COMMISSION ON RADIOLOGICAL PROTECTION, Radiation
Protection Recommendations as Applied to the Disposal of Long-lived Solid Radioactive
Waste, International Commission on Radiological Protection, ICRP Publication 81, Pergamon
Press, Oxford (2000).
[6] SOUTH AFRICAN NUCLEAR ENERGY CORPORATION, Design for the Borehole Disposal
Concept, Report GEA 1623, NECSA, Pretoria (2003).
[7] INTERNATIONAL ATOMIC ENERGY AGENCY, Socio-economic and Other Non-
radiological Impacts of the Near Surface Disposal of Radioactive Waste, IAEA-TECDOC-
1308, IAEA, Vienna (2002).
[8] INTERNATIONAL ATOMIC ENERGY AGENCY, Safety Assessment Methodologies for
Near Surface Disposal Facilities, Volume I: Review and Enhancement of Safety Assessment
Approaches and Tools, IAEA-ISAM-1, IAEA, Vienna (2004).
[9] INTERNATIONAL ATOMIC ENERGY AGENCY, Safety Assessment Methodologies for
Near Surface Disposal Facilities, Volume II: Test Cases, IAEA-ISAM-2, IAEA, Vienna (2004).
[10] NATIONAL NUCLEAR REGULATOR, Licensing Guide: The Borehole Disposal Facility
Safety Case, NNR report, Revision 0, NNR, Centurion (2002).
[11] INTERNATIONAL ATOMIC ENERGY AGENCY, Borehole Disposal Facilities for
Radioactive Waste, IAEA Safety Series No. SSG-1, IAEA, Vienna (2009).
[12] FOOD AND AGRICULTURE ORGANIZATION OF THE UNITED NATIONS,
INTERNATIONAL ATOMIC ENERGY AGENCY, INTERNATIONAL LABOUR
90
ORGANISATION, OECD NUCLEAR ENERGY AGENCY, PAN AMERICAN HEALTH
ORGANIZATION, WORLD HEALTH ORGANIZATION, International Basic Safety
Standards for Protection Against Ionising Radiation and for the Safety of Radiation Sources,
IAEA Safety Series No. 115, IAEA, Vienna (1996).
[13] INTERNATIONAL ATOMIC ENERGY AGENCY, “Reference Biospheres” for Solid
Radioactive Waste Disposal (BIOMASS Programme), (IAEA-BIOMASS-6), IAEA, Vienna
(2003).
[14] PRÖHL, G., et al., Biosphere Models for Safety Assessment of Radioactive Waste Disposal,
GSF-Bericht 06/04, National Research Centre for Environment and Health, Neuherberg (2004).
[15] INTERNATIONAL COMMISSION ON RADIOLOGICAL PROTECTION, 1990
Recommendations of the International Commission on Radiological Protection, ICRP
Publication 60, Pergamon Press, Oxford (1991).
[16] INTERNATIONAL COMMISSION ON RADIOLOGICAL PROTECTION, A Framework for
Assessing the Impact of Ionising Radiation on Non-human Species, ICRP Publication 91,
Pergamon Press, Oxford (2003).
[17] INTERNATIONAL ATOMIC ENERGY AGENCY, Protection of the Environment from
Ionising Radiation: The Development and Application of a System of Radiation Protection for
the Environment, Proceedings of the Third International Symposium on the Protection of the
Environment from Ionising Radiation (SPEIR 3), IAEA-CSP-17, IAEA, Vienna (2003).
[18] FASSET, Framework for Assessment of Environmental Impact, Final Report produced under
European Commission Contract FIGE-CT-2000-00102, available from http://www.fasset.org/
(2004).
[19] INTERNATIONAL ATOMIC ENERGY AGENCY, Application of Safety Assessment
Methodologies for Near Surface Disposal Facilities (ASAM), Common Application Aspects
Working Group, Position Paper on the Roles of Conservatism and Realism, ASAM Position
Paper, IAEA, Vienna (2006).
[20] INTERNATIONAL ATOMIC ENERGY AGENCY, Safety Assessment for Near Surface
Disposal of Radioactive Waste, IAEA Safety Standards Series No. WS-G-1.1, IAEA, Vienna
(1999).
[21] INTERNATIONAL ATOMIC ENERGY AGENCY, Report on Radioactive Waste Disposal,
IAEA Technical Reports Series No. 349, IAEA, Vienna (1993).
919191
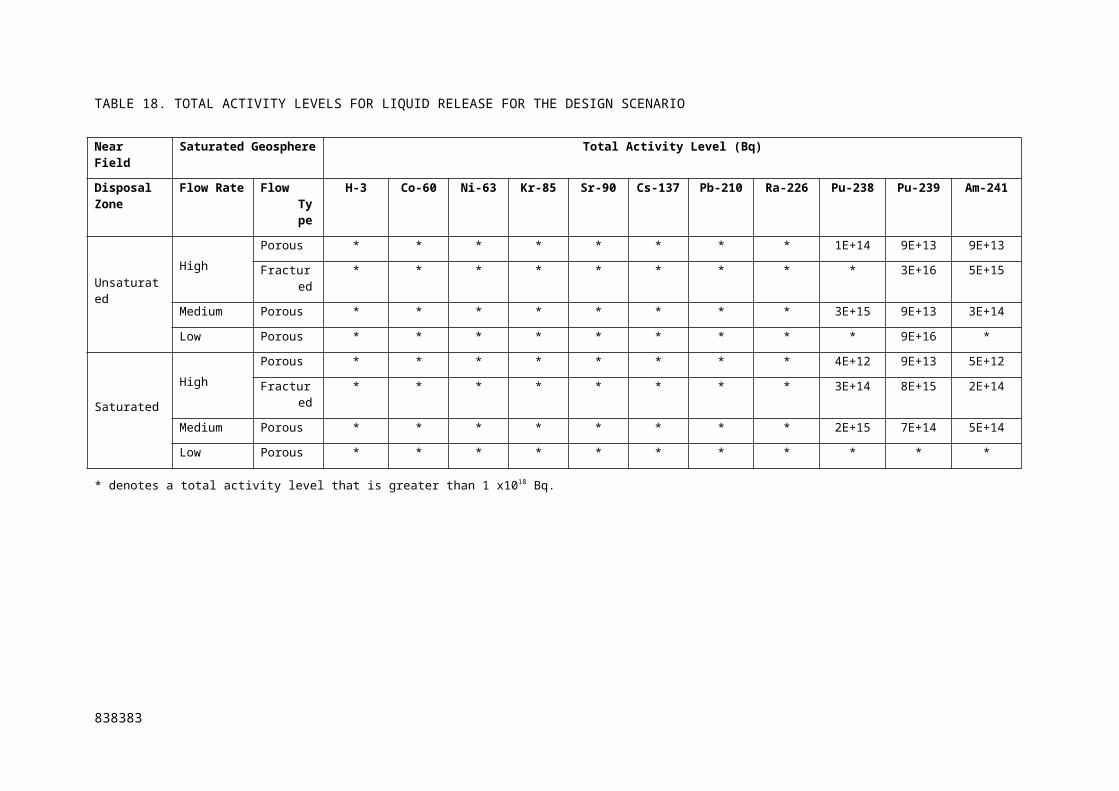
[22] INTERNATIONAL ATOMIC ENERGY AGENCY, The Use of Safety Assessment in the
Derivation of Activity Limits for Disposal of Radioactive Waste to Near Surface Facilities,
IAEA-TECDOC-1380, IAEA, Vienna (2003).
[23] INTERNATIONAL ATOMIC ENERGY AGENCY, Identification of Radioactive Sources and
Devices, IAEA Nuclear Security Series No. 5, IAEA, Vienna (2007).
[24] INTERNATIONAL ATOMIC ENERGY AGENCY, Net Enabled Waste Management Database
(NEWMDB), http://www-newmdb.iaea.org/, IAEA, Vienna. Accessed January 2008.
[25] VAN BLERK, J.J., Analysis of a Post Closure Safety Assessment Methodology for Radioactive
Waste Disposal Systems in South Africa, Ph.D. Thesis, Faculty of Natural Science, Department
of Geohydrology, University of the Free State, Bloemfontein (2000).
[26] NEL, B.v.d.L., Design for the Borehole Disposal Concept, NECSA Report No. GEA 1623,
South African Nuclear Energy Corporation, Pretoria (2004).
[27] INTERNATIONAL ATOMIC ENERGY AGENCY, Siting of Near Surface Disposal Facilities,
IAEA Safety Series No. 111-G-3.1, IAEA, Vienna (1994).
[28] INTERNATIONAL ATOMIC ENERGY AGENCY, Siting of Geological Disposal Facilities,
IAEA Safety Series No. 111-G-4.1, IAEA, Vienna (1994).
[29] NUCLEAR INDUSTRY RADIOACTIVE WASTE EXECUTIVE, Generic Repository Studies:
Generic Post-closure Performance Assessment, Nirex Report N/080, UK Nirex Limited,
Harwell (2003).
[30] LOONEY, B.B., GRANT, M.W., KING, C.M., Estimation of Geochemical Parameters for
Assessing Subsurface Transport at the Savannah River Plant, Savannah River Laboratory
Report DPST-85-904 (1987).
[31] NEUMAN, S.P., Universal Scaling of Hydraulic Conductivities and Dispersivities in
Geological Media, Water Resources Research, Vol. 26, No. 8, pp. 1749-1758 (1990).
[32] KOERNER, R.M., HSUAN, Y.G., AND KOERNER, G.R., Geomembrane Lifetime Prediction:
Unexposed and Exposed Conditions. Geosynthetic Institute, GRI White Paper No. 6,
http://www.geosynthetic-institute.org/papers/paper6.pdf (2005).
92
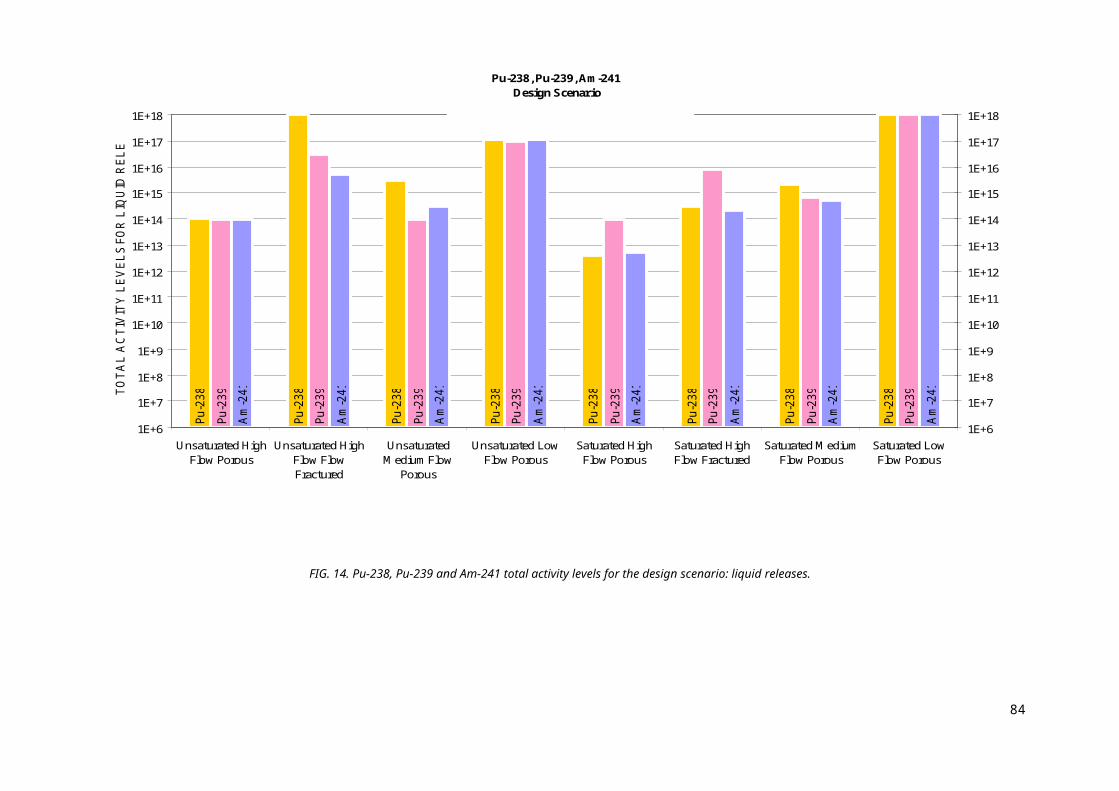
[33] WIENHOLD, P., CHUDNOVSKY, A., Lifetime of High-Density Polyethylene Drain Pipe in an
Aggressive Environment. Transportation Research Board Annual Meeting 2006 Paper #06-
2377, http://pubsindex.trb.org/document/view/default.asp?lbid=777424 (2006).
[34] DOUBT, G., Assessing reliability and useful life of containers for disposal of irradiated fuel
waste. Atomic Energy of Canada Limited Report, AECL-8328 (1984).
[35] LITTLE, R.H., VAN BLERK, J.J., WALKE, R.C., BOWDEN, R.A., Generic Post-Closure
Safety Assessment and Derivation of Activity Limits for the Borehole Disposal Concept,
Quintessa Report QRS-1128A-6 v2.0, Quintessa Limited, Henley-on-Thames (2004).
[36] BRITISH STANDARD INSTITUTE, Code of Practice for Site Investigations, BS 5930:1999
(1999).
[37] BERNER, U., Evolution of porewater chemistry during degradation of cement in a radioactive
waste repository environment, Waste Management, 12, 201-219 (1992).
[38] BERNER, U., Status of Cement Modelling: Future investigations in the view of
cement/bentonite interactions, (Metcalfe, R., Walker, C., Eds) (Proc. Int. Workshop Tokyo,
2004), NUMO report TR-04-05, Tokyo (2004).
[39] ENVIROS AND QUINTESSA, AMBER 5.0 Reference Guide, Enviros Consulting Limited,
Culham, and Quintessa, Henley-on-Thames (2006).
[40] BRITISH NUCLEAR FUELS LIMITED, Drigg Post-Closure Safety Case, British Nuclear
Fuels plc, Sellafield (2002).
[41] BYRNE, G.D., HINDMARSH A.C., A Polyalgorithm for the Numerical Solution of Ordinary
Differential Equations, ACM Transactions on Mathematical Software, Vol. 1, No. 1, (place)
(1975) pp. 71-96.
[42] ROBINSON, P.C., DYLAN Time-stepping Algorithms: The Approach Used in the DYLAN
Solver, Quintessa Report QSR-DYLAN-1, Quintessa Limited, Henley-on-Thames (2001).
[43] ROBINSON, P.C., PENFOLD, J.S.S., LITTLE, R.H., WALKE, R.C., AMBER 5 Verification:
Summary, Quintessa Report QSR-3001B-1, Quintessa Limited, Henley-on-Thames (2006).
[44] OECD NUCLEAR ENERGY AGENCY, Stakeholder Participation in Radiological Decision
Making: Processes and Implications: Summary Report of the 3rd Villigen (Switzerland)
939393
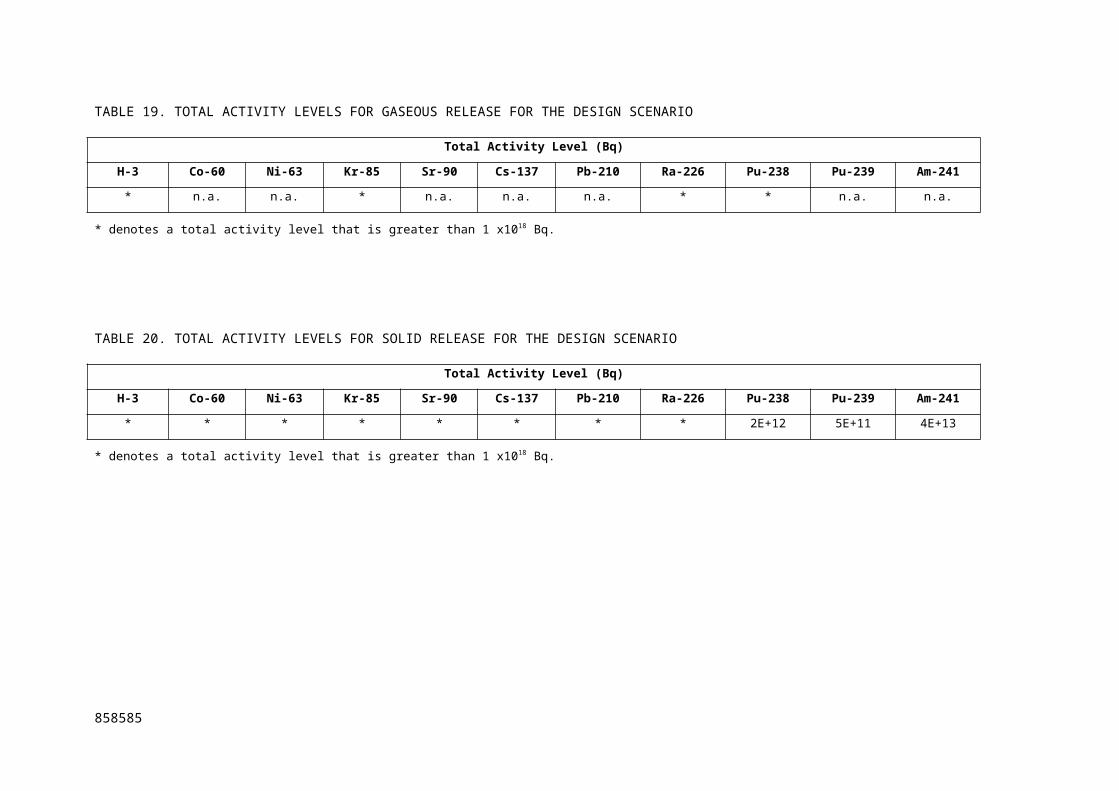
Workshop, October 2003, Organization for Economic Co-operation and Development – Nuclear
Energy Agency, Paris (2004).
[45] OECD NUCLEAR ENERGY AGENCY, Learning and Adapting to Societal Requirements for
Radioactive Waste Management, Organization for Economic Co-operation and Development –
Nuclear Energy Agency, Paris (2004).
[46] INTERNATIONAL ATOMIC ENERGY AGENCY, Safety Case and Confidence Building for
Radioactive Waste Disposal Facilities, Draft document for discussion from the ASAM
Regulatory Review Working Group, IAEA, Vienna (2003).
[47] MAUL, P.R., ROBINSON, P.C., Exploration of Important Issues for the Safety of SFR 1 using
Performance Assessment Calculations, Swedish Nuclear Power Inspectorate Report 02:62,
Stockholm (2002).
[48] PENFOLD J.S.S., LITTLE R.H., BOWDEN R.A., EGAN M.J., Preliminary Safety Assessment
of Concepts for a Permanent Waste Repository at the Western Waste Management Facility
Bruce Site, Quintessa Report QRS-1027B-1 v1.0, Henley-on-Thames (2003).
[49] INTERNATIONAL ORGANIZATION FOR STANDARDIZATION, Quality Management
Systems – Requirements, ISO 9001:2000, ISO, Geneva (2000).
94
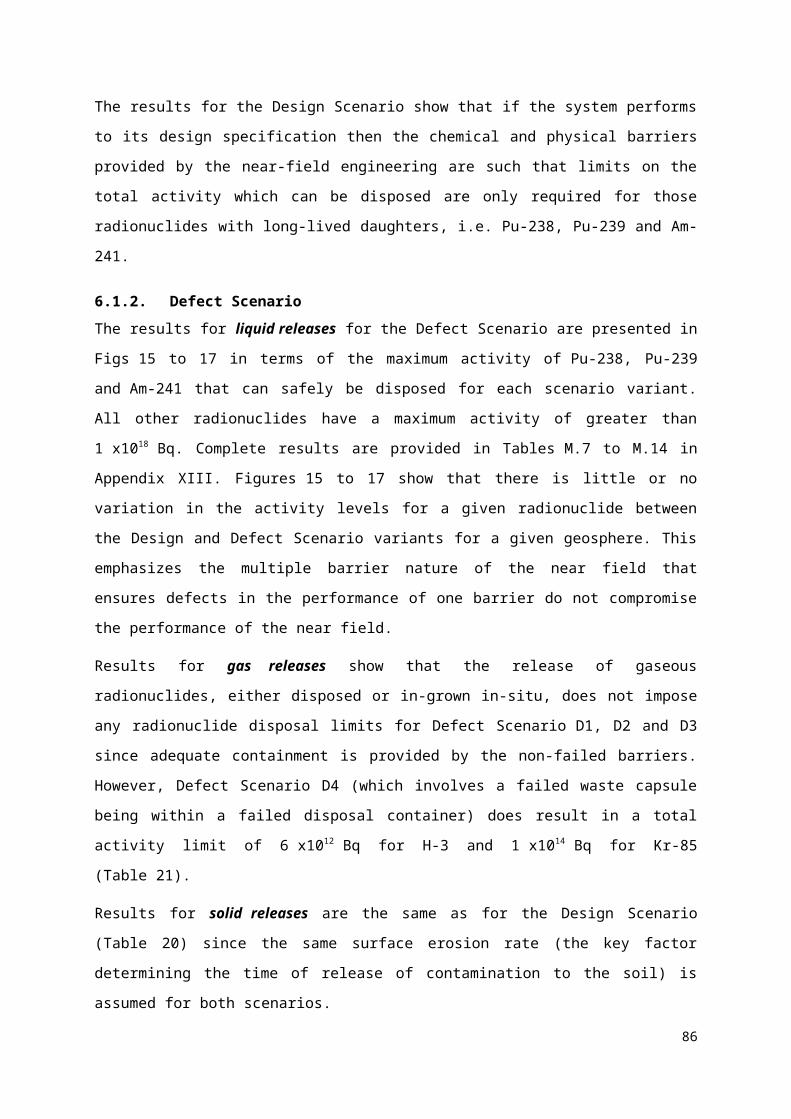
Appendix IRADIONUCLIDE SCREENING
A total of total 31 radionuclides have been identified for consideration in the GSA (see Section 3.1.1).
The maximum inventory found across all the countries considered is given in Table 30, which also
provides the half-life for each radionuclide. It is assumed for the purposes of the screening calculations
that the total inventory is distributed evenly over the 50 capsules disposed in the borehole.
For reasons of practicality, it is desirable to screen out any radionuclides that, due to their half-life,
maximum activity, or radiotoxicity, will not result in significant post-closure impacts. For the purposes
of radionuclide screening, the dose constraint of 0.3 mSv y-1 is considered (Section 2.3).
Institutional control periods are often taken into consideration such that there is a period within which
exposures are assumed not to occur. For the GSA an institutional control period of 30 years has been
assumed (Section 2.6), within which exposures are considered not to occur.
Radionuclide screening has been undertaken in two simple steps:
Preliminary screening – doses associated with direct exposure via ingestion, inhalation and
external irradiation to a single disused source following a 30 year institutional control period
are calculated; and
Main screening – for those radionuclides remaining after Step 1, a simple assessment of doses
associated with the groundwater and gas pathways is undertaken.
I.1 PRELIMINARY SCREENING
The preliminary screening calculation assumes that a human is directly exposed to a single sealed
source following the end of the institutional control period. Exposure through ingestion, inhalation and
external irradiation is considered. For the inhalation pathway, Kr-85 exposure is via inhalation of the
gas, for all other radionuclides exposure is due to inhalation of particulate material. The resulting
doses are given in Table 31 [52–55].
96

TABLE 30. RADIONUCLIDES CONSIDEREDIN THE SCREENING CALCULATIONS
979797
Radionuclide Maximum inventory (Bq)
Half life(y)
H-3 2.8E+14 1.24E+01
Na-22 3.4E+06 2.60E+00
Mn-54 1.0E+05 8.56E-01
Fe-55 9.9E+09 2.70E+00
Co-57 1.7E+10 7.42E-01
Co-60 2.9E+15 5.27E+00
Ni-63 2.1E+10 9.60E+01
Zn-65 3.7E+05 6.68E-01
Se-75 3.0E+11 3.28E-01
Kr-85 6.3E+11 1.07E+01
Y-88 1.0E+05 2.92E-01
Sr-90 5.3E+11 2.91E+01
Cd-109 3.1E+09 1.27E+00
Ba-133 3.3E+08 1.07E+01
Cs-137 7.5E+14 3.00E+01
Pm-147 2.7E+11 2.62E+00
Sm-151 7.8E+09 9.00E+01
Eu-152 4.0E+08 1.33E+01
Gd-153 1.5E+11 6.63E-01
Yb-169 2.2E+11 8.76E-02
Ir-192 9.3E+14 2.03E-01
Au-195 4.0E+07 5.01E-01
Hg-203 1.5E+06 1.28E-01
Tl-204 5.0E+08 3.78E+00
Pb-210 1.0E+07 2.23E+01
Po-210 1.0E+10 3.79E-01
Ra-226 2.6E+13 1.60E+03
Pu-238 2.0E+10 8.77E+01
Pu-239 6.7E+11 2.41E+04
Am-241 1.2E+13 4.32E+02
Cf-252 4.1E+09 2.64E+00
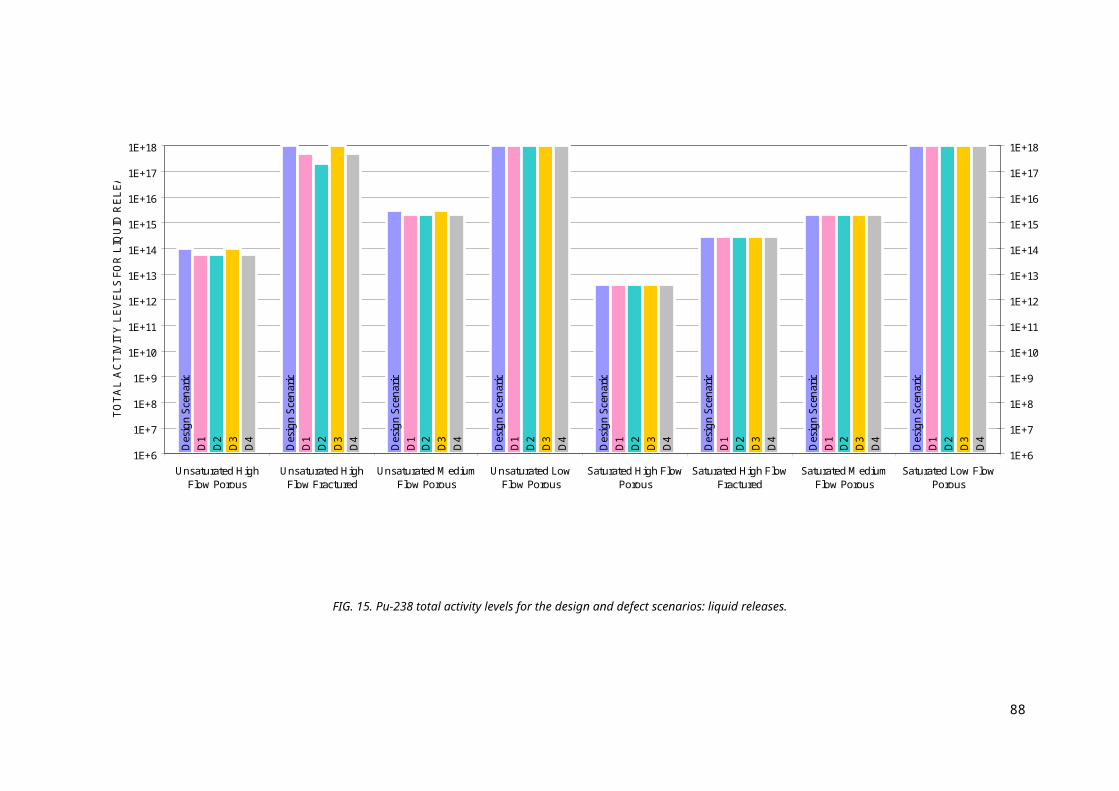
TABLE 31. PRELIMINARY SCREENING - DOSES ASSOCIATED WITH DIRECT EXPOSURE TO A
SEALED SOURCE
RadionuclideMaximum inventory
at 30 y (Bq)
Dose Coefficientsa
IngestionDose (Sv)
InhalationDose (Sv)
ExternalDose (Sv)fIngestion
(Sv/Bq)b
Inhalation (Sv/Bq)b, c
External (Sv/y per
Bq)e
H-3 1.0E+12 1.8E-11 4.5E-11 0.0E+00 1.9E+01 4.7E+01 0.0E+00
Na-22 2.3E+01 3.2E-09 1.3E-09 3.5E-17 7.3E-08 3.0E-08 8.0E-15
Mn-54 5.6E-08 7.1E-10 1.5E-09 1.3E-17 4.0E-17 8.5E-17 7.5E-24
Fe-55 9.0E+04 3.3E-10 7.7E-10 3.4E-19 3.0E-05 6.9E-05 3.0E-13
Co-57 2.3E-04 2.1E-10 5.5E-10 1.9E-18 4.8E-14 1.3E-13 4.4E-21
Co-60 1.1E+12 3.4E-09 1.0E-08 3.5E-13 3.8E+03 1.1E+04 3.9E+00
Ni-63 3.4E+08 1.5E-10 4.8E-10 0.0E+00 5.1E-02 1.6E-01 0.0E+00
Zn-65 2.2E-10 3.9E-09 1.6E-09 9.3E-18 8.7E-19 3.6E-19 2.1E-26
Se-75 1.8E-18 2.6E-09 1.0E-09 6.2E-18 4.6E-27 1.8E-27 1.1E-34
Kr-85 1.8E+09 0.0E+00 9.2E-13d 0.0E+00 0.0E+00 1.7E-03 0.0E+00
Y-88 2.4E-28 1.3E-09 4.4E-09 4.3E-17 3.1E-37 1.0E-36 1.0E-43
Sr-90 5.2E+09 3.1E-08 3.8E-08 2.8E-16 1.6E+02 2.0E+02 1.5E-05
Cd-109 4.8E+00 2.0E-09 8.1E-09 5.1E-20 9.6E-09 3.9E-08 2.4E-18
Ba-133 9.5E+05 1.5E-09 3.1E-09 5.8E-18 1.4E-03 2.9E-03 5.5E-11
Cs-137 7.5E+12 1.3E-08 3.7E-08 7.8E-14 9.8E+04 2.8E+05 5.9E+00
Pm-147 1.9E+06 2.6E-10 5.0E-09 5.5E-23 5.0E-04 9.6E-03 1.1E-15
Sm-151 1.2E+08 9.8E-11 4.0E-09 4.5E-18 1.2E-02 5.0E-01 5.6E-09
98
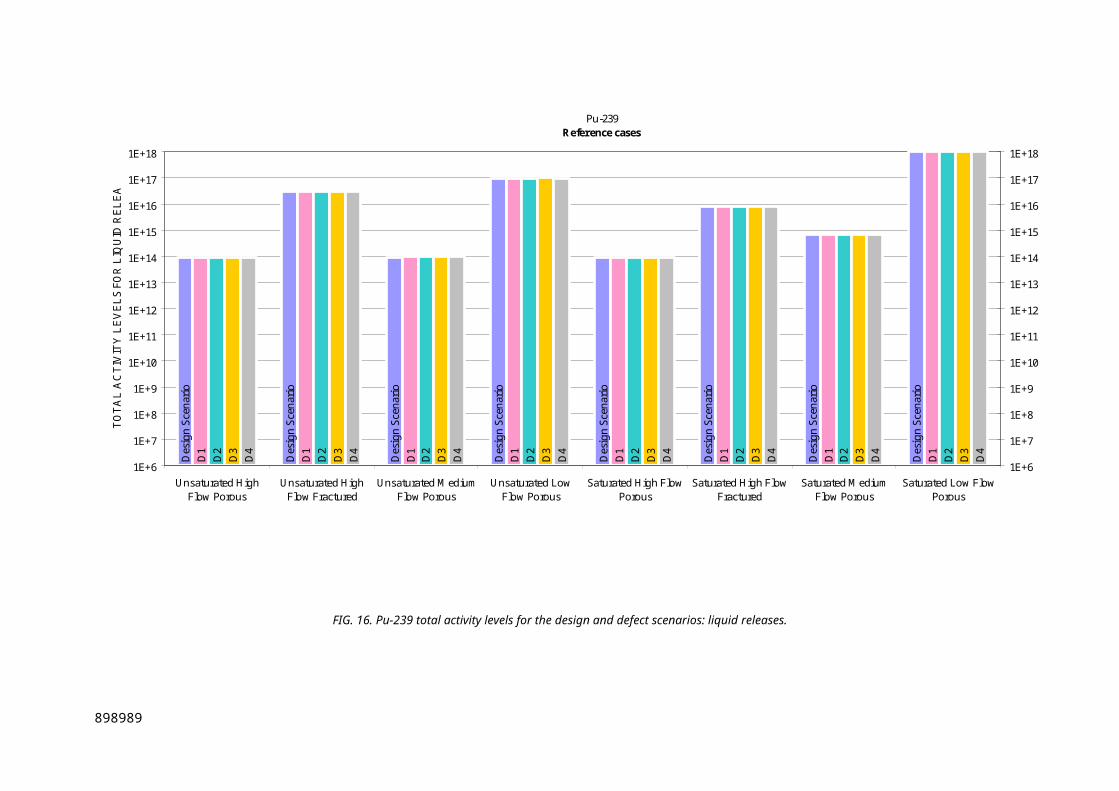
Eu-152 1.7E+06 1.4E-09 4.2E-08 1.6E-13 2.3E-03 7.0E-02 2.7E-06
Gd-153 7.2E-05 2.7E-10 2.1E-09 8.4E-19 1.9E-14 1.5E-13 6.0E-22
Yb-169 3.6E-94 7.1E-10 3.0E-09 4.5E-18 2.5E-103 1.1E-102 1.6E-110
Ir-192 6.1E-32 1.4E-09 6.6E-09 1.3E-17 8.5E-41 4.0E-40 7.9E-48
Au-195 7.5E-13 2.5E-10 1.7E-09 1.3E-18 1.9E-22 1.3E-21 9.5E-30
Hg-203 8.4E-67 1.9E-09 2.4E-09 3.8E-18 1.6E-75 2.0E-75 3.2E-83
Tl-204 4.1E+04 1.2E-09 3.9E-10 1.7E-20 4.9E-05 1.6E-05 6.8E-15
Pb-210 7.9E+04 6.9E-07 1.2E-06 5.4E-17 5.4E-02 9.4E-02 4.3E-11
Po-210 3.0E-16 1.2E-06 3.3E-06 1.2E-18 3.6E-22 9.8E-22 3.6E-33
Ra-226 5.1E+11 2.8E-07 3.5E-06 2.4E-13 1.4E+05 1.8E+06 1.2E+00
Pu-238 3.2E+08 2.3E-07 4.6E-05 1.0E-18 7.3E+01 1.5E+04 3.2E-09
Pu-239 1.3E+10 2.5E-07 5.0E-05 7.0E-18 3.3E+03 6.7E+05 9.4E-07
Am-241 2.3E+11 2.0E-07 4.2E-05 3.0E-15 4.6E+04 9.6E+06 6.9E-03
Cf-252 3.1E+04 9.0E-08 2.0E-05 9.8E-17 2.8E-03 6.2E-1 3.0E-11
999999

Notes: a Short-lived daughters with a half life of less than 25 days are assumed to be in secular equilibrium with their
parent and included in the parent’s dose coefficient. A list of short-lived daughters is given in Table 32.
b Data taken from Ref. [52] for adults.
c Data taken from Ref. [52] for adults, adopting the recommended default absorption class, where no
recommendation is made, then the most conservative (highest) dose coefficient is adopted from the range of
absorption classes reported.
d Dose factor for point source calculated by multiplying mean gamma energy in MeV by 1.4E-13 Sv/y per
Bq/MeV [53]. Emissions data are taken from Refs [54, 55]. Photons with individual energies below 50 keV have not
been included because the equation used to calculate the dose coefficient from a point source substantially over-
estimates the dose rate below this value, and the contribution to effective dose equivalent, given the existence of other
exposure pathways, would in any event be very small.
e Units are Sv/h per Bq/m3.
f Dose calculated assuming inventory to be in 1 m3 of air and exposure duration of 1 hour.
References for Table 31
[52] INTERNATIONAL COMMISSION ON RADIOLOGICAL PROTECTION, Age-dependent
doses to members of the public from intake of radionuclides: Part 5. Compilation of ingestion
and inhalation dose coefficients. Annals of the ICRP 26(1), ICRP Publication 72, Pergamon
Press. Oxford (1996).
[53] SMITH, G.M., FEARN, H.S., SMITH, K.R., DAVIS, J.P., KLOS, R., Assessment of the
radiological impact of disposal of solid radioactive waste at Drigg, National Radiological
Protection Board, NRPB-M148, Chilton (1988).
[54] INTERNATIONAL COMMISSION ON RADIOLOGICAL PROTECTION, Radionuclide
Transformations Energy and Intensity of Emissions. International Commission on Radiological
Protection, ICRP Publication 38, Oxford (1983).
[55] BROWNE, R.B., FIRESTONE, V.S., Table of the Radioactive Isotopes, New York, NY
(1988).
100
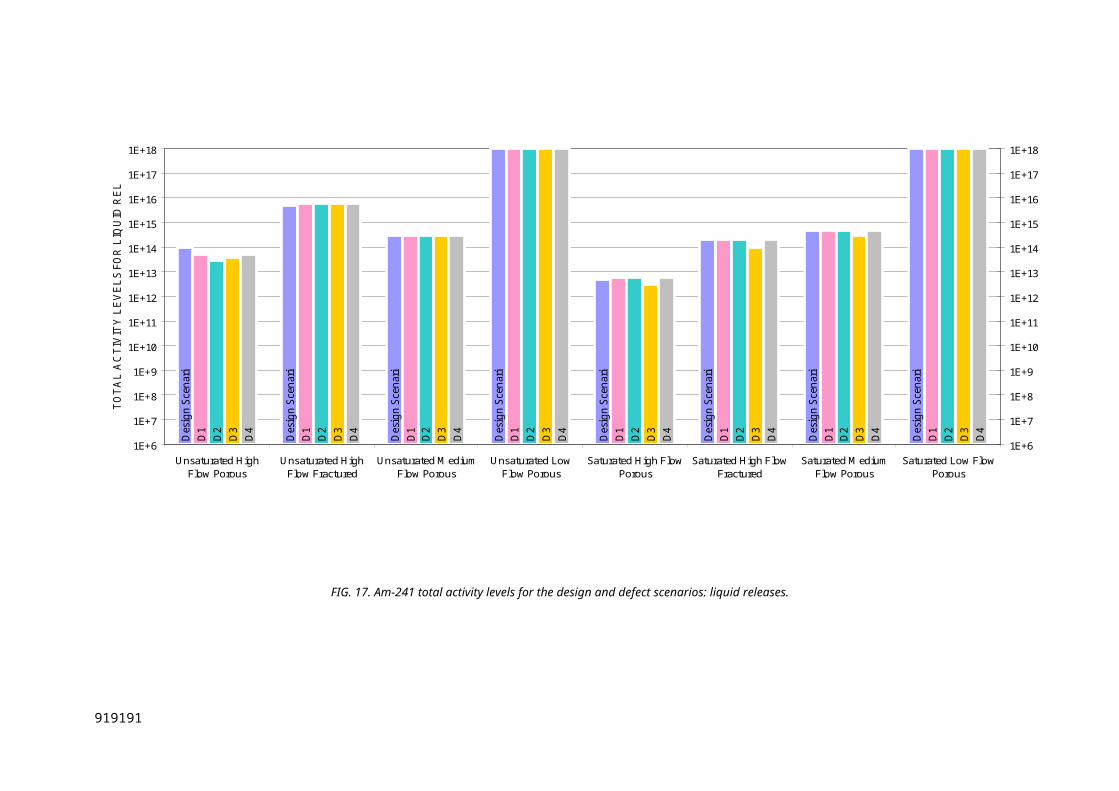
The following radionuclides give a dose of less than 0.3 mSv y -1 following direct exposure to the
sealed source for all three potential exposure pathways: Na-22, Mn-54, Fe-55, Co-57, Zn-65, Se-75,
Y-88, Cd-109, Gd-153, Yb-169, Ir-192, Au-195, Hg-203, Tl-204 and Po-210. These radionuclides are
therefore screened out.
I.2 MAIN SCREENING
A simple exposure model has been developed for the groundwater and gas pathways using the
AMBER code (as applied within the main GSA calculations – see Section 5.4). The model uses the
reduced decay chains described in Table 33, and the dose coefficients given in Table 34 [56, 57]. The
model was run for a simulation time of 1E+06 years to investigate the effects of ingrowth, and in
particular the generation of Rn-222 gas.
TABLE 32. RADIONUCLIDES AND ASSOCIATED DAUGHTERS CONSIDERED IN THE MAIN
SCREENING CALCULATIONS
Disposed Radionuclide
Short-lived Daughter(s)a
Daughter(s)a
H-3
Co-60Ni-63Kr-85Sr-90 *Ba-133Cs-137 *Pm-147Sm-151Eu-152Pb-210 * ®ÆPo-210
Ra-226 * ®ÆPb-210*®Æ Po-210
Pu-238 ®ÆU-234®Æ Th-230®Æ Ra-226*®Æ Pb-210*®Æ Po-210
Pu-239 ®ÆU-235*®ÆPa-231®ÆAc-227*
Am-241 ®ÆNp-237®Æ Pa-233®Æ U-233®Æ Th-229*
Cf-252 ®ÆCm-248
Note: a * indicates a daughter with a half-life of less than 25 days (see Table 33).
101101101
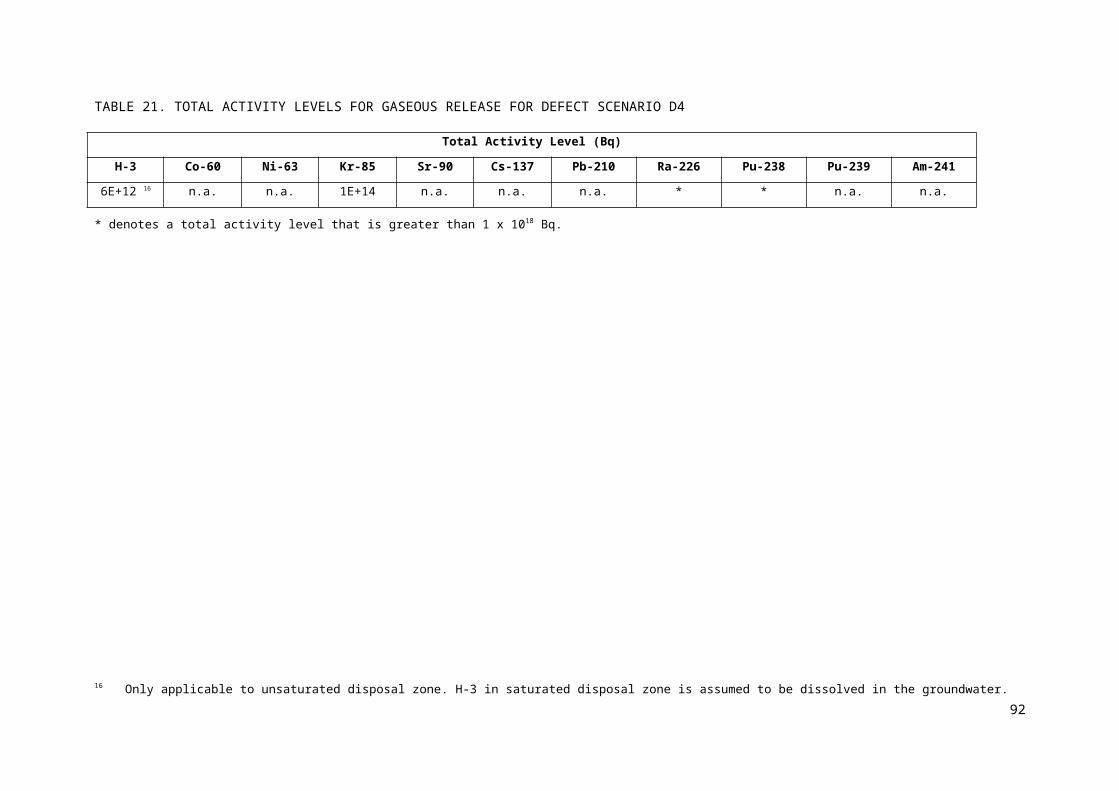
TABLE 33. SHORT-LIVED DAUGHTERS WITH HALF-LIVES OF LESS THAN 25 DAYS ASSUMED TO
BE IN SECULAR EQUILIBRIUM WITH THEIR PARENTS
Parent Short Lived DaughtersSr-90 ®Æ Y-90Cs-137 ®Æ (branching ratio 0.946) Ba-137mPb-210 ®Æ Bi-210Ra-226 ®Æ Rn-222®Æ Po-218®Æ (branching ratio 0.999 8) Pb-214 ®Æ Bi-214 ®Æ (branching ratio 0.999 8)
Po-214 ®Æ (branching ratio 0.000 2) At-218 ®Æ Bi-214 ®Æ (branching ratio 0.999 8) Po-214
Ac-227 ®Æ (branching ratio 0.013 8) Fr-223®Æ(branching ratio 0.9862) Th-227 ®ÆRa-223®ÆRn-219®ÆPo-215®ÆPb-211®Æ Bi-211
®Æ (branching ratio 0.997 2) ®ÆTl-207®Æ(branching ratio 0.0028) Po-211Th-229 ®Æ Ra-225®Æ Ac-225®Æ Fr-221®Æ At-217®Æ Bi-213®Æ (branching ratio 0.978 4) Po-213®Æ Pb-209
®Æ (branching ratio 0.021 6) Tl-209®Æ Pb-209U-235 ®Æ Th-231
TABLE 34. MAIN SCREENING – DOSE COEFFICIENTS
RadionuclideDose Coefficientsa
Ingestion (Sv/Bq)
Inhalation (Sv/Bq)
H-3 1.8E-11 4.5E-111.8E-11 (HTO gas)
Co-60 3.4E-09 1.0E-08Ni-63 1.5E-10 4.8E-10Kr-85 0.0E+00 9.2E-13b
Sr-90 3.1E-08 3.8E-08Ba-133 1.5E-09 3.1E-09Cs-137 1.3E-08 3.7E-08Pm-147 2.6E-10 5.0E-09Sm-151 9.8E-11 4.0E-09Eu-152 1.4E-09 4.2E-08Pb-210 6.9E-07 1.2E-06Po-210 1.2E-06 3.3E-06
Ra-226 2.8E-07 3.5E-069.0E-09 Rn-222b
Ac-227 1.2E-06 5.7E-04Th-229 6.1E-07 8.6E-05Th-230 2.1E-07 1.4E-05Pa-231 7.1E-07 1.4E-04Pa-233 8.7E-10 3.9E-09U-233 5.1E-08 3.6E-06U-234 4.9E-08 3.5E-06U-235 4.7E-08 3.1E-06
Np-237 1.1E-07 2.3E-05Pu-238 2.3E-07 4.6E-05Pu-239 2.5E-07 5.0E-05Am-241 2.0E-07 4.2E-05Cm-248 7.7E-07 1.5E-04Cf-252 9.0E-08 2.0E-05
Notes: a Data taken from Ref. [56] for adult, except for Rn-222 gas which is
taken from Ref. [57]. Short-lived daughters with a half life of less than 25
102
days are assumed to be in secular equilibrium with their parent and included
in the parent’s dose coefficient. For inhalation, the recommended default
absorption class given in Ref. [56] is adopted. Where no recommendation is
made, then the most conservative (highest) dose coefficient is adopted from
the range of absorption classes reported.
b Units are Sv/h per Bq/m3.
References for Table 34
[56] INTERNATIONAL COMMISSION ON RADIOLOGICAL PROTECTION, Age-dependent
doses to members of the public from intake of radionuclides: Part 5. Compilation of ingestion and
inhalation dose coefficients, Annals of the ICRP 26(1), ICRP Publication 72, Pergamon Press, Oxford
(1996).
[57] UNITED NATIONS SCIENTIFIC COMMITTEE ON THE EFECTS OF ATOMIC
RADIATION, Sources and Effects of Ionizing Radiation, United Nations, New York (2000).
For the groundwater pathway it is assumed that, following an institutional control period of 30 years, a
groundwater well is sunk immediately adjacent to a disposal borehole. The well is of the same depth
as the disposal borehole and is open throughout its length. It is assumed to immediately capture all the
contamination released from the disposal borehole. It is assumed that water is drawn into the well
from a column of radius 5 m and length 50 m, with a rock porosity of 0.3. For the purposes of
calculating ingestion doses, it is assumed that the well is used to supply drinking water (assumed to be
0.6 m3 y-1 per person). For the purposes of calculating inhalation doses, it is assumed that the well is
used to irrigate a small garden (4 m2) and humans are exposed from inhalation of contaminated soil.
External irradiation is not considered in the main scoping calculations since the preliminary scoping
calculations have shown that external irradiation calculations are lower than ingestion and inhalation
doses (see Table 31).
For the gas scenario, it is assumed that, following the 30 year institutional control period, a house is
built directly above a disposal borehole and a resident is exposed to all the gas released from the
disposed packages in the borehole. No account is taken of dilution, dispersion, or attenuation. All gas
released from the borehole is assumed to enter the house, which is assumed to be continuously
occupied. The house dimensions were assumed to be conservatively small (4 x 4 x 2.5 m) and a
ventilation rate of 0.25 h-1 which is typical for a well insulated building [58].
103103103
For the main screening assessment, for both the groundwater and gas pathways, it is also considered
appropriate to take the engineering performance into consideration. It is assumed that 5 of the
50 packages disposed in a single disposal borehole fail after 30 years, releasing their entire inventory.
The remaining 45 disposal packages are assumed to fail after 100 years releasing their entire
inventories into the groundwater (for the groundwater pathway calculations) or the house (for the gas
pathway calculations).
The results for the groundwater and gas pathways are presented in Tables 35 and 36 [58], respectively.
For the groundwater pathway, calculated doses for Ba-133, Pm-147, Sm-151, Eu-152 and Cf-252 are
below the screening dose of 0.3 mSv y-1 and are therefore screening out of the GSA. The gas pathway
results for all four radionuclides exceed the screening dose of 0.3 mSv y-1 and are therefore included in
the assessment.
Following the preliminary and main screening calculations, the following 11 radionuclides are
identified for inclusion in the GSA: H-3, Co-60, Ni-63, Kr-85, Sr-90, Cs-137, Pb-210, Ra-226, Pu-
238, Pu-239 and Am-241.
TABLE 35. MAIN SCREENING – RESULTS FOR THE GROUNDWATER PATHWAY
Radionuclide Peak Ingestion Dose (Sv/y) Peak Inhalation Dose (Sv/y)a
H-3 4.8E-02 3.5E-05
Co-60 9.7E+00 8.3E-03
Ni-63 7.8E-04 7.2E-07
Sr-90 7.7E-01 2.8E-04
Ba-133 3.5E-06 2.1E-09
Cs-137 4.9E+02 4.1E-01
Pm-147 1.3E-06 7.2E-09
Sm-151 1.8E-04 2.1E-06
Eu-152 6.0E-06 5.2E-08
Pb-210 4.3E-04 3.0E-07
Ra-226 2.7E+04 2.9E+01
Pu-238 1.1E+00 6.2E-02
Pu-239 8.5E+01 4.9E+00
Am-241 1.0E+03 6.3E+01
Cf-252 1.2E-05 6.8E-07
Note: a Calculated assuming soil depth of 0.3 m, soil porosity of 0.3, grain density of 2650 kg m-3, dust loading of
1E-6 kg m-3 and inhalation rate of 1.8 m3 h-1.
104

TABLE 36. MAIN SCREENING – RESULTS FOR THE GAS PATHWAY
Radionuclide (Parent) Peak Inhalation Dose (Sv/y)
H-3 9.4E+00
Kr-85 8.3E-04
Rn-222 (Ra-226) 2.2E+04
Rn-222 (Pu-238) 3.7E-03
REFERENCE
[58] BRITISH NUCLEAR FUELS LIMITED, Drigg Post-Closure Safety Case, British Nuclear
Fuels plc, Sellafield (2002).
105105105
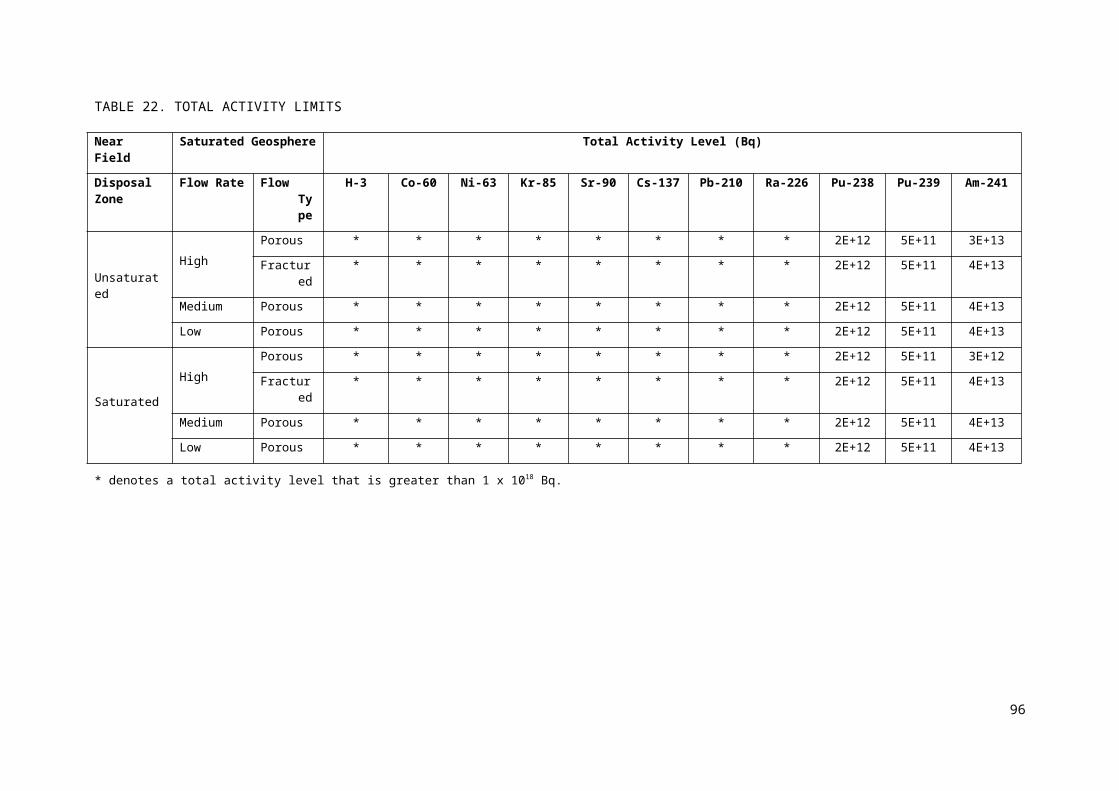
Appendix IIGEOCHEMICAL CONDITIONS CONSIDERED
II.1. REQUIREMENTS OF SPECIFICATIONS FOR GEOCHEMICAL CONDITIONS
The specifications for geochemical conditions are required to have the following characteristics.
The specifications must be based on well-defined criteria.
The specifications must effectively define bounding values for geochemical parameters that
may affect corrosion or degradation of engineered barriers.
The specified geochemical conditions should be internally consistent. It must be borne in mind
that values for many geochemical parameters are related to one another and therefore extreme
(bounding) values should not be specified independently. For example, extremely high CO3
concentrations would not occur in groundwater with extremely low pH.
The specified geochemical conditions must be reasonable for geological environments that
might plausibly be chosen for borehole disposal. In other words, it is inappropriate to consider
groundwater of extreme composition that would occur only in a geological environment that is
unsuitable for borehole disposal according to .non-geochemical criteria.
II.2. APPROACH TO DEFINING GEOCHEMICAL CONDITIONS
It is considered that the composition of any particular groundwater will reflect primarily a combination
of:
water/rock interactions; and
mixing between other compositionally distinct groundwaters and/or recharge waters.
Thus, the required bounding compositions can be based on those of:
groundwaters that occur in a range of different rock types;
surface waters that are found in a range of surface environmental conditions.
To ensure that the specified ranges of geochemical conditions are internally consistent, the
compositions presented in the present report are derived from a combination of:
real groundwater compositions;
theoretical simulations to obtain limiting values for key parameters that are consistent with
these real groundwater compositions.
The real groundwater samples used have extreme compositions. An extreme composition is simply
one that includes the greatest (and/or smallest) observed values for one or more determinands.
106
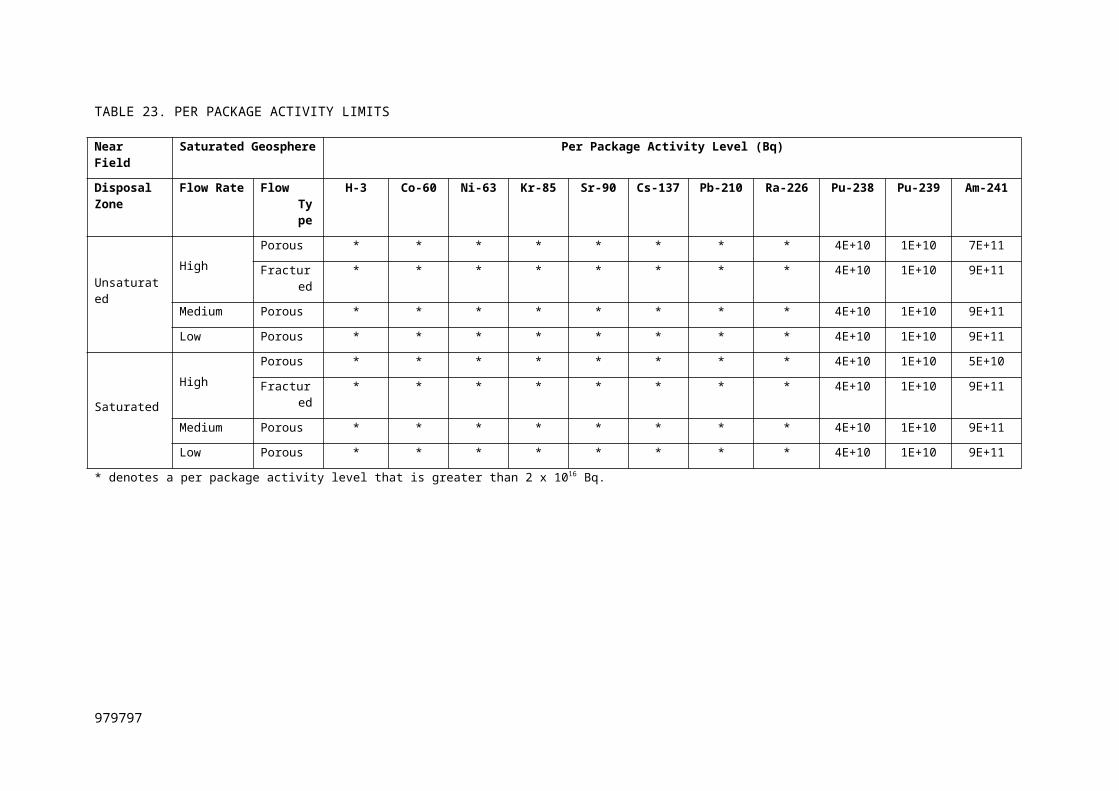
In principle, for each geochemical parameter, it would be possible to identify a groundwater
composition with an extreme value. However, this approach would lead to the definition of a very
large number of extreme compositions. For the present project, it is considered neither practicable nor
necessary to follow this approach. Several of the chemical parameters of interest will be correlated,
and will each have extreme values in the same water sample.
It should be noted that not all such extreme groundwater compositions are ‘limiting’ compositions in
the same way that mineralogical end-members are true limiting compositions of a particular solid
solution. Unlike mineralogical end-members, in most real extreme groundwater compositions, one or
more geochemical parameters will not be limited by any particular physical or chemical process.
Bearing in mind these points, the following steps were taken here.
The fundamental processes that influence/control groundwater chemistry were reviewed. The
database of Features, Events and Processes (FEPs) used for the development and justification of
scenarios (see Section 4) was used to check that no key processes had been omitted.
These processes were screened to remove any that would occur only where conditions would be
unsuitable for geological disposal, as indicated by non-geochemical criteria.
The results of the review and screening were used to:
- identify theoretical limits on key parameters (e.g. equilibrium with the atmosphere buffering
the dissolved oxygen concentration);
- identify parameters for which theoretical limits are unlikely to be reached in nature under the
pressure and temperature conditions of interest;
- recommend groundwater compositions with realistic extreme values for these parameters
that are unlikely to be limited by natural processes.
These groundwater compositions were used as inputs to theoretical models that calculated
extreme values for process-limited parameters.
The global distribution of the groundwater compositions that have not been screened out was
determined, to demonstrate the plausibility of such compositions occurring within all countries
that might consider borehole disposal.
II.3. BOUNDING GROUNDWATER COMPOSITIONS
Table 37 tabulates 12 water compositions that effectively bound the compositional space of
groundwaters that are expected to occur in all environments that are likely to be considered for
borehole disposal of disused radioactive sources.
107107107
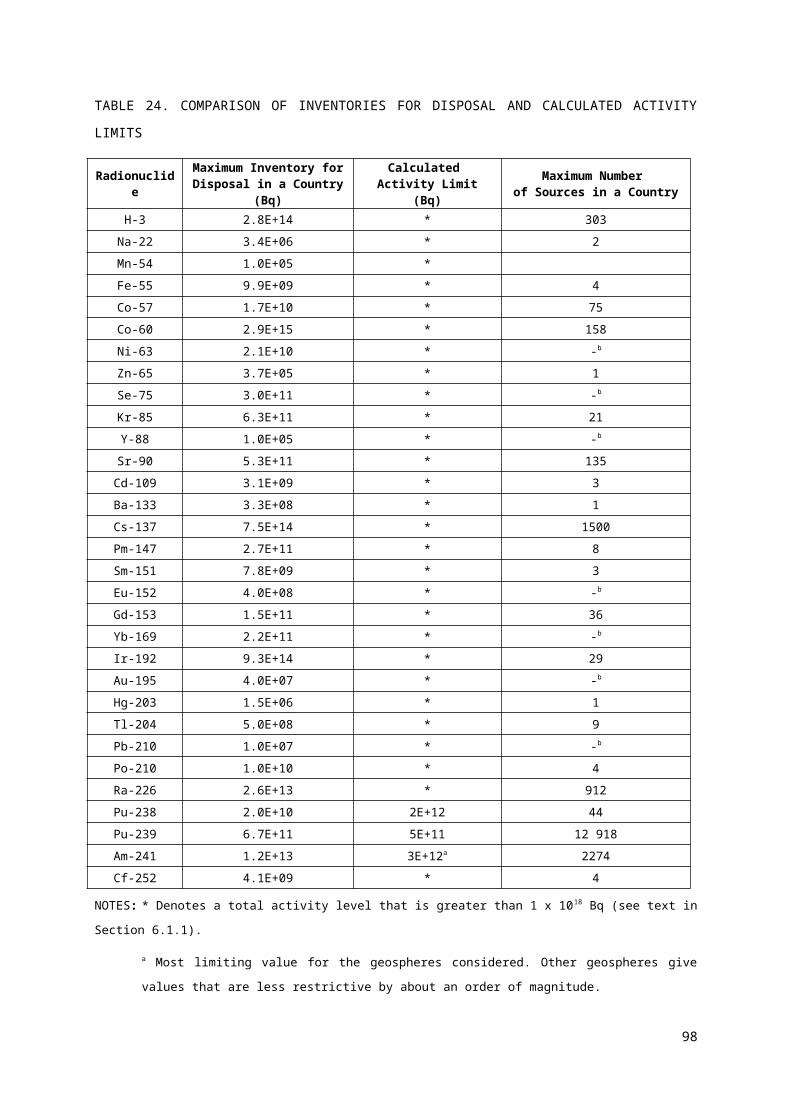
However, a smaller number of water compositions is sufficient to undertake calculations that are
designed to bound the degradation rates of engineered barriers. This sub-set of the water compositions
was selected by identifying:
the geochemical parameters that would influence the corrosion rate of steel and/or the
degradation rate of cement grout; and
the water compositions that have values of parameters that would result in maximum rates.
The following geochemical parameters are particularly important from the point of view of
determining the rates of corrosion of metals and the degradation rates of cement grout:
pH;
redox potential (Eh);
dissolved O2 concentration;
SO4 concentration;
TIC concentration;
Cl concentration.
The screening according to the likely influence on corrosion rates places most emphasis on the redox
conditions and Cl content. Accordingly, high and low Cl waters under both aerobic and anaerobic
conditions are of most interest, leading to selection of the following compositions:
aerobic, high Cl: water – No. 12 (alkaline, Na-Cl-SO4 brine);
anaerobic, high Cl water – No. 6 (halite-saturated brine) (Nos 3, 8 and 9 also fall into this
group);
anaerobic, but relatively oxidising, low Cl – No. 10 (fresh, high-pH water);
anaerobic, but relatively reducing, low Cl – No. 5. (fresh reducing high pH) (Nos 4 and 7 also
fall into this group).
However, whereas redox state and Cl concentrations are considered to be the primary controls on
metal corrosion, pH, SO4 and TIC will be the main controls on cement grout stability. In particular,
cement grout degradation will be tend to be enhanced by low pH, high SO4 and high TIC. The above
selection of groundwater compositions includes the highest SO4 composition among the bounding
waters (groundwater No. 12). However, waters with lowest pH and highest TIC are not included.
Therefore, to ensure that a conservative treatment of cement grout degradation is included among the
calculations to be undertaken during this project, the following compositions are also selected:
low-pH meteoric water – No. 1; and
alkaline, Na-Cl brine with high TIC – No. 11.
108
Thus, of the 12 water compositions, six (Nos 1, 5, 6, 10, 11 and 12) are considered sufficient to bound
the chemical controls on barrier corrosion and degradation for the purposes of sensitivity analysis.
II.4. REFERENCE GROUNDWATER COMPOSITIONS
Whilst it is acceptable to have six groundwaters for the purposes of bounding/sensitivity calculations,
there is a need to reduce the number further for reference case calculations. The suitability of each of
the six bound waters was reviewed as follows.
Waters Nos 11 and 12 would occur only at or near localities where there are, or have been,
surface water bodies with high evaporation rates. That is, these groundwaters would be most
likely to occur in certain extremely arid environments. Whilst in principle such environments
might be considered for borehole disposal in some cases, they are not as widely distributed in
regions of the world. Consequently Nos 11 and 12 are not considered further.
Waters like the halite saturated brine, No. 9, are more widely distributed than waters Nos 11 and
12. However, chloride brines like water No. 9 tend to occur at relatively great depths (reflecting
partly their high densities) and are most typically distributed in regions where presently there are
evaporite deposits.
In contrast to water No. 9, water No. 6 is diagenetically altered marine water. Such waters are
very widely distributed, not only in present coastal regions, but also inland. These latter
occurrences reflect the past penetration of seawater into the sub-surface during periods of
relatively high sea level, or the preservation of connate marine water.
Water No. 10 is fresh water that has reacted with minerals in mafic crystalline rock and
consequently acquired its alkaline pH. The water is broadly similar to water No. 5, but is more
oxidising and alkaline. Water No. 5 is one that has reacted with granitic rock, thereby gaining a
moderately alkaline composition. Waters like both Nos 10 and 5 are quite widely distributed in
areas of crystalline rock. However, on a global scale, in continental areas rocks of broadly
granitic composition are more common than are rocks of gabbroic composition.
Water No. 1 is an example of acid rainwater. Clearly fresh meteoric water will occur globally;
this one’s acid composition makes it an extreme example of meteoric water.
Given the requirement to select three waters, so as to reduce the number of calculations to a
manageable level, and to ensure that each of the selected waters has a wide distribution, Nos 1, 5 and 6
are chosen.
109109109
Text cont. on p. xxx
110
TABLE 37. GEOCHEMICAL DETERMINANDS FOR SELECTED GROUNDWATERS
Determinand UnitsNo. 1. Acid meteoric water No. 2. Ocean Standard Water
Value Source of data Notes Value Source of data Notes
Temperature °C 6 Bailey et al. (2002) 1 16.1 NOAA/NCDC (2006) 4
pH pH 4.1 Appelo and Postma (1994) 2,3 8.2 Royal Society (2005) 5
Eh mV 996 Appelo and Postma (1994) 2,3 751 6
Dissolved O2 mg/kg 12.0 Appelo and Postma (1994) 2,3 7.97 6
Na mg/kg 0.11 Appelo and Postma (1994) 2,3 10 770 Summerhayes and Thorpe
(1996)
K mg/kg 0.08 Appelo and Postma (1994) 2,3 399 Summerhayes and Thorpe
(1996)
Mg mg/kg 0.05 Appelo and Postma (1994) 2,3 1290 Summerhayes and Thorpe
(1996)
Ca mg/kg 0.16 Appelo and Postma (1994) 2,3 412 Summerhayes and Thorpe
(1996)
Si mg/kg 2.8 Summerhayes and Thorpe (1996)
Al mg/kg 0.001 Summerhayes and Thorpe (1996)
Fe mg/kg 0.000 055 Summerhayes and Thorpe (1996)
Mn mg/kg 0.000 014 Summerhayes and Thorpe (1996)
Cl mg/kg 0.53 Appelo and Postma (1994) 2,3 19 354 Summerhayes and Thorpe
(1996)
SO4 mg/kg 2.88 Appelo and Postma (1994) 2,3 2708 Summerhayes and Thorpe
(1996)
H2S mg/kg
N mg/kg 0.34 Appelo and Postma (1994) 2,3 0.042 Summerhayes and Thorpe
(1996)7
TIC mg/kg 0.23 Appelo and Postma (1994) 2,3 27.6 Summerhayes and Thorpe
(1996)
111111111
TABLE 37. GEOCHEMICAL DETERMINANDS FOR SELECTED GROUNDWATERS (cont.)
Determinand Units
No. 3. Diagenetic water of seawater origin,
Chalk, Trunch, UK
No. 4. Diagenetic water of meteoric origin,
Chalk, Trunch, UK
Value Source of data Notes Value Source of data Notes
Temperature °C 20.0 Bath and Edmunds (1981)
8 10 Estimated 14
pH pH 8.2 Royal Society (2005)
9 7.09 Bath and Edmunds (1981)
15
Eh mV -234 Bath and Edmunds (1981)
10,11,12,13 -154 Bath and Edmunds (1981)
15,16,17,18
Dissolved O2 mg/kg
Na mg/kg 11 100 Bath and Edmunds (1981)
10,11,12 41 Bath and Edmunds (1981)
15,16,17
K mg/kg 283 Bath and Edmunds (1981)
10,11,12 2.9 Bath and Edmunds (1981)
15,16,17
Mg mg/kg 1363 Bath and Edmunds (1981)
10,11,12 12.5 Bath and Edmunds (1981)
15,16,17
Ca mg/kg 647 Bath and Edmunds (1981)
10,11,12 120 Bath and Edmunds (1981)
15,16,17
Si mg/kg 4.0 Bath and Edmunds (1981)
10,11,12 2.79 Bath and Edmunds (1981)
15,16,17
Al mg/kg 0.007 Bath and Edmunds (1981)
10,11,12 0.000 1 Bath and Edmunds (1981)
15,16,17
Fe mg/kg 8.32 Bath and Edmunds (1981)
10,11,12 2.35 Bath and Edmunds (1981)
15,16,17
Mn mg/kg
Cl mg/kg 19 682 Bath and Edmunds (1981)
10,11,12 104.2 Bath and Edmunds (1981)
15,16,17
SO4 mg/kg 2850 Bath and Edmunds (1981)
10,11,12 66 Bath and Edmunds (1981)
15,16,17
H2S mg/kg3.63E-
06
Bath and Edmunds (1981)
10,11,12 2.73E-06 Bath and Edmunds (1981)
N mg/kg 0.20 Bath and Edmunds (1981)
TIC mg/kg 4.71 Bath and Edmunds (1981)
10,11,12 67.35 Bath and Edmunds (1981)
15,16,17
112
TABLE 37. GEOCHEMICAL DETERMINANDS FOR SELECTED GROUNDWATERS (cont.)
Determinand UnitsNo. 5. JNC Fresh Reducing High pH
(FRHP)No. 6. JNC Saline Reducing High pH
(FRHP)
Value Source of data Notes Value Source of data Notes
Temperature °C 25 Yui et al. (2004) 25 Yui et al. (2004)
pH pH 8.46 Yui et al. (2004) 18 7.95 Yui et al. (2004) 18
Eh mV -281 Yui et al. (2004) 18 -303 Yui et al. (2004) 18
Dissolved O2 mg/kg
Na mg/kg 81.61 Yui et al. (2004) 18 14 185 Yui et al. (2004) 18
K mg/kg 2.40 Yui et al. (2004) 18 414.5 Yui et al. (2004) 18
Mg mg/kg 1.22 Yui et al. (2004) 18 6.05 Yui et al. (2004) 18
Ca mg/kg 4.37 Yui et al. (2004) 18 13.39 Yui et al. (2004) 18
Si mg/kg 9.52 Yui et al. (2004) 18 8.29 Yui et al. (2004) 18
Al mg/kg 0.01 Yui et al. (2004) 18 0.000 1 Yui et al. (2004) 18
Fe mg/kg 0.000 1 Yui et al. (2004) 18 0.002 2 Yui et al. (2004) 18
Mn mg/kg
Cl mg/kg 0.52 Yui et al. (2004) 18 20 917 Yui et al. (2004) 18
SO4 mg/kg 10.66 Yui et al. (2004) 18,19 2891 Yui et al. (2004) 18,19
H2S mg/kg
N mg/kg 0.32 Yui et al. (2004) 18 72.13 Yui et al. (2004) 18
TIC mg/kg 42.52 Yui et al. (2004) 18 415.58 Yui et al. (2004) 18
113113113
TABLE 37. GEOCHEMICAL DETERMINANDS FOR SELECTED GROUNDWATERS (cont.)
Determinand UnitsNo. 7. Fresh, high-pH water, Toki
Granite, Tono, JapanNo. 8. Halite-saturated brine based on Sellafield
groundwater, UK
Value Source of data Notes Value Source of data Notes
Temperature °C
25 JNC (2000) 20 25 Temperature for thermodynamic data in GWB
HMW database
22
pH pH 10.1 Iwatsuki et al. (2004)
21 6.26 Bath et al. (2006) 22,23,24,25
Eh mV -400 Iwatsuki et al. (2004)
21 -100 Bath et al. (2006) 22,23,24,25,26
Dissolved O2 mg/kg
Na mg/kg 25.4 Iwatsuki et al. (2004)
21 100 300
Bath et al. (2006) 22,23,24,25
K mg/kg 2.3 Iwatsuki et al. (2004)
21 458.3 Bath et al. (2006) 22,23,24,25
Mg mg/kg 0.3 Iwatsuki et al. (2004)
21 449.1 Bath et al. (2006) 22,23,24,25
Ca mg/kg 5.4 Iwatsuki et al. (2004)
21 2237 Bath et al. (2006) 22,23,24,25
Si mg/kg 1.9 Iwatsuki et al. (2004)
21
Al mg/kg 0.19 Iwatsuki et al. (2004)
21
Fe mg/kg 8.90 Iwatsuki et al. (2004)
21
Mn mg/kg 0.16 Iwatsuki et al. (2004)
21
Cl mg/kg 4.4 Iwatsuki et al. (2004)
21 159 100
Bath et al. (2006) 22,23,24,25
SO4 mg/kg 4.6 Iwatsuki et al. (2004)
21 1764 Bath et al. (2006) 22,23,24,25
H2S mg/kg
N mg/kg 17.79 Iwatsuki et al. (2004)
21
TIC mg/kg 18.4 Iwatsuki et al. (2004)
21 13.77 Bath et al. (2006) 22,23,24,25
114
TABLE 37. GEOCHEMICAL DETERMINANDS FOR SELECTED GROUNDWATERS (cont.)
Determinand Units
No. 9. Saline, Ca-Cl matrix porewater from Lac du Bonnet Granite Batholith, Whiteshell,
Manitoba, Canada
No. 10. Fresh, high-pH water from gabbro at East Bull Lake, Ontario,
Canada
Value Source of data Notes Value Source of data Notes
Temperature °C
25 Temperature for thermodynamic data in
GWB HMW
database
25 Bottomley et al. (1990)
32
pH pH 8.74 Gascoyne (2004) 24,27,28,29 10.4 Bottomley et al. (1990)
33
Eh mV -297 Gascoyne (2004) 30 220 Bottomley et al. (1990)
33,34
Dissolved O2 mg/kg
Na mg/kg 1376 Gascoyne (2004) 24,27,28,29 65 Bottomley et al. (1990)
33,34
K mg/kg 19.2 Gascoyne (2004) 24,27,28,29 0.2 Bottomley et al. (1990)
33,34
Mg mg/kg 0.26 Gascoyne (2004) 24,27,28,29 0.6 Bottomley et al. (1990)
33,34
Ca mg/kg 26 620 Gascoyne (2004) 24,27,28,29 0.4 Bottomley et al. (1990)
33,34
Si mg/kg 1.44 Gascoyne (2004) 29,31 12.1 Bottomley et al. (1990)
33,34
Al mg/kg 0.00 Gascoyne (2004) 29,31 N.R. Bottomley et al. (1990)
33,34
Fe mg/kg 0.01 Gascoyne (2004) 29,31 1.13 Bottomley et al. (1990)
33,34
Mn mg/kg 0.04 Bottomley et al. (1990)
33,34
Cl mg/kg 48 350 Gascoyne (2004) 24,27,28,29 10.9 Bottomley et al. (1990)
33,34
SO4 mg/kg 1210 Gascoyne (2004) 24,27,28,29 9.9 Bottomley et al. (1990)
33,34
H2S mg/kg
N mg/kg 0.02 Gascoyne (2004) 29,31
TIC mg/kg 0.11 Gascoyne (2004) 24,27,28,29 30.9 Bottomley et al. (1990)
33,34,35
115115115
TABLE 37. GEOCHEMICAL DETERMINANDS FOR SELECTED GROUNDWATERS (cont.)
Determinand UnitsNo. 11. Alkaline, Na-Cl brine from
Lake Magadi, KenyaNo. 12. Alkaline, Na-Cl-SO4 brine, based on brine from Searles Lake, California, U.S.A
Value Source of data Notes Value Source of data Notes
Temperature °C
25 Temperature for thermodynamic data in GWB
HMW database
25 Temperature for thermodynamic data in GWB
HMW database
pH pH 10.3 Surdam and Shepherd (1977)
36 10 Hay and Guldman (1987) 38
Eh mV 600 Surdam and Shepherd (1977)
37 630 Hay and Guldman (1987), Gale (1915)
39
Dissolved O2 mg/kg 3.5 Surdam and Shepherd (1977)
37 3 Hay and Guldman (1987), Gale (1915)
39
Na mg/kg 68 685 Surdam and Shepherd (1977)
36 90 230 Gale (1915) 40,41
K mg/kg 964 Surdam and Shepherd (1977)
36 18 130 Gale (1915) 40,41
Mg mg/kg 0.04 Gale (1915) 40,41
Ca mg/kg 0.2 Gale (1915) 40,41
Si mg/kg 255 Surdam and Shepherd (1977)
36
Al mg/kg
Fe mg/kg
Mn mg/kg
Cl mg/kg 41 134 Surdam and Shepherd (1977)
36 104 800 Gale (1915) 40,41
SO4 mg/kg 1591 Surdam and Shepherd (1977)
36 39 700 Gale (1915) 40,41
H2S mg/kg
N mg/kg
TIC mg/kg 12 047 Surdam and Shepherd (1977)
36 3941 Gale (1915) 40,41
Notes: 1. Mean daily temperature averages -8.3 °C in January and 18.7 °C in July.
2. Data from Hubbard Brook Experimental Forest, New Hampshire, U.S.A. Values here calculated from
reported values expressed in mmol/l, assuming the density of water to be 1kg/l.
3. The water composition from Hubbard Brook, reported in Appelo and Postma (1994) was used as input to a
simulation using Geochemist’s Workbench Version 6.0.3 and the thermodynamic database thermo.dat. In this
simulation charge was balanced by adjusting Cl-, the TIC was constrained by equilibrium with atmospheric CO2
and the redox state was constrained by equilibrium with atmospheric oxygen.
4. Compiled from data between 1901 and 2000.
5. Royal Society (2005) quotes surface values measured for 1994 from the GLODAP dataset. These values
range from 7.9 to 8.25 with a mean value of 8.08.
116
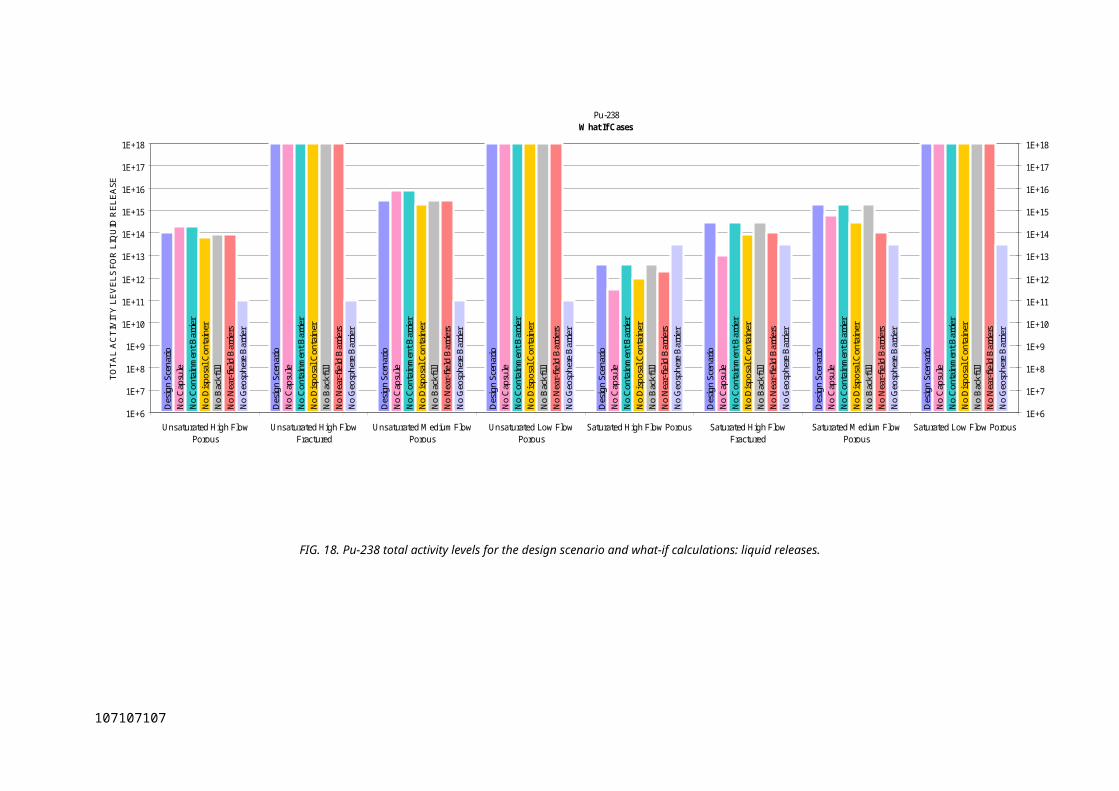
6. The seawater composition reported in Summerhayes and Thorpe (1994) was used as input to a simulation
using Geochemist’s Workbench Version 6.0.3 and the thermodynamic database thermo.dat. In this simulation the
redox state was constrained by equilibrium with atmospheric oxygen.
7. Concentrations exclude dissolved N2 gas; element occurs also as dissolved nitrogen (N2) gas. Species other
than NO3- are often important in the upper ocean (e.g., NO2-, NH4+).
8. Value reported for a depth of 480.5 m.
9. pH of modern seawater specified since the origins of the salinity is considered to be seawater and since Bath
and Edmunds (1981) note that the pH of the flowing waters sampled in nearby boreholes, which is up to 7.3, is
likely to be lower than the pH of the deeper interstitial waters.
10. Reported concentration units in Bath and Edmunds (1981) are mg/l; here recalculated to units of mg/kg using
a density of 1.026305, the same as the density of seawater at a similar chlorinity, reported by Millero (1984).
11. Analysis of porewater from a depth of 480.5 m in the Trunch borehole and represents the most saline water
from the Chalk at this locality.
12. The porewater composition from a depth of 480.5 m in the Trunch borehole, reported in Bath and Edmunds
(1981) was used as input to a simulation using Geochemist’s Workbench Version 6.0.3 and the thermodynamic
database thermo.dat. In this simulation TIC, Si, Al, Fe and HS- were controlled by equilibrium with respect to
calcite, chalcedony, kaolinite, siderite and pyrite respectively.
13. The Eh is quoted for the SO4--/HS- redox couple.
14. Depth of sample is not reported. However the sample is stated to be “shallow” and in the nearby Trunch
borehole the temperature at 100 m depth is about 10 degrees; this value is used here.
15. Analysis of “shallow” flowing water from a borehole near to the Trunch borehole, is the lowest-pH water
reported in Bath and Edmunds (1981).
16. Reported concentration units in Bath and Edmunds (1981) are mg/l; here values taken to be the same as for
units of mg/kg consistent with a density of 1.00.
17. Analysis of “shallow” flowing water from a borehole near to the Trunch borehole, reported in Bath and
Edmunds (1981), was used as input to a simulation using Geochemist’s Workbench Version 6.0.3 and the
thermodynamic database thermo.dat. In this simulation Si, Al, Fe and HS- were controlled by equilibrium with
respect to chalcedony, kaolinite, siderite and pyrite respectively.
18. The concentration is modelled using PHREEQE, but shown to be similar to natural Japanese groundwater of
extreme composition.
19. Total S is reported in Yui et al. (2004), given here as SO4.
20. Assumed normal geothermal gradient for Japan - reasonable based upon published data for the Tono area.
21. The analysis is of the highest pH water from the Tono area, from a depth of 561 m below ground level in the
Toki Granite.
22. The water composition from DET 1 of Sellafield borehole BH3, reported in Bath et al. (2006) was used as
input to a simulation using Geochemist’s Workbench Version 6.0.3 and the Harvie-Moller-Weare thermodynamic
database thermo_hmw.dat. The removal of water of neutral pH until halite saturation was simulated.
23. pH was constrained by specifying equilibrium with respect to calcite.
117117117
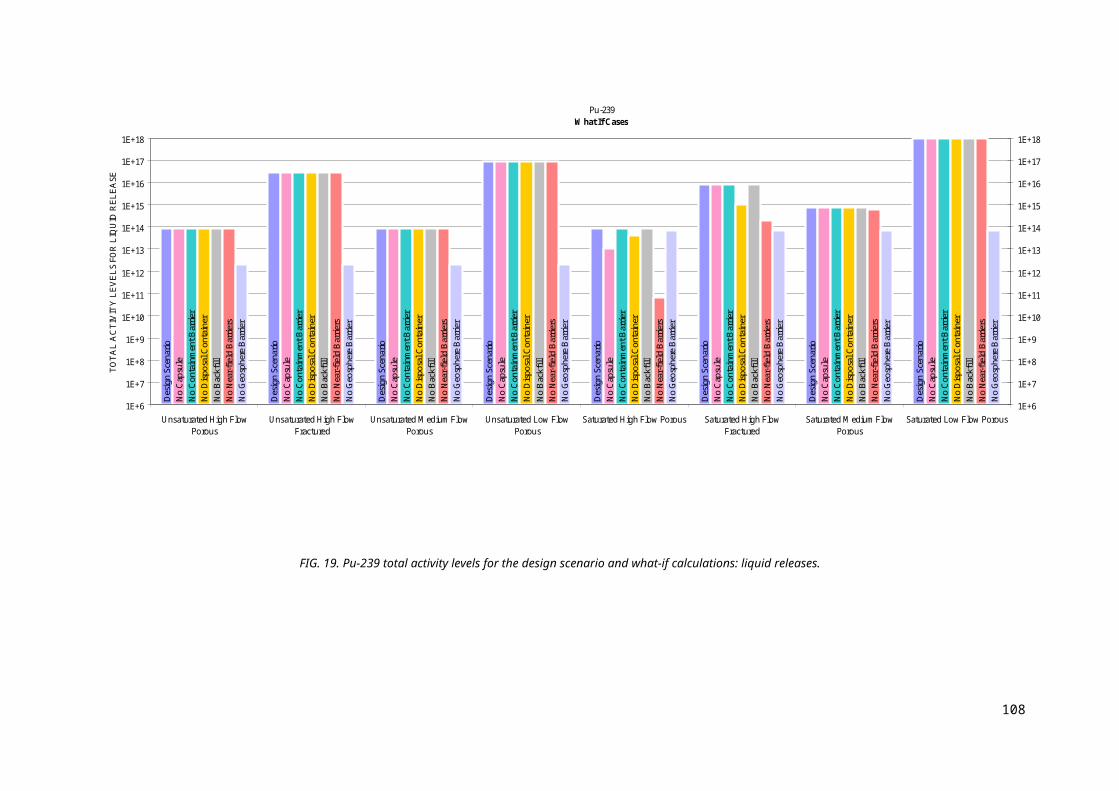
24. Charge was balanced by adjusting Cl-.
25. The composition in Bath et al. (2006) is reported in mg/l; here the composition used as input to the GWB
calculation was recalculated to mg/kg by specifying an assumed density of 1.192 kg/l (equivalent to the mass of
1 kg water plus mass of solids, and with Cl adjusted to achieve charge balance).
26. The redox condition was calculated by carrying out a simulation using Geochemist’s Workbench Version
6.0.3 and the thermodynamic database thermo.dat. The water composition output by the simulation described in
Note 12 was used as input, Fe was constrained by equilibrium with siderite and HS- was constrained by equilibrium
with pyrite. Note that the result of this calculation is an approximation because the Debye-Huckel equation was
used to calculation activities.
27. The composition of the most saline porewater collected in unfractured rock from boreholes at the Whiteshell
URL, reported in Gascoyne (2004) was used as input to a simulation using Geochemist’s Workbench Version 6.0.3
and the Harvie-Moller-Weare thermodynamic database thermo_hmw.dat. The pH was adjusted until calcite
saturation was achieved.
28. Most saline porewater collected in unfractured rock from boreholes at the Whiteshell URL.
29. Values reported in units of mg/l; here recalculated to units of mg/kg using a density of 1.066, calculated using
the relationship between density and TDS of density = 0.000795*TDS (in g/l) +0.997151, given in Gascoyne
(2004).
30. The redox condition was calculated by carrying out a simulation using Geochemist’s Workbench Version
6.0.3 and the thermodynamic database thermo.dat. The water composition output by the simulation described in
Note 16 was used as input, Fe was constrained by equilibrium with annite and HS- was constrained by equilibrium
with pyrite, Si was constrained by equilibrium with quartz and Al was constrained by equilibrium with kaolinite.
Note that the result of this calculation is an approximation because the Debye-Huckel equation was used to
calculation activities.
31. The composition of the most saline porewater collected in unfractured rock from boreholes at the Whiteshell
URL, reported in Gascoyne (2004) was used as input to a simulation using Geochemist’s Workbench Version 6.0.3
and the Harvie-Moller-Weare thermodynamic database thermo_hmw.dat.
32. Bottomley et al. (1990) do not indicate a precise temperature, but state that temperatures are < 25 °C.
33. Most alkaline groundwater sampled from East Bull Lake, between 75-243 m depth in gabbro (sensu lato).
34. Reported concentration units in Bottomley et al. (1990) are mg/l; here values taken to be the same as for units
of mg/kg consistent with a density of 1.00.
35. Calculated from alkalinity reported in mg/l HCO3-, assuming that all alkalinity is due to carbonate alkalinity.
36. Reported concentration units in Surdam and Sheppard (1977) are mg/l; here recalculated to units of mg/kg
using a density of 1.21, assuming that the density is equal to the reported TDS (210,000 mg/l) + mass of 1 kg of
water in 1 l of solution.
37. The redox condition was calculated by carrying out a simulation using Geochemist’s Workbench Version
6.0.3 and the thermodynamic database thermo.dat. The water composition output by the simulation described in
Note 24 was used as input. The redox constraint was specified by equilibrium with the atmosphere. Note that the
result of this calculation is an approximation because the Debye-Huckel equation was used to calculation activities.
38. The maximum pH referred to in Hay and Guldman (1987) is 9.9. An upper limiting pH of 10 is therefore used
here; no pH is quoted in Gale (1915).
118
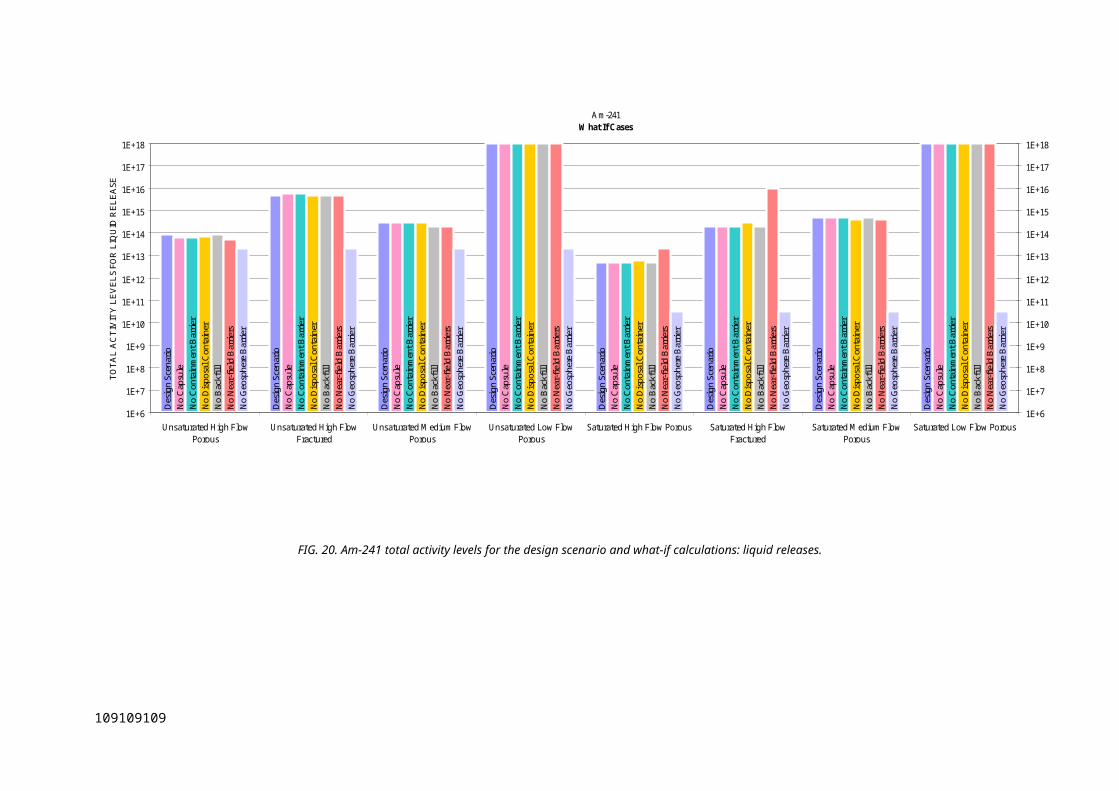
39. The redox condition was calculated by carrying out a simulation using Geochemist’s Workbench Version
6.0.3 and the thermodynamic database thermo.dat. The water composition output by the simulation described in
Note 26 was used as input. The redox constraint was specified by equilibrium with the atmosphere. Note that the
result of this calculation is an approximation because the Debye-Huckel equation was used to calculation activities.
40. The composition of water sample SE7 was given by Gale (1915) was used as input to a simulation using
Geochemist’s Workbench Version 6.0.3 and the Harvie-Moller-Weare thermodynamic database thermo_hmw.dat.
Sample SE7 was chosen because it is the most SO4-rich among the samples considered in this paper.
41. The GWB model adjusted Na+ to balance the charge and constrained concentrations of Ca2+ and Mg2+ by
specifying equilibrium with respect to calcite and dolomite respectively.
REFERENCES
[59] APPELO, C.A.J., POSTMA, D., Geochemistry, groundwater and pollution, Balkema,
Rotterdam, (1994) 24, Table 2.2.
[60] BAILEY, A.S., HORNBECK, J.W., CAMPBELL, J.L., EAGAR, C., Hydrometeorological
database for Hubbard Brook Experimental Forest: 1955-2000, United States Department of
Agriculture Forest Service, General Technical Report NE-305 (2002).
[61] BATH, A.H., et al., Geochemical Indicators of Deep Groundwater Movements at Sellafield,
UK, Journal of Geochemical Exploration (2006) 90, 24-44.
[62] BATH, A.H., EDMUNDS, W.M., Identification of connate water in interstitial solution of
Chalk sediment, Geochimica et Cosmochimica Acta (1981) 45, 1449-1461.
[63] BOTTOMLEY, D.J., GASCOYNE, M., KAMINENI, D.C., The geochemistry, age and
origin of groundwater in a mafic pluton, East Bull Lake, Ontario, Canada, Geochimica et
Cosmochimica Acta, (1990) 54, 933-1008.
[64] GALE, H.S., Salines in the Owens, Searles, and Panamint Basins, southeastern California,
United States Geological Survey Bulletin, (1915) 580: 251-323.
[65] GASCOYNE, M., Hydrogeochemistry, groundwater ages and sources of salts in a granitic
batholith on the Canadian Shield, southeastern Manitoba, Applied Geochemistry, (2004) 19,
519-560.
[66] HAY, R.L., GULDMAN, S.G., Diagenetic alteration of silicic ash in Searles Lake,
California, Clays and Clay Minerals, (1987) 35, 449-457.
119119119
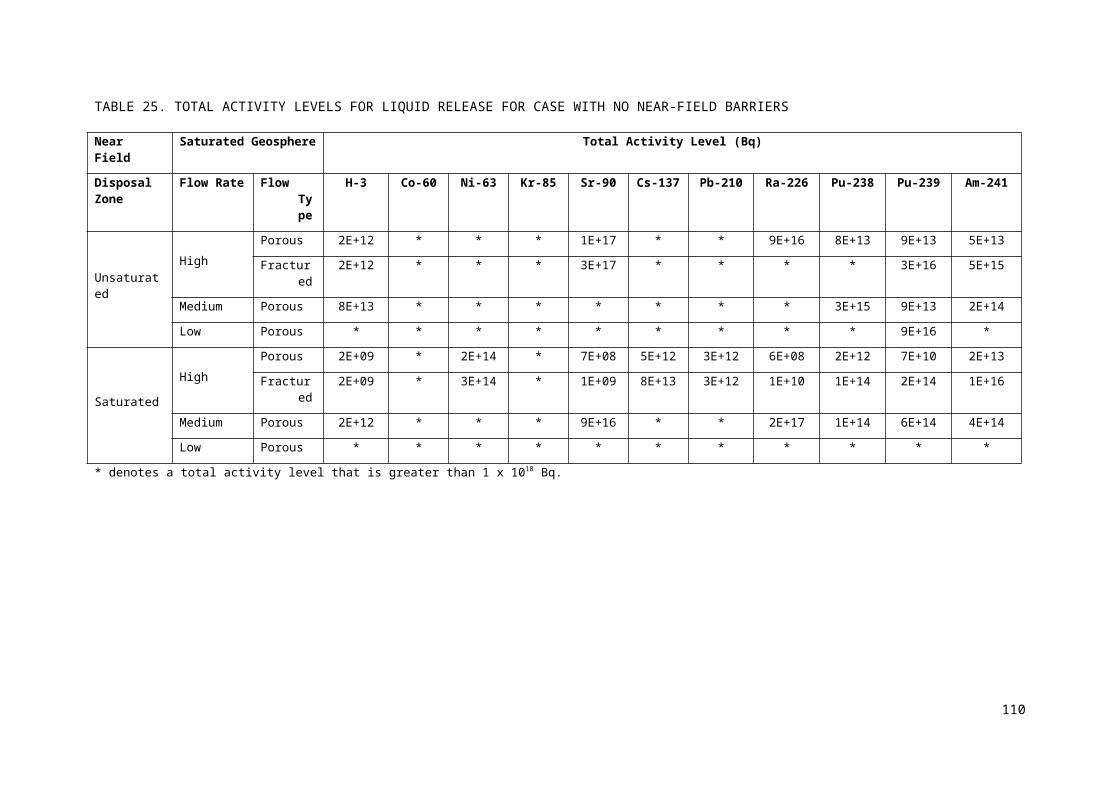
[67] IWATSUKI, T., ARTHUR, R.C., OTA, K., METCALFE, R., Solubility constraints on
uranium concentrations in groundwaters of the Tono Uranium deposit, Japan, Radiochimica
Acta, (2004) 92, 789-796.
[68] JAPAN NUCLEAR CYCLE DEVELOPMENT INSTITUTE, H12: Project to establish the
scientific and technical basis for HLW disposal in Japan, Second Progress Report on
Research and Development for the Geological Disposal of HLW in Japan, JNC Technical
Report JNC TN1410 2000-002, Tokai-mura, Japan (2000).
[69] MILLERO, F.J., The conductivity-density-salinity-chlorinity relationships for estuarine
water. Limnology and Oceanography, (1984) 29, 1317-1321.
[70] NATIONAL OCEANIC AND ATMOSPHERIC ADMINISTRATION, National Climate
Data Center (NCDC),
http://www.ncdc.noaa.gov/oa/climate/research/anomalies/anomalies.html, (2006).
[71] ROYAL SOCIETY, Ocean acidification due to increasing atmospheric carbon dioxide,
(2005).
[72] SUMMERHAYES, C.P., THORPE, S.A., Oceanography: An Illustrated Guide, (1996)
Chapter 11, 165-181.
[73] SURDAM, R.C., SHEPPARD, R.A., Zeolites in saline, alkaline-lake deposits. In: SAND
L.B., MUMPTON F.A., (Eds), Natural Zeolites, Occurrence, Properties, Use, New York,
(1977) 145-174.
[74] YUI, M., SASAMOTO, H., ARTHUR, R.C., Geostatistical and geochemical classification
of groundwaters considered in safety assessment of a deep geologic repository for high-
level radioactive wastes in Japan. Geochemical Journal 38, (2004), 33-42.
120

Appendix IIISCENARIO GENERATION APPROACH
The approach used is shown in Fig. 22 and is described below.
FIG. 22. Scenario development and justification approach used.
A panel, consisting of the attendees of the first consultants’ meeting to develop this safety report
(i.e. Gerard Bruno, Ian Crossland, Luis Jova Sed, Richard Little and Philip Metcalf), identified
121121121
Develop and Justify Alternative Scenarios
Identify Alternative Scenarios
Describe Each Alternative Scenario
Screen FEPs for Each Alternative Scenario
Convene Panel
Define Status of External FEPs for Design Scenario
Describe Design Scenario
Screen FEPs for Design Scenario
Review and Modify Status of
External FEPs from Design Scenario
Assessment Context System Description Scenario Description Updated ISAM FEP
List
Develop and Justify Design Scenario
Assessment Context System Description
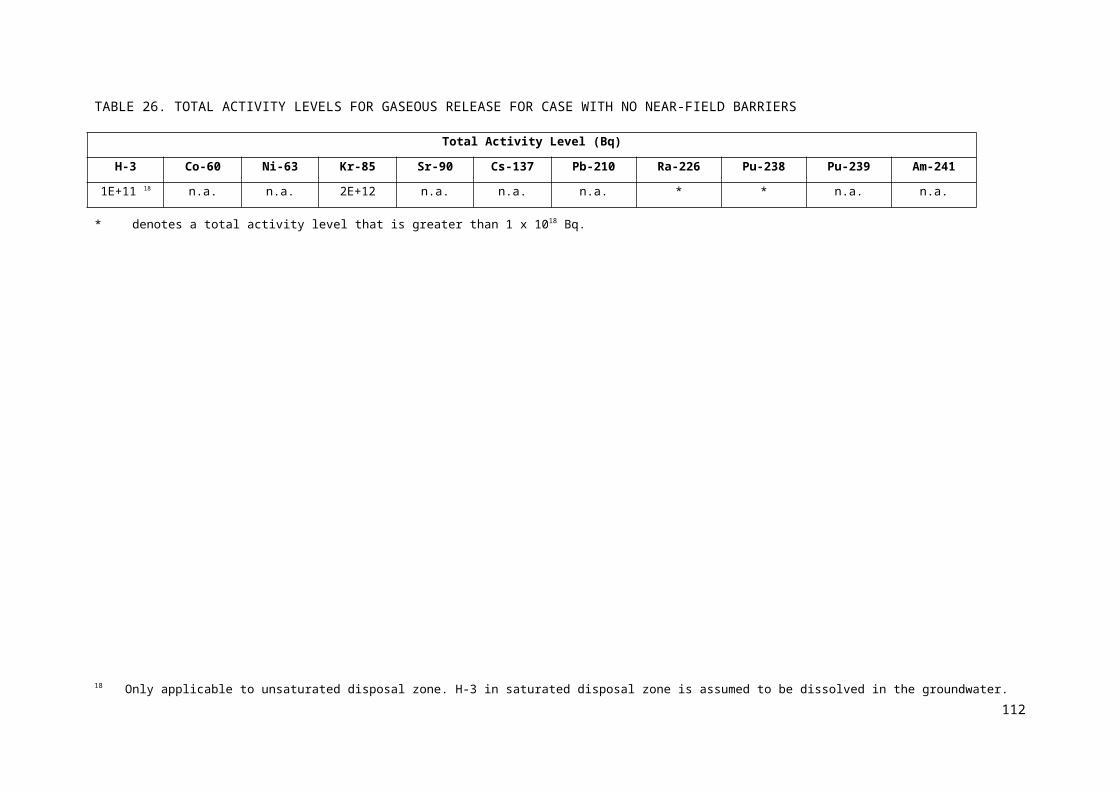
scenarios for consideration in the GSA. The components of the disposal system were divided into
internal and external components (Fig. 23). The internal components are situated within the spatial and
temporal boundaries of the system, Whilst the external components are situated outside these
boundaries19. External factors (external features, events and processes (EFEPs)) were regarded as
boundary conditions or forcing functions for the system model. They were considered as scenario
generating features, events and processes (FEPs). The panel considered each of the four external
factors identified in Fig. 23 and, using information relating to the assessment context (Section 2) and
system description (Section 3), assigned the following ‘states’ for each of the external factors for the
purpose of defining a ‘Design Scenario’20:
repository factors – the borehole is assumed to be constructed, operated and closed as designed
and planned (i.e. consistent with Section 3.1);
geological processes and events – the geosphere is assumed to be as described in Section 3.2
with no unexpected features, processes or events (e.g. earthquakes);
climate processes and events – constant climate conditions are assumed (a simplifying
assumption) but with allowance for continuous gradual surface erosion; and
future human actions and behaviours – after 30 years of institutional control, it is assumed that
water is abstracted from a borehole drilled 100 m down the hydraulic gradient from the disposal
borehole and used for domestic purposes (drinking) and agricultural purposes (watering of cows
and irrigation of root and green vegetables) (i.e. consistent with Sections 3.2 and 3.3).
Construction of a dwelling above the disposal borehole at the end of the institutional control
period is also considered but it is assumed that there is no intrusion into the borehole’s disposal
zone (consistent with Sections 3.3).
19 Repository factors are considered to be external since they relate to decisions concerning borehole design, operation and closure which are taken before the start of the post-closure period - the time period of interest for the GSA.20 The Design Scenario represents how the disposal system can be expected to evolve assuming the boreholes design functions as planned and provides a benchmark against which alternative scenarios can be compared.
122
Internal Factors
External Factors
Health Impact
RepositoryFactors
ClimateProcesses and
Events
Future HumanActions andBehaviours
GeologicalProcesses and
Events
HumanBehaviour
Characterisation
EngineeredBarrier System
Characterisation
WasteCharacterisation
SiteCharacterisation
Near-Field
Geosphere
Biosphere
FIG. 23. External and internal factors.
The panel then identified alternative scenarios by considering possible alternative conditions for the
EFEP (i.e. the scenario generating FEPs), consistent with the assessment context and system
description (Table 11). Four alternative scenarios were identified:
the Defect Scenario;
the Unexpected Geological Characteristics;
the Changing Environmental Conditions Scenario; and
123123123
the Borehole Disturbance Scenario.
124
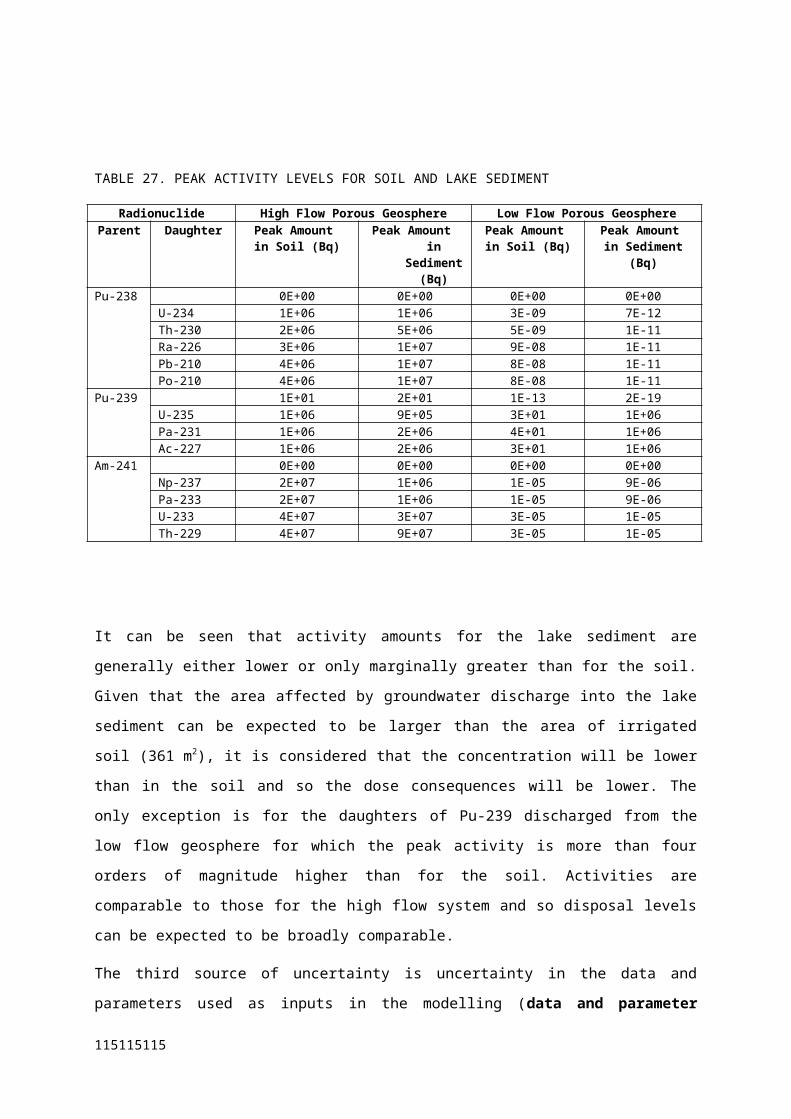
Appendix IVSCREENED FEP LIST FOR THE DESIGN SCENARIO
0 ASSESSMENT CONTEXT FACTORS
0.01 Assessment Purpose – Yes, see Section 2.1 for the four main purposes of the assessment.0.02 Regulatory Requirements and Exclusions
1 0.2.01 Protection of human health and the environment – Yes, see Sections 2.2 and 2.4, especially Box 1 for protection objective and criteria. Impacts on non-human biota and non-radiological impacts are considered to be beyond the scope of the current study, so the focus is on radiological impacts upon human health.
2 0.2.02 Phases of disposal – Yes, see Sections 2.2 and 2.7. Assessment is of the post-closure phase, although it is recognized that operational and closure issues need to be considered when assessing post-closure safety.
3 0.2.03 Technical Requirements – Yes, see Sections 2.1 and 2.5. End points considered are waste activity levels expressed as total activity values and per waste package activity values. Output of assessment will help provide information on suitable inventories, engineering, institutional control period and hydrochemical characteristics.
0.03 Assessment Philosophy4 0.3.01 Assessment approach – Yes, see Section 2.6. The ISAM Safety Assessment Approach is being
used, consistent with best international practice.0.3.02 Uncertainties, treatment of
5 0.3.02.01 Future uncertainties – Yes, see Sections 2.6.4 and 3. This type of uncertainty is treated using a transparent and comprehensive scenario development and justification methodology.
6 0.3.02.02 Model uncertainties – Yes, see Sections 2.6.4 and 6. This type of uncertainty is treated using alternative conceptualizations and mathematical representations of the system.
7 0.3.02.03 Parameter/data uncertainties – Yes, see Sections 2.6.4 and 6. This type of uncertainty is treated using a deterministic sensitivity analysis.
8 0.3.02.04 Subjective uncertainties – Yes, see Section 2.6.4. This type of uncertainty is treated using a systematic and transparent assessment approach which allows subjective judgements to be document, justified and quantified (as far as possible).
9 0.3.03 Sensitivity analysis, performance of – Yes, see Section 6 for deterministic sensitivity analysis.0.3.04 Confidence, model
10 0.3.04.01 Verification, performance of – Yes, see Section 5.5. The software tool used (AMBER) has been successfully used in over 20 countries by over 60 organizations and has associated verification documentation.
11 0.3.04.02 Calibration, performance of – No, calibration is a site-specific procedure and therefore not possible for a generic safety assessment.
12 0.3.04.03 Validation, performance of – No, validation is not considered possible for a long-term generic safety assessment.
13 0.3.05 Modelling approach – Yes, see Sections 2.6 and 6. The approach used aims to balance simplicity, conservatism and realism. Deterministic calculations are used. The emphasis is to understand the behaviour of the system better and to identify the importance of specific components of the system in providing a level of post-closure safety that meets the relevant regulatory compliance criteria.
0.04 Assessment Bounding Conditions14 0.4.01 Assessment timeframe – Yes, see Sections 2.7 and 4.2. Calculations are undertaken out to a time
when it can be demonstrated that the peak value of the primary safety indicator (dose) has been passed. Institutional control period assumed to last 30 years after closure.
15 0.4.02 Assessment domain – Yes, see Sections 3 and 4.2.1. Assumed to be limited to the immediate vicinity of the disposal borehole (i.e. within a radius of about 100 m) since a water abstraction borehole is assumed to be sunk 100 m from the disposal borehole and the water used for domestic and agricultural purposes by humans.
126

16 0.4.03 Future human action assumptions – Yes, see Sections 3.3 and 4.2.1. No consideration is given to the development of new societal structures and technologies.
17 0.4.04 Future human behaviour (target group) assumptions – Yes, see Sections 3.3 and 4.2.1. It is assumed that humans are exposed once institutional control of the site is lost either due to use contaminated groundwater abstracted from a borehole sunk 100 m from the disposal borehole, or due inhalation of contaminated gas in dwelling constructed directly above the disposal borehole.
18 0.4.05 Target audience (Stakeholder involvement) – Yes, see Section 2.3. Two audiences are considered – “developers” and “regulators”.
19 0.4.06 Assessment endpoints – Yes, see Sections 2.5 and 6. Primary end points are waste activity levels, which can be expressed as total activity values and per waste package activity values.
20 0.4.07 Dose response assumptions – No, see Section 2.5. Risks of deleterious health effects are not considered as end points in the current study.
21 0.4.08 Results, presentation of – Yes, see Section 6. Results presented in tabular form.22 0.4.09 Disposal Facility Assumptions – Yes, see Sections 3.1 and 4.2.1. It is assumed that the disposal
borehole is constructed, operated and closed as planned.
1 EXTERNAL FACTORS
1.1 Disposal Facility Factors23 1.1.01 Investigations, site – Yes, although the assessment is generic and therefore it is assumed that there
is no site-specific information available from site investigation (see Section 3.2), data (e.g. hydraulic gradients, conductivities, porosities) are presented in Section 3.2 that implicitly assumed that there has been some site investigation of the synthesised sites. It is assumed that any investigation boreholes have been appropriately backfilled and do not compromise the long-term safety of the disposal system.
24 1.1.02 Design, disposal facility – Yes, see Section 3.1.2 and Table 4. It is assumed that the disposal borehole is designed with appropriate safety features and functions.
25 1.1.03 Schedule and planning – Yes, see Sections 3.1.2 and 4.2.1. It is assumed that the disposal borehole is constructed, operated and closed as planned.
26 1.1.04 Construction, disposal facility – Yes, see Sections 3.1.2 and 4.2.1. It is assumed that the disposal borehole is constructed as planned.
27 1.1.05 Operation, disposal facility – Yes, see Sections 3.1.2 and 4.2.1. It is assumed that the disposal borehole is operated as planned.
28 1.1.06 Closure, disposal facility – Yes, see Sections 3.1.2 and 4.2.1. It is assumed that the disposal borehole is closed as planned.
29 1.1.07 Institutional controls – Yes, see Sections 2.7 and 4.2.1. It is assumed that institutional controls are in place for a period of 30 years after closure.
30 1.1.08 Quality assurance – Yes, see Section 4.2.1. It is assumed that appropriate quality assurance is applied to the design, construction, operation and closure of the disposal borehole.
31 1.1.09 Administrative control, disposal facility – Yes, see Sections 2.7 and 4.2.1. It is assumed that institutional controls are in place during the construction, operation and closure of the disposal borehole and for a period of 30 years after closure.
32 1.1.10 Accidents and unplanned events – No, see Section 4.2.1. It is assumed that the disposal borehole is closed as planned and there are no accidents or unplanned events.
33 1.1.11 Retrievability – No, see Section 3.1.2. Each waste package is backfilled into the borehole immediately following its emplacement.
34 1.1.12 Motivation and knowledge issues – Yes, see Section 4.2.1. It is assumed that no markers are fixed at the site to reveal the location of a radioactive waste disposal facility but land use controls are in place during the institutional control period.
35 1.1.13 Nuclear Criticality – No, such effects are considered to be insignificant for the typical inventories to be disposed.
1.2 Geological Processes and Effects36 1.2.01 Tectonic movement – No, see Sections 3.2 and 4.2.1. It is assumed that the disposal borehole is
located in a geologically stable area with no or extremely limited tectonic activity over the timescales of interest in the safety assessment.
127127127
37 1.2.02 Orogeny – No, see Sections 3.2 and 4.2.1. It is assumed that the disposal borehole is located in geologically stable area and there is no orogenic activity over the timescales of interest in the safety assessment.
38 1.2.03 Seismicity – No, see Sections 3.2 and 4.2.1. It is assumed that the disposal borehole is located in a geologically stable area with no or extremely limited seismic activity over the timescales of interest in the safety assessment.
39 1.2.04 Volcanic and magmatic activity – No, see Sections 3.2 and 4.2.1. It is assumed that the disposal borehole is located in geologically stable area and there is no volcanic and magmatic activity over the timescales of interest in the safety assessment.
40 1.2.05 Metamorphism – No, see Sections 3.2 and 4.2.1. It is assumed that the disposal borehole is located in geologically stable area and there is no metamorphic activity over the timescales of interest in the safety assessment.
41 1.2.06 Hydrothermal activity – No, see Sections 3.2 and 4.2.1. It is assumed that the disposal borehole is located in geologically stable area and there is no hydrothermal activity over the timescales of interest in the safety assessment.
42 1.2.07 Erosion and sedimentation – Yes, see Sections 3.2, 3.3, 4.1 and 4.2.1. It is assumed that there is gradual net erosion on a regional and local scale.
43 1.2.08 Diagenesis – No, diagenesis is not considered to be a significant process affecting the disposal system over the depths and timescales of interest in the safety assessment.
44 1.2.09 Pedogenesis – Yes, see Section 3.3 and 4.2.1. Need to consider soil contaminated by irrigation water.
45 1.2.10 Salt diapirism and dissolution – No, assume disposal borehole is located in an area that has no natural resources requiring excavation by extensive surface excavation or underground mining (see Section 3.2).
46 1.2.11 Undetected geological features – No, see Section 4.1. The geosphere is assumed to be as described in Section 3.2 with no unexpected features, processes or events.
47 1.2.12 Hydrological/hydrogeological response to geological changes – No, see Sections 3.2 and 4.2.1. It is assumed that the disposal borehole is located in geologically stable area and there are no significant geological changes over the timescales of interest in the safety assessment.
48 1.2.13 Geomorphologic responds to geological changes – No, see Sections 3.2 and 4.2.1. It is assumed that the disposal borehole is located in geologically and geomorphologically stable area and there are no significant changes over the timescales of interest in the safety assessment.
1.3 Climate Processes and Effects49 1.3.01 Climate change, global – No, see Section 4.1. Constant climate conditions are assumed (a
simplifying assumption).50 1.3.02 Climate change, regional and local – No, see Section 4.1. Constant climate conditions are assumed
(a simplifying assumption).51 1.3.03 Sea level change – No, see Section 3.3. It is assumed that the site is located in a position that will
not be susceptible to possible future sea level rises.52 1.3.04 Periglacial effects – No, see Section 3.3. No consideration of extreme conditions such as
permafrost.53 1.3.05 Glacial and ice sheet effects, local – No, see Section 3.3. No consideration of extreme conditions
such as glaciation.54 1.3.06 Warm climate effects (tropical and desert) – Yes, see Section 3.3. It is assumed that the climate is
consistent with the assumption of subsistence agriculture land use. Such land use is possible in tropical climates and, if there is a sufficient supply of freshwater, arid conditions.
55 1.3.07 Hydrological/hydrogeological response to climate changes – No, since constant climate conditions are assumed (see Section 4.1).
56 1.3.08 Ecological response to climate changes – No, since constant climate conditions are assumed (see Section 4.1).
57 1.3.09 Human behavioural response to climate changes – No, since constant climate conditions are assumed (see Section 4.1).
58 1.3.10 Geomorphologic responds to climate changes – No, since constant climate conditions are assumed (see Section 4.1).
1.4 Future Human Actions
128

59 1.4.01 Human influences on climate – No, since constant climate conditions are assumed (see Section 4.1).
60 1.4.02 Knowledge and motivational issues (Disposal facility) – Yes, see Section 4.2.1. It is assumed that no markers are fixed at the site to reveal the location of a radioactive waste disposal facility but land use controls are in place during the institutional control period to prevent human intrusion. The impact of deliberate human intrusion is considered to be beyond the scope of the current assessment (Section 1.3).
61 1.4.03 Drilling activities (human intrusion) – Yes, see Sections 3.2, 4.1 and 4.2.1. It is assumed that a water abstraction borehole is drilled 100 m from the disposal borehole and only once there is no institutional control over the site.
62 1.4.04 Mining and other underground activities (human intrusion) – No, see Sections 3.2 and 3.3. It is assumed that the disposal borehole is located in an area that has no natural resources requiring excavation by extensive underground mining. Furthermore, human activities are assumed to be limited to agricultural activities.
63 1.4.05 Un-intrusive site investigation – No, see Sections 3.2 and 3.3. It is assumed that the disposal borehole is located in an area that has no natural resources and human activities are assumed to be limited to agricultural activities. Therefore, it is considered that there is no un-intrusive site investigation.
64 1.4.06 Surface excavations – No, see Sections 3.2 and 3.3. The disposal zone is assumed to be at least 30 m below the ground surface and it is considered that any surface excavations associated with agricultural land use will not extend down to such depths.
65 1.4.07 Pollution – No, it is assumed that human activities do not significantly affect the disposal system.66 1.4.08 Site Development – Yes, see Sections 3.2, 4.1 and 4.2.1. It is assumed that a water abstraction
borehole is drilled 100 m from the disposal borehole and only once there is no institutional control over the site.
67 1.4.09 Archaeology – No, see Section 3.3. Human activities are assumed to be limited to agricultural activities.
68 1.4.10 Water management (wells, reservoirs, dams) – Yes, see Sections 3.2, 4.1 and 4.2.1. It is assumed that a water abstraction borehole is drilled 100 m from the disposal borehole and only once there is no institutional control over the site.
69 1.4.11 Social and institutional developments – Yes, see Sections 2.7, 3.3 and 4.2.1. It is assumed that land use controls are in place during the institutional control period to prevent human intrusion. But at the end of the period, controls are assumed to be no longer in place.
70 1.4.12 Technological developments – No, see Sections 3.3 and 4.2.1. No consideration is given to the development of new technologies.
71 1.4.13 Remedial actions – No, see Sections 2.7 and 4.2.1. It is assumed that the disposal system performs appropriately and so there is no need for remedial actions during the period of active institutional control.
72 1.4.14 Explosions and crashes – No, it is assumed that there are no explosions or crashes.
2 DISPOSAL SYSTEM DOMAIN FACTORS
2.1 Waste, Waste Form & Engineered Features73 2.1.1 Inventory, waste – Yes, see Section 3.1.1 and Appendix V. Assume a unit inventory of 1 TBq per
waste package of each of the emboldened radionuclides in Table 3 is disposed in the borehole.
74 2.1.2 Waste form materials, characteristics and degradation processes – Yes, see Sections 3.1.1, 3.1.2 and 4.2.1 and Appendix V. See Tables 4, 5 and 11 and Figs 2, 3 and 4 for details.
75 2.1.3 Container materials, characteristics and degradation/failure processes – Yes, see Sections 3.1.2 and 4.2.1 and Appendix V. See Tables 4, 5 and 11 and Figs 2, 3 and 4 for details.
76 2.1.4 Buffer/backfill materials, characteristics and degradation processes – Yes, see Sections 3.1.2 and 4.2.1 and Appendix V. See Tables 4, 5 and 11 and Figs 2, 3 and 4 for details.
77 2.1.5 Other engineered barrier system characteristics and degradation processes – Yes, see Sections 3.1.2 and 4.2.1 and Appendix V. See Tables 4, 5 and 12 and Figs 2, 3 and 4 for details.
2.2 Geological Environment
129129129
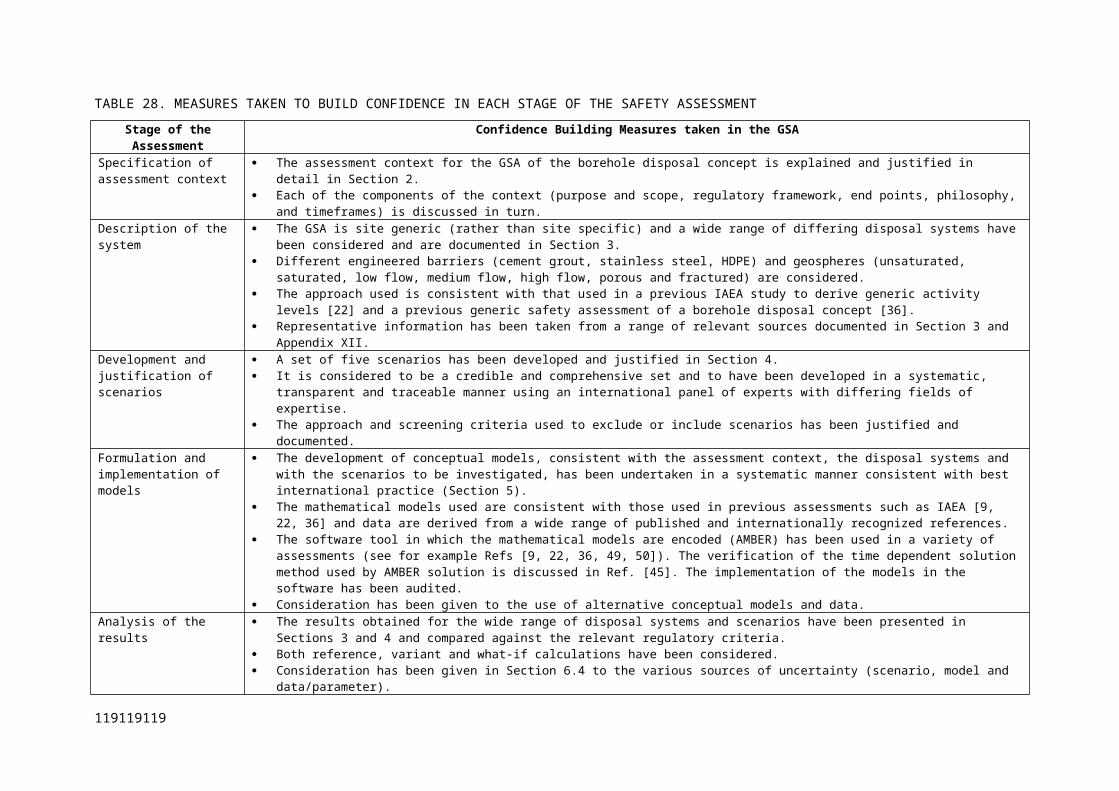
78 2.2.1 Stratigraphy – Yes, see Sections 3.2, 4.1 and 4.2.1. Although there is no explicit consideration of the stratigraphy of the synthesised geospheres, it is noted that the geology is not homogeneous, although any variation can be adequately represented through the use of averaged hydrological and geochemical parameter values. For disposal in the unsaturated zone, a total depth of unsaturated zone of 90 m is assumed. For disposal in the saturated zone, a total depth of saturated zone of 50 m is assumed. Characteristics are not assumed to change with time (see Section 4.2.1).
79 2.2.2 Host lithology – Yes, see Sections 3.2, 3.4, 4.1 and 4.2.1. Key physical characteristics of synthesised geospheres are summarized in Table 7. Characteristics are not assumed to change with time (see Section 4.2.1).
80 2.2.3 Disturbed zone, host lithology – Yes, see Section 3.2, 4.1 and 4.2.1. Disturbed zone is assumed to be part of the near field. Voids and cracks in the host geology immediately adjacent to the borehole are assumed to be grouted and sealed during the drilling process.
81 2.2.4 Discontinuities, large scale (in geosphere) – No, it is assumed that there are no large-scale discontinuities.
82 2.2.5 Contaminant migration path characteristics (in geosphere) – Yes, see Sections 3.2 and 4.2.1. Consider both porous and fracture flow and transport in the unsaturated and saturated geosphere. Characteristics are not assumed to change with time (see Section 4.2.1).
83 2.2.6 Mechanical processes and conditions (in geosphere) – No, it is assumed that there are no significant mechanical processes and conditions affecting the geosphere and that the disposal borehole will not affect the mechanical properties of the geosphere.
84 2.2.7 Hydraulic/hydrogeological processes and conditions (in geosphere) – Yes, see Sections 3.2, 3.4 and 4.2.1. A range of conditions is considered (see Tables 7, 8 and 9). Conditions are not assumed to change with time (see Section 4.2.1).
85 2.2.8 Chemical/geochemical processes and conditions (in geosphere) – Yes, see Sections 3.2, 3.4 and 4.2.1. Conditions in the geosphere are assumed not to change with time.
86 2.2.9 Biological/biochemical processes and conditions (in geosphere) – Yes, see Sections 3.2, 3.4 and 4.2.1. Conditions in the geosphere are assumed not to change with time.
87 2.2.10 Thermal processes and conditions (in geosphere) – No, see Sections 2.5, 3.2, 3.4 and 4.2.1. It is assumed that there are no significant sources of thermal heat in the geosphere and that the inventory does not significantly affect the thermal properties of the geosphere.
88 2.2.11 Gas sources and effects (in geosphere) – No, see Section 3.2. It is assumed that there are no significant sources of geothermal heat or gas in the vicinity of the disposal borehole.
89 2.2.12 Geological resources (in geosphere) – Yes, see Sections 3.2, 4.1 and 4.2.1. Water assumed to be abstracted from the geosphere.
2.3 Surface Environment90 2.3.1 Topography and morphology – Yes, see Section 3.3. It is assumed that the biosphere has subdued
relief.91 2.3.2 Biomes – Yes, see Sections 3.3 and 4.2.1. It is assumed that a range of crops and livestock is raised
consistent with the assumption of subsistence agriculture in non-extreme climate conditions. Assume contamination due to irrigation of crops and watering of animals.
92 2.3.3 Soil and sediment – Yes, see Sections 3.3 and 4.2.1. It is assumed that soils have similar mineralogical properties to those of the underlying geosphere from which they are assumed to have been derived. It is also assumed that they are capable of supporting a range of crops. Assume contamination due to irrigation of crops.
93 2.3.4 Aquifers and water-bearing features, near surface – Yes, see Sections 3.3, 4.1 and 4.2.1. Water assumed to be abstracted from the geosphere.
94 2.3.5 Terrestrial surface water bodies – No, see Section 3.3. Interest limited to water in abstraction borehole.
95 2.3.6 Coastal features – No, see Section 3.3. Disposal borehole is assumed to be located in a position that will not be susceptible to coastal processes.
96 2.3.7 Marine features – No, see Section 3.3. Disposal borehole is assumed to be located in a position that will not be susceptible to coastal processes and possible future sea level rises and so marine features are not considered to be relevant.
97 2.3.8 Atmosphere – Yes, see Section 4.2.1. Needs to be considered for the suspension of contaminated soil and gas inhalation pathways.
98 2.3.9 Vegetation – Yes, see Sections 3.3 and 4.2.1. It is assumed that a range of crops is raised consistent with the assumption of subsistence agriculture in non-extreme climate conditions.
130
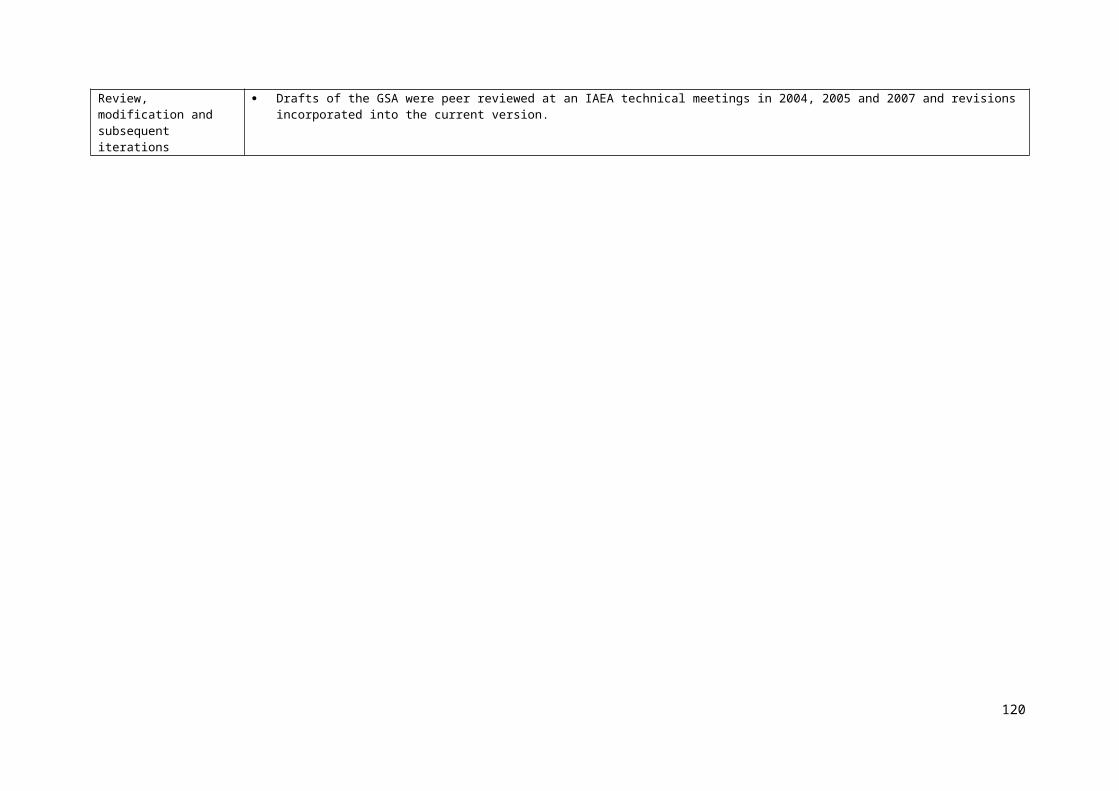
99 2.3.10 Animal populations – Yes, see Sections 3.3 and 4.2.1. It is assumed that a range of animals is raised consistent with the assumption of subsistence agriculture in non-extreme climate conditions.
100 2.3.11 Meteorology – Yes, see Section 3.3. It is assumed that the climate is consistent with the assumption of subsistence agriculture land use and is non-extreme.
101 2.3.12 Hydrological regime and water balance (near-surface) – Yes, see Section 3.2. Infiltration into the geosphere influences leaching of radionuclides from contaminated soil and the flux of water in the geosphere.
102 2.3.13 Erosion and deposition – Yes, see Sections 3.2, 3.3, 4.1 and 4.2.1. It is assumed that there is gradual net erosion on a regional and local scale resulting in the loss of the closure zone over a 100,000 year period.
103 2.3.14 Ecological/biological/microbial systems – Yes, see Sections 3.3 and 4.2.1. It is assumed that a range of crops is grown, consistent with the assumption of subsistence agriculture in non-extreme climate conditions. It is assumed that the crops are grown on soil contaminated with water from the abstraction borehole.
104 2.3.15 Animal/Plant intrusion – No, see Section 4.2.1. Given the assumed low erosion rate and the depth of the disposal zone it is considered that there is no need to consider biotic intrusion.
2.4 Human Behaviour105 2.4.1 Human characteristics (physiology, metabolism) – Yes, see Section 5.4. Implicitly considered in
dose factors for ingestion and inhalation of radionuclides.106 2.4.2 Adults, children, infants and other variations – Yes, see Section 2.5. Consider annual individual
effective dose to an average adult member of a hypothetical critical group.107 2.4.3 Diet and fluid intake – Yes, see Sections 3.3 and 4.2.1. Ingestion of contaminated water, crops and
animal produce.108 2.4.4 Habits (non-diet-related behaviour) – Yes, see Sections 3.3 and 4.2.1. The assumed human habits
give raise to exposure via ingestion of crops, soil and animal products, inhalation of gases and dust, and external irradiation from contaminated soil.
109 2.4.5 Community characteristics – Yes, see Sections 3.3 and 4.2.1. Assume a subsistence agriculture community. Two exposure groups considered: farmer and house dweller.
110 2.4.6 Food preparation and water processing – Yes, see Sections 3.3 and 4.2.1. Although it is assumed that the abstracted water used is not treated or stored before use, food is assumed to be processed before consumption.
111 2.4.7 Dwellings – Yes, see Sections 3.3 and 4.2.1. At end of institutional control period, it is assumed that a dwelling can be constructed above the disposal borehole.
112 2.4.8 Natural/semi-natural land and water use – No, see Sections 3.3 and 4.2.1. Assume subsistence agriculture rather than natural/semi-natural land use.
113 2.4.9 Rural and agricultural land and water use – Yes, see Sections 3.3 and 4.2.1. Assume subsistence agriculture and abstracted groundwater used for domestic and agricultural purposes.
114 2.4.10 Urban and industrial land and water use – No, see Sections 3.3 and 4.2.1. Assume subsistence agriculture rather than urban and industrial land use.
115 2.4.11 Leisure and other uses of environment – No, see Sections 3.3 and 4.2.1. Assume subsistence agriculture rather than leisure or other use.
3 CONTAMINANT FACTORS
3.1 Contaminant Characteristics116 3.1.1 Radioactive decay and in-growth – Yes, see Section 3.1.1 and Appendix I.117 3.1.2 Radionuclide properties, other – Yes, see Section 3.1.1. It is assumed that the radionuclides in the
disused sources are in a physical state that means that they are soluble.118 3.1.3 Organics and potential for organic forms – No, it is assumed that there is no significant organic
component in the waste.119 3.1.4 Chemical/organic toxin stability – No, see Sections 1.3 and 2.2.4. Non-radiological impacts, which
might arise from the content of chemically or biologically toxic materials in the waste or engineered barrier materials, are considered to be beyond the scope of the GSA.
120 3.1.5 Inorganic solids/solutes – Yes, see Section 3.1.1 and FEP 3.1.2.121 3.1.6 Volatiles and potential for volatility – Yes, see Section 3.1.1. Iodine is potentially volatile.122 3.1.7 Noble gases – Yes, Rn-222 in-grown from Ra-226 (see Table A.4).
131131131
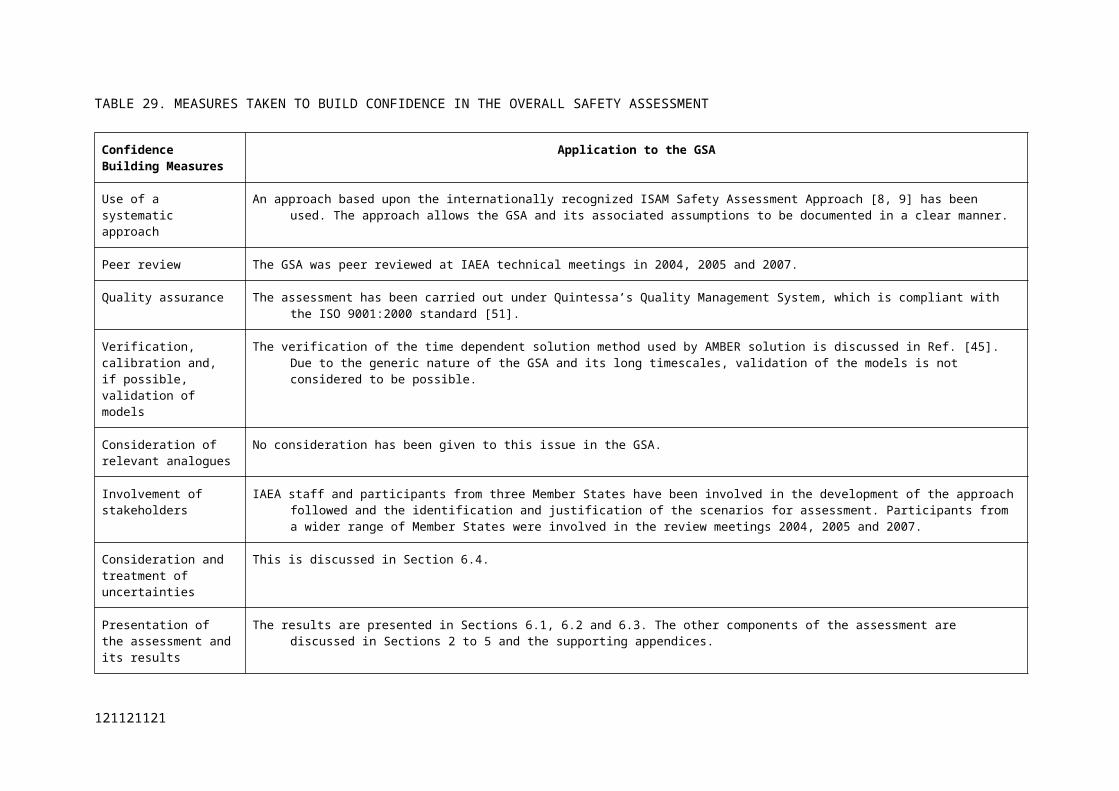
3.2 Contaminant Release and Migration Factors123 3.2.1 Contaminant release pathways – Yes, see Section 4.2.1. Consideration is given to releases via
water and gas pathways.124 3.2.2 Chemical/geochemical-mediated processes, effects on contaminant release and migration – Yes,
see Sections 3.1, 3.2 and 4.2.1. Consideration is given to a range of near-field and geosphere chemical conditions and sorption processes.
125 3.2.3 Microbial/biological-mediated processes, effects on contaminant release and migration – No, assume no need to represent microbial/biological-mediated processes explicitly. However, these processes are implicitly represented through considering a range of near-field and geosphere chemical conditions (see Sections 3.1.3 and 3.2).
126 3.2.4 Water-mediated migration of contaminants – Yes, see Sections 3.2 and 4.2.1. Consideration given to advection, dispersion and diffusion.
127 3.2.5 Solid-mediated migration of contaminants – Yes, see Section 4.2.1. Erosion of soil contaminated by irrigation water considered. Soil assumed to be contaminated with radionuclides from borehole once closure zone is removed by erosion (after 100 000 years).
128 3.2.6 Gas-mediated migration of contaminants – Yes, see Section 4.2.1. Scenario considers release of radionuclides in the gas phase from the borehole.
129 3.2.7 Atmospheric migration of contaminants – Yes, see Section 4.2.1. Scenario considers release of contaminated gas into a dwelling and suspension and dispersion of soil contaminated by irrigation water considered.
130 3.2.8 Animal, plant and microbe mediated migration of contaminants – Yes, see Section 4.2.1. Irrigation of crops and watering of animals considered.
131 3.2.9 Colloids mediated migration of contaminant – No. Assume that in systems with a cement grout near field, colloids are not readily formed due to the chemical conditions.
3.3 Exposure Factors132 3.3.1 Food chains, uptake of contaminants in – Yes, see Sections 3.3 and 4.2.1. Ingestion of
contaminated crops and animal produce considered.133 3.3.2 Drinking water, foodstuffs and drugs, contaminant concentrations in – Yes, see Sections 3.3 and
4.2.1. Scenario includes consideration of the consumption of contaminated drinking water, crops and animal produce and inhalation of contaminated gas.
134 3.3.3 Environmental media, contaminant concentrations in – Yes, see Section 4.2.1. Need to consider contaminant concentrations in soil, air, crops and animals.
135 3.3.4 Non-food products, contaminant concentrations in – No, see Sections 3.3 and 4.2.1. Humans are assumed not to be exposed via non-food products for the scenario.
136 3.3.5 Exposure modes – Yes, see Sections 3.3 and 4.2.1. Scenario includes consideration of the ingestion, inhalation gas and external irradiation.
137 3.3.6 Dosimetry – Yes, see Sections 2.4 and 2.5. Consider annual individual effective dose to an average adult member of a hypothetical critical group.
138 3.3.7 Radiological toxicity/effects – Yes, see Sections 2.4 and 2.5. Consider annual individual effective dose to an average adult member of a hypothetical critical group.
139 3.3.8 Chemical toxicity/effects – No, see Sections 1.3 and 2.2.4. Non-radiological impacts, which might arise from the content of chemically or biologically toxic materials in the waste or engineered barrier materials, are considered to be beyond the scope of the GSA.
140 3.3.9 Radon and radon daughter exposure – Yes, see Section 4.2.1. Rn-222 in-grows from Ra-226.
132

Appendix VDETAILED NEAR-FIELD FEP LIST
Category FEP FEP
2.1 Waste, Waste Form & Engineered Features
2.1.1 Waste inventory
2.1.1.1 Radionuclide content
2.1.1.2 Chemical content
2.1.2 Source characteristics and degradation processes
2.1.2.1 Characteristics of sources
2.1.2.2 Degradation of metallic sources
2.1.2.3 Degradation of ceramic and glass sources
2.1.2.4 Degradation of powder sources
2.1.2.5 Degradation of gas and liquid sources
2.1.3 Container characteristics and degradation/failure processes
2.1.3.1 Characteristics of containers
2.1.3.2 General corrosion
2.1.3.3 Localized corrosion
2.1.3.4 Stress corrosion cracking
2.1.3.5 Corrosion fatigue
2.1.3.6 Hydrogen-related effects
2.1.3.7 Galvanic corrosion
2.1.3.8 Weld attack
2.1.4 Backfill characteristics and degradation processes
2.1.4.1 Characteristics of backfill
2.1.4.2 Chloride attack
2.1.4.3 Sulphate attack
2.1.4.4 Carbonation
2.1.5 Other engineered features: characteristics and degradation processes
2.1.5.1 HDPE casing
2.1.5.2 Centralisers
2.1.5.3 Anti-intrusion barrier
2.1.5.4 Native soil/crushed rock
2.1.6 Mechanical processes and conditions
2.1.6.1 Container collapse
2.1.6.2 Material volume changes
2.1.6.3 Fracturing of cement grout
2.1.7 Hydrological processes and conditions
2.1.7.1 Infiltration and movement of water in the borehole
2.1.7.2 Degree of saturation
134
Category FEP FEP
2.1.7.3 Resaturation of the borehole
2.1.7.4 Gas mediated water flow
2.1.7.5 Coupled hydraulic processes including temperature, chemical or electrical gradients
2.1.8 Chemical processes and conditions
2.1.8.1 pH conditions
2.1.8.2 Redox conditions
2.1.8.3 Chloride and sulphate conditions
2.1.8.4 Mineralization change
2.1.8.5 Effects of chelating agents
2.1.8.6 Colloid formation
2.1.8.7 Precipitation/dissolution reactions (solubility limitation)
2.1.9 Biological processes and conditions
2.1.9.1 Microbial growth and poisoning
2.1.9.2 Microbially/biologically mediated processes
2.1.9.3 Microbial/biological effects of evolution of redox and pH
2.1.10 Thermal processes and conditions
2.1.10.1 Radiogenic, chemical and biological heat production from the wastes
2.1.10.2 Chemical heat production from engineered features
2.1.10.3 Temperature evolution
2.1.10.4 Temperature dependence of processes
2.1.11 Radiation effects
2.1.11.1 Effects on containers
2.1.11.2 Effects on cement grout
2.1.11.3 Effects on other engineered features
2.1.11.4 Effects on pH
2.1.11.5 Effects on redox
2.1.11.6 Decay product gas generation
2.1.12 Gas sources and effects
2.1.13 Extraneous materials
V.1. WASTE, WASTE FORM & ENGINEERED FEATURES
V.1.1. Waste inventory
135135135
V.1.1.1. Radionuclide content
Description – Mass of radioactive material disposed in the borehole.
Treatment in GSA – Unit inventory of 1 TBq per waste package is assumed for each of the 12
radionuclides that appear in bold font in Table 3. The change in radionuclide inventories due to
radioactive decay and ingrowth after disposal is taken into account.
Inclusion of FEP – Included in all scenarios.
V.1.1.2. Chemical content
Description – Mass of non-radioactive material disposed in the borehole.
Treatment in GSA – Chemical contaminants are not considered in the GSA since non-radiological
impacts, which might arise from the content of chemically or biologically toxic materials in the
disused sources are beyond the scope of the GSA (see Section 1.3 and 2.4).
Inclusion of FEP – Excluded in all scenarios.
V.1.2. Source characteristics and degradation processes
V.1.2.1. Characteristics of sources
Description – The physical and chemical characteristics of the disused sources at the time of disposal
and evolution of these properties with time. This includes processes that are relevant specifically as
sources degradation processes, rather than processes that contribute to the general evolution of the
borehole.
Treatment in the GSA – Table 12 summarizes the characteristics of the sources considered in
the GSA. A range of different physical and chemical forms is considered including metallic, ceramic,
glass, powder, gas and liquid.
Inclusion of FEP – Included in all scenarios.
V.1.2.2. Degradation of metallic sources
Description – Some of the sources considered in the GSA can occur in metallic form (e.g. Co-60, see
Table 12). The metal will corrode with time resulting in the release of radionuclides into water and the
generation of hydrogen gas.
Treatment in the GSA – Degradation of the metallic sources is assumed to occur once the capsule
containing the source and the failed source container is breached, allowing the entry of water and its
contact with the source. Degradation occurs through various corrosion processes (see FEP 2.1.3)
resulting in the release of radionuclides into water. It is considered that the amount of hydrogen gas
generated is small in comparison to that generated by the corrosion of the capsule and disposal
container.
136
Inclusion of FEP – Included in all scenarios.
V.1.2.3. Degradation of ceramic and glass source
Description – Some of the sources considered in the GSA can occur in ceramic or glass form (e.g. Sr-
90, see Table 12). The ceramic/glass will dissolve with time resulting in the release of radionuclides
into water.
Treatment in the GSA – Dissolution of the ceramic/glass sources is assumed to occur once the capsule
containing the source and the failed source container is breached, allowing the entry of water and its
contact with the source. The rate of dissolution will be affected by the geochemical conditions in the
borehole.
Inclusion of FEP – Included in all scenarios.
V.1.2.4. Degradation of powder sources
Description – Some of the sources considered in the GSA can occur as powders (e.g. Cs-137 and Ra-
226, see Table 12). The powder will dissolve with time resulting in the release of radionuclides into
water. For soluble powders (e.g. Ra-226), the dissolution will be instantaneous on contact with water.
Treatment in the GSA – Dissolution of the powder sources is assumed to occur once the capsule
containing the source and the failed source container is breached, allowing the entry of water and its
contact with the source. The GSA takes account of the solubility of the powder under the various
geochemical conditions assessed.
Inclusion of FEP – Included in all scenarios.
V.1.2.5. Degradation of gas and liquid sources
Description – Some of the sources considered in the GSA can occur as gas (e.g. H-3 and Kr-85, see
Table 12) and liquid (e.g. H-3, see Table 12).
Treatment in the GSA – No degradation of the gas and liquid is assumed to occur other than
radioactive decay (see FEP 3.1.1). Once the capsule containing the source and the failed source
container is breached, it is assumed that the gas and liquid are released immediately.
Inclusion of FEP – Excluded in all scenarios (other than radioactive decay - see FEP 3.1.1).
V.1.3. Container characteristics and degradation/failure processes
V.1.3.1. Characteristics of containers
Description – The characteristics of the various containers in which the disused sources are enclosed.
Treatment in the GSA – Three “containers” are identified in Section 3.1.2 for use in the borehole
disposal concept.
137137137
The source container within which the source material is sealed. It is conservatively assumed
that the source container will have failed prior to disposal and so no credit is taken for it.
The Type 304 stainless steel capsule containing the source container. Until breached, it isolates
source container from water, animals and humans and prevents escape of gas from source
container. Once breached, it limits fraction of radionuclides available for release from the
capsule until the entire capsule has been corroded.
The Type 316 L stainless steel disposal container, which contains the capsule and containment
barrier. Until breached, it isolates source container, capsule and containment barrier from water,
animals and humans. Once it and the capsule are both breached, the disposal container can limit
the fraction of radionuclides available for release into the borehole until the entire container has
been corroded.
For the Design Scenario, it is assumed that none of the closure welds on the capsule and disposal
container are defective. For Defect Scenario D1, it is assumed that the closure weld in one 316 L
dipsosal container is defective. For Defect Scenario D2, it is assumed that the closure weld in one
304 capsule is defective. For Defect Scenario D4, it is assumed that the closure weld in one 316 L
disposal container and one 304 capsule and the faulty capsule is in the faulty container.
Inclusion of FEP – Capsule and disposal container included in all scenarios. Source container
excluded from all scenarios.
V.1.3.2. General corrosion
Description – Stainless steels are subject to general corrosion at a rate that varies with time,
temperature, redox conditions, pH, and salinity. Stainless steels are protected by the formation of a
stable Cr(III) oxide or hydroxide film (variously represented by Cr2O3, Cr(OH)3, or CrOOH).
On freshly polished surfaces, the corrosion rate will continue to decrease with time for several years
after exposure to the corrosive environment as the passive film develops. The film is typically
amorphous, although for some passive materials re-crystallization of the oxide can occur over time,
resulting in an increase in corrosion rate.
The general corrosion rate of stainless steel is typically not a strong function of the redox potential,
here interpreted in terms of the corresponding dissolved O2 concentration. Increasing [O2] leads to an
increase in ECORR, but provided the potential is within the passive range the corrosion rate is
determined more by the properties of the oxide film than by the rate of the cathodic reaction (the
reduction of O2). An increase in ECORR, however, will result in an increase in the potential drop across
the passive film and the “leakage current” (which corresponds to the rate of general corrosion) will
increase accordingly. In contrast, the corrosion rate of active materials may be proportional to the [O2]
if the rate of corrosion is cathodically limited.
138
The protectiveness of the passive film depends on the solution pH. The minimum solubility of Cr(III)
oxides lies between pH 7 and pH 8.5, depending upon the stable form. The solubility increases at both
lower and higher pH, although the rate of increase in solubility is much greater in acidic solutions.
Furthermore, the stability of the oxides of other alloying elements at higher pH maintains a stable
passive film in the alkaline range.
Chloride ions tend to de-stabilise the passive film on stainless steels. Although the effect of Cl - is most
significant for the initiation and propagation of localized corrosion, Cl - ions also tend to decrease the
stability of the passive oxide film and lead to an increase in general corrosion rate.
Treatment in the GSA – General corrosion of the stainless steel capsule and disposal container is one
of the main corrosion processes included in the GSA. The corrosion rate is taken to be a function of
redox potential, pH, and Cl- concentration (see FEP 2.1.8).
Isothermal conditions are assumed, so the temperature dependence of the general corrosion rate is not
considered (see FEP 2.1.10.4).
It is assumed that the general corrosion rate attains a steady state soon after emplacement of the waste
and does not change with time other than due to the evolution of porewater pH with time.
Inclusion of FEP – Included in all scenarios.
V.1.3.3. Localized corrosion
Description – Localized corrosion of stainless steels can take the form of discrete pitting of exposed
surfaces or of crevice corrosion in geometrically occluded regions or under surface deposits. Localized
attack is favoured by higher temperatures, lower pH, increased Cl- concentrations, and more-positive
ECORR (or EH) values. A number of oxyanions, including SO42-, inhibit the aggressive effect of Cl-.
The initiation of localized corrosion occurs if the corrosion potential ECORR exceeds the breakdown
potential of the passive film. Crevice corrosion tends initiate more easily than pitting as the occluded
region serves to both concentrate aggressive ions (such as Cl-) and also create a differential O2
concentration cell, leading to the spatial separation of anodic and cathodic reactions and the resulting
localized attack. Once initiated, a pit or crevice will continue to propagate until some process leads to
the loss of the critical pit or crevice chemistry and the cessation of corrosion. The rate of propagation
of localized corrosion can be several orders of magnitude higher than the rate of general corrosion.
Type 316L stainless steel is more resistant to localized corrosion than Type 304 because of the
addition of Mo. Molybdenum provides stability at low pH because of the formation of MoO2 or MoO3
phases which are stable in acidic solutions. Type 304 stainless steel can also become sensitised during
welding because of the formation of chromium carbides at grain boundaries, leading to an increased
susceptibility to intergranular SCC.
139139139
Once initiated, a crevice (as assumed here) will propagate through the wall thickness until perforation
of the shell occurs at a particular location within the crevice. Following initial perforation, the area of
through-wall corrosion will extend over the entire creviced region (provided the through-wall
penetration does not result in the loss of the critical crevice chemistry) and may extend beyond the
area of the original occluded region if precipitated corrosion product acts as its own crevice former.
Adjacent creviced regions may coalesce to produce larger defects in the container, although the rate of
crevice propagation will slow with time as the cathode:anode surface area ratio diminishes as more of
the container wall is corroded.
Treatment in the GSA – Localized corrosion is included in the GSA corrosion assessment as a failure
mechanism for the stainless steel waste capsule and disposal container.
Neither grade of stainless steel is deemed to be susceptibility to pitting or crevice corrosion during
Stage 1 or 2 of cement grout degradation because of the high pH of the cement grout porewater
contacting the capsule and disposal container. This conclusion is based on a comparison of reported
ECORR and breakdown potentials measured at high pH. During Stages 3 and 4, both materials may be
susceptible to localized corrosion in aerated groundwaters (in which ECORR exceeds the repassivation
potential for crevice corrosion) but not in anaerobic (reducing) waters. The concentration of Cl - is
sufficient to induce localized corrosion even in the fresh groundwaters considered in the GSA.
The conditions of potential, Cl- concentration, and pH for the initiation of localized corrosion have
been converted to an equivalent pH value. In this way, the time at which localized corrosion is
possible can be estimated from the time-dependence of the cement grout porewater pH.
To maintain conservatism, the potential at which localized corrosion initiates is taken to be 200 mV
more negative than the re-passivation potential for crevice corrosion. The conservatism in this
treatment arises from three factors (i) the choice of crevice corrosion rather than pitting (pitting occurs
at more positive potential), (ii) the selection of the re-passivation potential as the criterion for
initiation, and (iii) the use of a value 200 mV more negative than that reported to account for the
stochastic nature of re-passivation potentials.
Based on this approach, the equivalent pH values for the initiation of localized corrosion for
Types 304 and 316L stainless steel are taken to be pH 11 and pH 10 (or the background pH of the
groundwater for alkaline waters). The higher pH value for Type 304 stainless steel reflects the greater
susceptibility of this material to localized corrosion and the possibility of sensitisation of the capsule
closure weld.
Crevice propagation is not explicitly treated in the GSA corrosion analysis as the rate of corrosion is
relatively fast compared with the predicted container lifetimes. Based on reported crevice propagation
rates, through-wall perforation will occur within a few years of initiation. Growth of the perforation
(and of adjacent perforations) will occur at a similar rate, possibly leading to through-wall perforation
140
on most of the container surface within a period of, say, 100 years. This period is short compared with
the estimated lifetimes of >104 years. Therefore, no credit is taken for the remaining mass-transfer
resistance offered by the capsule and disposal container for the period between the initiation of
localized corrosion and such extensive localized attack that the vessel no longer restricts mass
transport into or out of the failed container.
Inclusion of FEP – Included in all scenarios.
V.1.3.4. Stress corrosion cracking
Description – Stress corrosion cracking (SCC) of stainless steels is known to occur in chloride
solutions. Cracking results from the presence of an applied tensile stress or from residual stress in
welds that have not undergone a stress-relief treatment.
Cracks typically initiate from pits and propagate relatively rapidly in a direction normal to the
principal tensile stress.
From an environmental viewpoint, the conditions that support cracking are more severe than those that
produce pitting of the exposed surface. Therefore, pitting and crevice corrosion occur at more-negative
potentials, lower Cl- temperatures, and/or lower temperatures than those at which cracking is observed.
Treatment in the GSA – SCC is not included as a failure mechanism in the GSA corrosion analysis.
The initiation (and relatively rapid propagation) of crevice corrosion is considered to occur under less
aggressive conditions than cracking (see FEP 2.1.3.3). Given that crevice propagation is rapid, failure
of the container will occur via this mechanism before failure by SCC.
Inclusion of FEP – Excluded in all scenarios.
V.1.3.5. Corrosion fatigue
Description – Corrosion fatigue is a result of the action of a corrosive environment and a cyclic load
resulting in cracking. The corrosion component enhances the crack growth rate that would otherwise
be observed in the absence of the environment (i.e., pure fatigue).
Treatment in the GSA – Corrosion fatigue is not included as a failure mechanism in the GSA
corrosion analysis because of the absence of cyclic loading of the capsule or disposal container.
Inclusion of FEP – Excluded in all scenarios.
V.1.3.6. Hydrogen-related effects
Description – Many metals are susceptible to failure due to the absorption of atomic hydrogen. Failure
often takes the form of cracks or blisters due to the accumulation of atomic or molecular hydrogen at
defects in the material. Ferritic steels are particular susceptible to hydrogen effects because of the high
diffusivity of hydrogen. The susceptibility to hydrogen damage generally increases with increasing
141141141
strength of the material because the higher potential stress gradients that can be created cause greater
segregation of absorbed hydrogen.
Austenitic stainless steels (such as Types 304 and 316L) are generally less susceptible to hydrogen
effects than ferritic materials (e.g., carbon or mild steels) because the diffusivity of hydrogen in the
austenite phase is several orders of magnitude lower than in the ferrite phase.
Treatment in the GSA – Hydrogen-related degradation mechanisms are not included in the corrosion
analysis for the GSA because of the generally lower susceptibility of austenitic stainless steels to
hydrogen effects.
Inclusion of FEP – Excluded in all scenarios.
V.1.3.7. Galvanic corrosion
Description – Galvanic corrosion occurs when two metals are coupled together in a conductive
medium. One of the metals acts as the anode and corrodes faster than if it were not coupled, and the
other metal becomes the cathode and corrodes more slowly. The severity of galvanic corrosion
depends on the separation of the two metals (in terms of mV) in the so-called galvanic series, the
relative surface areas of the materials, and the conductivity of the electrolyte.
Treatment in the GSA – Galvanic corrosion is not included in the corrosion analysis for the GSA
because of the apparent absence of dissimilar metal contacts for either the capsule or the disposal
container.
Inclusion of FEP – Excluded in all scenarios.
V.1.3.8. Weld attack
Description – Welds are often locations for preferential corrosion. The enhanced susceptibility of
welds results from (i) micro-scale galvanic cells that can be created due to the use of a dissimilar weld
material (ii) microstructural differences between the weld metal, heat-affected zone, and base metal, or
(iii) segregation of certain alloying elements to grain boundaries (sensitisation).
Stainless steels can be susceptible to preferential weld attack if steps are not taken to avoid the effects
listed above. Type 304 stainless steel is susceptible to intergranular attack or enhanced SCC due to
sensitisation of grain boundaries.
Treatment in the GSA – The possibility of enhanced susceptibility of sensitised welds for the
Type 304 capsule is implicitly included in the GSA corrosion analysis through the use of a higher pH
threshold for the initiation of localized corrosion.
Inclusion of FEP – Implicit in enhanced susceptibility of Type 304 capsules to the initiation of
localized corrosion assumed for all scenarios.
142
V.1.4. Backfill characteristics and degradation processes
V.1.4.1. Characteristics of backfill
Description – Chemical and physical characteristics of the backfill used in the borehole disposal
concept.
Treatment in the GSA – Cement “backfill” is used as a chemical and physical barrier in five locations
in the borehole disposal concept (see Section 3.1.2):
the containment barrier – the space between the capsule and the disposal container is backfilled
with cement grout;
the disposal zone backfill - cement grout is used to separate disposal containers in vertical
dimension from one another, and in the horizontal dimension from the borehole casing;
the disposal zone plug at base of borehole;
the disturbed zone backfill - cement grout is used to fill the gap between the casing and the host
rock and any voids/cracks in the host rock immediately adjacent to the borehole; and
the closure zone backfill – it is assumed that the first 5 m from the ground surface is native
soil/crushed rock and the remainder down to the disposal zone is cement grout.
For all scenarios other than Defect Scenario D3, it is assumed that cement grout emplaced under
appropriate QA/QC is present in all five locations. For Defect Scenario D3, it is assumed that the
cement grout in the disposal and disturbed zone has not been emplaced under appropriate QA/QC and
so degrades more rapidly.
Inclusion of FEP – Included in all scenarios.
V.1.4.2. Chloride attack
Description – The effect of chloride ions in groundwater coming into the borehole on the cement grout
backfill used in the borehole (e.g. Nielsen et al. 2005). Chloride will to some extent become bound to
solid phases as a consequence of reactions within the cement grout. Some chloride will form solid
compounds such as Friedel salts (Ca3Al2O6.CaCl2.10H2O) whilst some chloride will sorb to the
surfaces of calcium silicate hydrates (CSH). However, the extent to which this binding occurs will
depend upon the concentrations and characteristics of other constituents within the pore fluid. Notably
carbonate and sulphate will generally act to diminish the binding of chloride. The chemical
composition of the cement grout is also a significant control. In reality this process would have less
effect on the strength and pH-buffering capacity of the cement grout barrier than would attack by
sulphate and/or carbonate.
Treatment in the GSA – Chloride attack of the cement grout is not taken into account explicitly.
Instead illustrative calculations are undertaken in which the capacity for chemical buffering capacity
143143143
and ability to physically retard fluid flow is diminished in comparison with the reference case. These
calculations are designed to illustrate the possible significance of attack not only by chloride, but also
by sulphate and carbonate. Additionally, from the perspective corrosion, it is conservative to assume
that the concentrations of chloride in the porewater contacting the steel barriers would not be
diminished by reactions in the cement grout.
Inclusion of FEP – Included in all scenarios.
V.1.4.3. Sulphate attack
Description – The effect of sulphate ions in groundwater coming into the borehole on the cement grout
backfill used in the borehole. These ions diffusing into cements react with certain phases forming
larger volume products. Initially, this volume increase will reduce the interconnected porosity and
hence the permeability. However, once the volume increase has proceeded to the extent that it cannot
be accommodated by the porosity, there will be an overall internal expansion eventually causes stress,
cracking and exfoliation of the reacted zone (Francis et al. 1997). The range of reactions involved is
complex and depends on the conditions, particularly the concentration of sulphate. Ettringite and
gypsum are among the products. The attack depletes the reservoir of alkalinity (calcium hydroxide) in
the concrete. An overall effect of this is to reduce the capacity of cementitious backfill to buffer pH to
high values. To predict the behaviour of the cement grout and the temporal evolution of the porewater
chemistry would require the development of complex coupled models taking into account a complete
physical and chemical description of the cement grout-porefluid system. The detailed evolution of this
system will be case-specific.
Treatment in the GSA – It is assumed that sulphate resistant cement grout is used (see Section 3.1.2).
Nevertheless, sulphate attack will occur. However, it is not treated explicitly in the GSA. To do so
would be unjustified in the absence of site-specific and engineered barrier-specific information (e.g.
exact porewater composition, groundwater flow rate and cement grout composition) and without
developing detailed coupled models. Instead illustrative calculations are undertaken in which the
capacity for chemical buffering capacity and ability to physically retard fluid flow is diminished in
comparison with the reference case. These calculations are designed to illustrate the possible
significance of attack not only by sulphate, but also by chloride and carbonate.
Inclusion of FEP – Included in all scenarios.
V.1.4.4. Carbonation
Description – The effect of carbonate ions in groundwater coming into the borehole on the cement
grout backfill used in the borehole. However, to predict the overall influence of carbonate attack on
the behaviour of the cement grout and the temporal evolution of the porewater chemistry would
require the development of complex coupled models. Furthermore, these models would need to take
into account a complete physical and chemical description of the cement grout-porefluid system. The
144

detailed evolution of this system will be case-specific. The carbonate will tend to reduce the ability of
concrete to impose a high pH on borehole water (Francis et al. 1997), by reacting with the main source
of alkalinity, calcium hydroxide and by limiting access of the migrating porewater to reactive
cementitious phases. On its own this effect on pH would be detrimental with respect to the longevity
of the steel barriers. However, carbonation will also tend to seal the porosity which may decrease the
porosity of the cement grout, at least at relatively early times. Thus, the flux of water past the steel
barriers could be diminished, which would tend to enhance the longevity of these barriers.
Treatment in the GSA – Carbonation is not treated explicitly. To do so would be unjustified in the
absence of site-specific and engineered barrier-specific information (e.g. exact porewater composition,
groundwater flow rate and cement grout composition) and without developing detailed coupled
models. Instead illustrative calculations are undertaken in which the capacity for the chemical
buffering capacity and ability to physically retard fluid flow is diminished in comparison with the
reference case. These calculations are designed to illustrate the possible significance of attack not only
by carbonate, but also by chloride and sulphate.
Inclusion of FEP – Included in all scenarios.
V.1.5. Other engineered features: characteristics and degradation processes
V.1.5.1. HDPE casing
Description – High-density polyethylene (HDPE) casing emplaced at time of drilling to help ensure
the borehole is dry during emplacement of the disposal containers. Top sections are withdrawn at
closure of borehole down to 1 m of the disposal zone.
Treatment in the GSA – HDPE is subject to various corrosion processes leading to a loss of
mechanical integrity. The leaching of plasticizers results in embrittlement of the plastic and eventual
cracking and loss of structure. Some forms of HDPE are also susceptible to stress corrosion cracking.
Conservatively assumed HDPE casing fails immediately on closure of the borehole and so is not
represented in the post-closure GSA calculations. It is assumed that any binding between radionuclides
and organic products of the breakdown of the HDPE would have an insignificant effect on
radionuclide migration.
Inclusion of FEP – Implicitly included in all scenarios since it is a component of the reference design.
However it is not explicitly modelled in post-closure GSA calculations. There is little information with
which to judge whether or not organics released from the degradation of HDPE could complex with
radionuclides to the extent that the mobility of radionuclides is affected significantly. However,
IAEA (2006) notes that HDPE is being considered as a material for fabricating containers for some
kinds of radioactive wastes. No mention is made of the possible significance of complaxation between
breakdown products and radionuclides. It is tehrefore assumed that the chemical effects of HDPE
breakdown would be insignificant.
145145145
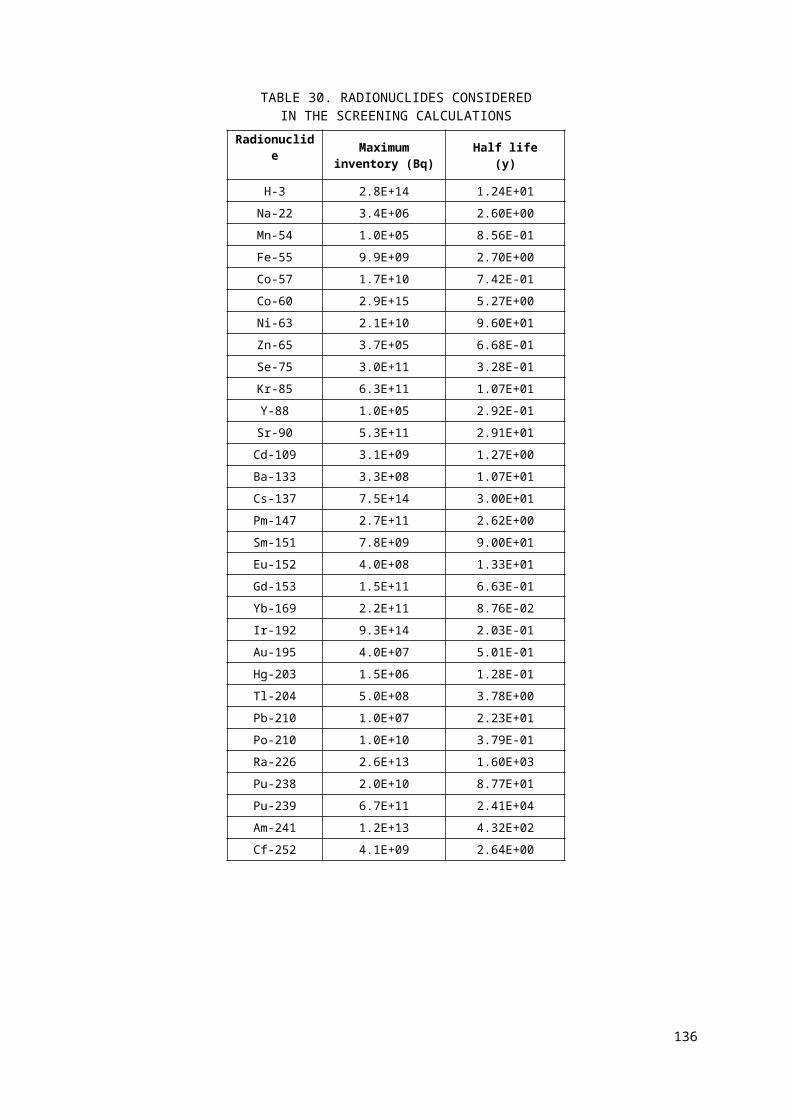
V.1.5.2. Centralisers
Description – The casing is fitted with centralisers to ensure that the casing is in the middle of the
borehole. These centralisers are made of thin mild steel plates inserted vertically to ensure that they do
not hamper the flow of the backfill slurry.
Treatment in the GSA – The centralisers will be subject to similar corrosion processes as the capsules
and disposal containers (see FEP 2.1.3). Since they are made of mild rather than stainless steel,
corrosion will occur much faster. The centralisers perform no role as a barrier to radionuclide
migration and so are not represented in the post-closure GSA calculations.
Inclusion of FEP – Implicitly included in all scenarios since they are a component of the reference
design. However they are not explicitly modelled in post-closure GSA calculations.
V.1.5.3. Anti-intrusion barrier
Description – An anti-intrusion barrier (for example a metallic ‘drill deflector’) is placed above the
disposal zone in order to deter/prevent human intrusion.
Treatment in the GSA – The role of the barrier is to deter/prevent human intrusion. It is not considered
to be a barrier to radionuclide migration by groundwater and gas pathways and so is not explicitly
represented in the post-closure GSA calculations.
Inclusion of FEP – Implicitly included in all scenarios since it is a component of the reference design.
However it is not explicitly modelled in post-closure GSA calculations.
V.1.5.4. Native soil/crushed rock
Description – Native soil/crushed rock used to fill the top 5 m of the closure zone.
Treatment in the GSA – The role of the barrier is to deter/prevent human intrusion. It is not considered
to be a barrier to radionuclide migration by groundwater and gas pathways and so is not explicitly
represented in the post-closure GSA calculations
Inclusion of FEP – Implicitly included in all scenarios since it is a component of the reference design.
However it is not explicitly modelled in post-closure GSA calculations.
V.1.6. Mechanical processes and conditions
V.1.6.1. Container collapse
Description – The processes that lead to the collapse of the containers in the post-closure period.
Treatment in the GSA – As noted in FEP 2.1.3.1, there are three containers considered in the GSA (the
source container, the capsule and the disposal container). The source container and the capsule have
significant voidage, whereas the disposal container is backfilled with the cement grout that forms the
146
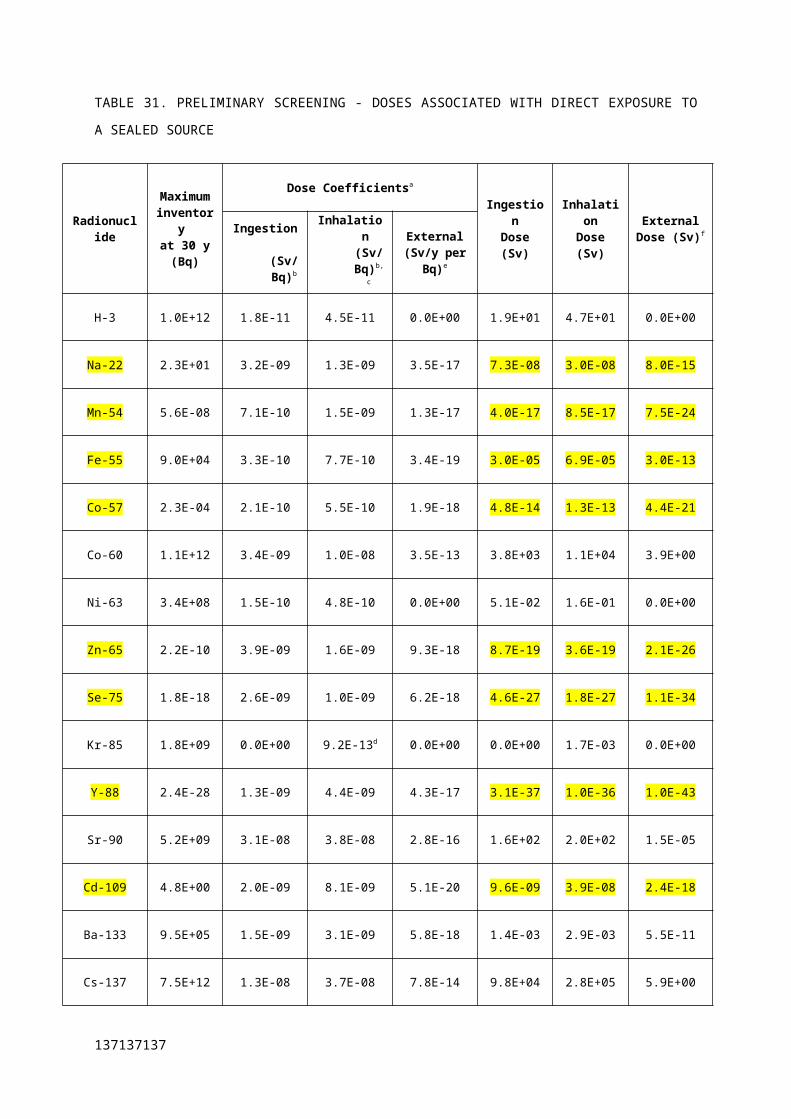
containment barrier. Whilst the source container is assumed to have failed prior to closure, the capulse
that contains it and its associated source is assumed to be intact, as is the disposal container.
With the ingress of groundwater into the borehole, the disposal container will be subject to gradual
corrosion which will eventually lead to the breach of the container (see FEP 2.1.3). Corrosion of the
disposal container will not result in its collapse since it is backfilled with the cement grout
containment barrier.
Following ingress of water into the disposal container, the capsule will be subject to corrosion (see
FEP 2.1.3). Corrosion will lead to breaches in the capsule. In addition, the cement grout containment
barrier in the disposal container will be subject to expansive reaction with ions in the incoming
groundwater, particularly sulphate (see FEP 2.1.4.3). Ultimately the combination of these processes
might lead to the collapse of the capsule due to its significant voidage. However, the impact of this
possible collapse is not considered to be significant in terms of increasing the release rate of
radionuclides given that the capsule will have to be significantly corroded prior to collapse and so
longer performing the role of a significant barrier.
Inclusion of FEP – Excluded in all scenarios.
V.1.6.2. Material volume changes
Description – The effects of volume changes in materials used in borehole. The volume changes
associated the main materials used in the borehole are as follows:
cements can show volume increased due to their degradation (see FEP 2.1.4); and
corrosion of metal containers usually leads to corrosion products that have larger volumes than
the original metals (see FEP 2.1.3).
Treatment in the GSA – It is considered that volume changes will not be significant in the borehole
although they might promote some localized fracturing of the cement grout (see FEP 2.1.6.3).
Inclusion of FEP – Included implicitly in all scenarios through consideration of increase permeability
of cement grout with time.
V.1.6.3. Fracturing of cement grout
Description – Cement of the containment barrier and the backfill may fracture due to applied stresses
(e.g. from material volume changes – see FEP 2.1.6.2) and/or degradation.
Treatment in the GSA – It is considered that fracturing of the cement grout in the borehole will occur
due to volume changes and cement grout degradation. This is implicitly considered through
consideration of increase permeability of cement grout with time.
147147147
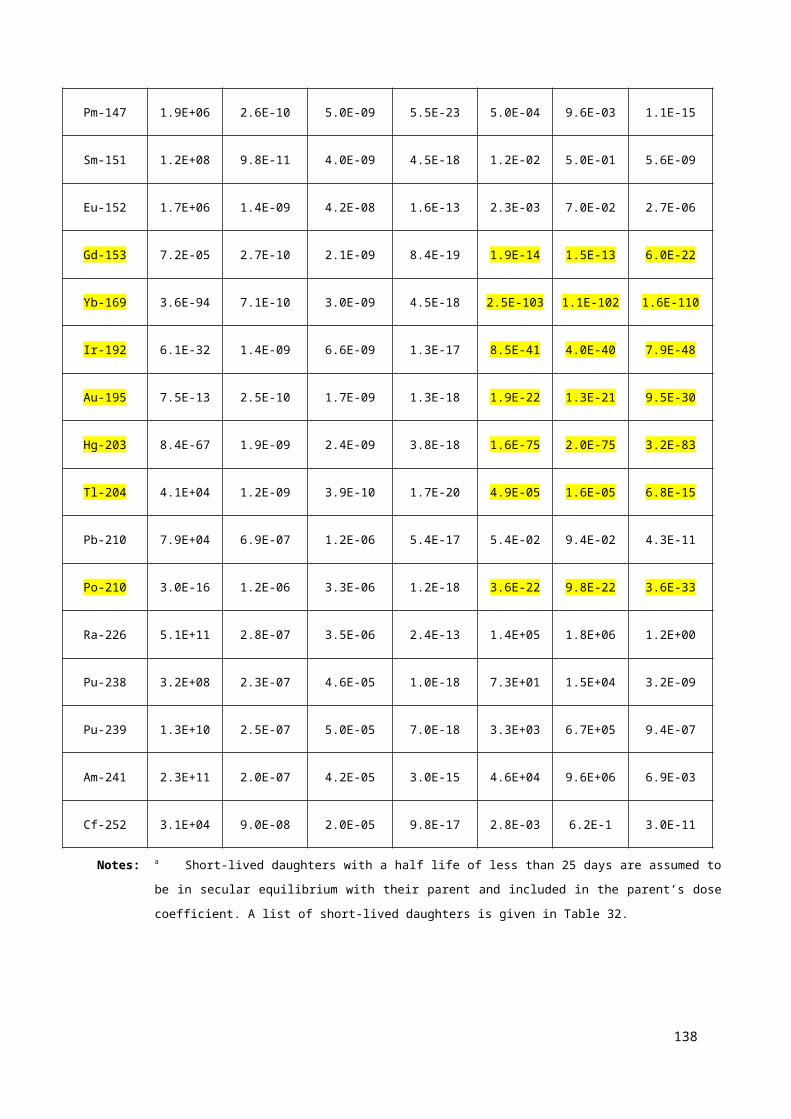
Inclusion of FEP – Included implicitly in all scenarios.
V.1.7. Hydrological processes and conditions
V.1.7.1. Infiltration and movement of water in the borehole
Description – Water flow into and through the borehole is governed by the hydraulic gradient,
hydraulic conductivity, porosity, and the degree of saturation in the borehole and, in the case of the
borehole in the unsaturated zone, the percolation rate in the unsaturated zone.
Treatment in the GSA – It is assumed that the infiltration rate into the borehole is time variant due to
changes in the hydraulic conductivity and porosity of the cement grout in the borehole as a
consequence of cement grout degradation.
Inclusion of FEP – Included in all scenarios.
V.1.7.2. Degree of saturation
Description – The degree of saturation can affect the flow of water through the borehole (see
FEP 2.1.7.1) and also the corrosion processes. Atmospheric corrosion typically exhibits a threshold
relative humidity of 60-70% below which there is insufficient surface moisture to support
electrochemical reactions (Shreir 1976). In aerated systems, the corrosion rate of non-passive materials
is often determined by the rate of supply of O2. As a consequence, the corrosion rate can be higher in
unsaturated systems as the rate of supply of O2 through the vapour phase is orders of magnitude higher
than through aqueous solution.
For passive materials such as Types 304 and 316L stainless steel, the corrosion behaviour is
determined by the properties of the passive film. Corrosion is therefore anodically, rather than
cathodically, limited and corrosion rates are similar in the vapour phase and in aqueous solutions, for
equivalent chloride concentration and redox conditions.
Thin moisture films, as formed on surfaces in humid atmospheres, can exhibit higher solute
concentrations because of evaporative concentration mechanisms.
Treatment in the GSA – The degree of saturation of the borehole is explicitly taken into account in the
calculation of water flows in the GSA.
The corrosion rate and susceptibility to localized corrosion is assumed to be the same for saturated and
unsaturated sites. It is implicitly assumed that the relative humidity in the borehole will always exceed
the threshold of 60-70% RH for corrosion processes.
It is assumed that evaporative concentration of electrolytes in thin moisture films does not occur
because of the absence of thermal gradients assumed for the GSA (see FEP 2.1.10).
Inclusion of FEP – Included in all scenarios.
148
V.1.7.3. Resaturation of the borehole
Description – At closure, the borehole will be unsaturated (be it in the unsaturated or saturated zone).
With time, the borehole in the saturated zone will resaturate. The rate of resaturation will be dependent
on the hydraulic conditions in the borehole and the surrounding geosphere, and the generate rate of
gases and associate gas pressure.
Treatment in the GSA – It is assumed that the borehole in the unsaturated zone remains unsaturated
and the degree of saturation is consistent with the surrounding unsaturated zone.
For the borehole in the saturated zone, it is assumed that it is immediately resaturated on closure since
the HDPE casing is conservatively assumed to fail on closure (see FEP 2.1.5.1) allowing the ingress of
groundwater. Even for the low flow rate system, the assumed hydraulic parameters given in Table 7
give a resaturation time of less than 20 years.
It is assumed that the generation of gas from the corrosion of the disposal containers and capsules does
not result in the build up of pressure in the borehole (see FEP 2.1.7.4) and so has no impact on the
resaturation process.
Inclusion of FEP – Included in all scenarios for the borehole in the saturated zone.
V.1.7.4. Gas mediated water flow
Description – Gas generation within the borehole may affect water flow within the borehole if
significant gas pressures are generated.
Treatment in the GSA – It is assumed that the corrosion of the containers in the saturated zone results
in the generation of gases, primarily hydrogen, at a maximum rate of 1E-5 m3 y-1. This rate of gas
generation is assumed to be less than the rate of gas loss and so there is no build up of gas pressure in
the borehole. Therefore there is no impact of gas on water flows.
Inclusion of FEP – Excluded in all scenarios.
V.1.7.5. Coupled hydraulic processes including temperature, chemical or electrical gradients
Description – Fluid flow driven by temperature, chemical or electrical gradients, rather than due to
hydraulic pressure gradients.
Treatment in the GSA – It is assumed that significant chemical and electrical gradients do not exist in
the borehole. It is also assumed that significant temperature gradients do not exist in the borehole (see
FEP 2.1.10)
Inclusion of FEP – Excluded in all scenarios.
V.1.8. Chemical processes and conditions
V.1.8.1. pH conditions
149149149
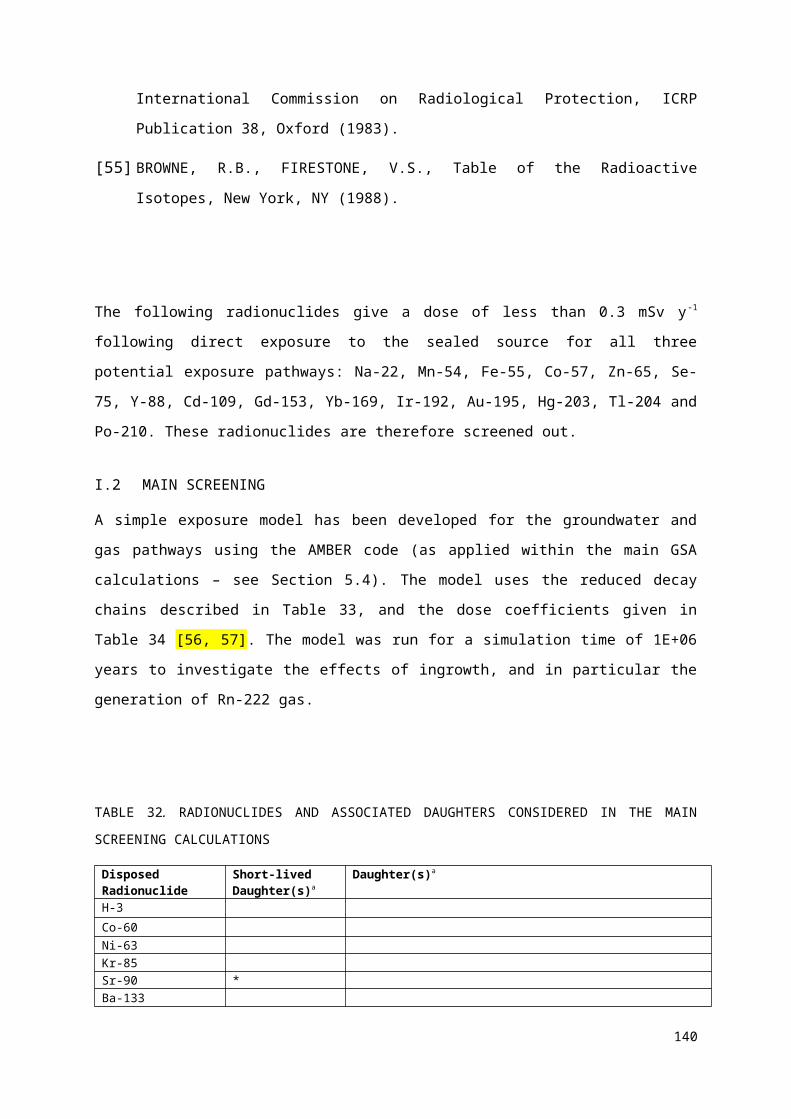
Description – The main factors affecting the pH in the borehole are the pH of the infiltrating water and
the cement grout in the containment barrier and disposal/disturbed zone backfill.
The chemical degradation of the cement grout will cause the pH of the cement grout porewater to
evolve over time as alkaline mineral phases dissolve and are flushed out of the cement grout. A model
for the evolution of the cement grout porewater pH developed by Berner (1990, 1992) is used to
determine the number of pore volumes corresponding to different stages in the porewater evolution.
The time-dependence of the number of pore volumes is a function of the assumed hydraulic
conductivity of the site.
Corrosion processes are typically sensitive to changes in pH. The rate of corrosion is often a minimum
at a pH in the range pH 7-9, corresponding to the minimum solubility of protective oxide films.
Amphoteric materials exhibit increased corrosion rates with increasing pH, although the rate of
corrosion for stainless steels is lower in alkaline solution than in the neutral pH range.
Similarly, the susceptibility of stainless steel to localized corrosion is higher at lower pH, again
because of the poorer properties of the oxide film in acidic solutions.
The pH of the environment in contact with the waste capsule and the disposal container will be
conditioned for some time after emplacement by the cementitious backfill materials. The time
dependence of the pH depends on the local hydraulic conductivity. Eventually, the porewater pH will
equilibrate with that of the local groundwater. Therefore, the stainless steel waste capsule and disposal
container will be exposed to a range of pH values over their service life.
Treatment in the GSA – A range of infiltrating waters with differing pH values are assumed in the
GSA (see Table 8).
Evolution of the borehole pH is included in the GSA. A four-stage cement grout degradation model is
assumed, with Stage 1 corresponding to pH control by NaOH/KOH (pH 13.5), Stage 2 is dominated
by equilibrium with Portlandite (Ca(OH)2) (pH 12.5), Stage 3 represents slow leaching of CSH phases,
and Stage 4 corresponds to equilibrium with the background groundwater.
The rate of general corrosion and susceptibility to localized corrosion are assumed to be functions of pH.
Inclusion of FEP – Included in all scenarios.
V.1.8.2. Redox conditions
Description – Oxidation/reduction conditions in the borehole and their change with time due to
processes such as the corrosion of the capsule and disposal container resulting in the consumption of
oxygen.
The corrosion behaviour of materials depends on the redox potential of the environment through its
effect on the controlling parameter, the corrosion potential. In general, more-positive redox potentials
result in more-positive corrosion potentials. For passive materials, such as stainless steels, an increase 150
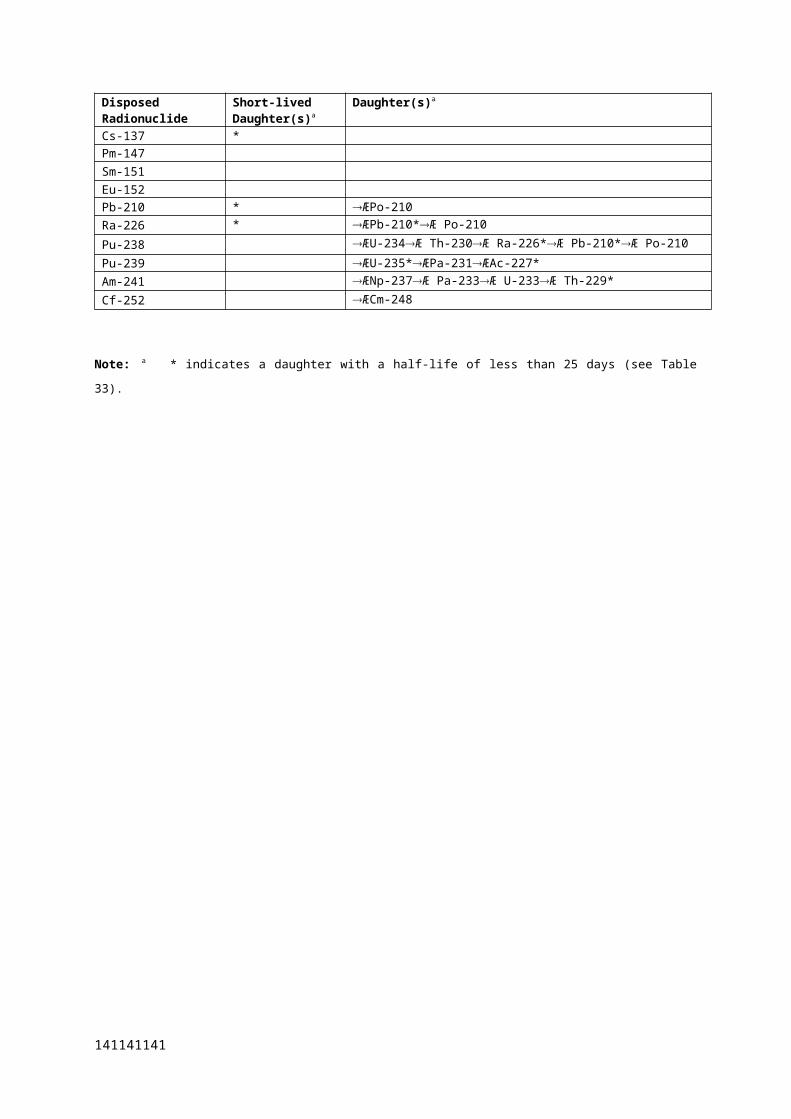
in redox potential can lead to an increase in the rate of general corrosion, although not to the same
extent as it would for an active material. Increasing corrosion potential (and redox potential) may
induce localized corrosion of passive materials.
Treatment in the GSA – A range of redox potentials is considered in the GSA (see Table 8). Although
the borehole in the saturated zone will initially be aerobic on closure, it is assumed that it rapidly
becomes anaerobic due to the ingress of reducing groundwater and the loss of oxygen through
processes such as corrosion. Thereafter, it is assumed that redox potentials remain constant, i.e.
positive (oxidising) for the unsaturated system and negative (reducing) for the saturated system.
Although corrosion will have the continued effect of reducing potentials further, the extent to which
this occurs will be minimized by incoming water and, in the case of the unsaturated borehole, air.
Accurate predictions of the actual redox state attained would require detailed case-specific information
and the development of sophisticated coupled models. However, it is conservative to assume that
conditions are more oxidising than would be the case were the effects of corrosion on redox to be
taken into account. Consequently, it is justified to ignore these effects.
The effect of redox potential on both general and localized corrosion is explicitly included in the
corrosion estimates for the waste capsule and disposal container.
Inclusion of FEP – Included in all scenarios.
V.1.8.3. Chloride and sulphate conditions
Description – Many of the groundwaters considered in the GSA contain high levels of Cl- and SO42-
ions. Chloride ions are known to lead to localized corrosion and SCC of stainless steels and may,
under some circumstances lead to an increase in the rate of general corrosion.
Sulphate ions can inhibit the aggressiveness of Cl- ions, although in the groundwater solutions
considered for the GSA the relative concentration of sulphate is too low to have a significant effect.
Sulphate may also act as an electron acceptor for sulphate-reducing bacteria (see FEP 2.1.9).
Sulphate and chloride ions also promote the degradation of cement grout (see FEP 2.1.4).
Treatment in the GSA – The effects of Cl- ions on the general and localized corrosion of stainless
steels are fully accounted for in the lifetime predictions for the waste capsule and disposal container.
No inhibitive effect of SO42- ions is assumed because of the high [Cl-]:[SO4
2-] ratio of the groundwaters
considered in the GSA.
The effect on the porewater SO42- concentration of interaction with the cement grout cannot be
considered explicitly, but the possible significance can be judged by means of alternative calculations
representing alterntive physical and chemical evolutions of the cement grout (see FEP 2.1.4.3).
Chloride and sulphate concentrations are assumed to remain constant with time.
151151151
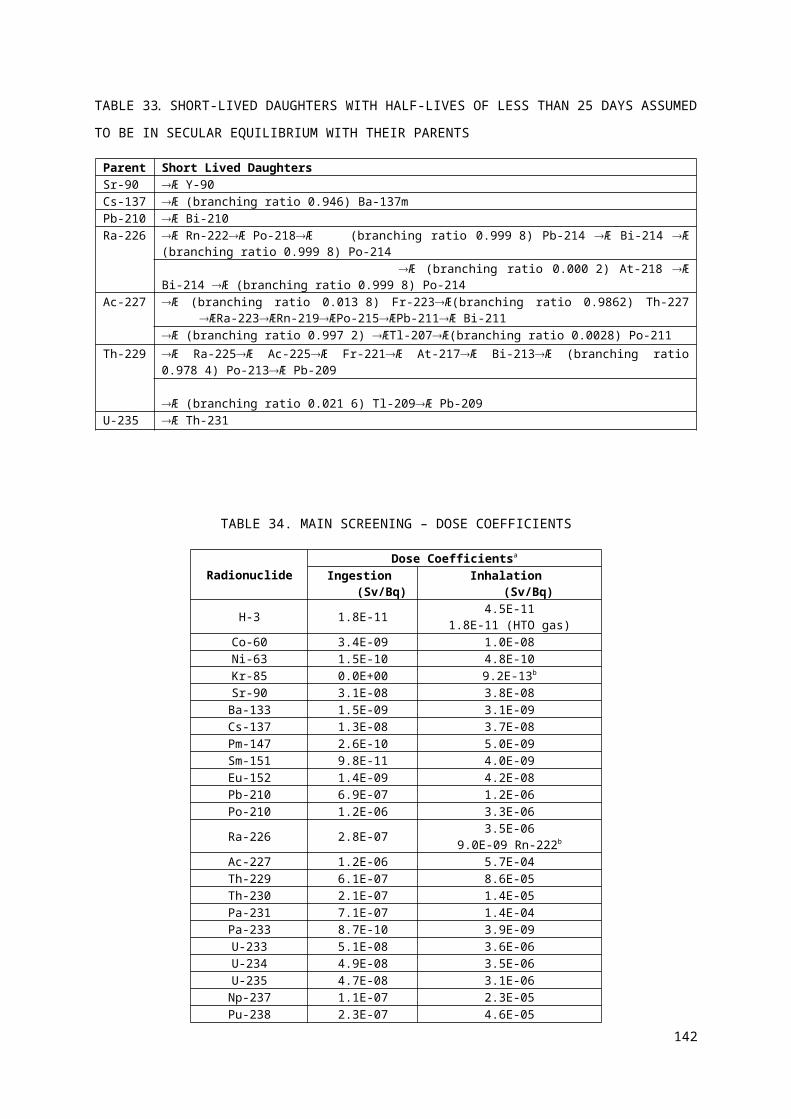
Inclusion of FEP – Included in all scenarios.
V.1.8.4. Mineralization change
Description – Long-term chemical changes occurring in the cement grout in the containment barrier
and disposal/disturbed zone backfill that could affect borehole performance.
Cement ages to produce minerals such as portlandite and tobermorite. Prolonged contact between
cement grout and groundwater leaches out portlandite (calcium hydroxide) and a proportionately
greater loss of calcium than silicon from the CSH gel that gives the materials their strength (Atkinson
et al. 1997). Reactions with species such as carbonate, sulphate and magnesium in groundwater could
continue into the long term, with species such as calcium carbonate, ettringite and magnesium sulphate
being produced. Most of these processes would restrict to some degree the ability of the cement grout
to impose a high pH into the long term, and could also lead to loss of physical integrity. They could
also affect the permeability of the cement grout; in the shorter-term loss of porosity diminishes
permeability; in the longer-term a loss of physical integrity could enhance porosity. The overall
temporal variations in physical and chemical properties and the extent to which the performance of the
barrier is enhanced or diminished, depends upon a complex coupling between these processes. To
predict these effects would require detailed case-specific information and the development of
sophisticated coupled models.
Treatment in the GSA – Mineralization is considered in the cement grout degration model adopted for
the GSA (see Appendix VIII).
Inclusion of FEP – Included in all scenarios.
V.1.8.5. Effects of chelating agents
Description – The effect of chelating agents on the performance of the borehole.
Chelating agents are organic compounds, usually carboxylic acids, which have a number of locations
in each molecule that can complex with a single metal atom. The resulting complexes are usually
highly stable, a factor that can increase significantly the solubilities of certain radionuclides, e.g. Pu
with the acidic degradation products of cellulose (Greenfield et al. 1997).
Treatment in the GSA – It is assumed that the effect of any chelating agents present in the
groundwater and the borehole does not have a significant impact on the performance of the borehole.
The only significant source of organic matter within the borehole is HDPE casing. There is little
information with which to judge whether or not organics released from the degradation of HDPE
could complex with radionuclides to the extent that the mobility of radionuclides is affected
significantly. However, the IAEA (2006) notes that HDPE is being considered as a material for
fabricating containers for some kinds of radioactive wastes. Attention is drawn to the possible loss of
physical container integrity that might occur due to chemical degradation. No mention is made of the
152
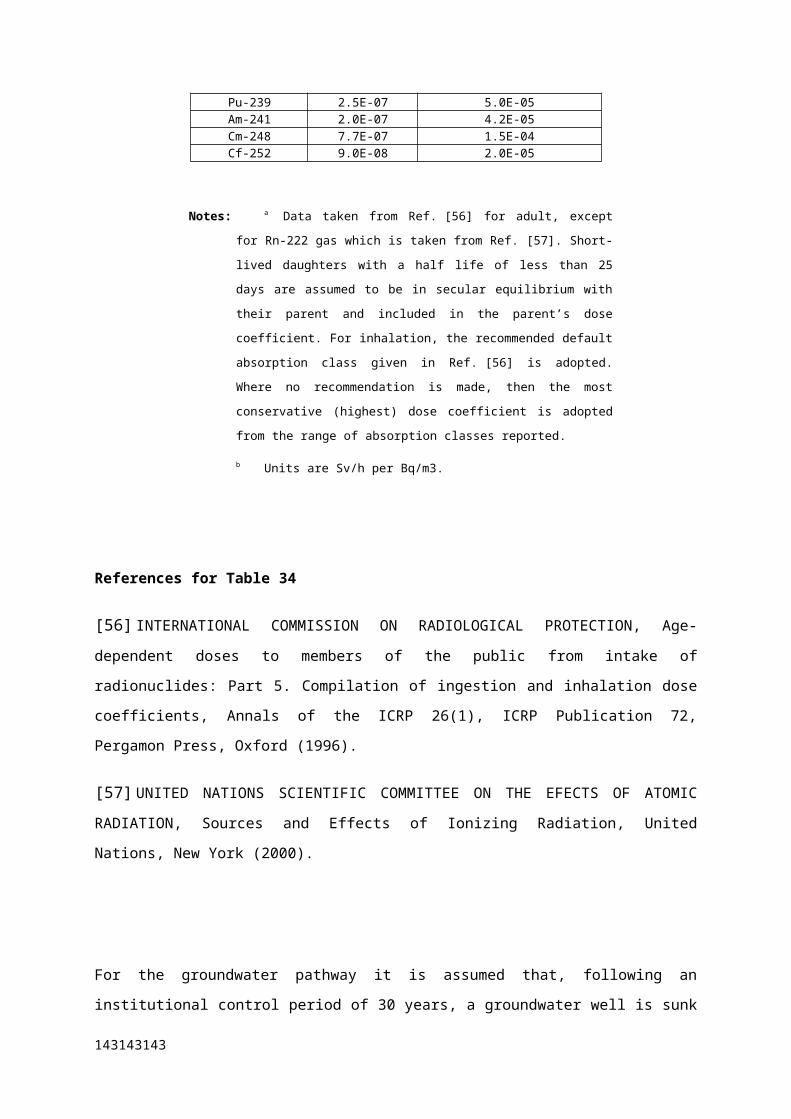
possible significance of complaxation between breakdown products and radionuclides. It is therefore
assumed that the chemical effects of HDPE breakdown would be insignificant. It is also assumed that
the borehole is sited so that anthropogenic chelating agents produced at or near the surface (e.g.
chelating agents such as those that might arise from landfill sites or industrial activities) could not
penetrate to the depths of the wastes.
Inclusion of FEP – Excluded in all scenarios.
V.1.8.6. Effects of colloids
Description – The existence of colloidal particles in borehole water and the effect of these particles on
the performance of the borehole.
Colloids are dispersions of finely divided particles in a dispersing medium. Particle diameters are
typically less than 1 μm. A variety of colloidal substances exist in groundwater, including humic
substances, micro-organisms, mineral precipitates and weathering products (Chambers et al. 1995).
Colloids could also be generated from materials in a borehole.
Colloids could potentially represent a route for increasing the rate of movement of radionuclides away
from the borehole, because their specific high surface areas might encourage sorption. To be mobile
over considerable distances, a colloidal particle must not be susceptible to aggregation with other,
similar particles, nor can it be filtered out in the borehole or geosphere.
Colloids can be generated in cements (Chambers et al. 1995). Their movement into a cement grout
could potentially lead to pore blockage.
Treatment in the GSA – It is assumed that the effect of any colloids present in the groundwater and the
borehole does not have a significant impact on the performance of the borehole. It is assumed that
transport of radionuclides would not be enhanced significantly by colloids originating in the cement
grout because the integrity of the steel barriers would be maintained until the cement grout had already
been substantially degraded. The possibility for significant colloidal transport to occur could be
minimized by siting the borehole within a sufficiently low-permeability lithology.
Inclusion of FEP – Excluded in all scenarios.
V.1.8.7. Precipitation/dissolution reactions (solubility limitation)
Description – The implications that conditions in the borehole (particularly of pH, Eh and
concentrations of complexing ions for radioelements) have for radioelement solubility and the nature
of precipitated phases.
Solubility can be defined as the measured aqueous concentration of an element in equilibrium with a
solid phase under a given set of conditions. This concentration is determined by the equilibrium
constant for the dissolution of the solubility-limiting solid phase and the equilibrium constants for the
153153153
formation of other soluble species, usually complexes. The solubility-limiting solid phase is the most
thermodynamically stable solid that can form under the prevailing conditions (Chambers et al. 1995).
It is important not to create the impression that solubility-limiting reactions defined in this way always
impose maximum concentration limits on solutes. In fact, in some cases, metastable solution-solid
reactions may give rise to higher aqueous concentrations than would be caused by true solubility
limitation as defined in the previous paragraph.
An increasing pH tends to decrease the solubilities of radioelements. This is because many of the most
stable solid phases are hydroxides, and increasing the concentration of hydroxyl ions in solution will
drive the solubility equilibrium towards the solid phase, reducing the solution concentration of the
radioelement. This effect occurs with a cementitious backfill.
The anaerobic conditions drive the most stable oxidation state to a lower level (for elements such as
actinides where a choice exists). In general, the lower the oxidation state the lower the limiting
solubility.
Some solubilities of radioelements are increased by the presence of complexing ions. One example is
the effect of carbonate ions on uranium solubility.
Treatment in the GSA – In the GSA the release functions of the various radionuclides depends upon
whether or not they are considered to be solubility limited (see Appendix X).
Inclusion of FEP – Included in all scenarios.
V.1.9. Biological processes and conditions
V.1.9.1. Microbial growth and poisoning
Description – A range of microbes will inevitably be introduced into the borehole during its
construction and in the operational phase. Growth requires the presence of water and suitable nutrients
(e.g. organic material such as cellulose). Although cellulose will not be found in the borehole, simple
organic molecules containing oxygen, nitrogen or sulphur, that might be present in the borehole, can
also act as nutrients for microbes. Plastics and most other polymers are relatively inert towards
microbes and in general do not support their growth.
Only some of the microbes present at borehole closure will find the subsequent conditions suitable for
their growth. Besides requiring certain types of nutrient, individual microbial populations will only
operate under particular conditions of temperature, pH and redox potential and salinity.
Alkaliphillic microbes can grow as biofilms on the surface of cement grout, though with a penetration
of less than 1 mm. This might block the passage of water through such a cementitious backfill, and
decrease the rate at which groundwater moves.
154
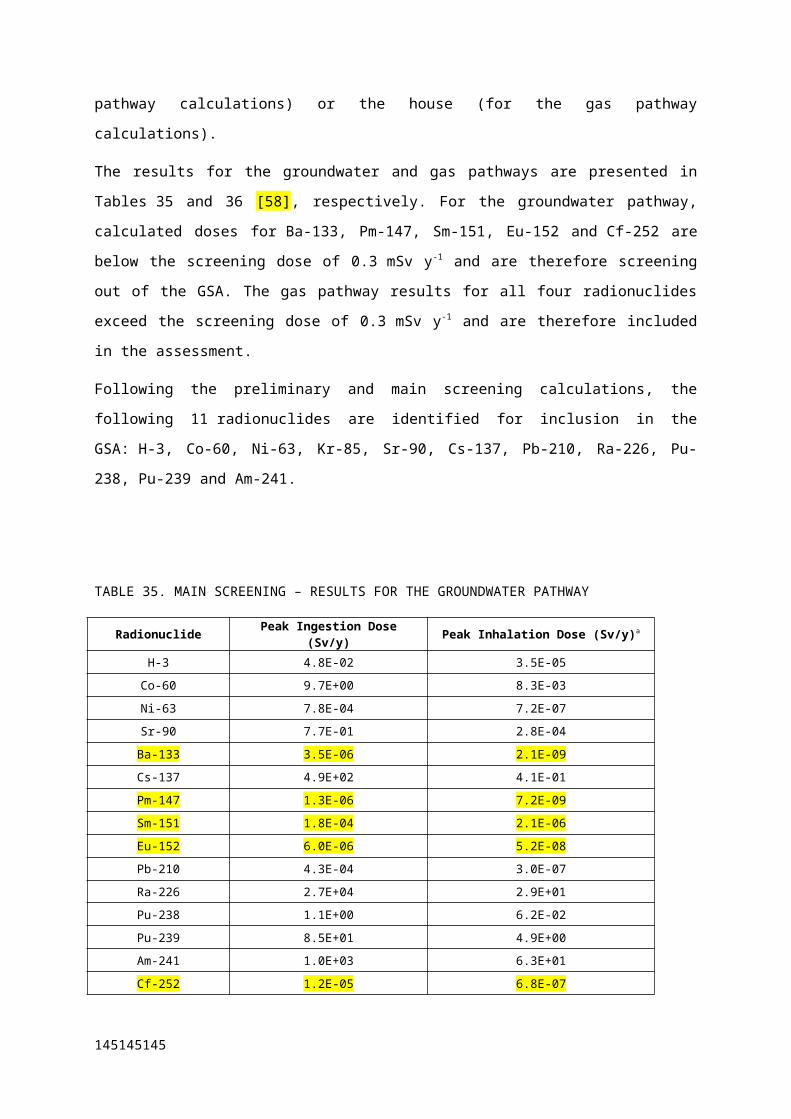
Microbial growth can lead to the formation of acidic and oxidising species that can participate in
corrosion of the steels (see FEP 2.1.9.2).
Poisoning of microbial processes can occur in a number of ways, including changing the pH to a value
where the microbial population ceases to function.
Treatment in the GSA – Given the absence of cellulose in the borehole and the initial high pH
conditions, it is considered that microbial growth will not be significant.
Inclusion of FEP – Excluded in all scenarios.
V.1.9.2. Microbially/biologically mediated processes
Description – Microscopic organisms, including bacteria, protozoans, yeast, viruses and algae, may
affect the performance of different engineered barriers, including the containers and backfill. Key
processes could include the following.
Microbiologically influenced corrosion (MIC). Microbial activity can induce corrosion of
metallic structures either through the production of aggressive metabolic by-products or by
creating occluded regions for localized corrosion. Stainless steels are known to be susceptible to
MIC (Little et al. 1991). The key to MIC is microbial activity. If microbes are not active then
they cannot produce aggressive metabolic by-products (such as sulphide ions or organic acids)
or the extracellular polymeric substance (i.e., slime) that creates localized environments.
Degradation of sulphate ions. Hydrogen formed during corrosion can react with sulphate ions in
groundwater to yield hydrogen sulphide (Nirex 1994).
Biofilm growth. Biofilms could potentially grow on the surfaces of cement grout and containers.
In the case of a cementitious backfill, this could lead to blocking of pores, restricting
groundwater movement (Francis et al. 1997).
Treatment in the GSA – These processes are not included in the corrosion analysis in the GSA.
Microbial activity near the capsule and disposal container surfaces will not occur during Stages 1 and
2 because of the high pH. The environment will only become less inhospitable for microbes during
Stage 3 or 4, by which time many of the containers are already estimated to have failed.
Inclusion of FEP – Excluded in all scenarios.
V.1.9.3. Microbial/biological effects of evolution of redox and pH
Description – Microbial and biological processes can affect both redox potential and pH. A microbial
population that changes these features could result in conditions where that population fails to thrive.
At this point, a further population may become active. For example, sulphur-oxidising bacteria cause
the formation of sulphuric acid by the oxidation of sulphur-containing species. However, this type of
bacteria requires oxygen in order to thrive.
155155155
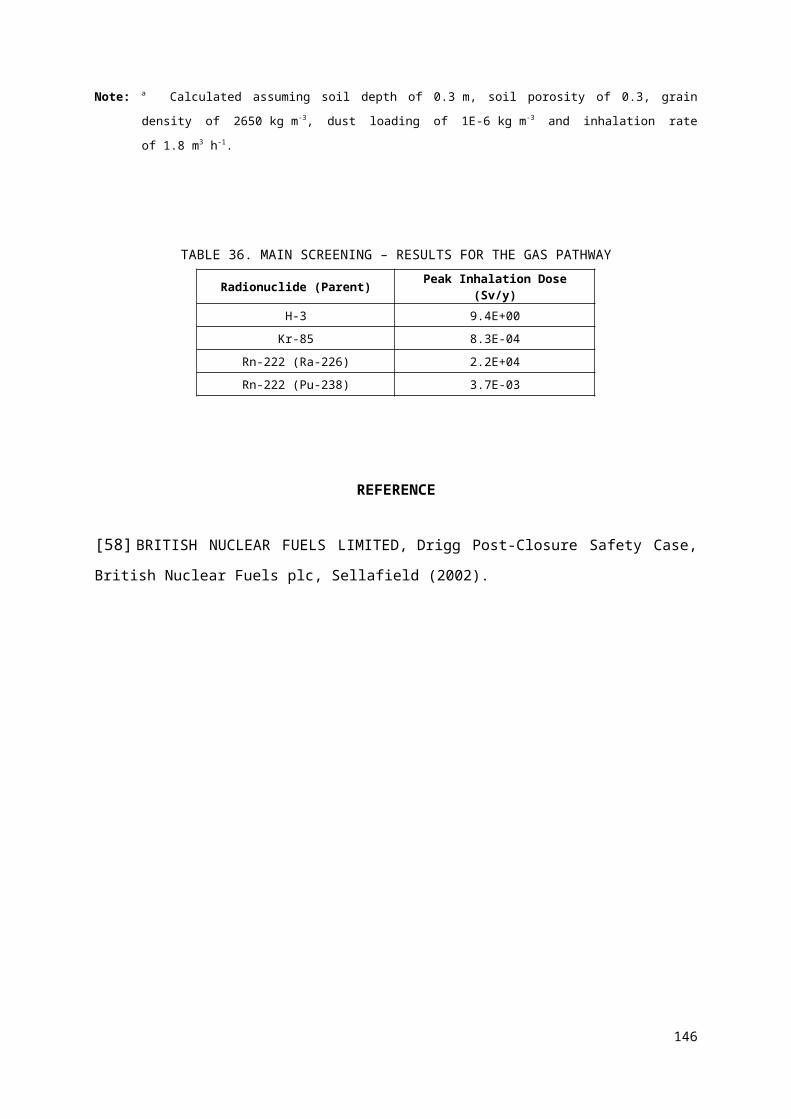
Treatment in the GSA – The impact of any microbial and biological processes on redox and pH are
considered to be minimal. pH evolution is considered to be driven by the degradation of cement grout
(see FEP 2.1.8.1) and no evolution of redox conditions is assumed (see FEP 2.1.8.2).
Inclusion of FEP – Excluded in all scenarios.
V.1.10.Thermal processes and conditions
V.1.10.1. Radiogenic, chemical and biological heat production from the wastes
Description – The heating effect produced by radioactive decay, chemical reactions (such as
corrosion) and microbiological processes in the waste.
For the first few decades after borehole closure, relatively short-lived radionuclides such as Co-60 and
Cs-137 will be the main sources of any radiogenic heat production. Thereafter, limited radiogenic
heating could continue but at a lower level due to the decay of any long-lived isotopes present.
Treatment in the GSA – For the purposes of the GSA, it is assumed that any heat production has
limited impact on the performance of the borehole. Calculations presented in Nel (2004) suggest a
maximum increase in temperature of less than 2°C for inventories considered for disposal to the
borehole disposal concept.
Inclusion of FEP – Excluded in all scenarios.
V.1.10.2. Chemical heat production from engineered features
Description – Concrete hydration, which is part of the chemical process of cement grout curing, has a
heat of reaction that could potentially lead to temperature increases in the borehole. However, the
period of heat generation is of the order of a few months.
Treatment in the GSA – Concrete hydration will have ended, and the associated heat dissipated, short
after borehole closure. It is considered that the heat production during curing will not have a
significant impact on the long-term safety of the borehole.
Inclusion of FEP – Excluded in all scenarios.
V.1.10.3. Temperature evolution
Description – A range of processes could potentially generate heat in a closed borehole (see
FEPs 2.1.10.1 and 2.1.10.2). These processes could contribute to temperature profiles across the
borehole and into the host rock. Although the effect on temperature may only be temporary, it could
have a permanent effect on borehole safety if it causes cracking in any backfill, concrete structures and
the immediately surrounding host rock. Water flow rates might increase and gas could migrate more
easily.
156
Treatment in the GSA – It is considered that the temperature rise in the borehole will be limited (see
FEPs 2.1.10.1 and 2.1.10.2). Therefore, isothermal conditions are assumed for the GSA.
Inclusion of FEP – Excluded in all scenarios.
V.1.10.4. Temperature dependence of processes
Description – Temperature increases in a closed borehole could lead to changes in the rates of a
number of chemical and physical processes in the borehole, including:
corrosion of metals;
mineralization reactions, particularly of the concrete present;
solubility limits for radioactive contaminants;
the extent of sorption of radionuclides on borehole components;
the rate of gas generation;
fluid pressure, density and viscosity; and
the rate of resaturation of the borehole.
Treatment in the GSA – The processes listed above might have their rates changed on a short-term
basis as the temperature in the borehole rises and then falls to near ambient in the initial period
following borehole closure. However, it is considered that the temperature rise in the borehole will be
limited (see FEPs 2.1.10.1 and 2.1.10.2) and so the impact on these processes is assumed to be
insignificant. Therefore, isothermal processes are assumed for the GSA.
Inclusion of FEP – Excluded in all scenarios.
V.1.11. Radiation effects
V.1.11.1. Effects on containers
Description – Radiolysis of water by -radiation can accelerate corrosion processes on metals through
the production of oxidising radiolysis products (the effects of - and -radiation and neutron
irradiation are not considered here for intact containers containing used sources).
Shoesmith and King (1999) have reviewed the evidence for the effects of -radiation on the corrosion
of various metallic materials. For stainless steels, no acceleration of general corrosion was reported at
an absorbed dose rate of 104 Gy/hr (1 Mrad/hr). Radiation has also been found to inhibit pitting,
probably due to the annealing of defects in the oxide film. There is some evidence for enhanced
initiation of crevice corrosion at a dose rate of 2.8 Gy/hr, although higher dose rates appear necessary
to sustain crevice propagation.
157157157
Treatment in the GSA – Radiation effects are not included in the corrosion analysis in the GSA. Many
of the used sources will not produce an external radiation field and, even for those that do, the dose
rate is likely to be significantly below the threshold for radiation-enhanced corrosion.
Inclusion of FEP – Excluded in all scenarios.
V.1.11.2. Effects on cement grout
Description – The action of radiation on cement grout components of the borehole. The action of
radiation on cement grout is to produce hydrogen gas from the radiolysis of free water in the cement
grout pores. The extent of gas formation by this route decreases rapidly following borehole closure as
the radionuclides decay.
Treatment in the GSA – The rapid decrease in radioactivity in the post-closure period indicates that the
amount of gas likely to be generated by this route is small and has no significant effect on borehole
performance since any gas generated will be able to migrate up through the cement grout.
Inclusion of FEP – Excluded in all scenarios
V.1.11.3. Effects on other engineered features
Description – The action of radiation on other components of the borehole, e.g the embrittlement of
the HDPE casing.
Treatment in the GSA – It is considered that the shielding offered by the containers and cement grout
will mean that the radiation sources will have no significant effect on the other engineered features in
the borehole. Even if embrittlement of the HDPE casing were to occur, this has implicitly been
considered by conservatively assuming that the casing fails on closure of the borehole (see
FEP 2.1.5.1).
Inclusion of FEP – Excluded in all scenarios.
V.1.11.4. Effects on pH
Description – The change in pH in the borehole caused by radiolysis.
Radioactive decay leads to the formation of oxidising or acidic species such as hydrogen peroxide
(formed by the radiolysis of water) and nitric acid (resulting from the nitrogen). Overall, the pH would
decrease to acid values in the absence of cement grout in the borehole. Such species would then be
potentially available to corrode the steel containers present.
The effect would fall off rapidly following borehole closure, in line with the extent of radioactive
decay.
Treatment in the GSA – This process might bring forward the loss of integrity in the steel containers
and initiate corrosion of metallic wastes. However, because radiolysis will decline rapidly following
158
borehole closure and a sizeable proportion of the radiative energy emitted will be absorbed by the
containers and cement grout in the borehole, this process is not considered to be significant in
controlling borehole pH.
Inclusion of FEP – Excluded in all scenarios.
V.1.11.5. Effects on redox
Description – The change in redox potential in the borehole caused by radiolysis.
Radiolysis of organic matter generates free radicals that are highly reactive towards oxygen in the
borehole. This process could help convert the borehole from being initially aerobic to being anaerobic.
Treatment in the GSA – Limited occurrence of organic matter in the borehole is assumed so there is
limited scope for the generation of free radicals and the resulting anaerobic conditions via radiolysis.
Anaerobic conditions assumed for saturated zone borehole from closure onwards (see FEP 2.1.8.2).
Inclusion of FEP – Excluded in all scenarios.
V.1.11.6. Decay product gas generation
Description – The production of gaseous isotopes from radioactive decay processes.
There are two main sources of gas in a borehole by this route:
the production of helium as α–particles; and
the generation of isotopes of radon in the decay of disposed and in-grown radium.
Treatment in the GSA – It is considered that helium will constitute only a small proportion of the total
gas formed in the borehole and could be carried away from it in dissolved form (Biddle et al. 1988).
However, the emission of radon gas from the borehole is considered.
Inclusion of FEP – Included for all scenarios.
V.1.12.Gas sources and effects Description – Factors within and around the sources, containers and engineered features resulting in
the generation of gases and their subsequent effects on the borehole system.
Gas production may result from corrosion of metals in the sources, container and engineered materials.
It may also be produced by radiation effects, including helium and radon as a products of radioactive
decay and gases produced by radiolysis of water in cement grout (see FEP 2.1.11). Anions present in
incoming groundwater (notably sulphate and nitrate) could become involved in gas production.
Potential gases include hydrogen, oxygen, carbon dioxide, methane, nitrogen and hydrogen sulphide.
These gases could give rise to a range of hazards. Gas could be transported out of the borehole
dissolved in groundwater or in the gas phase. This latter process could cause changes in the local
159159159

chemical and hydraulic conditions; for instance elevated gas pressures could act as a driving force to
expel contaminated water out of the borehole, or they may result in unsaturated conditions so that two-
phase flow becomes important. Elevated gas pressures could also prevent the ingress of groundwater
into the borehole. Gas production could also affect the mechanisms for radionuclide transport, i.e. gas-
induced and gas-mediated transport. Some gases might be flammable or might form an explosive
mixture; for instance hydrogen and methane could mix with oxygen and explode to damage the
borehole. Some gases would be potentially toxic, notably hydrogen sulphide. However this species is
highly reactive, and is likely to be converted to a solid sulphide within the borehole (Biddle et
al. 1988).
Treatment in the GSA – The main gas in the borehole is hydrogen formed as a result of corrosion of
the containers. However, calculations suggest that less than 1E-5 m3 y-1 is produced. Other gases could
be produced in even smaller amounts by corrosion, radiolysis and microbial attack. Therefore, these
gases are not considered in the GSA.
The main radioactive gases produced will be H-3 and Kr-85 (disposed) and Rn-222 (in-grown
from Ra-226). These gases are considered in the GSA.
Inclusion of FEP – Included in all scenarios.
V.1.13.Extraneous materialsDescription – The effect of extraneous materials introduced into a borehole with waste packages and
during borehole construction, operation and closure.
Treatment in the GSA – It is considered that appropriate QA/QC will be in place to ensure that no
extraneous materials are introduced into the borehole other than microbes. Waste packages will
inevitably contain microbes but it is considered that these will not have a significant impact on the
performance of the borehole (see FEP 2.1.9).
Inclusion of FEP – Excluded in all scenarios.
REFERENCES[75] ATKINSON, A., HARRIS, A.W., HEARNE, J.A., Comparison of Materials for the
Backfilling of Repositories, Nirex Report NSS/R306, UK (1997).
[76] BERNER, U.R., A thermodynamic description of the evolution of porewater chemistry and
uranium speciation during the degradation of cement, Technical Report, NTB 90-12, Nagra,
Switzerland (1990).
160
[77] BERNER, U.R., Evolution of porewater chemistry during degradation of cement in a
radioactive waste repository environment, Waste Management, 12, (1992) 201-219.
[78] BIDDLE, P., DAVIES, A.A., McGAHAN, D.J., REES, J.H., RUSHBROOK, P.E., The
Evolution of Minor Active and Toxic Gases in Repositories, Nirex Report NSS/R118, UK
(1988).
[79] CHAMBERS, A.V., WILLIAMS, S.J., WISBEY, S.J., Nirex Near Field Research: Report on
Current Status in 1994, Nirex Report S/95/011, UK (1995).
[80] FRANCIS, A.J., CATHER, R., CROSSLAND, I.G., Development of the Nirex Reference
Vault Backfill: Report on Current Status in 1994, Nirex Report S/97/014, UK (1997).
[81] GREENFIELD, B.F., SPINDLER, M.W., WOODWARK, D.R., Summary of Effects of
Organic Degradation Products on Near–field Radioelement Chemistry, Nirex Report
NSS/R298, UK (1997).
[82] INTERNATIONAL ATOMIC ENERGY AGENCY, Development of specifications for
radioactive waste packages, International Atomic Energy Agency Report IAEA-TECDOC-
1515, IAEA, Vienna (2006).
[83] LITTLE, B., WAGNER, P., MANSFELD, F., Microbiologically influenced corrosion of
metals and alloys, Int. Mater, Rev. 36 (1991) 253-272.
[84] NEL, B., vd L. Design for the Borehole Disposal Concept, NECSA Report No. GEA 1623,
South African Nuclear Energy Corporation, Pretoria (2004).
[85] NIELSEN, E.P., HERFORTA, D., GEIKERB, M.R., Binding of chloride and alkalis in
Portland cement systems, Cement and Concrete Research, 35, (2005) 117-123.
[86] NUCLEAR INDUSTRY RADIOACTIVE WASTE EXECUTIVE (NIREX), Post-closure
Performance Assessment: Gas Generation and Migration, Nirex Report S/94/003, UK (1994).
[87] SHOESMITH, D.W., KING, F., The effects of gamma radiation on the corrosion of candidate
materials for the fabrication of nuclear waste packages, Atomic Energy of Canada Limited
Report, AECL-11999 (1999).
[88] SHREIR, L.L., Corrosion, 2nd edition, Newnes-Butterworths, London (1976).
161161161
Appendix VISCREENED FEP LIST FOR THE DEFECT SCENARIO
Modifications to the list derived in Appendix IV for the Design Scenario are underlined.
0 ASSESSMENT CONTEXT FACTORS
0.01 Assessment Purpose – Yes, see Section 2.1 for the four main purposes of the assessment.0.02 Regulatory Requirements and Exclusions
1 0.2.01 Protection of human health and the environment – Yes, see Sections 2.2 and 2.4, especially Box 1 for protection objective and criteria. Impacts on non-human biota and non-radiological impacts are considered to be beyond the scope of the current study, so the focus is on radiological impacts upon human health.
2 0.2.02 Phases of disposal – Yes, see Sections 2.2 and 2.7. Assessment is of the post-closure phase, although it is recognized that operational and closure issues need to be considered when assessing post-closure safety.
3 0.2.03 Technical Requirements – Yes, see Sections 2.1 and 2.5. End points considered are waste activity levels expressed as total activity values and per waste package activity values. Output of assessment will help provide information on suitable inventories, engineering, institutional control period and hydrochemical characteristics.
0.03 Assessment Philosophy4 0.3.01 Assessment approach – Yes, see Section 2.6. The ISAM Safety Assessment Approach is being
used, consistent with best international practice.0.3.02 Uncertainties, treatment of
5 0.3.02.01 Future uncertainties – Yes, see Sections 2.6.4 and 3. This type of uncertainty is treated using a transparent and comprehensive scenario development and justification methodology.
6 0.3.02.02 Model uncertainties – Yes, see Sections 2.6.4 and 6. This type of uncertainty is treated using alternative conceptualizations and mathematical representations of the system.
7 0.3.02.03 Parameter/data uncertainties – Yes, see Sections 2.6.4 and 6. This type of uncertainty is treated using a deterministic sensitivity analysis.
8 0.3.02.04 Subjective uncertainties – Yes, see Section 2.6.4. This type of uncertainty is treated using a systematic and transparent assessment approach which allows subjective judgements to be document, justified and quantified (as far as possible).
9 0.3.03 Sensitivity analysis, performance of – Yes, see Section 6 for deterministic sensitivity analysis.0.3.04 Confidence, model
10 0.3.04.01 Verification, performance of – Yes, see Section 5.5. The software tool used (AMBER) has been successfully used in over 20 countries by over 60 organizations and has associated verification documentation.
11 0.3.04.02 Calibration, performance of – No, calibration is a site-specific procedure and therefore not possible for a generic safety assessment.
12 0.3.04.03 Validation, performance of – No, validation is not considered possible for a long-term generic safety assessment.
13 0.3.05 Modelling approach – Yes, see Sections 2.6 and 6. The approach used aims to balance simplicity, conservatism and realism. Deterministic calculations are used. The emphasis is to understand the behaviour of the system better and to identify the importance of specific components of the system in providing a level of post-closure safety that meets the relevant regulatory compliance criteria.
0.04 Assessment Bounding Conditions14 0.4.01 Assessment timeframe – Yes, see Sections 2.7 and 4.2. Calculations are undertaken out to a time
when it can be demonstrated that the peak value of the primary safety indicator (dose) has been passed. Institutional control period assumed to last 30 years after closure.
15 0.4.02 Assessment domain – Yes, see Sections 3 and 4.3.1. Assumed to be limited to the immediate vicinity of the disposal borehole (i.e. within a radius of about 100 m) since a water abstraction borehole is assumed to be sunk 100 m from the disposal borehole and the water used for domestic and agricultural purposes by humans.
162
16 0.4.03 Future human action assumptions – Yes, see Sections 3.3 and 4.3.1. No consideration is given to the development of new societal structures and technologies.
17 0.4.04 Future human behaviour (target group) assumptions – Yes, see Sections 3.3 and 4.3.1. It is assumed that humans are exposed once institutional control of the site is lost either due to use contaminated groundwater abstracted from a borehole sunk 100 m from the disposal borehole, or due inhalation of contaminated gas in dwelling constructed directly above the disposal borehole.
18 0.4.05 Target audience (Stakeholder involvement) – Yes, see Section 2.3. Two audiences are considered – “developers” and “regulators”.
19 0.4.06 Assessment endpoints – Yes, see Sections 2.5 and 6. Primary end points are waste activity levels, which can be expressed as total activity values and per waste package activity values.
20 0.4.07 Dose response assumptions – No, see Section 2.5. Risks of deleterious health effects are not considered as end points in the current study.
21 0.4.08 Results, presentation of – Yes, see Section 6. Results presented in tabular form.22 0.4.09 Disposal Facility Assumptions – Yes , see Section 4.3.1. It is assumed that not all components of
the near field perform as envisaged in the Design Scenario due to either defective manufacturing of waste packages (e.g. welding defects), or defective implementation in the borehole (e.g. improper cement grout emplacement). This results in earlier release of radionuclides from the near field.
1 EXTERNAL FACTORS
1.1 Disposal Facility Factors23 1.1.01 Investigations, site – Yes, although the assessment is generic and therefore it is assumed that there
is no site-specific information available from site investigation (see Section 3.2), data (e.g. hydraulic gradients, conductivities, porosities) are presented in Section 3.2 that implicitly assumed that there has been some site investigation of the synthesised sites. It is assumed that any investigation boreholes have been appropriately backfilled and do not compromise the long-term safety of the disposal system.
24 1.1.02 Design, disposal facility – Yes, see Section 3.1.2 and Table 4. It is assumed that the disposal borehole is designed with appropriate safety features and functions.
25 1.1.03 Schedule and planning – Yes , see Section 4.3.1. It is assumed that the disposal borehole is not operated as planned (see FEP 1.1.05).
26 1.1.04 Construction, disposal facility – Yes , see Section 4.3.1. It is assumed that the disposal borehole is not constructed as planned resulting in earlier release of radionuclides from the near field. For Defect Scenario Variant D3, it is assumed that implacement and quality of cement grout is worse than the Design Scenario resulting in more rapid chemical and physical degradation of the disturbed zone cement grout .
27 1.1.05 Operation, disposal facility – Yes , see Section 4.3.1. It is assumed that the disposal borehole is not operated as planned resulting in earlier release of radionuclides from the near field. For Defect Scenario Variant D3, it is assumed that implacement and quality of cement grout is worse than the Design Scenario resulting in more rapid chemical and physical degradation of the disposal zone cement grout.
28 1.1.06 Closure, disposal facility – Yes, see Section 4.3.1. It is assumed that the disposal borehole is closed as planned.
29 1.1.07 Institutional controls – Yes, see Sections 2.7 and 4.3.1. It is assumed that institutional controls are in place for a period of 30 years after closure.
30 1.1.08 Quality assurance – Yes , see Section 4.3.1. It is assumed that appropriate quality assurance is applied to the operation and closure of the disposal borehole. It is assumed that defects arise in waste capsule and container welds and cement grout emplacement despite best efforts to eliminate them.
31 1.1.09 Administrative control, disposal facility – Yes , see Sections 2.7 and 4.3.1. It is assumed that administrative controls are in place during the construction, operation and closure of the disposal borehole and for a period of 30 years after closure. However, it is assumed that some defects may arise, despite best efforts to eliminate them.
32 1.1.10 Accidents and unplanned events – Yes , see Section 4.3.1. It is assumed that there are no accidents. However, it is assumed that defects arise in waste capsule and container welds and cement grout emplacement, despite best efforts to eliminate them.
33 1.1.11 Retrievability – No, see Section 3.1.2. Each waste package is backfilled into the borehole immediately following its emplacement.
163163163
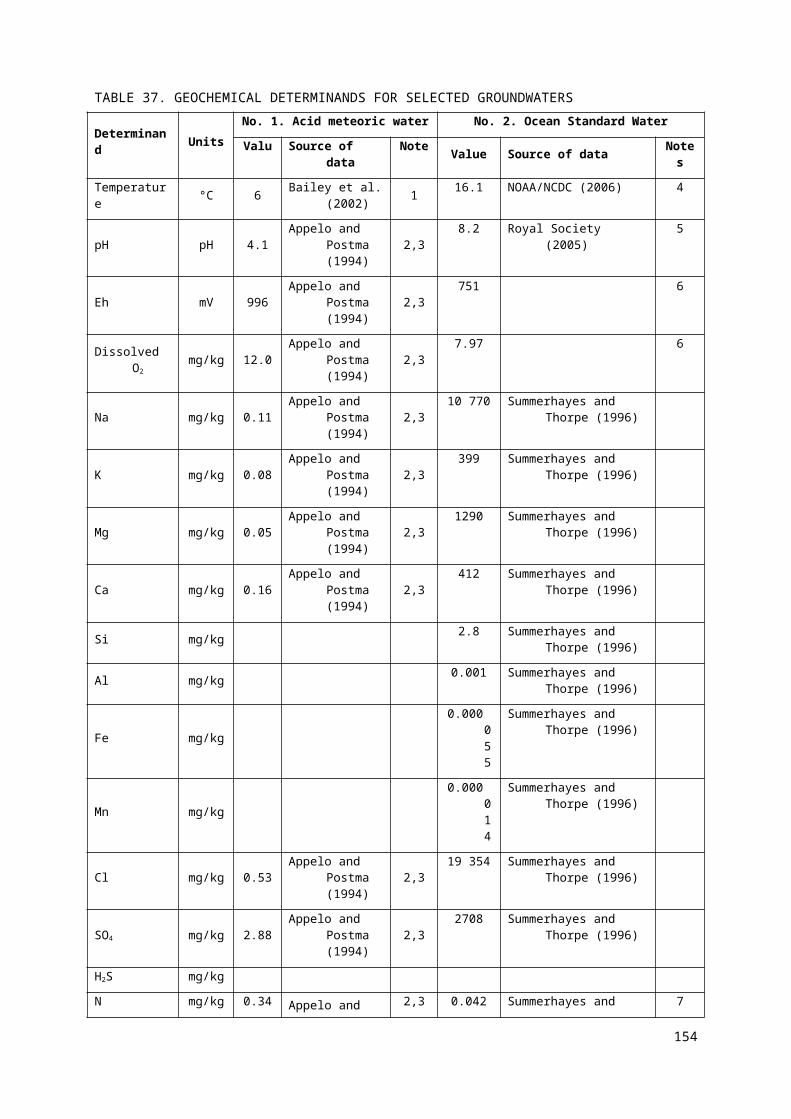
34 1.1.12 Motivation and knowledge issues – Yes, see Section 4.3.1. It is assumed that no markers are fixed at the site to reveal the location of a radioactive waste disposal facility but land use controls are in place during the institutional control period.
35 1.1.13 Nuclear Criticality – No, such effects are considered to be insignificant for the typical inventories to be disposed.
1.2 Geological Processes and Effects36 1.2.01 Tectonic movement – No, see Sections 3.2 and 4.3.1. It is assumed that the disposal borehole is
located in a geologically stable area with no or extremely limited tectonic activity over the timescales of interest in the safety assessment.
37 1.2.02 Orogeny – No, see Sections 3.2 and 4.3.1. It is assumed that the disposal borehole is located in geologically stable area and there is no orogenic activity over the timescales of interest in the safety assessment.
38 1.2.03 Seismicity – No, see Sections 3.2 and 4.3.1. It is assumed that the disposal borehole is located in a geologically stable area with no or extremely limited seismic activity over the timescales of interest in the safety assessment.
39 1.2.04 Volcanic and magmatic activity – No, see Sections 3.2 and 4.3.1. It is assumed that the disposal borehole is located in geologically stable area and there is no volcanic and magmatic activity over the timescales of interest in the safety assessment.
40 1.2.05 Metamorphism – No, see Sections 3.2 and 4.3.1. It is assumed that the disposal borehole is located in geologically stable area and there is no metamorphic activity over the timescales of interest in the safety assessment.
41 1.2.06 Hydrothermal activity – No, see Sections 3.2 and 4.3.1. It is assumed that the disposal borehole is located in geologically stable area and there is no hydrothermal activity over the timescales of interest in the safety assessment.
42 1.2.07 Erosion and sedimentation – Yes, see Sections 3.2, 3.3, 4.1 and 4.3.1. It is assumed that there is gradual net erosion on a regional and local scale.
43 1.2.08 Diagenesis – No, diagenesis is not considered to be a significant process affecting the disposal system over the depths and timescales of interest in the safety assessment.
44 1.2.09 Pedogenesis – Yes, see Section 3.3 and 4.3.1. Need to consider soil contaminated by irrigation water.
45 1.2.10 Salt diapirism and dissolution – No, assume disposal borehole is located in an area that has no natural resources requiring excavation by extensive surface excavation or underground mining (see Section 3.2).
46 1.2.11 Undetected geological features – No, see Section 4.1. The geosphere is assumed to be as described in Section 3.2 with no unexpected features, processes or events.
47 1.2.12 Hydrological/hydrogeological response to geological changes – No, see Sections 3.2 and 4.3.1. It is assumed that the disposal borehole is located in geologically stable area and there are no significant geological changes over the timescales of interest in the safety assessment.
48 1.2.13 Geomorphologic responds to geological changes – No, see Sections 3.2 and 4.3.1. It is assumed that the disposal borehole is located in geologically and geomorphologically stable area and there are no significant changes over the timescales of interest in the safety assessment.
1.3 Climate Processes and Effects49 1.3.01 Climate change, global – No, see Section 4.1. Constant climate conditions are assumed (a
simplifying assumption).50 1.3.02 Climate change, regional and local – No, see Section 4.1. Constant climate conditions are assumed
(a simplifying assumption).51 1.3.03 Sea level change – No, see Section 3.3. It is assumed that the site is located in a position that will
not be susceptible to possible future sea level rises.52 1.3.04 Periglacial effects – No, see Section 3.3. No consideration of extreme conditions such as
permafrost.53 1.3.05 Glacial and ice sheet effects, local – No, see Section 3.3. No consideration of extreme conditions
such as glaciation.54 1.3.06 Warm climate effects (tropical and desert) – Yes, see Section 3.3. It is assumed that the climate is
consistent with the assumption of subsistence agriculture land use. Such land use is possible in tropical climates and, if there is a sufficient supply of freshwater, arid conditions.
164

55 1.3.07 Hydrological/hydrogeological response to climate changes – No, since constant climate conditions are assumed (see Section 4.1).
56 1.3.08 Ecological response to climate changes – No, since constant climate conditions are assumed (see Section 4.1).
57 1.3.09 Human behavioural response to climate changes – No, since constant climate conditions are assumed (see Section 4.1).
58 1.3.10 Geomorphologic responds to climate changes – No, since constant climate conditions are assumed (see Section 4.1).
1.4 Future Human Actions59 1.4.01 Human influences on climate – No, since constant climate conditions are assumed (see Section
4.1).60 1.4.02 Knowledge and motivational issues (Disposal facility) – Yes, see Section 4.3.1. It is assumed that
no markers are fixed at the site to reveal the location of a radioactive waste disposal facility but land use controls are in place during the institutional control period to prevent human intrusion. The impact of deliberate human intrusion is considered to be beyond the scope of the current assessment (Section 1.3).
61 1.4.03 Drilling activities (human intrusion) – Yes, see Sections 3.2, 4.1 and 4.3.1. It is assumed that a water abstraction borehole is drilled 100 m from the disposal borehole and only once there is no institutional control over the site.
62 1.4.04 Mining and other underground activities (human intrusion) – No, see Sections 3.2 and 3.3. It is assumed that the disposal borehole is located in an area that has no natural resources requiring excavation by extensive underground mining. Furthermore, human activities are assumed to be limited to agricultural activities.
63 1.4.05 Un-intrusive site investigation – No, see Sections 3.2 and 3.3. It is assumed that the disposal borehole is located in an area that has no natural resources and human activities are assumed to be limited to agricultural activities. Therefore, it is considered that there is no un-intrusive site investigation.
64 1.4.06 Surface excavations – No, see Sections 3.2 and 3.3. The disposal zone is assumed to be at least 30 m below the ground surface and it is considered that any surface excavations associated with agricultural land use will not extend down to such depths.
65 1.4.07 Pollution – No, it is assumed that human activities do not significantly affect the disposal system.66 1.4.08 Site Development – Yes, see Sections 3.2, 4.1 and 4.3.1. It is assumed that a water abstraction
borehole is drilled 100 m from the disposal borehole and only once there is no institutional control over the site.
67 1.4.09 Archaeology – No, see Section 3.3. Human activities are assumed to be limited to agricultural activities.
68 1.4.10 Water management (wells, reservoirs, dams) – Yes, see Sections 3.2, 4.1 and 4.3.1. It is assumed that a water abstraction borehole is drilled 100 m from the disposal borehole and only once there is no institutional control over the site.
69 1.4.11 Social and institutional developments – Yes, see Sections 2.7, 3.3 and 4.3.1. It is assumed that land use controls are in place during the institutional control period to prevent human intrusion. But at the end of the period, controls are assumed to be no longer in place.
70 1.4.12 Technological developments – No, see Sections 3.3 and 4.3.1. No consideration is given to the development of new technologies.
71 1.4.13 Remedial actions – No , see Sections 2.7 and 4.3.1. It is assumed that, although there are defects in the welds/cement grout emplacement, the defects do not cause detectable releases of radionuclides during active institutional control. Therefore there are no remedial actions taken during the period of active institutional control.
72 1.4.14 Explosions and crashes – No, it is assumed that there are no explosions or crashes.
2 DISPOSAL SYSTEM DOMAIN FACTORS
2.1 Waste, Waste Form & Engineered Features73 2.1.1 Inventory, waste – Yes, see Section 3.1.1 and Appendix V. Assume a unit inventory of 1 TBq per
waste package of each of the emboldened radionuclides in Table 3 is disposed in the borehole.
74 2.1.2 Waste form materials, characteristics and degradation processes – Yes, see Sections 3.1.1, 3.1.2 and 4.3.1 and Appendix V. See Tables 4, 5 and 11 and Figs 2, 3 and 4 for details.
165165165
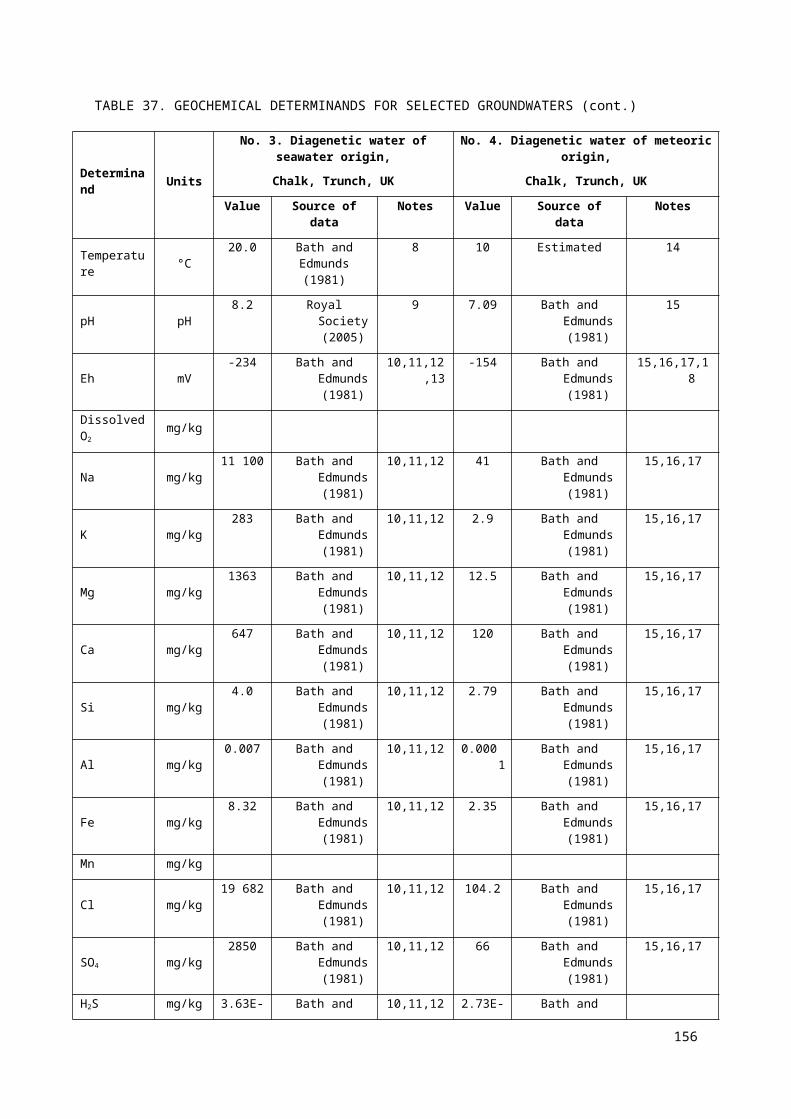
75 2.1.3 Container materials, characteristics and degradation/failure processes – Yes , see Sections 3.1.2 and 4.3.1 and Appendix V. See Tables 4, 5 and 11 and Figs 2, 3 and 4 for details. For the Defect Scenario Variant D1, it is assumed that there is a defect in the closure weld of one waste container that results in the more rapid degradation of the container. For Variant D2, the closure weld on one waste capsule is assumed to have failed. For Variant D4, the closure weld on one capsule and one container has failed.
76 2.1.4 Buffer/backfill materials, characteristics and degradation processes – Yes , see Sections 3.1.2 and 4.3.1 and Appendix V. See Tables 4, 5 and 11 and Figs 2, 3 and 4 for details. For the Defect Scenario Variant D3, it is assumed that implacement and quality of cement grout is worse than the Design Scenario resulting in more rapid chemical and physical degradation of the disposal and disturbed zone cement grout.
77 2.1.5 Other engineered barrier system characteristics and degradation processes – Yes, see Sections 3.1.2 and 4.3.1 and Appendix V. See Tables 4, 5 and 11 and Figs 2, 3 and 4 for details.
2.2 Geological Environment78 2.2.1 Stratigraphy – Yes, see Sections 3.2, 4.1 and 4.3.1. Although there is no explicit consideration of
the stratigraphy of the synthesised geospheres, it is noted that the geology is not homogeneous, although any variation can be adequately represented through the use of averaged hydrological and geochemical parameter values. For disposal in the unsaturated zone, a total depth of unsaturated zone of 90 m is assumed. For disposal in the saturated zone, a total depth of saturated zone of 50 m is assumed. Characteristics are not assumed to change with time (see Section 4.3.1).
79 2.2.2 Host lithology – Yes, see Sections 3.2, 3.4, 4.1 and 4.3.1. Key physical characteristics of synthesised geospheres are summarized in Table 7. Characteristics are not assumed to change with time (see Section 4.3.1).
80 2.2.3 Disturbed zone, host lithology – Yes, see Sections 3.2, 4.1 and 4.3.1. Disturbed zone is assumed to be part of the near field. Voids and cracks in the host geology immediately adjacent to the borehole are assumed to be grouted and sealed during the drilling process.
81 2.2.4 Discontinuities, large scale (in geosphere) – No, it is assumed that there are no large-scale discontinuities.
82 2.2.5 Contaminant migration path characteristics (in geosphere) – Yes, see Sections 3.2 and 4.3.1. Consider both porous and fracture flow and transport in the unsaturated and saturated geosphere. Characteristics are not assumed to change with time (see Section 4.3.1).
83 2.2.6 Mechanical processes and conditions (in geosphere) – No, it is assumed that there are no significant mechanical processes and conditions affecting the geosphere and that the disposal borehole will not affect the mechanical properties of the geosphere.
84 2.2.7 Hydraulic/hydrogeological processes and conditions (in geosphere) – Yes, see Sections 3.2, 3.4 and 4.3.1. A range of conditions is considered (see Tables 7, 8 and 9). Conditions are not assumed to change with time (see Section 4.3.1).
85 2.2.8 Chemical/geochemical processes and conditions (in geosphere) – Yes, see Sections 3.2, 3.4 and 4.3.1. Conditions in the geosphere are assumed not to change with time.
86 2.2.9 Biological/biochemical processes and conditions (in geosphere) – Yes, see Sections 3.2, 3.4 and 4.3.1. Conditions in the geosphere are assumed not to change with time.
87 2.2.10 Thermal processes and conditions (in geosphere) – No, see Sections 2.5, 3.2, 3.4 and 4.3.1. It is assumed that there are no significant sources of thermal heat in the geosphere and that the inventory does not significantly affect the thermal properties of the geosphere.
88 2.2.11 Gas sources and effects (in geosphere) – No, see Section 3.2. It is assumed that there are no significant sources of geothermal heat or gas in the vicinity of the disposal borehole.
89 2.2.12 Geological resources (in geosphere) – Yes, see Sections 3.2, 4.1 and 4.3.1. Water assumed to be abstracted from the geosphere.
2.3 Surface Environment90 2.3.1 Topography and morphology – Yes, see Section 3.3. It is assumed that the biosphere has subdued
relief.91 2.3.2 Biomes – Yes, see Sections 3.3 and 4.3.1. It is assumed that a range of crops and livestock is raised
consistent with the assumption of subsistence agriculture in non-extreme climate conditions. Assume contamination due to irrigation of crops and watering of animals.
166

92 2.3.3 Soil and sediment – Yes, see Sections 3.3 and 4.3.1. It is assumed that soils have similar mineralogical properties to those of the underlying geosphere from which they are assumed to have been derived. It is also assumed that they are capable of supporting a range of crops. Assume contamination due to irrigation of crops.
93 2.3.4 Aquifers and water-bearing features, near surface – Yes, see Sections 3.3, 4.1 and 4.3.1. Water assumed to be abstracted from the geosphere.
94 2.3.5 Terrestrial surface water bodies – No, see Section 3.3. Interest limited to water in abstraction borehole.
95 2.3.6 Coastal features – No, see Section 3.3. Disposal borehole is assumed to be located in a position that will not be susceptible to coastal processes.
96 2.3.7 Marine features – No, see Section 3.3. Disposal borehole is assumed to be located in a position that will not be susceptible to coastal processes and possible future sea level rises and so marine features are not considered to be relevant.
97 2.3.8 Atmosphere – Yes, see Section 4.3.1. Needs to be considered for the suspension of contaminated soil and gas inhalation pathways.
98 2.3.9 Vegetation – Yes, see Sections 3.3 and 4.3.1. It is assumed that a range of crops is raised consistent with the assumption of subsistence agriculture in non-extreme climate conditions.
99 2.3.10 Animal populations – Yes, see Sections 3.3 and 4.3.1. It is assumed that a range of animals is raised consistent with the assumption of subsistence agriculture in non-extreme climate conditions.
100 2.3.11 Meteorology – Yes, see Section 3.3. It is assumed that the climate is consistent with the assumption of subsistence agriculture land use and is non-extreme.
101 2.3.12 Hydrological regime and water balance (near-surface) – Yes, see Section 3.2. Infiltration into the geosphere influences leaching of radionuclides from contaminated soil and the flux of water in the geosphere.
102 2.3.13 Erosion and deposition – Yes, see Sections 3.2, 3.3, 4.1 and 4.3.1. It is assumed that there is gradual net erosion on a regional and local scale resulting in the loss of the closure zone over a 100,000 year period.
103 2.3.14 Ecological/biological/microbial systems – Yes, see Sections 3.3 and 4.3.1. It is assumed that a range of crops is grown, consistent with the assumption of subsistence agriculture in non-extreme climate conditions. It is assumed that the crops are grown on soil contaminated with water from the abstraction borehole.
104 2.3.15 Animal/Plant intrusion – No, see Section 4.3.1. Given the assumed low erosion rate and the depth of the disposal zone it is considered that there is no need to consider biotic intrusion.
2.4 Human Behaviour105 2.4.1 Human characteristics (physiology, metabolism) – Yes, see Section 5.4. Implicitly considered in
dose factors for ingestion and inhalation of radionuclides.106 2.4.2 Adults, children, infants and other variations – Yes, see Section 2.5. Consider annual individual
effective dose to an average adult member of a hypothetical critical group.107 2.4.3 Diet and fluid intake – Yes, see Sections 3.3 and 4.3.1. Ingestion of contaminated water, crops and
animal produce.108 2.4.4 Habits (non-diet-related behaviour) – Yes, see Sections 3.3 and 4.3.1. The assumed human habits
give raise to exposure via ingestion of crops, soil and animal products, inhalation of gases and dust, and external irradiation from contaminated soil.
109 2.4.5 Community characteristics – Yes, see Sections 3.3 and 4.3.1. Assume a subsistence agriculture community. Two exposure groups considered: farmer and house dweller.
110 2.4.6 Food preparation and water processing – Yes, see Sections 3.3 and 4.3.1. Although it is assumed that the abstracted water used is not treated or stored before use, food is assumed to be processed before consumption.
111 2.4.7 Dwellings – Yes, see Sections 3.3 and 4.3.1. At end of institutional control period, it is assumed that a dwelling can be constructed above the disposal borehole.
112 2.4.8 Natural/semi-natural land and water use – No, see Sections 3.3 and 4.3.1. Assume subsistence agriculture rather than natural/semi-natural land use.
113 2.4.9 Rural and agricultural land and water use – Yes, see Sections 3.3 and 4.3.1. Assume subsistence agriculture and abstracted groundwater used for domestic and agricultural purposes.
114 2.4.10 Urban and industrial land and water use – No, see Sections 3.3 and 4.3.1. Assume subsistence agriculture rather than urban and industrial land use.
167167167
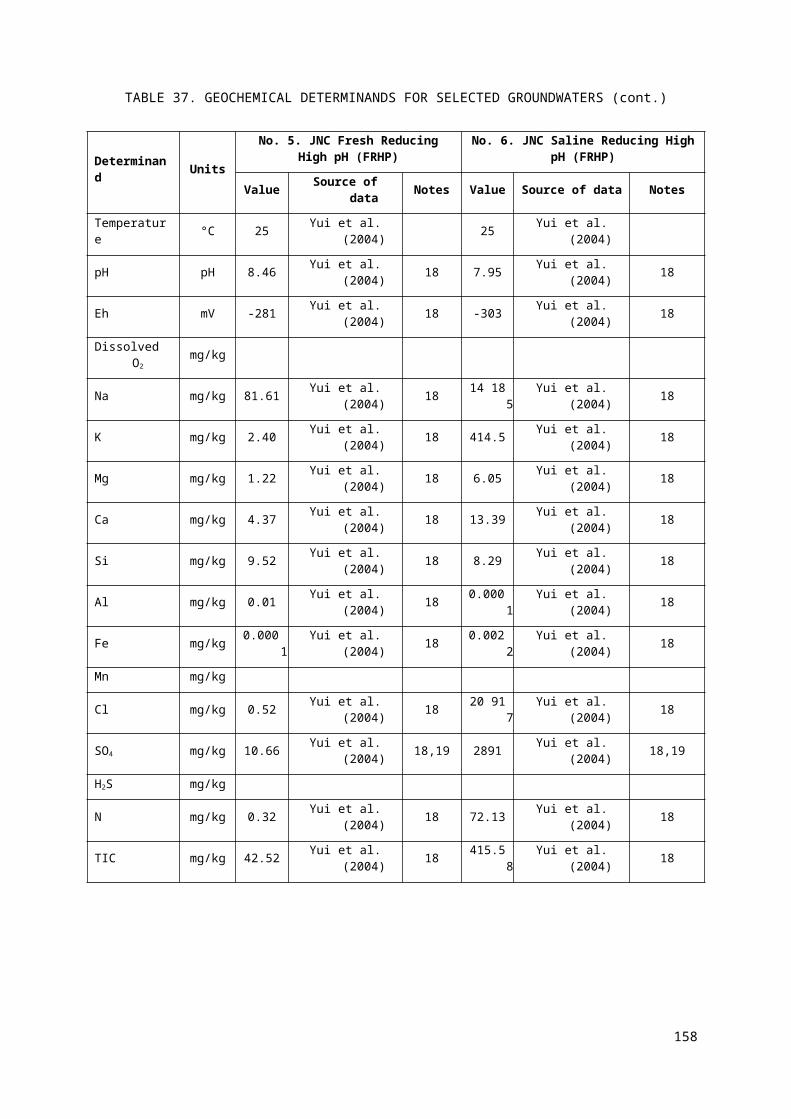
115 2.4.11 Leisure and other uses of environment – No, see Sections 3.3 and 4.3.1. Assume subsistence agriculture rather than leisure or other use.
3 CONTAMINANT FACTORS
3.1 Contaminant Characteristics116 3.1.1 Radioactive decay and in-growth – Yes, see Section 3.1.1 and Appendix I.117 3.1.2 Radionuclide properties, other – Yes, see Section 3.1.1. It is assumed that the radionuclides in the
disused sources are in a physical state that means that they are soluble.118 3.1.3 Organics and potential for organic forms – No, it is assumed that there is no significant organic
component in the waste.119 3.1.4 Chemical/organic toxin stability – No, see Sections 1.3 and 2.2.4. Non-radiological impacts, which
might arise from the content of chemically or biologically toxic materials in the waste or engineered barrier materials, are considered to be beyond the scope of the GSA.
120 3.1.5 Inorganic solids/solutes – Yes, see Section 3.1.1 and FEP 3.1.2.121 3.1.6 Volatiles and potential for volatility – Yes, see Section 3.1.1. Iodine is potentially volatile.122 3.1.7 Noble gases – Yes, Rn-222 in-grown from Ra-226 (see Table A.4).
3.2 Contaminant Release and Migration Factors123 3.2.1 Contaminant release pathways – Yes, see Section 4.3.1. Consideration is given to releases via
water and gas pathways.124 3.2.2 Chemical/geochemical-mediated processes, effects on contaminant release and migration – Yes,
see Sections 3.1, 3.2 and 4.3.1. Consideration is given to a range of near-field and geosphere chemical conditions and sorption processes.
125 3.2.3 Microbial/biological-mediated processes, effects on contaminant release and migration – No, assume no need to represent microbial/biological-mediated processes explicitly. However, these processes are implicitly represented through considering a range of near-field and geosphere chemical conditions (see Sections 3.1.3 and 3.2).
126 3.2.4 Water-mediated migration of contaminants – Yes, see Sections 3.2 and 4.3.1. Consideration given to advection, dispersion and diffusion.
127 3.2.5 Solid-mediated migration of contaminants – Yes, see Section 4.3.1. Erosion of soil contaminated by irrigation water considered. Soil assumed to be contaminated with radionuclides from borehole once closure zone is removed by erosion (after 100 000 years).
128 3.2.6 Gas-mediated migration of contaminants – Yes, see Section 4.3.1. Scenario considers release of radionuclides in the gas phase from the borehole.
129 3.2.7 Atmospheric migration of contaminants – Yes, see Section 4.3.1. Scenario considers release of contaminated gas into a dwelling and suspension and dispersion of soil contaminated by irrigation water considered.
130 3.2.8 Animal, plant and microbe mediated migration of contaminants – Yes, see Section 4.3.1. Irrigation of crops and watering of animals considered.
131 3.2.9 Colloids mediated migration of contaminant – No. Assume that in systems with a cement grout near field, colloids are not readily formed due to the chemical conditions.
3.3 Exposure Factors132 3.3.1 Food chains, uptake of contaminants in – Yes, see Sections 3.3 and 4.3.1. Ingestion of
contaminated crops and animal produce considered.133 3.3.2 Drinking water, foodstuffs and drugs, contaminant concentrations in – Yes, see Sections 3.3 and
4.3.1. Scenario includes consideration of the consumption of contaminated drinking water, crops and animal produce and inhalation of contaminated gas.
134 3.3.3 Environmental media, contaminant concentrations in – Yes, see Section 4.3.1. Need to consider contaminant concentrations in soil, air, crops and animals.
135 3.3.4 Non-food products, contaminant concentrations in – No, see Sections 3.3 and 4.3.1. Humans are assumed not to be exposed via non-food products for the scenario.
136 3.3.5 Exposure modes – Yes, see Sections 3.3 and 4.3.1. Scenario includes consideration of the ingestion, inhalation gas and external irradiation.
137 3.3.6 Dosimetry – Yes, see Sections 2.4 and 2.5. Consider annual individual effective dose to an average adult member of a hypothetical critical group.
168
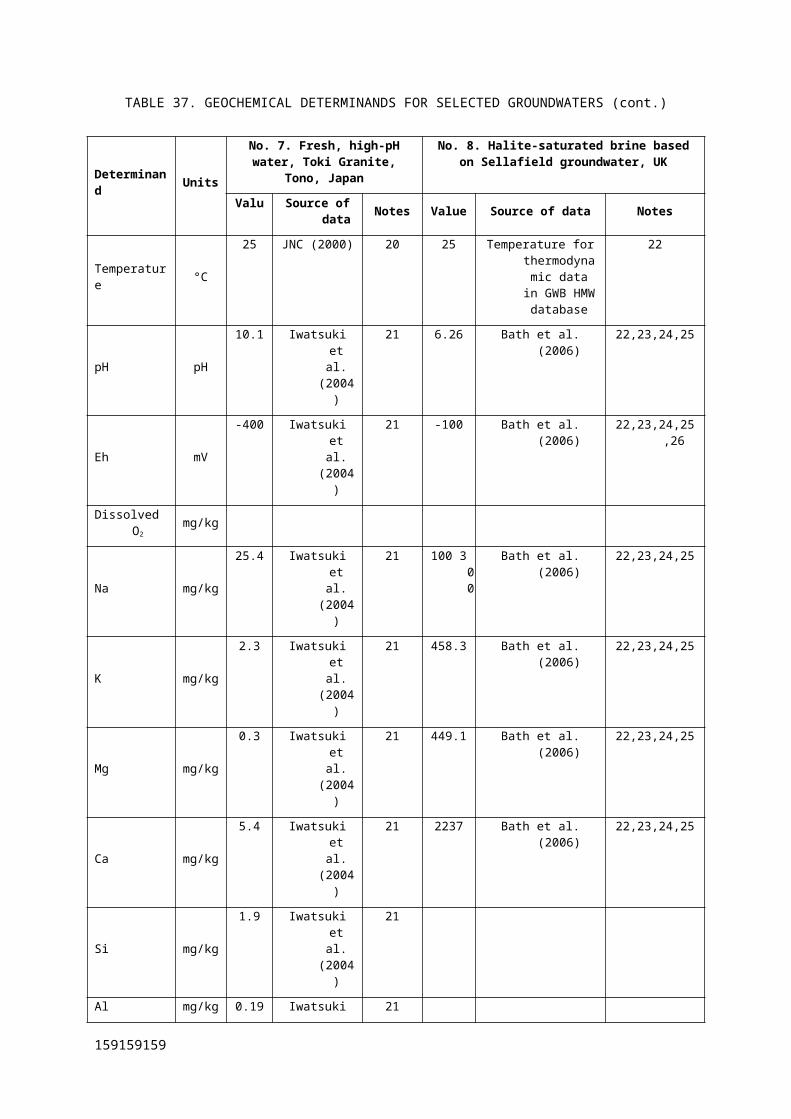
138 3.3.7 Radiological toxicity/effects – Yes, see Sections 2.4 and 2.5. Consider annual individual effective dose to an average adult member of a hypothetical critical group.
139 3.3.8 Chemical toxicity/effects – No, see Sections 1.3 and 2.2.4. Non-radiological impacts, which might arise from the content of chemically or biologically toxic materials in the waste or engineered barrier materials, are considered to be beyond the scope of the GSA.
140 3.3.9 Radon and radon daughter exposure – Yes, see Section 4.3.1. Rn-222 in-grows from Ra-226.
169169169
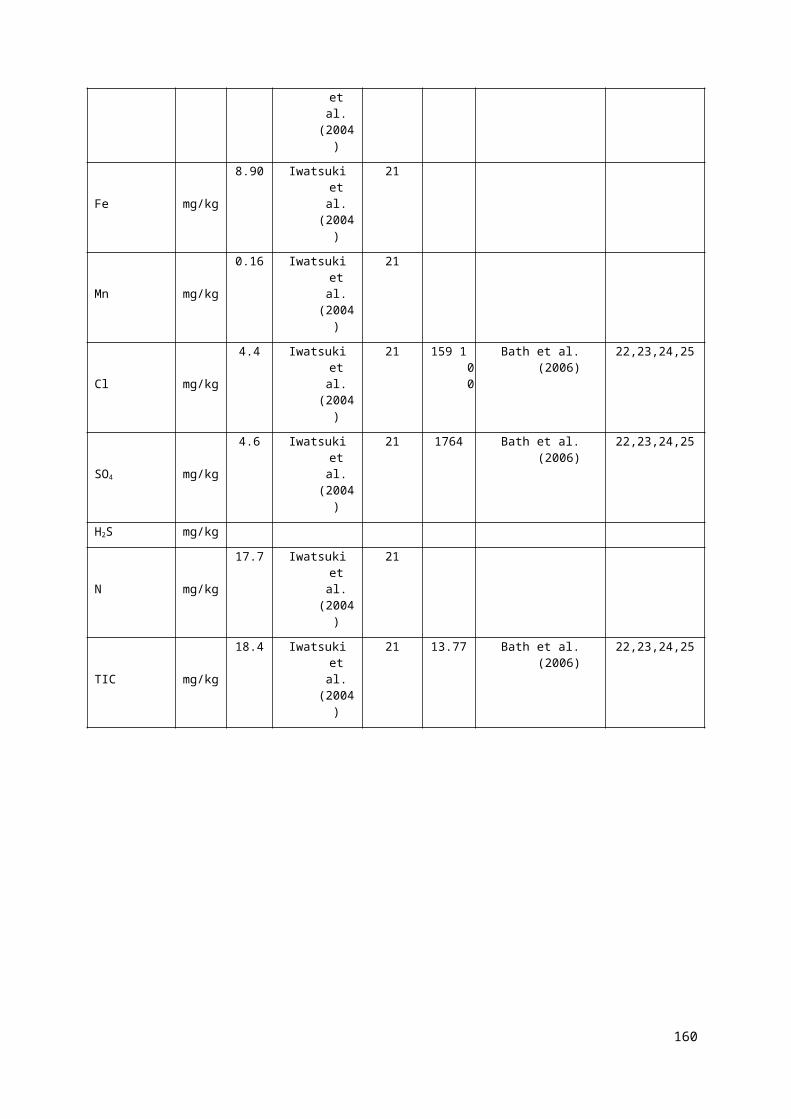
Appendix VIIAPPROACH FOR CONCEPTUAL MODEL DEVELOPMENT
Once the scenarios have been developed, their consequences must be analysed. To allow this, it is
necessary to develop a conceptual model of the disposal system, its environmental setting and the
associated release, transport and exposure mechanisms and media. A conceptual model can be defined
as “a set of qualitative assumptions used to describe a system” [89]. A conceptual model should
comprise a description of:
the model’s features, events and processes (FEPs);
the relationships between these FEPs; and
the model’s scope of application in spatial and temporal terms.
The model should have enough detail to allow appropriate mathematical models to be developed to
describe the behaviour of the system and its components.
For the purpose of the current assessment the Interaction Matrix Approach is used to develop
conceptual models in a traceable manner. This approach is based on ideas developed in BIOMOVS II
[90] and subsequently developed and enhanced in a number of studies such as Refs [91, 92, 93, 94].
The use of the Interaction Matrix allows the graphical representation of system interactions through
the use of formalized procedures and has the advantage of allowing disposal system components to be
included explicitly in the Interaction Matrix.
The approach starts with a top down approach to dividing the system into constituent parts. The main
components are identified and listed in the leading diagonal elements (LDEs) of the matrix. The
interactions between the LDEs are then noted in the off-diagonal elements (ODEs). When using the
Interaction Matrix approach the convention is to allocate ODEs in the direction of contaminant
migration. In this way, contaminant migration pathways and the associated exposure pathways and
exposure groups can be traced and translated into the conceptual model. Each transfer of contaminant
from LDE to another LDE via an ODE can be represented by a mathematical formalism and
incorporated into the mathematical model.
As noted above, the first step in developing the Interaction Matrix is to identify the main components
of the disposal system that can be distinguished on the basis of their chemical and/or physical
characteristics. At the top level, the disposal system can be divided into the near field, geosphere and
biosphere. Based on the description of the disposal system (Section 3) and the scenarios to be
assessed (Section 4), the near field, geosphere and biosphere components listed below can be
identified.
VII.1. NEAR-FIELD COMPONENTS
170
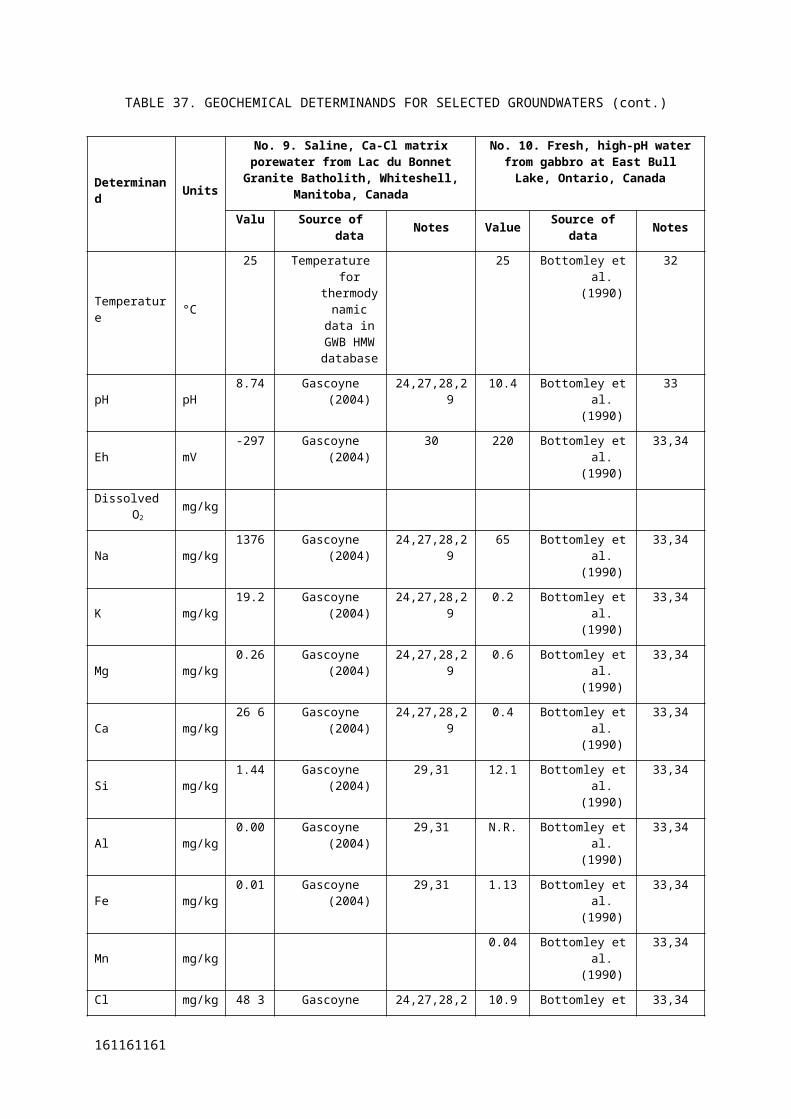
Five near-field components can be identified.
Source: The source material, the source container (in which the radioactive source material is
held), and the stainless steel capsule (in which the source container is assumed to be emplaced).
It is conservatively assumed that the source container will have failed prior to disposal,
however the stainless steel capsule is assumed to start to corrode once the disposal container
has been breached. Once the disposal container has been breached, various corrosion
mechanisms (including localized and general corrosion) are assumed to occur and cause the
capsule to be breached (see Table 11).
Containment Barrier: The barrier between the capsule and the disposal container, which is
assumed to be cement grout. Physical and chemical degradation of the cement grout of barrier
is assumed to start once the disposal container has started to degrade (see Table 11).
Disposal Zone: The stainless steel disposal container, the disposal zone backfill (cement grout)
and the associated borehole casing are considered to comprise the disposal zone. Whilst the
HDPE casing is conservatively assumed to fail on closure, it is assumed that the sta
inless steel disposal container remains intact until breached by corrosion (see Table 11).
Closure Zone: The cement grout backfill, the anti-intrusion barrier and the uppermost 5 m of
native soil or crushed rock are considered to comprise the closure zone (Fig. 4).
Disturbed Zone and Plug: The plug at the bottom of the borehole and the backfill in the
disturbed zone between the casing and the native rock are assumed to be cement grout (Fig. 4).
VII.2. GEOSPHERE COMPONENTS
At a high level (appropriate for the GSA), the geosphere can be divided into two zones.
Unsaturated Zone: comprising the region between the ground surface and the water table but
excluding the rooting zone for major food crops (soil).
Saturated Zone: comprising the region below the water table.
VII.3. BIOSPHERE COMPONENTS
Given that the exposure pathways being considered in the Design Scenario are the domestic and
agricultural use of contaminated water by humans and the inhalation of contaminated gas
(Section 4.2.1), the biosphere can be sub-divided into six components.
Humans: who are assumed to be farmers or house dwellers.
Soil: the region in which significant biological activity occurs from the ground surface to the
base of the rooting zone for major food crops.
171171171
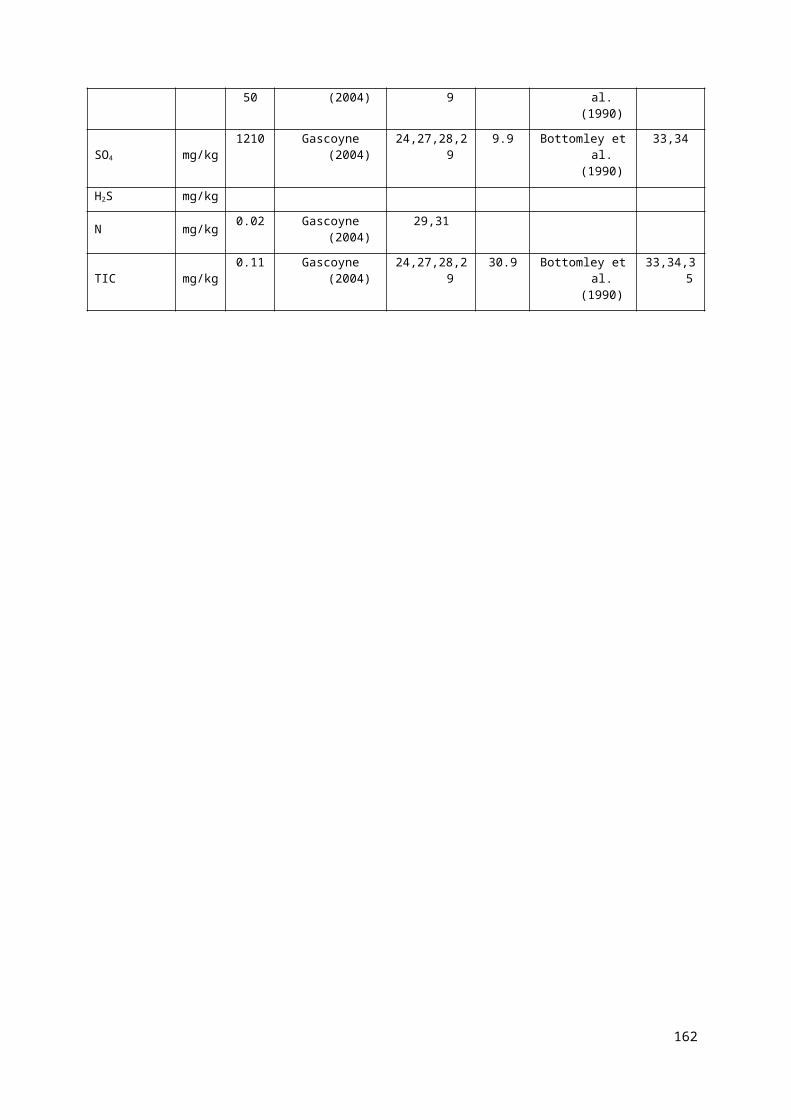
Atmosphere: the air breathed by humans and fauna, including dust in it. Includes air into
which the contaminated gas is assumed to discharge from the borehole (i.e. the air in the
dwelling constructed on top of the borehole).
Crops: the root and green vegetables that are irrigated using contaminated water and are
harvested by humans.
Animals: the cattle that are raised by humans and are given contaminated drinking water.
Elsewhere: Radionuclides can be lost by a number of mechanisms from the immediate vicinity
of the release (e.g. ventilation of the dwelling, groundwater flow past the abstraction borehole).
They are no longer of interest in the evaluation of individual doses since they are lost to
locations where radionuclide concentrations are lower and the associated doses lower. For the
purpose of this safety assessment and the conceptual model, these locations are described as
being ‘elsewhere’.
VII.4. INTERACTIONS BETWEEN COMPONENTS
Based upon expert judgement (gained from previous assessments of the borehole disposal concept
such as Refs [91, 92, 95]) and information from the description of the disposal system and the
scenarios to be assessed, key interactions between the various disposal system components have been
identified that result in the release and migration of radionuclides through the system and the
subsequent exposure of humans for both the Design and Defect Scenarios. These are shown on Fig. 7
for the case where the disposal zone is saturated and in Fig. 8 for the case in which it is unsaturated.
The two cases are broadly similar, the main difference being the nature of water flow through the near
field (saturated vs. unsaturated) and the exclusion of gas migration in the saturated case. The
components and their interactions for the Defect Scenario are the same as those for the Design
Scenario since the faster degradation rates, earlier failure times, and faster radionuclide migration
times of the Defect Scenario can be accounted for by modifying the associated parameters in the
mathematical model (e.g. container degradation rates) rather than fundamentally altering the
Interaction Matrices.
REFERENCES
[89] INTERNATIONAL ATOMIC ENERGY AGENCY, Radioactive Waste Management
Glossary, 2003 Edition, IAEA, Vienna (2003).
172
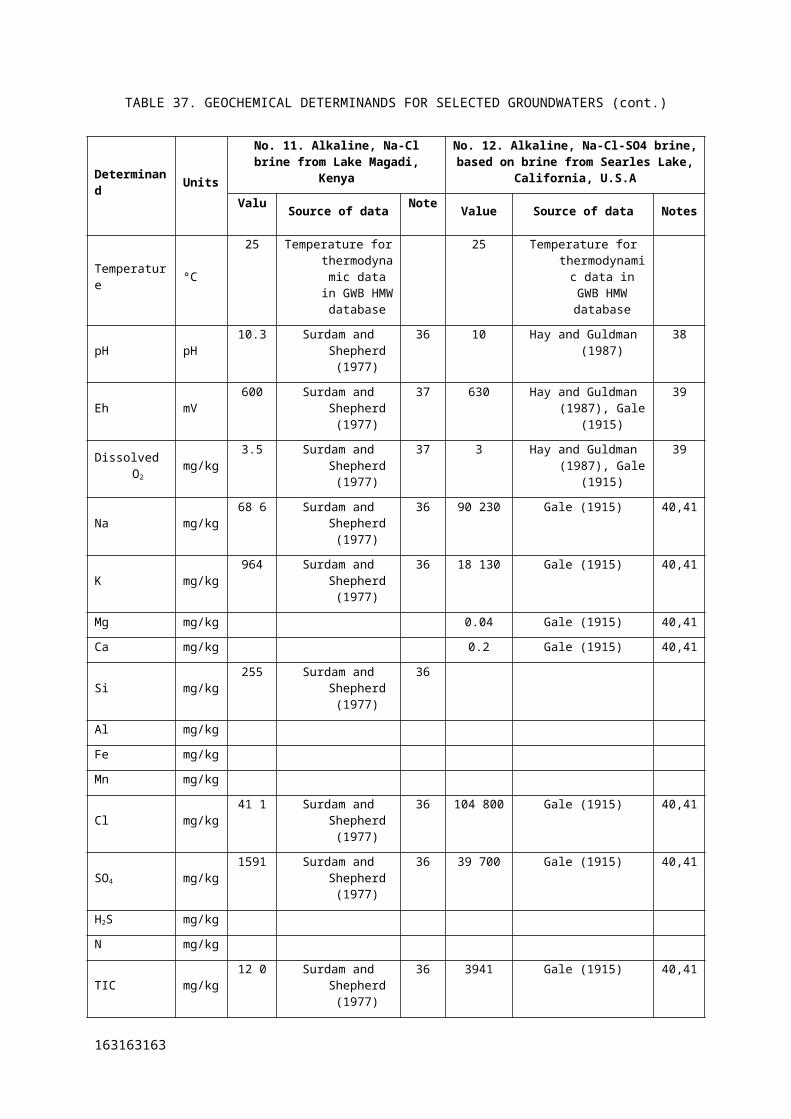
[90] BIOMOVS II, Development of a Reference Biospheres Methodology for Radioactive
Waste Disposal, BIOMOVS II Technical Report No. 6, published on behalf of the BIOMOVS
II Steering Committee by the Swedish Radiation Protection Institute, Sweden (1996).
[91] INTERNATIONAL ATOMIC ENERGY AGENCY, Improvement of Safety Assessment
Methodologies for Near Surface Disposal Facilities, Volume II: Test Cases, IAEA-ISAM-2,
IAEA, Vienna (2004).
[92] LITTLE, R.H., VAN BLERK, J., WALKE, R.C., BOWDEN, R.A., Generic Post-Closure
Safety Assessment and Derivation of Activity Limits for the Borehole Disposal Concept,
Quintessa Report QRS-1128A-6 v2.0, Quintessa Limited, Henley-on-Thames (2004).
[93] ANDERSSON, J., RIGGARE, P., SKAGIUS, K., Project SAFE - Update of the SFR-1
Safety Assessment Phase 1, SKB Report R-98-43, Swedish Nuclear Fuel and Waste
Management Company, Stockholm (1998).
[94] BRITISH NUCLEAR FUELS LIMITED (BNFL), Drigg Post-Closure Safety Case, British
Nuclear Fuels plc, Sellafield (2002).
[95] KOZAK, M.W., STENHOUSE, M.J., VAN BLERK, J.J., Borehole Disposal of Spent
Sources, Volume II: Preliminary Safety Assessment of the Disposal Concept, NECSA Report
GEA-1353 (NWS-RPT-00\013), South African Nuclear Energy Corporation, Pretoria (2000).
173173173
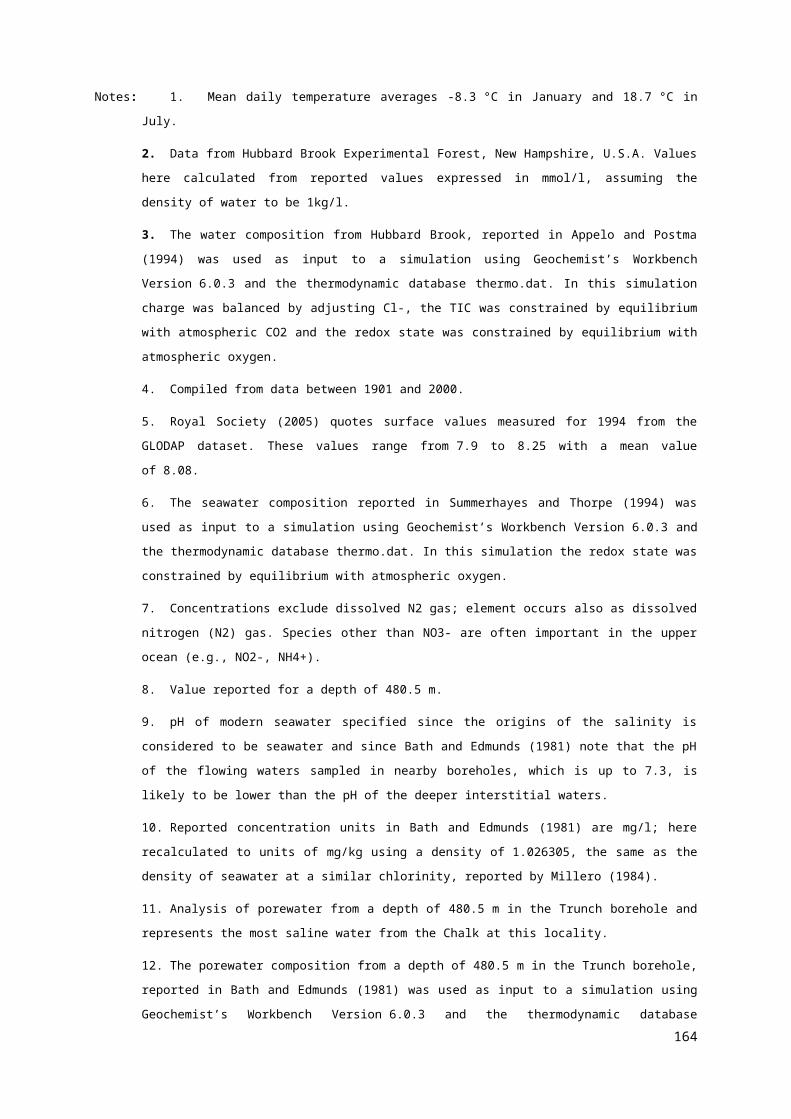
Appendix VIIICEMENT DEGRADATION MODEL
VIII.1. IMPORTANT IMPACTS OF CEMENT EVOLUTION
Cement evolution may affect the overall functioning of the barrier system in the borehole in the
following major ways.
The period for which steel barrier integrity is maintained will depend upon evolving chemical
reactions between porewater and cement phases. These reactions will influence the ability of
the cement to buffer porewater pH and to control the accessibility of steel surfaces to certain
aqueous constituents, principally chloride. High pH and low chloride will favour steel longevity
(see Appendix I).
The ability of the cement to sorb radionuclides that escape from the waste container will depend
upon the extent to which the mineral constituents of the cement have evolved physically and
chemically. The physical evolution of solid grains will influence the surface areas that are
available for sorption and the accessibility of the grains to migrating fluid. The pH evolution of
the porewater will also influence sorption.
Evolving chemical reactions within the cement may control the concentration of ligands that may
complex with certain radionuclides, thereby increasing their mobility. For example, carbonate
in the groundwater will tend to react with cementitious phases, thereby rendering the carbonate
unable to complex with Am.
Fluctuations in the permeability of the cement may influence the flux of water that is available to
corrode steel barriers and to transport radionuclides.
VIII.2. PROCESSES CONTROLLING CEMENT DEGRADATION
The chemical and physical evolution of the cement used in the borehole environment is a function of
many factors (e.g. Refs [96, 97]), principally:
the chemical composition of the natural groundwater;
the chemical composition of the cement;
the initial physical properties of the cement (which depend partially upon the methods used to
prepare and emplace the cement);
the flux of the groundwater; and
the natural thermal gradient.
174
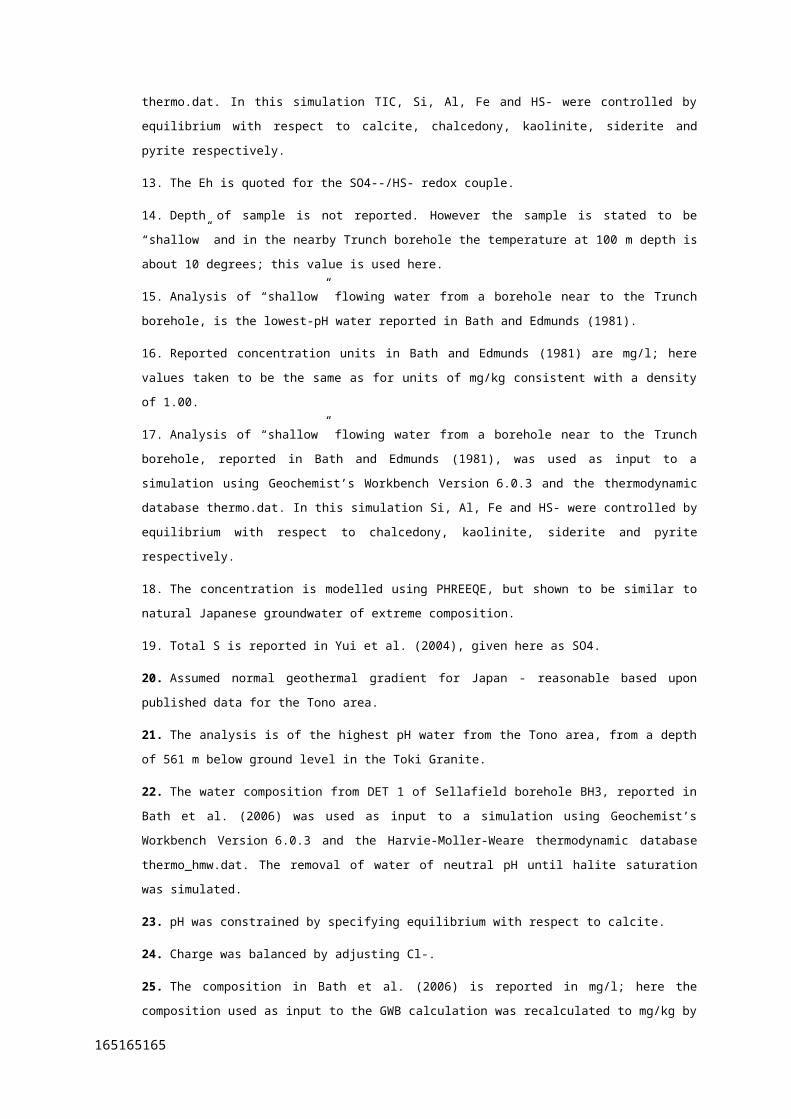
Complex couplings between these factors will determine their impacts on the capacity of the cement
to buffer pH, which is a key parameter that affects the longevity of the steel barriers. In particular,
chemical cement degradation processes will be coupled to the groundwater flux since mineral
precipitation and dissolution will cause the cement’s porosity and permeability to vary whilst the flux
of groundwater will in turn influence the chemical reactions that occur. Similarly, these coupled
processes will be affected by, and also affect, the physical integrity of the cement.
The approach taken in the GSA is to evaluate the performance of the barrier system for reasonable
bounding assumptions relating to the chemical and physical evolution of the cement, rather than to
undertake detailed coupled modelling of the cement and its evolution. To enable these bounding
assumptions to be well-founded, it is appropriate to review how the key processes might influence the
barrier function of the cement.
The following factors are particularly important.
If the natural groundwater has a high pH initially, the stability of the cement will tend to be
favoured; lower pH will tend to promote cement degradation.
Reactions between the cement and chloride in the groundwater could produce CaCl2, calcium
aluminates and Friedel’s salt, thereby reducing the concentration of chloride in the water that is
available for participating in the corrosion of stainless steel.
Reactions between cement and carbonate dissolved in the groundwater would result in the
formation of solid calcium carbonate within the cement. This process would lead to a reduction
in porosity and permeability, causing a decrease in the flux of groundwater passing through the
cement. Potentially a consequence of this process could be an increase in the time for which
high-pH conditions are maintained adjacent to the waste containers. On the other hand, calcium
carbonate precipitation along fluid flow paths, for example interconnected fractures, could have
the effect of armouring the cement phases and restricting their access to the fluid. This process
might effectively decrease the time for which the fluid contacting the steel barriers would
have pH buffered at a high value.
Sulphate in the groundwater would also react with the cement to form solid phases such as
ettringite, monosulphatealuminate and gypsum. Precipitation of these minerals results in a
significant solid volume increase. Initially, as in the case of calcium carbonate precipitation, the
consequence would be a decrease in porosity and permeability, tending to prolong the period of
high-pH buffering. However, the volume increase would eventually produce fracturing which
would allow groundwater to flow relatively quickly to contact the steel barrier components.
Thus, the buffering of pH to high values may be inhibited.
175175175
If corrosion of the steel components of the barrier system occurs before the cement has degraded,
the greater volume of the corrosion products compared with the original steel may cause
cracking. The cracks may result in the permeability of the cement increasing significantly,
leading in turn to greater fluxes of groundwater to the remaining steel. Overall, this process
could potentially lead to more rapid breaching of the steel components than would otherwise
occur.
The second process is considered to be of much less importance for the present work than the other
processes. The extent to which binding of chloride occurs will depend upon the concentrations and
characteristics of other constituents within the pore fluid. Notably carbonate and sulphate will
generally act to diminish the binding of chloride. The chemical composition of the cement is also a
significant control. In reality, chloride binding would have less effect on the strength and pH-
buffering capacity of the cement barrier than would attack by sulphate and/or carbonate.
VIII.3. AVAILABLE CEMENT DEGRADATION MODELS
Of particular interest in the present project is the temporal pH evolution of the porewater in the
cement. The importance of this evolution is due to the strong influence of pH on the rates of corrosion
of the steel barriers. The other evolutionary processes are of relevance mainly because they influence
this pH evolution. Whilst chloride binding may also influence the corrosion rate of the steel, by
decreasing the concentration of chloride in the porewater that contacts the steel, this process is
assumed to be of secondary importance in the present project.
The precipitation of carbonate and sulphate phases could influence radionuclide migration in other
ways besides affecting pH buffering. For example, this precipitation could affect sorption of
radionuclides on cementitious phases or the generation of cement colloids. However, these influences
cannot be predicted confidently and are considered to be generally positive so that they can be
conservatively neglected in the present project.
Several stages can be identified in the pH evolution of cement porewater.
Initially, the pore fluid produced by the cement contains relatively high concentrations of soluble
metal hydroxides, NaOH and KOH. These hydroxides maintain the pH of pore fluids at values
greater than about pH 13. There are only small quantities of NaOH and KOH present in the
cement, so the period for which these high pH conditions is maintained is relatively short.
After the soluble hydroxides have been leached, pH is regulated by the dissolution of portlandite,
Ca(OH)2. This latter phase buffers the Ca concentration in the fluid at around 2x10⁻² M and
causes the pH to be maintained at about 12.5 (at 25°C).
176
Subsequently, dissolution of calcium silicate hydrate (C-S-H) gel controls pH. This process is
probably the most important pH control over timescales relevant to performance assessment. C-
S-H gel dissolution initially maintains Ca concentrations in the pore fluid at high values,
comparable with that caused by the earlier portlandite buffering. However, C-S-H dissolution
occurs incongruently, causing the Ca/Si ratio of the solid to decrease with time due to
preferential Ca removal. Consequently the Ca/Si ratio decreases from about 2.5 to 1.7/1.8 when
pH starts to decrease. When a Ca/Si ratio of about 0.85 has been reached the remaining C-S-H
dissolves congruently at a pH of ~10.5.
Most cement-groundwater interaction models focus on representing the C-S-H gel, reflecting the
complexity of the structure and chemical behaviour of this phase. The C-S-H gel is a hydration
product of the tricalcium silicate (3CaO.SiO2) and dicalcium silicate (2CaO.SiO2) in the cement
clinker. However, the chemical composition of the C-S-H gel is not fixed but has a variable Ca/Si
ratio, ranging from about one to more than two. The structure of the gel is nearly amorphous, but is
thought to have some clay-like layering, consisting of sheets of calcium silicate with interlayer
calcium ions and water [96].
The degree to which the C-S-H phase dissolve incongruently increases with the Ca/Si ratio of the
solid. Gels with Ca/Si > 2 equilibrate with aqueous solutions having Ca/Si > 10 000, whereas those
having Ca/Si 1 regulate aqueous solutions at Ca/Si < 1. Although the dissolution behaviour is non-
stoichiometric, it is thought that it is driven by thermodynamic equilibrium. The evidence seems to be
good that tobermorite and jennite-like units occur in the C-S-H, but the quantities of bound hydroxyls
and tetrahedral Al at certain Ca/Si ratios cannot be explained by a gel consisting entirely of
tobermorite and jennite-like structural units. However, a solid solution between tobermorite and
jennite-like units and calcium hydroxide may account for most of the bulk gel composition. In
addition, at the high mean Ca/Si ratios found in Ordinary Portland Cement (OPC) pastes there may be
significant interlayering with AFm ((Ca2(Al,Fe)(OH6)].X.nH2O where X is a univalent anion or
‘half’ a divalent anion, such as hydroxyl, sulphate or carbonate).
Three kinds of model have been proposed to explain this C-S-H gel behaviour from a thermodynamic
perspective.
1. Solubilities in the system CaO-SiO2-H2O are recalculated to unique solubility products raised to
fractional powers as a function of the Ca/Si ratio (e.g. Ref. [98]). However, this approach is
inconsistent with the law of mass action, which requires that chemical reactions have non-
fractional stoichiometric coefficients. Integer coefficients are required to ensure that aqueous
solutions are electrically neutral. In other respects this model is attractive because variable
solubility products are used to fit experimental data in the system CaO-SiO2-H2O.
177177177
2. The Gibbs-Duhem equation is applied at constant pressure and temperature to each phase in the 3-
component system CaO-SiO2-H2O:
Equation 8
XCi dmC
i +XSi dmS
i +X Hi dmH
i =0
where i are chemical potentials in each component i. An expression of the following type can be
written to relate the solids Ca/Si ratio to the aqueous phase’s chemical composition:
Equation 9
RC /S=XC
S
XSS =
−dmS
dmC
1−mSaq RH /S
55. 51+
mCaq RH /S
55 .51
where RH/S is the molar H2O/SiO2 ratio of the solid and m denotes molal units. This approach suffers
from the major disadvantage that it does not take into account any structural information about C-S-H
gels, such as non-ideal mixing behaviour or miscibility gaps.
3. Solid-solution models of various types. The first such model was developed by Ref. [99] who
concluded that C-S-H gel with Ca/Si > 1 could be described as a solid solution between
Ca(OH)2 and a calcium silicate component with low Ca/Si ratio. From the perspective of
structural and aqueous chemical data, there is good evidence that C-S-H gel can be represented
by a solid-solution. During recent years there have been advances in the construction of solid
solution models for C-S-H gels.
Projects connected with radioactive waste disposal have tended to explain C-S-H gel behaviour using
models of either the first or second type. Owing to the requirement to consider long time periods,
incongruent C-S-H gel dissolution must be modelled deterministically, and account for the
experimentally observed relationships between Ca/Si ratios and variations in pH and calcium and
silicon concentrations. A recent, more thermodynamically defensible approach is describing the
incongruent dissolution of CSH gel as a non-ideal solid solution-aqueous solution (SSAS).
VIII.4. REPRESENTATION OF CEMENT DEGRADATION IN THE GSA
Detailed models of cement evolution of the kinds outlined in Section VIII.3 are inappropriate for the
GSA. These models would take considerable resources to develop using experimental data for
particular cement and fluid compositions. From the results obtained, it would then be necessary to
abstract general evolutionary trends in pH that are appropriate for safety assessment calculations.
Thus, there is no advantage to be gained from developing such models in comparison to deducing
general temporal variations in pH directly from experimental information.
178
The approach taken for the GSA is to use a combination of experimental results and modelling results
reported in Refs [97 and 100], to develop a generic model for the pH evolution of cement suitable for
the GSA and use this as an analogue for the evolution of the cement’s chemical and physical
characteristics. The particular model proposed by Ref. [97] is widely used model and of the first type
outlined in Section VIII.3.
Reference [97] predicted that a volume of fresh groundwater within the range c. 4 500 to c. 7 500
times the total pore volume would be required to completely degrade cement (Fig. 24). Here,
degradation is defined to have been completed when all the CSH-gel has dissolved. Reference [97]
reported the following stages in the pH evolution of porewater flushing sulphate-resistant cement:
Stage 1 has porewater pH of around 13.5, owing to the presence of significant NaOH and KOH
and persists during flushing by about 100 pore volumes.
Stage 2 has porewater pH of about 12.5, owing to buffering by Ca(OH)2 and persists during
flushing by approximately and additional 900 pore volumes.
Stage 3 has porewater pH diminishing steadily from 12.5 to about 11, owing to buffering with C-
S-H phases having progressively decreasing Ca/Si ratios. This stage persists during flushing by
approximately an additional 4000 to 9000 pore volumes (depending upon the water
composition).
The groundwater’s carbonate content was found to be an important control on the lifetime of the
cement. This variation can be appreciated from Fig. 24a which shows that the marl porewater with
relatively high carbonate content degrades sulphate-resistant cement more rapidly than pure water.
It also appears that the composition of the cement exerts a significant impact upon the time taken for
complete cement degradation to occur. Figure 24a illustrates results obtained when sulphate-resistant
cement was modelled and shows that about 7500 pore volumes of pure water were required to achieve
complete cement degradation. In contrast, although Ref. [100] does not specify the cement
composition, it seems likely that the experimental results in Fig. 24b were obtained using cement that
was not sulphate resistant. In this case about 3 000 pore volumes of pure CO2-free water are required
to degrade the cement completely.
179179179

FIG. 24. (a) Modelled relative times taken for hydrated cement to degrade in pure water (dotted line) and in “marl-type”,
relatively CO3-rich groundwater (solid line), (after Ref. [97]); (b) Results of experimental leaching of a cement disc using
pure CO2-free water (10 ml of cumulative volume correspond to 1 sample pore volume; the double peak in the sulphate
concentration curve is due to an experimental failure) (after Ref. [99]).
In the GSA, the three reference waters, 1, 5 and 6 are considerably different in composition from
those considered in Refs [97, 100]. Of these waters, reference water 1 has the closest overall
composition to the fresh waters considered in Refs [97, 100]. However, the pH of this reference
water (4.2) is much lower than those considered in Refs [97, 100] (around 7). Consequently, it is
considered that the value of 7450 pore volumes would effectively be an upper limit on the longevity
of the cement. A more reasonable limit, taking into account the low pH of the reference water, can be
calculated by means of simple scoping calculations.
Data presented in Ref. [101] show that cement paste in Degerham cement has 38 095 moles of
leachable OH- per m3 of cement. This concentration in the solid phase can be compared with the
concentrations of OH- in Stage 1 porewater (pH 13.5, concentration of OH- c. 3.16 x 10⁻¹⁴ molal),
Stage 2 porewater (pH 12.5, concentration of OH- c. 3.16 x 10⁻¹³ molal) and groundwater (pH 4.2,
concentration of OH- c. 6.30957E-5 molal). For example, 1/ 4819 of the quantity of OH- present in the
solid phase would need to be leached by groundwater occupying porosity equivalent to 0.25 of the
cement volume, in order for the pH to be buffered by portlandite.
It should be borne in mind that the actual reference water 1 contains other pH-buffering constituents,
notably small quantities of carbonate. To evaluate the potential significance of these, simple scoping
calculations were carried out using the code Geochemist’s Workbench v. 6.0 and the thermodynamic
database “thermo.dat” [102]. In the model, cement was approximated by portlandite, which was
flushed by reference water 1. The variation in pH as a function of the quantity of reference water 1 is
shown in Fig. 25.
180
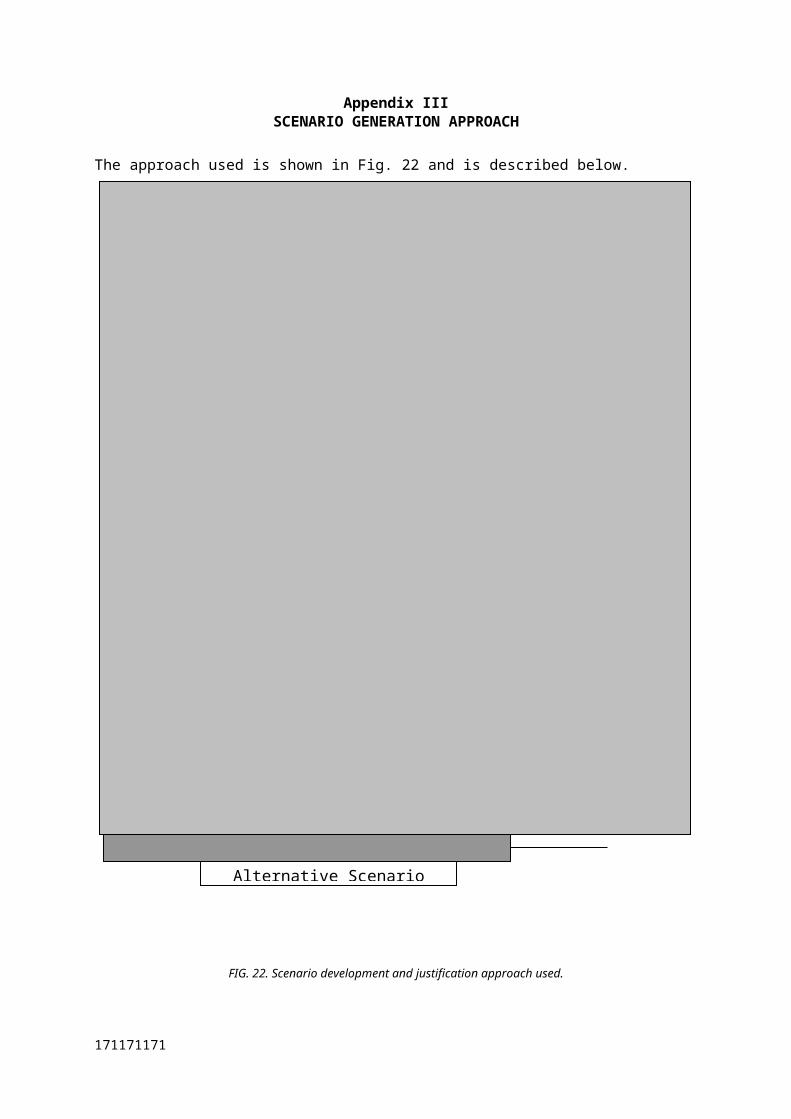
FIG. 25. Variation in porewater pH as reference water 1 reacts with portlandite-equilibrated water in contact with 1 mole of
portlandite. Reference water 1 inflows to the portlandite, equilibrates and then flows away, to be replaced by a new volume
of reference water 1. Thus, about 65 kg of this water would need to flush 1 mole of portlandite to deplete its pH buffering
capacity.
Using the result shown in Fig. 24, again assuming that the cement has a porosity of 25%, and taking
the portlandite to have a density of 2241.43 kg/m3, 5900 pore volumes would be needed to deplete the
pH buffering capacity of the cement.
Taking these results together implies that the acid fresh water would indeed degrade the cement more
readily than the fresh water considered by Ref. [97]. Furthermore, although the increased degradation
rate cannot be estimated precisely, it would seem reasonable that there would be a reduction in
longevity of the cementitious barrier of between 20% and 40%, compared to the freshwater case in
Ref. [97].
Bearing in mind the uncertainties, a reference case for water 1 is defined in which the number of
porewater flushes during Stages 2 and 3 are half those calculated for fresh water leaching of sulphate-
resistant OPC in Ref. [97]. The initially most alkaline Stage 1 is specified to be of the same duration
as in Ref. [97] because: (1) Reference [97] acknowledges that the model describes this initial stage
inadequately, so that choosing a different duration would not be well-founded; (2) in any case Stage 1
is very short compared to Stages 2 and 3 (only about 1%). In summary, for reference water 1, the
various stages are:
181181181
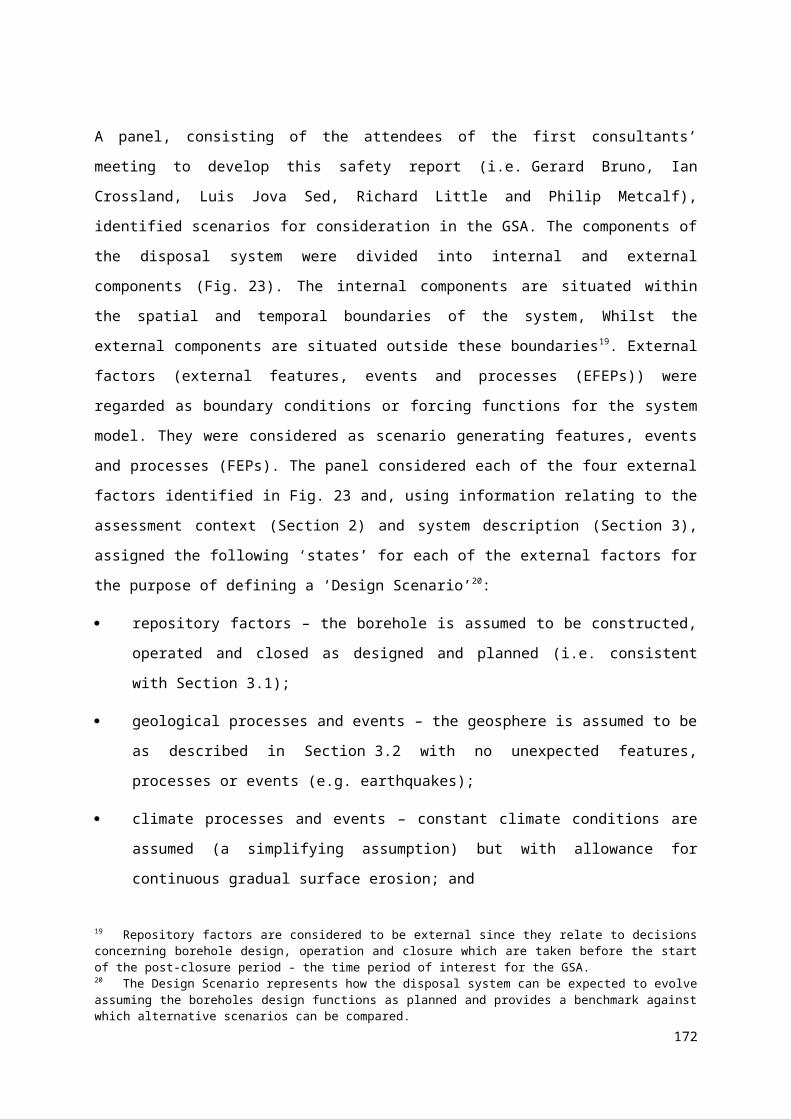
Stage 1 has porewater pH of around 13.5, owing to the presence of significant NaOH and KOH
and persists during flushing by about 100 pore volumes.
Stage 2 has porewater pH of about 12.5, owing to buffering by Ca(OH)2 and persists during
flushing by approximately and additional 500 pore volumes.
Stage 3 has porewater pH diminishing steadily from 12.5 to the ambient groundwater pH, owing
to buffering with C-S-H phases having progressively decreasing Ca/Si ratios. This stage
persists during flushing by approximately an additional 3725 pore volumes.
The pH of the reference waters 5 (pH 8.46) and 6 (pH 7.95) are actually more alkaline than the waters
considered by Refs [97, 100]. However, the reference waters contain different proportions of Cl, CO3
and SO4 to one another and to marl water considered in Ref. [97]. The concentrations of these
constituents in reference water 5 are less than in the marl water. In contrast, the concentrations in
reference water 6 are higher than in the marl water. It is to be expected that these differences in
chemical compositions would be reflected in different longevities of the cementitious barriers.
However, for the reasons outlined in Section VIII.2, the precise differences cannot be estimated. It is
unclear whether overall the differences in composition of the reference waters compared to the fresh
water considered in Ref. [97] would lead to increases or decreases in the lifetimes of the barriers.
Thus, the approach taken here for reference waters 5 and 6 is:
firstly to adopt the temporal variation in pH specified in Ref. [97] for fresh water in sulphate-
resistant OPC as the reference case;
secondly to evaluate the possible significance of the cementitious barriers degrading more rapidly
by calculating results for alternative cases in which:
- the barrier degrades twice as quickly;
- there is no cementitious barrier.
VIII.5. CEMENT DEGRADATION TIMES FOR THE REFERENCE CASES IN THE GSA
Using the model described in Section VIII.4 and the groundwater flow characteristics described in
Section 3.2, the cement degradation times given in Tables 38 and 39 have been calculated for the
reference systems of interest. An Excel spreadsheet has been used to undertake these calculations.
TABLE 38. CEMENT DEGRADATION TIMES FOR THE REFERENCE CASES FOR THE DESIGN
SCENARIO AND DEFECT SCENARIO D1, D2 AND D4
Geosphere Duration (y)
Stage 1 Stage 2 Stage 3 Cumulative
182
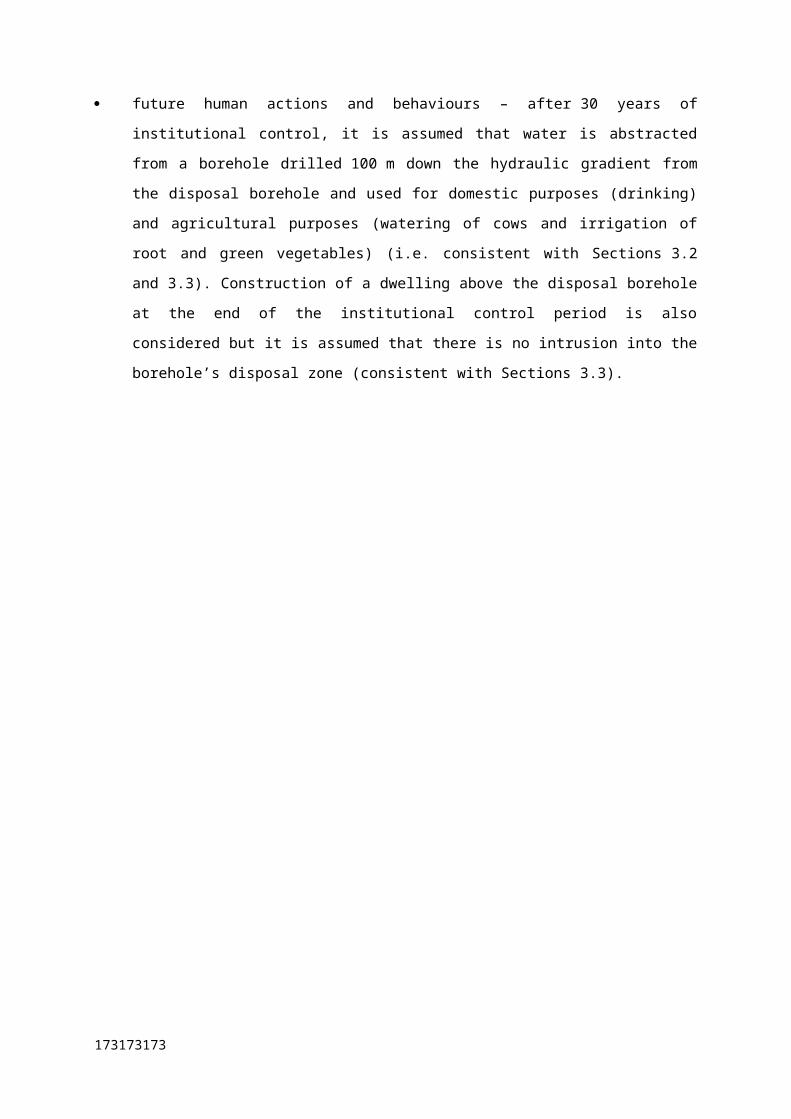
Backfill Cement Unsaturated Zone 1.00E+04 4.00E+04 5.47E+05 5.97E+05
High flow (porous and fractured)
5.14E+02 4.62E+03 3.65E+01 5.17E+03
Medium flow 5.14E+02 4.62E+03 3.54E+03 8.67E+03
Low flow 1.64E+03 1.48E+04 3.32E+05 3.48E+05
Containment Barrier Cementa
Unsaturated Zone 9.95E+03 3.98E+04 5.44E+05 5.94E+05
High flow (porous and fractured)
1.84E+02 1.65E+03 1.30E+01 1.85E+03
Medium flow 1.84E+02 1.65E+03 1.26E+03 3.10E+03
Low flow 5.87E+02 5.29E+03 1.19E+05 1.25E+05
Note: a Time from time of failure of the disposal container.
183183183
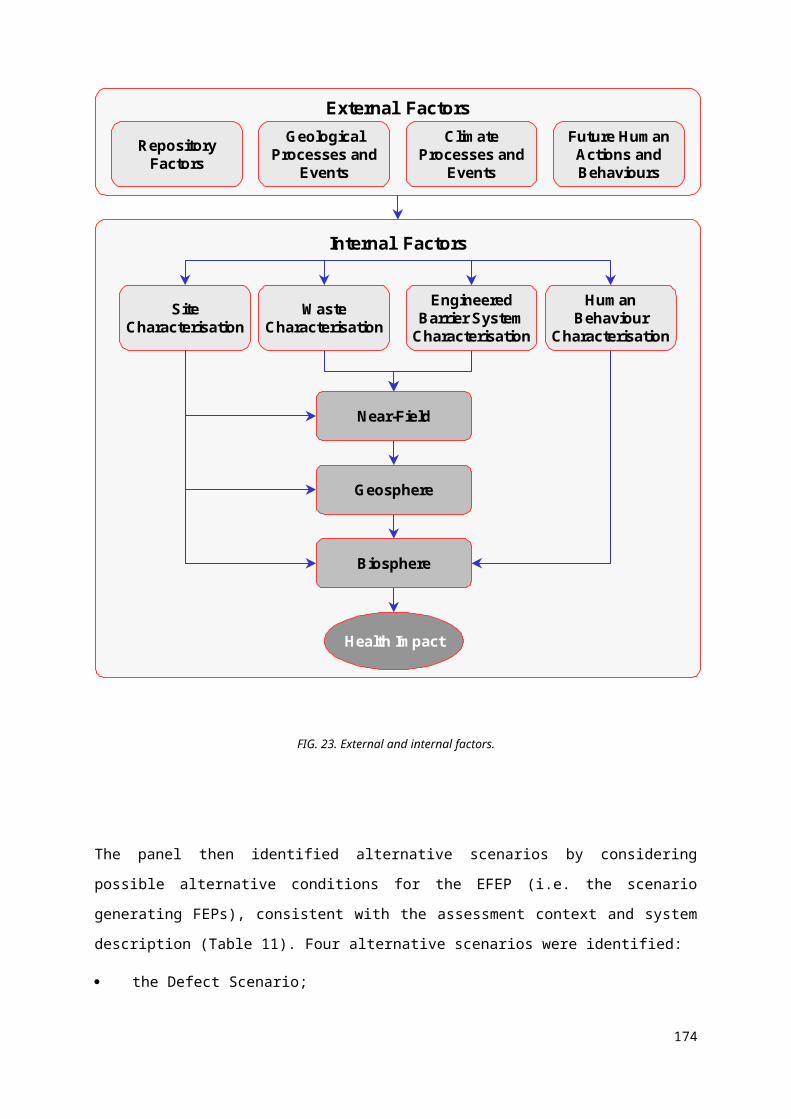
TABLE 39. CEMENT DEGRADATION TIMES FOR THE REFERENCE CASES FOR THE DEFECT
SCENARIO D3
Geosphere Duration (y)
Stage 1 Stage 2 Stage 3 Cumulative
Backfill Cement Unsaturated Zone 5.00E+03 2.00E+04 2.73E+05 2.98E+05
High flow (porous and fractured)
2.57E+01 2.31E+02 1.82E+01 2.75E+02
Medium flow 2.57E+01 2.31E+02 1.38E+03 1.64E+03
Low flow 8.22E+02 7.39E+03 1.66E+05 1.74E+05
Containment Barrier Cementa
Unsaturated Zone 4.98E+03 1.99E+04 2.72E+05 2.97E+05
High flow (porous and fractured)
9.18E+00 8.26E+01 6.51E+00 9.83E+01
Medium flow 9.18E+00 8.26E+01 4.94E+02 5.86E+02
Low flow 2.94E+02 2.64E+03 5.93E+04 6.23E+04
Note: a Time from time of failure of the disposal container
REFERENCES [96] MINDESS, S., YOUNG, J.F., Concrete, Prentice-Hall, NJ (1981).
[97] BERNER, U., Evolution of porewater chemistry during degradation of cement in a
radioactive waste repository environment, Waste Management, 12, (1992) 201-219.
[98] GLASSER, F.P., MACPHEE, D.E., LACHOWSKI, E.E., Solubility modelling of cements:
Implications for radioactive waste immobilisation, In: M.J. Apted and R.E. Westermann
(Editors), Scientific Basis for Nuclear Waste Management XI. Materials Research Society,
(1988) 331-341.
[99] GREENBERG, S.A., CHANG, T.N., Investigation of the colloidal hydrated calcium silicates:
II Solubility relationships in the calcium oxide - silica - water system at 25°C, Journal of
Physical Chemistry, (1965) 69: 182-188.
[100] BERNER, U., Status of Cement Modelling: Future investigations in the view of
cement/bentonite interactions, (Metcalfe, R., Walker, C., Eds) (Proc. Int. Workshop Tokyo,
2004) NUMO report TR-04-05, Tokyo (2004).
[101] KARLSSON, F., LINDGREN, M., SKAGIUS, K., WIBORGH, M., ENGKVIST, I.,
Evolution of geochemical conditions in SFL 3-5, SKB Report R-99-15 Swedish Nuclear Fuel
and Waste Management Company, Stockholm (1999).
184

[102] BETHKE, C.M., The Geochemist’s Workbench Release 6: GWB Essentials Guide: A User’s
Guide to Rxn, Act2, Tact, SpecE8, and Aqplot, Rockware, Golden, CO (2006) 76.
185185185
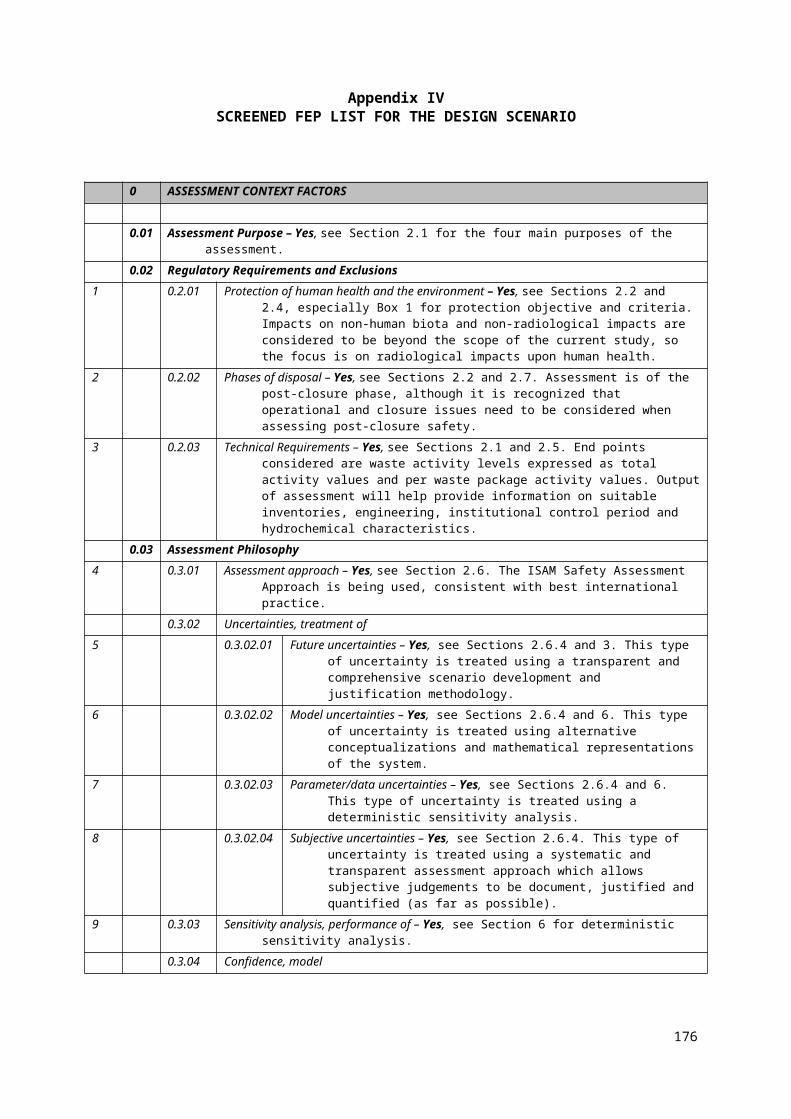
Appendix IXCORROSION OF STAINLESS STEEL WASTE CAPSULES AND DISPOSAL
CONTAINERS
IX.1. INTRODUCTION
The proposed design for the Borehole Disposal Concept (BDC) includes a robust engineered barrier
system. Included in these barriers are a sealed AISI Type 304 stainless steel waste capsule and a
sealed AISI Type 316L disposal container. These stainless steel barriers are surrounded by a cement
grout barrier comprising a layer of sulphate-resistant cement grout between the waste capsule and the
disposal container, referred to as the containment barrier, and another layer of the same material
between the disposal container and a high-density polyethylene borehole casing, referred to as the
disposal zone backfill. The cementitious material not only provides a mass transport barrier to the
release of radionuclides but, more importantly from a corrosion viewpoint, chemically conditions the
environment. The high pH of the cement grout porewater will substantially improve the corrosion
resistance and performance of the stainless steel containers. As a consequence, if properly emplaced,
this series of metallic and cementitious engineered barriers could potentially isolate the disposed
sources from the external environment for very long periods of time.
The purpose of the corrosion model described below is to develop a sound mechanistic basis for long-
term estimates of the lifetimes of the disposal container and waste capsule. First, the corrosion
behaviour of austenitic stainless steels (i.e., typically the AISI 300-series) is briefly reviewed along
with a critical review of relevant corrosion data (Section IX.2). Next, potential target lifetimes for the
borehole are defined, largely by reference to the containment of various potential radionuclides in the
different sources that may be disposed (Section IX.3). The corrosion model is then described (Section
IX.4). This description includes discussion of the structure of the model and a summary of the
environmental conditions for the Design and Defect Scenarios considered. Any such model inevitably
involves some simplification of the detailed mechanistic understanding into a form that is
computationally tractable, and that abstraction process is also described. In addition, the mathematical
implementation of the model and the quality assurance procedures used are described. Section I.5
presents failure times for the reference systems considered in the GSA, together with “corrosion
maps”, which, in a pictorial fashion, are used to relate various environmental conditions to the
consequences for the performance of the borehole.
IX.2. LITERATURE REVIEW AND SUMMARY OF DATA
IX.2.1. Corrosion Behaviour of Stainless Steels
IX.2.1.1. General Corrosion
186
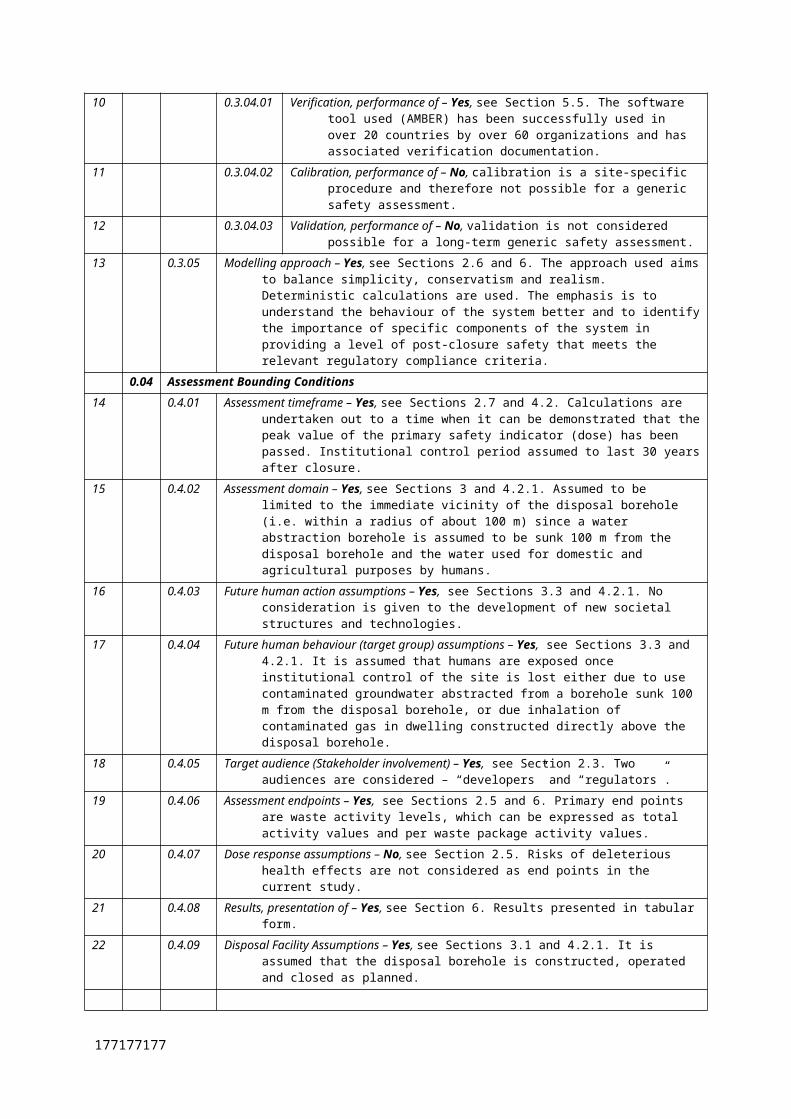
The corrosion behaviour of stainless steels has been extensively studied and is relatively well
understood (Newman 2001). A wide range of stainless steel alloys has been developed to address
specific corrosion issues and to provide suitable corrosion resistance in a range of environments. The
most widely used group of stainless steels is probably the austenitic grades, generally referred to as
the AISI 300-series alloys. These alloys typically contain ~18 wt.% Cr and 8-10 wt.% Ni. The two
most common grades, Type 304 (UNS S30400) and Type 316 (UNS S31600), are distinguished by
the addition of 2-3 wt.% Mo to the latter to improve the resistance to localized corrosion and SCC.
Low-carbon grades (304L and 316L) are available to minimise the possibility of sensitisation of welds
due to the precipitation of chromium carbides at grain boundaries.
Stainless steels are subject to general corrosion at a rate that varies with time, temperature, redox
conditions, pH, and salinity (ASM 1987, 2003, 2005; Newman 2001; Revie 2000, Shreir et al. 1994).
Stainless steels are protected by the formation of a stable Cr(III) oxide or hydroxide film (variously
represented by Cr2O3, Cr(OH)3, or CrOOH, Clayton and Olefjord 1995).
On freshly polished surfaces, the corrosion rate will continue to decrease with time for several years
after exposure to the corrosive environment as the passive film develops. The film is typically
amorphous, although for some passive materials re-crystallization of the oxide can occur over time,
resulting in an increase in corrosion rate as in the case of Ti (Mattson and Olefjord 1990, Mattsson et
al. 1990).
The general corrosion rate of stainless steel is typically not a strong function of the redox potential,
here interpreted in terms of the corresponding dissolved O2 concentration. Increasing [O2] leads to an
increase in ECORR, but provided the potential is within the passive range the corrosion rate is
determined more by the properties of the oxide film than by the rate of the cathodic reaction (the
reduction of O2). An increase in ECORR, however, will result in an increase in the potential drop across
the passive film and the “leakage current” (which corresponds to the rate of general corrosion) will
increase accordingly. In contrast, the corrosion rate of active materials, such as carbon or mild steel,
can be proportional to the [O2] if the rate of corrosion is cathodically limited.
The protectiveness of the passive film depends on the solution pH (Fig. 26). The minimum solubility
of Cr(III) oxides lies between pH 7 and pH 8.5, depending upon the stable form (Fig. 27). The
solubility increases at both lower and higher pH, although the rate of increase in solubility is much
greater in acidic solutions. Furthermore, the stability of the oxides of other alloying elements at higher
pH maintains a stable passive film in the alkaline range.
Chloride ions tend to de-stabilise the passive film on stainless steels. Although the effect of Cl - is
most significant for the initiation and propagation of localized corrosion, Cl - ions also tend to decrease
the stability of the passive oxide film and lead to an increase in general corrosion rate (Clayton and
Olefjord 1995).
187187187
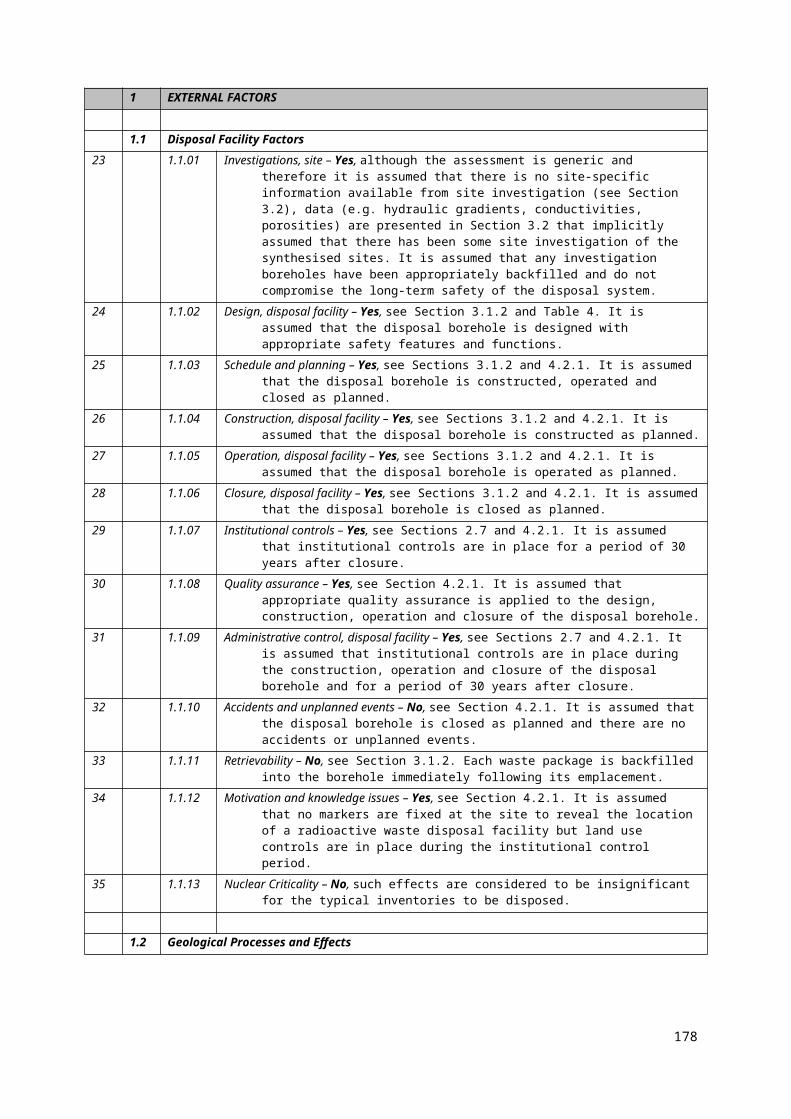
The rate of general corrosion is dependent on the degree of passivity of the passive oxide film and can
be measured as a simple weight-loss corrosion rate or as a passive current density in electrochemical
experiments. Depending upon the range of T, pH, and [Cl -], the rate of general corrosion will typically
be in the range 0.01-2 my-1 (see below).
General corrosion can occur under saturated conditions (i.e., immersed in groundwater) or under
unsaturated conditions. In the latter case, a threshold relative humidity (RH) for corrosion of ~60-70%
is generally observed, below which corrosion is not possible because there is insufficient adsorbed
water on the surface to sustain the electrochemical reactions that constitute the overall corrosion
process (Shreir et al. 1994).
IX.2.1.2. Localized Corrosion
Stainless steel and other passive materials are known to be susceptible to localized corrosion in the
form of pitting or crevice corrosion (ASM 1987, 2003, 2005; Revie 2000, Sedriks 1996; Shreir et
al. 1994, Szklarska-Smialowska 2005). The mechanism of these two processes is similar, the major
difference being the location at which the localized corrosion initiates; pitting occurs on the bold
exposed surface and crevice corrosion initiates in geometrically occluded areas.
Localized corrosion is typically divided into initiation and propagation stages (Szklarska-Smialowska
2005). Initiation involves the development of a suitable environment (sometimes referred to as an
incubation phase) and the localized breakdown of the passive film. Film breakdown can be meta-
stable (i.e., the passive film attempts to and succeeds in self-healing) or stable (i.e., a sustained area of
localized corrosion is generated). Propagation results in loss of wall thickness as the de-passivated
material undergoes active corrosion in occluded regions (either created by the crevice former or, in
the case of pitting, by a “cap” of precipitated corrosion products) in which a low-pH, high-[Cl -]
environment is maintained. Pit growth can be stifled, however, if this local environment is lost, as for
example in the case of the exhaustion of the cathodic reactant (typically dissolved O2), breakdown of
the cap of corrosion products, iR drops down the occluded region, etc.
In general, the susceptibility to initiation and the severity of propagation increase with increasing
electrochemical potential (E), temperature (T), and [Cl -] and decreasing pH. A number of oxyanions,
including SO42-, inhibit the aggressive effect of Cl- (Newman 2001, Szklarska-Smialowska 2005)
Initiation is typically studied in simple exposure tests or electrochemically. In exposure tests, planar
or creviced samples are exposed to an environment and the number of initiated pits or crevices
observed. Electrochemically, the potential is scanned until film breakdown is observed (characterized
by a rapid increase in the measured current) which defines a “breakdown” or “pitting” potential (E P).
Figure 28 shows the dependence of the pitting potential on T and [Cl-]. The pitting potential moves to
more “active”, i.e., more negative, values with increasing T and [Cl-]. Similar dependences can be
developed for film breakdown potentials for crevice corrosion (ECREV) by using samples with creviced
188
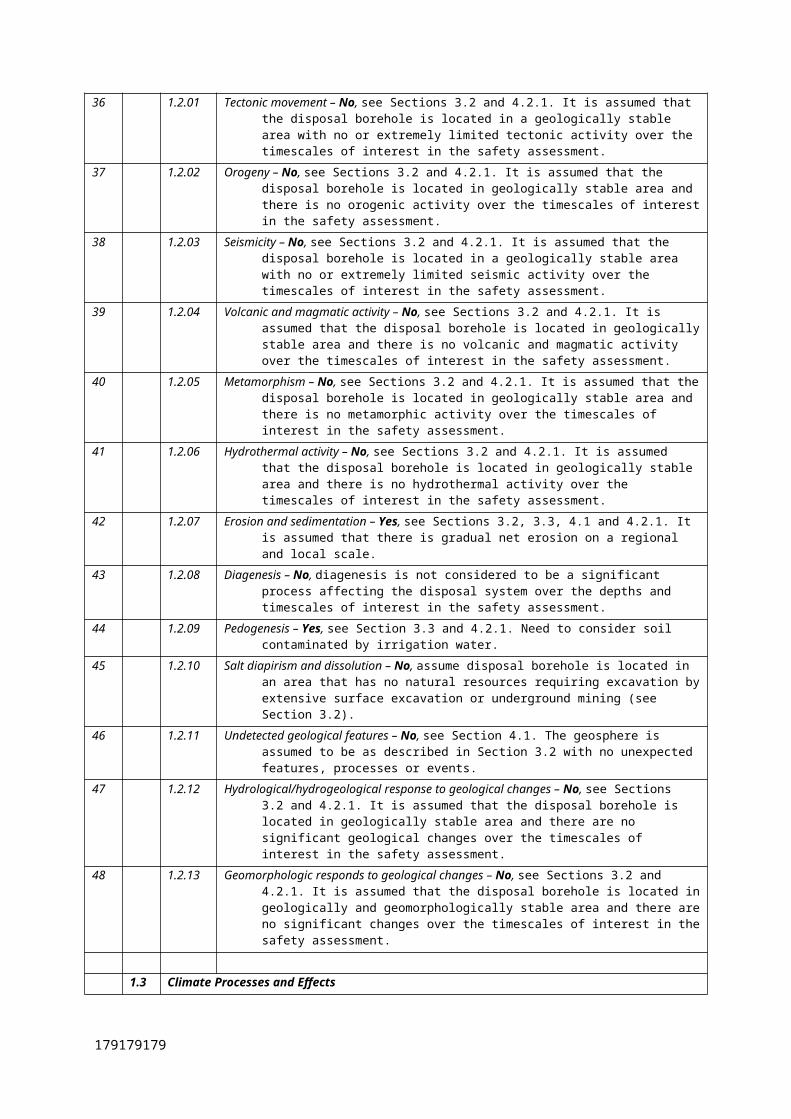
or occluded regions. The crevice breakdown potential is typically 10’s to 100’s mV more negative
than the equivalent potential for pitting as it is easier to develop the critical chemistry for film
breakdown within the occluded region than it is for pitting of an exposed surface.
Under naturally corroding conditions, pitting or crevice corrosion will initiate if the value of the
corrosion potential ECORR (the natural electrochemical potential at which the stainless steel rests in the
aqueous environment) exceeds the value of the film breakdown potential for either process.
Mathematically, this condition is expressed as
Equation 10
ECORR EP, ECREV
A re-passivation potential (ERP or ERCREV for pitting and crevice corrosion, respectively) can also be
defined at which a propagating pit or crevice will re-passivate. The repassivation potential is often
used as a conservative measure of the initiation of localized corrosion, the mathematical criterion for
initiation then being
Equation 11
ECORR ERP, ERCREV
The extent of propagation of localized corrosion can also be assessed by measuring the depth of attack
as a function of time. For a range of materials including stainless steels (Newman and Franz 1984), it
is typically found that the rate of localized corrosion propagation decreases with time (t). The depth of
local penetration D is given by
Equation 12
D = ktn
where k and n are material- and environment-specific constants. Depending upon the values of k and
n and the wall thickness, localized corrosion may effectively stop before penetrating the wall.
IX.2.1.3. Stress Corrosion Cracking
Stainless steels are also known to be susceptible to stress corrosion cracking (SCC). Cracking is most
commonly associated with Cl- environments, although SCC also occurs in other solutions
(Jones 1992). From a practical viewpoint, the ranges of T, pH, and [Cl-] that support SCC have been
defined. Figure 29 defines ranges of [Cl-], T, [O2], and pH for the SCC of Type 304 stainless steel,
indicating that the severity of SCC increases with increasing T, [O2], and [Cl-] and decreasing pH.
As for localized corrosion, SCC can be divided into initiation and propagation stages. Initiation
involves the formation of microscopic cracks from initially uncracked surfaces, and is often
characterized by a threshold stress. Using a linear-elastic fracture mechanics approach, crack growth
189189189
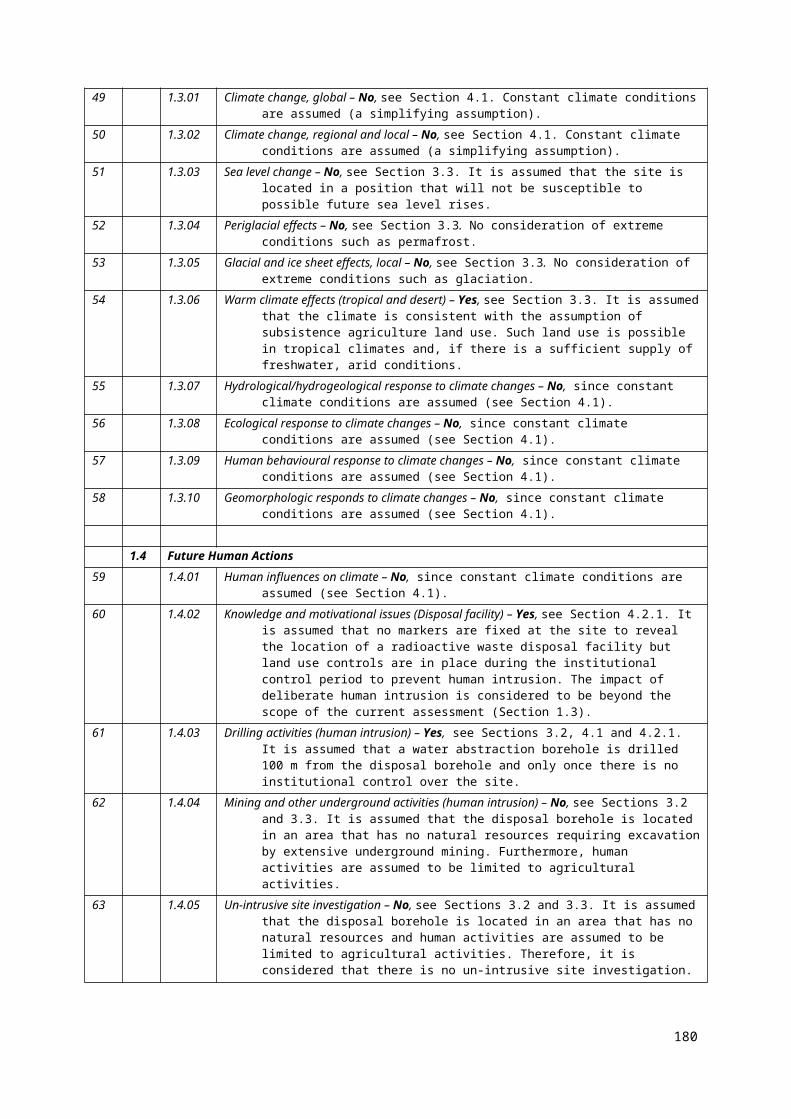
is characterized by a stress intensity factor (KI), the magnitude of which depends on the applied or
residual stress and the size and shape of the crack. In general, the crack growth rate increases with
increasing KI. Alternatively, crack growth can be modeled based on the known mechanism, be it a
film-rupture/dissolution process, film-induced cleavage, or some other mechanism.
Note from Fig. 29 that pitting and SCC are closely related. Cracks often initiate from pits on the
surface. With increasing pH, the incidence of both pitting and SCC diminish, suggesting that stainless
steel in contact with cement grout should be resistant to both forms of corrosion.
Welds are often prime locations for SCC. This enhanced susceptibility is the result of a number of
factors, including: high residual stress, a sensitised microstructure because of preferential segregation
of impurities and alloying elements (principally Cr and C) to grain boundaries, electrochemical
differences between the base metal, heat-affected zone, and weld material, and local high hardness.
This implies that well-defined welding procedures and QA processes should be defined for container
fabrication for the borehole disposal concept.
IX.2.1.4. Microbiologically Influenced Corrosion
Microbial activity can induce corrosion of metallic structures either through the production of
aggressive metabolic by-products or by creating occluded regions for localized corrosion. Stainless
steels are known to be susceptible to microbiologically influenced corrosion (MIC) (Little et al.
1991).
The key to MIC is microbial activity. If microbes are not active then they cannot produce aggressive
metabolic by-products (such as sulphide ions or organic acids) or the extracellular polymeric
substance (i.e., slime) that creates localized environments.
A number of environmental factors can limit microbial activity. In the present context, the elevated
pH in the cement grout porewater will prevent microbial activity until the pH drops below a value
of ~10.
For stainless steels, ennoblement of ECORR has to be observed, which may make the material more
susceptible to localized corrosion. If locally acidic conditions can be formed under biofilms by acid-
producing bacteria, de-passivation could occur at low enough pH. Preferential weld attack has also
been observed on stainless steel in microbially active environments.
IX.2.1.5. Preferential Corrosion of Welds
Welds are often locations for preferential corrosion. The enhanced susceptibility of welds results from
(i) micro-scale galvanic cells that can be created due to the use of a dissimilar weld material
(ii) microstructural differences between the weld metal, heat-affected zone, and base metal, or
(iii) segregation of certain alloying elements to grain boundaries (sensitisation).
190
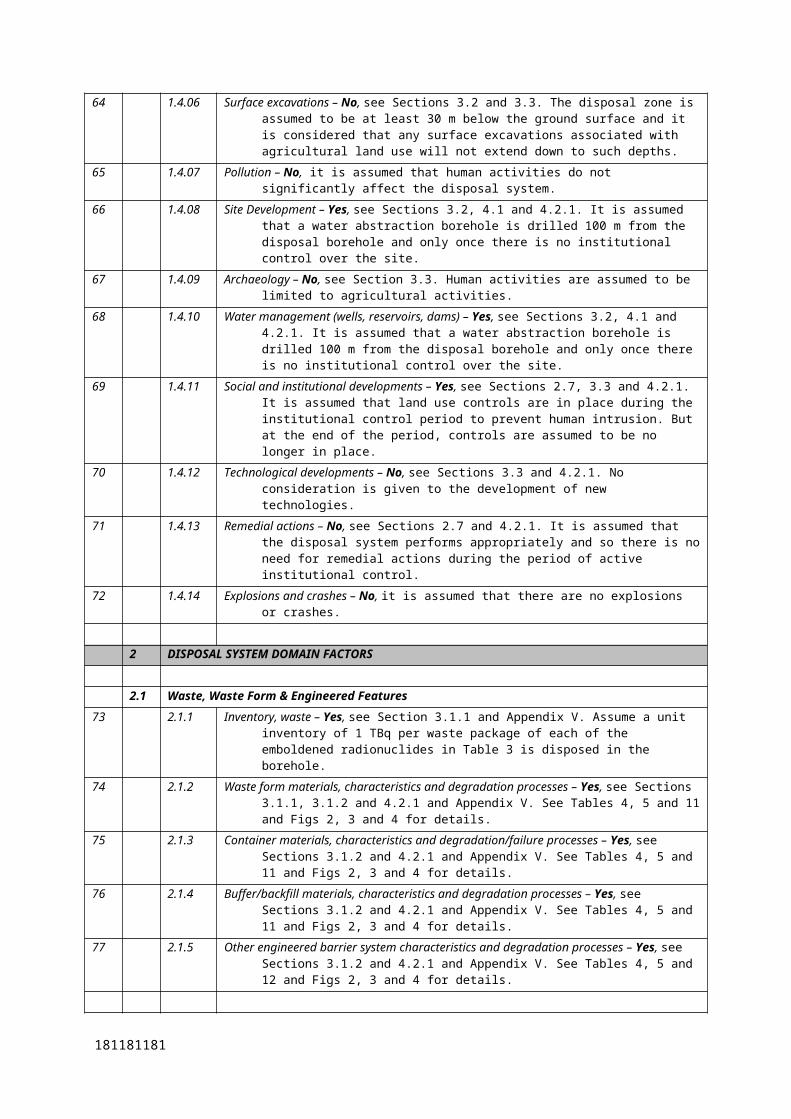
Stainless steels can be susceptible to preferential weld attack if steps are not taken to avoid the effects
listed above. Classically, Type 304 stainless steel is susceptible to intergranular attack or enhanced
SCC due to sensitisation of grain boundaries (Jones 1992).
IX.2.2. Corrosion Data
IX.2.2.1. General Corrosion
The general corrosion rate of stainless steel has been measured under a wide range of conditions,
including in highly alkaline (pH 10) and near-neutral to moderately alkaline solutions and for
exposure to various atmospheric conditions.
Under highly alkaline conditions (Table 40), a number of trends are observed. Rates are typically
<1 my-1 and generally <0.1 my-1. The corrosion rate tends to decrease with time of exposure and
with increasing pH. The absence of O2 also appears to result in a lower corrosion rate, although the
limited data set makes firm conclusions difficult. The corrosion rate increases with increasing
temperature, but there are too few data to draw any definitive conclusion about the effect of Cl - ions,
although there is some indication for an increase in rate with increasing [Cl -]. For the available data
set, there is no apparent difference between the corrosion rates for Types 304 and 316 (or 316L)
stainless steels.
Similar trends are observed for neutral to slightly alkaline solution (Table 41). Thus, the general
corrosion rate tends to increase with increasing temperature and increasing salinity and the rate tends
to be higher under aerated, as opposed to deaerated, conditions. Corrosion rates are significantly
higher than in highly alkaline solution (with rates generally in the range 0.1-1 my-1), but again there
is no apparent difference between the two grades of material.
There are relatively few data under atmospheric exposure conditions (Table 42). The available data
exhibit no obvious dependence on the nature of the atmosphere, with rates typically <0.1 my-1.
IX.2.2.2. Pitting
Pitting is a result of the breakdown of the passive film by aggressive species, most commonly Cl - ions
(Szklarska-Smialowska 2005). Table 43 summarizes a number of measurements of EP and ERP in Cl-
solutions as a function of temperature for both Type 304 (Table 43(a)) and Type 316 (Table 43(b))
stainless steels.
When the studies are taken together, there is a wide scatter in values. This scatter is the result of
different experimental techniques, different surface preparation methods, as well as the dependence of
EP and ERP on environmental parameters such as temperature, pH, [Cl-], and the concentration of other
aggressive and inhibitive anions.
191191191
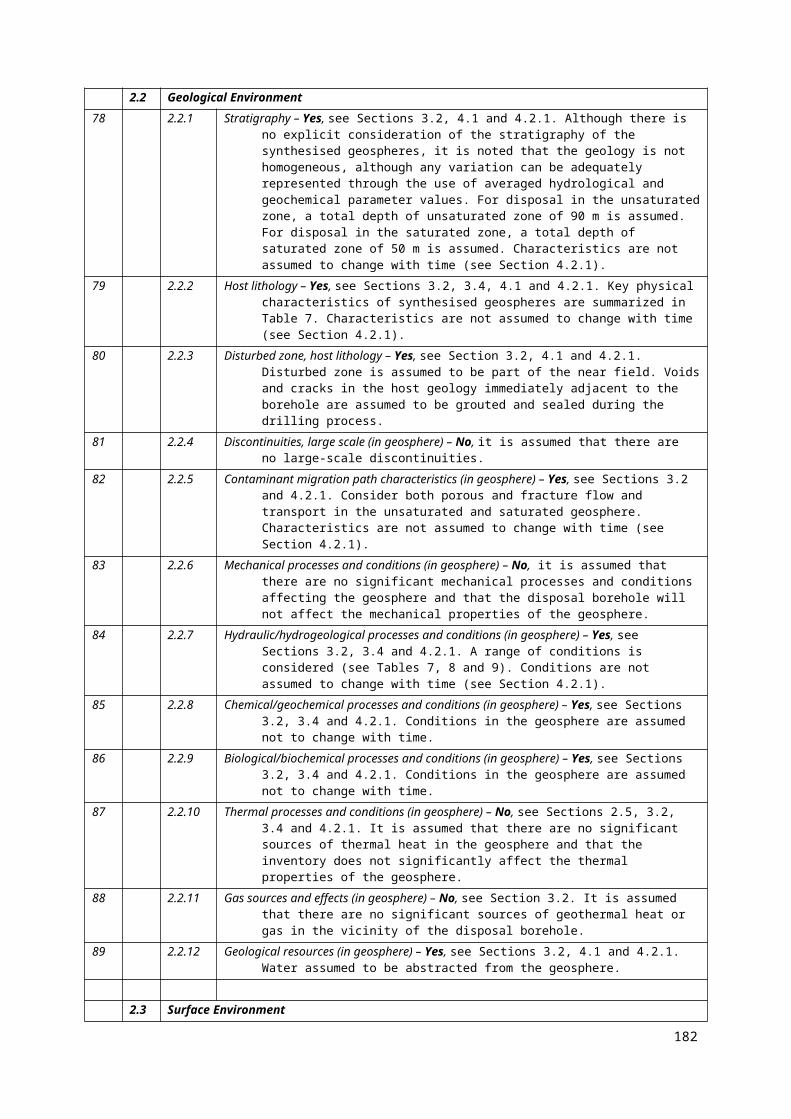
A number of trends are apparent, however, from individual studies. For example, the pitting potential
decreases linearly with log10[Cl-] (Figs I.3, I.5) with evidence for a threshold [Cl-] at low
concentrations (Fig. 30(e)). Interestingly, the dependence of EP on log[Cl-] is greater for the more-
resistant Type 316 stainless steel (-206 to –220 mV/dec, Fig 30(b)) than for Type 304 (-127 to –
152 mV/dec, Figs 30(b) and 30(d)). However, the value of EP or ERP for Type 316 is typically 100-
200 mV more positive than for Type 304 (Figs 30(b) and I.6). In addition, the re-passivation potential
is typically 200-400 mV more negative than EP (Fig. 30(e)), making the former measure a more-
conservative criterion for pitting.
The pitting potential decreases with increasing temperature (Fig. 31), accounting for the increased
susceptibility of these alloys at elevated temperature. Whereas the value of E P for Type 304 appears to
decrease monotonically with increasing temperature, that for Type 316 exhibits a plateau at
temperatures above ~70oC.
In keeping with the greater protectiveness of the passive film in alkaline solution, EP increases
significantly with increasing pH at pH >10 (Fig. 32). Type 316 stainless steel exhibits an increase in
EP above ~pH 10, whereas the increase for Type 304 occurs at >pH 11. At lower pH values, EP is only
moderately dependent on the solution pH.
IX.2.2.3. Crevice Corrosion
Crevice corrosion occurs under less-aggressive conditions than pitting because the occluded geometry
helps establish differential chemical concentrations (notably of O2 and Cl-) inside and outside of the
crevice (Szklarska-Smialowska 2005). Thus, crevice corrosion occurs at more-negative potentials and
lower [Cl-] than pitting (Fig. 33). Similarly, crevice corrosion will occur at lower temperatures and at
higher pH than is observed for pitting.
This greater susceptibility is reflected in more-negative crevice breakdown and re-passivation
potentials than the corresponding values for pitting (cf. Tables 43 and 44). Comparison of values in
Tables 44(a) and 44(b) shows that, as for pitting, Type 304 stainless steel is more susceptible to
crevice corrosion than Type 316.
Figure 34 shows the effect of SO42- ions on the crevice corrosion of Types 304 and 316 stainless steel
in Cl- solutions. This figure again shows the greater susceptibility of Type 304. Sulphate ions are more
effective as an inhibitor for crevice corrosion for Type 316, with an approximately equal
concentration of SO42- able to inhibit crevice corrosion (expressed in units of gg-1), whereas the
[SO42-] must exceed the [Cl-] to have a similar effect for Type 304.
Figure 29 shows the effect of Cl- concentration, pH, and temperature on the susceptibility of
Type 304 stainless steel to pitting (and SCC). The susceptibility to pitting increases with decreasing
pH, increasing [Cl-], and increasing temperature. It is interesting to note that, except for two
192
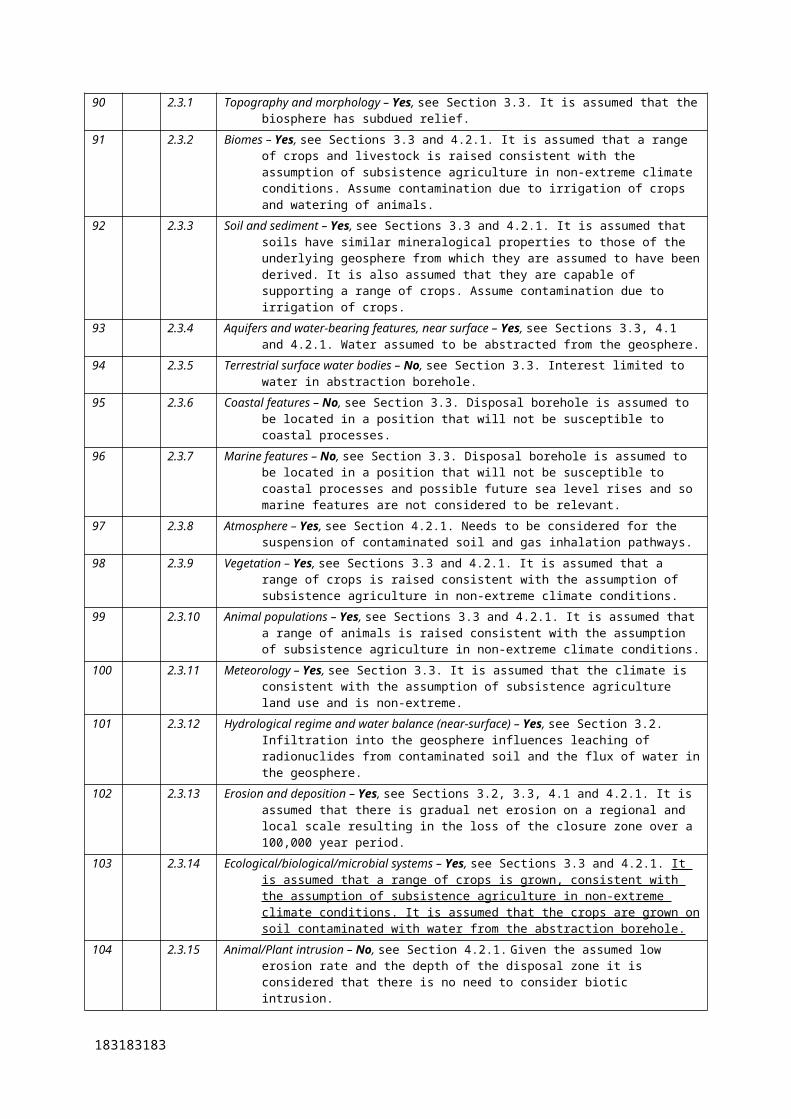
indications of pitting at a Cl- concentration of 104 gg-1 (which appears to be an experimental
artifact), Type 304 stainless steel appears to be immune to pitting at pH 12.
There are several reports of the localized corrosion penetration rates in the literature. Griffen et al.
(1988) report rates of pitting under a biofilm (which would have acted as a crevice former) of
0.86 mm/y for Type 304 and 0.36 mm/y for Type 316, illustrating the greater susceptibility of
Type 304 to pit growth. Sedriks (1996) reports crevice propagation rates of between 0.001 and
0.017 mm/y for cold-rolled and annealed Type 316, respectively.
IX.2.2.4. Stress Corrosion Cracking
Figure 29 shows the effect of Cl- concentration, pH, and temperature on the susceptibility of Type 304
stainless steel to SCC. The susceptibility to cracking increases with decreasing pH, increasing [Cl -],
and increasing temperature. It is interesting to note that cracking is not observed at pH 12, except
under boiling conditions.
Based on industrial experience, SCC of austenitic stainless steels is not observed at temperatures
below 60oC in near-neutral pH solutions, regardless of the Cl- concentration (McIntyre 1987).
As noted above, Fig. 29 illustrates the correlation between pitting an cracking. Pits initiate and grow
under less-aggressive conditions than cracking. Pits act as crack nucleation sites because they serve as
stress concentrators. Pitting, therefore, is a more conservative indicator of potential failure than
cracking.
IX.2.2.5. Corrosion Potential
The value of ECORR is strongly dependent on the dissolved O2 concentration (Table 45 and Fig. 35(a)).
The corrosion potential shifts to more-positive values by ~75 mV per order of magnitude increase in
[O2] (Fig. 35(a)). Thus, under anaerobic conditions, ECORR will be 300-400 mV more negative than in
aerated solutions. This is an important difference, as it renders the surface less susceptible to localized
corrosion or SCC with decreasing [O2].
Except at low pH values (pH <3), ECORR is relatively insensitive to pH in O2-containing solutions
(Figs I.10(b) and 10(c)).
The corrosion potential tends to decrease with increasing Cl - concentration (Fig. 30(e)), reflecting the
effect of Cl- on the passive film. The dependency of ECORR on Cl- is minor in deaerated solution
(Fig. 30(e)).
IX.3. TARGET LIFETIMES
It is useful to define “target” lifetimes for the waste capsule and disposal container for comparison
against the predicted lifetime of these engineered barriers. These target lifetimes are not requirements
193193193
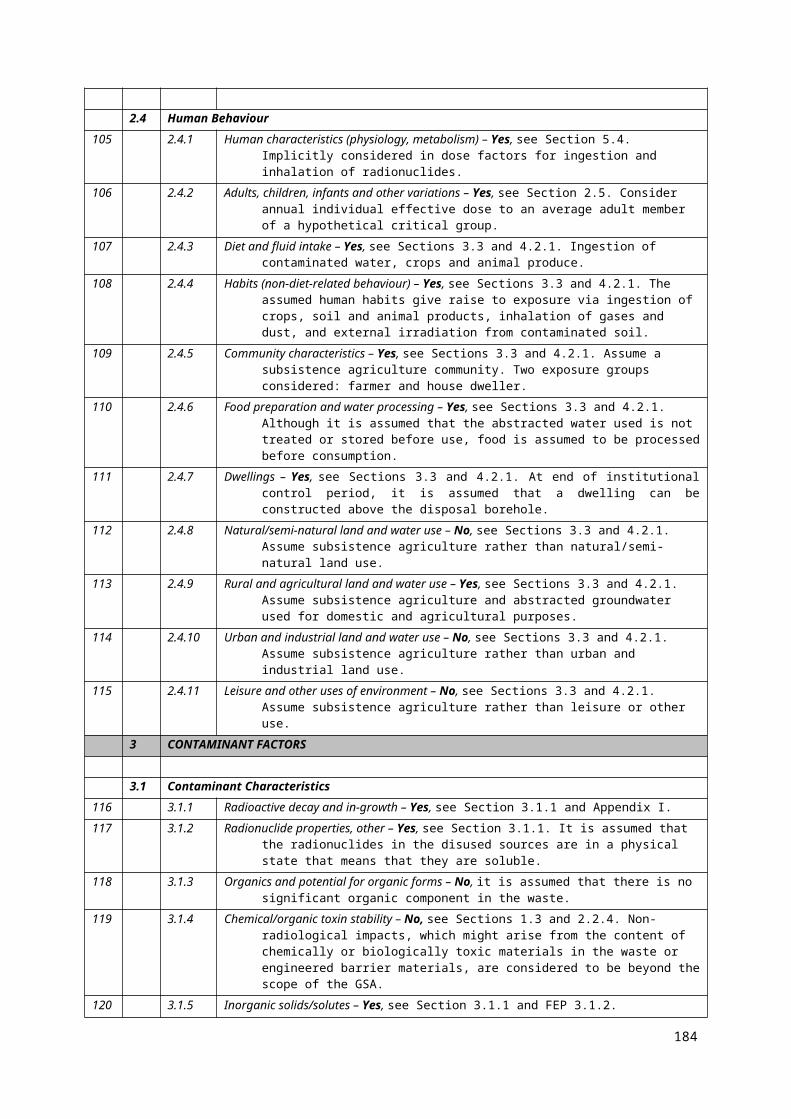
that must be met, but simply indicators of the potential effect on the overall safety of the concept of
the metallic barriers.
Table 46 defines a number of target lifetimes, largely based on the half-lives of various possible
radionuclides in the disused sealed sources. Radionuclides with an expected maximum inventory of
105 MBq are distinguished from radionuclides with lower expected inventories (based on the data in
Appendix I). The target lifetimes are based on the assumption that the activity of a particular
radionuclide has decayed to negligible levels after ten half-lives.
A target lifetime of 10 years would provide for both the safe handling and installation of the waste
packages, as well as essentially providing absolute containment for short-lived radionuclides such as
Ir-192 and certain medical isotopes.
A lifetime of 300 years would provide containment for not only these species, but also comparatively
longer-lived radionuclides such as H-3, Sr-90, Cs-137, and others.
Longer lifetimes only provide additional safety and absolute containment for a limited number of
species. A lifetime of 20,000 years would provide containment of Am-241, Pu-238, Ni-63, Sm-151,
and Ra-226. Very long lifetimes of 106 years would also contain C-14. However, it is not feasible to
contain the long-lived daughters of radionuclides such as Pu-239 based on absolute containment by
the waste packages alone.
IX.4. CORROSION MODEL
IX.4.1. Structure of Model
IX.4.1.1. System Description
The corrosion model is based on the system description in Figs 3 and 4 and Tables 43 and 44 of the
main text. Briefly, the barriers considered here (in sequence from the source outwards) are:
source container;
Type 304 stainless steel waste capsule (welded, minimum wall thickness 3 mm);
containment barrier cement grout (sulphate resistant cement grout , 41 mm thick);
Type 316 stainless steel disposal container (welded, minimum wall thickness 6 mm);
disposal zone backfill (cement grout, 12.5 mm thick); and
HDPE borehole casing (10 mm thick).
The corrosion model specifically estimates the lifetimes of the Type 304 waste capsule and of the
Type 316 disposal container, taking into account the conditioning of the local chemical environment
by the cementitious containment barrier and disposal zone backfill. Corrosion of the waste capsule
194
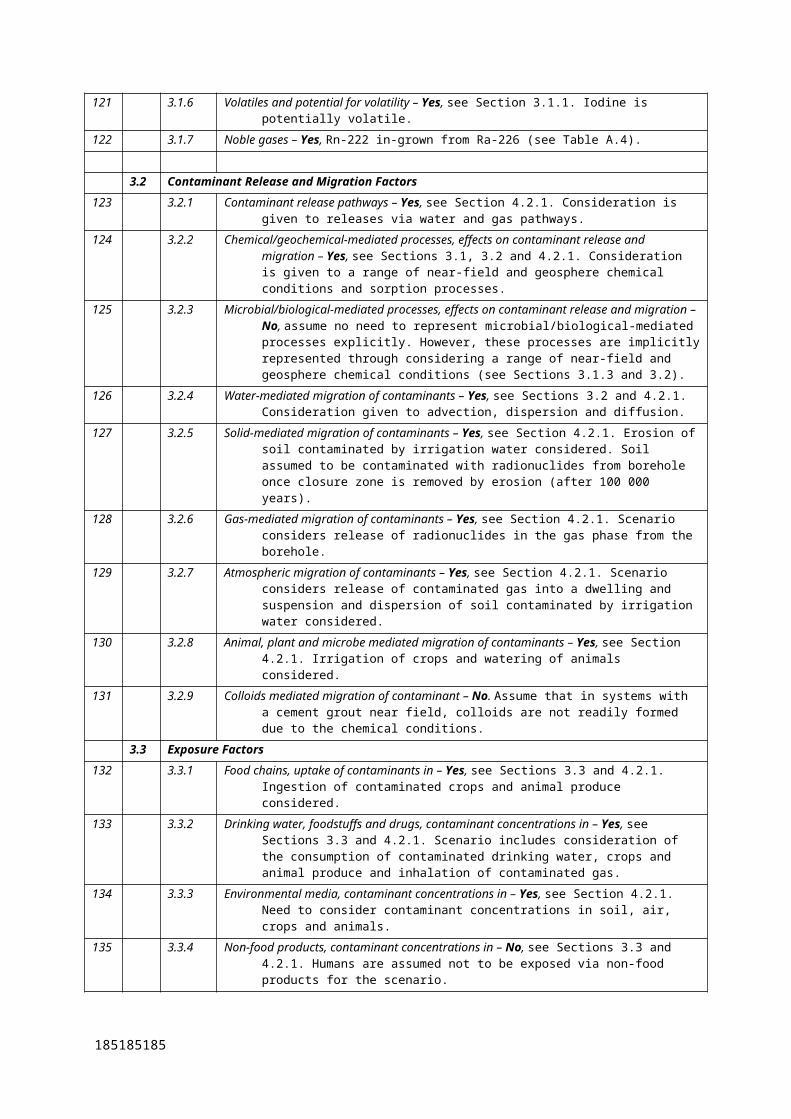
(and degradation of the containment barrier cement grout) is assumed to start immediately following
the initial perforation of the disposal container.
Failure of the waste capsule or disposal container is defined as either:
1. a through-wall penetration by localized corrosion, SCC or a weld defect; or
2. consumption of the corrosion allowance by general corrosion.
The corrosion allowance is defined as 80% of the wall thickness (i.e., 2.4 mm and 4.8 mm for the
waste capsule and disposal container, respectively), with the remaining wall required for structural
stability of the container. In other words, once 80% of the wall has been lost by general corrosion, the
container is assumed to collapse from external loads and no longer provide a barrier function.
A lifetime is defined for the initial penetration, 10% perforation of the container, 50% perforation, and
100% perforation. These different fractional failure areas are provided because the waste capsule and
disposal container will continue to act as a mass-transport barrier following the initial penetration. In
the safety assessment code AMBER, these fractional failure areas can be used to modify the mass-
transfer coefficient between the borehole compartments (see Appendix XI). Times for different
fractional corroded areas are provided for localized corrosion (see below), but not for general
corrosion where the entire surface is assumed to be uniformly corroded.
It is assumed that the HDPE borehole casing provides no barrier to the inflow of groundwater and
does not impact the leaching behaviour of the cement grout barriers or the corrosion behaviour of the
waste capsule or disposal container.
IX.4.1.2. Decision Tree
A decision-tree approach can be used to develop the corrosion model for the waste capsule and
disposal container for the GSA. Figure 36 shows the decision tree used for the current assessment.
The decision tree is based on a number of underlying assumptions:
the corrosion processes for Types 304 and 316 stainless steels are the same and differ only in
the rate and/or criteria for initiation of localized corrosion and SCC,
the disposal system is isothermal,
localized corrosion and SCC can only occur in the presence of oxygen (see below),
under aerobic conditions, a threshold pH can be defined below which localized corrosion and
SCC are possible, and
below this threshold pH value, a critical Cl- concentration exists for the initiation of localized
corrosion and SCC.
IX.4.1.3. Scenario Definition
195195195
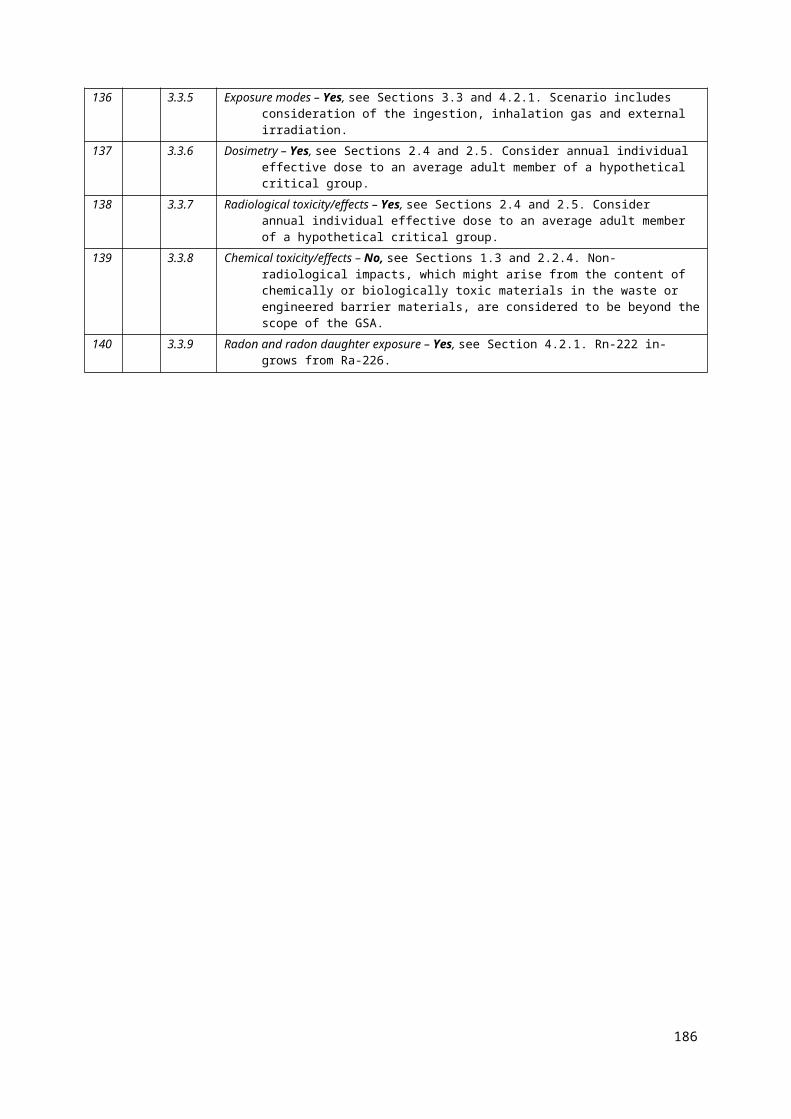
For the GSA, this corrosion model has been applied to two different scenarios:
the Design Scenario, which describes the expected behaviour of the system in which all barriers
function as designed, and
the Defect Scenarios, which account for failure in one or more of the engineered barriers.
Four Defect Scenario variants are considered:
D1: initial failure of the closure weld on one disposal container in the borehole, all other
barriers function as designed;
D2: initial failure of the closure weld on one waste capsule in the borehole, all other barriers
function as designed;
D3: degraded/incomplete disposal zone cement grout affecting all disposal containers in the
borehole, all other barriers function as designed; and
D4: initial failure of the closure weld on both the waste capsule and disposal container in the
same waste package, all other barriers function as designed.
IX.4.2. Environmental Conditions
IX.4.2.1. Summary of Groundwater and Site Conditions and Porewater Evolution
As described in Section 3.2 and Appendix II, various groundwater compositions, groundwater
transport mechanisms, degree of saturation, and cement grout porewater leaching conditions are
considered in the GSA.
Table 47 summarizes the six groundwater compositions considered for the GSA for calculation
purposes (see Appendix II). From a corrosion perspective, these waters can be described as either
aerobic or anaerobic and either fresh ([Cl-] < 100 mg kg-1) or saline ([Cl-] > 10 000 mg kg-1). The
categorization of the different groundwaters is as follows:
Groundwater #1: aerobic, fresh, high [SO42-]:[Cl-], low pH;
Groundwater #5: anaerobic, fresh, high [SO42-]:[Cl-];
Groundwater #6: anaerobic, saline, high [SO42-];
Groundwater #10: aerobic, fresh, alkaline pH;
Groundwater #11: aerobic, saline, high [HCO3-], alkaline pH; and
Groundwater #12: aerobic, saline, high [SO42-], alkaline pH.
The porewater in the containment barrier and disposal zone will undergo a change in pH as the
cement grout is leached by contact with the groundwater. A four-stage cement grout porewater model
is used, comprising the following processes:
196
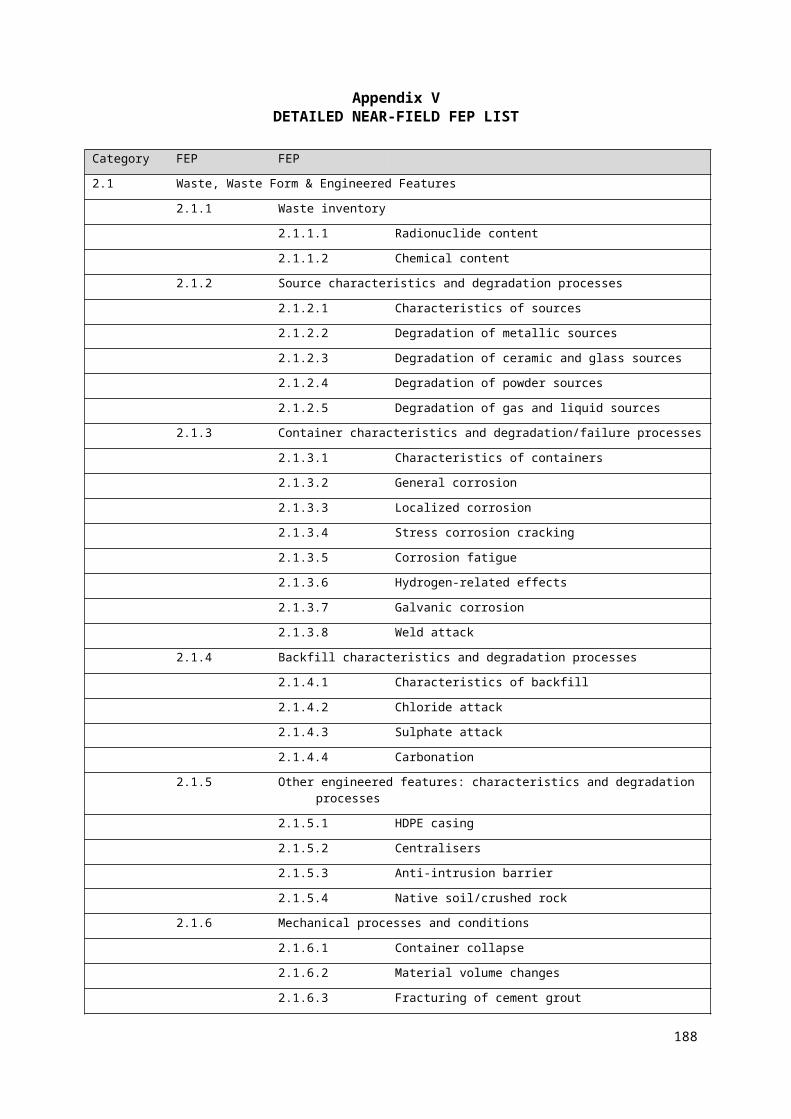
Stage 1: Porewater pH controlled by NaOH/KOH, pH 13.5;
Stage 2: Porewater pH controlled by Ca(OH)2, pH 12.5;
Stage 3: Porewater pH evolves from control by Ca(OH)2 to background groundwater pH; and
Stage 4: Porewater pH determined by groundwater.
The number of pore volumes required to transition from one stage to the next are determined by the
chemical conditions of the groundwater (see Appendix VIII).
The groundwater flow conditions (the relative importance of diffusion and advection) and the degree
of saturation (saturated or unsaturated) determine the time required to exchange the appropriate
number of pore volumes for each stage in the evolution of the porewater pH.
IX.4.2.2. Abstraction of Environmental Conditions for the Corrosion Model
The most important environmental factors for the corrosion behaviour of the waste capsule and
disposal container are the porewater pH, the redox conditions, and the Cl- concentration.
A slightly modified pH evolution of the cement grout porewater is used in the corrosion model.
During Stage 3, instead of assuming a continuous evolution in pH, a two-step evolution is assumed
with a constant pH in each of Stage 3(a) and Stage 3(b). The transition from Stage 3(a) to Stage 3(b)
occurs at a critical pH at and below which localized corrosion is possible in aerated environments.
Replacement of the continuous decrease in pH during Stage 3 by a two-stage step function simplifies
the estimation of the extent of general corrosion during this period. As discussed further below, the
critical pH for localized corrosion for the two alloys is different.
IX.4.3. Corrosion Model
IX.4.3.1. Overview of the Corrosion Model
Tables 48 and 49 give a general overview of the processes considered (and not considered) in the
GSA corrosion model. The rationale for including localized corrosion under only certain conditions is
provided, as are the reasons for excluding other forms of corrosion from the analysis (Table 48). As
will become apparent in the following discussion, the major form of corrosion for the Design Scenario
is general corrosion, with some possibility of localized corrosion during the latter stages of Stage 3
and during Stage 4 for aerobic groundwaters only (Table 49). For anaerobic groundwaters, the only
corrosion process will be general corrosion.
IX.4.3.2. Treatment of General Corrosion
The rates of general corrosion of both Types 304 and 316 stainless steel were derived from the data in
Tables 40, 41, and 42. There is some variability in the reported data, presumably as a consequence of
197197197
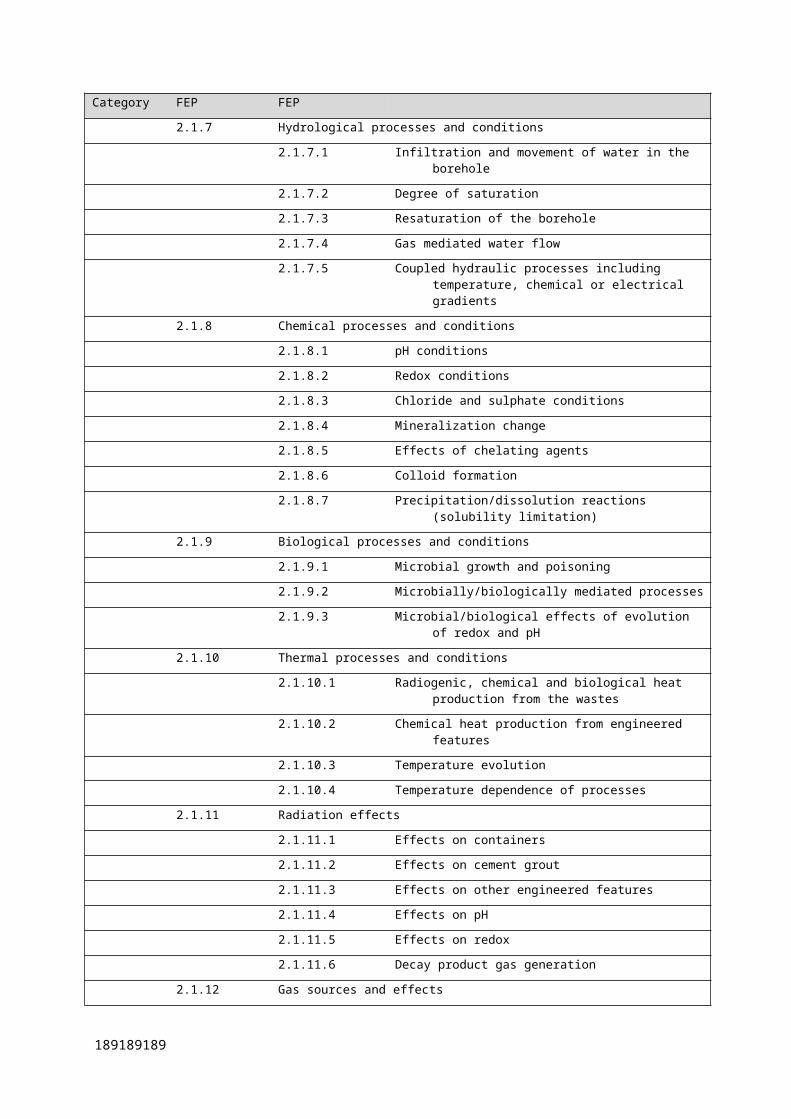
differences in experimental techniques and procedures, and because of the difficulty in measuring the
low corrosion rates observed for passive materials.
Expert judgment was used, therefore, to derive best-estimate corrosion rates as a function of pH,
redox condition, and Cl- concentration. The following principles were used in deriving appropriate
rates of general corrosion.
The corrosion rate was assumed to be the same for both Type 304 and 316L stainless steel.
Corrosion protection is provided by a Cr(III) oxide film and, since the Cr content is similar for
the two alloys, the rate of general corrosion would be expected to be similar.
The corrosion rate is a strong function of pH, with significantly lower rates in alkaline solution
(Table 40) than in near-neutral pH solution (Table 41).
The corrosion rate is a function of redox conditions, with an assumed factor of ten difference in
rate in alkaline solution between anaerobic and aerobic environments.
The corrosion rate is a weak function of Cl- concentration, with an assumed factor of two
difference in rate in fresh and saline waters.
The corrosion rate is the same for unsaturated and saturated conditions, on the assumption that
the relative humidity in the borehole exceeds the threshold of 60-70% RH required to support
electrochemical reactions.
The rates of general corrosion used in the corrosion model for the different stages in the evolution of
the porewater pH are given in Table 50.
IX.4.3.3. Treatment of Localized Corrosion
Both the initiation and propagation of localized corrosion are considered in the model.
The conditions under which initiation of localized corrosion could occur were determined by
comparison of the value of ECORR and the critical potentials for localized corrosion (Equations 10 and
11). For the GSA corrosion model, the critical potential for the initiation of localized corrosion was
conservatively taken as the crevice re-passivation potential ERCREV. The use of ERCREV is conservative
for the following reasons:
crevice corrosion initiates under less aggressive conditions than pitting because of the effect of
the occluded environment in promoting the spatial separation of anodic and cathodic reactions;
and
the re-passivation potential is the potential at which an actively propagating crevice will re-
passivate, rather than the potential at which the passive film first breaks down.
198
A further conservatism was introduced by using a value for ERCREV of 200 mV more negative than the
best-estimate value derived from the data in Table 44 to account for the stochastic nature of these
potentials (Szklarska-Smialowska 2005).
In selecting the crevice re-passivation potential as the criterion for localized corrosion, there is an
implicit assumption that a crevice, or some other form of occluded region, will be present on the
surfaces of both the waste capsule and disposal container. This is a reasonable assumption as the
presence of the porous cement grout backfill could create local differences in the environment at the
container surface.
There are relatively few values for ERCREV under alkaline conditions in Table 44. Therefore, values for
ERCREV were derived from both pitting and crevice breakdown potentials (EP and ECREV, respectively)
and the derived values compared with the few measured values of ERCREV in order to derive a best-
estimate value for the GSA corrosion analysis, as follows:
the film breakdown potentials for pitting in alkaline solution (pH 12) are +585 mVSCE and
+400 mVSCE for Types 316 and 304 stainless steel, respectively (Fig. 32);
the crevice film breakdown potential (ECREV) is between 60-70 mV (Haruki et al. 1991) and
0-600 mV (Fig. 33) more negative than the pit breakdown potential (EP), with a best-estimate
value of 200 mV;
the re-passivation potential for pitting is 150-200 mV (Sridhar et al. 1993) to 170-500 mV
(Szklarska-Smialowska 2005) more negative than EP, leading to a best-estimate difference of
200 mV between ECREV and ERCREV for crevice corrosion; and
the derived value for the re-passivation potentials for crevice corrosion at pH 12 are, therefore,
+185 mVSCE and 0 mVSCE for Types 316 and 304 stainless steel, respectively.
The derived value for ERCREV for Type 316 at pH 12 is consistent with the values of –50 to -150 mVSCE
at near-neutral pH calculated from the expression given by Sridhar et al. (2004) after correction by
300 mV for the effect of pH (Fig. 32).
For comparison, the value of ECORR of Type 316L stainless steel in aerated simulated cement grout
porewater (pH 12.5-13.5) is –11020 mVSCE (Cui and Sagüés 2003). Thus, the difference between the
corrosion potential and crevice re-passivation potential for Type 316L stainless steel at pH 12 is of the
order of 300 mV, and well in excess of the estimated 200 mV to account for variability about the
mean value of ERCREV. A slightly smaller difference can be expected for the less-resistant Type 304,
but in both cases it is expected that localized corrosion will not initiate on the container during the
alkaline phase in Stages 1 and 2.
The conclusion that neither the waste capsule nor the disposal container are susceptible to localized
corrosion in the alkaline cementitious porewater environment is consistent with experimental work of
199199199
Betts and Newman (1990) who found no pitting of Types 304L and 316L stainless steel in simulated
cement grout porewaters.
Although localized corrosion is not predicted during Stages 1 and 2, the waste capsule and disposal
container can become susceptible to localized attack during Stage 3 as the pH decreases or in the
groundwater-dominated porewater during Stage 4.
Table 51 shows the derivation of the crevice re-passivation potential for the two materials in fresh and
saline pore or ground waters for Stages 3 and 4. This derivation follows the same process used above
for deriving ERCREV for alkaline solutions. First, a best-estimate for the EP value for each material was
derived from the data in Table 43, for both fresh (defined as [Cl -] < 100 mg kg-1) and saline (defined
as [Cl-] > 10 000 mg kg-1) waters. As apparent from the data in Table 43, there is a lot of variability in
the reported data, for reasons discussed above. However, best-estimate values for E P were derived
from the available data based on expert judgement, and are given in the first row of Table 51. Second,
following the arguments above, corresponding ECREV values were estimated by subtracting 200 mV
from the best-estimate EP values. Next, a further 200 mV is subtracted to arrive at an estimated
crevice re-passivation potential ERCREV. Finally, yet another 200 mV is subtracted to give an estimated
minimum ERCREV value that accounts for the stochastic nature of film breakdown and re-passivation
processes. The validity of this approach can be assessed by comparing the derived best-estimate and
minimum values of ERCREV to those predicted from the polynomial expression developed from
experimental measurements by Sridhar et al. (2004) in Fig. 37. The experimentally based polynomial
(strictly only valid for 6-24 mg m-3 Cl- and 0.8-3.4 mg m-3 SO42-) predicts ERCREV values for Type 316L
in the range of –150 mV in fresh water and –200 mV in saline solutions, in reasonable agreement with
the derived minimum values in Table 51.
Localized corrosion will initiate if the corrosion potential ECORR exceeds the crevice re-passivation
potential. Table 51 also contains best-estimate values for ECORR in aerated and deaerated solutions
(equivalent to aerobic and anaerobic conditions) for both fresh and saline waters. These values were
derived from the data in Table 45. The value of ECORR is relatively insensitive to the [Cl-] and the
grade of material but is a strong function of the redox conditions, being some 400-500 mV more
positive in aerated solution than in the absence of oxygen.
Comparison of the best-estimate ECORR to the estimated minimum ERCREV values suggests that localized
corrosion will occur in aerated (aerobic) solution, but not under deaerated (anaerobic) conditions. This
comparison would suggest, therefore, that crevice corrosion would initiate in the aerobic
groundwaters considered here (namely, groundwaters 1, 10, 11, and 12, Table 47), but not in the
anaerobic waters (groundwaters 5 and 6, Table 47). However, the data in Fig. 33 suggest that, despite
the relatively positive redox potential (220 mVSHE), the Cl- concentration in groundwater 10 (10.9 mg
200
kg-1) is too low to initiate localized corrosion. Therefore, in the GSA, localized corrosion is assumed
to be only possible in groundwaters 1, 11, and 12.
The analysis above indicates that localized corrosion is not possible during Stages 1 and 2 because of
the high porewater pH but that crevice corrosion will occur in three of the six groundwaters
considered during Stage 4. For the three potentially aggressive groundwaters, the question is at what
stage during the evolution of the porewater pH in Stage 3 localized corrosion will initiate? Since the
corrosion analysis is based on the time-dependence of the porewater pH, it would be useful to define a
threshold pH at and below which localized corrosion initiates. Based on the evidence from Fig. 32, it
appears that such a threshold can be defined by the sharp increase in film breakdown potential with
increasing pH. This sharp increase occurs at a pH of 9-10 for Type 316 and pH 11-12 for Type 304.
Therefore, for the purposes of the GSA corrosion analysis, the threshold or critical pH (pHCRIT) for the
initiation of localized corrosion is defined as pH 10 for Type 316 stainless steel and pH 11 for
Type 304. Thus, localized corrosion is assumed to initiate at some time during Stage 3 as the
porewater pH in the containment barrier and disposal zone cement grout reaches these values.
Once initiated, localized corrosion is assumed to propagate to failure. Stifling of propagating crevices,
as often observed experimentally (Newman and Franz 1984), is assumed not to occur. Based on the
highest propagation rate reported by Griffen et al. (1988) of 0.86 mm/y, the time to first penetration is
taken to be 1 year following initiation. Thereafter, propagation will continue and the fraction of the
surface area of the container that is corroded will increase with time, albeit at a diminishing rate as the
cathode:anode surface area ratio decreases with time as more of the container is corroded. Based on
expert judgment only, 100% perforation of the container is assumed to occur 100 y after initiation,
with 10% and 50% perforation after 10 years and 30 years, respectively.
IX.4.3.4. Corrosion Processes Not Included in the Model
A number of corrosion processes are not explicitly included in the corrosion model (Table 48).
Although non-stress-relieved locations around the closure weld could be susceptible to SCC, cracking
is not explicitly included in the analysis because it is considered that localized corrosion will initiate
(and result in failure) under milder environmental conditions than those required to initiate SCC.
Microbiologically influenced corrosion is not included in the model either, primarily because
microbes will not be active for much of the lifetime of the containers due to the high porewater pH.
Although microbes can always be found surviving in extreme conditions of elevated or sub-zero
temperature, acidic or alkaline pH, high salinity, desiccation, irradiation, etc., each of these factors
limits the biodiversity of the microbial population and in doing so limits the ability of microbes to
establish aggressive environments to support MIC. In the present case, the elevated porewater pH
during Stages 1, 2, and the early part of Stage 3 will severely limit microbial activity at the container
201201201
surfaces. Therefore, since many of the predicted container lifetimes are within these early stages, MIC
is not specifically included in the GSA corrosion model.
IX.4.4. Mathematical Implementation of Model and Quality AssuranceThe GSA corrosion model is primarily a conceptual model of the corrosion processes that are, and are
not, important in determining the lifetimes of the waste capsule and disposal container. Mathematical
implementation of the model is relatively simple. Based on the estimated periods for each stage in the
evolution of the porewater pH and the general corrosion rates and localized corrosion behaviour
during each stage, the extent and nature of the corrosion damage was manually calculated for each set
of conditions considered and tabulated in a Microsoft Excel spreadsheet.
The quality assurance for the model was based on manual checks of selected predicted lifetimes to
ensure consistency between various estimates.
IX.5. AILURE TIMES AND CORROSION MAPS FOR THE GSA
Using the model described in Section I.4 and the groundwater flow characteristics described in
Section 3.2, the failure times given in Table 52 have been calculated for the Design Scenario for the
reference systems of interest. Calculated disposal container lifetimes range from 4.8 x 10⁴ y for
aerobic waters to 4.8 x 10⁵ y for anaerobic fresh waters. The calculated lifetimes of the waste capsules
(as measured from the time of emplacement) range from 7.2 x 10⁴ y for aerobic waters to 7.2 x 10⁵ y
for anaerobic fresh waters. In all cases considered, failure of both the disposal containers and waste
capsules are by general corrosion. Failure occurs during Stages 2, 3, or 4, depending upon the
respective corrosion rates for the different geochemical conditions.
Calculated disposal container and waste capsule lifetimes for the four Defect Scenarios are given in
Table L.17 (Appendix XII). For Defect Scenario D1 (initial defect in a single disposal container),
initial perforation of the disposal container leads to immediate degradation of the containment barrier
cement grout and corrosion of the waste capsule. Therefore, for the defected disposal container, the
lifetimes of the corresponding waste capsule (again, measured form the time of emplacement) ranges
from 2.4 x 10⁴ y to 2.4 x 10⁵ y, depending upon geochemical conditions. All other 49 waste packages
in the borehole behave as for the Design Scenario.
If the initial defect is in the waste capsule rather than the disposal container (Defect Scenario D2,
Table L.17), release from the failed waste capsule into the borehole occurs once the other disposal
container has failed (elapsed time of 4.8 x 10⁴ y to 4.8 x 10⁵ y, although complete corrosion of the
defected waste capsule only occurs after an elapsed time of 7.2 x 10⁴ y to 7.2 x 10⁵ y.
202
Degraded disposal zone cement grout (Defect Scenario D3) has relatively little effect on the
calculated lifetimes (Table L.17), as there is still sufficient pH-buffering capacity in the degraded
cement grout to ensure long containment periods.
Finally, defects in both the disposal container and waste capsule in a single waste package clearly
allows for immediate release from that particularly package, although all other 49 packages in the
borehole behave as in the Design Scenario. Corrosion of the defected waste capsule starts
immediately, as groundwater is assumed to enter the containment barrier soon after emplacement,
resulting in complete corrosion of the defected waste capsule after a period of 2.4 x 10⁴ y to
2.4 x 10⁵ y, depending upon geochemical conditions.
Using the corrosion results, corrosion maps can be developed to help guide the selection of suitable
sites for the borehole disposal concept. The original aim of these maps was to identify site conditions
that would be acceptable or unacceptable for the disposal of sealed sources in boreholes. It is not,
however, easy to answer that question based on the corrosion analysis alone. First, the safety of a
particular site is not solely a function of the containment period. Other site characteristics, such as the
local hydrogeology and the nature of the biosphere, also a play a role in determining the dose
consequences for a particular location.
Second, as demonstrated above, the corrosion behaviour of the disposal container and waste capsule
are determined primarily by the conditioning of the near-field environment by the containment barrier
and disposal zone cement grout. To a first approximation, if the engineered barrier system behaves as
designed, then the lifetimes of the stainless steel vessels are relatively independent of the nature of the
surrounding groundwater, and waste capsule lifetimes in excess of 104 y are likely.
Third, the conditions at a particular site are not static, but change with time as the disposal zone and
containment barrier cement grout leaches. Thus, what may start out as a high-pH near-field
environment eventually becomes less alkaline as the pore chemistry is flushed by the groundwater.
The corrosion maps provided here summarise the calculated lifetimes for the waste capsule (measured
from the time of emplacement) as a function of EH, Cl- concentration, and near-field pH. The latter is
defined as the pH of the porewater to which the disposal container and waste capsule are exposed. For
the Design Scenario, the near-field pH will evolve over time in a manner similar to the model used
here and, will for an extended period of time, protect the containers from excessive rates of corrosion
by maintaining an alkaline near-field environment.
Figure 38 illustrates the effect of the near-field pH and chloride concentration on the predicted
lifetime of the waste capsule (as measured form the time of emplacement in the borehole). Under
Design Scenario conditions, the near-field pH will remain above pH 12 for an extended time and long
waste capsule lifetimes are predicted under both aerobic (Fig. 38(a)) and anaerobic conditions
(Fig. 38(b)). Under Defect Scenario conditions involving inadequate pH-buffering of the near field,
203203203
the predicted lifetimes become shorter due either to accelerated general corrosion under anaerobic
conditions, or possible localized corrosion under aerobic conditions, although the conditions that
support localized corrosion were not found to exist for the references cases considered in the GSA.
These data can also be represented in terms of the effect of redox potential and chloride concentration
(Fig. 39). Figure 39(a) represents the expected behaviour under alkaline conditions and, in this sense,
represents the expected behaviour for much of the duration of the Design Scenario. Long waste
capsule lifetimes are predicted under all redox conditions because the high near-field pH protects the
disposal container and waste capsule from localized corrosion and limits the rate of general corrosion.
At lower pH, however, potentially shorter waste capsule lifetimes are predicted, especially under
aerobic conditions (Fig. 39(b)). These shorter lifetimes are the result of localized corrosion failure of
the containers.
IX.6. SUMMARY AND CONCLUSIONS
An analysis of the expected corrosion behaviour of the stainless steel disposal container and waste
capsule for the borehole disposal concept for disused sealed sources has been carried out. The concept
involves enclosing the used sealed sources in a welded Type 304 stainless steel waste capsule, which
is then placed in a welded Type 316L stainless steel disposal container. The gap between the waste
capsule and disposal container and the region outside the disposal container are filled with cement
grout to condition the near-field pH and to provide a mass-transport barrier to the release of
radionuclides.
The corrosion analysis developed for the GSA calculates the estimated lifetimes of the disposal
container and waste capsule for a range of environmental conditions, including:
three different groundwaters of different salinity and redox potential, and
four different combinations of groundwater flow and degree of saturation.
The behaviour under the expected (Design Scenario) and upset (Defect Scenario) conditions has been
considered.
The corrosion behaviour of the stainless steel containers is dominated by the alkaline near-field pH
and the redox conditions. If the near-field pH remains in the alkaline range (pH >12), the vessels will
undergo general corrosion at a rate that is estimated to range from 0.01 to 0.2 my-1 depending upon
the salinity and redox potential of the surrounding environment. Estimated waste capsule lifetimes are
in excess of 104 y and as high as 7 x 10⁵ y for fresh, anaerobic groundwaters.
At longer times after the cement grout porewater has been leached, or under defect conditions when
the duration of pH control by the cement minerals is limited, localized corrosion is possible in aerobic
environments. For the Design Scenario, localized corrosion is only possible for sites with high
204
hydraulic conductivity (which result in the fastest cement grout leaching), although these conditions
were not found to exist for the references cases considered in the GSA.
Defect Scenario variants have been considered, including:
an initial defect in one disposal container closure weld,
an initial defect in one waste capsule closure weld,
incomplete, or degraded disposal zone cement grout, and
initial defects in one waste capsule and the associated disposal container.
Of these different defects, a defect in the disposal container weld leads to shorter predicted waste
capsule lifetimes than a defect in the waste capsule closure weld because the containment barrier
cement grout is assumed to start to degrade immediately rather than only after failure of the disposal
container. Any defect that compromises the ability of the cement grout to condition the near-field pH
can result in substantially shorter lifetimes in aerobic environments because of the possibility of rapid
localized corrosion failure, although again these conditions were not found to exist for the references
cases considered in the GSA.
Corrosion maps have been constructed summarizing the predicted lifetimes in terms of the effects of
redox potential, groundwater chloride concentration, and near-field pH. Provided the cement grout
barriers are able to condition the near-field pH for the predicted timescales, long waste capsule
lifetimes (defined here as >104 y) are possible in a wide range of groundwater conditions. Anaerobic
groundwaters provide greater assurance against early waste capsule failure in the event that a defect or
other factor leads to faster degradation of the near-field alkaline pH.
REFERENCES
[103] ALEXANDER, A.L., SOUTHWELL, C.R., Forgeson, B.W., Corrosion of metals in
tropical environments, part 5 – stainless steel, Corrosion 17, (1961) 345.
[104] AMERICAN SOCIETY FOR METALS INTERNATIONAL, Corrosion, Metals
Handbook, Ninth edition, Volume 13, (ASM Handbook), Metals Park, OH (1987).
[105] AMERICAN SOCIETY FOR METALS INTERNATIONAL, Corrosion: Fundamentals,
Testing, and Protection, American Society for Metals International, Volume 13A, (ASM
Handbook), Metals Park, OH (2003).
205205205
[106] AMERICAN SOCIETY FOR METALS INTERNATIONAL, Corrosion: Materials,
American Society for Metals International, Volume 13B, (ASM Handbook), Metals Park, OH
(2005).
[107] BETTS, A.J., NEWMAN, R.C., The resistance of austenitic stainless steels to pitting
corrosion in simulated BFS/OPC porewater containing thiosulphate ions, UK Nirex Report
NSS/R164, National Decommissioning Authority, UK (1990).
[108] BLACKWOOD, D.J., et al., The localized corrosion of carbon steel and stainless steel in
simulated repository environments, AEAT/ERRA 0318, (2002).
[109] BECHTEL SAIC COMPANY (BSC) Aqueous corrosion rates for waste package materials,
Prepared for US DOE, ANL-DSD-MD-000001, (2004).
[110] CASTEELS, I., DRESSELAARS, G., TAS, H., Corrosion behaviour of container materials
for geological disposal of high level waste. Commission of the European Communities
Report, EUR 10398 EN, (1986) 3-40.
[111] CLAYTON, C.R., OLEFJORD, I., Passivity of austenitic stainless steels. In Corrosion
Mechanisms in Theory and Practice (Dekker, M., Marcus, P., Oudar, J., Eds), New York, NY
(1995), 175-199.
[112] CUI, I., SAGÜÉS, A., Corrosion performance of stainless steel clad rebar in simulated
porewater and concrete, (Proc. Corrosion 2003, NACE International, Houston, 2003) place
(2003).
[113] DECHEMA, Corrosion Handbook: Corrosive Agents and their Interaction with Materials,
Volume 7 Atmosphere, (1990).
[114] DUNN, D.S., CRAGNOLINO, G.A., SRIDHAR, N., Localized corrosion initiation,
propagation, and repassivation of corrosion resistant high-level nuclear waste container
materials (Proc. CORROSION 96, NACE International, Denver, 1996), (1996?)
[115] FUJISAWA R., KURASHIGE, T., INAGAKI, U., SENOO, M., Gas generation behavior of
transuranic waste under disposal conditions (Proc. MRS Symposium ProceedingsVolume
556, Boston, 1998), Vol. 556, (1999).
[116] FUKAYA, Y., AKASHI, M., Estimation of the cathodic hydrogen evolution rate on
radioactive waste packaging materials (Proc. CORROSION 2003, NACE International, San
Diego, 2003) (2003).
[117] GRIFFEN, R.B., CORNWELL, L.R., SEITZ, W., ESTES, E., Localized corrosion under
biofouling (Proc. CORROSION 88, NACE International, Saint Louis, 1988), (1988).
206
[118] HARUKI, N., KIMURA, T., KURODA, M., MIYUKI, H., KUDO, T., Corrosion resistance
of super stainless steel for condensers of power plants (Proc. Conf. on Stainless Steels, Chiba,
1991), Vol. 2 (1991).
[119] HOCH, A.R., NAISH, C.C., SHARLAND, S.M., SMITH, A.C., TAYLOR, K.J.,
Experiments And Modeling Studies Concerning Localized Corrosion Of Carbon Steel And
Stainless Steel Containers For Intermediate And Low Level Radioactive Waste (Proc. Symp.
Materials Research Society, Boston, 1992), place, (year).
[120] JOHNSON, M.J., PAVLIK, P.J., Atmospheric corrosion of stainless steels (Ailor, W.H.,
Ed.), Atmospheric Corrosion, (1982) 461.
[121] JONES, R.H. (Ed.), Stress-Corrosion Cracking, ASM International, Materials Park, OH
(1992).
[122] KEARNS, J.R., JOHNSON, M.J., FRANSON, I.A., The corrosion of stainless steels and
nickel alloys in caustic solutions (Proc. CORROSION 84, NACE International, Houston, TX,
1984), place & (year).
[123] LAYCOK, N.J., NEWMAN, R.C., Localized dissolution kinetics, salt films and pitting
potentials, Corrosion Science 39, (1997) 1771-1790.
[124] LAYCOCK, N.J., NOH, J.S., WHITE, S.P., KROUSE, D.P., Computer simulation of
pitting potential measurements, Corrosion Science 47, (2005) 3140–3177.
[125] LITTLE, B., WAGNER, P., MANSFELD, I., Microbiologically influenced corrosion of
metals and alloys, International Materials Review 36, (1991) 253–272.
[126] MATTSSON, H., OLEFJORD, I., Analysis of oxide formed on Ti during exposure in
bentonite clay - I. The oxide growth, Vol. 41, (1990) 383–390.
[127] MATTSSON, H., LI, C., OLEFJORD, I., Analysis of oxide formed on Ti during exposure
in bentonite clay. II. The structure of the oxide. Vol. 41, (1990) 578–584.
[128] MCDONALD, D.B., SHERMAN, M.R., PFEIFER, D.W., VIRMANI, Y.P., Stainless steel
reinforcing as corrosion protection, Reprint in Concrete International, No. 14034, (1995).
[129] MCINTYRE, D.R., Experience survey stress corrosion cracking of austenitic stainless steel
in water, Materials Technology Institute, St. Louis, MO, (1987).
[130] MORSY, S.M., EL-RAGHY, S.M., ELSAED, A.A., EL-MEHAIRY A.E., Effect of cations
on the corrosion of stainless alloys in saline water at elevated temperatures, Arab Republic of
Egypt Atomic Energy Establishment Report 232 (1979).
207207207
[131] NAISH, C.C., BLACKWOOD, D.J., TAYLOR, K.J., THOMAS, M.I., The anaerobic
corrosion of stainless steels in simulated repository backfill environments, Nirex Report
NSS/R307 (1995).
[132] NEWMAN, R.C., Understanding the corrosion of stainless steel, Corrosion Vol. 57, (2001)
1030-1041.
[133] NEWMAN, R.C., FRANZ, E.M., Growth and repassivation of single corrosion pits in
stainless steel, Corrosion Vol. 40, (1984) 325.
[134] PARK, J.O., MATSCH, S., BÖHNI, H., Effects of temperature and chloride concentration
on pit initiation and early pit growth of stainless steel, Journal of The Electrochemical
Society, Vol. 149, Issue 2, (2002) B34-B39.
[135] POURBAIX, M., Atlas of Electrochemical Equilibria in Aqueous Solutions, 2nd edn,
Cebelcor, Brussels, Belgium, NACE International, Houston, TX, (1974).
[136] REVIE, R.W., Uhlig’s Corrosion Handbook, 2nd edn, (WILEY, J., Ed.), New York (2000).
[137] RUBINSHTEJN, I.I., LASHCHEVSKAYA, D.E., RUBINSHTEJIN, E., MAMONTAVA,
L.M., GULYAEV, V.A., Accelerated testing of the corrosion resistance of chromium nickel
steels in model environments simulating the manufacturing conditions of the synthetic resin
KFE, Mat. Primen, No. 3, (1977) 59.
[138] SEDRIKS, A.J., Corrosion of Stainless Steels, 2nd edn (Wiley, J., Ed.), New York, NY
(1996).
[139] SHARLAND, S.M., (Proc. Nuclear Waste Packaging FOCUS’ 91, La Grange Park, IL,
1991), place (year) 233–240.
[140] SHREIR, L.L., JARMAN, R.A., BURSTEIN, G.T., (Eds) Corrosion, 3rd edn., Butterworth-
Heinemann, Oxford (1994).
[141] SMART, N.R., et al., The Anaerobic Corrosion of Carbon and Stainless Steels in Simulated
Repository Environments: A Summary Review of Nirex Research, AEA Technology Report
AEAT/ERRA-0313, (2004).
[142] SRIDHAR, N., CRAGNOLINO, G.A.,DUNN, D., Experimental investigations of localized
corrosion of high-level container materials, Center for Nuclear Waste Regulatory Analyses,
San Antonio, TX (1993) 93-004.
[143] SRIDHAR, N., BROSSIA, C.S., DUNN, D.S., ANDERKO, A., Predicting localized
corrosion in seawater, Corrosion Vol. 60, (2004) 915-936.
208
[144] SZKLARSKA-SMIALOWSKA, Z., Pitting and Crevice Corrosion, NACE International,
Houston, TX (2005).
[145] TANI, J., MAYUZUMI, M., Stress corrosion cracking of stainless steel canister for dry
storage of spent fuel using concrete cask (Proc. Workshop on Long-term Prediction of
Corrosion Damage in Nuclear Waste Systems, Pennsylvania State University, PA 2007),
place (year).
[146] WADA, R., NISHIMURA, T., FUJIWARA, K., TANABE, M., MIHARA, M.,
Experimental study of hydrogen gas generation rate from corrosion of Zircaloy and stainless
steel under anaerobic alkaline condition (Proc. ICEM Conf. Radioactive Waste Management
and Environmental Remediation, Nagoya, 1999), place (year).
[147] WHITE, J.H., YANIC, A.E., SCHICK, H., The corrosion of metals in the water of the Dead
Sea, Corrosion Science 6, (1966) 447.
209209209
TABLE 40. LITERATURE GENERAL CORROSION RATES FOR STAINLESS STEEL IN HIGHLY ALKALINE SOLUTION
Grade pH Temperature (oC) [Cl-]
(gg-
1)
Redox conditions Other Rate (myr-1)
Reference
304 12.8
10.5
30, 45 200 days
60 days
0.000 3
0.01
Fujisawa et al. 1999
304 13.3 Ambient 18 400 Aerated 28 days 0.3 Mcdonald et al. 1995
304 13 30
50
80
Deaerated 0.06
0.18
0.82
Blackwood et al. 2002
304 10
12.5
13.5
50 Deaerated 230 days 0.009
0.005 5
0.006 3
Wada and Nishimura 1999
304 12.8 30 Deaerated Calculated
1 year
10 years
100 years
1000 years
104 years
0.055
0.010
0.002
0.000 3
0.000 06
Fukaya and Akashi 2003
316 13.3 Ambient 18 400 Aerated 28 days 0.6 Mcdonald et al. 1995
316L >13 Ambient 10 000 Deaerated 0.1 MPa H2 0.03 Smart et al. 2004
Stainless steel
13 Ambient Deaerated 0.1 moldm-3 KOH agar gel, 50 days
0.4-1.6 Sharland 1991
Stainless steel
13.4 Ambient Aerated 1-6 Rubinshtejn et al. 1977
Stainless steel
12.9 25-80 10 000 Deaerated <0.1 Naish et al. 1995
210
TABLE 41. LITERATURE GENERAL CORROSION RATES FOR STAINLESS STEEL IN NEUTRAL TO SLIGHTLY ALKALINE SOLUTION
Grade pH Temperature (oC) [Cl-]
(gg-1)
Redox conditions Other Rate (myr-1)
Reference
304 Ambient 90 7000-43 000 Aerated 10 hrs 10-130 Morsy et al. 1979
304L Ambient 25-100 “Freshwater” Aerated 0.21 BSC 2004
304L Ambient 27
90
“Saltwater” Aerated 11.4
5.82
BSC 2004
304 Ambient 25
50
75
Interstitial clay water Aerated 0.2-0.96
0.22-0.23
0.3-0.35
Casteels et al. 1986
316 Ambient Ambient 19 000 Aerated 8 years, Pacific Ocean seawater
4 Alexander et al. 1961
316L Ambient 30
50-100
“Freshwater” Aerated 0.01
0.25
BSC 2004
316L Ambient 27 “Saltwater” Aerated 1.94 BSC 2004
316 Ambient 25
50
75
Interstitial clay water Aerated 0.1-0.24
0.1-0.34
0.1-0.17
Casteels et al. 1986
Stainless steel
Ambient 25-40 Seawater
19 000
Deaerated 120 days 0.8 White et al. 1966
Stainless steel
Ambient 25-40 7.7 gg-1 O2
2.17 gg-1 O2
0.55
4.8
White et al. 1966
Stainless steel
9.8
9.4
25
80
2000 Deaerated 0.025-0.23
0.01-0.034
Hoch et al. 1992
211211211
TABLE 42. LITERATURE GENERAL CORROSION RATES FOR STAINLESS STEEL UNDER ATMOSPHERE
CONDITIONS
Grade Temperature (oC)
Redox conditions
Other Rate (myr-1)
Reference
304 Ambient Aerated Urban, 5-15 years
Urban, 5-15 years
Marine, 5-15 years
Industrial/urban, 5-15 years
<0.03
0.022
0.05-2
0.01
Johnson and Pavlik 1982
304 Ambient Industrial/urban 0.03-3 Kearns et al. 1984
316 Ambient Aerated Urban, 5-15 years <0.03 Johnson and Pavlik 1982
Stainless steel
Ambient Aerated Various atmospheres 0.05 Dechema 1990
212
TABLE 43(a). LITERATURE DATA ON PITTING OF TYPE 304 STAINLESS STEELS
Grade
Temperature
(oC)
[Cl-]
(mgkg-1)
Other EP or ERP
(mVSCE)
Reference
304 80 19 000 Synthetic seawater +50 (EP) Haruki et al. 1991
304 20 34 500 With additions of Na2S2O3
0 moldm-3
4 x 10⁻⁴moldm-3
1 x 10⁻³ moldm-3
2 x 10⁻³ moldm-3
4 x 10⁻³ moldm-3
0.01 moldm-3
0.1 moldm-3
0.4 moldm-3
1.0 moldm-3
(EP)
+30*
-20
+40
-130
-205
-195
-135
-95
-65
Szklarska-Smialowska 2005 (Fig 7.15)
304 80 34 500 With additions of Na2S2O3
0 moldm-3
1 x 10⁻⁴ moldm-3
4 x 10⁻⁴moldm-3
1 x 10⁻³ moldm-3
0.01 moldm-3
0.1 moldm-3
(EP)
-65*
-65
-255
-265
-260
-190
Szklarska-Smialowska 2005 (Fig 7.15)
304 25
40
60
90
17 000 With addition of 0.1 moldm-3 NaHCO3, pH 8
+415 (EP)
+320+155
+65
Szklarska-Smialowska 2005 (Fig 12.2)
304 100
150
345 Sensitized 304 -55 (EP)
-240
Szklarska-Smialowska 2005 (Fig 12.5)
304
20
40
60
80
Range 100-20 000
(EP)
750 – 152 log [Cl-]
628 – 140 log [Cl-]
554 – 144 log [Cl-]
500 – 145 log [Cl-]
Szklarska-Smialowska 2005 (Fig 12.6)
304 Ambient 34 500 +232 (EP) Szklarska-Smialowska 2005 (Fig 18.4)
304 3450 With addition of 0.1 moldm-3 NaHCO3
-70 (EP) Sedriks 1996 (Table 4.3)
304 30 660 +50 gg-1 SO42-, 2 gg-1 Cu2+
Base metal
Weld HAZ
60% cold work
(EP)
+390
+190
+210
Sedriks 1996 (Table 4.10)
304L 30 142 000 pH 9.3 -51 (EP)
-216 (ERP)
Sridhar et al. 1993
213213213
Grade
Temperature
(oC)
[Cl-]
(mgkg-1)
Other EP or ERP
(mVSCE)
Reference
304 18 400 pH 3
pH 4
pH 5
pH 6
pH 7
pH 8
pH 9
pH 10
pH 11
pH 12
-5 (EP)
+10
+15
+25
+40
+50
+60
+70
+80
+400
Sedriks 1996 (Fig. 4.38)
304 30 18 400 +60 (EP) Sedriks 1996 (Fig. 4.42)
314 25 17 000 pH 5 +200 (EP) Sedriks 1996 (Table 4.15)
304 25 34 500 H2 atmosphere 0.076 gg-1 O2
N2 atmosphere 0.460 gg-1 O2
Ar atmosphere 0.057 gg-1 O2
O2 atmosphere 30.1 gg-1 O2
-50 (EP)
-20
+50
+65
Sedriks 1996 (Table 4.16)
304 20 345
3450
34 500
Mean values, dEP/dlog[Cl-] = 127 mV
1000 grit
+565 (EP)
+460
+315
Laycock et al. 2005
304 20 345
3450
34 500
Mean values, dEP/dlog[Cl-] = 137 mV
220 grit
+495 (EP)
+385
+220
Laycock et al. 2005
304 0
30
60
90
3450 +360 (EP)
+190
+60
-20
Park et al. 2002
214
TABLE 43(b). LITERATURE DATA ON PITTING OF TYPE 316 STAINLESS STEELS
Grade Temperature (oC)
[Cl-]
(gg-1)
Other EP or ERP
(mVSCE)
Reference
316L 80 19 000 Synthetic seawater +150 (EP) Haruki et al. 1991
316L 20 34 500 With additions of Na2S2O3
0 moldm-3
1 x 10⁻⁴moldm-3
2 x 10⁻³ moldm-3
4 x 10⁻³ moldm-3
0.01 moldm-3
0.04 moldm-3
0.1 moldm-3
0.4 moldm-3
1.0 moldm-3
(EP)
+180*
+110
+125
+125
+140
-50
-25
+5
+50
Szklarska-Smialowska 2005 (Fig 7.15)
316L 80 34 500 With additions of Na2S2O3
0 moldm-3
1 x 10⁻⁴moldm-3
2 x 10⁻³ moldm-3
4 x 10⁻³ moldm-3
0.01 moldm-3
0.04 moldm-3
0.1 moldm-3
(EP)
+55*
+55
+85
0
-135
-115
-100
Szklarska-Smialowska 2005 (Fig 7.15)
316L
18
30
40
50
60
19 000 Seawater
ECORR = -155 mVSCE (8 mm crevice corrosion)
ECORR = -346 mVSCE (25-30 mm CC)
ECORR = -393 mVSCE (25-30 mm CC)
ECORR = -365 mVSCE (10 mm CC, 0.025 mm pit)
ECORR = -362 mVSCE (40 mm CC, 0.021 mm pit)
(EP/ERP)
+505/+2
+274/-166
+156/-274
+155/-215
+28/-142
Szklarska-Smialowska 2005 (Table 13.2)
316 17 000 With addition of 0.1 moldm-3 NaHCO3 +140 (EP) Sedriks 1996 (Table 4.3)
316 31 000 Oxygenated solution, 0.4-2 wt.% Mn +210-245 (EP)
Sedriks 1996 (Table 4.27)
316L 40
50
60
70
21 500 +275 (EP)
+220
+135
+70
Sedriks 1996 (Fig. 4.36)
316L 30 142 000 pH 9.3 -48 (EP)
-237 (ERP)
Sridhar et al. 1993
316 18 400 pH 3
pH 4
pH 5
pH 6
pH 7
pH 8
+285 (EP)
+285
+285
+285
+285
+290
Sedriks 1996 (Fig. 4.38)
215215215
Grade Temperature (oC)
[Cl-]
(gg-1)
Other EP or ERP
(mVSCE)
Reference
pH 9
pH 10
pH 11
pH 12
+305
+350
+460
+585
316L 80 35
345
3450
NaCl solutions only +115 (EP)
-5
-105
Sedriks 1996 (Fig. 4.41)
316L 80 35
345
3450
34 500
Cl-/S2O32- mixtures, [Cl-]:[S2O3
2-] = 17 +45 (EP)
-180
-215
-275
Sedriks 1996 (Fig. 4.41)
316 30 18 400 Effect of temperature +230 (EP) Sedriks 1996 (Fig. 4.42)
316 20 345
3450
10 300
34 450
120 grit finish, aerated solution +317 (EP)
+205
+170
+98
Laycock and Newman 1997
316 20 3 450
34 450
Mean values, dEP/dlog[Cl-] = 206 mV
1000 grit
+630 (EP)
+415
Laycock et al. 2005
316 20 345
3450
34 500
Mean values, dEP/dlog[Cl-] = 220 mV
220 grit
+750 (EP)
+500
+335
Laycock et al. 2005
216
TABLE 44(a). LITERATURE DATA ON CREVICE CORROSION OF TYPE 304 STAINLESS STEELS
Grade Temperature
(oC)
[Cl-]
(gg-
1)
Other ECREV or ERCREV
(mVSCE)
Reference
304 17 000
34 500
+131 (ECREV)
+10
Szklarska-Smialowska 2005 (Fig 18.4)
304L 10
20
30
40
50
60
70
80
19 000 Seawater, pH 8.2 -120 (ERCREV)
-140
-150
-155
-175
-175
-200
-210
Tani and Mayuzumi 2007
304 80 19 000 Synthetic seawater -10 (ECREV) Haruki et al. 1991
217217217
TABLE 44(b). LITERATURE DATA ON CREVICE CORROSION OF TYPE 316 STAINLESS STEELS
Grade
Temperature (oC)
[Cl-]
(gg-
1)
Other ECREV or ERCREV
(mVSCE)
Reference
316L 10
20
30
40
50
60
70
80
19 000 Seawater, pH 8.2 -80 (ERCREV)
-95
-110
-120
-140
-155
-155
-165
Tani and Mayuzumi 2007
316L 23-50 6000- 0-800 gg-1 S2O32-,
800-3,400 gg-
1 SO42-
ERCREV = -301.5 – 3.7([Cl-]-15) – 15.3([SO42-]-2.1)
–188.7([S2O32-]-0.4) – 2(T-36.5)
–0.047(([Cl-]-15)([SO42-]-2.1)
+ 3.83([Cl-]-15)([S2O32-]-0.4)
–0.75([Cl-]-15)(T-36.5) + 0.35([Cl-]-15)2
T in oC, concentrations in g/L
Sridhar et al. 2004
316L 80 19 000 Synthetic seawater +80 (ECREV) Haruki et al. 1991
218
TABLE 45. LITERATURE DATA ON CORROSION POTENTIAL OF STAINLESS STEELS
Grade pH Temperature
(oC)
[Cl-]
(gg-1)
Redox conditions Other ECORR (mVSCE) Reference
304L 8.2 24
30
50
60
70
80
19 000 Aerated Seawater -90
-90
-120
-140
-155
-210
Tani and Mayuzumi 2007
304L 9.3 30 142 000 Deaerated -488 Sridhar et al. 1993
304 5 25 17 300 Deaerated -464 Sedriks 1996 (Table 4.15)
304 34 500 Aerated -63 Szklarska-Smialowska 2005 (Fig 18.4)
304 4.5 3 450 Aerated -14 Sridhar et al. 2004
316L 7
10
12
0.32 gg-1 O2 0.5 m Na2SO4 -117
-119
-145
Sridhar et al. 2004
316L 8.2 24
30
50
60
70
80
19 000 Aerated Seawater -80
-85
-105
-120
-140
-165
Tani and Mayuzumi 2007
316L 95 6-1000 Deaerated 10-1,000 gg-1
NO3-,
2 gg-
-1 F-, 20-1,000 gg-
-1 SO42-
-739 to -454 Sridhar et al. 1993
316L 9.3 30 142 000 Deaerated -685 Sridhar et al. 1993
316L 10
12.6
13.6
22 177 000 Aerated +70
-80
-125
Cui and Sagues 2003
316L 12.6 22 Aerated -100 Cui and Sagues 2003
316L 95 1000
200 000
Aerated -125
-330
Dunn et al. 1996
316L 19 000 0.45 gg-1 O2
2.6 gg-1 O2
7.6 gg-1 O2
34.7 gg-1 O2
-86
-44
-18
+47
Sridhar et al. 2004
316L 9.3 30 142 000 Deaerated -685 Sridhar et al. 1993
316L 10
12.6
22 177 000 Aerated +70
-80
Cui and Sagues 2003
219219219
Grade pH Temperature
(oC)
[Cl-]
(gg-1)
Redox conditions Other ECORR (mVSCE) Reference
13.6 -125
316L 12.6 22 Aerated -100 Cui and Sagues 2003
316L 95 1000
200 000
Aerated -125
-330
Dunn et al. 1996
316L 19 000 0.45 gg-1 O2
2.6 gg-1 O2
7.6 gg-1 O2
34.7 gg-1 O2
-86
-44
-18
+47
Sridhar et al. 2004
220
TABLE 46. TARGET LIFETIMES FOR THE WASTE CAPSULE AND DISPOSAL CONTAINER IN THE
GENERIC SAFETY ASSESSMENT OF THE BOREHOLE DISPOSAL CONCEPT BASED ON
RADIONUCLIDE ACTIVITY
Target lifetime
(years)
Description Radionuclide
Inventory
>105 MBq
Other
10 Safe handling requirement
Containment of radionuclides with
t1/2 100 days
Ir-192, Yb-169 Hg-203
300 Containment of radionuclides with
t1/2 30 years
As above, plus
H-3, Co-60, Se-75,
Kr-85, Sr-90, Cs-
137, Pm-147
As above, plus
Na-22, Mn-54, Fe-55, Co-57, Zn-65, Y-88,
Cd-107, Ba-133, Eu-152, Gd-153, Au-195,
Tl-204, Pb-210, Po-210, Cf-252,
2 x 10⁴ Containment of radionuclides with
t1/2 2000 years
As above, plus
Ra-226, Am-241
As above, plus
Ni-63, Sm-151, Pu-238
106 Containment of radionuclides with
t1/2 105 years
As above, plus
Pu-239
As above
221
TABLE 47. GROUNDWATERS CONSIDERED IN THE GSA CORROSION ANALYSIS
Groundwater
ID
[Cl-]
(gg-1
[SO42-]
(gg-1)
Total inorganic
carbon
(gg-1)
EH
(mVSHE)pH
1 0.53 2.88 0.23 996 4.10
5 0.52 10.66 42.5 -281 8.46
6 20 917 2891 416 -303 7.95
10 10.9 9.9 30.9 220 10.40
11 41 134 1591 12 047 600 10.30
12 104 800 39 700 3941 630 10.00
222
TABLE 48: OVERVIEW OF VARIOUS PROCESSES IN THE GSA CORROSION MODEL.
Process Stages 1 and 2
(pH 12.5)
Stages 3 and 4
(pH < 12.5)
General corrosion Factor of two-fold higher rate in saline waters compared with fresh waters
Factor of 10-fold higher rate in aerobic compared with anaerobic conditions
Rate increases with decreasing pH, increasing EH, and increasing [Cl-]
Pitting No pitting during these stages as EP and ERP exceed ECORR
Possible under aerobic, but not anaerobic, conditions.
EP decreases with increasing [Cl-]
Crevice corrosion No crevice corrosion during these stages as ECREV and ERCREV exceed ECORR
Possible under aerobic, but not anaerobic, conditions.
Crevice corrosion assumed to initiate at more-negative potential than pitting.
ERCREV relatively insensitive to [Cl-].
Susceptibility to localized corrosion (as determined by the condition ECORR ERCREV) converted to a critical pH. pHCRIT = 11 for Type 304 and 10 for Type 316, reflecting the greater susceptibility of the lower-grade alloy.
Stress corrosion cracking
Not specifically included in model as failure assumed to occur by localized corrosion first
Not specifically included in model as failure assumed to occur by localized corrosion first
Microbiologically influenced corrosion
No microbial activity because of elevated pH
Not explicitly included as failure by general or localized corrosion generally occurs at pH values greater than those at which microbial activity would be expected.
Preferential attack on welds
No difference in weld behaviour at elevated pH
Greater sensitivity of Type 304 due to possible sensitisation of weld, reflected in the lower pHCRIT
for localized corrosion.
Effect of redox conditions
Factor of 10-fold higher rate in aerobic compared with anaerobic conditions
Localized corrosion possible under aerobic, but not anaerobic, conditions
Material-specific issues Same rate of general corrosion for both materials.
EP and ECREV for Type 316 ~100-200 mV more positive than for Type 304
Same rate of general corrosion for both materials.
Type 304 more sensitive to localized corrosion, reflected in higher critical pH
TABLE 49. SUMMARY OF THE GSA CORROSION MODEL
Aerobic conditions Anaerobic conditions
Stage 1 (pH 13.5) General corrosion only General corrosion only
Stage 2 (pH 12.5) General corrosion only General corrosion only
Stage 3(a) (pHCRIT < pH < 12.5) General corrosion only General corrosion only
Stage 3(b) (pHGW < pH pHCRIT) General and localized corrosion General corrosion only
Stage 4 (pHGW) General and localized corrosion General corrosion only
223223223
TABLE 50. RATES OF GENERAL CORROSION USED IN THE GSA CORROSION MODEL*
Groundwater ID
Groundwater characteristics
Stage 1(pH 13.5)
Stage 2(pH 12.5)
Stage 3(a)
(pHCRIT < pH < 12.5)
Stage 3(b)
(pHGW < pH pHCRIT)
Stage 4(pHGW)
1 Aerobic, fresh, pH 4.1 0.1 0.1 0.1 0.5 1
5Anaerobic,
fresh, pH 8.5
0.01 0.01 0.01 0.01 0.01
6Anaerobic,
saline, pH 8
0.02 0.02 0.02 0.05 1
10Aerobic, fresh,
pH 10.4
0.1 0.1 0.1 0.15 0.2
11
Aerobic, saline, pH 10.3
0.2 0.2 0.2 1 2
12
Aerobic, saline, pH 10.0
0.2 0.2 0.2 1 2
* Rates in myr-1
TABLE 51. DERIVATION OF THRESHOLD POTENTIALS FOR LOCALIZED CORROSION IN SLIGHTLY ALKALINE TO NEAR-NEUTRAL PH ENVIRONMENTS*
Type 304 Type 316/316L
Fresh water Saline water Fresh water Saline water
EP (mVSCE) +400 +150 +500 +300
Est. ECREV (mVSCE) +200 -50 +300 +100
Est. ERCREV (mVSCE) 0 -250 +100 -100
Est. minimum ERCREV (mVSCE) -200 -450 -100 -300
ECORR (mVSCE)
Aerated-100 -150 -100 -150
ECORR (mVSCE)
Deaerated-600 -550 to -600 -600 -550 to -600
* See text for detailed description of the derivation.
224
TABLE 52. FAILURE TIMES FOR THE REFERENCE CASES
GeosphereDisposal Container Failure Times (y)a Waste Capsule Failure Times (y)a
Initial perf
10% perf
50% perf 100% perf Failure
modebInitial
perf 10% perf 50% perf 100% perf Failure modeb
Unsaturated Zone, groundwater #1 4.80E+04 4.80E+04 4.80E+04 4.80E+04 GC, Stage 2 7.20E+04 7.20E+04 7.20E+04 7.20E+04 GC, Stage 2
High flow (porous and fractured), groundwater #5 4.80E+05 4.80E+05 4.80E+05 4.80E+05 GC, Stage 4 7.20E+05 7.20E+05 7.20E+05 7.20E+05 GC, Stage 4
Medium flow, groundwater #5 4.80E+05 4.80E+05 4.80E+05 4.80E+05 GC, Stage 4 7.20E+05 7.20E+05 7.20E+05 7.20E+05 GC, Stage 4
Low flow, groundwater #6 2.15E+05 2.15E+05 2.15E+05 2.15E+05 GC, Stage 3b 2.90E+05 2.90E+05 2.90E+05 2.90E+05 GC, Stage 3b
Notes: a Time from time of waste emplacement.b GC= General Corrosion; Stage refers to the stage of the cement grout degradation model (see Appendix VIII) in which the container/capsule fails.
225
(a) Cr2O3
(b) Cr(OH)3
FIG. 26. Potential-pH Diagrams for the Cr-H2O System
Assuming Cr2O3 or Cr(OH)3 as the Stable Cr(III) Solid
Species (Pourbaix 1974).
226
(a) Pure water
(b) Chloride solution
FIG. 27. Solubility of Chromium in Aqueous Solution in Equilibrium with Cr(OH)3 or Cr2O3
(Pourbaix 1974).
227227227
FIG. 28. Dependence of the Pitting Potential of 316L Stainless Steel on Chloride
Concentration and Temperature.
FIG. 29. Ranges of pH, Chloride Concentration and
228
Temperature for the Pitting and SCC of 304 Stainless
Steel (Jones 1992).
229229229
(a) Laycock and Newman (1997)
(b) Laycock et al. (2005).
(c) From Sedriks (1996)
230
(d) Type 304 stainless steel, Szklarska-Smialowska (2005)
231231231
(e) Dunn et al. (1996)
FIG. 30. Examples of Experimental Studies of the Dependence of the Pitting and Pit Repassivation Potentials on Chloride Concentration for Types 304 and 316 Stainless Steel.
232
FIG. 31. Dependence of the Pitting Potential on Temperature for Types 304 and 316
Stainless Steel in 3% NaCl Solution (from Sedriks 1996).
FIG. 32. Dependence of the Pitting Potential on pH for Types 304 and 316 Stainless
Steel in 3% NaCl Solution (from Sedriks 1996).
233233233
FIG. 33. Map of the Dependence of Crevice Corrosion and
Pitting on Potential and Chloride Concentration (from
Szklarska-Smialowska 2005).
FIG. 34. Inhibitive Effect of Sulphate on the Crevice Corrosion of Types 304
and 316 Stainless Steel in Chloride Solutions (from Sedriks 1996).
234
(a) Dependence of ECORR on [O2] in Artificial Seawater.
(b) Dependence of ECORR on pH in Aerated Na2SO4 and NaCl Solution.
235235235
(c) Dependence of ECORR on pH in 0.5 m Na2SO4 Containing
0.32 gg-1 O2.
FIG. 35. Dependence of the Corrosion Potential on Oxygen
Concentration and pH of Type 316L Stainless Steel (Sridhar
et al. 2004).
236
FIG. 36. Decision Tree for the Corrosion Model Used for the Borehole Disposal Concept Generic Safety Assessment.
237237237
Is the environment aerobic or anaerobic?
Aerobic Anaerobic
Is the pH less than the critical pH for localized
corrosion?
Is the Cl- concentration greater than the critical
concentration for localized corrosion?
General corrosion
only
No
General corrosion
only
General corrosion
only
Yes
No
General and localized corrosion
and SCC
Yes
FIG. 37. Crevice Re-passivation Potentials for Type 316L Stainless Steel from the Polynomial Expression Developed from
Experimental Measurements by Sridhar et al. (2004). Curves shown for different concentrations of sulphateions.
238
-250
-200
-150
-100
-50
0
0 5 10 15 20 25Chloride concentration (g/L)
E RC
REV
(mV S
CE)
0 g/L SO41 g/L SO42 g/L SO43 g/L SO4
(a) Aerobic conditions.
(b) Anaerobic conditions.
FIG. 38. Corrosion Maps Illustrating the Effect of the Near-field pH and Chloride Concentration
on the Predicted Lifetimes of the Waste Capsule for the Borehole Disposal Concept.
(a) Alkaline pH (pH > 12).
239239239
1
100
10000
1000000
<7 7-9 9-12 >12
Near-field pH
Chl
orid
e co
ncen
trat
ion
(g.
g-1)
3.6 x 10⁴ yr
7.2 x 10⁴ yr
100 yr
100 yr
100 yr
100 yr - >104 yr
100 yr - >104 yr
100 yr - >104 yr
5 x 10⁴ yr
5 x 10⁴ yr100 yr - >104 yr
100 yr - >104 yr
1
100
10000
1000000
<7 7-9 9-12 >12
Near-field pH
Chl
orid
e co
ncen
trat
ion
(g.
g-1)
7.2 x 10³ yr 3.6 x 10⁵ yr1.4 x 105 yr
7.2 x 10⁵ yr7.2 x 105 yr 7.2 x 10⁵ yr 7.2 x 10⁵ yr
7.2 x 10³ yr
5 x 10⁵ yr5 x 104 yr5 x 104 yr 5 x 10⁵ yr

(b) Ambient pH.
FIG. 39. Corrosion Maps Illustrating the Effect of the Chloride Concentration and Redox Potential on the Predicted Lifetimes of the Waste Capsule for the Borehole Disposal Concept.
240
1
100
10000
1000000
< -200 -200 to +200 > 200
Redox potential (mVSHE)
Chl
orid
e co
ncen
trat
ion
(g.
g-1)
7.2 x 10⁵ yr
5 x 10⁴ yr
7.2 x 10³ yr
100 yr - >104 yr
100 yr
100 yr100 yr - >104 yr
100 yr - >103 yr
100 yr - >105 yr
1
100
10000
1000000
< -200 -200 to +200 > 200
Redox potential (mVSHE)
Chl
orid
e co
ncen
trat
ion
(g.
g-1)
7.2 x 10⁵ yr
5 x 10⁵ yr
3.6 x 10⁵ yr
7.2 x 10⁴ yr
5 x 10⁴ yr
3.6 x 10⁴ yr105 yr
105 yr
105 yr
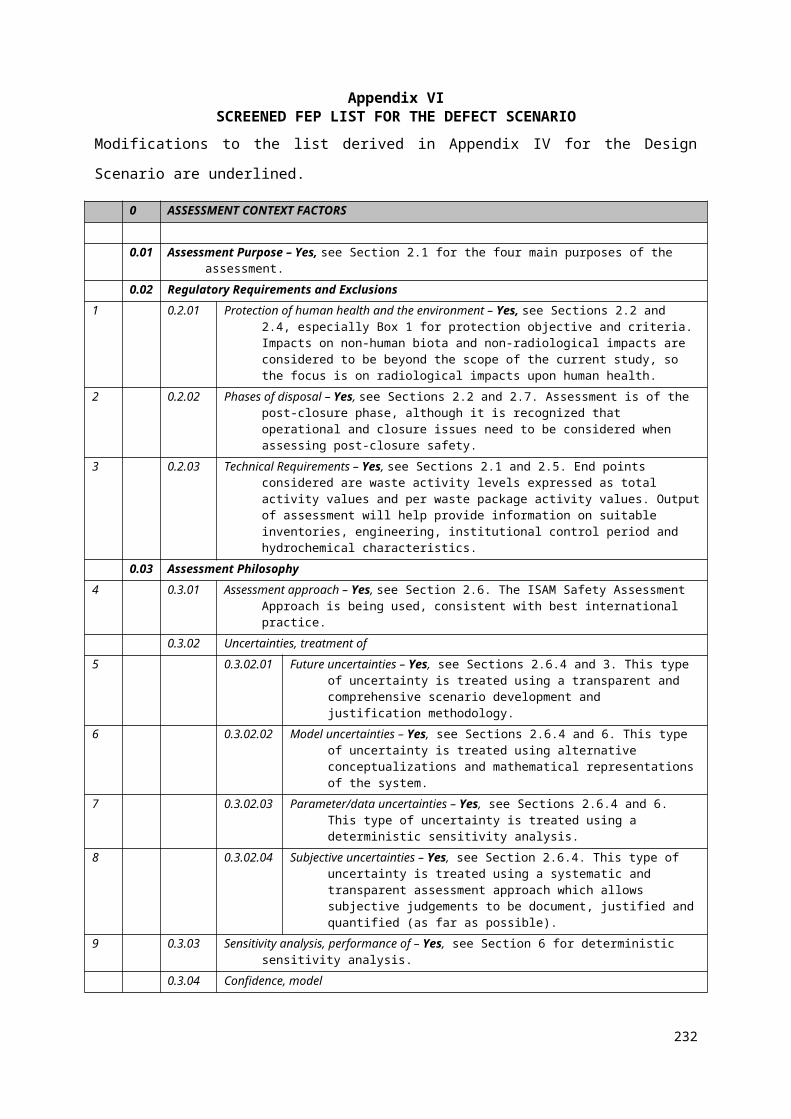
Appendix XCALCULATION OF SOLUBILITY CONDITIONS
This appendix provides background information in a series of tables concerning the potential for
solubility limitation of the 13 radionuclides assessed in GSA.
It is not possible to calculate precise limiting solubilities for the radionuclides of interest, nor to be
entirely confident that a solubility control would or would not exist. There are many reasons for these
limitations, but notably:
thermodynamic data are of uncertain quality or absent for mineral phases that could contain the
radionuclides of interest;
kinetic factors will control whether or not a true solubility limit is reached.
there is an uncertainty about the exact chemical form of the wastes.
To estimate whether or not a mineral phase is likely to control the aqueous concentrations of the
radionuclides of interest in the waters considered, two approaches were used:
calculations were carried out using the computer code Geochemists Workbench version 6.0 [148]
in conjunction with the thermodynamic database “thermo.com.v8.r6+.dat”;
a brief iterature search was carried out.
The results are summarized in Table 53. Supporting results are shown in Tables 54 to 57 for the three
reference waters identified in Section 3.2 (i.e. water Nos 1, 5 and 6).
Table 54 provides information for a “cement” porewater for each of the three reference waters,
denoted C1, C5 and C6, corresponding to groundwaters Nos 1, 5 and 6 respectively. Each of the
simplified model cement porewaters has been derived by taking a groundwater composition and
content by fixing the pH at 12.5 and constraining the calcium and bicarbonate content content by
specifying equilibrium with portlandite and calcite respectively. The resulting water is considered to
represent the water that would result from the interaction of the groundwater with the cement grout in
the borehole. In contrast Table 55 provides information for the unmodified background groundwater
(suitable for use once the cement grout has degraded).
It should be noted that in some cases, from a thermodynamic point of view, it would be expected that a
radionuclide would be released from the waste form instantaneously (because it occurs within a solid
that is very soluble), but would then precipitate in a less soluble mineral that is not present initially
within the waste form. In such cases, it might be appropriate to simulate release from the waste by a
solubility-limiting approach, using the secondary phase to calculate the concentration of the
radionuclide of interest. Relevant information is provided in Table 56 (for cement waters) and
Table 57 (for unmodified background groundwaters). However, it is necessary to bear in mind that
242
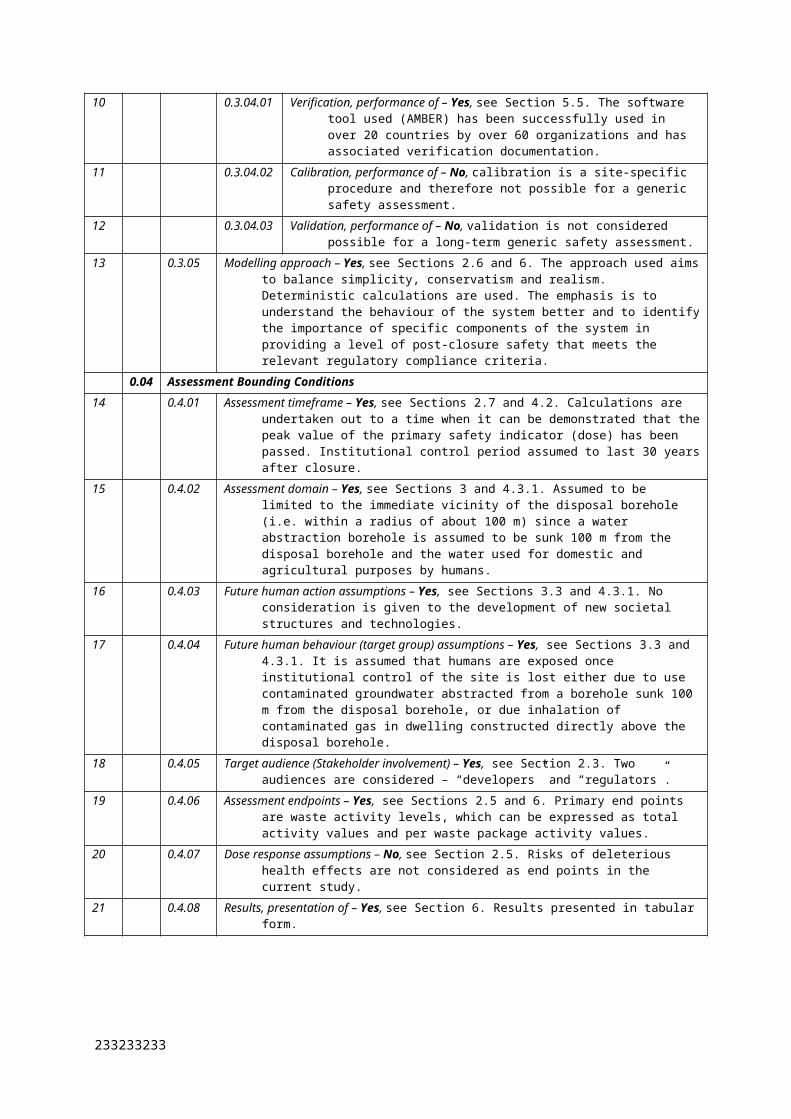
reaction kinetics may be too slow to allow this secondary mineral phase to form. Therefore, it would
be conservative to assume instantaneous release in these cases.
It must be borne in mind that there are several limitations with the results of these calculations.
The thermodynamic data used for the solubility calculations are of uncertain quality.
The solid phases used in the calculations to represent the solids present in the waste forms only
approximate the phases actually containing the radionuclides considered. As a result, the
calculated solubilities may actually depart significantly from the actual solubilities.
The calculations are all thermodynamic equilibrium calculations. It is unclear whether or not
equilibrium would actually occur. A particular issue is the fact that the waste forms themselves
may be only metastable. That is, the calculations may indicate that the waste form would be
dissolved, to be replaced by another, lower solubility phase which would thereafter control the
aqueous concentration of the radionuclide that it contains. However, in reality, formation of
such a lower solubility phase may not occur for kinetic reasons, meaning that a solubility
control is never actually achieved.
Further relevant information is provided in Ref. [149]. These authors calculated the solubilities of
plutonium, neptunium, uranium, americium, actinium, thorium, protactinium, lead, and radium using
the EQ3/6 thermodynamic database developed for the Yucca Mountain project (Data0.ymp.R2). The
solubilities of the various radionuclides are reported as a function of pH for a range of water
compositions, based on the following water analysis.
The solubilities of solid phases containing the above radionuclides were calculated using the code
EQ3NR and the above water composition. For each phase, a number of calculations were performed in
which the pH was varied between 3.5 and 9. For each solubility-controlling phase, sensitivity
calculations were also carried out in which the concentration of a particular constituent was increased
243
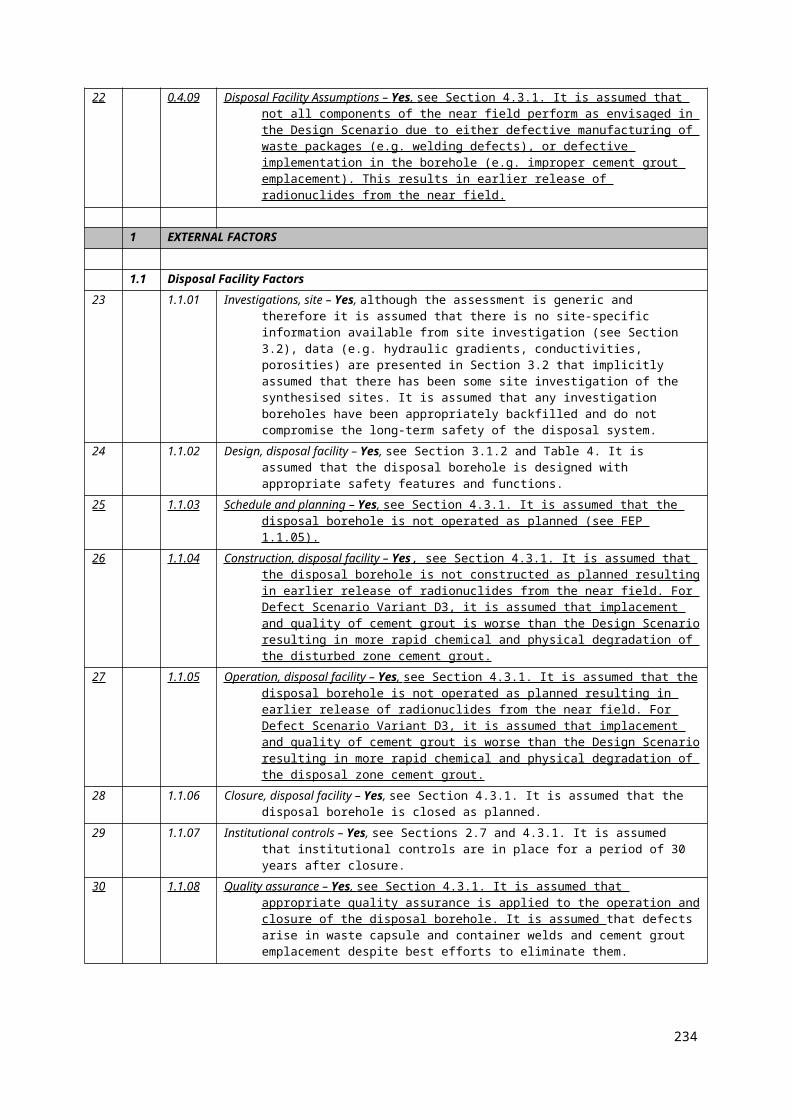
to 10x, 100x and 1000x the initial value. Thus, the overall range of water compositions spanned those
considered by the borehole disposal project.
Key conclusions from the work in Ref. [149] are that:
Pu could be solubility-limited by PuO2.
Am could be solubility-limited by AmOHCO3, Am(OH)3 and Am(OH)3(am). However, the
report considered that the first of these, AmOHCO3 is most likely to be the solubility-limiting
phase in practice in the above water and through a pH range from 5.9 to 8.4 and temperatures
from 25 to 90°C.
Ra is considered potentially to be solubility limited by RaSO4. However, it is also noted that field
studies have shown that radium concentrations in some natural waters are orders of magnitude
below levels corresponding to RaSO4 saturation. Instead, the report points out that natural
concentrations are more likely to be controlled by the solubilities of radium in solid solution in
more common sulfate solids such as SrSO4 or BaSO4.
Pb is one of the least mobile of the common heavy metals. In low-pH, SO4-rich waters or neutral
to alkaline, carbonate-rich waters dissolved lead concentrations are considered very likely to be
limited by either PbSO4 or lead hydroxycarbonate formation.
Cs is not expected to be solubility-limited.
Sr is quite soluble and it is considered that under repository conditions, the most likely solubility-
limiting phases would be Strontium strontianite (SrCO3) or celestite (SrSO4). It was assumed
conservatively that Sr would not be solubility-limited in the repository.
REFERENCES
[148] BETHKE, C.M., The Geochemist’s Workbench Release 6: GWB Essentials Guide: A User’s
Guide to Rxn, Act2, Tact, SpecE8, and Aqplot, Rockware, Golden Colorado (2006) 76pp.
[149] CHEN, Y., et al., Dissolved concentration limits of radioactive elements, Sandia Report ANL-
WIS-MD-000010 REV 02 (2003).
[150] BERNER, U., Evolution of porewater chemistry during degradation of cement in a radioactive
waste repository environment, Waste Management, 12, (1992) 201-219.
[151] BAES, C.F. Jr., MESMER, R.E., The Hydrolysis of Cations (Wiley, J., Reprint Edition), New
York, NY (1976) 490pp.
244
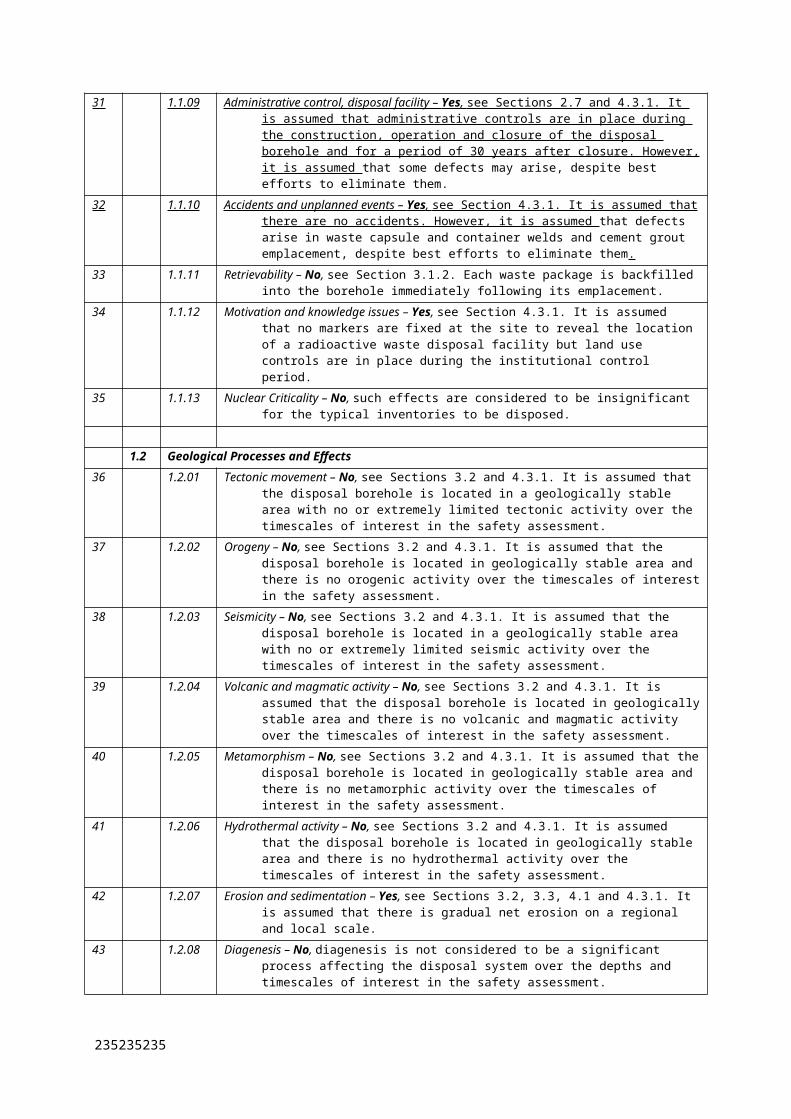
245245245
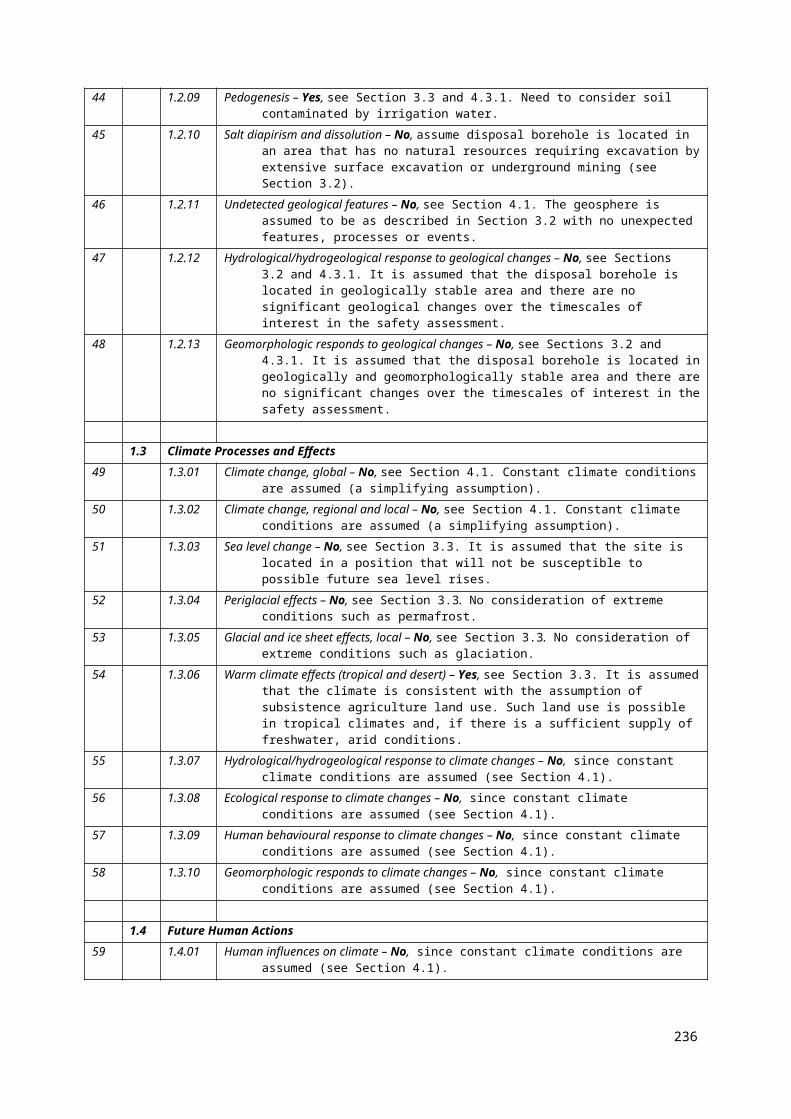
TABLE 53. SUMMARY OF THE SOLUBILITY CONDITIONS FOR THE GSARadionuclide Physical/Chemical Form
in Disused SourceImportant natural minerals (not including phases within which the radionuclide might co-precipitate and not exhaustive)
Scope for solubility limitation in cement-buffered porewater (based on calculation results in Tables J.2 and J.4)
Scope for solubility limitation in groundwater (based on calculation results in Tables J.3 and J.5)
H-3 Often tritium gas or tritiated water
If located in tritiated water may occur within any hydrated mineral phase
No No
Co-60 Metallic form in thin discs or small cylindrical pellets. Very low solubility.
Sulphides and arsenides, including linnaeite (Co3S4) cobaltite, (CoAsS), and smaltite (CoAs2)
No No
Ni-63 Solid, electrical deposition on metal foil
Tends to occur as an alloy with native Fe (notably in meteorites)
Ni in waste form would be very soluble in all waters.
Ni could be solubility-limited by bunsenite (NiO) or possibly metastable Ni(OH)2 in all waters.
Ni in waste form would be very soluble in all waters.
In waters 5 and 6, Ni could be solubility-limited by a sulphide phase such as polydymite or possibly vaseite. Alternatively, limitation could be by metastable bunsenite (NiO) or Ni(OH)2 .
Kr-85 Gas None No No
Sr-90 Oxide or titanate form.
Often silver plated for medical applications.
Ceramic or glass bead or rolled silver foil for other applications
The main minerals are strontianite (SrCO3) and celestite (SrSO4)
SrO in waste form likely to be very soluble in all waters.
Strontianite could be a potential solubility-limiting phase in all waters.
SrO in waste form likely to be very soluble in all waters. No information concerning solubility of titanite, but unlikely to be a true equilibrium solubility control
Strontianite could be a potential solubility-limiting phase in waters 5 and 6.
Cs-137 Only used as a salt (often caesium chloride).
Sometimes ceramic form for weak sources (very low
Pollucite (2Cs2O.2Al2O3.9SiO2.H2O), occurs in Rhodizite (a borate) and in some K-ores
No No
246
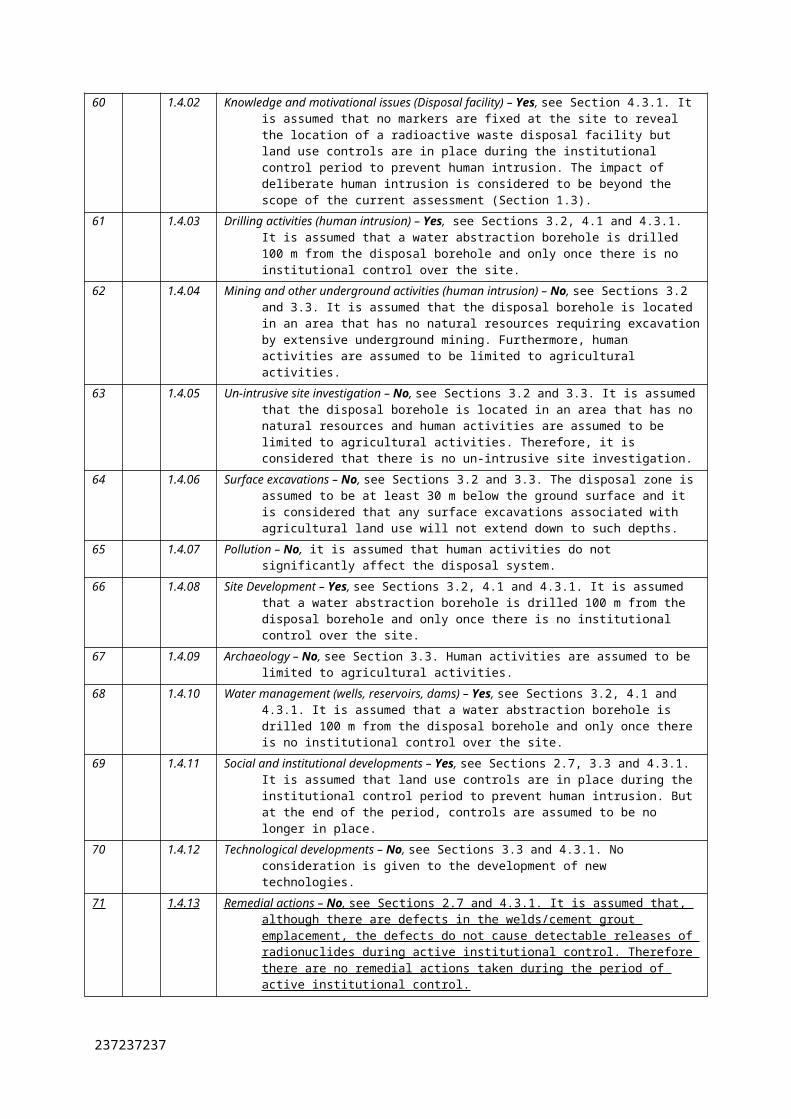
Radionuclide Physical/Chemical Form in Disused Source
Important natural minerals (not including phases within which the radionuclide might co-precipitate and not exhaustive)
Scope for solubility limitation in cement-buffered porewater (based on calculation results in Tables J.2 and J.4)
Scope for solubility limitation in groundwater (based on calculation results in Tables J.3 and J.5)
solubility)
Pb-210 Solid, mainly carbonate, and sulphate
Occurs in a wide range of sulphides, oxides and sulphates, the most common of which are galena (PbS), anglesite (PbSO4), minim (Pb3O4) and cerussite (PbCO3)
The Pb-carbonate and sulphate in the waste form is likely to be very soluble in all waters.
In water C1 there could potentially be a solubility control by minium (Pb3O4) or possibly by metastable Pb4SO7. In waters C5 and C6 there could potentially be a solubility control by Pb4SO7. However, in all waters Pb4SO7 is moderately soluble.
Dissolution of the waste form could be solubility-limited; in water 1, release could be controlled by solubility of PbSO4; in waters 5 and 6 release could be controlled by solubility of PbCO3.
Ra-226 (+ Rn gas) Very reactive alkaline earth metal in form of salts (e.g. bromides, chlorides, sulphates or carbonates). All soluble
Ra occurs in ores of U (represented by UO2)
The solubility of Ra in the waste form is likely to be very high in all waters; in all cases the solubilitiy of RaCl2.2H2O is very high.
RaSO4 could be a solubility-controlling phase in all waters.
The solubility of Ra in the waste form is likely to be very high in all waters; in all cases the solubilitiy of RaCl2.2H2O is very high.
There is a possibility for solubility control by RaSO4 in all the waters.
Pu-238 (+ Rn gas) Used in RTGs, and for neutron generators and calibration. Sources typically have Pu oxide in ceramic.
None – occurs only in extremely small abundances in some uranium ores
The waste form could potentially be poorly soluble; PuO2 could be a solubility-controlling phase in all waters.
The waste form could potentially be poorly soluble; PuO2 could be a solubility-controlling phase in all waters.
Pu-239
Am-241 Chemical characteristics similar to rare earth metals. Americium oxides normally used.
For neutron sources, fine americium oxide powder used mixed with beryllium powder. Often in pellet form.
Sometimes in sintered form.
None In water C1 AmO2 in the waste form could be a solubility-limiting phase. However, AmO2 is very soluble in waters C5 and C6.
Am(OH)3 could be a solubility-limiting phase in all waters.
Dissolution of the waste form is unlikely to be solubility-limited; in all waters the solubility of AmO2 is very high.
AmOHCO3 could be a solubility-controlling phase in waters 5 and 6.
247247247
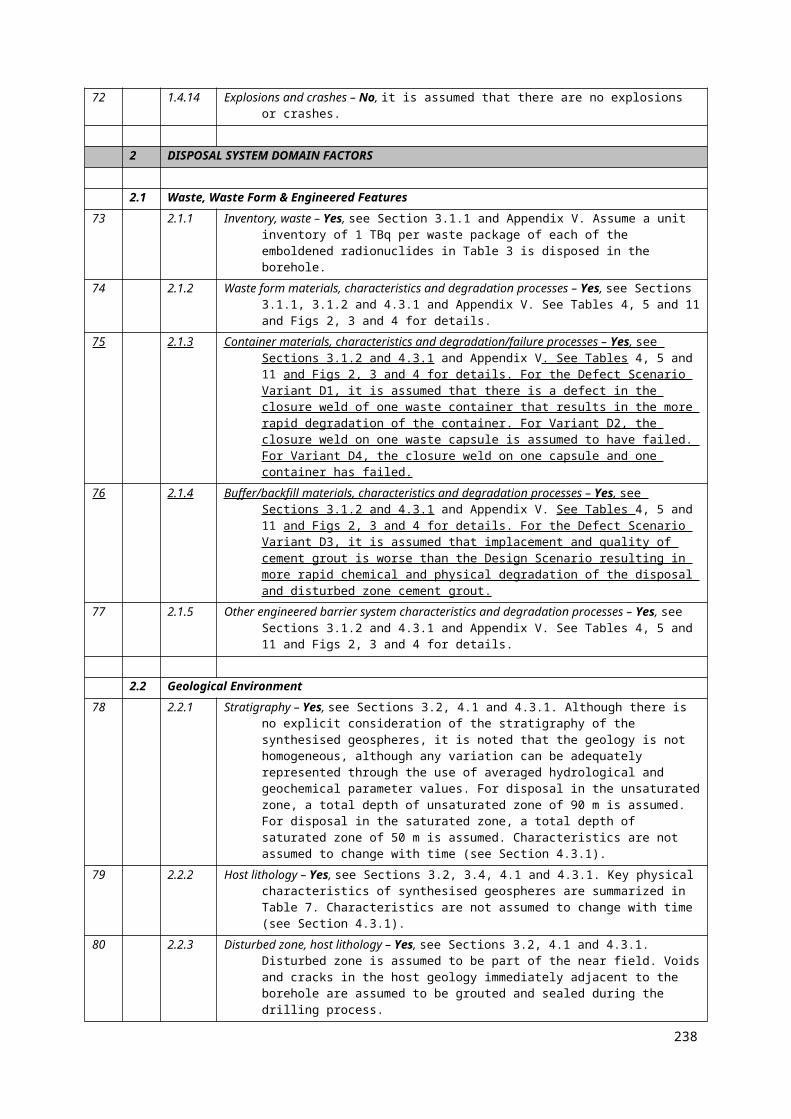
248
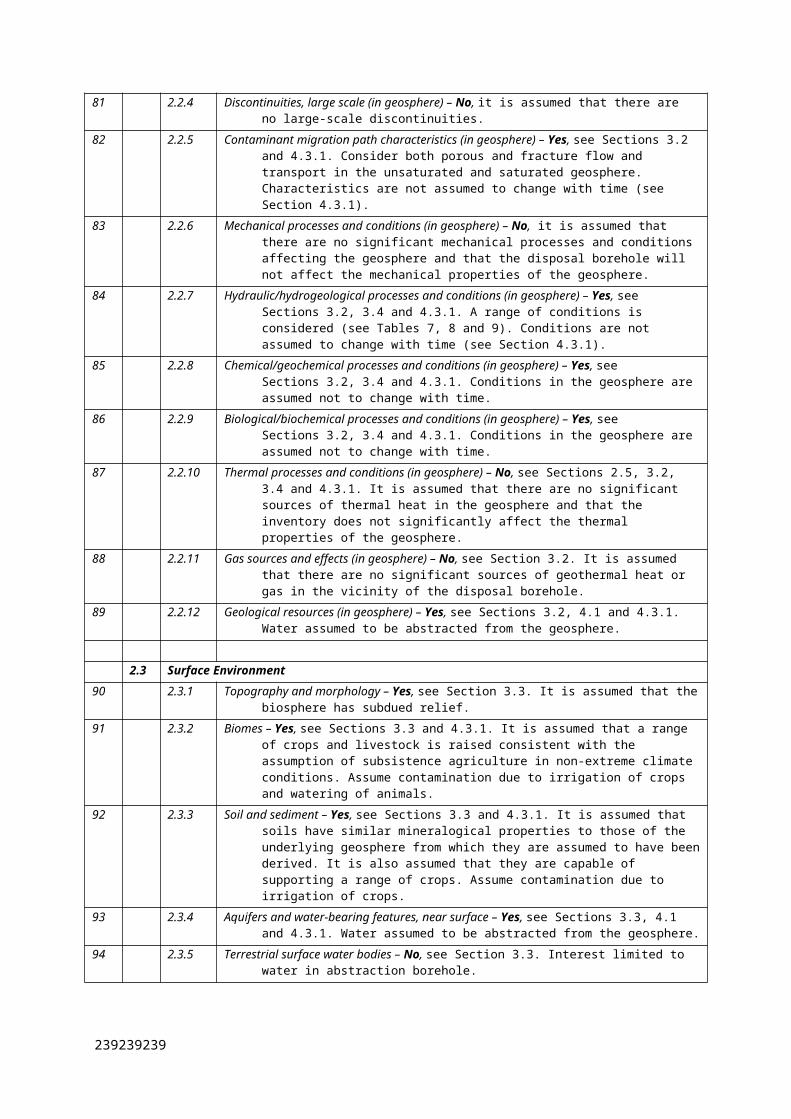
TABLE 54. ESTIMATED SOLUBILITIES FOR MINERAL PHASES THAT ARE CONSIDERED TO REPRESENT THE SOLIDS OCCURRING WITHIN THE WASTE FORMS WHEN THE WASTE FORMS ARE CONTACTED BY MODELLED CEMENT POREWATER
Radionuclide Physical/Chemical FormPotential Solubility-controlling phase in waste form
Cement Water C1 Cement Water C5 Cement Water C6
Solubility (mg/kg) Solubility (mg/kg) Solubility (mg/kg)
H-3 Often tritium gas or tritiated water None n.a. n.a. n.a.
Co-60 Metallic form in thin discs or small cylindrical pellets. Very low solubility.
Co metal Not calculated; very high1 Not calculated; very high1 Not calculated; very high1
Ni-63 Solid, electrical deposition on metal foil Ni metal Not calculated; very high1 Not calculated; very high1 Not calculated; very high1
Kr-85 Gas None n.a. n.a. n.a.
Sr-90 Oxide or titanate form.
Often silver plated for medical applications.
Ceramic or glass bead or rolled silver foil for other applications
SrO Not calculated; very high1 Not calculated; very high1 Not calculated; very high1
Cs-137 Only used as a salt (often caesium chloride).
Sometimes ceramic form for weak sources (very low solubility)
Cs2NaAmCl6 (only chloride in the database)
Not calculated; at logK for the dissolution reaction is 11.7089 (i.e. the chloride is very soluble)
Not calculated; at logK for the dissolution reaction is 11.7089 (i.e. the chloride is very soluble)
Not calculated; at logK for the dissolution reaction is 11.7089 (i.e. the chloride is very soluble)
Pb-210 Solid, mainly carbonate, and sulphateCerussite (PbCO3) Not calculated; very high1 Not calculated; very high1 Not calculated; very high1
Anglesite (PbSO4) Not calculated; very high1 Not calculated; very high1 Not calculated; very high1
Ra-226 (+ Rn gas) Very reactive alkaline earth metal in form of salts (e.g. bromides, chlorides, sulphates or carbonates). All soluble
RaCl2.2H2O Not calculated; very high1 Not calculated; very high1 Not calculated; very high1
Pu-238 (+ Rn gas)Used in RTGs, and for neutron
generators and calibration. Sources typically have Pu oxide in ceramic.
PuO2 2.51e-010 3.198e-012 2.98e-012
Pu-239 PuO2 2.51e-010 3.198e-012 2.98e-012
Pu-238 (+ Rn gas) PuO2(OH)2 Not calculated; very high1 Not calculated; very high1 Not calculated; very high1
Pu-239 PuO2(OH)2 Not calculated; very high1 Not calculated; very high1 Not calculated; very high1
249249249
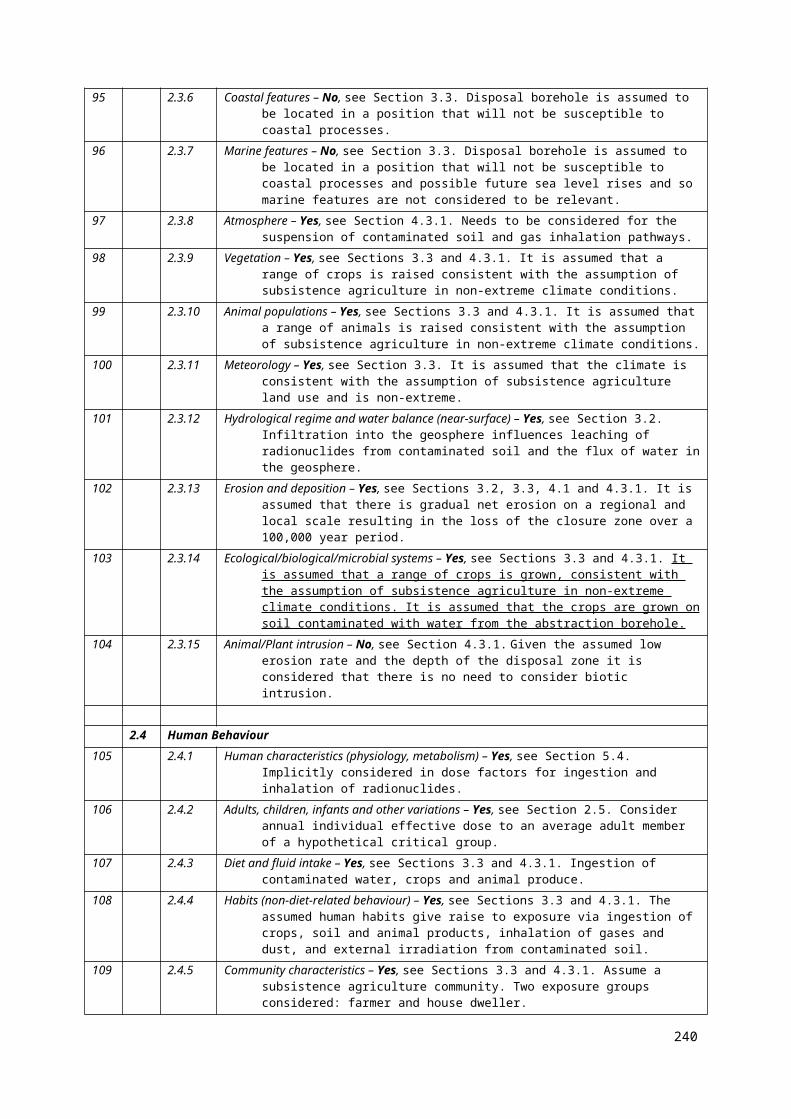
Radionuclide Physical/Chemical FormPotential Solubility-controlling phase in waste form
Cement Water C1 Cement Water C5 Cement Water C6
Solubility (mg/kg) Solubility (mg/kg) Solubility (mg/kg)
Am-241 Chemical characteristics similar to rare earth metals. Americium oxides normally used.
For neutron sources, fine americium oxide powder used mixed with beryllium powder. Often in pellet form.
Sometimes in sintered form.
AmO2 8.15e-007 Not calculated; very high1 Not calculated; very high1
250
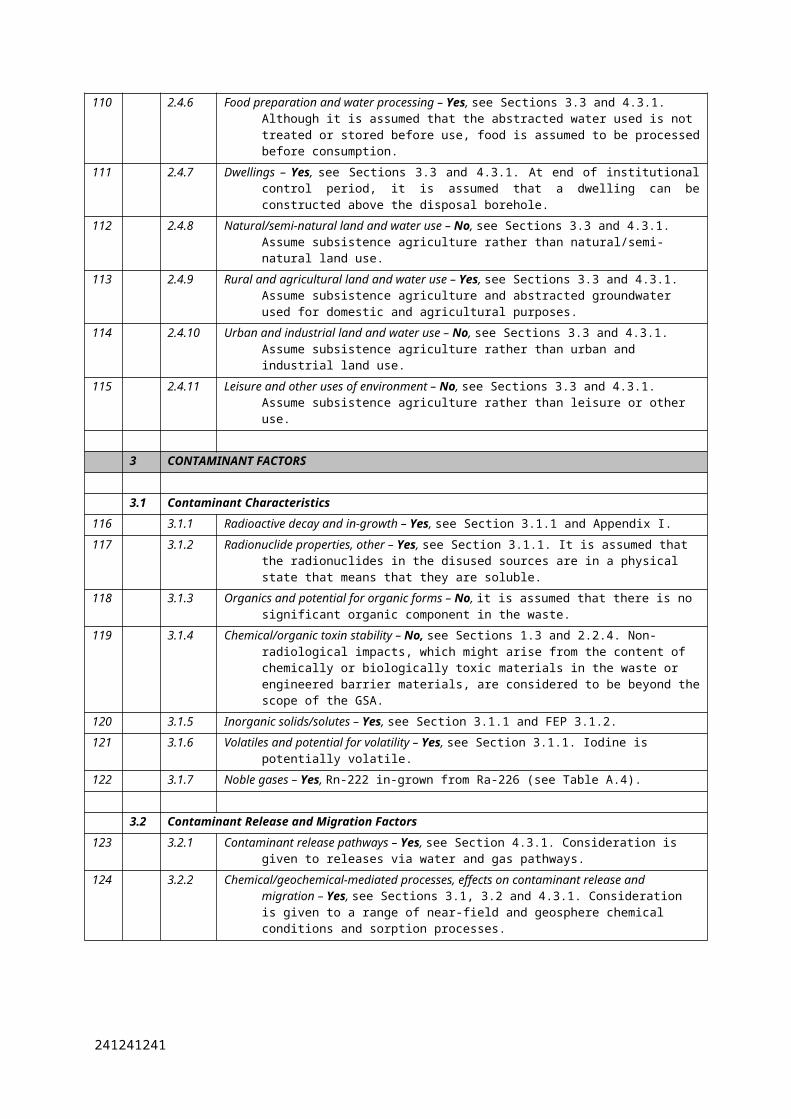
TABLE 55. ESTIMATED SOLUBILITIES FOR MINERAL PHASES THAT ARE CONSIDERED TO REPRESENT THE SOLIDS OCCURRING WITHIN THE WASTE FORMS, WHEN THE WASTE FORMS ARE CONTACTED BY GROUNDWATER
Radionuclide Physical/Chemical FormPotential Solubility-controlling phase in waste form
Water No. 1 Water No. 5 Water No. 6
Solubility (mg/kg) Solubility (mg/kg) Solubility (mg/kg)
H-3 Often tritium gas or tritiated water None n.a. n.a. n.a.
Co-60 Metallic form in thin discs or small cylindrical pellets. Very low solubility.
Co metal Not calculated; at 25ºC, logK for the oxidation reaction is 52.530 7 (i.e. the metal is very unstable)
Not calculated; at 25ºC, logK for the oxidation reaction is 52.530 7 (i.e. the metal is very unstable)
Not calculated; at 25ºC, logK for the oxidation reaction is 52.530 7 (i.e. the metal is very unstable)
Ni-63 Solid, electrical deposition on metal foil Ni metal Not calculated; at 25ºC, the log K for the oxidation reaction is 50.991 4 (i.e. the metal is very unstable)
Not calculated; at 25ºC, the log K for the oxidation reaction is 50.991 4 (i.e. the metal is very unstable)
2.64e+003
Kr-85 Gas None n.a. n.a. n.a.
Sr-90 Oxide or titanate form.
Often silver plated for medical applications.
Ceramic or glass bead or rolled silver foil for other applications
SrO Not calculated; at 25ºC, logK for the dissolution reaction is 41.891 6 (i.e. the oxide is very unstable)
Not calculated; at 25ºC, logK for the dissolution reaction is 41.891 6 (i.e. the oxide is very unstable)
Not calculated; at 25ºC, logK for the dissolution reaction is 41.891 6 (i.e. the oxide is very unstable)
Cs-137 Only used as a salt (often caesium chloride).
Sometimes ceramic form for weak sources (very low solubility)
Cs2NaAmCl6 (only chloride in the database)
Not calculated; at logK for the dissolution reaction is 11.708 9 (i.e. the chloride is very soluble)
Not calculated; at logK for the dissolution reaction is 11.708 9 (i.e. the chloride is very soluble)
Not calculated; at logK for the dissolution reaction is 11.708 9 (i.e. the chloride is very soluble)
Pb-210 Solid, mainly carbonate, and sulphateCerussite (PbCO3) Not calculated; very higha 0.0248 3 0.0312
Anglesite (PbSO4) 154.5 Not calculated; very highaa,b
Not calculated; very higha,d
Ra-226 (+ Rn gas) Very reactive alkaline earth metal in form of salts (e.g. bromides, chlorides, sulphates or
RaCl2.2H2O Not calculated; very higha Not calculated; very higha Not calculated; very higha
251251251
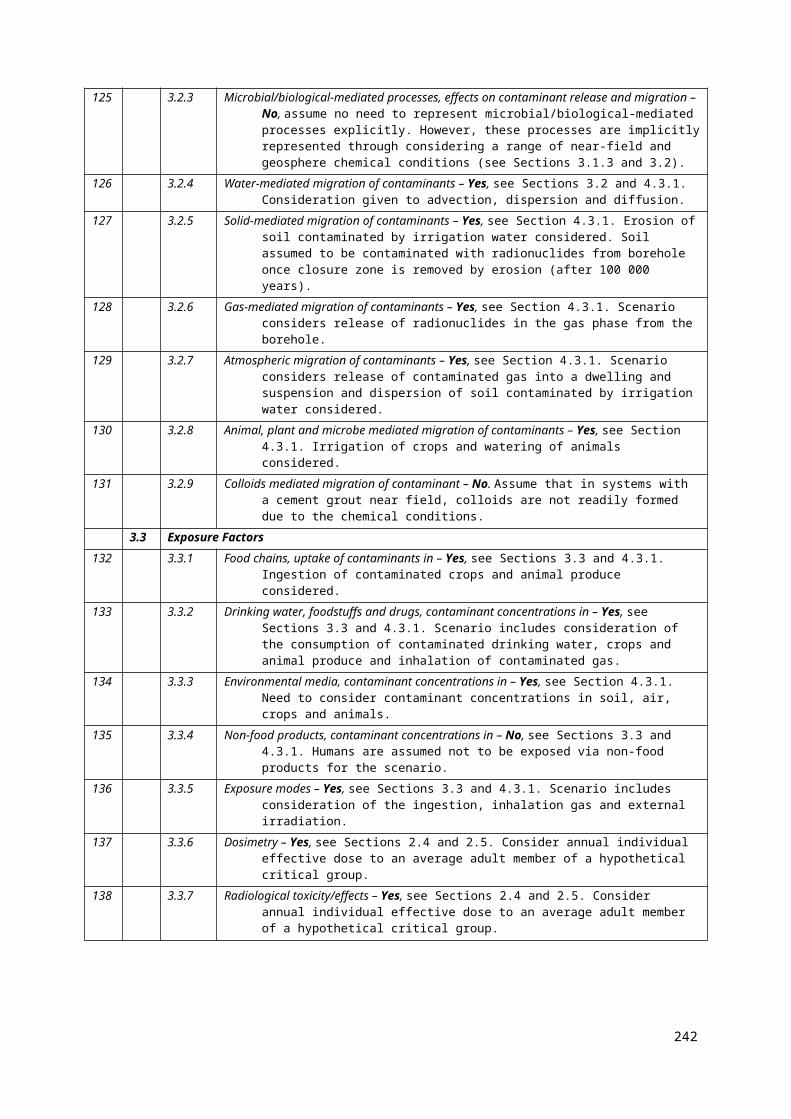
Radionuclide Physical/Chemical FormPotential Solubility-controlling phase in waste form
Water No. 1 Water No. 5 Water No. 6
Solubility (mg/kg) Solubility (mg/kg) Solubility (mg/kg)
carbonates). All soluble
Pu-238 (+ Rn gas)
Used in RTGs, and for neutron generators and calibration. Sources typically have Pu oxide in ceramic.
PuO2 0.000 253 6 3.254e-012 9.008e-011
Pu-239 PuO2 0.000 253 6 3.254e-012 9.008e-011
Pu-238 (+ Rn gas) PuO2(OH)2 9.858 Not calculated; very higha,c
Not calculated; very higha,c,e
Pu-239 PuO2(OH)2 9.858 Not calculated; very higha,c
Not calculated; very higha,c,e
Am-241 Chemical characteristics similar to rare earth metals. Americium oxides normally used.
For neutron sources, fine americium oxide powder used mixed with beryllium powder. Often in pellet form.
Sometimes in sintered form.
AmO2 Not calculated; very higha Not calculated; very higha Not calculated; very higha
Notes: a Here “very high” means that, when an attempt is made to calculate a solubility of the solubility-limiting phase, using Geochemist’s Workbench v. 6.0 and the thermodynamic
database “thermo.com.v8.r6+.dat”, unrealistically high concentrations are calculated. These concentrations are sufficiently high (ionic strength >1 molal) that the geochemical model
implemented in the code becomes inaccurate.
b Due to the chemical speciation of Pb being dominated by hydroxide species under the ambient pH conditions.
c Due to the chemical speciation of Pu being dominated by OH- species under the ambient pH conditions.
d Due to the chemical speciation of Pb being dominated by CO3 species under the ambient chemical conditions.
e Due to the chemical speciation of Pu being dominated by the Pu+++ species under the ambient conditions.
252

TABLE 56. SOLUBILITIES OF POTENTIAL SOLID RADIONUCLIDE-BEARING PHASES THAT WOULD BE STABLE IN THE MODELLED CEMENT POREWATERS
Radionuclide Physical/Chemical FormPotential Alternative Solubility-Controlling Phase
Cement Water C1 Cement Water C5 Cement Water C6
Solubility (mg/kg) Solubility (mg/kg) Solubility (mg/kg)
Ni Solid, electrical deposition on metal foil Ni(OH)2 0.131 0.131 0.155
Bunsenite (NiO) 0.069 22 0.069 4 0.080 7
Sr-90 Oxide or titanate form.
Often silver plated for medical applications.
Ceramic or glass bead or rolled silver foil for other applications
Strontianite (SrCO3) 4.61 4.71 12.76
Celestite (SrSO4) >1000 >250 365.4
Pb-210 Solid, mainly carbonate, and sulphateMinium (Pb3O4) 3.65 Not calculated; very higha Not calculated; very higha
Pb4SO7 538 287. 158.
Ra-226 (+ Rn gas) Very reactive alkaline earth metal in form of salts (e.g. bromides, chlorides, sulphates or carbonates). All soluble
RaSO4 1.27 0.358 0.012 69
Am-241 Chemical characteristics similar to rare earth metals. Americium oxides normally used.
For neutron sources, fine americium oxide powder used mixed with beryllium powder. Often in pellet form.
Sometimes in sintered form
AmOHCO3 3814 3815 3811.
Am(OH)3 8.843e-006 8.85e-006 8.840e-006
Notes: a Here “very high” means that, when an attempt is made to calculate a solubility of the solubility-limiting phase, using Geochemist’s Workbench v. 6.0 and the thermodynamic
database “thermo.com.v8.r6+.dat”, unrealistically high concentrations are calculated. These concentrations are sufficiently high (ionic strength >1 molal) that the geochemical model
implemented in the code becomes inaccurate.
??!b. The thermodynamic database used here (“thermo.com.v8.r6+.dat”) contains data for only three Be-bearing solids (Be metal, Be 13U and bromellite (BeO)). Of these, only
bromellite is likely to show low solubility. However, Ref. [3] notes that although the Nagra/PSI thermodynamic database does not contain thermodynamic data for beryllium, Ref. [4]
report data that implies that beryllium may form polynuclear complexes below pH c. 6 (mainly the trimer Be 3(OH)33+), and anionic hydroxides (Be(OH)3 –, Be(OH)4
2–) above pH ~
253253253
10. Reference [3] interpreted these data to mean that within these pH ranges Be solubility would be > 10 -3 mol/l (>10 mg/kg). However, Ref. [3] also concluded from the data in
Ref. [4] that in the pH range from about 7 -10 where solubility limitation by α-Be(OH)2(s) is possible, consistent with aqueous beryllium concentrations of <10 -6 mol/l (< 0.009
mg/kg).
254
TABLE 57. SOLUBILITIES OF SOLID PHASES THAT ARE NOT KNOWN TO OCCUR WITHIN THE WASTE FORMS, BUT WHICH WOULD BE STABLE IN THE
PRESENCE OF AT LEAST ONE OF THE THREE GROUNDWATERS CONSIDERED
Radionuclide Physical/Chemical FormPotential Alternative Solubility-Controlling Phase
Water No. 1 Water No. 5 Water No. 6
Solubility (mg/kg) Solubility (mg/kg) Solubility (mg/kg)
Ni-63 Solid, electrical deposition on metal foil
Ni(OH)2 Not calculated; very higha 5.24 182
Bunsenite (NiO) Not calculated; very higha 2.77 94.5
Polydymite (Ni3S4) Not calculated; very higha 1.26e-005 3.23e-016
Vaesite (NiS2) Not calculated; very higha 0.000160 2.72e-020
Sr-90 Oxide or titanate form.
Often silver plated for medical applications.
Ceramic or glass bead or rolled silver foil for other applications
Strontianite (SrCO3) Not calculated; very higha 0.06295 0.141
Celestite (SrSO4) Not calculated; very higha Not calculated; very higha Not calculated; very higha
Ra-226 (+ Rn gas) Very reactive alkaline earth metal in form of salts (e.g. bromides, chlorides, sulphates or carbonates). All soluble
RaSO4 0.30 0.1301 0.1643
Am-241 Chemical characteristics similar to rare earth metals. Americium oxides normally used.
For neutron sources, fine americium oxide powder used mixed with beryllium powder. Often in pellet form.
Sometimes in sintered form.
AmOHCO3 Not calculated; very higha 0.01250 0.1065
Notes: a Here “very high” means that, when an attempt is made to calculate a solubility of the solubility-limiting phase, using Geochemist’s Workbench v. 6.0 and the thermodynamic
database “thermo.com.v8.r6+.dat”, unrealistically high concentrations are calculated. These concentrations are sufficiently high (ionic strength >1 molal) that the geochemical model
implemented in the code becomes inaccurate.
b The thermodynamic database used here (“thermo.com.v8.r6+.dat”) contains data for only three Be-bearing solids (Be metal, Be13U and bromellite (BeO)). Of these, only
bromellite is likely to show low solubility. However, Ref. [3] notes that although the Nagra/PSI thermodynamic database does not contain thermodynamic data for beryllium, [4]
report data that implies that beryllium may form polynuclear complexes below pH c. 6 (mainly the trimer Be3(OH)33+), and anionic hydroxides (Be(OH)3 –, Be(OH)42–) above pH
255255255
~ 10. Reference [3] interpreted these data to mean that within these pH ranges Be solubility would be > 10-3 mol/l (>10 mg/kg). However, Ref. [3] also concluded from the data in
Ref. [4] that in the pH range from about 7 -10 where solubility limitation by α-Be(OH)2(s) is possible, consistent with aqueous beryllium concentrations of <10-6 mol/l (< 0.009
mg/kg).
256
Appendix XIASSESSMENT MODEL
XI.1. DESIGN SCENARIO
It is important to note that the release and migration processes described in Section XI.1.1 are assumed
to occur only once the capsule containing the source container has started to fail (see Section 4).
Details concerning the mathematical model used to represent the failure of capsule and other near-field
engineered barriers are given in Appendix XI.3.
The processes identified in leading and off diagonal elements in the Interaction Matrices in Figs 7 and
8 are listed in Table 58. The associated equations are listed in Table 58 and discussed below.
XI.1.1. Release Processes
As discussed in Section 5.2.1, the radionuclides in the source container could be in a number of
different physical and chemical forms and release of radionuclides could occur on breaching of the
waste capsule due to the following mechanisms.
Instantaneous release of gas for radionuclides that are in gaseous form (H-3 and Kr-85) or
which have gas phase progeny (Rn-222 for Ra-226 and Pu-238). For calculation of doses to the
House Dweller Exposure Group via the inhalation of radioactive gases, the concentration of
radionuclides to which the house dweller is exposed via inhalation can be calculated as a linear
function of the amount of radionuclides in the disposal borehole (see Equation to Equation ).
Therefore, there is no need to represent explicitly the release of radionuclides in gaseous form
between different parts of the disposal system, and so inter-compartmental transfer rates need
not be specified.
Instantaneous dissolution of radionuclides that are in a form that would result in immediate release to
water once the capsule containing the source has failed (e.g. liquid, soluble solid, surface
contamination) (H-3, Ni-63, Sr-90, Cs-137, Pb-210, Ra-226 and Am-241).
257
TABLE 58. RELEASE AND MIGRATION PROCESSES AND ASSOCIATED EQUATIONS FOR THE
DESIGN SCENARIO
System Component
Process Equation/Comment
Near Field Dissolution Once water contacts the source, it is assumed that radionuclides in the source can be dissolved and transferred from the capsule containing the source into the surrounding containment barrier/disposal zone due to advection, dispersion and/or diffusion. Instantaneous dissolution congruent release models are considered depending on the chemical and physical form of the source.
Gas release Equation and Equation Sorption Equation ,
the following general formula: to Equation , Equation to Equation , Equation and Equation
Decay Equation 1Degradation See Appendix XI.3Advection Equation , Equation , Equation , and Equation Dispersion Implicitly represented through the discretisation of the geosphere into a series of
compartments and allowing compartment widths to increase perpendicular to groundwater flow
Diffusion Equation , Equation , Equation and Equation Groundwater flow Equation and Equation Percolation Set equal to the minimum of the infiltration rate of water through the unsaturated zone,
and the hydraulic conductivity of the disposal zone and containment barrierGas migration Equation and Equation
Geosphere Sorption the following general formula:, Equation , Equation , Equation , Equation and Equation
Decay Equation 1Advection Equation and Equation Dispersion Implicitly represented through the discretisation of the geosphere into a series of
compartments and allowing compartment widths to increase perpendicular to groundwater flow
Diffusion Equation , Equation , Equation and Equation Groundwater flow Equation Percolation Rate specified in Section 3.2.1Recharge Not explicitly represented. Implicitly represented via percolation and groundwater
transport.Abstraction Equation
Biosphere Excretion by humans
Not explicitly represented. Implicitly represented by modelling the abstraction of water from the geosphere from consumption by humans and assuming it is directed to the “elsewhere” compartment (Equation ).
Excretion by animals
Not explicitly represented. Implicitly represented by not modelling the loss of activity from the soil due to uptake by flora.
Bioturbation Not explicitly represented. Implicitly represented by assuming uniform concentration of radionuclides in the soil.
Ploughing Not explicitly represented. Implicitly represented by assuming uniform concentration of radionuclides in the soil.
Gas Dispersion Equation and Equation Decay Equation 1Precipitation Not explicitly represented. Implicitly represented via percolation in unsaturated zone
and groundwater flow in saturated zone.SorptionSuspension Equation Deposition onto
soilNot explicitly represented. Implicitly represented by not modelling the loss of activity
from the soil due to suspension.Deposition onto
floraEquation
Translocation Equation Root uptake Equation Erosion Equation Percolation Equation
258
System Component
Process Equation/Comment
Death and decay of crops
Not explicitly represented. Implicitly represented by not modelling the loss of activity from the soil due to uptake by crops.
Cultivation Considered by modelling the ingestion of crops by humans (Equation )Harvesting Considered by modelling the ingestion of crops by humans (Equation )Rearing Considered by modelling the ingestion of animals by humans (Equation )Food preparation
lossesEquation
Congruent release of radionuclides that are in a form that would result in slow release to water
(e.g. solid with low solublity) (Co-60, Pu-238 and Pu-239).
It is recognized that the instantaneous dissolution and congruent release mechanisms could, under
certain circumstances, be solubility limited (see Table 15 and Appendix X). However, no solubility
limitation is considered for the reference case calculations (a conservative assumption).
For the congruent release model, it is assumed that once the engineered barriers containing the sealed
source have failed, the source will begin to corrode/dissolve and radionuclides become available for
release. The fraction of the sealed source inventory released in any time period is equal to the amount
which becomes available divided by the inventory remaining in the source. For short time periods this
simplifies to the rate of change of availability with time divided by the amount which remains
unavailable.
It is assumed that the source is a sphere of material whose radius decreases with time as it dissolves /
corrodes. Ignoring decay (since this will automatically be calculated by AMBER), the amount
available at a time t, is therefore equal to:
Equation 13
where I is the radionuclide inventory (Bq), r is the initial radius of the source (m), Cr is the corrosion /
dissolution rate (m y-1).
Cancelling terms and expanding gives:
Equation 14
259259259
I×(43
πr3−43
π (r−C r t )3
43
πr 3 )
I×( r 3
r 3−[ r3
r3 −3 r2 C r t
r3 +3 rCr
2 t2
r3 −C r
3 t 3
r3 ])

Therefore the amount available at time t equals:
Equation 15
Differentiating with respect to time gives the rate of change of the amount available with time:
Equation 16
K.1.2 Liquid Migration Processes
XI.1.1.1. Advective and Dispersive Release – Disposal in the Unsaturated Zone
The advective and dispersive transfer rate of radionuclides released from the capsule containing the
source due to percolation of water through the near field (lUnsatLeach, in y-1) is given by:
Equation 17
λUnsatLeach=qPERC f
Lc ϑ wc Rc
where qPERC is the annual percolation rate through the capsule compartment (i.e. the compartment
representing the capsule that contains the source) (m y -1) (equal to the minimum of the infiltration rate
of water through the unsaturated zone, and the hydraulic conductivity of the disposal zone and
containment barrier), f is the fraction of the waste that is available for release (unitless) (given by
Equation , Equation and Equation ), Lc is the length of the capsule compartment in the direction of
water flow (m), Jwc is the water-filled porosity of the capsule compartment (unitless), and Rc is the
element dependent retardation of the capsule compartment (unitless).
Jwc is calculated using the following general formula:
Equation 18
ϑ w = ε θ
260
I×( 3 r2 C r t
r3 −3 rCr
2 t 2
r3 +C r
3 t3
r3 )
I×( 3 r2 C r
r3 −6 rCr
2 t
r3 +3 Cr
3 t2
r 3 )
where ε is the degree of saturation (unitless) in the compartment and θ is the total porosity of the
compartment (unitless). For the purposes of the GSA, it is assumed that all the water-filled porosity
contributes to flow and so total porosity and effective porosity have the same values.
Rc is calculated using the following general formula:
Equation 19
R = 1 + ρ Kdϑw
where r is the dry bulk density of the compartment (kg m-3) and Kd is the sorption coefficient of the
element in the compartment (m3 kg–1).
r is calculated using the following general formula:
Equation 20
ρ = ρg (1 − θ )
where rg is the grain density of the compartment (kg m-3).
XI.1.1.2. Advective and Dispersive Release - Disposal in the Saturated Zone
The advective transfer rate from the release of radionuclides from the capsule containing the source
due to the flow of groundwater through the near field (lSatLeach,, in y-1) is given by:
Equation 21
λSatLeach=qc f
ϑwc Lc Rc
where qc is the Darcy velocity of the groundwater through the capsule compartment (m y -1), Jwc is the
water-filled porosity of the capsule compartment (unitless), Lc is the length of capsule compartment in
the direction of groundwater flow (m), and Rc (unitless) is the retardation factor in the capsule
compartment for the radionuclide.
qc is calculated by:
Equation 22
qc=−Kc∂ H∂ x
261261261
where Kc (m y-1) is the hydraulic conductivity of the capsule compartment and ¶H/¶x is the hydraulic
gradient (unitless).
The dispersion of radionuclides in the direction of groundwater movement (longitudinal dispersion) is
not represented explicitly as a mathematical model. This is because when a flow path is divided into a
number of equally sized compartments in the direction of groundwater flow, the mathematical
representation as a series of well-mixed compartments introduces dispersion. The effective Peclet
number (a measure of dispersion) is twice the number of compartments in the flow path (see
discussion in Appendix II of [XI.1]). Where the compartments are not of the same size, the effective
Peclet number is dominated by the largest compartment.
XI.1.1.3. Diffusive Release – Disposal in the Unsaturated and Saturated Zones
The diffusive release from the capsule compartment (lDiffRelF,, in y-1) is given by:
Equation 23
λDiffR elF =Adiff f DEffc
Rc V c Δc ϑ wc
where Adiff (m2) is the cross-sectional area relevant to the diffusive release from the capsule, f is the
fraction of the waste that is available for release, DEffc (m2 y-1) is the effective diffusion coefficient for
the capsule compartment, Rc (unitless) is the retardation factor in the capsule compartment for the
radionuclide, Vc (m3) is the volume of the capsule compartment, Dc (m) is a representative diffusion
length between the capsule compartment and the adjacent compartment, generally taken to be the
distance between the mid-points of the compartments in the direction of the diffusive flux, and Jwc is
the water-filled porosity of the capsule compartment.
In addition to this ‘forward’ diffusive transfer rate, there is a need to represent a corresponding
‘backward’ diffusive transfer rate in the reverse direction from the compartment adjacent to the
capsule compartment (lDiffRelB,, in y-1). This transfer rate is given by:
Equation 24
λDiffR elB =Adiff f DEffA
RA V A Δc ϑ wA
where DEffA (m2 y-1) is the effective diffusion coefficient for the compartment adjacent to the capsule
compartment, RA (unitless) is the retardation factor for the radionuclide in the compartment adjacent to
the capsule compartment, VA (m3) is the volume of the compartment adjacent to the capsule
compartment, Dc (m) is a representative diffusion length between the adjacent compartment and the
capsule compartment, generally taken to be the distance between the mid-points of the compartments
262
in the direction of the diffusive flux, and JwA is the water-filled porosity of the compartment adjacent
to the capsule compartment.
XI.1.1.4. Advective and Dispersive Transport – Disposal in the Unsaturated Zone
The transfer rate of contaminated water percolating (due to advection and dispersion) through the
unsaturated near field, unsaturated geosphere and soil (lPERC, in y-1) is given by:
Equation 25
λPERC=qPERC
L ϑ w R
where qPERC is the annual percolation rate through the compartment (m y -1), L is the length of the
compartment in the direction of water flow (m), Jw is the water-filled porosity of the compartment
(unitless), and R is the element dependent retardation of the compartment (unitless) (given by
Equation XI.7). For flow in a fracture it is assumed that there is no retardation, and so R is unity
XI.1.1.5. Advective and Dispersive Transport in the Saturated Zone
For transport through the saturated zone, the advective transfer rate (lA, in y-1) is given by:
Equation 26
λ A=q
ϑw L R
where q is the Darcy velocity of the groundwater in the compartment (m y -1), Jw is the water-filled
porosity of the compartment (unitless), L is the length of the compartment in the direction of water
flow, and R is the element dependent retardation of the compartment (unitless).
q is given by:
Equation 27
q=−K ∂H∂ x
where K (m y-1) is the hydraulic conductivity of the compartment and ¶H/¶x is the hydraulic gradient
(unitless).
As discussed above, the dispersion of radionuclides in the direction of groundwater movement
(longitudinal dispersion) is implicitly represented through the discretisation of the saturated zone into
a series of compartments. Contaminant dispersion at right angles to the direction of groundwater
movement in the saturated medium (transverse dispersion) is not represented explicitly as a process
263263263
because the compartment dimensions can be defined to represent the increase in plume dimensions
due to lateral spreading.
XI.1.1.6. Diffusive Transport – Disposal in the Unsaturated and Saturated Zones
The ‘forward’ diffusive transfer rate (lDiffD, in y-1) is given by:
Equation 28
λDiffD =AU DEffU
RU V U ΔU ϑ wU
where AU (m2) is the cross-sectional area relevant to the diffusive transfer from the upstream
compartment, DEffU (m2 y-1) is the effective diffusion coefficient for the upstream compartment, RU
(unitless) is the retardation factor in the upstream compartment for the radionuclide, VU (m3) is the
volume of the upstream compartment, DU (m) is a representative diffusion length between the
upstream and downstream compartments, generally taken to be the distance between the mid-points of
the compartments in the direction of the diffusive flux, and JwU is the water-filled porosity of the
upstream compartment.
In addition to this ‘forward’ diffusive transfer rate, there is a need to represent a corresponding
‘backward’ diffusive transfer rate in the reverse direction (lDiffU,, in y-1). This transfer rate is given by:
Equation 29
λDiffU =AU DEffD
RD V D ΔU ϑ wD
where AU (m2) is the cross-sectional area relevant to the transport, DEffD (m2 y-1) is the effective
diffusion coefficient for the downstream compartment, RD (unitless) is the retardation factor for the
radionuclide in the downstream compartment, VD (m3) is the volume of the downstream compartment,
DU (m) is a representative diffusion length between the upstream and downstream compartments,
generally taken to be the distance between the mid-points of the compartments in the direction of the
diffusive flux, and JwD is the water-filled porosity of the downstream compartment.
The diffusive transfer rate from a fractured compartment into a matrix compartment (lrm, in y-1) is
given by:
Equation 30
264
λrm =2 a DEffm
ϑwf δ
where a is the flow wetted surface area per unit volume of rock (m2 m-3), ϑ
wf is the water-filled
fracture porosity (unitless), DEffm is the effective diffusion coefficient of the matrix compartment
(m2 y-1), and d is the depth of the matrix compartment (m).
The reverse transfer rate from a matrix compartment back to the fracture (lmr, in y-1) is given by:
Equation 31
λmr =2 DEffm
Rm δ 2ϑwm
where Rm is the retardation coefficient of the radionuclide in the matrix, and Jwm is the water-filled
matrix porosity (unitless).
XI.1.1.7. Water Abstraction
The transfer rate of radionuclides in groundwater abstracted from the geosphere to soil due to
irrigation of crops (lirrig, in y-1) is given by:
Equation 32
λ irrig =Dil V irrig
ϑ ww V w Rw
where Dil is the fraction of the water demand supplied by contaminated water, Virrig is the volume of
irrigation water that reaches the soil (m3 y-1), Jww is the water-filled porosity of the compartment from
which the water is abstracted (unitless), Vw is the volume of the compartment from which the water is
abstracted (m3), Rw is the retardation coefficient (unitless) of the compartment from which the water is
abstracted.
For this abstraction, it is necessary to consider only the volume of irrigation water reaching the soil
since it represents the transfer of radionuclides from the geosphere to the soil (rather than to the crops).
Some of the water abstracted from the geosphere for irrigation purposes will be intercepted by the
crops and will not reach the soil since it is either taken up directly into the crop or evaporated from the
crop surface. This water is accounted for in the other water abstraction considered below.
The transfer rate of radionuclides due to abstraction of water for watering of animals and domestic
purposes (lother, in y-1) is given by:
Equation 33
265265265
λother =Dil V other
ϑww V w Rw
where Dil is the fraction of the water demand supplied by contaminated water, Vother is the volume of
water abstracted for watering of animals and domestic purposes (includes the volume of irrigation
water not reaching the soil due to interception by crops) (m3 y-1), Jww is the water filled porosity of the
compartment from which the water is abstracted (unitless), Vw is the volume of the compartment from
which the water is abstracted (m3), and Rw is the retardation coefficient (unitless) of the compartment
from which the water is abstracted.
XI.1.1.8. Erosion
The transfer rate of radionuclides by erosion of a compartment (λEROS, in y-1) is given by:
Equation 34
λEROS=dEROS
D
where dEROS is the erosion rate for the compartment (m y-1), and D is the depth of the compartment
from which erosion takes place (m).
XI.1.1.9. Suspension
The suspension of dust above a soil compartment is modelled by using dust loading factors, where the
concentration of a radionuclide in the air above the soil, CAir (Bq m-3) is given by:
Equation 35
C Air= χ Dry(RSoil−1)
RSoilcDust
where χDry is the radionuclide concentration in the dry surface soil (Bq kg -1 dry weight soil), RSoil is the
retardation coefficient for soil compartment (unitless), cDust is the dust level in the air above the soil
compartment (kg m-3).
χDry is given by:
Equation 36
χ Dry=CSoil
ρSoil
where CSoil is the radionuclide concentration in the soil (Bq m-3) and rSoil is the dry bulk density of the
soil (kg m-3).
266
CSoil is given by:
Equation 37
CSoil=AmountSoil
V Soil
where AmountSoil is the amount of the radionuclide in the soil (Bq) and VSoil is the volume of the
compartment representing the soil (m3).
XI.1.2. Gas Migration Processes
For calculation of doses to the House Dweller Exposure Group via the inhalation of radioactive gases,
the concentration of radionuclides to which the house dweller is exposed via inhalation can be
calculated as a linear function of the amount of radionuclides in the disposal borehole ( see Equation
to Equation ). Therefore, there is no need to represent explicitly the migration of radionuclides in
gaseous form between different parts of the disposal system, and so inter-compartmental transfer rates
need not be specified.
XI.1.3. Exposure Mechanisms
For the Design Scenario, it is assumed that exposure can only occur once the capsule has started to fail
and the institution control period has ended (Section 4.2). Details concerning the mathematical model
used to represent the failure of capsule and other near-field engineered barriers are given in Appendix
XI.3 and it is assumed that the institutional control period ends 30 years after site closure (Section
4.2).
The exposure mechanisms identified in the off diagonal elements in the Interaction Matrices in Figs 7
and 8 are listed in Table 59. Equations are given below that are used to calculate the annual effective
dose received by an average adult member of an exposure group from these exposure mechanisms.
TABLE 59. EXPOSURE MECHANISMS AND ASSOCIATED EQUATIONS
FOR THE DESIGN SCENARIO
Mechanism Medium Equation
Ingestion Groundwater Equation 38
Soil Equation 40
Crops Equation 42
Animals Equation 44
Inhalation Dust Equation 46
Gas Equation 47 and Equation 50
External Irradiation Soil Equation 54
267267267
XI.1.3.1. Ingestion of Groundwater
The annual individual effective dose to a human from the consumption of drinking water (DWat, in Sv
y-1) is given by:
Equation 38
DWat=CW IngWat DC Ing
where CW is the radionuclide concentration in the abstracted water (Bq m-3), IngWat is the individual
ingestion rate of water (m3 y-1), and DCIng is the dose coefficient for ingestion (Sv Bq-1).
CW is given by:
Equation 39
CW =Dil Amountw
ϑ w V w Rw
where Dil is the contribution of the water from the abstraction borehole to the total water ingested,
Amountw is the amount of the radionuclide in the compartment from which the water is abstracted
(Bq), Jw is the water-filled porosity of the compartment (unitless), Vw is the volume of the
compartment from which the water is abstracted (m3), and Rw is the retardation coefficient of the
compartment from which the water is abstracted (unitless).
XI.1.3.2. Ingestion of Soil
Soil can be inadvertently ingested by humans. The annual individual dose to a human from the
ingestion of soil (DSed, in Sv y-1) is given by:
Equation 40
DSed= χWet IngSed OOut DC Ing
where χWet is the radionuclide concentration in the soil (Bq kg -1 wet weight), IngSed is the individual
inadvertent ingestion rate of soil (kg wet weight h-1), OOut is the individual occupancy on the soil (h y-1),
and DCIng is the dose coefficient for ingestion (Sv Bq-1).
χWet is given by:
Equation 41
268
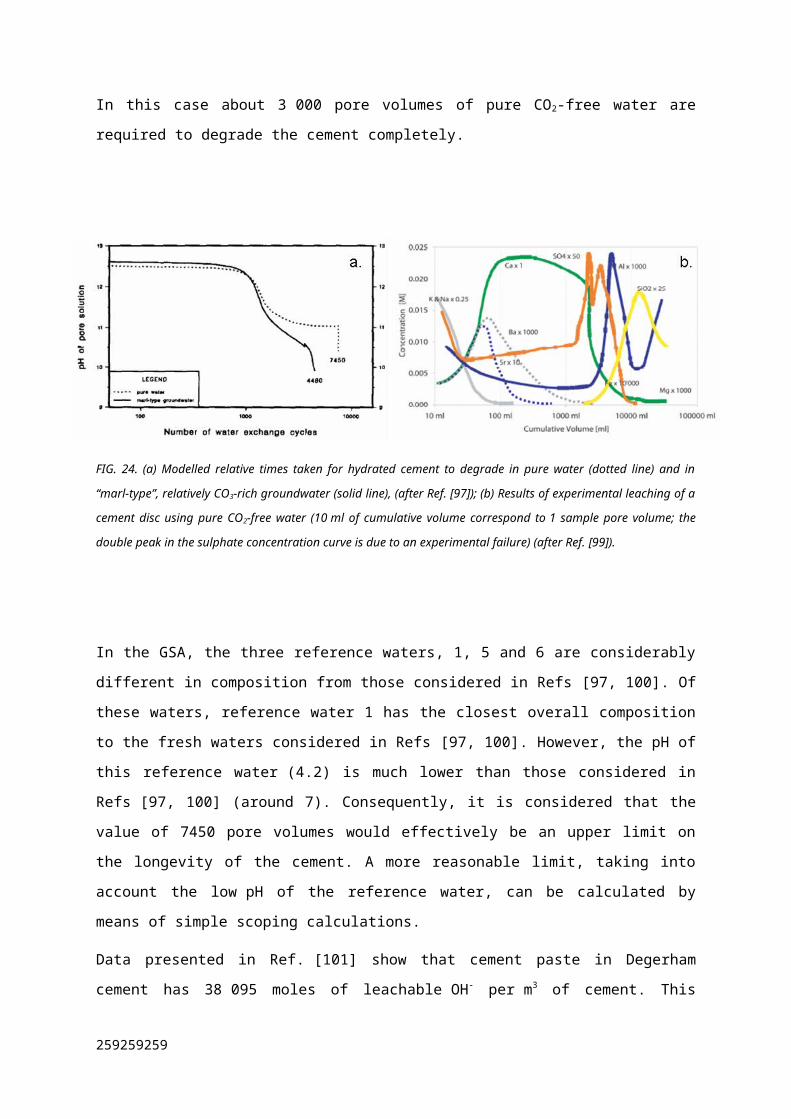
χWet=CSoil
ρSoil+ϑ wSoil ρWat
where Csoil is the radionuclide concentration in the soil (Bq m-3), rSoil is the dry bulk density of the soil
(kg m-3), JwSoil is the water filled porosity of the soil (unitless), and rWat the density of water (kg m-3).
XI.1.3.3. Ingestion of Crops
The annual individual effective dose to a human from the consumption of a crop, (DCrop, in Sv y-1), is
given by:
Equation 42
DCrop= χCrop IngCrop DC Ing
where χ
Crop is the radionuclide concentration in the crop (Bq kg-1 fresh weight of crop), IngCrop is the
individual ingestion rate of the crop (kg fresh weight y-1), and DCIng is the dose coefficient for
ingestion (Sv Bq-1).
The χcrop term is calculated using:
Equation 43
χCrop=(CFCrop+(1−f Pr ep)sCrop ) χDry+μCropd Irr CW
(1− f Pr ep )(1−f Trans ) e−T W crop+ f Trans
Y Crop
where CFcrop is the concentration factor for the crop (Bq kg -1 fresh weight of crop/Bq kg-1 (dry weight
of soil)), fPrep is the fraction of external contamination on the crop lost due to food processing
(unitless), sCrop is the soil contamination on the crop (kg dry weight soil kg -1 fresh weight of crop), χDry
is the radionuclide concentration in the dry surface soil (Bq kg-1 dry weight soil), crop is the
interception fraction for irrigation water on the crop (unitless), dIrr is the depth of irrigation water
applied to the crop (m y-1), CW is the radionuclide concentration in the abstracted water (Bq m-3), fTrans
is the fraction of activity transferred from external to internal plant surfaces (unitless), T is the interval
between irrigation and harvest (y), Wcrop is the removal rate of irrigation water from the crop by
weathering processes (weathering rate) (y-1), and YCrop is the yield of the crop (kg fresh weight of crop
m-2 y-1).
XI.1.3.4. Ingestion of Animals
The annual individual effective dose to a human from the consumption of animal produce (DAnm, in Sv
y-1) is given by:
Equation 44
269269269
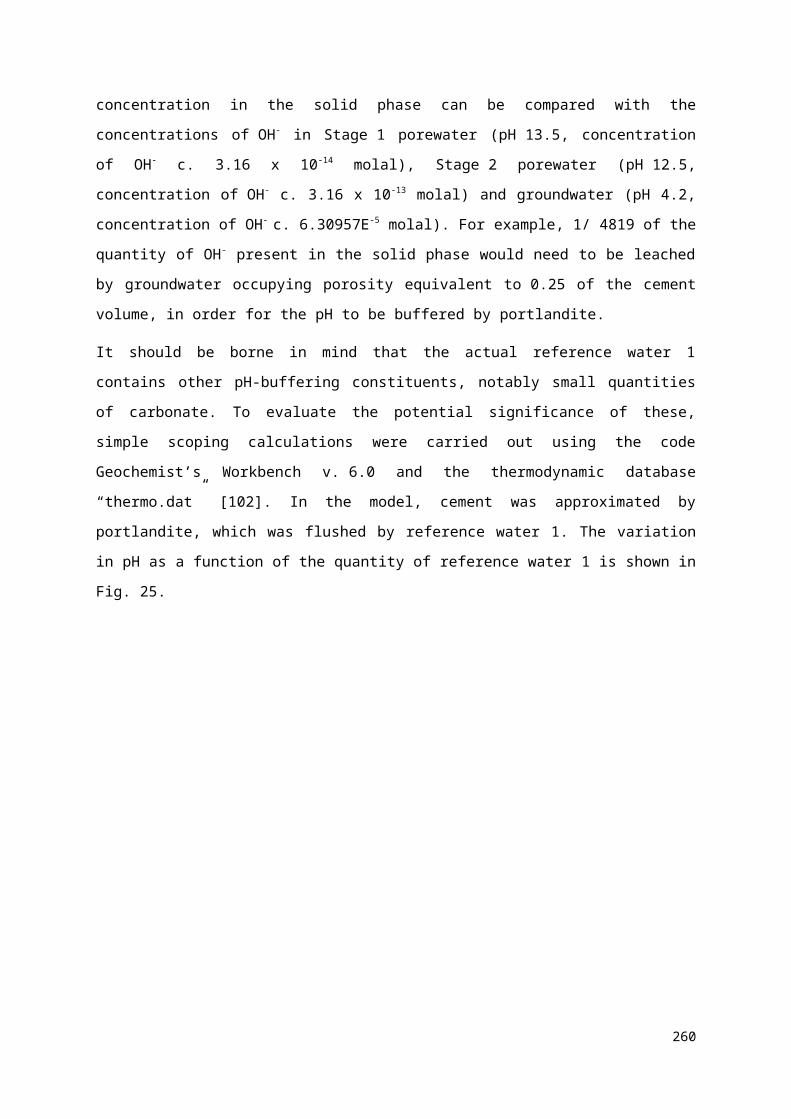
DAnm= χ Anm IngAnm DCIng
where χAnm is the radionuclide concentration in the animal product (Bq kg-1 fresh weight of product),
IngAnm is the individual consumption rate of the animal product (kg fresh weight of product y -1) and
DCIng is the dose coefficient for ingestion (Sv Bq-1).
The χAnm term is calculated using:
Equation 45
χ Anm=CF Anm CW IngAW
where CFAnm is the concentration factor for the animal product (d kg -1 fresh weight of product), Cw is
the radionuclide concentration in the water used for watering animals (Bq m -3) and IngAW is the
consumption rate of water by the animal (m3 d-1).
XI.1.3.5. Inhalation of Dust
The annual individual dose to a human from the inhalation of dust (DDust, in Sv y-1) is given by:
Equation 46
DDust=C Air OOut InhSed DC Inh
where CAir is the radionuclide concentration in the air above the soil (Bq m -3), InhSed is the breathing
rate of the human on the contaminated soil (m3 h-1), and DCInh is the dose coefficient for inhalation
(Sv Bq-1).
XI.1.3.6. Inhalation of Gases
The annual individual dose to a human due to inhalation of gases (other than Rn-222) (Dgas, in Sv y-1)
is given by:
Equation 47
where Dinhg is the dose coefficient for inhalation of the gaseous form of the radionuclide (Sv Bq-1),
BRgas is the breathing rate of the human in the house (m3 h-1), Ogas is the individual occupancy in the
house (h y-1), Cgas is the concentration of the gas in the house (Bq m-3).
Cgas is given by:
Equation 48
Cgas = Φg Ab / (lv Vh)
270
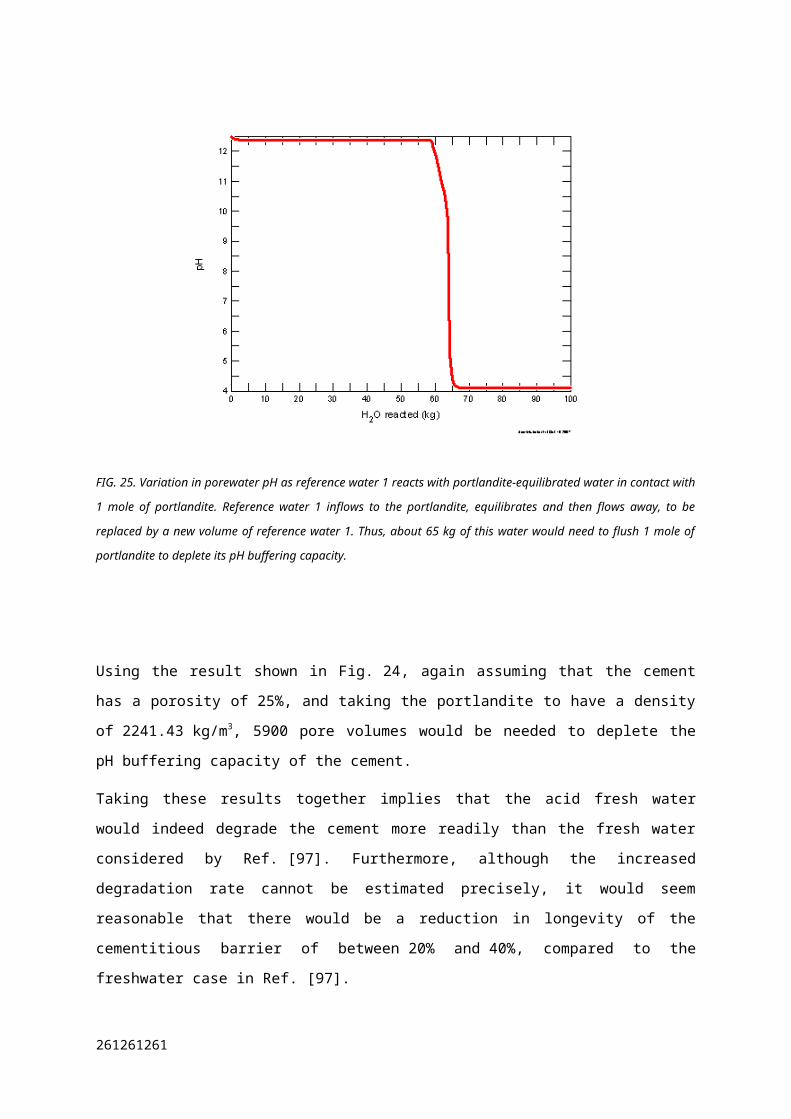
where Φg (Bq m-2 y-1) is the flux of the radionuclide into the house, Ab (m2) and Vh (m3) are the cross-
sectional area of the borehole and total volume of the house and lv is the rate of ventilation of the
house (y-1).
Φg is given by:
Equation 49
Φg=I g f g
τ g Ab
where Ig is the disposed inventory of the radionuclide, decay-corrected to the start time of the
capsule’s physical failure (Bq) and tg is the timescale over which gas production is assumed to take
place following failure of the capsule (y). fg is the total fraction of the inventory of the radionuclide
which is assumed to be released as gas.
For Rn-222, the dose coefficient for inhalation of is given in Sv h -1/Bq m-3, and so Equation is
rewritten as:
Equation 50
DRn= D InhRn Ogas CRnair
where DRn is the individual dose from the inhalation of Rn-222 (Sv y-1), DinhRn is the dose coefficient
for inhalation of Rn-222 (Sv h-1/Bq m-3), Ogas is the individual occupancy in the house (h y-1), and CRnair
is the concentration of Rn-222 in the house (Bq m-3).
CRnair is given by:
Equation 51
CRnair = ΦRn Ab / ((lv + λRn ) Vh)
where ΦRn (Bq m-2 y-1) is the flux of Rn-222 into the house, Ab (m2) is the cross-sectional area of the
borehole, Vh (m3) is the total volume of the house, lv is the rate of ventilation of the house (y-1), and lRn
is the Rn-222 decay rate (y-1).
FRn is given by:
Equation 52
271271271
ΦRn= χRaBh λRn ε Rn ρBh DBh e
−d Bh
D Bh
χRaBh is the concentration of Ra-226 in the disposal zone (Bq kg-1). eRn is the Rn emanating fraction
(unitless), rBh is the dry bulk density of the borehole’s disposal zone (kg m -3), DBh is the diffusion
length for Rn in the borehole (m), and dBh is the thickness of the borehole’s closure zone (m).
χRaBh is calculated using:
Equation 53
χRaBh = AmountRaBh / (ρBh VBh)
where AmountRaBh (Bq) is the amount of Ra-226 in the borehole’s disposal zone, ρBh is the dry bulk
density of the borehole’s disposal zone (m3 kg-1) and VBh is the volume of the borehole’s disposal zone
(m3).
XI.1.3.7. External Irradiation
The annual individual dose to a human from external irradiation from soil (DExSoil, in Sv y-1) is given
by:
Equation 54
DExSoil=CSoil OOut DC Exts
where CSoil is the concentration in the soil (Bq m-3), OOut is the individual occupancy outdoors on the
contaminated soil (h y-1), and DCExts is the dose coefficient for external irradiation from soil (Sv h-1/Bq m-
3).
XI.2. DEFECT SCENARIO
The mathematical model for this scenario is the same as that for the Design Scenario discussed in
Appendix XI.1, although some different parameter values are used (Appendix XII).
XI.3. REPRESENTING NEAR-FIELD DEGRADATION
It is necessary to consider the degradation of the following near-field components (see Table 11):
272
the stainless steel capsule that contains the source container (the source container is assumed to
have failed before disposal) and the stainless steel disposal container that contains the capsule;
and
the containment barrier, the disposal zone backfill and plug, the closure zone backfill, and the
disturbed zone backfill.
Degradation can affect both the physical and chemical performance of the near-field components.
XI.3.1. Physical Performance
XI.1.3.1. Capsule and Disposal Container
Failure times for each component are specified in Appendix XII based upon the corrosion modelling
reported in Appendix XI. The physical performance of each of these components could fail in a linear
manner over a period of time. It could start at a user-defined time (tPhysDegStart, in y) (when the water/gas
tightness of the component is first breached) and end at a user-defined time (tPhysDegEnd, in y) (when the
component has totally failed and is fully degraded). Between these two times, linear failure could be
assumed. However, corrosion model results discussed in Appendix I indicate that the physical
performance of each components can be consider to occur essentially instantaneously. Nevertheless,
flexibility in the model is maintained by adopting the linear failure model but setting tPhysDegEnd to be
marginally greater than tPhysDegStart.
Prior to the start of the failure of the stainless steel capsule none of the waste is available for release.
However, once the capsule starts to fail (at time tCapPhysDegStart, in y), the fraction of the waste available
for release is assumed to start to increase in a linear manner until all of the waste is assumed to be
available once the capsule is fully degraded ((at time tCapPhysDegEnd, in y). Thus, the value of the fraction
of waste available for release (f, unitless) (as used in Equation , Equation , Equation and Equation ) is
a function of time:
Equation 55
f (t )=0 t < tCapPhysDegStart
Equation 56
f ( t )=1 t ≥ tCapPhysDegEnd
Equation 57
f (t )=t−tCapPhysDegStart
tCapPhysDegEnd−tCapPhysDegStart otherwise
273273273
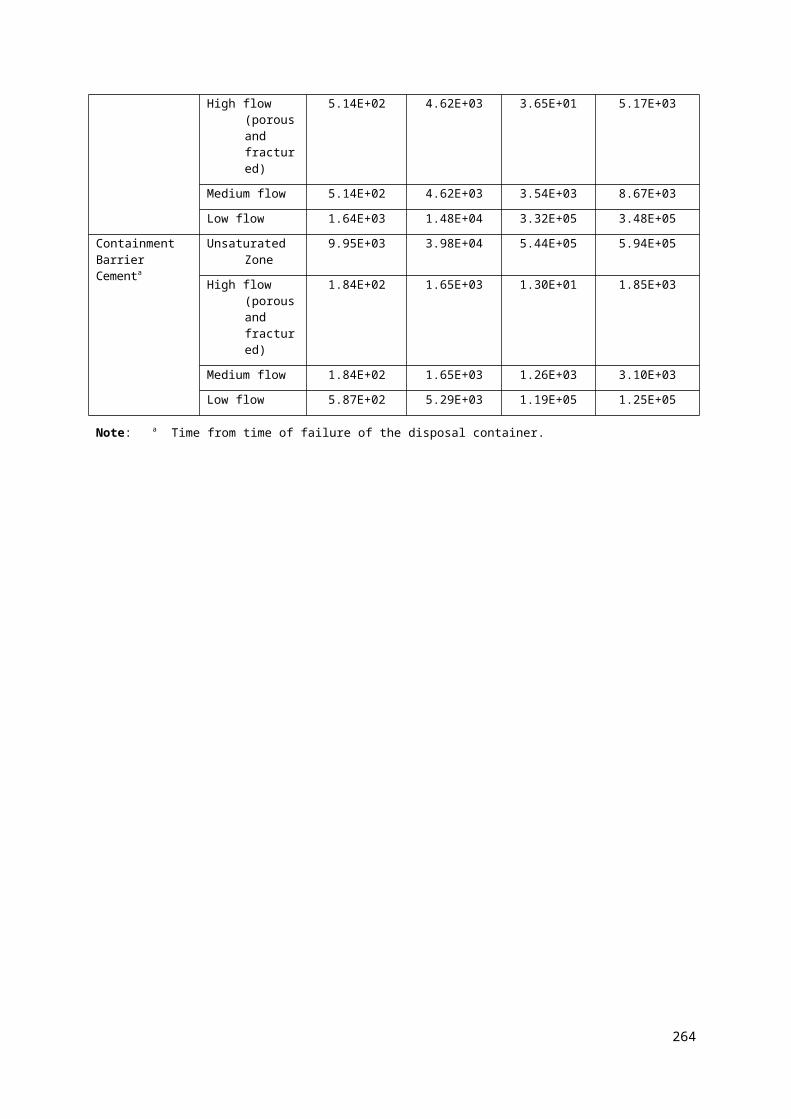
XI.1.3.2. Containment Barrier and Backfill Material
The hydraulic conductivity and total porosity of the cement grout containment barrier and backfill
material are assumed to increase due to physical degradation (e.g. cracking) and chemical degradation
(e.g. calcium leaching and sulphate attack) for all scenarios (see Appendix VIII). These changes can
be represented by the definition of ‘undegraded’ and ‘degraded’ values for both parameters. A
function, fPhysDeg, can be used to describe the transition of the values from the undegraded state prior to
the start of degradation (at time tMatPhysDegStart, in y) to the end of degradation (at time tMatPhysDegEnd , in y):
Equation 58
f Phys Deg(t )=0 t < tMatPhysDegStart
Equation 59
f Phys Deg(t )=1 t ≥ tMatPhysDegEnd
Equation 60
f Phys Deg(t )=t−tMatPhys DegStart
tMatPhys DegEnd−t MatPhysDegStart otherwise
The value of hydraulic conductivity at a given time (K(t), in m y-1) can be determined using the
function as follows:
Equation 61
K ( t )=(1− f Phys Deg( t )) KUnDeg+f PhysDeg( t ) K Deg
where KUnDeg and KDeg are the undegraded and degraded hydraulic conductivities, respectively (both in
m y-1).
The same approach can be used to calculate the total porosity (θ, unitless):
Equation 62
θ( t )=(1− f Phys Deg( t )) θUnDeg+ f Phys Deg( t ) θDeg
where θ UnDeg and θ Deg are the undegraded and degraded total porosities, respectively (both unitless).
XI.3.2. Chemical Performance
Degradation of the chemical performance of cement grout containment barrier and backfill material is
assumed to occur in all scenarios. The processes that lead to chemical degradation, such as calcium
leaching and sulphate attack, are implicitly rather than explicitly modelled. Failure times for each
component are specified in Appendix XII based upon cement grout degradation model presented in
Apppendix VIII. It is assumed that the chemical performance of each of these components does not
274
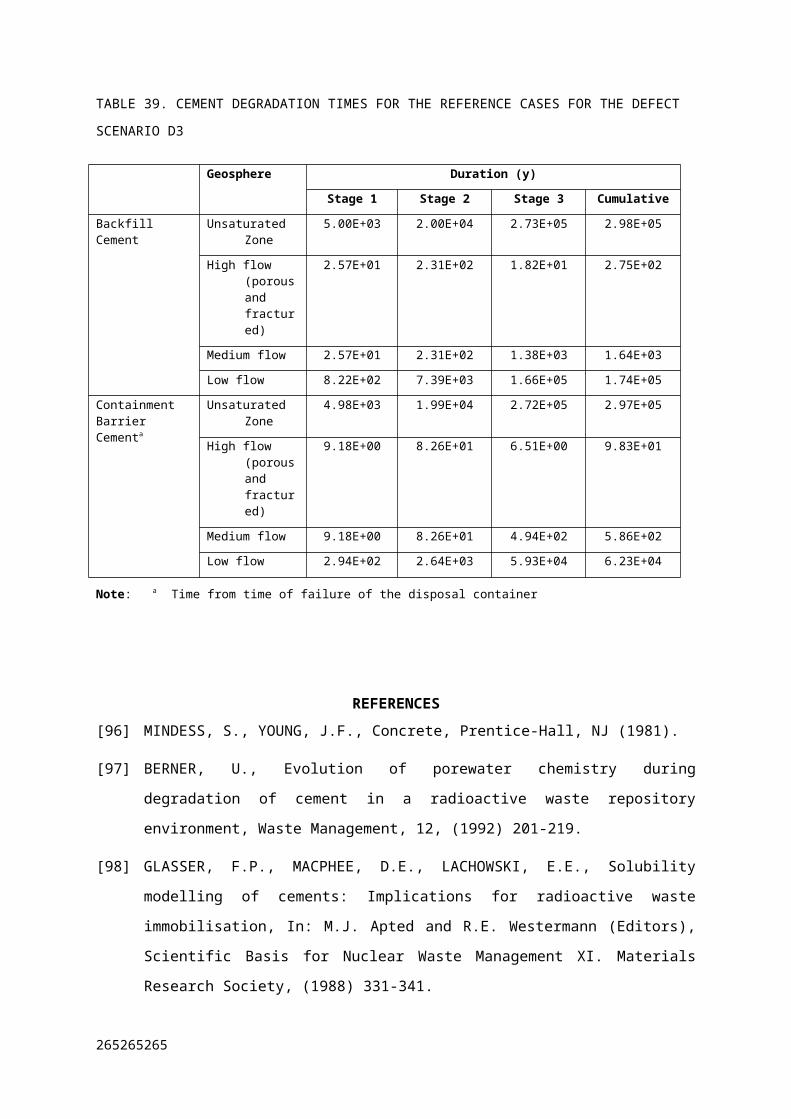
degrade instantaneously; degradation is assumed to occur in a linear manner over a period of time. It is
assumed to start at a user-defined time (tChemDegStart, in y) and end at a user-defined time (tChemDegEnd, in y).
Between these two times, linear degradation is assumed.
It is assumed that chemical evolution of the cement grout near field affects the near-field sorption
coefficients. An approach similar to that used for modelling the change in hydraulic conductivity and
porosity is used to represent changes in sorption coefficients. A function, fChemDeg, can be used to
describe the transition of the values from the undegraded state prior to the start of degradation (at time
tMatChemDegStart, in y) to the end of degradation (at time tMatChemDegEnd, in y):
Equation 63
f Chem Deg( t )=0 t < tMatChemDegStart
Equation 64
f Chem Deg( t )=1 t ≥ tMatChemDegEnd
Equation 65
f Chem Deg( t )=t−tMatChem DegStart
tMatChem DegEnd− tMatChem DegStart otherwise
The value of a radionuclide’s near-field sorption coefficient at a given time (Kd(t), in m3 kg-1) can be
determined using the function as follows:
Equation 66
Kd ( t )=(1−f C hemDeg ( t )) KdUnDeg+ f C hemDeg ( t ) K dDeg
where KdUnDeg and KdDeg are the undegraded and degraded sorption coefficients, respectively (both in
m3 kg-1).
REFERENCE[152] PENFOLD, J.S.S., LITTLE, R.H., ROBINSON, P.C., SAVAGE, D., Improved Safety
Assessment Modelling of Immobilised LLW Packages for Disposal, Ontario Power
Generation Technical Report 05386-REP-03469.3-10002-R00, Toronto (2002).
275275275
Appendix XIIASSESSMENT DATA
Table 60 lists the parameters used in the mathematical models described in Appendix XI and identifies
the table in which the associated data can be found.
TABLE 60. PARAMETERS FOR THE MATHEMATICAL MODEL AND LOCATION OF ASSOCIATED
VALUES
Symbol Definition Units ValueΔc a representative diffusion length between the upstream and
downstream compartmentsm Tables L.15, L.19 and L.20
ΔU a representative diffusion length between the capsule compartment and the adjacent compartment
m Table L.15
δ depth of the matrix compartment m Tables L.19 and L.20¶H/¶x hydraulic gradient - Tables L.13 and L.18e degree of saturation - Tables L.13, L.18, L.22eRn Rn emanating fraction - Table L.14θ total porosity - Tables L.13, L.18, L.22θDeg total porosity of degraded cement grout - Table L.13θ H total porosity of the base of the house - Table L.22θUndeg total porosity of undegraded cement grout - Table L.13Jw water-filled porosity - Calculated using Equation 10JwA water-filled porosity of the compartment adjacent to the capsule
compartment- Calculated using Equation 10
JwB water-filled porosity of the downstream compartment - Calculated using Equation 10Jwc water-filled porosity of capsule compartment - Calculated using Equation 10JwDC water-filled porosity of the contaminated drill core - Calculated using Equation 10Jwf water-filled fracture porosity - Calculated using Equation 10Jwm water-filled matrix porosity - Calculated using Equation 10JwSoil water-filled porosity of the soil - Calculated using Equation 10JwU water-filled porosity of the upstream compartment - Calculated using Equation 10Jww water-filled porosity of the compartment from which the water
is abstracted- Calculated using Equation 10
λA advective transfer rate in the saturated zone y-1 Calculated using Equation λDiffD forward (downstream) diffusive transfer rate y-1 Calculated using Equation λDiffRelB backward diffusive transfer rate from the compartment adjacent
to the capsuley-1 Calculated using Equation
λDiffRelF forward diffusive release rate from capsule compartment y-1 Calculated using Equation λDiffU backward (upstream) diffusive transfer rate y-1 Calculated using Equation lEROS transfer rate due to erosion y-1 Calculated using Equation λirrig transfer rate in groundwater abstracted from the geosphere to
soil due to irrigation of cropsy-1 Calculated using Equation
lmr diffusive transfer rate from matrix to fracture y-1 Calculated using Equation λN decay constant for radionuclide N y-1 Table L.4lother transfer rate due to abstraction of water for watering of animals
and domestic purposesy-1 Calculated using Equation
lPerc advective and dispersive transfer rate through the unsaturated zone
y-1 Calculated using Equation
lrm diffusive transfer rate from fracture to matrix y-1 Calculated using Equation lRn Rn-222 decay rate y-1 Table L.4λSatLeach advective and dispersive transfer rate from capsule containing
the source due to groundwater flowy-1 Calculated using Equation
λUnsatLeach advective and dispersive transfer rate from capsule containing the source due to water percolation
y-1 Calculated using Equation
lv ventilation rate of the house y-1 Table L.22crop interception fraction for irrigation water on the crop - Table L.24r dry bulk density kg m-3 Calculated using Equation
276
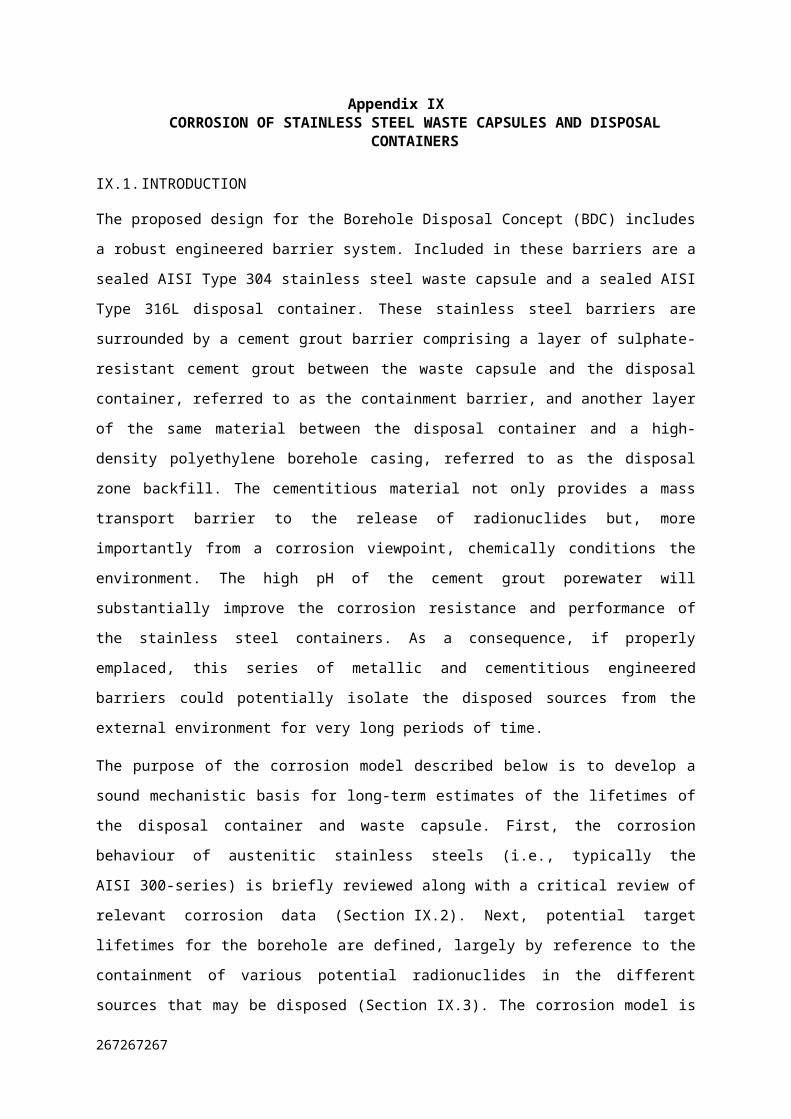
Symbol Definition Units ValuerBh dry bulk density of the borehole’s disposal zone kg m-3 Calculated using Equation rg grain density kg m-3 Tables L.13, L.18,L.22, L.5 and L.7rSoil dry bulk density of the soil kg m-3 Calculated using Equation rWat density of water kg m-3 1000 kg m-3
tgas timescale over which gas production is assumed to take place y Table L.14Φgas the flux of gas into the house Bq m-2 y-1 Calculated using Equation ΦRn the flux of Rn-222 into the house Bq m-2 y-1 Calculated using Equation ΧAnm radionuclide concentration in the animal product Bq kg-1
fresh weight
of product
Calculated using Equation
χCrop radionuclide concentration in the crop Bq kg-1
fresh weight
Calculated using Equation
χDry radionuclide concentration in the surface soil Bq kg-1 dry weight
Calculated using Equation
χRaBh concentration of Ra-226 in the borehole’s disposal zone Bq kg-1 dry weight
Calculated using Equation
χWet radionuclide concentration in the surface soil Bq kg-1 wet weight
Calculated using Equation
A flow wetted surface area per unit volume of rock m2 m-3 Tables L.2 and L.3Ab cross-sectional area of the disposal borehole m2 Table L.14Adiff cross-sectional area relevant to the diffusive release from the
capsulem2 Table L.15
Amount amount of a radionuclide in a compartment Bq or moles
Calculated using Equation 1
AmountRaBh amount of Ra-226 in the borehole’s disposal zone Bq Calculated using Equation 1AmountSoil amount of a radionuclide in the soil Bq Calculated using Equation 1Amountw amount of a radionuclide in the compartment from which the
water is abstractedBq Calculated using Equation 1
AU cross-sectional area relevant to the diffusive transfer from the upstream compartment
m2 Tables L.2 and L.3
BRgas breathing rate of the human in the house m3 h-1 Table L.23CAir concentration of a radionuclide in the air above the soil Bq m-3 Calculated using Equation cDust dust level in the air above the soil compartment kg m-3 Table L.22CFAnm concentration factor for the animal product d kg-1 fresh
weight
of product
Table L.12
CFcrop concentration factor for the crop Bq kg-1
fresh weight
of cro
Table L.8
277277277
Symbol Definition Units Valuep/Bq kg-
1
(dry
weight
of soil)
Cgas concentration of gas in the house Bq m-3 Calculated using Equation Cr corrosion/dissolution rate of source m y-1 Table L.13CRnair concentration of Rn-222 in the house Bq m-3 Calculated using Equation CSoil radionuclide concentration in the soil Bq m-3 Calculated using Equation CW radionuclide concentration in the abstracted water Bq m-3 Calculated using Equation D depth of the compartment from which erosion takes place m Table L.22DAnm annual individual effective dose to a human from the
consumption of animal produceSv y-1 Calculated using Equation
DBh diffusion length for Rn in the borehole m Table L.14dBh thickness of the borehole’s closure zone m Table L.14DCExts dose coefficient for external irradiation from soil Sv h-1/Bq
m-3Table L.5
DCIng dose coefficient for ingestion Sv Bq-1 Table L.5DCInh dose coefficient for inhalation Sv Bq-1 Table L.5DCrop annual individual effective dose to a human from the
consumption of a cropSv y-1 Calculated using Equation
DDust annual individual dose to a human from the inhalation of dust Sv y-1 Calculated using Equation DEffA effective diffusion coefficient for the compartment adjacent to
the capsule compartmentm2 y-1 Table L.16
DEffc effective diffusion coefficient for the capsule compartment m2 y-1 Table L.16DEffD effective diffusion coefficient for the downstream compartment m2 y-1 Table L.16DEffm effective diffusion coefficient for the matrix compartment m2 y-1 Table L.16DEffU effective diffusion coefficient for the upstream compartment m2 y-1 Table L.16dEROS erosion rate for the compartment m y-1 Table L.22DExSoil annual individual dose to a human from external irradiation
from soilSv y-1 Calculated using Equation
Dgas annual individual effective dose from inhalation of gases (other than Rn-222)
Sv y-1 Calculated using Equation
Dil contribution of water from abstraction borehole to the total water demand
- Table L.21
Dinhg dose coefficient for inhalation of the gaseous form of the radionuclide
Sv Bq-1 Table L.5
DinhRn dose coefficient for inhalation of Rn-222 Sv h-1/Bq m-3
Table L.5
dIrr depth of irrigation water applied to the crop m y-1 Table L.24DRn annual individual effective dose from inhalation of Rn-222 Sv y-1 Calculated using Equation dRn effective diffusion of Rn m2 y-1 Table L.22DSed annual individual dose to a human from the ingestion of soil Sv y-1 Calculated using Equation DWat annual individual effective dose from the consumption of
drinking waterSv y-1 Calculated using Equation
f fraction of the waste that is available for release - Calculated using Equation to Equation fChemDeg extent of chemical degradation - Calculated using Equation to Equation fg total fraction of the inventory of a gas producing radionuclide
which is assumed to be released as gas- Table L.14
fPhysDeg extent of physical degradation - Calculated using Equation to Equation fPrep fraction of external contamination on the crop lost due to food
processing- Table L.11
fTrans fraction of activity transferred from external to internal plant surfaces
- Table L.10
Ig disposed inventory of the radionuclide, decay-corrected to the start time of the capsule’s physical failure
Bq Calculated from I e- λt where I is the initial inventory disposed (1E+12 Bq, Section 3.1.1), λ (y-1) is the decay constant (Table L.4), and t (y) is the start time of the capsule’s physical failure (Tables L.16 and L.17)
IngAnm individual ingestion rate of animal product kg fresh Table L.23278
Symbol Definition Units Valueweight
of product y-1
IngAW consumption rate of water by the animal m3 d-1 Table L.23IngCrop individual ingestion rate of the crop kg fresh
weight y-
1
Table L.23
IngSed individual inadvertent ingestion rate of soil kg wet weight h-
1
Table L.23
IngWat individual ingestion rate of freshwater m3 y-1 Table L.23
InhSed breathing rate of the human on the contaminated soil m3 h-1 Table L.23K hydraulic conductivity of a medium m y-1 Tables L.13 and L.18
For cement grout in near-field calculated using Equation
Kc hydraulic conductivity of the capsule compartment m y-1 Table L.13Kd sorption coefficient of the element in the compartment m3 kg –1 Table L.7
For cement grout in near-field calculated using Equation
KdDeg sorption coefficient of degraded cement grout m3 kg –1 Table L.7KDeg Hydraulic conductivity of degraded cement grout backfill m y-1 Table L.13KdUnDeg sorption coefficient of undegraded cement m3 kg –1 Table L.7KUnDeg Hydraulic conductivity of undegraded cement grout backfill m y-1 Table L.13L length of compartment in the direction of water flow m Tables L.15, L.19 and L.20Lc length of capsule compartment in the direction of water flow m Table L.15Ogas individual occupancy in the house h y-1 Table L.23OOut The individual occupancy on the soil h y-1 Table L.23Q Darcy velocity of groundwater through a compartment m y-1 Calculated using Equation qc Darcy velocity of groundwater through the capsule
compartmentm y-1 Calculated using Equation
qPERC annual percolation rate through the capsule compartment m y-1 Table L.13r initial radius of the source m Table L.13R element dependent retardation of the compartment - Calculated using Equation 11RA element dependent retardation of the compartment adjacent to
the capsule compartment- Calculated using Equation 11
Rc element dependent retardation of the capsule compartment - Calculated using Equation 11RD element dependent retardation of the downstream compartment - Calculated using Equation 11Rm element dependent retardation of the matrix compartment - Calculated using Equation 11RSoil element dependent retardation of the soil compartment - Calculated using Equation 11RU element dependent retardation of the upstream compartment - Calculated using Equation 11Rw element dependent retardation of the compartment from which
the domestic and agricultural water is abstracted- Calculated using Equation 11
sCrop soil contamination on the crop kg dry weight
soil
kg-
1
fresh weight
of cro
Table L.24
279279279
Symbol Definition Units Valuep
T is the interval between irrigation and harvest y Table L.24tCapPhysDegStart time at which failure of the capsule’s physical performance
startsy Tables L.16 and L.17
tCapPhysDegEnd time at which failure of the capsule’s physical performance ends y Tables L.16 and L.17tChemDegStart time at which failure of a barrier’s chemical performance starts y Tables L.16 and L.17tChemDegEnd time at which failure of a barrier’s chemical performance starts y Tables L.16 and L.17tDelay average radon travel time from the soil into the house y Table L.22tMatChemDegStart time at which failure of the cement grout containment barrier’s
and cement grout backfill’s chemical performance starts
y Tables L.16 and L.17
tMatChemDegEnd time at which failure of the cement grout containment barrier’s and cement grout backfill’s chemical performance ends
y Tables L.16 and L.17
tMatPhysDegStart time at which failure of the containment barrier and backfill material’s physical performance starts
y Tables L.16 and L.17
tMatPhysDegEnd time at which failure of the containment barrier and backfill material’s physical performance ends
y Tables L.16 and L.17
tPhysDegStart time at which failure of a barrier’s physical performance starts y Tables L.16 and L.17tPhysDegEnd time at which failure of a barrier’s physical performance ends y Tables L.16 and L.17V volume of the compartment m3 Derived from dimensions, Tables L.15, L.19,
L.20 and L.22VA volume of the compartment adjacent to the capsule
compartmentm3 Derived from dimensions, Table L.15
VBh volume of the borehole’s disposal zone m3 Derived from dimensions, Section 3.1.2Vc volume of the capsule compartment m3 Derived from dimensions, Table 5VD volume of the downstream compartment m3 Derived from dimensions, Tables L.15, L.19
and L.20VDC volume of the contaminated drill core m3 Table L.24Vh total volume of the house m3 Derived from dimensions, Table L.22Virrig is the volume of irrigation water that reaches the soil m3 y-1 Table L.22Vother volume of water abstracted for watering of animals and
domestic purposes (includes the volume of irrigation water not reaching the soil due to interception by crops)
m3 y-1 Table L.22
VSoil volume of the compartment representing the soil m3 Derived from dimensions, Table L.22Vw volume of compartment from which water is abstracted m3 Derived from dimensions, Tables L.19 and
L.20VU volume of the upstream compartment m3 Derived from dimensions, Tables L.15, L.19
and L.20Wcrop removal rate of irrigation water from the crop by weathering
processes (weathering rate)y-1 Table L.9
YCrop yield of the crop kg (fresh weight
of crop) m-2
y-1
Table L.24
XII.1. INVENTORY AND RADIONUCLIDE DATA
TABLE 61. RADIONUCLIDES DISPOSED AND ASSOCIATED DAUGHTERS CONSIDERED
280
Disposed Radionuclidea
Short-lived Daughter(s)b
Daughter(s)
H-3Co-60Ni-63Kr-85Sr-90 *Cs-137 *Pb-210 *Ra-226 * ®ÆPb-210*®Æ Po-210Pu-238 ®ÆU-234®Æ Th-230®Æ Ra-226*®Æ Pb-210*®Æ
Po-210Pu-239 ®ÆU-235*®ÆPa-231®ÆAc-227*Am-241 ®ÆNp-237®Æ Pa-233®Æ U-233®Æ Th-229*
Notes: a For each disposed radionuclide, an inventory of 1 TBq per waste package is assumed (see
Section 3.1.1). It is also assumed that there are 50 waste packages per borehole (see Section 3.1.2),
giving a total inventory of 50 TBq for each radionuclide.
b * indicates a daughter with a half-life of less than 25 days (see Table L.3).
TABLE 62. SHORT-LIVED DAUGHTERS WITH HALF-LIVES OF LESS THAN 25 DAYS ASSUMED TO BE
IN SECULAR EQUILIBRIUM WITH THEIR PARENTS
Parent Short Lived DaughtersSr-90 ®Æ Y-90Cs-137 ®Æ (branching ratio 0.94) Ba-137mPb-210 ®Æ Bi-210Ra-226 ®Æ Rn-222®Æ Po-218 ®Æ (branching ratio 0.9998) Pb-214 ®Æ Bi-214 ®Æ (branching ratio 0.9998) Po-214
®Æ (branching ratio 0.0002) At-218 ®Æ Bi-214 ®Æ (branching ratio 0.9998) Po-214
Ac-227 ®Æ (branching ratio 0.0138) Fr-223 ®Æ(branching ratio 0.9862) Th-227 ®ÆRa-223®ÆRn-219®ÆPo-215®ÆPb-211®ÆBi-211
®Æ (branching ratio 0.9972) ®ÆTl-207 ®Æ (branching ratio 0.0028) Po-211Th-229 ®Æ Ra-225 ®Æ Ac-225 ®Æ Fr-221 ®Æ At-217 ®Æ Bi-213 ®Æ (branching ratio 0.9784) Po-213 ®Æ Pb-209
®Æ (branching ratio 0.0216) Tl-209 ®Æ Pb-209
U-235 ®Æ Th-231
TABLE 63. RADIONUCLIDE HALF-LIVES AND DECAY RATES
Radionuclide Half-life (y)a Decay rate (y-1)b
H-3 1.24E+01 5.59E-02
281281281
Co-60 5.27E+00 1.32E-01Ni-63 9.60E+01 7.22E-03Kr-85 1.07E+01 6.48E-02Sr-90 2.91E+01 2.38E-02Cs-137 3.00E+01 2.31E-02Pb-210 2.23E+01 3.11E-02Po-210 3.79E-01 1.83E+00Rn-222 1.05E-02 6.60E+01Ra-226 1.60E+03 4.33E-04Ac-227 2.18E+01 3.18E-02Th-229 7.34E+03 9.44E-05Th-230 7.70E+04 9.00E-06Pa-231 3.28E+04 2.11E-05Pa-233 7.39E-02 9.38E+00U-233 1.59E+05 4.36E-06U-234 2.45E+05 2.83E-06U-235 7.04E+08 9.85E-10Np-237 2.14E+06 3.24E-07Pu-238 8.77E+01 7.90E-03Pu-239 2.41E+04 2.88E-05Am-241 4.32E+02 1.60E-03
Notes: a Data from Ref. [1].
b Decay constant =
ln2half life
Reference for Table 63
[1] INTERNATIONAL COMMISSION ON RADIOLOGICAL PROTECTION, Radionuclide
Transformations Energy and Intensity of Emissions, International Commission on Radiological
Protection, ICRP Publication 38, Pergamon Press, Oxford (1983).
TABLE 64. RADIONUCLIDE DOSE COEFFICIENTS FOR INGESTION, INHALATION AND EXTERNAL
IRRADIATION
Radionuclide
Dose Coefficients for Adultsa
Ingestion(Sv Bq-1)b
Inhalation(Sv Bq-1)b
External Irradiationfrom soil
(Sv h-1/Bq m-3)e
Water Immersion(Sv h-1/Bq m-3)f
H-3 1.8E-11 4.5E-11
1.8E-11 (HTO gas)
0 0
282
Co-60 3.4E-09 1.0E-08 3.0E-13 9.3E-13
Ni-63 1.5E-10 1.3E-09 0 0
Kr-85 0 9.2E-13c 0 0
Sr-90 3.1E-08 3.8E-08 7.9E-16 4.0E-15
Cs-137 1.3E-08 4.6E-09 6.2E-14 2.0E-13
Pb-210 6.9E-07 1.2E-06 1.5E-16 1.5E-15
Po-210 1.2E-06 3.3E-06 9.5E-19 3.0E-18
Ra-226 2.8E-07 3.5E-06
9.0E-09d
2.1E-13 6.5E-13
Ac-227 1.2E-06 5.7E-04 8.6E-18 1.4E-13
Th-229 6.1E-07 8.6E-05 2.9E-14 1.1E-13
Th-230 2.1E-07 1.4E-05 2.1E-17 1.2E-16
Pa-231 7.1E-07 1.4E-04 3.4E-15 1.2E-14
Pa-233 8.7E-10 3.9E-09 1.8E-14 6.7E-14
U-233 5.1E-08 3.5E-06 2.4E-17 1.1E-16
U-234 4.9E-08 3.5E-06 6.6E-18 5.0E-17
U-235 4.7E-08 3.1E-06 1.3E-14 5.5E-14
Np-237 1.1E-07 2.3E-05 1.4E-15 7.2E-15
Pu-238 2.3E-07 4.6E-05 2.3E-18 2.9E-17
Pu-239 2.5E-07 5.0E-05 5.1E-18 2.8E-17
Am-241 2.0E-07 4.2E-05 7.2E-16 5.5E-15
Notes: a Values include effects of short-lived (half-life less than 25 days) daughters not explicitly listed, assuming secular
equilibrium at time of intake or exposure. A list of short-lived daughters is given in Table L.3.
b Data taken from Ref. [1].
c Value for gas rather than particulate, units are in Sv h-1/Bq m-3.
d Value for Rn-222 gas taken from Ref. [3]. Units are in Sv h-1/Bq m-3.
e Data taken from Ref. [2] assuming contamination to an infinite depth.
f Data taken from Ref. [2].
References for Table 64
[1] INTERNATIONAL COMMISSION ON RADIOLOGICAL PROTECTION, Age dependent doses
to members of the public from intake of radionuclides: Part 5, Compilation of ingestion and
inhalation dose coefficients, ICRP Publication 72, Ann, ICRP 26 No. 1, Pergamon Press, Oxford
(1996).
283283283
[2] UNITED STATES ENVIRONMENTAL PROTECTION AGENCY, Online Database of Dose
Coefficients from Federal Guidance Report No. 12, Date Accessed: 16 September 2004,
http://www.ornl.gov/~wlj/fgr12tab.htm.
[3] UNITED NATIONS SCIENTIFIC COMMITTEE ON THE EFFECTS OF ATOMIC
RADIATION, Sources and Effects of Ionizing Radiation, United Nations, New York, NY (2000).
XII.2. ELEMENT-DEPENDENT DATA
TABLE 65. EFFECTIVE DIFFUSION COEFFICIENTS (M2 Y-1)
Element Capsulec Cementd High Flow Rate Fractured
Systeme
High and Medium Flow Rate Porous
Systemd
Low Flow Rate Systemd
Undegraded Degraded
H 1E-1 8E-5 4E-3 2E-6d 2E-2 3E-3Bea 4E-2 8E-5 4E-3 1E-5 2E-2 3E-3Co 4E-2 8E-5 4E-3 9E-7f 2E-2 3E-3Ni 4E-2 8E-5 4E-3 9E-7 2E-2 3E-3Sr 4E-2 8E-5 4E-3 1E-5 2E-2 3E-3Cs 8E-2 8E-5 4E-3 3E-5 2E-2 3E-3Pb 8E-2 8E-5 4E-3 1E-6g 2E-2 3E-3Po 8E-2 8E-5 4E-3 1E-6h 2E-2 3E-3Ra 8E-2 8E-5 4E-3 1E-6 2E-2 3E-3Acb 1E-1 8E-5 4E-3 1E-6 2E-2 3E-3Th 1E-1 8E-5 4E-3 2E-7 2E-2 3E-3Pa 1E-1 8E-5 4E-3 1E-6 2E-2 3E-3U 1E-1 8E-5 4E-3 1E-6 2E-2 3E-3Np 1E-1 8E-5 4E-3 1E-6 2E-2 3E-3Pu 1E-1 8E-5 4E-3 1E-6 2E-2 3E-3Am 1E-1 8E-5 4E-3 1E-6 2E-2 3E-3
Notes: a Sr used as an analogue.b Am used as an analogue.c Data for free water diffusion from Ref. [1]. Used for capsule compartment since capsule is assumed not to be
backfilled (see Section 3.1.2). d Data from Ref. [3].e Data from Ref. [2].f Ni used as an analogue.g Sn used as an analogue. h Pb used as an analogue.
284
References for Table 65
[1] LITTLE, R.H., VAN BLERK J., WALKE R.C., BOWDEN, R.A., Generic Post-Closure Safety
Assessment and Derivation of Activity Limits for the Borehole Disposal Concept, Quintessa
Report QRS-1128A-6 v2.0, Quintessa Limited, Henley-on-Thames, UK (2004).
[2] ANDERSSON, J., SR 97 Data and Data Uncertainties. Compilation of Data and Data Uncertainties
for Radionuclide Transport Calculations. SKB Technical Report TR-99-09, Swedish Nuclear Fuel
and Waste Management Company, Stockholm (1999).
[3] SAVAGE, D., STENHOUSE, M.J., SFR Vault Database, SKI Report R02-53, Swedish Nuclear
Power Inspectorate, Stockholm (2002).
TABLE 66. SORPTION COEFFICIENTS (M3 KG-1)
Element Capsuleb Cementc Unsaturated Zonef
High and Medium Flow Saturated
Zonej
Low Flow Saturated
Zonej
HighValues for
SoilkUndegrad
edDegraded
Ha 0 0 0 0 0 0 0.0001Be 0 0.1d 0.01d 0.5g 0.5g 0.05g 1.3Co 0 0.1 0.01 0.1h 0.1h 1h 0.54Ni 0 0.1 0.01 0.1h 0.1h 1h 0.67Sr 0 0.1 0.01 0.005g 0.005g 0.001g 0.11Cs 0 0.001 0.005 0.05 0.05 0.01 1.8Pb 0 0.5 0.1 0.1 0.1 1 0.54Po 0 0.5 0.1 0.1i 0.1i 1i 2.7Ra 0 0.05 0.05 0.5 0.5 0.05 9.0Ac 0 5 1 5 5 5 2.4Th 0 5 1 1 1 1 5.4Pa 0 0.5 0.1 1 1 1 2.7U 0 1/5e 0.1/1e 1 1 1 1.5Np 0 2/5e 0.2/1e 1 1 1 0.055Pu 0 5 1 1 1 1 4.9Am 0 5 1 5 5 5 8.1
Notes: 1. Data from Ref. [1].a Assumed not to be sorbed in the geosphere.b Capsule is assumed not to be backfilled and so has no sorption properties (see Section 3.1.2).c Data from Ref. [2].d Sr used as an analogue.e First value is for oxidising conditions, second is for reducing conditions.f Assumed to be the same as high/medium flow saturatesd zone.
285285285
g In the absence of data in Ref. [4], it is assumed that Sr sorption values are an order of magnitude lower than Cs
values, consistent with the information given in Refs [1, 3].h Pd used as an analogue.i Pb used as an analogue.j Data from Ref. [4]. For high and medium flow saturated zones use data for sandstone with fresh type
groundwater in [4]. For low flow saturated zone use data for mudstone with saline type groundwater in Ref. [4].k Data from Ref. [3].
References for Table 66
[1] NATIONALE GENOSSENSCHAFT FÜR DIE LAGERUNG RADIOAKTIVER ABFÄLLE,
Project Opalinus Clay: Models, Codes and Data for Safety Assessment. Demonstration of Disposal
Feasibility for Spent Fuel, Vitrified High-level Waste and Long-lived Intermediate-level Waste
(Entsorgungsnachweis), Nagra Technical Report 02-06, Wettingen (2002).
[2] SAVAGE, D., STENHOUSE, M.J., SFR Vault Database, SKI Report R02-53, Swedish Nuclear
Power Inspectorate, Stockholm (2002).
[3] INTERNATIONAL ATOMIC ENERGY AGENCY, The Use of Safety Assessment in the
Derivation of Activity Limits for Disposal of Radioactive Waste to Near Surface Facilities, IAEA-
TECDOC-1380, IAEA, Vienna (2003).
[4] JAPAN NUCLEAR CYCLE DEVELOPMENT INSTITUTE: H12: Project to Establish the
Scientific and Technical Basis of HLW Disposal in Japan, Supporting Report 3: Safety Assessment
of the Geological Disposal System, JNC Report JNC TN1410 2000-004, Tokai-mura, Japan
(2000).
TABLE 67. SOIL TO PLANT CONCENTRATION FACTORS
(BQ KG-1 FRESH WT/BQ KG-1 DRY SOIL) FOR CROPS
Element Root Vegetablesa Green Vegetablesa
H 5E+0 5E+0Be 1E-3 2E-3Co 3E-2 3E-2Ni 3E-2 3E-2Sr 9E-2 3E+0Cs 3E-2 3E-2Pb 1E-2 1E-2
286
Po 2E-4 2E-4Ra 4E-2 4E-2Ac 1E-3 1E-3Th 5E-4 5E-4Pa 4E-2 4E-2U 1E-3 1E-3Np 1E-3 1E-2Pu 1E-3 1E-4Am 1E-3 1E-3
Notes: a Data from Ref. [1].
References for Table 67
[1] INTERNATIONAL ATOMIC ENERGY AGENCY, The Use of Safety Assessment in the
Derivation of Activity Limits for Disposal of Radioactive Waste to Near Surface Facilities, IAEA-
TECDOC-1380, IAEA, Vienna (2003).
TABLE 68. WEATHERING RATES (Y-1)Element Root Vegetablesa Green Vegetablesa
H 1.8E+1 1.8E+1Be 1.8E+1 1.8E+1Co 1.8E+1 1.8E+1Ni 1.8E+1 1.8E+1Sr 1.8E+1 1.8E+1Cs 1.8E+1 1.8E+1Pb 1.8E+1 1.8E+1Po 1.8E+1 1.8E+1Ra 1.8E+1 1.8E+1Ac 1.8E+1 1.8E+1Th 1.8E+1 1.8E+1Pa 1.8E+1 1.8E+1U 1.8E+1 1.8E+1Np 1.8E+1 5.1E+1Pu 1.8E+1 5.1E+1Am 1.8E+1 5.1E+1
Notes: a Data taken from Ref. [1].
Reference for Table 68
287287287
[1] SMITH, G.M., FEARN, H.S., SMITH, K.R., DAVIS, J.P., KLOS, R., Assessment of the
radiological impact of disposal of solid radioactive waste at Drigg, National Radiological
Protection Board, NRPB-M148, Chilton, UK (1988).
TABLE 69. FRACTION OF ACTIVITY TRANSFERRED FROM EXTERNAL TO INTERNAL PLANT SURFACES (-)
Element Root Vegetablesb Green Vegetablesb
H 2.0E-2 2.3E-2
Be 9.9E-2 1.8E-1
Co 1.7E-1 1.8E-1
Ni 3.9E-2 3.7E-1
Sr 1.4E-1 2.0E-1
Cs 3.0E-1 1.9E-1
Pb 2.2E-1 2.2E-1
Poa 2.2E-1 2.2E-1
Ra 9.9E-2 1.8E-1
Ac 2.9E-1 4.5E-1
Th 2.9E-1 3.8E-2
Pa 2.9E-1 4.5E-1
U 4.3E-2 3.6E-1
Np 2.9E-1 4.5E-1
Pu 4.3E-2 3.6E-1
Am 2.9E-1 2.8E-1
Notes: a Pb used as an analogue.
b Data taken from for root vegetables and leafy vegetables [1].
Reference for Table 69
[1] ASHTON, J., SUMERLING, T.J., Biosphere Database for Assessments of Radioactive Waste
Disposals, UKDoE Report No. DoE/RW/88.083 (1988).
288
TABLE 70. FOOD PREPARATION LOSSES (-)
Element Root Vegetablesa Green Vegetablesb
H 0.0E+0 9.0E-1Be 0.0E+0 9.0E-1Co 0.0E+0 9.0E-1Ni 0.0E+0 9.0E-1Sr 0.0E+0 9.0E-1Cs 0.0E+0 9.0E-1Pb 0.0E+0 9.0E-1Po 0.0E+0 9.0E-1Ra 0.0E+0 9.0E-1Ac 0.0E+0 9.0E-1Th 0.0E+0 9.0E-1Pa 0.0E+0 9.0E-1U 0.0E+0 9.0E-1Np 0.0E+0 9.0E-1Pu 0.0E+0 9.0E-1Am 0.0E+0 9.0E-1
Notes: a Data from Ref. [1].
b Data from Ref. [2].
References for Table 70
[1] SIMMONDS, J.R., CRICK, M.J., Transfer parameters for use in terrestrial foodchain models.
National Radiological Protection Board, NRPB-M63, Chilton, UK (1982).
[2] SMITH, G.M., FEARN, H.S., SMITH, K.R., DAVIS, J.P., KLOS, R., Assessment of the
radiological impact of disposal of solid radioactive waste at Drigg, National Radiological
Protection Board, NRPB-M148, Chilton, UK (1988).
TABLE 71. TRANSFER COEFFICIENTS TO ANIMAL PRODUCE
Element Beef (d kg-1 fresh weight)a
Cow’s Milk(d l-1)a
Fish (m3 kg-1 fresh weight)a
H 2.9E-2 1.5E-2 1E-3Be 6.6E-4 2.6E-6 1E-1Co 1.0E-2 3.0E-4 3E-1Ni 5.0E-3 1.6E-2 1E-1Sr 8.0E-3 2.8E-3 6E-2Cs 5.0E-2 7.9E-3 2E+0Pb 4.0E-4 3.0E-4 3E-1Po 5.0E-3 3.4E-4 5E-2Ra 9.0E-4 1.3E-3 5E-2Ac 1.6E-4 4.0E-7 3E-2
289289289
Th 2.7E-3 5.0E-6 1E-1Pa 5.0E-5 5.0E-6 1E-2U 3.0E-4 4.0E-4 1E-2Np 1.0E-3 5.0E-6 3E-2Pu 1.0E-5 1.1E-6 3E-2Am 4.0E-5 1.5E-6 3E-2
Note: a Data from Ref. [1]. Data for fish only used for variant calculation that
assumes contaminated groundwater is used to supply a fish farm.
Reference for Table 71
[1] INTERNATIONAL ATOMIC ENERGY AGENCY, The Use of Safety Assessment in the
Derivation of Activity Limits for Disposal of Radioactive Waste to Near Surface Facilities, IAEA-
TECDOC-1380, IAEA, Vienna (2003).
XII.3. NEAR-FIELD ELEMENT-INDEPENDENT DATA
TABLE 72. NEAR-FIELD LIQUID RELEASE AND FLOW DATA
Parameter Units Near-fieldCapsule Cement
Undegraded DegradedHydraulic conductivity m y-1 1E+6e 3.2E-1h 3.2E+2j
Total porosity - 1.0E+0f 1.0E-1i 2.5E-1i
Grain density kg m-3 1.0E+3g 2.4E+3i 2.4E+3i
Hydraulic gradient in saturated zonea
- 0.01
Percolation rate in unsaturated zoneb
m y-1 5E-2
Degree of saturation in unsaturated zoneb
- 3.3E-1
Initial radius of sourcec m 5E-3Corrosion/dissolution rate of sourced
m y-1 1E-8
Notes: a See Table 8.
b See Section 3.2.1.
c Data from Ref. [2].
d Reference [3] gives a value of 1E-3 g m-2 d-1 (approx. 1E-7 m y-1) for glass at a temperature of 60°C and notes
that the dissolution rate is about an order of magnitude lower at 20°C. It is conservatively assumed that the dissolution
rate for ceramic will be the same as for glass.290
e Nominal value adopted to ensure flow in the near field is not limited by the hydraulic conductivity of the capsule.
f Capsule assumed to be void space.
g Assumed to be the same as water.
h Based on data from Ref. [1] which gives range of 3.2E-3 to 3.2E-1 m y-1 for structural cement.
i Value consistent with the internal diameter of the capsule (see Table 5).
j Typical value for sand and gravel.
References for Table 72
[1] NATIONALE GENOSSENSCHAFT FÜR DIE LAGERUNG RADIOAKTIVER ABFÄLLE,
Report on Long-Term Safety of the L/ILW Repository at the Wellenberg Site, Nagra Report NTB
94-06, Wettingen (1994).
[2] ALLARD, B., HÖGLUND, L.O., SKAGIUS, K., Adsorption of Radionuclides in Concrete, SKB
Progress Report SKB/SFR 91-02, Swedish Nuclear Fuel and Waste Management Company,
Stockholm (1991).
[3] JAPAN NUCLEAR CYCLE DEVELOPMENT INSTITUTE, H12: Project to establish the
scientific and technical basis for HLW disposal in Japan. Second Progress Report on Research and
Development for the Geological Disposal of HLW in Japan, JNC Technical Report JNC TN1410
2000-002, Tokai-mura (2000).
TABLE 73. NEAR-FIELD GAS PARAMETERS
Parameter Units Value
Timescale for gas production after failure of capsulea y 1E+2
Cross-sectional area of boreholeb m2 5.3E-2
Fraction of radionuclide released as gasc - 1E+0
Emanating fraction for Rn-222a - 2E-1
Depth of closure zoned m 3E+1
Diffusion length for Rn-222 in the boreholea m 1E+0
Notes: a Data taken from Ref. [1].
b Assumes borehole diameter of 0.26 m (see Section 3.1.2).
291291291
c Conservative value.
d See Section 3.1.2.
Reference for Table 73
[1] INTERNATIONAL ATOMIC ENERGY AGENCY, Improvement of Safety Assessment
Methodologies for Near Surface Disposal Facilities, Volume 2: Test Cases, IAEA-ISAM-2, IAEA,
Vienna (2004).
TABLE 74. NEAR-FIELD TRANSPORT DATA
Compartment Type
Disposal Zone
Number of Compartments
Length in Direction of Flow
(m)
Area Perpendicular to Flow (m2)
Diffusion Length
(m)q
Area for Diffusion
(m2)s
Capsule (containing source container)
Unsaturated 10c 5.50E-1e 3.46E-4n 2.58E-2 3.63E-2Saturated 1d 1.05E-2f 1.16E-1 (15) 2.58E-2 3.63E-1
Containment Barrier
Unsaturated 10c 9.30E-1g 8.33E-3n 2.70E-2 3.36E-1Saturated 1d 4.10E-2h 9.58E-1o 2.70E-2 3.36E+0
Disposal Zone (horizontally adjacent to capsule)
Unsaturated 10c 5.00E+0i 5.01E-3 (16) 3.14E-2 2.51E+0Saturated 1d 1.25E-2j 7.00E+0o 3.14E-2 2.51E+1
Disposal Zone (vertically adjacent to capsule)
Unsaturated 10c 3.68E+0k 1.04E-2n -r -r
Saturateda - - - - -
Disturbed Zone (Backfill)
Unsaturated 10c 5.00E+0l 3.30E-2p 2.49E-1 4.08E+0Saturated 1d 5.00E-2m 1.30E+1o 2.49E-1 4.08E+1
Disposal Zone (Plug)
Unsaturated 1c 5.00E-1l 5.31E-2n -r -r
Saturatedb - - - - -
Notes: a The material within the disposal zone vertically adjacent to the capsule is not explicitly modelled for saturated
conditions as it is assumed not to participate in the transport of radionuclides.
b For saturated conditions, flow moves horizontally through the concrete backfill of the disturbed zone between the
casing and the borehole wall. The length of the disturbed zone in the direction of water flow is therefore the same as the
distance between the borehole casing and borehole wall, i.e. 50 mm (Section 3.1.2). The plug is not modelled since it is
assumed not to participate in the transport of radionuclides.
c The total vertical depth of the disposal zone is about 50 m (Section 3.1.2). For the unsaturated conditions, flow is
vertically down the borehole and it is important to discretise the flow path of 50 m. It is considered appropriate to
divide the 50 m length into 10 source compartments, 10 containment barrier compartments and 10 disposal zone
compartments representing the disposal zone between the disposal containers, in order to provide adequate
292
discretisation. The vertical flow will pass through the plug at the base of the borehole into the geosphere. It is assumed
that the plug is 0.5 m thick and so can be represented by one compartment. In addition, flow will occur down the
disposal zone between the disposal containers and the casing and down along the concrete backfill between the casing
and the borehole wall. These have a total length of 50 m and can be discretised into 10 compartments.
d For saturated conditions, flow is horizontal and so the flow path length through the disposals is equal to the
diameter of the borehole (0.26 m) (Section 3.1.2) and so one compartment is sufficient to represent the flow path
through each near-field component.
e The length of the capsule is 110 mm (Table 5). For unsaturated conditions, flow percolates vertically down through
all 50 capsules giving a total length of 5.5 m. This is divided between 10 compartments, giving a length in the direction
of water flow of 0.55 m for each capsule compartment.
f The radius of the capsule is 10.5 mm (Table 5). For saturated conditions, flow moves horizontally through the
capsules giving a length in the direction of groundwater flow of 0.0105 m for the capsule compartment.
g For unsaturated conditions, flow percolates vertically down through the borehole. The length of each cement grout
containment barrier in the direction of water flow is 186 mm (Table 5). Over all 50 containers this gives a total length
of 9.3 m. This is divided between 10 compartments, gives a length in the direction of water flow of 0.93 m for each
cement grout containment barrier compartment.
h For saturated conditions, flow moves horizontally through the containment barrier. The length of the cement grout
containment barrier in the direction of water flow is therefore the same as its thickness, i.e. 41 mm (Table 5).
i Flow will occur down the disposal zone between the disposal containers and the borehole casing. This has a total
length of 50 m, i.e. 5 m per compartment.
j For saturated conditions, flow moves horizontally through the containment barrier. The length of the disposal zone
in the direction of water flow is therefore the same as the distance between the disposal container and the borehole
casing, i.e. 12.5 mm (Section 3.1.2).
k For unsaturated conditions, water flow is vertically down the borehole. It is noted in Section 3.1.2 that between 700
and 800 mm of backfill can be used between vertically adjacent disposal containers. Assuming a value of 750 mm, the
total length of the backfill in the disposal zone between the disposal containers is 36.75 m. This is divided between 10
compartments, gives a length in the direction of water flow of 3.68 m for each disposal zone compartment.
l For unsaturated conditions, the vertical flow will pass through the plug at the base of the borehole into the
geosphere. It is assumed that the plug is 0.5 m thick. In addition, flow will occur down along the backfill between the
casing and the borehole wall. This has a total length of 50 m, i.e. 5 m per compartment.
m For saturated conditions flow moves horizontally through the backfill of the disturbed zone between the casing and
the borehole wall. The length of the disturbed zone in the direction of water flow is therefore the same as the distance
between the borehole casing and the borehole wall, i.e. 50 mm (Section 3.1.2). The plug is not modelled since it is
assumed not to participate in the transport of radionuclide.
n For unsaturated conditions, water flow is vertically down the borehole. Therefore, the area of each compartment
perpendicular to water flow is calculated using π ro2 where ro is the outer radius of the compartment (see Table 5 for
data).
293293293
o For saturated conditions, flow moves horizontally through the borehole. Therefore, the area of each compartment
perpendicular to water flow is calculated using a formula based on the depth of compartment multiplied by the diameter
of compartment.
p For unsaturated conditions, water flow is vertically down the borehole. Therefore, the area of each compartment
perpendicular to water flow is calculated using π (ro2 – ri2) where ro is the outer radius of the compartment and ri is the
inner radius of the compartment (see Table 5 for data).
q Taken to be the distance between the mid points of the adjacent compartments.
r No diffusive transport is modelled from the disposal zone vertically adjacent to the capsule as, if diffusion
dominates, horizontal diffusion from the disposal container is assumed to be of greater importance.
s Equal to the circumference of the compartment multiplied by its depth.
TABLE 75. TIMES FOR THE FAILURE OF THE PERFORMANCE OF THE NEAR-FIELD COMPONENTS
FOR THE DESIGN SCENARIO
Component Failure Times (y, from time of disposal)
Unsaturated Disposal Zone
Groundwater #1
Saturated, High Flow Rate Disposal Zone
Groundwater #5
Saturated, Medium Flow Rate Disposal
ZoneGroundwater #5
Saturated, Low Flow Rate Disposal Zone
Groundwater #6
Start of Failurec
Totally Failedd
Start of Failurec
Totally Failedd
Start of Failurec
Totally Failedd
Start of Failurec
Totally Failedd
Backfill Cementa
5.00E+4 5.97E+5 5.14E+3 5.17E+3 5.14E+3 8.67E+3 1.64E+4 3.48E+5
Stainless steel disposal containerb
4.80E+4 4.80E+4 4.80E+5 4.80E+5 4.80E+5 4.80E+5 2.15E+5 2.15E+5
Containment Barriera
9.78E+4 6.42E+5 4.82E+5 4.82E+5 4.82E+5 4.83E+5 2.21E+5 3.40E+5
Stainless steel capsuleb
7.20E+4 7.20E+4 7.20E+5 7.20E+5 7.20E+5 7.20E+5 2.90E+5 2.90E+5
Notes: a Data derived from Table H.1.
b Data taken from Table 52.
c Represents start of degradation for cement grout (i.e. end of Stage 2/start of Stage 3).
d Represents end of degradation for cement grout (i.e. end of Stage 3/start of Stage 4).
294
TABLE 76. TIMES FOR THE FAILURE OF THE PERFORMANCE OF THE NEAR-FIELD COMPONENTS FOR THE DEFECT SCENARIO VARIANTS
Defect Scenario D1
Component Failure Times (y, from time of disposal)
Unsaturated Disposal Zone
Groundwater #1
Saturated, High Flow Rate Disposal Zone
Groundwater #5
Saturated, Medium Flow Rate Disposal Zone
Groundwater #5
Saturated, Low Flow Rate Disposal Zone
Groundwater #6
Start of Failuree
Totally Failedf Start of Failuree
Totally Failedf Start of Failuree
Totally Failedf Start of Failuree
Totally Failedf
Backfill cement grouta 5.00E+4 5.97E+5 5.14E+3 5.17E+3 5.14E+3 8.67E+3 1.64E+4 3.48E+5
Failed stainless steel disposal containerb 0 4.80E+4 0 4.80E+5 0 4.80E+5 0 2.15E+5
Intact stainless steel disposal containersc 4.80E+4 4.80E+4 4.80E+5 4.80E+5 4.80E+5 4.80E+5 2.15E+5 2.15E+5
Containment barrier in failed disposal containera
9.30E+4 6.39E+5 1.84E+4 1.85E+4 1.84E+4 3.10E+4 5.87E+4 1.77E+5
Containment barrier in intact disposal containersa
9.78E+4 6.42E+5 4.82E+5 4.82E+5 4.82E+5 4.83E+5 2.21E+5 3.40E+5
Stainless steel capsule in failed disposal containerd
2.40E+4 2.40E+4 2.40E+5 2.40E+5 2.40E+5 2.40E+5 1.07E+5 1.07E+5
Stainless steel capsule in intact disposal containerc
7.20E+4 7.20E+4 7.20E+5 7.20E+5 7.20E+5 7.20E+5 2.90E+5 2.90E+5
295295295
Defect Scenario D2
Component Failure Times (y, from time of disposal)
Unsaturated Disposal Zone
Groundwater #1
Saturated, High Flow Rate Disposal Zone
Groundwater #5
Saturated, Medium Flow Rate Disposal Zone
Groundwater #5
Saturated, Low Flow Rate Disposal Zone
Groundwater #6
Start of Failuree
Totally Failedf Start of Failuree
Totally Failedf Start of Failuree
Totally Failedf Start of Failuree
Totally Failedf
Backfill cement grouta 5.00E+4 5.97E+5 5.14E+3 5.17E+3 5.14E+3 8.67E+3 1.64E+4 3.48E+5
Stainless steel disposal containers c 4.80E+4 4.80E+4 4.80E+5 4.80E+5 4.80E+5 4.80E+5 2.15E+5 2.15E+5
Containment barrier in disposal containersa 9.78E+4 6.42E+5 4.82E+5 4.82E+5 4.82E+5 4.83E+5 2.21E+5 3.40E+5
Defective stainless steel capsuleg 0 7.20E+4 0 7.20E+5 0 7.20E+5 0 2.9E+5
Intact stainless steel capsulec 7.20E+4 7.20E+4 7.20E+5 7.20E+5 7.20E+5 7.20E+5 2.90E+5 2.90E+5
Defect Scenario D3
Component Failure Times (y, from time of disposal)
Unsaturated Disposal Zone
Groundwater #1
Saturated, High Flow Rate Disposal Zone
Groundwater #5
Saturated, Medium Flow Rate Disposal Zone
Groundwater #5
Saturated, Low Flow Rate Disposal Zone
Groundwater #6
Start of Failuree
Totally Failedf Start of Failuree
Totally Failedf Start of Failuree
Totally Failedf Start of Failuree
Totally Failedf
Backfill Cementh 2.50E+4 2.98E+5 2.57E+2 2.75E+2 2.57E+2 1.64E+3 8.22E+3 1.74E+5
Stainless steel disposal containerc 4.80E+4 4.80E+4 4.80E+5 4.80E+5 4.80E+5 4.80E+5 1.56E+5 1.56E+5
Containment Barrierh 7.29E+4 3.45E+5 4.80E+5 4.80E+5 4.80E+5 4.81E+5 1.59E+5 2.18E+5
Stainless steel capsulec 7.20E+4 7.20E+4 7.20E+5 7.20E+5 7.20E+5 7.20E+5 2.17E+5 2.17E+5
296
Defect Scenario D4
Component Failure Times (y, from time of disposal)
Unsaturated Disposal Zone
Groundwater #1
Saturated, High Flow Rate Disposal Zone
Groundwater #5
Saturated, Medium Flow Rate Disposal Zone
Groundwater #5
Saturated, Low Flow Rate Disposal Zone
Groundwater #6
Start of Failur
ee
Totally Faile
df
Start of Failuree
Totally Failedf Start of Failuree
Totally Failedf Start of Failuree
Totally Failedf
Backfill cement grouta 5.00E+4 5.97E+5 5.14E+3 5.17E+3 5.14E+3 8.67E+3 1.64E+4 3.48E+5
Failed stainless steel disposal containeri 0 4.80E+4 0 4.80E+5 0 4.80E+5 0 2.15E+5
Intact stainless steel disposal containersc 4.80E+4 4.80E+4 4.80E+5 4.80E+5 4.80E+5 4.80E+5 2.15E+5 2.15E+5
Containment barrier in failed disposal containera
9.30E+4 6.39E+5 1.84E+4 1.85E+4 1.84E+4 3.10E+4 5.87E+4 1.77E+5
Containment barrier in intact disposal containersa
9.78E+4 6.42E+5 4.82E+5 4.82E+5 4.82E+5 4.83E+5 2.21E+5 3.40E+5
Failed stainless steel capsule in failed disposal containeri
0 2.40E+4 0 2.40E+5 0 2.40E+5 0 1.07E+5
Stainless steel capsule in intact disposal containerc
7.20E+4 7.20E+4 7.20E+5 7.20E+5 7.20E+5 7.20E+5 2.90E+5 2.90E+5
297297297
Notes: a Data derived from Table H.1.
b Assumes that one container has a defective weld. In light of the discussion in Appendix I, it is assumed that the defective container fails due to general corrosion rather than
localized corrosion.
c Data taken from Table 52.
d Early failure of disposal container only affects failure time of capsule in that container.
e Represents start of degradation for cement grout (i.e. end of Stage 2/start of Stage 3).
f Represents end of degradation for cement grout (i.e. end of Stage 3/start of Stage 4).
g Assumes that one capsule has a defective weld. It is assumed that the defective weld allows access to 10% of the waste once the disposal container has failed. In light of the
discussion in Appendix I, it is assumed that the defective capsule fails due to general corrosion rather than localized corrosion. It is assumed that, once the defective capsule fails, there
is a ramp up to 100% of the waste being available. Note that although the defective capsule is assumed to have failed at t=0, no releases of radionuclides occur until the waste container
is breached.
h Data derived from Table H.2.
i Assumes that one capsule has a defective weld and this is contained in a disposal container that also has a defective weld. It is assumed that the defective weld in the capsule
allows access to 10% of the waste. In light of the discussion in Appendix I, it is assumed that the defective capsule and container fail due to general corrosion rather than localized
corrosion. It is assumed that, once the defective capsule fails, there is a ramp up to 100% of the waste being available.
298
XII.4. GEOSPHERE ELEMENT-INDEPENDENT DATA
TABLE 77. GEOSPHERE FLOW DATA
Parameter UnitsUnsaturated Geosphere Saturated Geosphere
PorousSystemc
FracturedSysteme Low Flow Medium Flow
High FlowPorous System Fractured System
Hydraulic conductivitya m y-1 -Fracture -
1E-2 1E+1 1E+3Fracture 1E+3
Matrix - Matrix -
Hydraulic gradienta - -Fracture -
1E-2 1E-2 1E-2Fracture 1E-2
Matrix - Matrix -
Percolation ratea m y-1 5E-2Fracture 5E-2
- - -Fracture -
Matrix - Matrix -
Total porosity - 1.5E-1d
Fracture 1.5E-1f
1E-2h 1E-1h 1E-1h
Fracture 1E-1f
Matrix 5E-3f Matrix 5E-3f
Degree of saturation - 3.3E-1d
Fracture 3.3E-1d
1E+0i 1E+0i 1E+0i
Fracture 1E+0i
Matrix 3.3E-1g Matrix 1E+0i
Grain densityb kg m-3 2.65E+3Fracture 2.65E+3
2.65E+3 2.65E+3 2.65E+3Fracture 2.65E+3
Matrix 2.65E+3 Matrix 2.65E+3
299299299
Notes: a Flow in unsaturated zone represented using the percolations rate and so hydraulic conductivity and hydraulic
gradient values do not need to be specified (see Equation and Equation ). Data for the saturated zone is taken from
Table 7 and Section 3.2.1. It is assumed in the fractured high flow rate system that the matrix does not contribute to
flow and so hydraulic conductivity and hydraulic gradient values do not need to be specified.
b Grain density of quartz assumed.
c Applicable to porous low, medium and high flow rate systems.
d Data from Section 3.2.1.
e Only applicable to fractured high flow rate system.
f For fractured system assume fracture porosity to be the same as for the porous system and matrix porosity to be
5E-3 (consistent with Ref. [1]).
g Assumed to be the same as for the fracture.
h Data from Table 8.
i By definition, the degree of saturation in the saturated zone is unity.
Reference for Table 77
[1] ANDERSSON, J., SR 97 Data and Data Uncertainties, Compilation of Data and Data
Uncertainties for Radionuclide Transport Calculations, SKB Technical Report TR-99-09,
Swedish Nuclear Fuel and Waste Management Company, Stockholm (1999).
300
TABLE 78. GEOSPHERE TRANSPORT DATA FOR DISPOSAL IN THE UNSATURATED ZONE
Parameter Units
Low Flow RateSystem Medium Flow Rate System High Flow Rate System
Unsaturated ZoneSaturated
Zone
Unsaturated Zone
Saturated Zone
Porous System Fractured System
Unsaturated ZoneSaturated
Zone
Unsaturated Zone Saturated Zone
Number of compartments - 12b 5g 12b 5j 12b 5j
Fracture 12b Fracture 5j
Matrix 12k Matrix 5k
Length of each compartment in direction of water flow
m 5c 20h 5c 20h 5c 20h
Fracture 5c Fracture 20h
Matrix 5k Matrix 20k
Area of each compartment perpendicular to water flow
m2
Adjacent to
borehole
0.73d
1i
Adjacent to
borehole
0.73d
1i
Adjacent to borehole
0.73d
1i
Fracture adjacent to borehole
0.73d
Fracture 1i
Matrix adjacent to b/h -l
Below borehole
0.79e
Below borehole
0.79e
Below borehole
0.79e
Fracture below borehole
0.79e
Matrix -l
Matrix below borehole
-l
Diffusion length between adjacent compartments
m 5f 20f 5f 20f 5f 20f
Fracture 5f Fracture 20f
Matrix 0.02m Matrix 0.02m
301301301
Area over which diffusion occursa
m2
Adjacent to
borehole
0.73
1
Adjacent to
borehole
0.73
1
Adjacent to borehole
0.73
1
Fracture adjacent to borehole
0.73
Fracture 1Matrix adjacent to borehole (m2
m-3)
0.15n
Below borehole
0.79
Below borehole
0.79
Below borehole
0.79
Fracture below borehole
0.79Matrix
(m2
m-
3)
1nMatrix below borehole (m2
m-3)
0.15n
302
Notes: a Assumed to equal to the area of each compartment perpendicular to water flow.
b Ten compartments used to represent the unsaturated zone adjacent to the disposal (consistent with the number
used for the discretisation of the disposal borehole (Table L.15)) plus two additional compartments used to
represent the 10 m of unsaturated zone between the base of the disposal borehole and the watertable (Section 3.2.1).
c The depth of disposal zone plus underlying unsaturated zone (60 m) divided by the number of compartments in
the unsaturated zone (12).
d Assumes that the unsaturated zone is a circle with a radius of 1 m around the disposal borehole (radius 0.26 m).
Area of unsaturated zone adjacent to the disposal borehole is therefore calculated using π (runsat2 – rbh2) where
runsat is the outer radius of the unsaturated compartment and rbh is the outer radius of the disposal borehole
compartment area.
e Assumes that the unsaturated zone is a circle with a radius of 1 m. Area of unsaturated zone adjacent to the
disposal borehole is therefore calculated using π runsat2 where runsat is the radius of the unsaturated compartment.
f Assumed to be equal to the length of each compartment.
g For a diffusion dominated system (such as the low flow rate system), the error resulting from discretisation into
compartments is equal to the inverse of the number of compartments squared [1]. Thus discretisation of the
saturated geosphere into five compartments between the disposal borehole and the abstraction borehole results in an
error of 4%.
h The distance to the abstraction borehole from the disposal borehole (100 m) divided by the number of
compartments in the saturated zone (5).
i See Table 7.
j For an advection dominated system (such as the medium and high flow rate systems), the number of
compartments should equal the Peclet number divided by two (see Ref. [2]). Peclet number is equal to the distance
from the disposal borehole to the abstraction borehole (100 m – Table 7) divide by the longitudinal dispersion
length (assumed to be 10% (see Ref. [3]) of the distance from the disposal borehole to the abstraction borehole).
k Assumes that each fracture compartment has an associated matrix compartment between which there is a
diffusive flux.
l It is assumed that there is no flow water in the matrix.
m Value taken from Ref. [4] for rock matrix depth.
n Assumes that transverse diffusion occurs from/to fracture into/from rock matrix (see Equation and Equation ).
Values represent the flow wetted surface area per unit volume of rock and are based on data given in Ref. [4] taking
into the assumed degree of saturation (see Table L.18).
References for Table 78
[1] CARSLA, H.S., JAEGER, J,C., Conduction of Heat in Solids, 2nd edn, Oxford University Press
(1959).
[2] PENFOLD, J.S.S., LITTLE, R.H., ROBINSON, P.C., SAVAGE, D., Improved Safety
Assessment Modelling of Immobilised LLW Packages for Disposal, Ontario Power Generation
Technical Report 05386-REP-03469.3-10002-R00, Toronto (2002).
[3] INTERNATIONAL ATOMIC ENERGY AGENCY, Improvement of Safety Assessment
Methodologies for Near Surface Disposal Facilities, Vol. 1: Review and Enhancement of Safety
Assessment Approaches and Tools, IAEA-ISAM-1, IAEA, Vienna (2004).
[4] ANDERSSON, J., SR 97 Data and Data Uncertainties, Compilation of Data and Data
Uncertainties for Radionuclide Transport Calculations, SKB Technical Report TR-99-09,
Swedish Nuclear Fuel and Waste Management Company, Stockholm (1999).
TABLE 79. GEOSPHERE TRANSPORT DATA FOR DISPOSAL IN THE SATURATED ZONE
Parameter UnitsLow Flow
Rate System
Medium Flow Rate
System
High Flow Rate SystemPorous System Fractured System
Number of compartments between the disposal borehole and the abstraction borehole
- 5e 5f 5f
Fracture 5f
Matrix 5g
Length of each compartment in direction of water flowa
m 20 20 20Fracture 20
Matrix 20g
Area of each compartment perpendicular to water flowb
m2 50 50 50
Fracture 50
Matrix-h
Diffusion length between adjacent compartmentsc m 20 20 20
Fracture 20
Matrix 0.02i
Area over which diffusion occursd m2 50 50 50
Fracture 50
Matrix (m2 m-3) 1j
Notes: a The distance to the abstraction borehole from the disposal borehole (100 m) divided by the number of
compartments in the saturated zone (5).
b See Table 8.
c Assumed to be equal to the length of each compartment.
d Assumed to equal to the area of each compartment perpendicular to water flow.
e For a diffusion dominated system (such as the low flow rate system), the error resulting from discretisation into
compartments is equal to the inverse of the number of compartments squared [1]. Thus discretisation into five
compartments results in an error of 4%.
f For an advection dominated system (such as the medium and high flow rate systems), the number of
compartments should equal the Peclet number divided by two (see Ref. [2]). Peclet number is equal to the distance
304
from the disposal borehole to the abstraction borehole (100 m – Table 7) divide by the longitudinal dispersion
length (assumed to be 10% (see Ref. [3]) of the distance from the disposal borehole to the abstraction borehole).
g Assumes that each fracture compartment has an associated matrix compartment between which there is a
diffusive flux.
h It is assumed that there is no flow water in the matrix.
i Value taken from Ref. [4] for rock matrix depth.
j Assumes that transverse diffusion occurs from/to fracture into/from rock matrix (see Equation and Equation ).
Values represent the flow wetted surface area per unit volume of rock and are based on data given in Ref. [4] taking
into the assumed degree of saturation (see Table L.18).
References for Table 79
[1] CARSLAW, H.S., JAEGER, J.C., Conduction of Heat in Solids, 2nd edn, Oxford University
Press (1959).
[2] PENFOLD, J.S.S., LITTLE, R.H., ROBINSON, P.C., SAVAGE, D., Improved Safety
Assessment Modelling of Immobilised LLW Packages for Disposal, Ontario Power Generation
Technical Report 05386-REP-03469.3-10002-R00, Toronto (2002).
[3] INTERNATIONAL ATOMIC ENERGY AGENCY, Improvement of Safety Assessment
Methodologies for Near Surface Disposal Facilities, Vol. 1: Review and Enhancement of Safety
Assessment Approaches and Tools, IAEA-ISAM-1, IAEA, Vienna (2004).
[4] ANDERSSON, J., SR 97 Data and Data Uncertainties, Compilation of Data and Data
Uncertainties for Radionuclide Transport Calculations, SKB Technical Report TR-99-09,
Swedish Nuclear Fuel and Waste Management Company, Stockholm (1999).
TABLE 80. FRACTION OF WATER DEMAND SUPPLIED BY CONTAMINATED WATER FOR
DIFFERENT GEOSPHERES AND CALCULATION CASES
Geosphere
Drinking Water Only Calculation
Case
All Other Cases
Location of Disposal Zone Location of Disposal Zone
Unsaturated Zonea Saturated Zonea Unsaturated Zoneb Saturated Zoneb
305305305
High flow rate system: porous system 1.00E+0 1.00E+0 3.76E-2 1.00E+0
High flow rate system: fractured system 1.00E+0 1.00E+0 3.76E-2 1.00E+0
Medium flow rate system 3.42E-2 1.00E+0 3.76E-4 1.88E-2
Low flow rate system 3.42E-4 1.71E-3 3.76E-6 1.88E-5
Notes: a The minimum value of unity and the result of dividing the water flux, in which the contaminated plume is
mixed (given in Table 7), by the assumed drinking water abstraction rate (2.92 m3 y-1) (2 l d-1 per person).
b Data from Table 7.
XII.5. BIOSPHERE ELEMENT-INDEPENDENT DATA
TABLE 81. BIOSPHERE COMPARTMENT PARAMETERS AND PROCESSES
Parameter UnitsExposure Group: Farmer House Dwelleri Site Dweller
Compartment: Surface Soil House Surface SoilDepth m 2.5E-1a 2.4E+0j 2.5E-1a
Length m 3.51E+1b 3.0E+0j 3.51E+1b
Width m 1E+1b 4.0E+0j 1E+1b
Total porosity - 3E-1a - 3E-1a
Degree of saturation - 3.3E-1c - 3.3E-1c
Grain density kg m-3 2.65E+3d - 2.65E+3d
Percolation rate m y-1 5E-2c - 5E-2c
Inhalable dust concentration kg m-3 2E-8a - 2E-8a
Erosion rate m y-1 3E-4e - 3E-4e
Volume of irrigation water that reaches the soil m3 y-1 71f - -l
Volume of non-irrigation water plus irrigation water intercepted by crops
m3 y-1 195g -l
Ventilation rate y-1 -h 2.2E+3k -h
Effective diffusion of Rn m2 y-1 -h - -h
Total porosity of the base of the house
- -h - -h
Notes: a Data taken from Ref. [1].
b An area of 351 m2 is required to grow root and green vegetables to meet the assumed demand of an exposure
group of four people (Table L.23), assuming the yields given in Table L.24. Assuming a nominal width of 10 m,
the length is therefore 35.1 m.
c See Section 3.2.1.
d Grain density of quartz.
e See Section 3.3.
306
f Value derived by multiplying the depth of irrigation water applied to root and green vegetables (Table L.24),
the area of root and green vegetables required to meet the assumed demand of an exposure group of four people
(Table L.23) (assuming the yields given in Table L.24), and unity minus the interception fraction for irrigation
water (Table L.24).
g Value derived by summing the volume of water intercepted by crops and the volume of water required by cows
and humans. The volume of water intercepted by crops is calculated by multiplying the depth of irrigation water
applied to root and green vegetables (Table L.24), the area of root and green vegetables required to meet the
assumed demand of an exposure group of four people (Table L.23) (assuming the yields given in Table L.24), and
the interception fraction for irrigation water (Table L.24). The volume of water required by cows is calculated by
multiplying the number of cows (i.e. four) required to meet the assumed meet and milk demands of an exposure
group of four people (Table L.23) by the annual water consumption rate of cows (derived from the daily rate given
in Table L.24). The volume of water required by humans is calculated by multiplying the number of humans in the
exposure group (i.e. four) by the annual water consumption rate of humans (Table L.23).
h Not relevant for soil compartment.
i Only exposed through inhalation of radioactive gases released to a house (see Section 4.2.1) and so, from a
biosphere perspective, only need to consider volume and ventilation rate of house (Equation and Equation ).
j Values taken from Ref. [2].
k Value taken from Ref. [3] for a modern, well insulated building.
l Does not use contaminated water.
References for Table 81
[1] INTERNATIONAL ATOMIC ENERGY AGENCY, The Use of Safety Assessment in the
Derivation of Activity Limits for Disposal of Radioactive Waste to Near Surface Facilities,
IAEA-TECDOC-1380, IAEA, Vienna (2003).
[2] LITTLE R.H., VAN BLERK, J., WALKE R.C., BOWDEN R.A., Generic Post-Closure Safety
Assessment and Derivation of Activity Limits for the Borehole Disposal Concept, Quintessa
Report QRS-1128A-6 v2.0, Quintessa Limited, Henley-on-Thames, UK (2004).
[3] BRITISH NUCLEAR FUELS Plc, Drigg Post-Closure Safety Case, Sellafield, UK (2002).
TABLE 82. HUMAN BEHAVIOUR PARAMETERS
Exposure Mechanism UnitsExposure Group
Farmer House Dweller Site Dwellerf
Ingestion Contaminated drinking water m3 y-1 0.73a - -
Contaminated root vegetables kg fw y-1 235b - 235b
307307307
Exposure Mechanism UnitsExposure Group
Farmer House Dweller Site Dwellerf
Contaminated green vegetables kg fw y-1 62b - 62b
Contaminated beef kg fw y-1 95b -
Contaminated cow’s milk kg fw y-1 300b - -
Contaminated soil kg fw h-1 1.5E-5c - -
Contaminated fish kg fw y-1 6.9d - -
InhalationContaminated outdoor air m3 h-1 1b - 1b
Contaminated indoor air m3 h-1 - 0.75b -
Occupancy
Time spent on contaminated soil h y-1 2192b - 2192b
Time spent in contaminated building h y-1 - 6575b -
Time spent in contaminated water h y-1 365e - -
Notes: a See Section 3.3.
b Data taken from Ref. [1].
c Data taken from Ref. [2] assuming that the annual value quoted in Ref. [2] results from an exposure to
contaminated soil of 8 hours per day.
d Data taken from Ref. [3]. Ingestion of fish only considered for the variant calculation that assumes
contaminated groundwater is used to supply a fish farm.
e Assumes 1 h d-1. Only considered for the variant calculation that assumes contaminated groundwater is used for
bathing.
f Only exposed through growing crops on contaminated soil due to erosion of closure zone.
References for Table 82
[1] INTERNATIONAL ATOMIC ENERGY AGENCY, The Use of Safety Assessment in the
Derivation of Activity Limits for Disposal of Radioactive Waste to Near Surface Facilities,
IAEA-TECDOC-1380, IAEA, Vienna (2003).
[2] YU, C., et al., Data Collection Handbook to Support Modelling the Impacts of Radioactive
Material in Soil, Argonne National Laboratory, Report ANL/EA15-8, Argonne, IL (1993).
[3] INTERNATIONAL ATOMIC ENERGY AGENCY, “Reference Biospheres” for Solid
Radioactive Waste Disposal, Report of BIOMASS Theme 1 of the BIOsphere Modelling and
ASSessment (BIOMASS) Programme, IAEA-BIOMASS-6, IAEA, Vienna (2003).
TABLE 83. NON-ELEMENT DEPENDENT PLANT PARAMETERS
308
Parameter Units Root Vegetables
Green Vegetables
Soil contamination of crop kg dw soil/kg fw cropa 1.5E-4 1.0E-4Yield of crop kg fw m-2 y-1 b 3.5E+0 3.0E+0Depth of irrigation water applied to
crop m y-1 b,c 3.0E-1 3.0E-1
Interception fraction for irrigation water -b,c 3.3E-1 3.3E-1
Time interval between irrigation and harvesting yc,d 4.0E-2 2.E-2
Notes: a Data taken from Ref. [1].
a Data taken from Ref. [2].
c Irrigation of crop with contaminated water only considered for the liquid release calculation cases.
d Data taken from Ref. [3].
References for Table 83
[1] LITTLE, R.H., VAN BLERK, J., WALKE, R.C., BOWDEN, R.A., Generic Post-Closure
Safety Assessment and Derivation of Activity Limits for the Borehole Disposal Concept,
Quintessa Report QRS-1128A-6 v2.0, Quintessa Limited, Henley-on-Thames (2004).
[2] INTERNATIONAL ATOMIC ENERGY AGENCY, The Use of Safety Assessment in the
Derivation of Activity Limits for Disposal of Radioactive Waste to Near Surface Facilities,
IAEA-TECDOC-1380, IAEA, Vienna (2003).
[3] INTERNATIONAL ATOMIC ENERGY AGENCY, “Reference Biospheres” for Solid
Radioactive Waste Disposal, Report of BIOMASS Theme 1 of the BIOsphere Modelling and
ASSessment (BIOMASS) Programme, IAEA-BIOMASS-6, IAEA, Vienna (2003).
TABLE 84. NON-ELEMENT DEPENDENT ANIMAL PARAMETERS
Parameter Units Cows
Consumption of water m3 d-1 6E-2a
Note: a Data taken from Ref. [1].
Reference for Table 84
309309309
[1] INTERNATIONAL ATOMIC ENERGY AGENCY, The Use of Safety Assessment in the
Derivation of Activity Limits for Disposal of Radioactive Waste to Near Surface Facilities,
IAEA-TECDOC-1380, IAEA, Vienna (2003).
310
Appendix XIIIASSESSMENT RESULTS
TABLE 85. TOTAL ACTIVITY LEVELS FOR LIQUID RELEASE FOR THE DESIGN SCENARIO
Near Field Saturated Geosphere Total Activity Level (Bq)
Disposal Zone
Flow Rate
Flow Type H-3 Co-60 Ni-63 Kr-85 Sr-90 Cs-137 Pb-210 Ra-226 Pu-238 Pu-239 Am-241
Unsaturated
HighPorous * * * * * * * * 1E+14 9E+13 9E+13
Fractured * * * * * * * * * 3E+16 5E+15
Medium Porous * * * * * * * * 3E+15 9E+13 3E+14
Low Porous * * * * * * * * * 9E+16 *
Saturated
HighPorous * * * * * * * * 4E+12 9E+13 5E+12
Fractured * * * * * * * * 3E+14 8E+15 2E+14
Medium Porous * * * * * * * * 2E+15 7E+14 5E+14
Low Porous * * * * * * * * * * *
* denotes a total activity level that is greater than 1 x 10¹⁸ Bq.
311311311
TABLE 86. PER PACKAGE ACTIVITY LEVELS FOR LIQUID RELEASE FOR THE DESIGN SCENARIO
Near Field Saturated Geosphere Per Package Activity Level (Bq)
Disposal Zone
Flow Rate Flow Type H-3 Co-60 Ni-63 Kr-85 Sr-90 Cs-137 Pb-210 Ra-226 Pu-238 Pu-239 Am-241
Unsaturated
HighPorous * * * * * * * * 2E+12 2E+12 2E+12
Fractured * * * * * * * * * 6E+14 4E+14
Medium Porous * * * * * * * * 6E+13 2E+12 5E+12
Low Porous * * * * * * * * * 2E+15 *
Saturated
HighPorous * * * * * * * * 9E+10 2E+12 1E+11
Fractured * * * * * * * * 5E+12 2E+14 5E+12
Medium Porous * * * * * * * * 3E+13 1E+13 1E+13
Low Porous * * * * * * * * * * *
* denotes a per package activity level that is greater than 2 x 10¹⁶ Bq.
TABLE 87. TOTAL ACTIVITY LEVELS FOR GASEOUS RELEASE FOR THE DESIGN SCENARIO
Total Activity Level (Bq)
H-3 Co-60 Ni-63 Kr-85 Sr-90 Cs-137 Pb-210 Ra-226 Pu-238 Pu-239 Am-241
* n.a. n.a. * n.a. n.a. n.a. * * n.a. n.a.
* denotes a total activity level that is greater than 1 x 10¹⁸ Bq.
TABLE 88. PER PACKAGE ACTIVITY LEVELS FOR GASEOUS RELEASE FOR THE DESIGN SCENARIO
Per Package Activity Level (Bq)
H-3 Co-60 Ni-63 Kr-85 Sr-90 Cs-137 Pb-210 Ra-226 Pu-238 Pu-239 Am-241
312
* n.a. n.a. * n.a. n.a. n.a. * * n.a. n.a.
* denotes a per package activity level that is greater than 2 x 10¹⁶ Bq.
TABLE 89. TOTAL ACTIVITY LEVELS FOR SOLID RELEASE FOR THE DESIGN SCENARIO
Total Activity Level (Bq)
H-3 Co-60 Ni-63 Kr-85 Sr-90 Cs-137 Pb-210 Ra-226 Pu-238 Pu-239 Am-241
* * * * * * * * 2E+12 5E+11 4E+13
* denotes a total activity level that is greater than 1 x 10¹⁸ Bq.
TABLE 90. PER PACKAGE ACTIVITY LEVELS FOR SOLID RELEASE FOR THE DESIGN SCENARIO
Per Package Activity Level (Bq)
H-3 Co-60 Ni-63 Kr-85 Sr-90 Cs-137 Pb-210 Ra-226 Pu-238 Pu-239 Am-241
* * * * * * * * 4E+10 1E+10 9E+11
* denotes a per package activity level that is greater than 2 x 10¹⁶ Bq.
TABLE 91. TOTAL ACTIVITY LEVELS FOR LIQUID RELEASE FOR DEFECT SCENARIO D1
Near Field Saturated Geosphere Total Activity Level (Bq)
Disposal Zone
Flow Rate Flow Type H-3 Co-60 Ni-63 Kr-85 Sr-90 Cs-137 Pb-210 Ra-226 Pu-238 Pu-239 Am-241
UnsaturatedHigh
Porous * * * * * * * * 6E+13 9E+13 5E+13
Fractured * * * * * * * * 5E+17 3E+16 6E+15
Medium Porous * * * * * * * * 2E+15 1E+14 3E+14
313313313
Low Porous * * * * * * * * * 9E+16 *
Saturated
HighPorous * * * * * * * * 4E+12 9E+13 6E+12
Fractured * * * * * * * * 3E+14 8E+15 2E+14
Medium Porous * * * * * * * * 2E+15 7E+14 5E+14
Low Porous * * * * * * * * * * *
* denotes a total activity level that is greater than 1 x 10¹⁸ Bq.
314
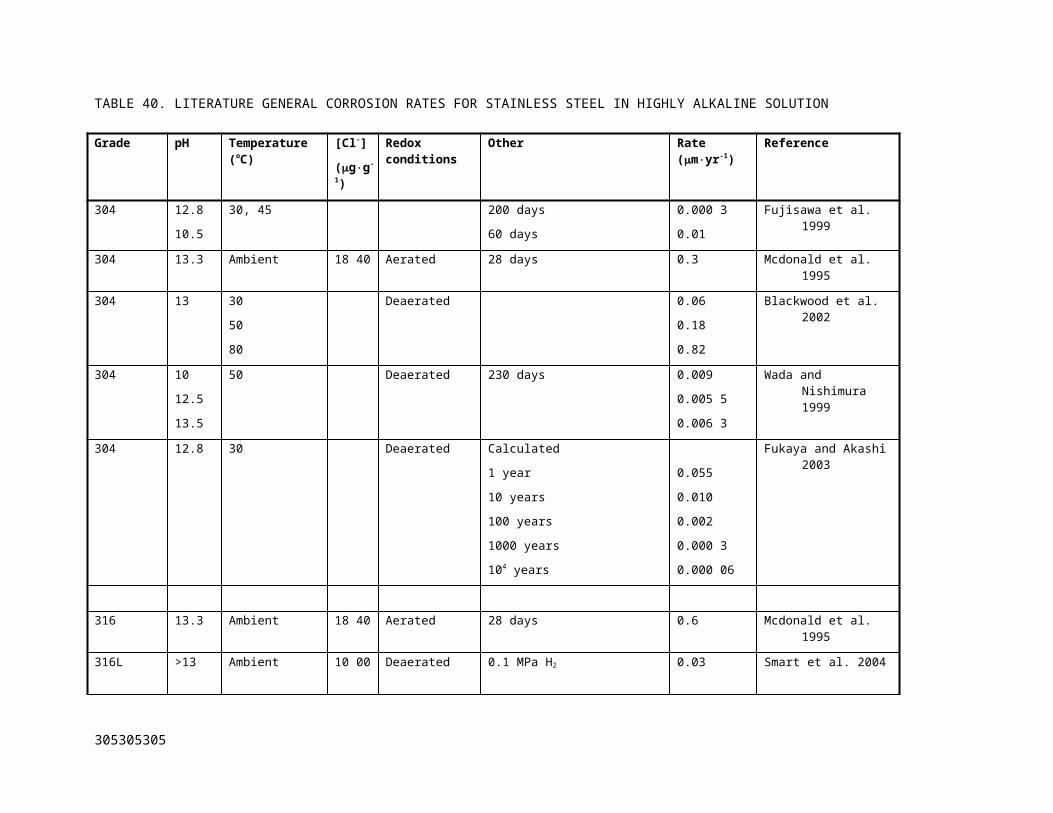
TABLE 92. PER PACKAGE ACTIVITY LEVELS FOR LIQUID RELEASE FOR DEFECT SCENARIO D1
Near Field Saturated Geosphere Per Package Activity Level (Bq)
Disposal Zone
Flow Rate Flow Type H-3 Co-60 Ni-63 Kr-85 Sr-90 Cs-137 Pb-210 Ra-226 Pu-238 Pu-239 Am-241
Unsaturated
HighPorous * * * * * * * * 1E+12 2E+12 1E+12
Fractured * * * * * * * * 1E+16 7E+14 1E+14
Medium Porous * * * * * * * * 4E+13 2E+12 5E+12
Low Porous * * * * * * * * * 2E+15 *
Saturated
HighPorous * * * * * * * * 9E+10 2E+12 1E+11
Fractured * * * * * * * * 5E+12 2E+14 5E+12
Medium Porous * * * * * * * * 3E+13 1E+13 1E+13
Low Porous * * * * * * * * * * *
* denotes a per package activity level that is greater than 2 x 10¹⁶ Bq.
315315315

TABLE 93. TOTAL ACTIVITY LEVELS FOR LIQUID RELEASE FOR DEFECT SCENARIO D2
Near Field Saturated Geosphere Total Activity Level (Bq)
Disposal Zone
Flow Rate Flow Type H-3 Co-60 Ni-63 Kr-85 Sr-90 Cs-137 Pb-210 Ra-226 Pu-238 Pu-239 Am-241
Unsaturated
HighPorous * * * * * * * * 6E+13 9E+13 3E+13
Fractured * * * * * * * * 2E+17 3E+16 6E+15
Medium Porous * * * * * * * * 2E+15 1E+14 3E+14
Low Porous * * * * * * * * * 9E+16 *
Saturated
HighPorous * * * * * * * * 4E+12 9E+13 6E+12
Fractured * * * * * * * * 3E+14 8E+15 2E+14
Medium Porous * * * * * * * * 2E+15 7E+14 5E+14Low Porous * * * * * * * * * * *
* denotes a total activity level that is greater than 1 x 10¹⁸ Bq.
316
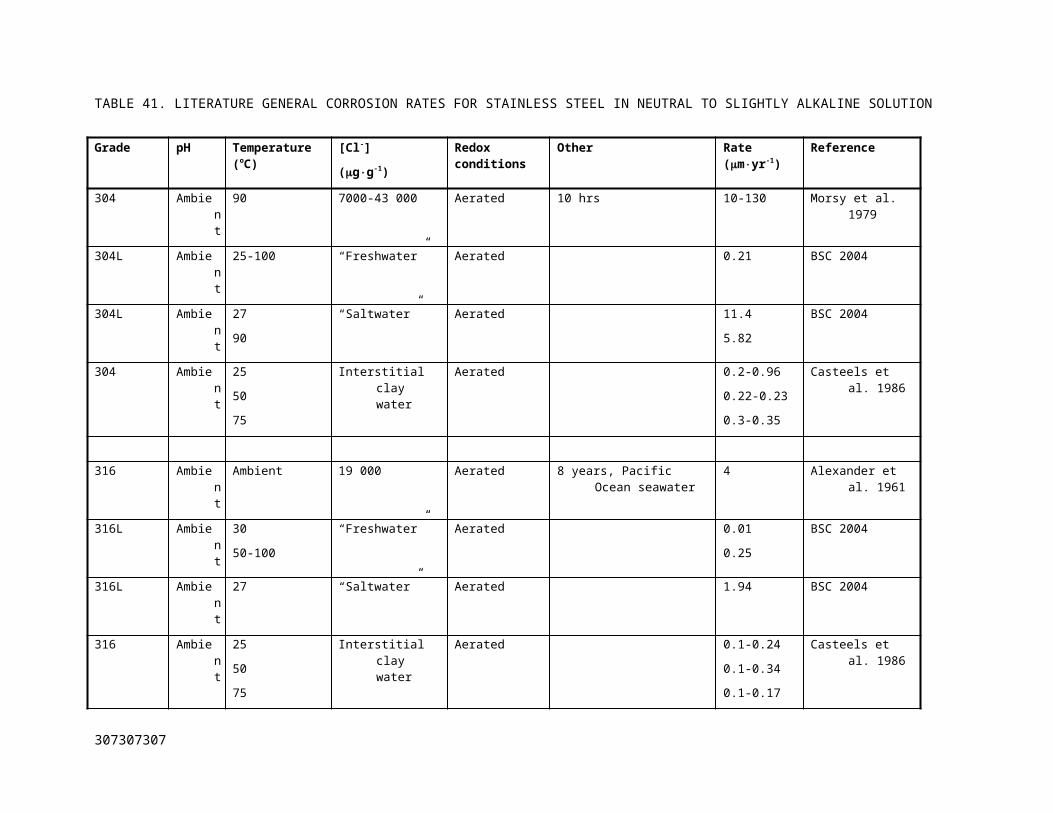
TABLE 94. PER PACKAGE ACTIVITY LEVELS FOR LIQUID RELEASE FOR DEFECT SCENARIO D2
Near Field Saturated Geosphere Per Package Activity Level (Bq)
Disposal Zone
Flow Rate Flow Type H-3 Co-60 Ni-63 Kr-85 Sr-90 Cs-137 Pb-210 Ra-226 Pu-238 Pu-239 Am-241
Unsaturated
HighPorous * * * * * * * * 1E+12 2E+12 7E+11
Fractured * * * * * * * * 4E+15 7E+14 1E+14
Medium Porous * * * * * * * * 9E+13 2E+12 1E+13
Low Porous * * * * * * * * * 2E+15 *
Saturated
HighPorous * * * * * * * * 9E+10 2E+12 1E+11
Fractured * * * * * * * * 5E+12 2E+14 5E+12
Medium Porous * * * * * * * * 3E+13 1E+13 1E+13
Low Porous * * * * * * * * * * *
* denotes a per package activity level that is greater than 2 x 10¹⁶ Bq.
317317317
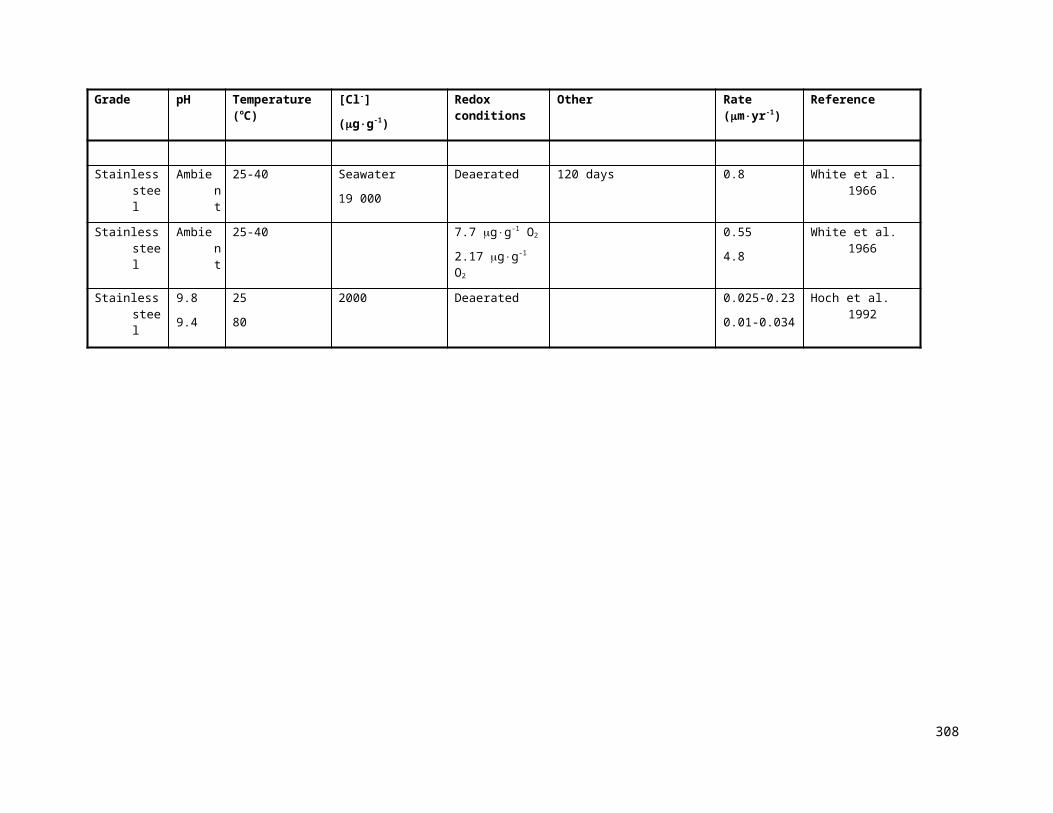
TABLE 95. TOTAL ACTIVITY LEVELS FOR LIQUID RELEASE FOR DEFECT SCENARIO D3
Near Field Saturated Geosphere Total Activity Level (Bq)
Disposal Zone
Flow Rate Flow Type H-3 Co-60 Ni-63 Kr-85 Sr-90 Cs-137 Pb-210 Ra-226 Pu-238 Pu-239 Am-241
Unsaturated
HighPorous * * * * * * * * 1E+14 9E+13 4E+13
Fractured * * * * * * * * * 3E+16 6E+15
Medium Porous * * * * * * * * 3E+15 1E+14 3E+14
Low Porous * * * * * * * * * 1E+17 *
Saturated
HighPorous * * * * * * * * 4E+12 9E+13 3E+12
Fractured * * * * * * * * 3E+14 8E+15 1E+14
Medium Porous * * * * * * * * 2E+15 7E+14 3E+14
Low Porous * * * * * * * * * * *
* denotes a total activity level that is greater than 1 x 10¹⁸ Bq.
318
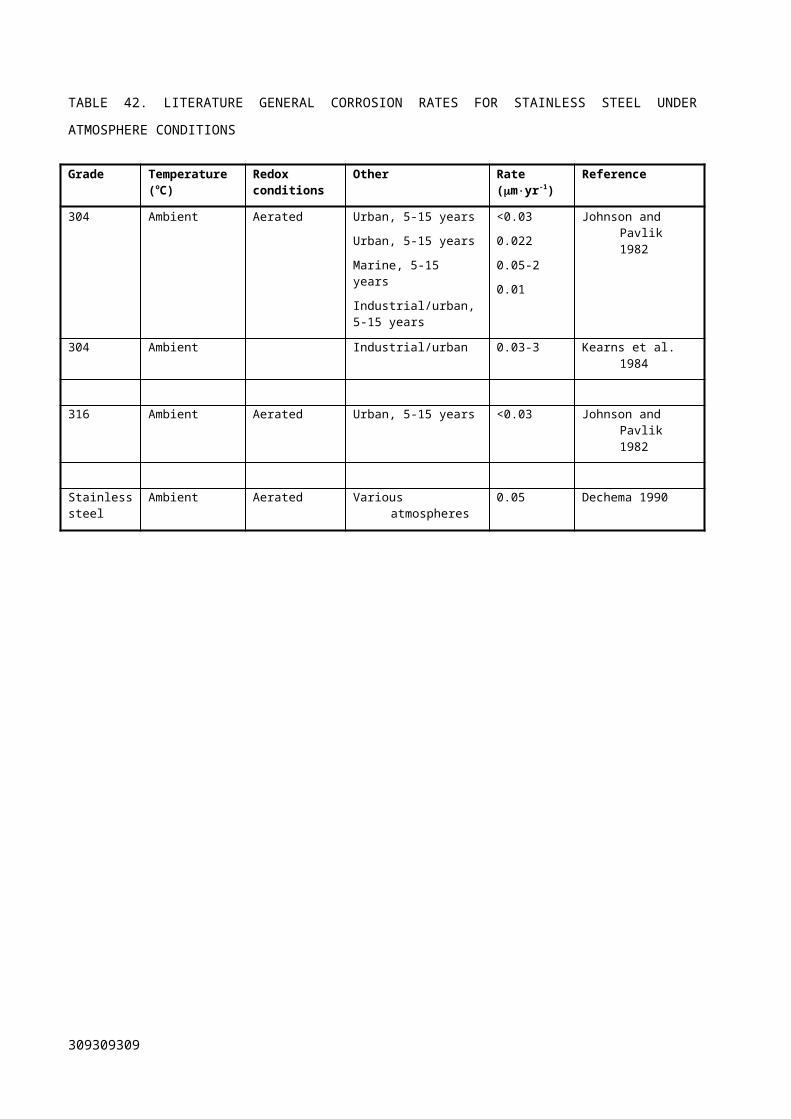
TABLE 96. PER PACKAGE ACTIVITY LEVELS FOR LIQUID RELEASE FOR DEFECT SCENARIO D3
Near Field Saturated Geosphere Per Package Activity Level (Bq)
Disposal Zone
Flow Rate Flow Type H-3 Co-60 Ni-63 Kr-85 Sr-90 Cs-137 Pb-210 Ra-226 Pu-238 Pu-239 Am-241
Unsaturated
HighPorous * * * * * * * * 2E+12 2E+12 9E+11
Fractured * * * * * * * * 5E+16 7E+14 1E+14
Medium Porous * * * * * * * * 7E+13 2E+12 5E+12
Low Porous * * * * * * * * * 2E+15 *
Saturated
HighPorous * * * * * * * * 9E+10 2E+12 5E+10
Fractured * * * * * * * * 5E+12 2E+14 2E+12
Medium Porous * * * * * * * * 3E+13 1E+13 5E+12
Low Porous * * * * * * * * * * *
* denotes a per package activity level that is greater than 2 x 10¹⁶ Bq.
319319319

TABLE 97. TOTAL ACTIVITY LEVELS FOR LIQUID RELEASE FOR DEFECT SCENARIO D4
Near Field Saturated Geosphere Total Activity Level (Bq)
Disposal Zone
Flow Rate Flow Type H-3 Co-60 Ni-63 Kr-85 Sr-90 Cs-137 Pb-210 Ra-226 Pu-238 Pu-239 Am-241
Unsaturated
HighPorous * * * * * * * * 6E+13 9E+13 5E+13
Fractured * * * * * * * * 5E+17 3E+16 6E+15
Medium Porous * * * * * * * * 2E+15 1E+14 3E+14
Low Porous * * * * * * * * * 9E+16 *
Saturated
HighPorous * * * * * * * * 4E+12 9E+13 6E+12
Fractured * * * * * * * * 3E+14 8E+15 2E+14
Medium Porous * * * * * * * * 2E+15 7E+14 5E+14
Low Porous * * * * * * * * * * *
* denotes a total activity level that is greater than 1 x 10¹⁸ Bq.
320
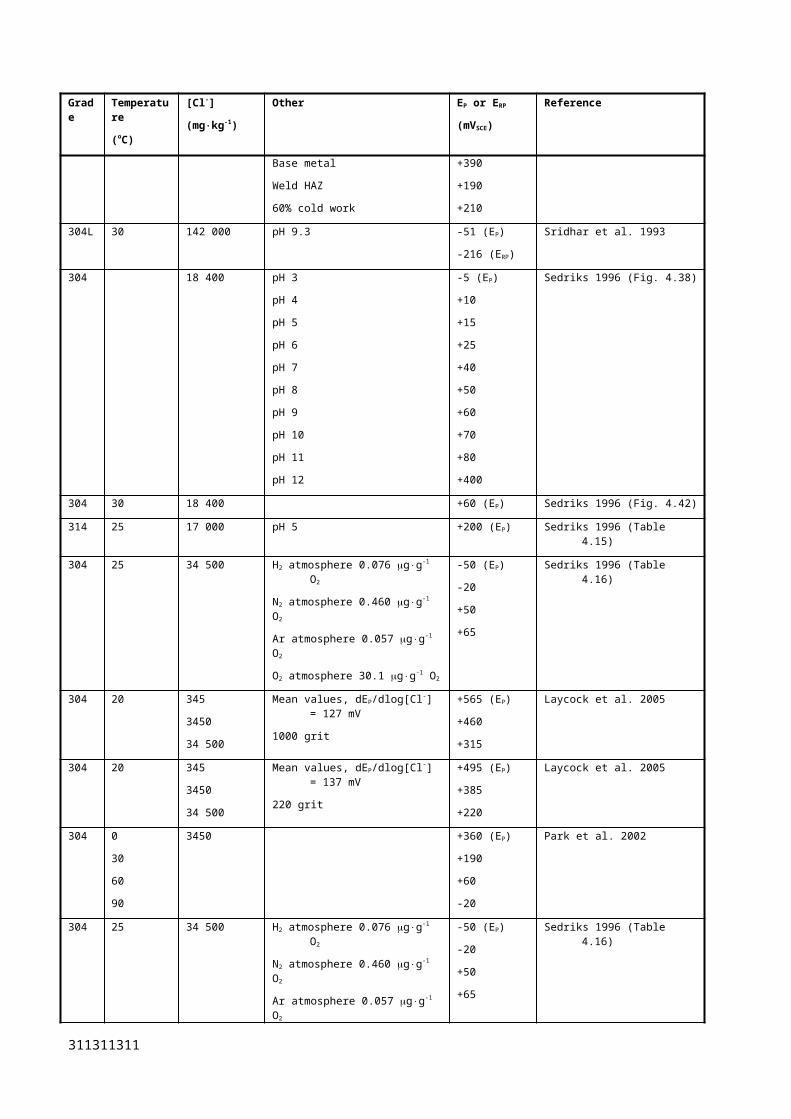
TABLE 98. PER PACKAGE ACTIVITY LEVELS FOR LIQUID RELEASE FOR DEFECT SCENARIO D4
Near Field Saturated Geosphere Per Package Activity Level (Bq)
Disposal Zone
Flow Rate Flow Type H-3 Co-60 Ni-63 Kr-85 Sr-90 Cs-137 Pb-210 Ra-226 Pu-238 Pu-239 Am-241
Unsaturated
HighPorous * * * * * * * * 1E+12 2E+12 1E+12
Fractured * * * * * * * * 1E+16 7E+14 1E+14
Medium Porous * * * * * * * * 4E+13 2E+12 5E+12
Low Porous * * * * * * * * * 2E+15 *
Saturated
HighPorous * * * * * * * * 9E+10 2E+12 1E+11
Fractured * * * * * * * * 5E+12 2E+14 5E+12
Medium Porous * * * * * * * * 3E+13 1E+13 1E+13
Low Porous * * * * * * * * * * *
* denotes a per package activity level that is greater than 2 x 10¹⁶ Bq.
TABLE 99. TOTAL ACTIVITY LEVELS FOR GASEOUS RELEASE FOR DEFECT SCENARIO D421
Total Activity Level (Bq)
H-3 Co-60 Ni-63 Kr-85 Sr-90 Cs-137 Pb-210 Ra-226 Pu-238 Pu-239 Am-241
6E+1222 n.a. n.a. 1E+14 n.a. n.a. n.a. * * n.a. n.a.
* denotes a total activity level that is greater than 1 x 10¹⁸ Bq.
21 Total activity levels for Defect Scenario D1, D2 and D3 are greater than 1E+18 Bq for all gases and so tables are not provided.
22 Only applicable to unsaturated disposal zone. H-3 in saturated disposal zone is assumed to be dissolved in the groundwater.
321321321
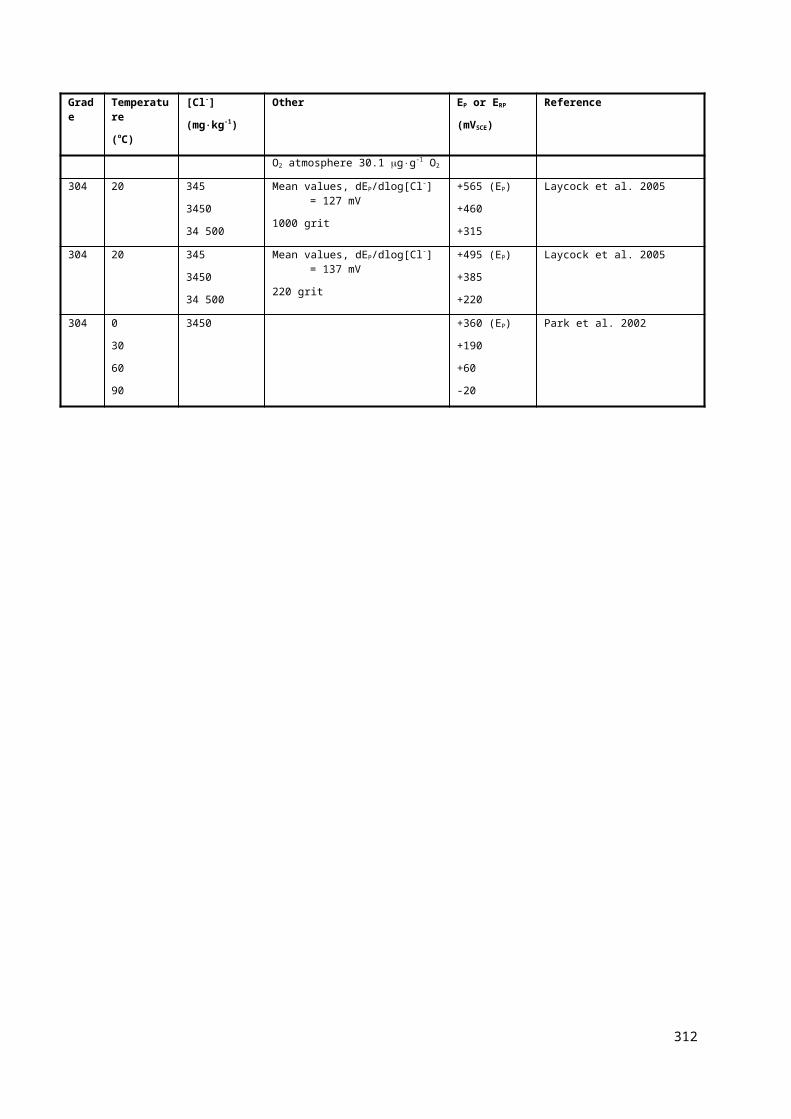
TABLE 100. PER PACKAGE ACTIVITY LEVELS FOR GASEOUS RELEASE FOR DEFECT SCENARIO D423
Per Package Activity Level (Bq)
H-3 Co-60 Ni-63 Kr-85 Sr-90 Cs-137 Pb-210 Ra-226 Pu-238 Pu-239 Am-241
1E+11 21 n.a. n.a. 2E+12 n.a. n.a. n.a. * * n.a. n.a.
* denotes a per package activity level that is greater than 2 x 10¹⁶ Bq.
23 Per package activity levels for Defect Scenario D1, D2 and D3 are greater than 2E+16 Bq for all gases and so tables are not provided.
322
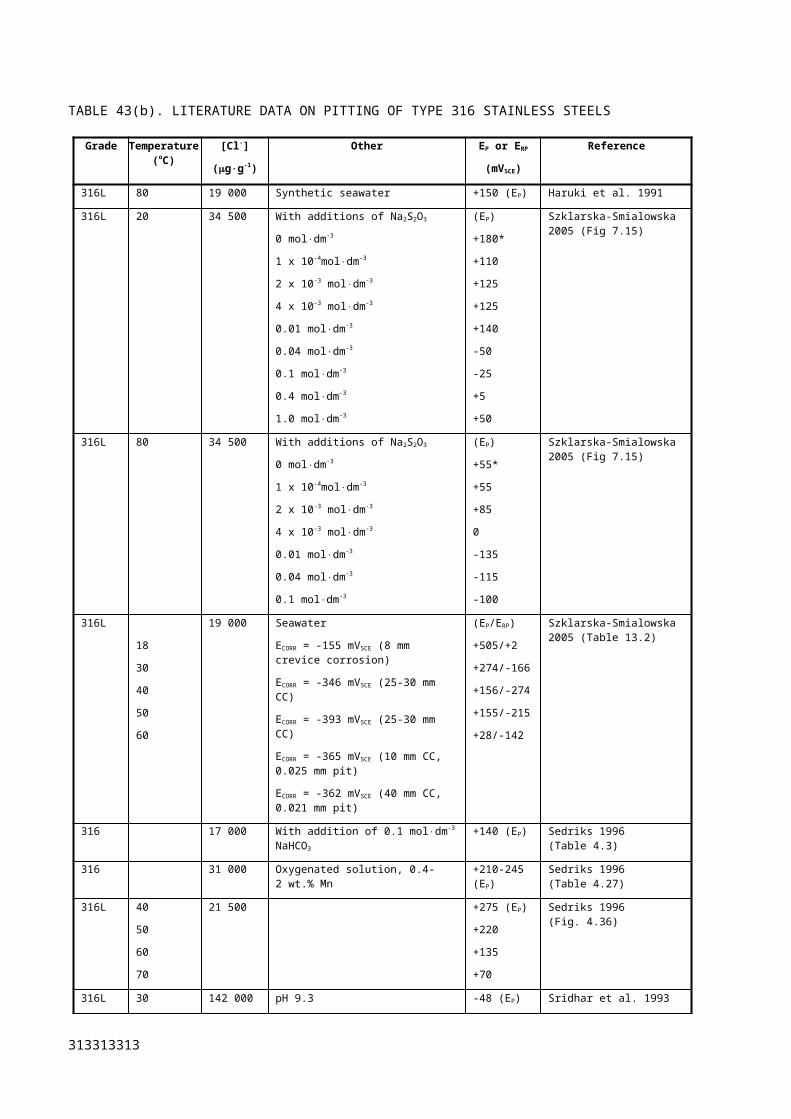
TABLE 101. TOTAL ACTIVITY LEVELS FOR LIQUID RELEASE FOR VARIANT CALCULATION WITH NO CONGRUENT RELEASE
Near Field Saturated Geosphere Total Activity Level (Bq)
Disposal Zone
Flow Rate Flow Type H-3 Co-60 Ni-63 Kr-85 Sr-90 Cs-137 Pb-210 Ra-226 Pu-238 Pu-239 Am-241
Unsaturated
HighPorous * * * * * * * * 7E+14 1E+15 9E+13
Fractured * * * * * * * * * 3E+17 5E+15
Medium Porous * * * * * * * * 2E+16 1E+15 3E+14
Low Porous * * * * * * * * * 9E+17 *
Saturated
HighPorous
* * * * * * * * 6E+12 1E+14 5E+12
Fractured * * * * * * * * 2E+14 8E+16 2E+14
Medium Porous * * * * * * * * 1E+16 7E+15 5E+14
Low Porous * * * * * * * * * * *
* denotes a per package activity level that is greater than 1 x 10¹⁸ Bq.
TABLE 102. PER PACKAGE ACTIVITY LEVELS FOR LIQUID RELEASE FOR VARIANT CALCULATION WITH NO CONGRUENT RELEASE
Near Field Saturated Geosphere Per Package Activity Level (Bq)
Disposal Zone
Flow Rate Flow Type H-3 Co-60 Ni-63 Kr-85 Sr-90 Cs-137 Pb-210 Ra-226 Pu-238 Pu-239 Am-241
Unsaturated
HighPorous * * * * * * * * 1E+13 2E+13 2E+12
Fractured * * * * * * * * * 6E+15 1E+14
Medium Porous * * * * * * * * 5E+14 2E+13 5E+12
Low Porous * * * * * * * * * 2E+16 *
Saturated High Porous * * * * * * * * 1E+11 2E+12 1E+11
323323323
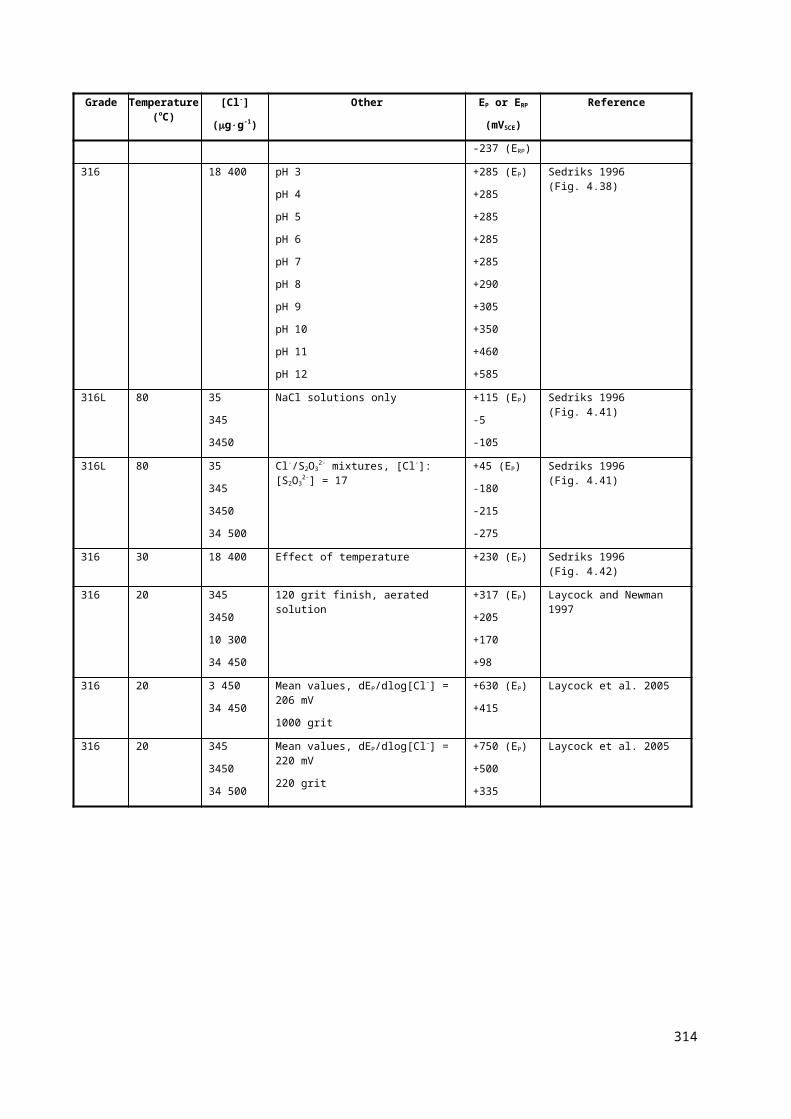
Fractured* * * * * * * * 4E+12 2E+15 5E+12
Medium Porous* * * * * * * * 3E+14 1E+14 1E+13
Low Porous * * * * * * * * * * *
* denotes a per package activity level that is greater than 2 x 10¹⁶ Bq.
TABLE 103. TOTAL ACTIVITY LEVELS FOR LIQUID RELEASE FOR VARIANT CALCULATION WITH FASTER CEMENT GROUT DEGRADATION (X10
FASTER THAN DESIGN)
Near Field Saturated Geosphere Total Activity Level (Bq)
Disposal Zone
Flow Rate Flow Type H-3 Co-60 Ni-63 Kr-85 Sr-90 Cs-137 Pb-210 Ra-226 Pu-238 Pu-239 Am-241
Unsaturated
HighPorous * * * * * * * * 7E+13 9E+13 6E+13
Fractured * * * * * * * * * 3E+16 5E+15
Medium Porous * * * * * * * * 2E+15 9E+13 2E+14
Low Porous * * * * * * * * * 9E+16 *
Saturated
High
Porous* * * * * * * * 4E+12 9E+13 5E+12
Fractured* * * * * * * * 3E+14 8E+15 2E+14
Medium Porous* * * * * * * * 2E+15 7E+14 5E+14
Low Porous * * * * * * * * * * *
* denotes a total activity level that is greater than 1 x 10¹⁸ Bq.
324
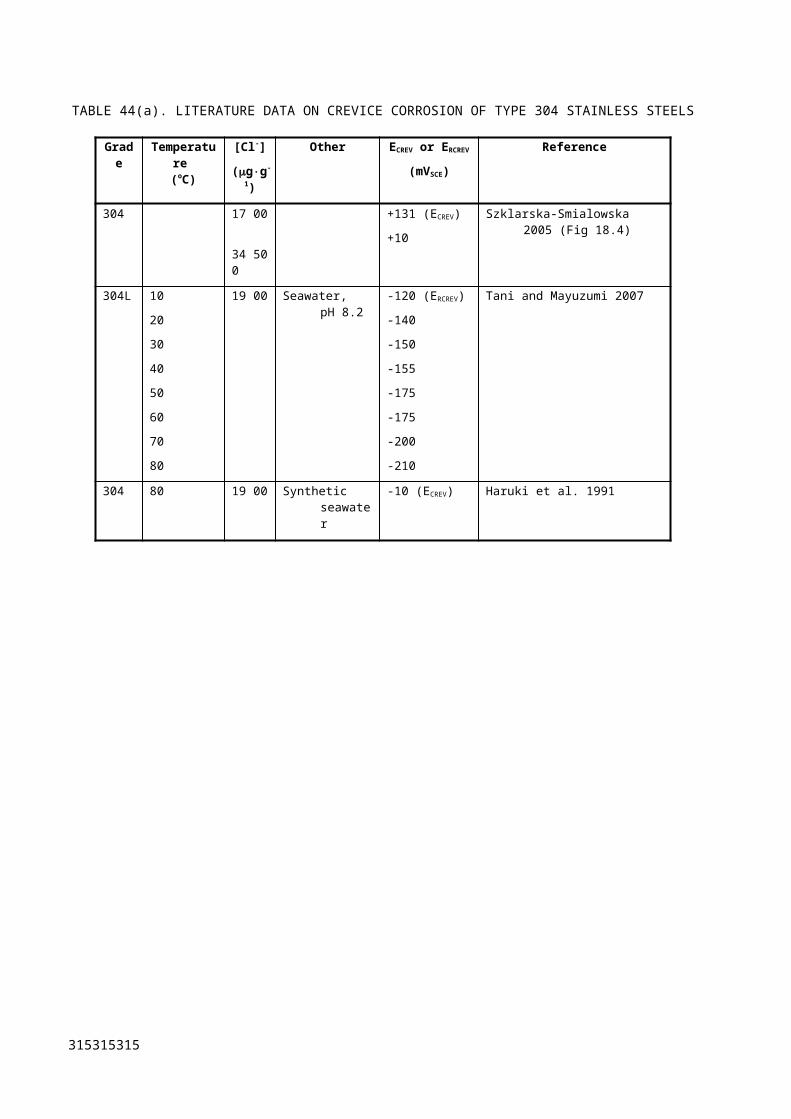
TABLE 104. PER PACKAGE ACTIVITY LEVELS FOR LIQUID RELEASE FOR VARIANT CALCULATION WITH FASTER CEMENT DEGRADATION (X10
FASTER THAN DESIGN)
Near Field Saturated Geosphere Per Package Activity Level (Bq)
Disposal Zone
Flow Rate Flow Type H-3 Co-60 Ni-63 Kr-85 Sr-90 Cs-137 Pb-210 Ra-226 Pu-238 Pu-239 Am-241
Unsaturated
HighPorous * * * * * * * * 1E+12 2E+12 1E+12
Fractured * * * * * * * * * 6E+14 1E+14
Medium Porous * * * * * * * * 5E+13 2E+12 5E+12
Low Porous * * * * * * * * * 2E+15 *
Saturated
High
Porous* * * * * * * * 9E+10 2E+12 1E+11
Fractured* * * * * * * * 5E+12 2E+14 5E+12
Medium Porous* * * * * * * * 3E+13 1E+13 1E+13
Low Porous * * * * * * * * * * *
* denotes a per package activity level that is greater than 2 x 10¹⁶ Bq.
325325325
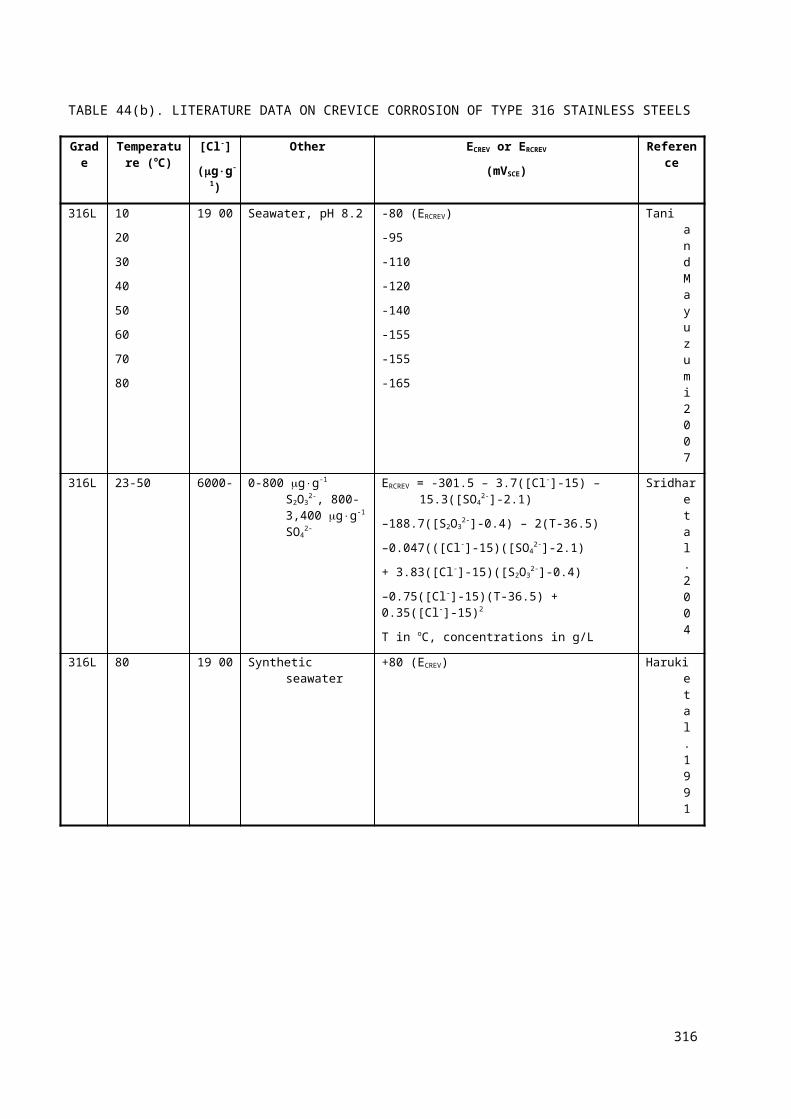
TABLE 105. TOTAL ACTIVITY LEVELS FOR LIQUID RELEASE FOR VARIANT CALCULATION WITH INCREASED STAINLESS STEEL CORROSION RATES
(X10 FASTER THAN DESIGN)
Near Field Saturated Geosphere Total Activity Level (Bq)
Disposal Zone
Flow Rate Flow Type H-3 Co-60 Ni-63 Kr-85 Sr-90 Cs-137 Pb-210 Ra-226 Pu-238 Pu-239 Am-241
Unsaturated
HighPorous * * * * * * * 5E+17 7E+13 9E+13 9E+13
Fractured * * * * * * * * * 3E+16 5E+15
Medium Porous * * * * * * * * 3E+15 9E+13 3E+14
Low Porous * * * * * * * * * 9E+16 *
Saturated
High
Porous* * * * * * * * 1E+12 7E+11 1E+13
Fractured* * * * * * * * 8E+13 2E+15 1E+15
Medium Porous* * * * * * * * 2E+14 6E+14 4E+14
Low Porous * * * * * * * * * * *
* denotes a total activity level that is greater than 1 x 10¹⁸ Bq.
326
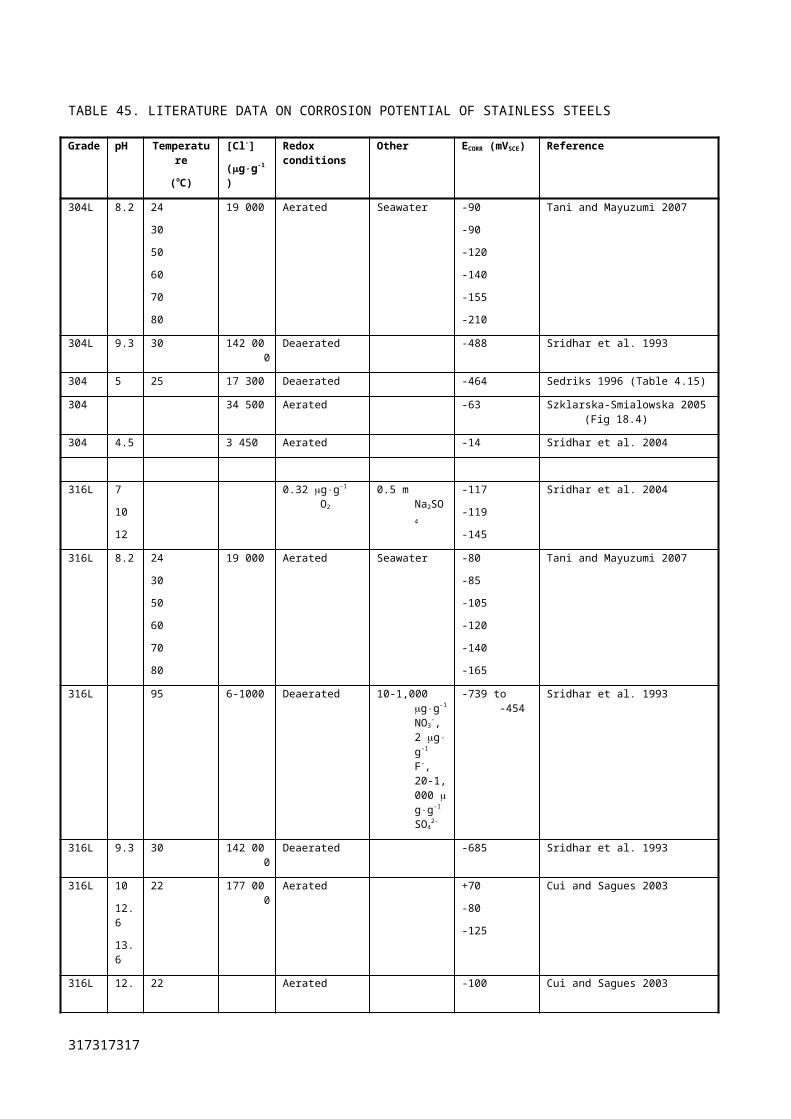
TABLE 106. PER PACKAGE ACTIVITY LEVELS FOR LIQUID RELEASE FOR VARIANT CALCULATION WITH INCREASED STAINLESS STEEL CORROSION
RATES (X10 FASTER THAN DESIGN)
Near Field Saturated Geosphere Per Package Activity Level (Bq)
Disposal Zone
Flow Rate Flow Type H-3 Co-60 Ni-63 Kr-85 Sr-90 Cs-137 Pb-210 Ra-226 Pu-238 Pu-239 Am-241
Unsaturated
HighPorous * * * * * * * 9E15 2E+12 2E+12 2E+12
Fractured * * * * * * * * * 6E+14 1E+14
Medium Porous * * * * * * * * 5E+13 2E+12 5E+12
Low Porous * * * * * * * * * 2E+15 *
Saturated
High
Porous* * * * * * * * 3E+10 1E+10 2E+11
Fractured* * * * * * * * 2E+12 4E+13 2E+13
Medium Porous* * * * * * * * 4E+12 1E+13 8E+12
Low Porous * * * * * * * * * * *
* denotes a per package activity level that is greater than 2 x 10¹⁶ Bq.
327327327
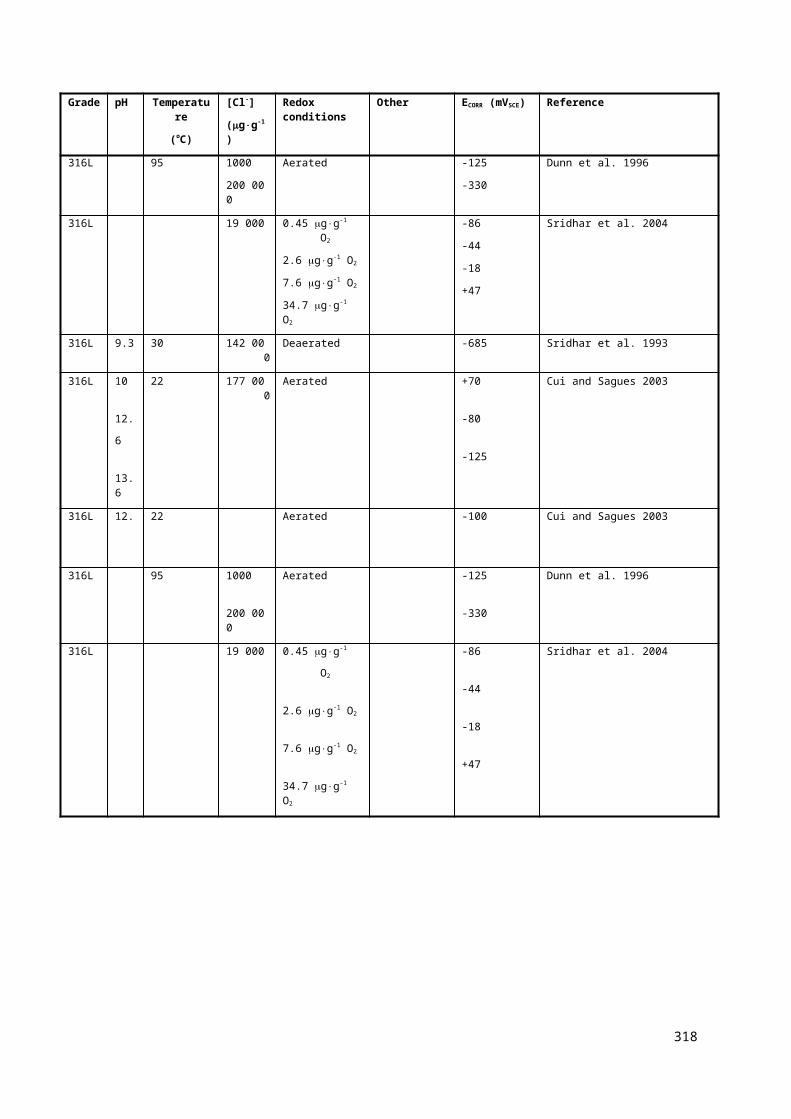
TABLE 107. TOTAL ACTIVITY LEVELS FOR LIQUID RELEASE FOR VARIANT CALCULATION WITH CEMENT GROUT SORPTION DECREASED BY TWO
ORDERS OF MAGNITUDE
Near Field Saturated Geosphere Total Activity Level (Bq)
Disposal Zone
Flow Rate Flow Type H-3 Co-60 Ni-63 Kr-85 Sr-90 Cs-137 Pb-210 Ra-226 Pu-238 Pu-239 Am-241
Unsaturated
HighPorous * * * * * * * * 6E+13 9E+13 2E+13
Fractured * * * * * * * * 5E+17 3E+16 5E+15
Medium Porous * * * * * * * * 2E+15 9E+13 2E+14
Low Porous * * * * * * * * * 9E+16 *
Saturated
High
Porous* * * * * * * * 4E+12 9E+13 5E+12
Fractured* * * * * * * * 3E+14 8E+15 2E+14
Medium Porous* * * * * * * * 2E+15 7E+14 5E+14
Low Porous * * * * * * * * * * *
* denotes a total activity level that is greater than 1 x 10¹⁸ Bq.
328
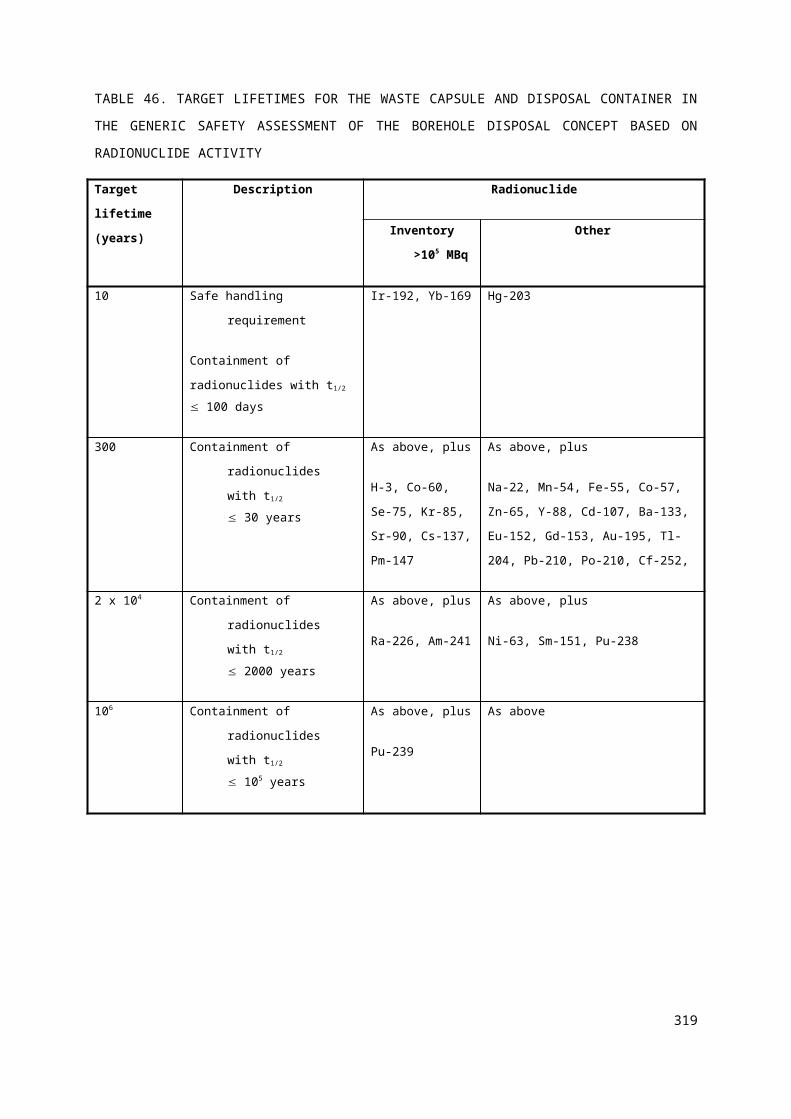
TABLE 108. PER PACKAGE ACTIVITY LEVELS FOR LIQUID RELEASE FOR VARIANT CALCULATION WITH CEMENT GROUT SORPTION DECREASED BY
TWO ORDERS OF MAGNITUDE
Near Field Saturated Geosphere Per Package Activity Level (Bq)
Disposal Zone
Flow Rate Flow Type H-3 Co-60 Ni-63 Kr-85 Sr-90 Cs-137 Pb-210 Ra-226 Pu-238 Pu-239 Am-241
Unsaturated
HighPorous * * * * * * * * 1E+12 2E+12 4E+11
Fractured * * * * * * * * 1E+16 6E+14 1E+14
Medium Porous * * * * * * * * 4E+13 2E+12 5E+12
Low Porous * * * * * * * * * 2E+15 *
Saturated
High
Porous* * * * * * * * 9E+10 2E+12 1E+11
Fractured* * * * * * * * 5E+12 2E+14 5E+12
Medium Porous* * * * * * * * 3E+13 1E+13 1E+13
Low Porous * * * * * * * * * * *
* denotes a per package activity level that is greater than 2 x 10¹⁶ Bq.
329329329
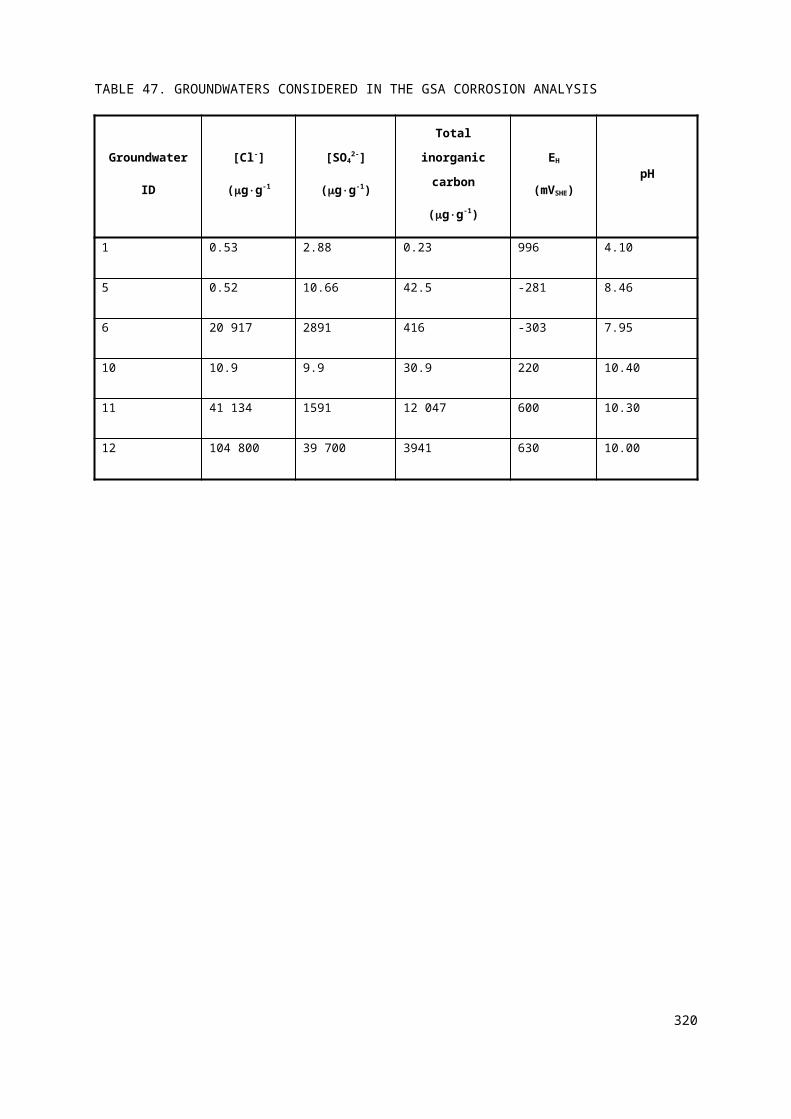
TABLE 109. TOTAL ACTIVITY LEVELS FOR LIQUID RELEASE FOR VARIANT CALCULATION WITH CEMENT GROUT SORPTION INCREASED BY TWO
ORDERS OF MAGNITUDE
Near Field Saturated Geosphere Total Activity Level (Bq)
Disposal Zone
Flow Rate Flow Type H-3 Co-60 Ni-63 Kr-85 Sr-90 Cs-137 Pb-210 Ra-226 Pu-238 Pu-239 Am-241
Unsaturated
HighPorous * * * * * * * * 7E+14 2E+14 2E+15
Fractured * * * * * * * * * 3E+16 6E+15
Medium Porous * * * * * * * * 2E+16 2E+14 2E+15
Low Porous * * * * * * * * * 9E+16 *
Saturated
High
Porous* * * * * * * * 4E+12 9E+13 6E+12
Fractured* * * * * * * * 3E+14 8E+15 3E+14
Medium Porous* * * * * * * * 2E+15 7E+14 6E+14
Low Porous * * * * * * * * * * *
* denotes a total activity level that is greater than 1 x 10¹⁸ Bq.
330
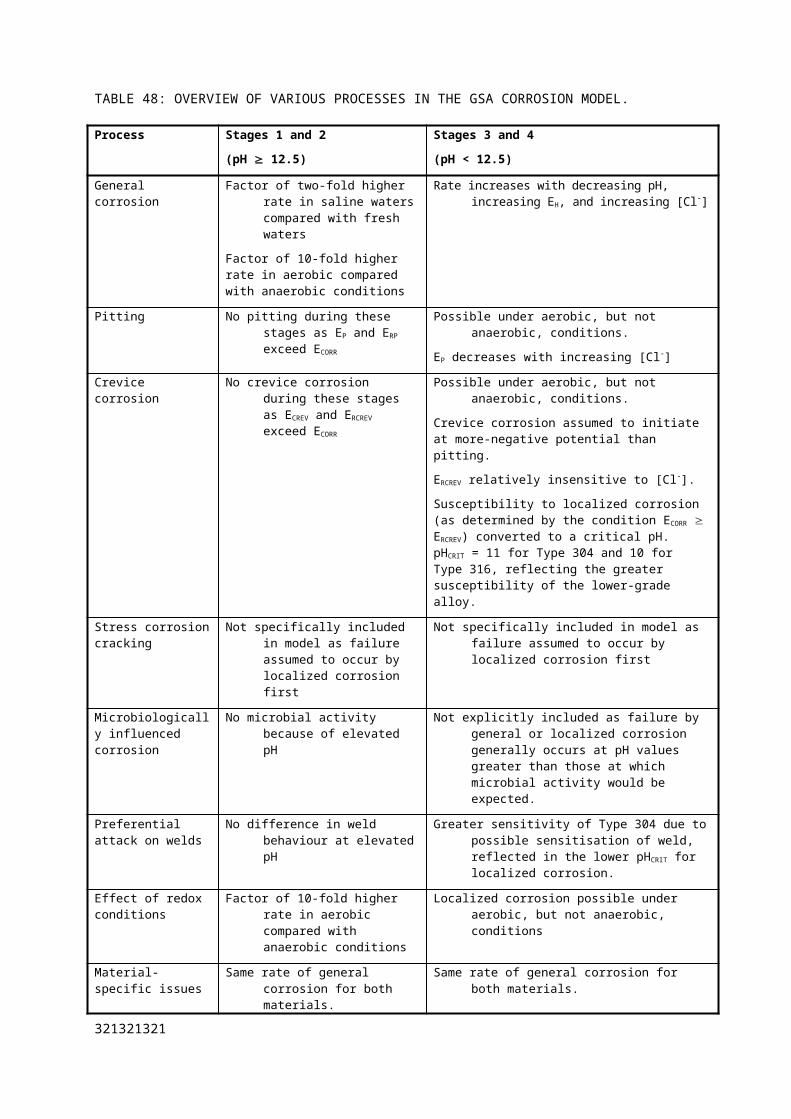
TABLE 110. PER PACKAGE ACTIVITY LEVELS FOR LIQUID RELEASE FOR VARIANT CALCULATION WITH CEMENT GROUT SORPTION INCREASED BY
TWO ORDERS OF MAGNITUDE
Near Field Saturated Geosphere Per Package Activity Level (Bq)
Disposal Zone
Flow Rate Flow Type H-3 Co-60 Ni-63 Kr-85 Sr-90 Cs-137 Pb-210 Ra-226 Pu-238 Pu-239 Am-241
Unsaturated
HighPorous * * * * * * * * 1E+13 5E+12 4E+13
Fractured * * * * * * * * * 6E+14 1E+14
Medium Porous * * * * * * * * 5E+14 4E+12 4E+13
Low Porous * * * * * * * * * 2E+15 *
Saturated
High
Porous* * * * * * * * 9E+10 2E+12 1E+11
Fractured* * * * * * * * 5E+12 2E+14 6E+12
Medium Porous* * * * * * * * 4E+13 1E+13 1E+13
Low Porous * * * * * * * * * * *
* denotes a per package activity level that is greater than 2 x 10¹⁶ Bq.
331331331
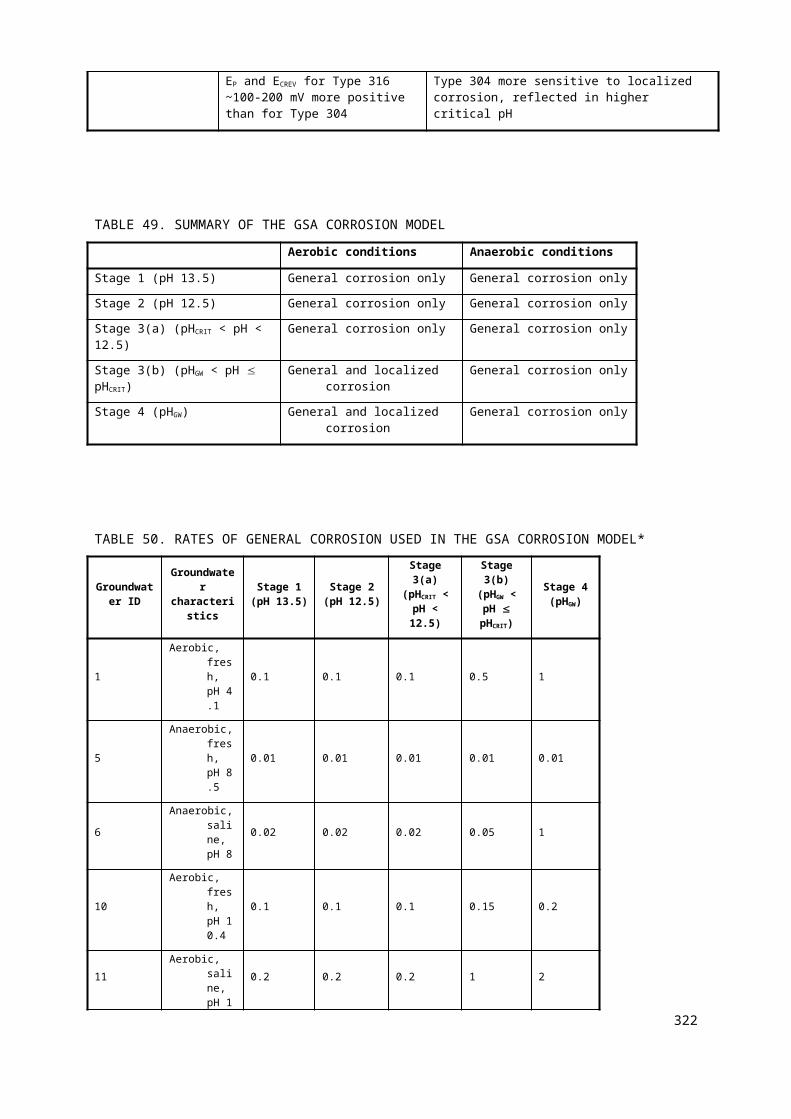
TABLE 111. TOTAL ACTIVITY LEVELS FOR LIQUID RELEASE FOR VARIANT CALCULATION WITH DISTANCE TO WELL SET TO 10 m
Near Field Saturated Geosphere Total Activity Level (Bq)
Disposal Zone
Flow Rate Flow Type H-3 Co-60 Ni-63 Kr-85 Sr-90 Cs-137 Pb-210 Ra-226 Pu-238 Pu-239 Am-241
Unsaturated
HighPorous * * * * * * * * 2E+14 1E+14 1E+14
Fractured * * * * * * * * 1E+17 3E+16 5E+14
Medium Porous * * * * * * * * 8E+13 8E+13 5E+13
Low Porous * * * * * * * * * 2E+15 8E+16
Saturated
High
Porous* * * * * * * * 5E+12 8E+13 7E+11
Fractured* * * * * * * * 1E+13 6E+14 1E+12
Medium Porous* * * * * * * * 9E+12 1E+14 3E+13
Low Porous * * * * * * * * * 1E+17 *
* denotes a total activity level that is greater than 1 x 10¹⁸ Bq.
332
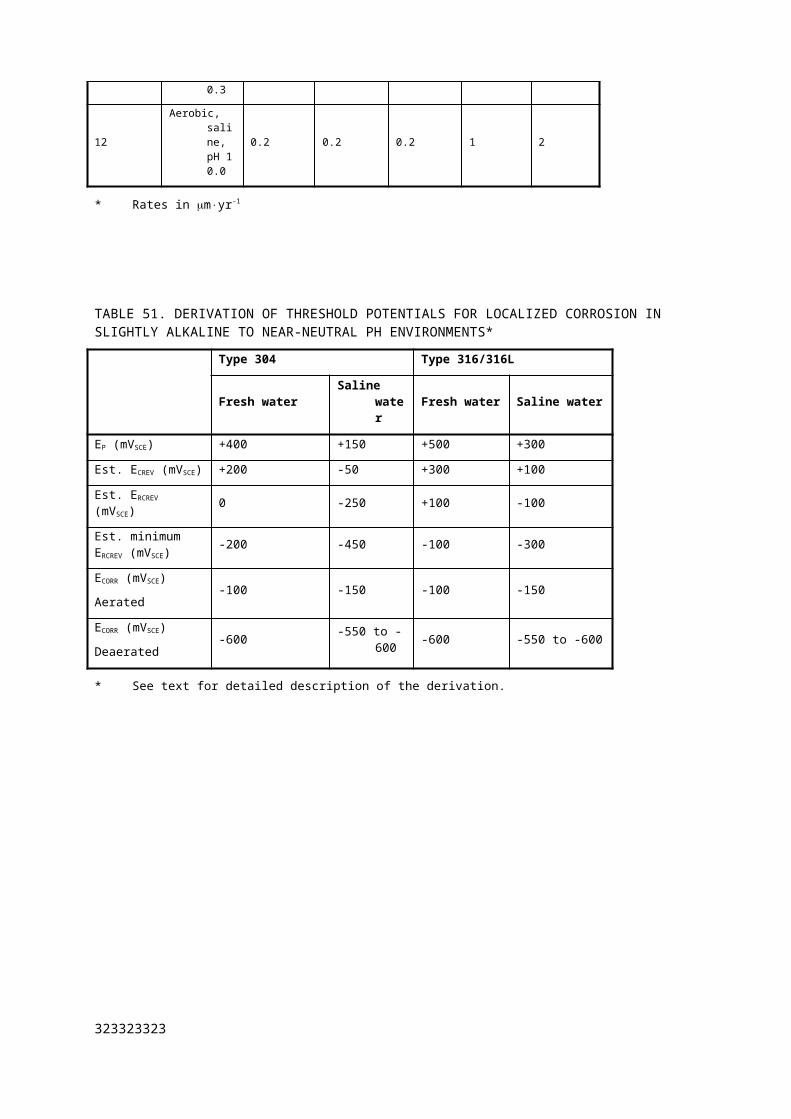
TABLE 112. PER PACKAGE LEVELS FOR LIQUID RELEASE FOR VARIANT CALCULATION WITH DISTANCE TO WELL SET TO 10 m
Near Field Saturated Geosphere Per Package Activity Level (Bq)
Disposal Zone
Flow Rate Flow Type H-3 Co-60 Ni-63 Kr-85 Sr-90 Cs-137 Pb-210 Ra-226 Pu-238 Pu-239 Am-241
Unsaturated
HighPorous * * * * * * * * 4E+12 2E+12 2E+12
Fractured * * * * * * * * 2E+15 7E+14 1E+13
Medium Porous * * * * * * * * 2E+12 2E+12 1E+12
Low Porous * * * * * * * * * 4E+13 2E+15
Saturated
High
Porous* * * * * * * * 1E+11 2E+12 1E+10
Fractured* * * * * * * * 2E+11 1E+13 2E+10
Medium Porous* * * * * * * * 2E+11 2E+12 6E+11
Low Porous * * * * * * * * * 2E+15 *
* denotes a total activity level that is greater than 2 x 10¹⁶ Bq.
333333333
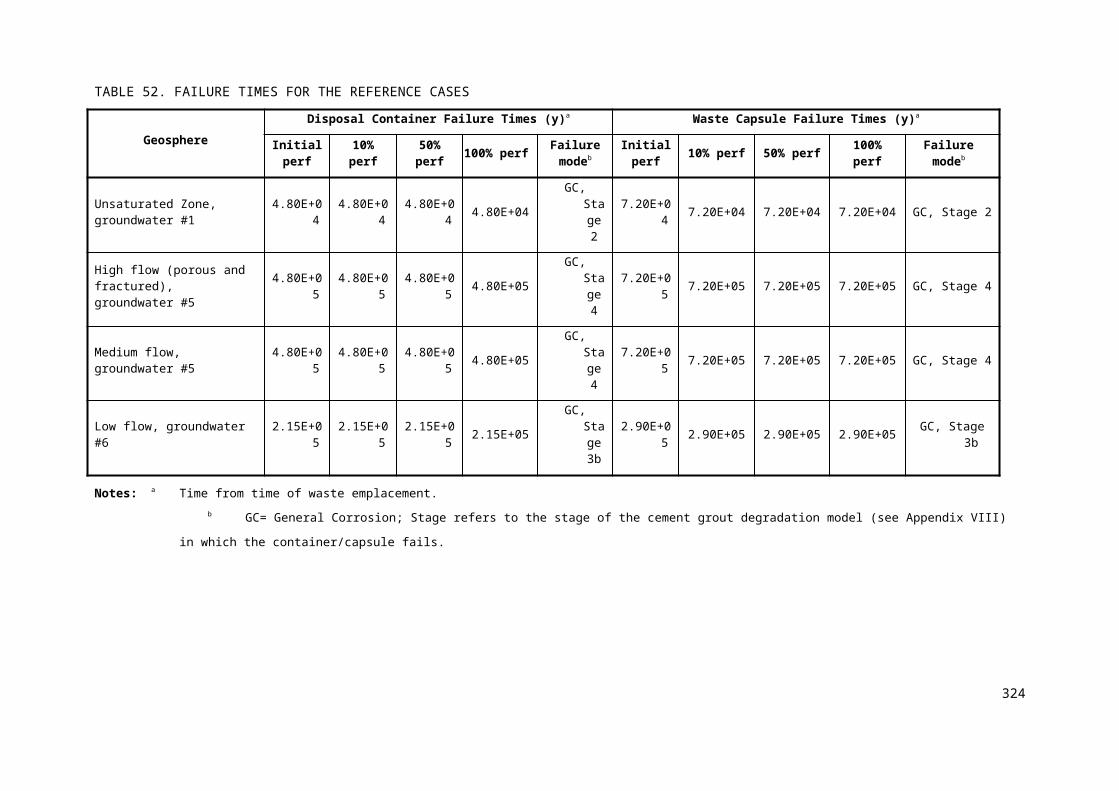
TABLE 113. TOTAL ACTIVITY LEVELS FOR LIQUID RELEASE FOR VARIANT CALCULATION WITH DISTANCE TO WELL SET TO 1000 m
Near Field Saturated Geosphere Total Activity Level (Bq)
Disposal Zone
Flow Rate Flow Type H-3 Co-60 Ni-63 Kr-85 Sr-90 Cs-137 Pb-210 Ra-226 Pu-238 Pu-239 Am-241
Unsaturated
HighPorous * * * * * * * * 7E+15 7E+13 4E+13
Fractured * * * * * * * * * 3E+16 *
Medium Porous * * * * * * * * * 6E+14 6E+16
Low Porous * * * * * * * * * * *
Saturated
HighPorous * * * * * * * * 2E+13 2E+14 6E+13
Fractured * * * * * * * * * 7E+16 *
Medium Porous * * * * * * * * * 6E+15 1E+17
Low Porous * * * * * * * * * * *
* denotes a total activity level that is greater than 1 x 10¹⁸ Bq.
334
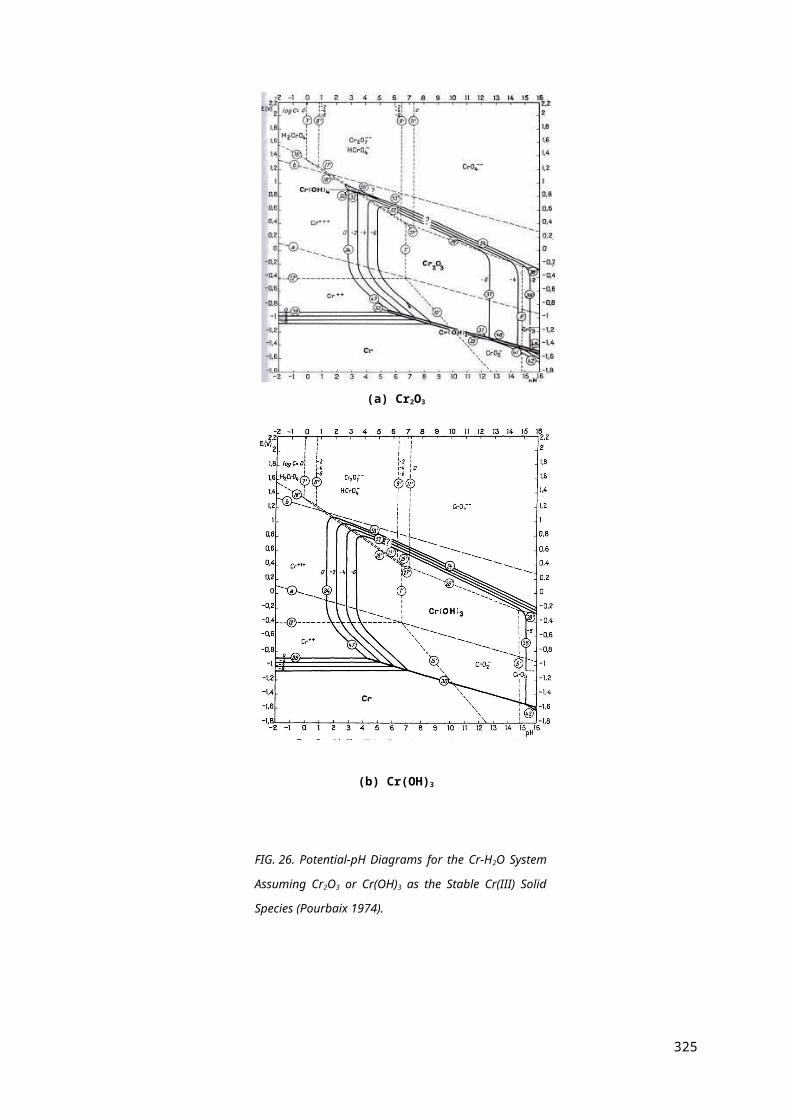
TABLE 114. PER PACKAGE ACTIVITY LEVELS FOR LIQUID RELEASE FOR VARIANT CALCULATION WITH DISTANCE TO WELL SET TO 1000 m
Near Field Saturated Geosphere Per Package Activity Level (Bq)
Disposal Zone
Flow Rate Flow Type H-3 Co-60 Ni-63 Kr-85 Sr-90 Cs-137 Pb-210 Ra-226 Pu-238 Pu-239 Am-241
Unsaturated
HighPorous * * * * * * * * 1E+12 1E+12 9E+11
Fractured * * * * * * * * * 7E+14 *
Medium Porous * * * * * * * * * 1E+13 1E+15
Low Porous * * * * * * * * * * *
Saturated
HighPorous * * * * * * * * 3E+11 4E+12 1E+12
Fractured * * * * * * * * * 1E+15 *
Medium Porous * * * * * * * * * 1E+14 2E+15
Low Porous * * * * * * * * * * *
* denotes a per package activity level that is greater than 2 x 10¹⁶ Bq.
335335335
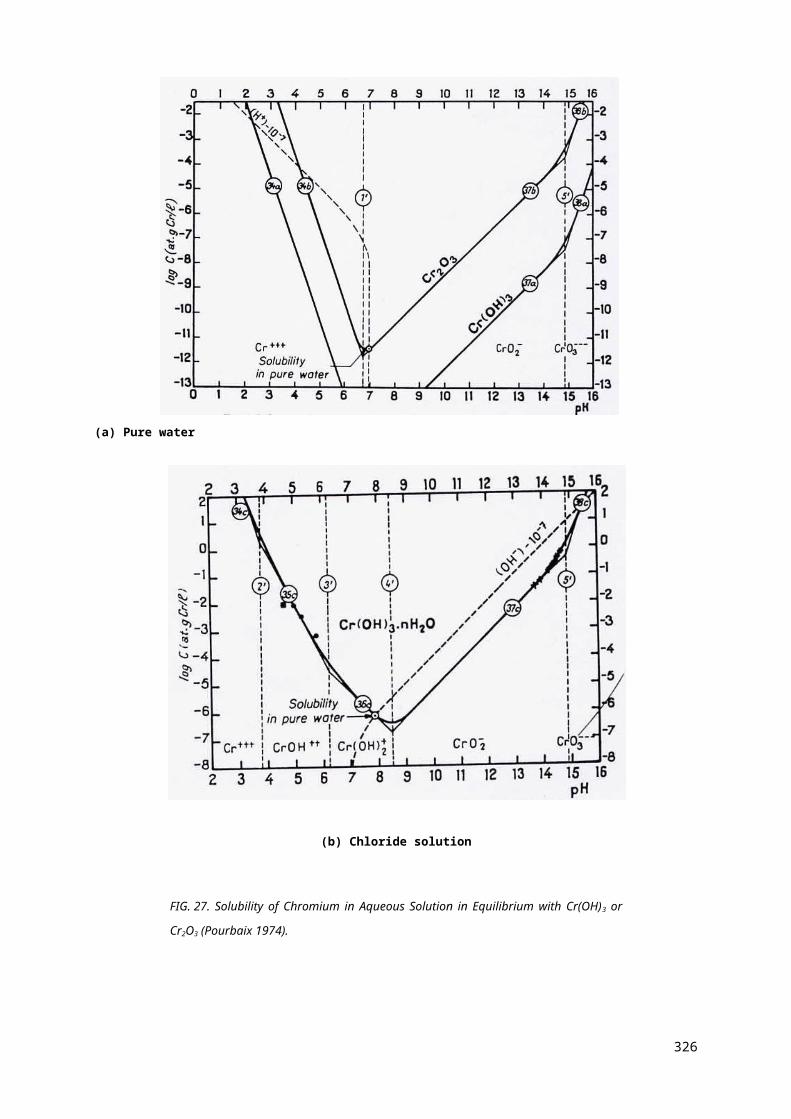
TABLE 115. TOTAL ACTIVITY LEVELS FOR LIQUID RELEASE FOR VARIANT CALCULATION WITH GEOSPHERE SORPTION DECREASED BY TWO ORDERS OF MAGNITUDE
Near Field Saturated Geosphere Total Activity Level (Bq)
Disposal Zone
Flow Rate Flow Type H-3 Co-60 Ni-63 Kr-85 Sr-90 Cs-137 Pb-210 Ra-226 Pu-238 Pu-239 Am-241
Unsaturated
HighPorous * * * * * * * * 2E+14 1E+14 1E+14
Fractured * * * * * * * * 8E+16 7E+16 7E+14
Medium Porous * * * * * * * * 1E+14 9E+13 9E+13
Low Porous * * * * * * * * 2E+17 5E+14 6E+15
Saturated
HighPorous * * * * * * * * 1E+13 8E+13 2E+13
Fractured * * * * * * * * 1E+11 9E+13 1E+13
Medium Porous * * * * * * * * 2E+12 5E+13 3E+12
Low Porous * * * * * * * * 6E+17 1E+16 4E+16
* denotes a total activity level that is greater than 1 x 10¹⁸ Bq.
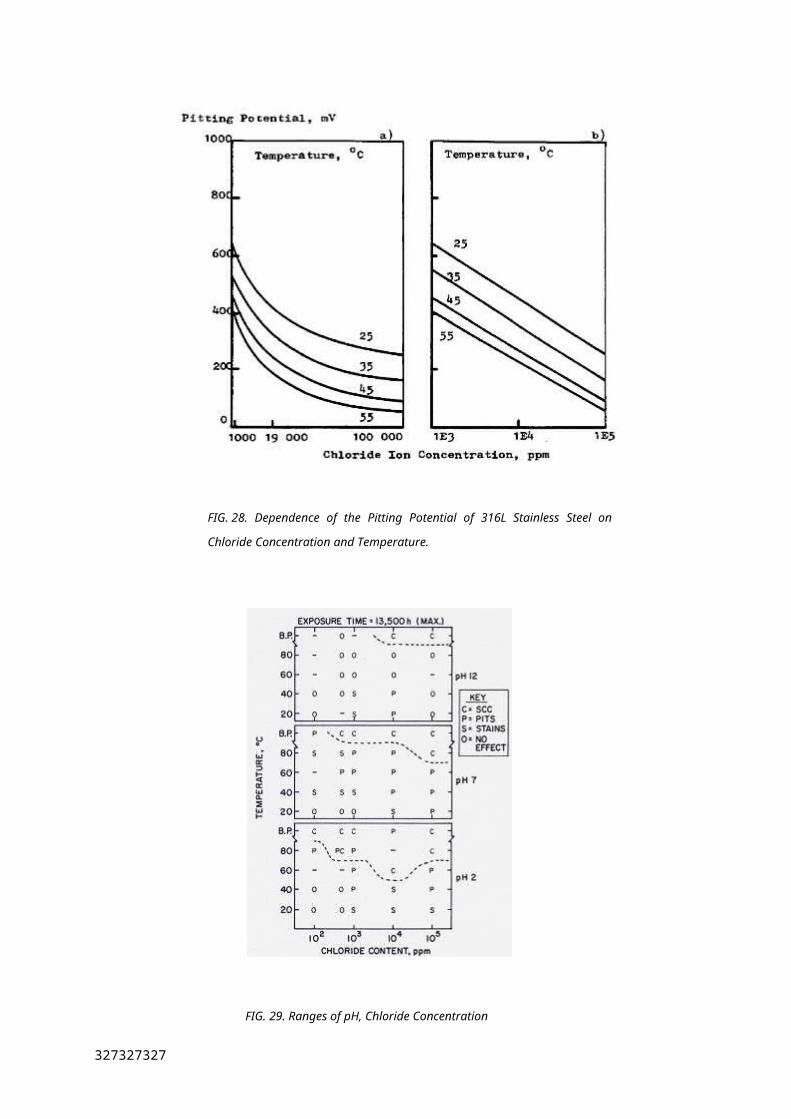
TABLE 116. PER PACKAGE ACTIVITY LEVELS FOR LIQUID RELEASE FOR VARIANT CALCULATION WITH GEOSPHERE SORPTION DECREASED BY
TWO ORDERS OF MAGNITUDE
Near Field Saturated Geosphere Per Package Activity Level (Bq)
Disposal Zone
Flow Rate Flow Type H-3 Co-60 Ni-63 Kr-85 Sr-90 Cs-137 Pb-210 Ra-226 Pu-238 Pu-239 Am-241
Unsaturated
HighPorous * * * * * * * * 4E+12 2E+12 2E+12
Fractured * * * * * * * * 2E+15 1E+15 1E+13
Medium Porous * * * * * * * * 2E+12 2E+12 2E+12
Low Porous * * * * * * * * 3E+15 1E+13 1E+14
Saturated
HighPorous * * * * * * * * 2E+11 2E+12 5E+11
Fractured * * * * * * * * 2E+11 2E+12 3E+11
Medium Porous * * * * * * * * 5E+10 1E+10 6E+10
Low Porous * * * * * * * * 1E+16 2E+14 8E+14
* denotes a per package activity level that is greater than 2 x 10¹⁶ Bq.
337337337

TABLE 117. TOTAL ACTIVITY LEVELS FOR LIQUID RELEASE FOR VARIANT CALCULATION WITH GEOSPHERE SORPTION INCREASED BY TWO
ORDERS OF MAGNITUDE
Near Field Saturated Geosphere Total Activity Level (Bq)
Disposal Zone
Flow Rate Flow Type H-3 Co-60 Ni-63 Kr-85 Sr-90 Cs-137 Pb-210 Ra-226 Pu-238 Pu-239 Am-241
Unsaturated
HighPorous * * * * * * * * 3E+15 9E+13 3E+14
Fractured * * * * * * * * * * *
Medium Porous * * * * * * * * * 7E+15 *
Low Porous * * * * * * * * * * *
Saturated
HighPorous * * * * * * * * 3E+15 1E+15 1E+15
Fractured * * * * * * * * * * *
Medium Porous * * * * * * * * * 8E+16 *
Low Porous * * * * * * * * * * *
* denotes a total activity level that is greater than 1 x 10¹⁸ Bq.
338
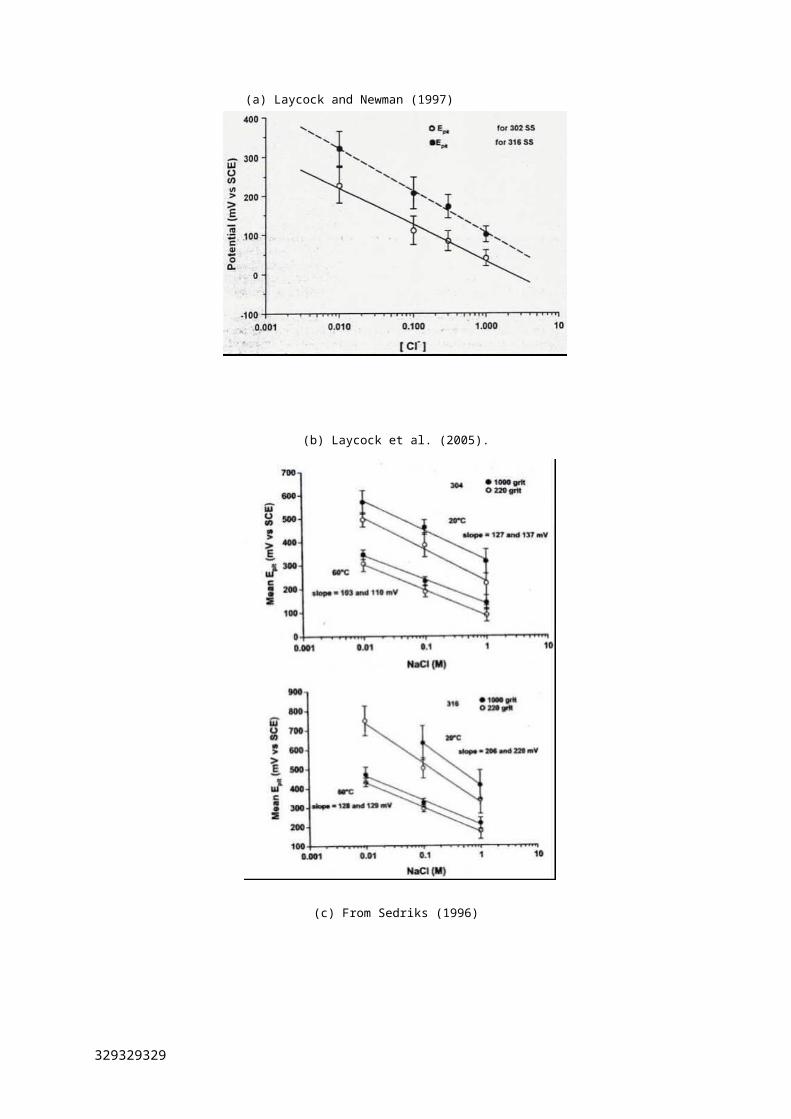
TABLE 118. PER PACKAGE ACTIVITY LEVELS FOR LIQUID RELEASE FOR VARIANT CALCULATION WITH GEOSPHERE SORPTION INCREASED BY
TWO ORDERS OF MAGNITUDE
Near Field Saturated Geosphere Per Package Activity Level (Bq)
Disposal Zone
Flow Rate Flow Type H-3 Co-60 Ni-63 Kr-85 Sr-90 Cs-137 Pb-210 Ra-226 Pu-238 Pu-239 Am-241
Unsaturated
HighPorous * * * * * * * * 6E+13 2E+12 5E+12
Fractured * * * * * * * * * * *
Medium Porous * * * * * * * * * 1E+14 *
Low Porous * * * * * * * * * * *
Saturated
HighPorous * * * * * * * * 6E+13 2E+13 2E+13
Fractured * * * * * * * * * * *
Medium Porous * * * * * * * * * 2E+15 *
Low Porous * * * * * * * * * * *
* denotes a per package activity level that is greater than 2 x 10¹⁶ Bq.
339339339
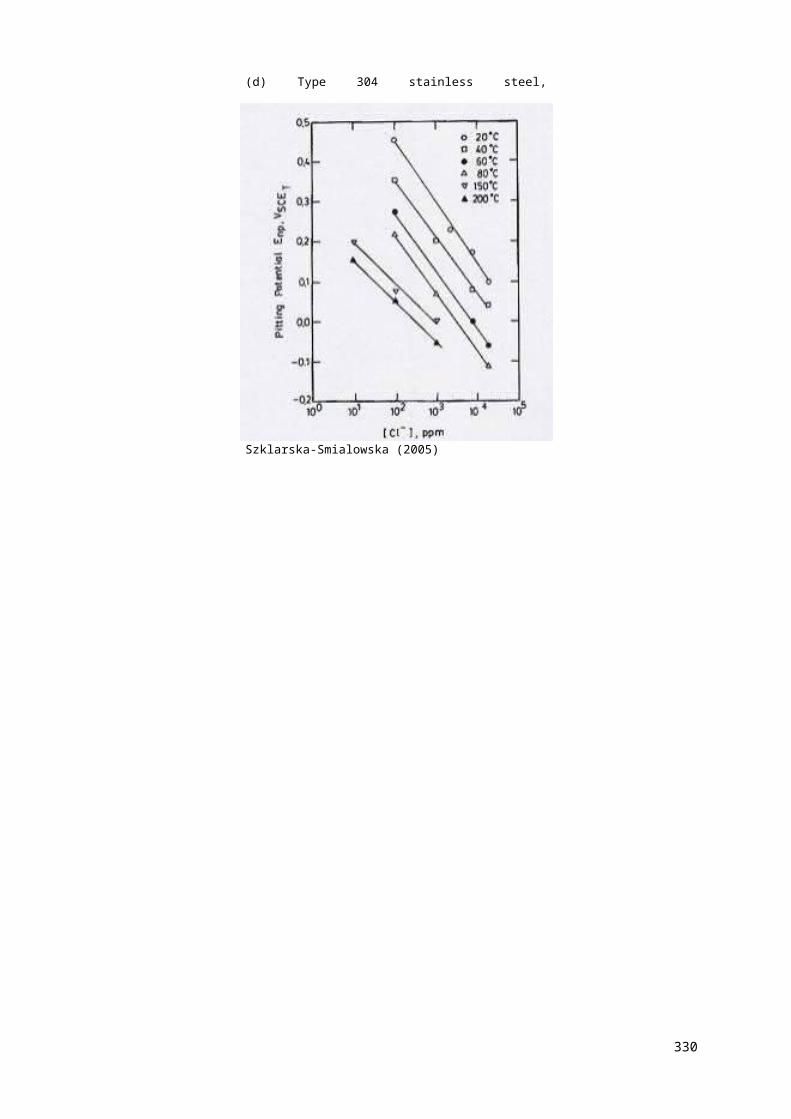
TABLE 119. TOTAL ACTIVITY LEVELS FOR LIQUID RELEASE FOR VARIANT CALCULATION WITH WATER USED FOR DRINKING ONLY
Near Field Saturated Geosphere Total Activity Level (Bq)
Disposal Zone
Flow Rate Flow Type H-3 Co-60 Ni-63 Kr-85 Sr-90 Cs-137 Pb-210 Ra-226 Pu-238 Pu-239 Am-241
Unsaturated
HighPorous * * * * * * * * 4E+11 6E+11 2E+11
Fractured * * * * * * * * * 2E+16 3E+16
Medium Porous * * * * * * * * 3E+14 2E+13 1E+13
Low Porous * * * * * * * * * 3E+16 *
Saturated
HighPorous * * * * * * * * 2E+13 6E+14 2E+13
Fractured * * * * * * * * 1E+15 5E+16 1E+15
Medium Porous * * * * * * * * 1E+14 3E+13 2E+13
Low Porous * * * * * * * * * 3E+17 *
* denotes a total activity level that is greater than 1 x 10¹⁸ Bq.
340
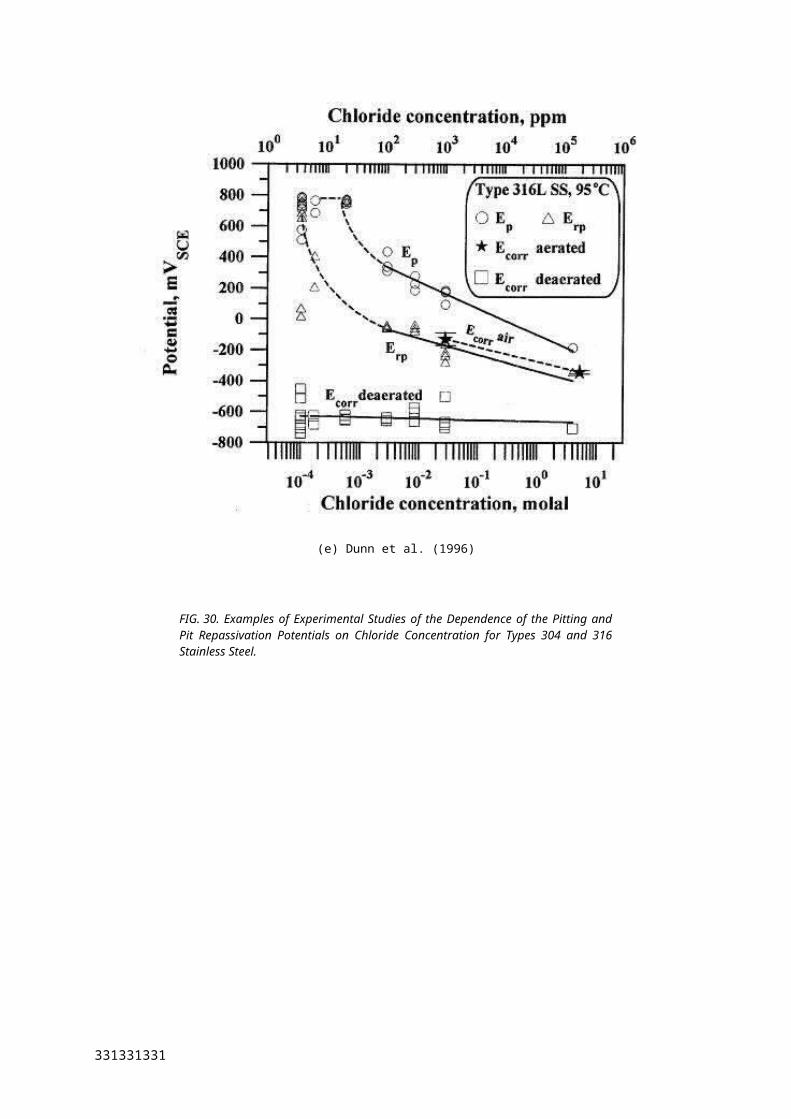
TABLE 120. PER PACKAGE ACTIVITY LEVELS FOR LIQUID RELEASE FOR VARIANT CALCULATION WITH WATER USED FOR DRINKING ONLY
Near Field Saturated Geosphere Per Package Activity Level (Bq)
Disposal Zone
Flow Rate Flow Type H-3 Co-60 Ni-63 Kr-85 Sr-90 Cs-137 Pb-210 Ra-226 Pu-238 Pu-239 Am-241
Unsaturated
HighPorous * * * * * * * * 7E+09 1E+10 4E+09
Fractured * * * * * * * * * 5E+14 7E+14
Medium Porous * * * * * * * * 6E+12 4E+11 2E+11
Low Porous * * * * * * * * * 6E+14 *
Saturated
HighPorous * * * * * * * * 3E+11 1E+13 5E+11
Fractured * * * * * * * * 3E+13 1E+15 3E+13
Medium Porous * * * * * * * * 2E+12 6E+11 5E+11
Low Porous * * * * * * * * * 6E+15 *
* denotes a per package activity level that is greater than 2 x 10¹⁶ Bq.
341341341
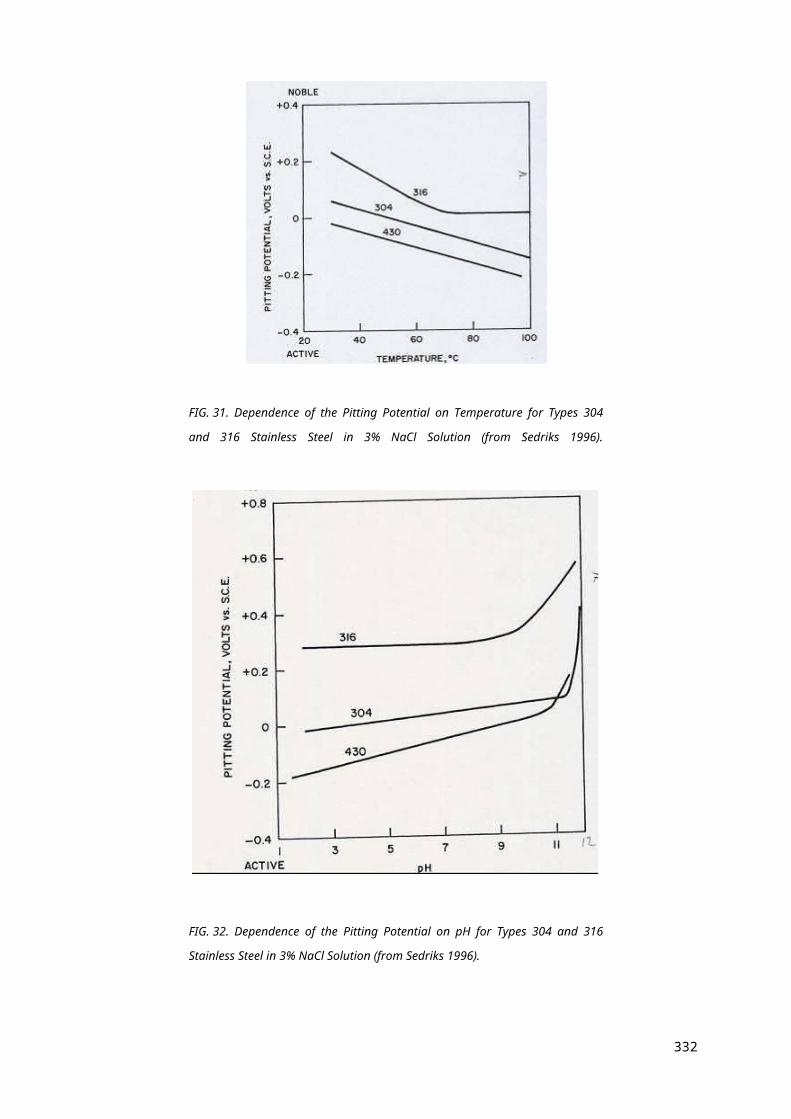
TABLE 121. TOTAL ACTIVITY LEVELS FOR LIQUID RELEASE FOR VARIANT CALCULATION WITH WATER USED FOR FISH FARMING ONLY
Near Field Saturated Geosphere Total Activity Level (Bq)
Disposal Zone
Flow Rate Flow Type H-3 Co-60 Ni-63 Kr-85 Sr-90 Cs-137 Pb-210 Ra-226 Pu-238 Pu-239 Am-241
Saturated
HighPorous * * * * * * * * 3E+13 8E+15 5E+13
Fractured * * * * * * * * 2E+15 7E+17 2E+15
Medium Porous * * * * * * * * 9E+15 6E+16 5E+15
Low Porous * * * * * * * * * * *
* denotes a total activity level that is greater than 1 x 10¹⁸ Bq.
342
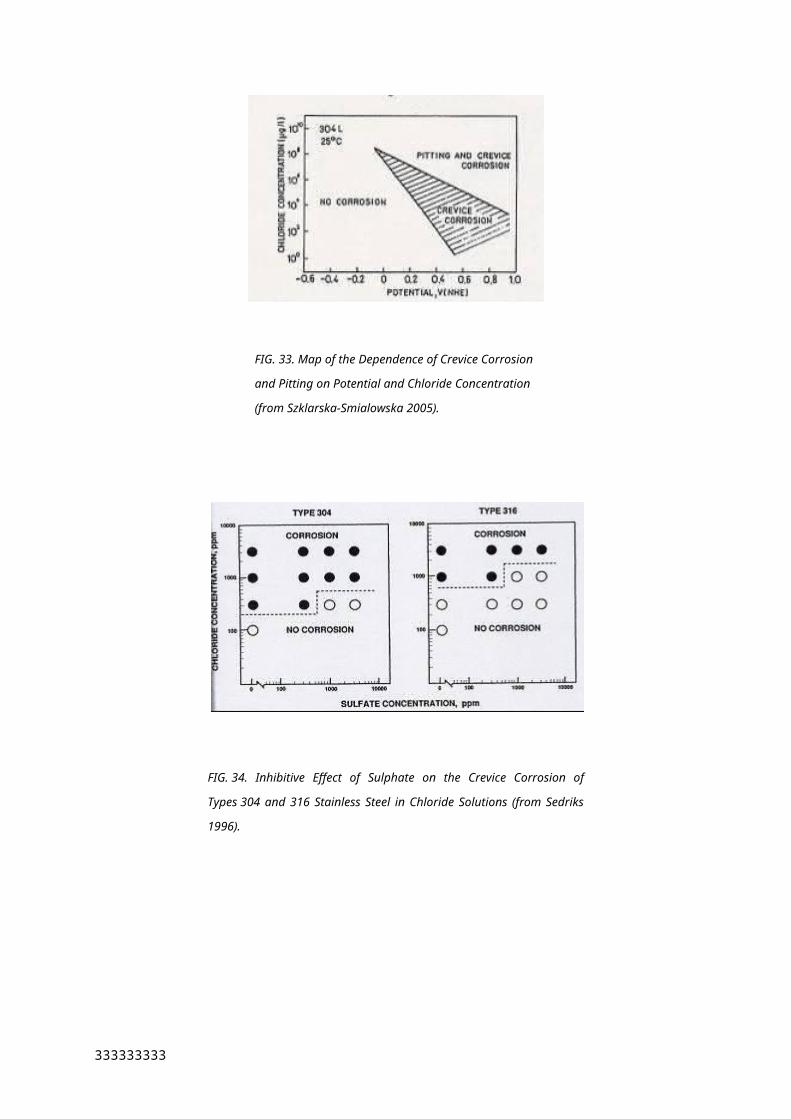
TABLE 122. PER PACKAGE ACTIVITY LEVELS FOR LIQUID RELEASE FOR VARIANT CALCULATION WITH WATER USED FOR FISH FARMING ONLY
Near Field Saturated Geosphere Per Package Activity Level (Bq)
Disposal Zone
Flow Rate Flow Type H-3 Co-60 Ni-63 Kr-85 Sr-90 Cs-137 Pb-210 Ra-226 Pu-238 Pu-239 Am-241
Saturated
HighPorous * * * * * * * * 5E+11 2E+14 1E+12
Fractured * * * * * * * * 3E+13 1E+16 4E+13
Medium Porous * * * * * * * * 2E+14 1E+15 1E+14
Low Porous * * * * * * * * * * *
* denotes a per package activity level that is greater than 2 x 10¹⁶ Bq.
343343343
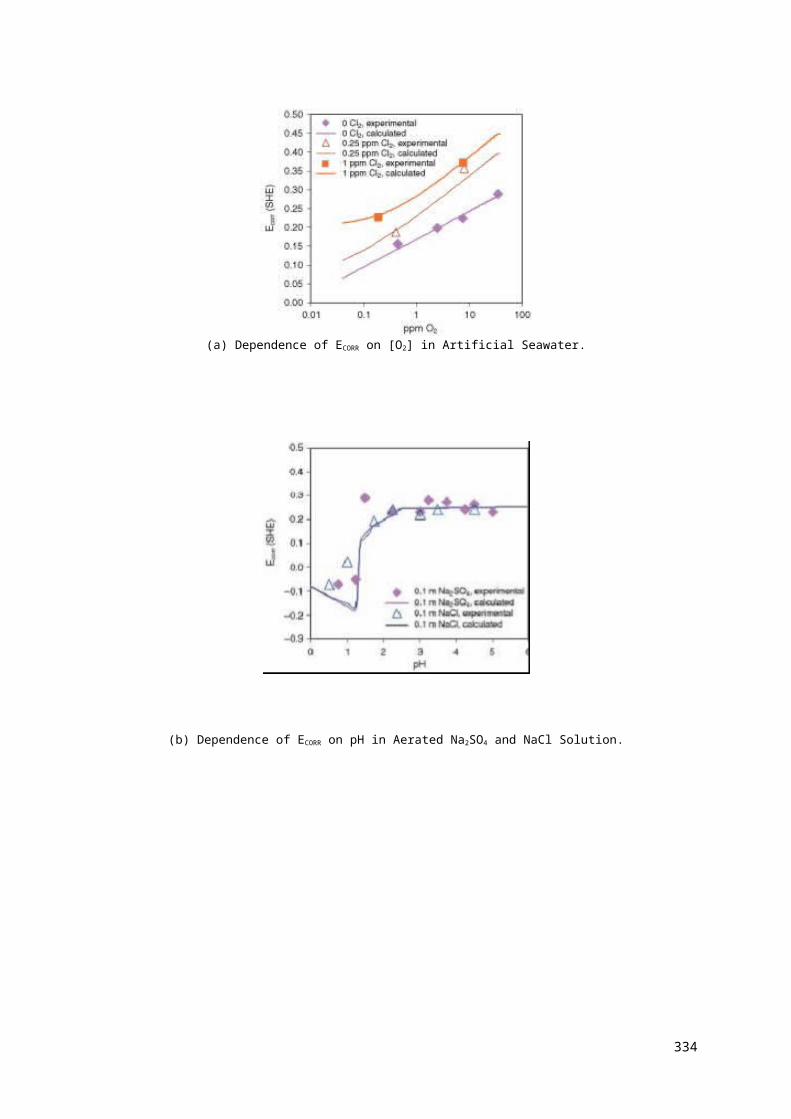
TABLE 123. TOTAL ACTIVITY LEVELS FOR LIQUID RELEASE FOR VARIANT CALCULATION WITH WATER USED FOR BATHING ONLY
Near Field Saturated Geosphere Total Activity Level (Bq)
Disposal Zone
Flow Rate Flow Type H-3 Co-60 Ni-63 Kr-85 Sr-90 Cs-137 Pb-210 Ra-226 Pu-238 Pu-239 Am-241
Saturated
HighPorous * * * * * * * * * * 3E+17
Fractured * * * * * * * * * * *
Medium Porous * * * * * * * * * * *
Low Porous * * * * * * * * * * *
* denotes a total activity level that is greater than 1 x 10¹⁸ Bq.
TABLE 124. PER PACKAGE ACTIVITY LEVELS FOR LIQUID RELEASE FOR VARIANT CALCULATION WITH WATER USED FOR BATHING ONLY
Near Field Saturated Geosphere Per Package Activity Level (Bq)
Disposal Zone
Flow Rate Flow Type H-3 Co-60 Ni-63 Kr-85 Sr-90 Cs-137 Pb-210 Ra-226 Pu-238 Pu-239 Am-241
Saturated
HighPorous * * * * * * * * * * 7E+15
Fractured * * * * * * * * * * *
Medium Porous * * * * * * * * * * *
Low Porous * * * * * * * * * * *
* denotes a per package activity level that is greater than 2 x10¹⁶ Bq.
TABLE 125. TOTAL ACTIVITY LEVELS FOR EROSIVE RELEASE WITH EROSION RATE DECREASED BY AN ORDER OF MAGNITUDE
344
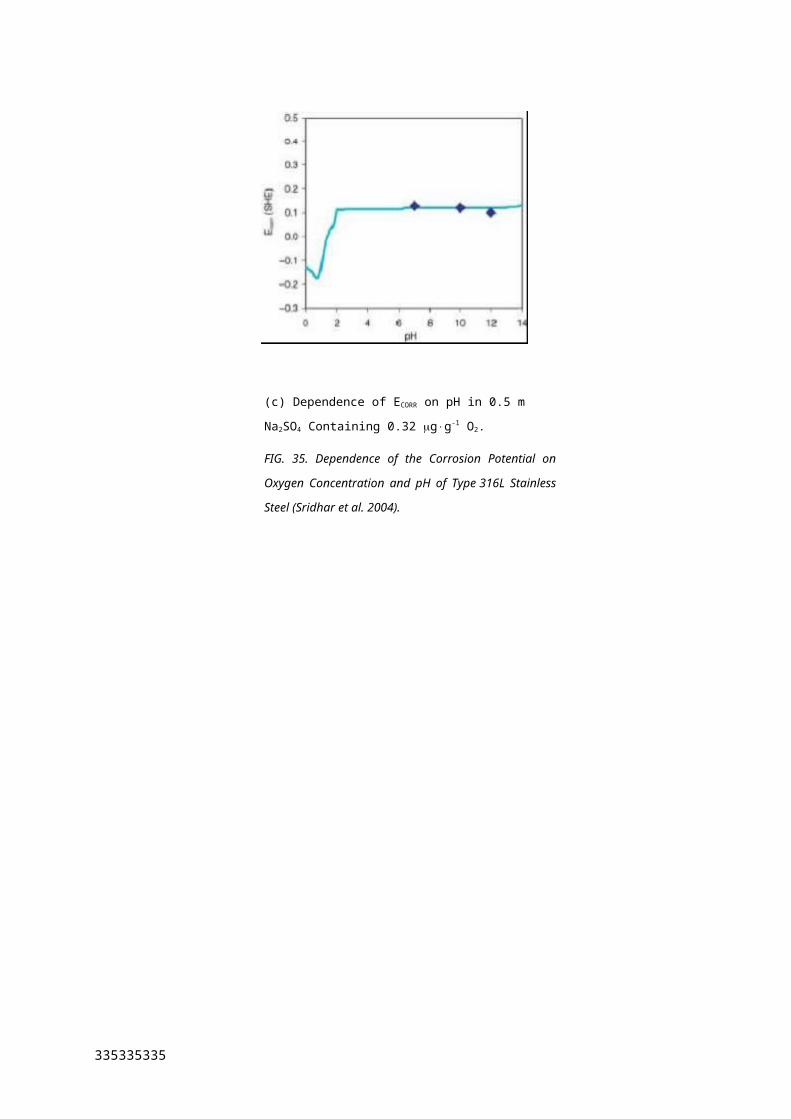
Total Activity Level (Bq)
H-3 Co-60 Ni-63 Kr-85 Sr-90 Cs-137 Pb-210 Ra-226 Pu-238 Pu-239 Am-241
* * * * * * * * 1E+13 8E+12 3E+13
* denotes a total activity level that is greater than 1 x 10¹⁸ Bq.
TABLE 126. PER PACKAGE ACTIVITY LEVELS FOR EROSIVE RELEASE WITH EROSION RATE DECREASED BY AN ORDER OF MAGNITUDE
Per Package Activity Level (Bq)
H-3 Co-60 Ni-63 Kr-85 Sr-90 Cs-137 Pb-210 Ra-226 Pu-238 Pu-239 Am-241
* * * * * * * * 2E+11 2E+11 7E+11
* denotes a per package activity level that is greater than 2 x 10¹⁶ Bq.
345345345
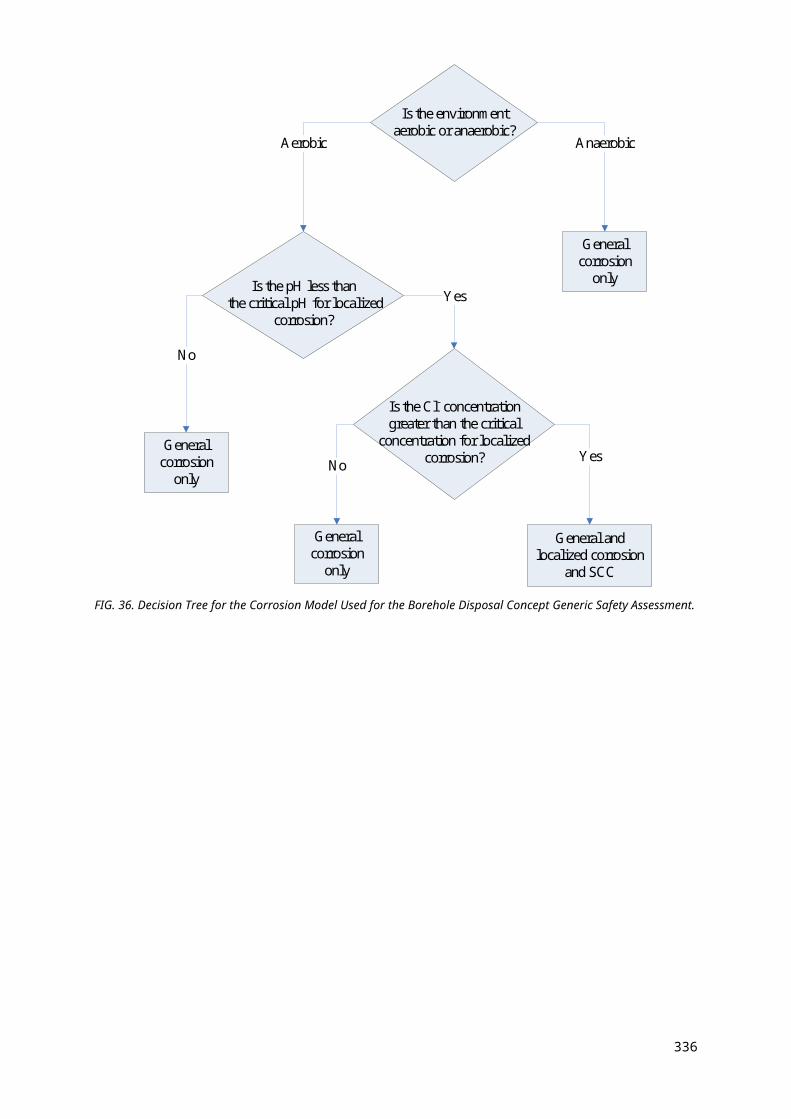
TABLE 127. TOTAL ACTIVITY LEVELS FOR EROSIVE RELEASE WITH EROSION RATE INCREASED BY AN ORDER OF MAGNITUDE
Total Activity Level (Bq)
H-3 Co-60 Ni-63 Kr-85 Sr-90 Cs-137 Pb-210 Ra-226 Pu-238 Pu-239 Am-241
* * * * * * * 3E+10 9E+12 4E+10 6E+13
* denotes a total activity level that is greater than 1 x 10¹⁸ Bq.
TABLE 128. PER PACKAGE ACTIVITY LEVELS FOR EROSIVE RELEASE WITH EROSION RATE INCREASED BY AN ORDER OF MAGNITUDE
Per Package Activity Level (Bq)
H-3 Co-60 Ni-63 Kr-85 Sr-90 Cs-137 Pb-210 Ra-226 Pu-238 Pu-239 Am-241
* * * * * * * 6E+08 2E+11 8E+08 1E+12
* denotes a per package activity level that is greater than 2 x 10¹⁶ Bq.
346
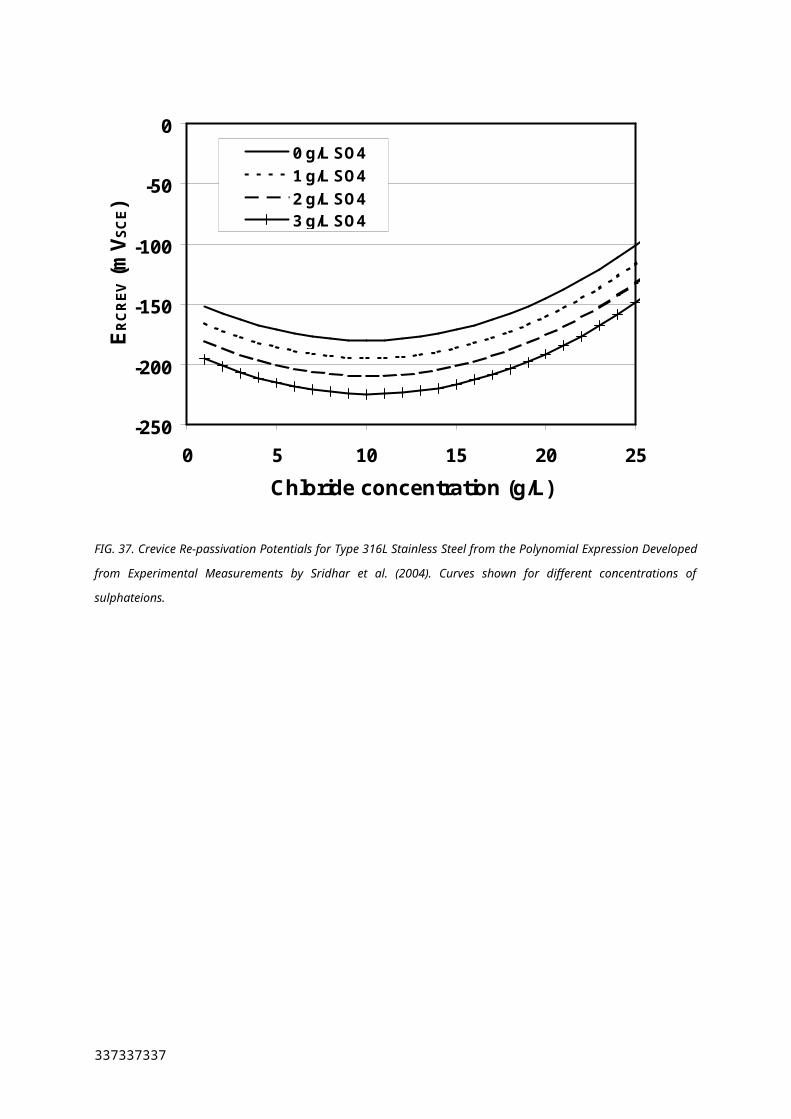
TABLE 129. TOTAL ACTIVITY LEVELS FOR LIQUID RELEASE FOR CASE WITH NO CAPSULE
Near Field Saturated Geosphere Total Activity Level (Bq)
Disposal Zone
Flow Rate Flow Type H-3 Co-60 Ni-63 Kr-85 Sr-90 Cs-137 Pb-210 Ra-226 Pu-238 Pu-239 Am-241
Unsaturated
HighPorous * * * * * * * * 2E+14 9E+13 6E+13
Fractured * * * * * * * * * 3E+16 6E+15
Medium Porous * * * * * * * * 8E+15 9E+13 3E+14
Low Porous * * * * * * * * * 9E+16 *
Saturated
HighPorous * * * * * * * * 3E+11 1E+13 5E+12
Fractured * * * * * * * * 1E+13 8E+15 2E+14
Medium Porous * * * * * * * * 6E+14 7E+14 5E+14
Low Porous * * * * * * * * * * *
* denotes a total activity level that is greater than 1 x 10¹⁸ Bq.
347347347
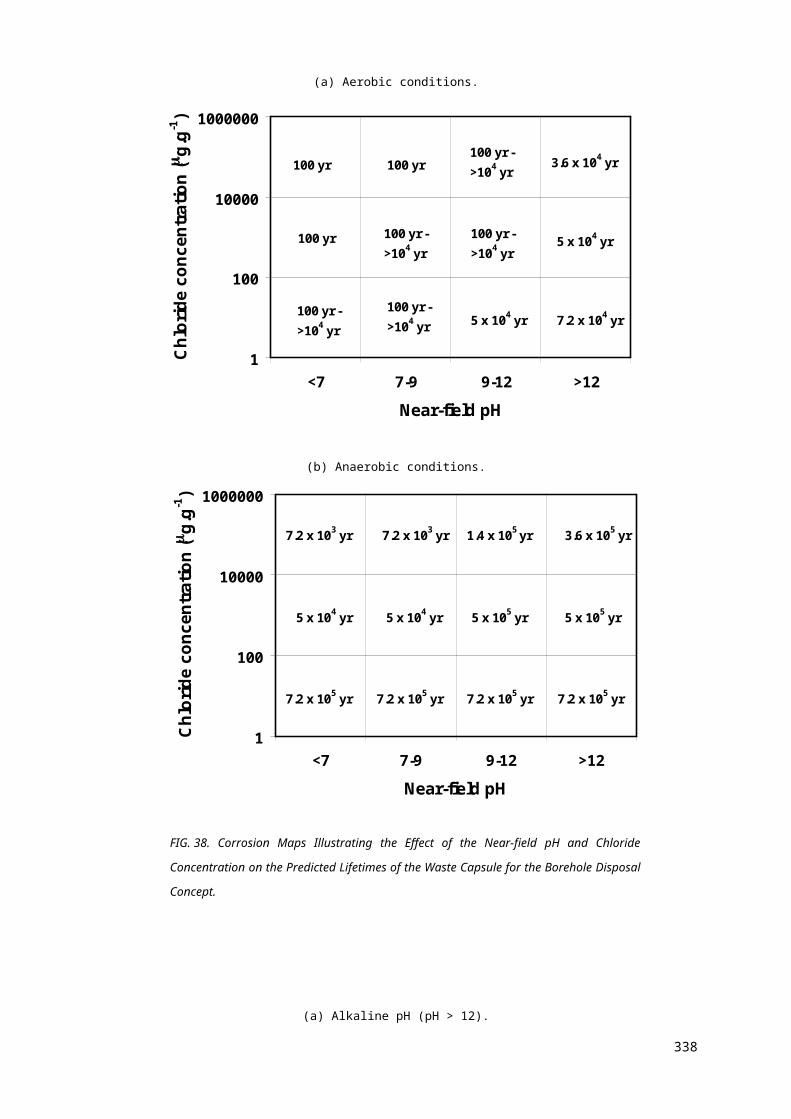
TABLE 130. PER PACKAGE ACTIVITY LEVELS FOR LIQUID RELEASE FOR CASE WITH NO CAPSULE
Near Field Saturated Geosphere Per Package Activity Level (Bq)
Disposal Zone
Flow Rate Flow Type H-3 Co-60 Ni-63 Kr-85 Sr-90 Cs-137 Pb-210 Ra-226 Pu-238 Pu-239 Am-241
Unsaturated
HighPorous * * * * * * * * 5E+12 2E+12 1E+12
Fractured * * * * * * * * * 6E+14 1E+14
Medium Porous * * * * * * * * 2E+14 2E+12 6E+12
Low Porous * * * * * * * * * 2E+15 *
Saturated
HighPorous * * * * * * * * 6E+09 2E+11 1E+11
Fractured * * * * * * * * 2E+11 2E+14 1E+12
Medium Porous * * * * * * * * 3E+13 1E+13 9E+12
Low Porous * * * * * * * * * * *
* denotes a per package activity level that is greater than 2 x 10¹⁶ Bq.
348
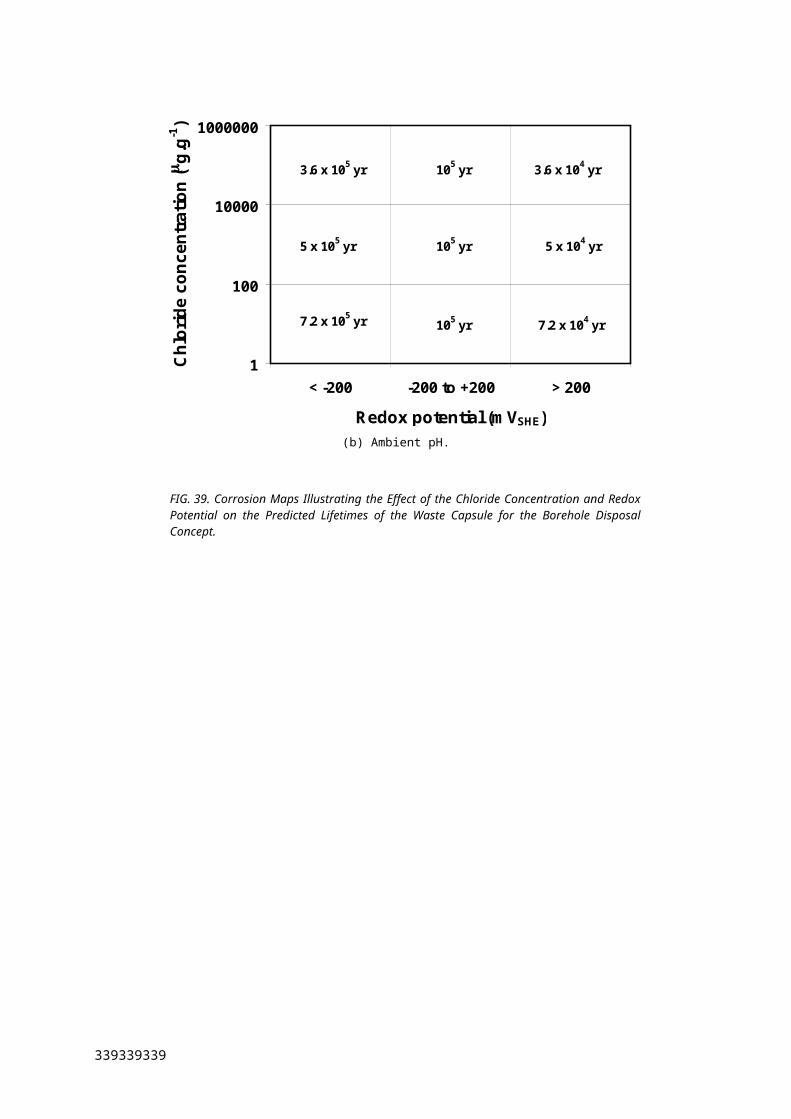
TABLE 131. TOTAL ACTIVITY LEVELS FOR LIQUID RELEASE FOR CASE WITH NO CONTAINMENT BARRIER
Near Field Saturated Geosphere Total Activity Level (Bq)
Disposal Zone
Flow Rate Flow Type H-3 Co-60 Ni-63 Kr-85 Sr-90 Cs-137 Pb-210 Ra-226 Pu-238 Pu-239 Am-241
Unsaturated
HighPorous * * * * * * * * 2E+14 9E+13 6E+13
Fractured * * * * * * * * * 3E+16 6E+15
Medium Porous * * * * * * * * 8E+15 9E+13 3E+14
Low Porous * * * * * * * * * 9E+16 *
Saturated
HighPorous * * * * * * * * 4E+12 9E+13 5E+12
Fractured * * * * * * * * 3E+14 8E+15 2E+14
Medium Porous * * * * * * * * 2E+15 7E+14 5E+14
Low Porous * * * * * * * * * * *
* denotes a total activity level that is greater than 1 x 10¹⁸ Bq.
349349349
TABLE 132. PER PACKAGE ACTIVITY LEVELS FOR LIQUID RELEASE FOR CASE WITH NO CONTAINMENT BARRIER
Near Field Saturated Geosphere Per Package Activity Level (Bq)
Disposal Zone
Flow Rate Flow Type H-3 Co-60 Ni-63 Kr-85 Sr-90 Cs-137 Pb-210 Ra-226 Pu-238 Pu-239 Am-241
Unsaturated
HighPorous * * * * * * * * 5E+12 2E+12 1E+12
Fractured * * * * * * * * * 6E+14 1E+14
Medium Porous * * * * * * * * 2E+14 2E+12 6E+12
Low Porous * * * * * * * * * 2E+15 *
Saturated
HighPorous * * * * * * * * 9E+10 2E+12 1E+11
Fractured * * * * * * * * 5E+12 2E+14 5E+12
Medium Porous * * * * * * * * 3E+13 1E+13 1E+13
Low Porous * * * * * * * * * * *
* denotes a per package activity level that is greater than 2 x 10¹⁶ Bq.
350
TABLE 133. TOTAL ACTIVITY LEVELS FOR LIQUID RELEASE FOR CASE WITH NO DISPOSAL CONTAINER
Near Field Saturated Geosphere Total Activity Level (Bq)
Disposal Zone
Flow Rate Flow Type H-3 Co-60 Ni-63 Kr-85 Sr-90 Cs-137 Pb-210 Ra-226 Pu-238 Pu-239 Am-241
Unsaturated
HighPorous * * * * * * * * 6E+13 9E+13 7E+13
Fractured * * * * * * * * * 3E+16 5E+15
Medium Porous * * * * * * * * 2E+15 9E+13 3E+14
Low Porous * * * * * * * * * 9E+16 *
Saturated
HighPorous * * * * * * * * 1E+12 4E+13 6E+12
Fractured * * * * * * * * 8E+13 1E+15 3E+14
Medium Porous * * * * * * * * 3E+14 7E+14 4E+14
Low Porous * * * * * * * * * * *
* denotes a total activity level that is greater than 1 x 10¹⁸ Bq.
351351351
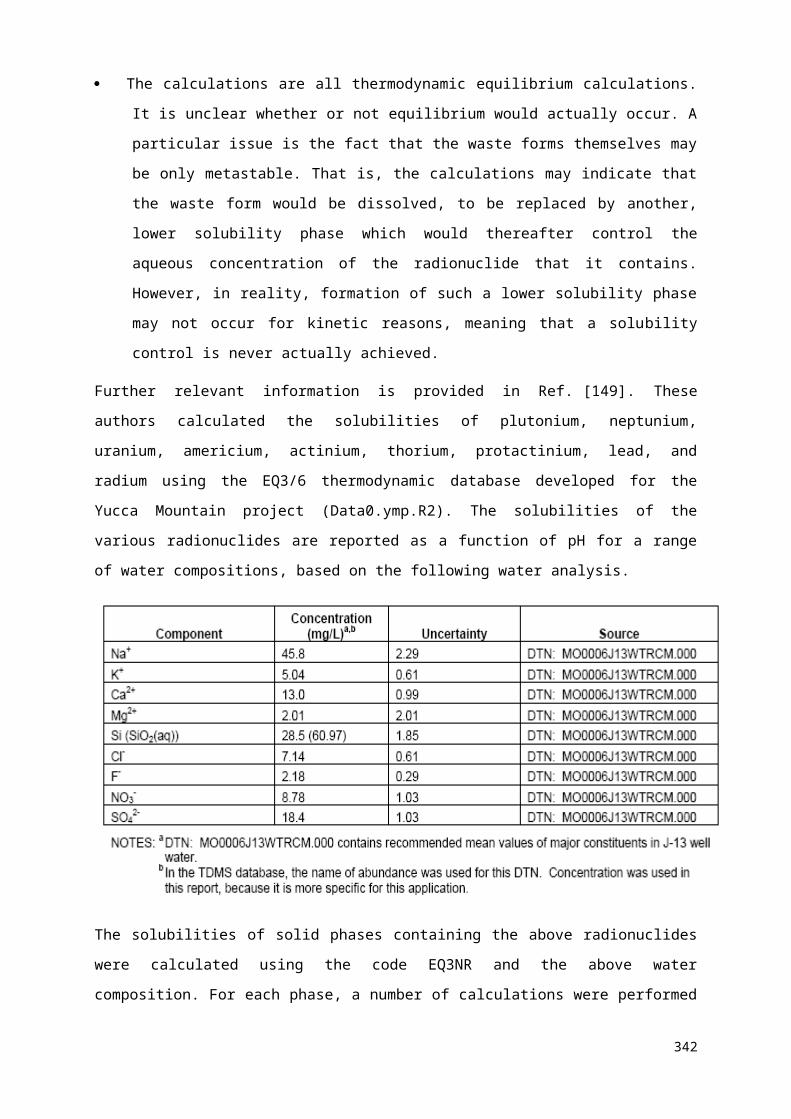
TABLE 134. PER PACKAGE ACTIVITY LEVELS FOR LIQUID RELEASE FOR CASE WITH NO DISPOSAL CONTAINER
Near Field Saturated Geosphere Per Package Activity Level (Bq)
Disposal Zone
Flow Rate Flow Type H-3 Co-60 Ni-63 Kr-85 Sr-90 Cs-137 Pb-210 Ra-226 Pu-238 Pu-239 Am-241
Unsaturated
HighPorous * * * * * * * * 1E+12 2E+12 1E+12
Fractured * * * * * * * * * 6E+14 1E+14
Medium Porous * * * * * * * * 4E+13 2E+12 6E+12
Low Porous * * * * * * * * * 2E+15 *
Saturated
HighPorous * * * * * * * * 3E+10 8E+11 1E+11
Fractured * * * * * * * * 2E+12 2E+14 6E+12
Medium Porous * * * * * * * * 6E+12 1E+13 8E+12
Low Porous * * * * * * * * * * *
* denotes a per package activity level that is greater than 2 x 10¹⁶ Bq.
352
TABLE 135. TOTAL ACTIVITY LEVELS FOR LIQUID RELEASE FOR CASE WITH NO BACKFILL
Near Field Saturated Geosphere Total Activity Level (Bq)
Disposal Zone
Flow Rate Flow Type H-3 Co-60 Ni-63 Kr-85 Sr-90 Cs-137 Pb-210 Ra-226 Pu-238 Pu-239 Am-241
Unsaturated
HighPorous * * * * * * * * 8E+13 9E+13 8E+13
Fractured * * * * * * * * * 3E+16 5E+15
Medium Porous * * * * * * * * 3E+15 9E+13 2E+14
Low Porous * * * * * * * * * 9E+16 *
Saturated
HighPorous * * * * * * * * 4E+12 9E+13 5E+12
Fractured * * * * * * * * 3E+14 8E+15 2E+14
Medium Porous * * * * * * * * 2E+15 7E+14 5E+14
Low Porous * * * * * * * * * * *
* denotes a total activity level that is greater than 1 x 10¹⁸ Bq.
353353353
TABLE 136. PER PACKAGE ACTIVITY LEVELS FOR LIQUID RELEASE FOR CASE WITH NO BACKFILL
Near Field Saturated Geosphere Per Package Activity Level (Bq)
Disposal Zone
Flow Rate Flow Type H-3 Co-60 Ni-63 Kr-85 Sr-90 Cs-137 Pb-210 Ra-226 Pu-238 Pu-239 Am-241
Unsaturated
HighPorous * * * * * * * * 2E+12 2E+12 2E+12
Fractured * * * * * * * * * 6E+14 1E+14
Medium Porous * * * * * * * * 5E+13 2E+12 5E+12
Low Porous * * * * * * * * * 2E+15 *
Saturated
HighPorous * * * * * * * * 9E+10 2E+12 1E+11
Fractured * * * * * * * * 5E+12 2E+14 5E+12
Medium Porous * * * * * * * * 3E+13 1E+13 1E+13
Low Porous * * * * * * * * * * *
* denotes a per package activity level that is greater than 2 x 10¹⁶ Bq.
354
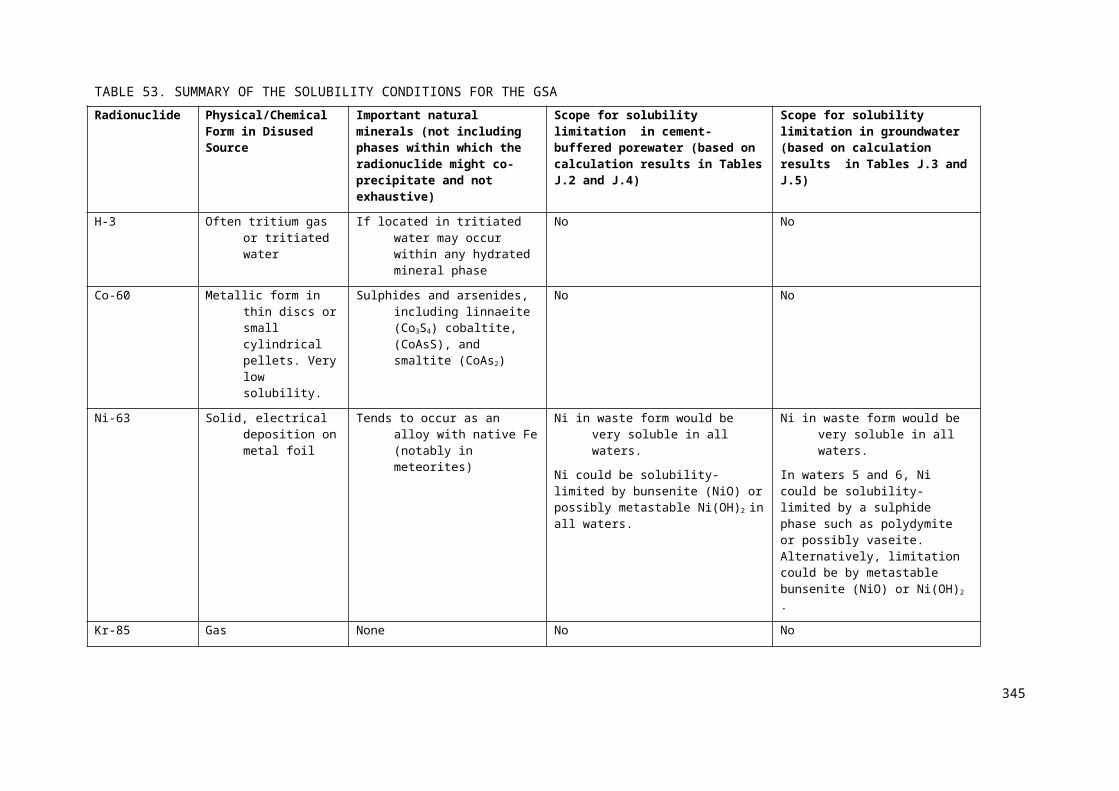
TABLE 137. TOTAL ACTIVITY LEVELS FOR LIQUID RELEASE FOR CASE WITH NO NEAR-FIELD BARRIERS
Near Field Saturated Geosphere Total Activity Level (Bq)
Disposal Zone
Flow Rate Flow Type H-3 Co-60 Ni-63 Kr-85 Sr-90 Cs-137 Pb-210 Ra-226 Pu-238 Pu-239 Am-241
Unsaturated
HighPorous 2E+12 * * * 1E+17 * * 9E+16 8E+13 9E+13 5E+13
Fractured 2E+12 * * * 3E+17 * * * * 3E+16 5E+15
Medium Porous 8E+13 * * * * * * * 3E+15 9E+13 2E+14
Low Porous * * * * * * * * * 9E+16 *
Saturated
HighPorous 2E+09 * 2E+14 * 7E+08 5E+12 3E+12 6E+08 2E+12 7E+10 2E+13
Fractured 2E+09 * 3E+14 * 1E+09 8E+13 3E+12 1E+10 1E+14 2E+14 1E+16
Medium Porous 2E+12 * * * 9E+16 * * 2E+17 1E+14 6E+14 4E+14
Low Porous * * * * * * * * * * *
* denotes a total activity level that is greater than 1 x 10¹⁸ Bq.
355355355
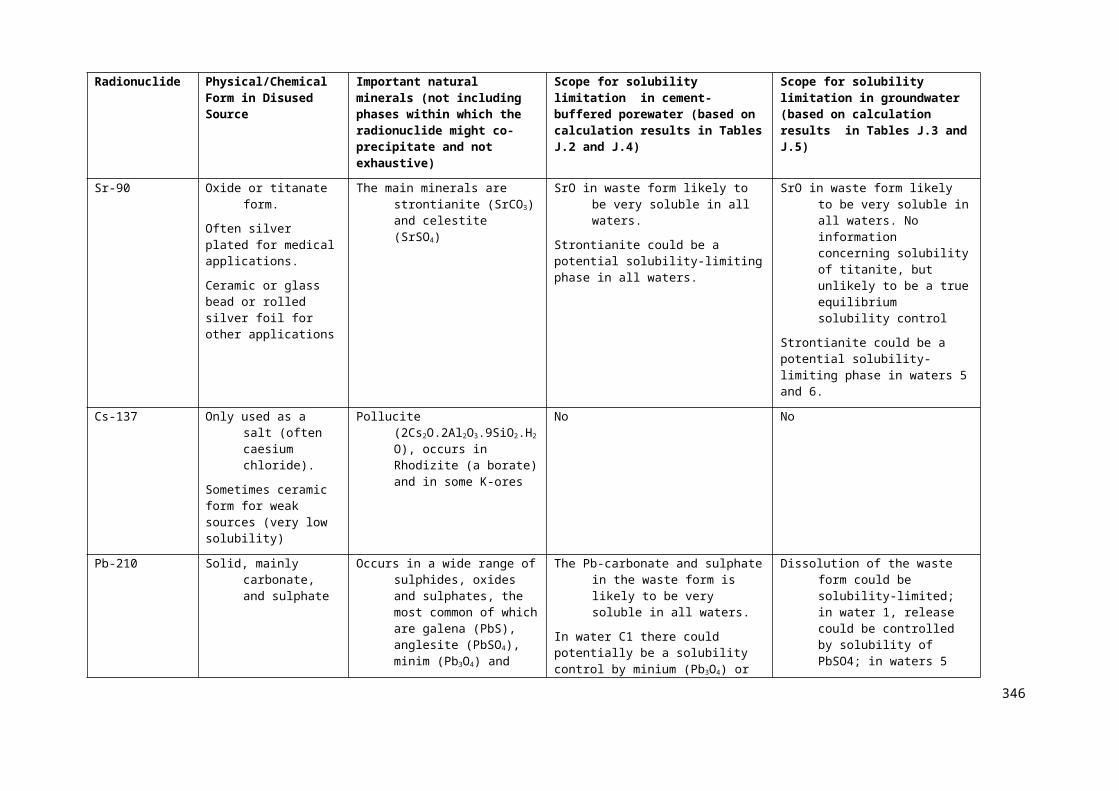
TABLE 138. PER PACKAGE ACTIVITY LEVELS FOR LIQUID RELEASE FOR CASE WITH NO NEAR-FIELD BARRIERS
Near Field Saturated Geosphere Per Package Activity Level (Bq)
Disposal Zone
Flow Rate Flow Type H-3 Co-60 Ni-63 Kr-85 Sr-90 Cs-137 Pb-210 Ra-226 Pu-238 Pu-239 Am-241
Unsaturated
HighPorous 3E+10 * * * 3E+15 * * 2E+15 2E+12 2E+12 1E+12
Fractured 4E+10 * * * 6E+15 * * * * 6E+14 1E+14
Medium Porous 2E+12 * * * * * * * 5E+13 2E+12 5E+12
Low Porous * * * * * * * * * 2E+15 *
Saturated
HighPorous 4E+07 * 3E+12 * 1E+07 1E+11 6E+10 1E+07 4E+10 1E+09 4E+11
Fractured 4E+07 * 5E+12 * 3E+07 2E+12 7E+10 2E+08 2E+12 3E+12 3E+14
Medium Porous 4E+10 * * * 2E+15 * * 4E+15 3E+12 1E+13 8E+12
Low Porous * * * * * * * * * * *
* denotes a per package activity level that is greater than 2 x 10¹⁶ Bq.
356
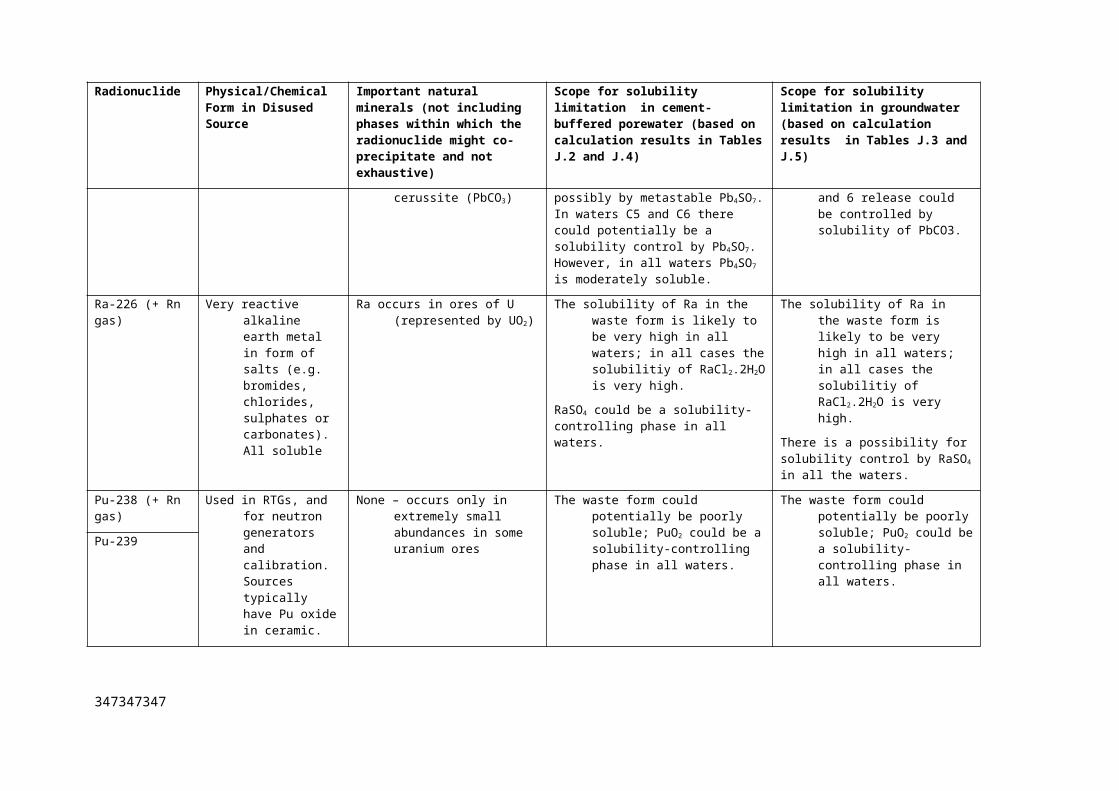
TABLE 139. TOTAL ACTIVITY LEVELS FOR GASEOUS RELEASE FOR CASE WITH NO NEAR-FIELD BARRIERS
Total Activity Level (Bq)
H-3 Co-60 Ni-63 Kr-85 Sr-90 Cs-137 Pb-210 Ra-226 Pu-238 Pu-239 Am-241
1E+11 24 n.a. n.a. 2E+12 n.a. n.a. n.a. * * n.a. n.a.
* denotes a total activity level that is greater than 1 x 10¹⁸ Bq.
TABLE 140. PER PACKAGE ACTIVITY LEVELS FOR GASEOUS RELEASE FOR CASE WITH NO NEAR-FIELD BARRIERS
Per Package Activity Level (Bq)
H-3 Co-60 Ni-63 Kr-85 Sr-90 Cs-137 Pb-210 Ra-226 Pu-238 Pu-239 Am-241
2E+0922 n.a. n.a. 5E+10 n.a. n.a. n.a. * * n.a. n.a.
* denotes a per package activity level that is greater than 2 x 10¹⁶ Bq.
TABLE 141. TOTAL ACTIVITY LEVELS FOR NO GEOSPHERE BARRIER
Near Field Total Activity Level (Bq)
Disposal Zone H-3 Co-60 Ni-63 Kr-85 Sr-90 Cs-137 Pb-210 Ra-226 Pu-238 Pu-239 Am-241
Unsaturated * * * * * * * * 1E+11 2E+12 2E+13
Saturated * * * * * * * * 3E+13 7E+13 3E+10
* denotes a total activity level that is greater than 1 x 10¹⁸ Bq.
24 Only applicable to unsaturated disposal zone. H-3 in saturated disposal zone is assumed to be dissolved in the groundwater.357357357
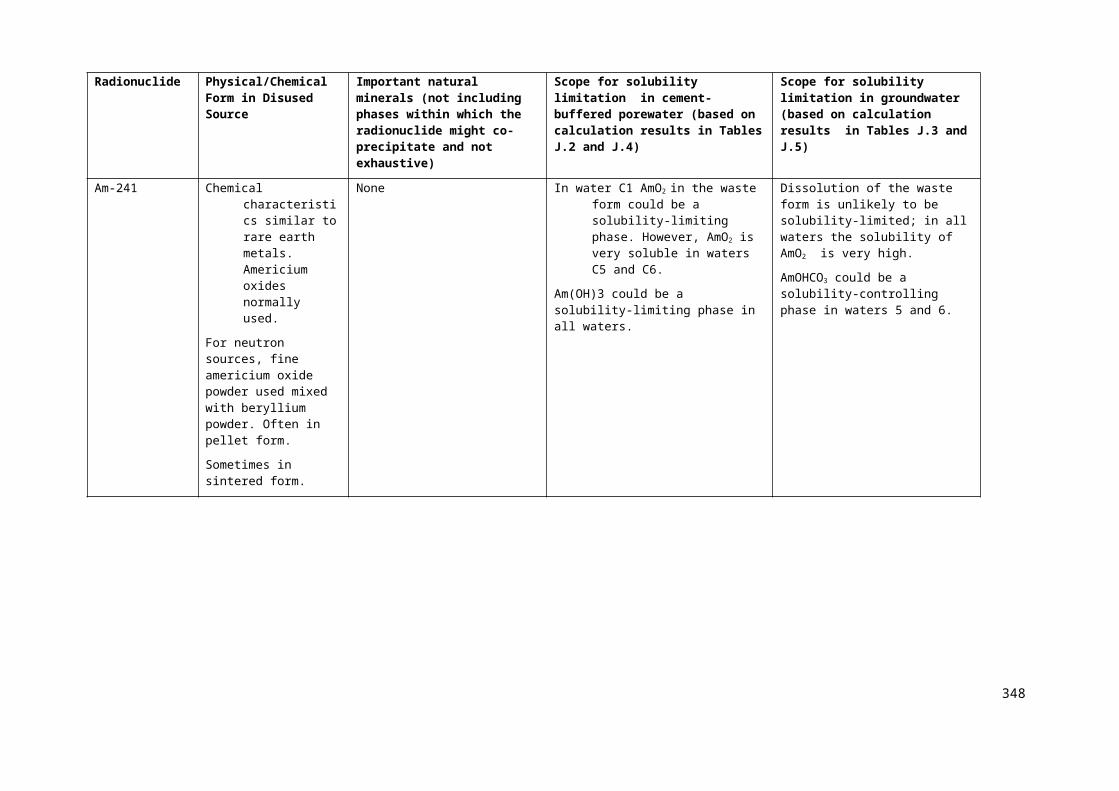
TABLE 142. PER PACKAGE ACTIVITY LEVELS FOR NO GEOSPHERE BARRIER
Near Field Per Package Activity Level (Bq)
Disposal Zone H-3 Co-60 Ni-63 Kr-85 Sr-90 Cs-137 Pb-210 Ra-226 Pu-238 Pu-239 Am-241
Unsaturated * * * * * * * * 2E+09 3E+10 4E+11
Saturated * * * * * * * * 5E+11 1E+12 7E+08
* denotes a total activity level that is greater than 2 x 10¹⁶ Bq.
358
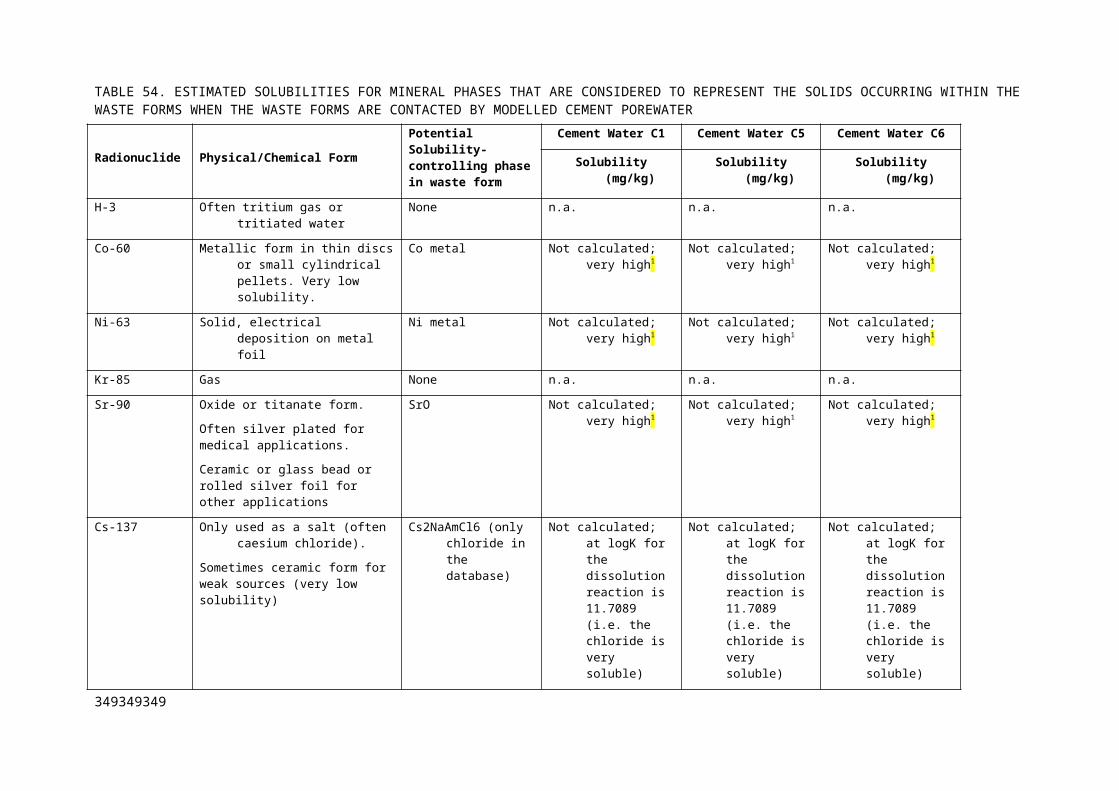
Unsaturated High Flow Porous Pu-238
1E+10 1E+11 1E+12 1E+13 1E+14 1E+15 1E+16 1E+17 1E+18
TOTAL ACTIVITY LEVELS FOR LIQUID RELEASE
Geosphere Kd reduced by 2 O.M
Cement Degradation increased by 1 O.M
Well at 10m Well at 1000m
Geosphere Kd increased by 2 O.M
Cement Kd reduced by 2 O.M Cement Kd increased by 2 O.M
Corrosion increased by 1 O.M
Drinking water only
No congruent release
Erosion
Erosion rate increased by 1 O.M
Erosion rate reduced by 1 O.M
Unsaturated High Flow Fractured Pu-238
1E+10 1E+11 1E+12 1E+13 1E+14 1E+15 1E+16 1E+17 1E+18
TOTAL ACTIVITY LEVELS FOR LIQUID RELEASE
Geosphere Kd reduced by 2 O.M
Cement Degradation increased by 1 O.M
Well at 10m Well at 1000m
Geosphere Kd increased by 2 O.M
Cement Kd reduced by 2 O.M Cement Kd increased by 2 O.M
Corrosion increased by 1 O.M
Drinking water only
No congruent release
Erosion
Erosion rate increased by 1 O.M
Erosion rate reduced by 1 O.M
Unsaturated Medium Flow Porous Pu-238
1E+10 1E+11 1E+12 1E+13 1E+14 1E+15 1E+16 1E+17 1E+18
TOTAL ACTIVITY LEVELS FOR LIQUID RELEASE
Geosphere Kd reduced by 2 O.M
Cement Degradation increased by 1 O.M
Well at 10m Well at 1000m
Geosphere Kd increased by 2 O.M
Cement Kd reduced by 2 O.M Cement Kd increased by 2 O.M
Corrosion increased by 1 O.M
Drinking water only
No congruent release
Erosion
Erosion rate increased by 1 O.M
Erosion rate reduced by 1 O.M
Unsaturated Low Flow Porous Pu-238
1E+10 1E+11 1E+12 1E+13 1E+14 1E+15 1E+16 1E+17 1E+18
TOTAL ACTIVITY LEVELS FOR LIQUID RELEASE
Geosphere Kd reduced by 2 O.M
Cement Degradation increased by 1 O.M
Well at 10m Well at 1000m
Geosphere Kd increased by 2 O.M
Cement Kd reduced by 2 O.M Cement Kd increased by 2 O.M
Corrosion increased by 1 O.M
Drinking water only
No congruent release
Erosion
Erosion rate increased by 1 O.M
Erosion rate reduced by 1 O.M
FIG. M.1. Pu-238 Doses for disposal in unaturated zone for variant cases.
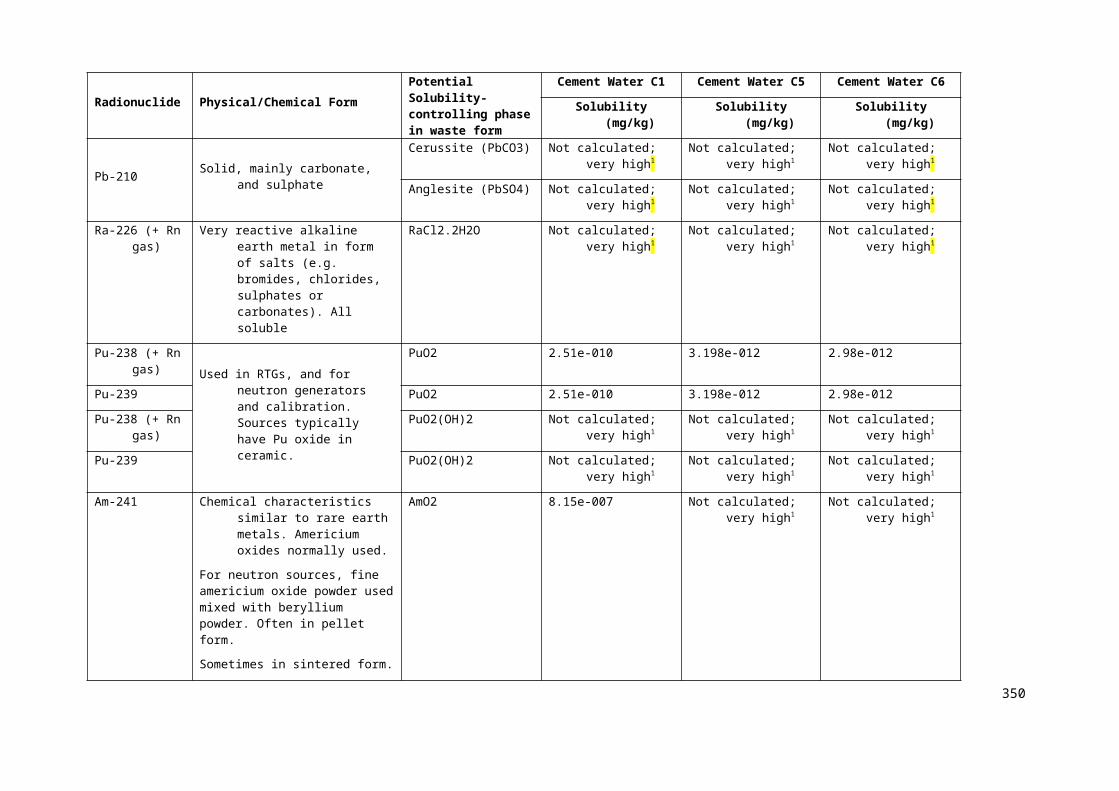
Saturated High Flow Porous Pu-238
1E+10 1E+11 1E+12 1E+13 1E+14 1E+15 1E+16 1E+17 1E+18
TOTAL ACTIVITY LEVELS FOR LIQUID RELEASE
Geosphere Kd reduced by 2 O.M
Cement Degradation increased by 1 O.M
Well at 10m Well at 1000m
Geosphere Kd increased by 2 O.M
Cement Kd reduced by 2 O.M Cement Kd increased by 2 O.M
Corrosion increased by 1 O.M
Drinking water only
No congruent release
Erosion
Erosion rate increased by 1 O.M
Erosion rate reduced by 1 O.M
Bathing only
Fishing only
Saturated High Flow Fractured Pu-238
1E+10 1E+11 1E+12 1E+13 1E+14 1E+15 1E+16 1E+17 1E+18
TOTAL ACTIVITY LEVELS FOR LIQUID RELEASE
Geosphere Kd reduced by 2 O.M
Cement Degradation increased by 1 O.M
Well at 10m Well at 1000m
Geosphere Kd increased by 2 O.M
Cement Kd reduced by 2 O.M Cement Kd increased by 2 O.M
Corrosion increased by 1 O.M
Drinking water only
No congruent release
Erosion
Erosion rate increased by 1 O.M
Erosion rate reduced by 1 O.M
Bathing only
Fishing only
Saturated Medium Flow Porous Pu-238
1E+10 1E+11 1E+12 1E+13 1E+14 1E+15 1E+16 1E+17 1E+18
TOTAL ACTIVITY LEVELS FOR LIQUID RELEASE
Geosphere Kd reduced by 2 O.M
Cement Degradation increased by 1 O.M
Well at 10m Well at 1000m
Geosphere Kd increased by 2 O.M
Cement Kd reduced by 2 O.M Cement Kd increased by 2 O.M
Corrosion increased by 1 O.M
Drinking water only
No congruent release
Erosion
Erosion rate increased by 1 O.M
Erosion rate reduced by 1 O.M
Bathing only
Fishing only
Saturated Low Flow Porous Pu-238
1E+10 1E+11 1E+12 1E+13 1E+14 1E+15 1E+16 1E+17 1E+18
TOTAL ACTIVITY LEVELS FOR LIQUID RELEASE
Geosphere Kd reduced by 2 O.M
Cement Degradation increased by 1 O.M
Well at 10m Well at 1000m
Geosphere Kd increased by 2 O.M
Cement Kd reduced by 2 O.M Cement Kd increased by 2 O.M
Corrosion increased by 1 O.M
Drinking water only
No congruent release
Erosion
Erosion rate increased by 1 O.M
Erosion rate reduced by 1 O.M
Bathing only
Fishing only
FIG. M.2. Pu-238 Doses for disposal in saturated zone for variant cases.
360

Unsaturated High Flow Porous Pu-239
1E+10 1E+11 1E+12 1E+13 1E+14 1E+15 1E+16 1E+17 1E+18
TOTAL ACTIVITY LEVELS FOR LIQUID RELEASE
Geosphere Kd reduced by 2 O.M
Cement Degradation increased by 1 O.M
Well at 10mWell at 1000m
Geosphere Kd increased by 2 O.M
Cement Kd reduced by 2 O.M Cement Kd increased by 2 O.M
Corrosion increased by 1 O.M
Drinking water only
No congruent release
Erosion
Erosion rate increased by 1 O.M
Erosion rate reduced by 1 O.M
Unsaturated High Flow Fractured Pu-239
1E+10 1E+11 1E+12 1E+13 1E+14 1E+15 1E+16 1E+17 1E+18
TOTAL ACTIVITY LEVELS FOR LIQUID RELEASE
Geosphere Kd reduced by 2 O.M
Cement Degradation increased by 1 O.M
Well at 10m Well at 1000m
Geosphere Kd increased by 2 O.M
Cement Kd reduced by 2 O.M Cement Kd increased by 2 O.M
Corrosion increased by 1 O.M
Drinking water only
No congruent release
Erosion
Erosion rate increased by 1 O.M
Erosion rate reduced by 1 O.M
Unsaturated Medium Flow Porous Pu-239
1E+10 1E+11 1E+12 1E+13 1E+14 1E+15 1E+16 1E+17 1E+18
TOTAL ACTIVITY LEVELS FOR LIQUID RELEASE
Geosphere Kd reduced by 2 O.M
Cement Degradation increased by 1 O.M
Well at 10m Well at 1000m
Geosphere Kd increased by 2 O.M
Cement Kd reduced by 2 O.M Cement Kd increased by 2 O.M
Corrosion increased by 1 O.M
Drinking water only
No congruent release
Erosion
Erosion rate increased by 1 O.M
Erosion rate reduced by 1 O.M
Unsaturated Low Flow Porous Pu-239
1E+10 1E+11 1E+12 1E+13 1E+14 1E+15 1E+16 1E+17 1E+18
TOTAL ACTIVITY LEVELS FOR LIQUID RELEASE
Geosphere Kd reduced by 2 O.M
Cement Degradation increased by 1 O.M
Well at 10m Well at 1000m
Geosphere Kd increased by 2 O.M
Cement Kd reduced by 2 O.M Cement Kd increased by 2 O.M
Corrosion increased by 1 O.M
Drinking water only
No congruent release
Erosion
Erosion rate increased by 1 O.M
Erosion rate reduced by 1 O.M
FIG. M.3. Pu-239 Doses for disposal in unsaturated zone for variant cases.
361361361
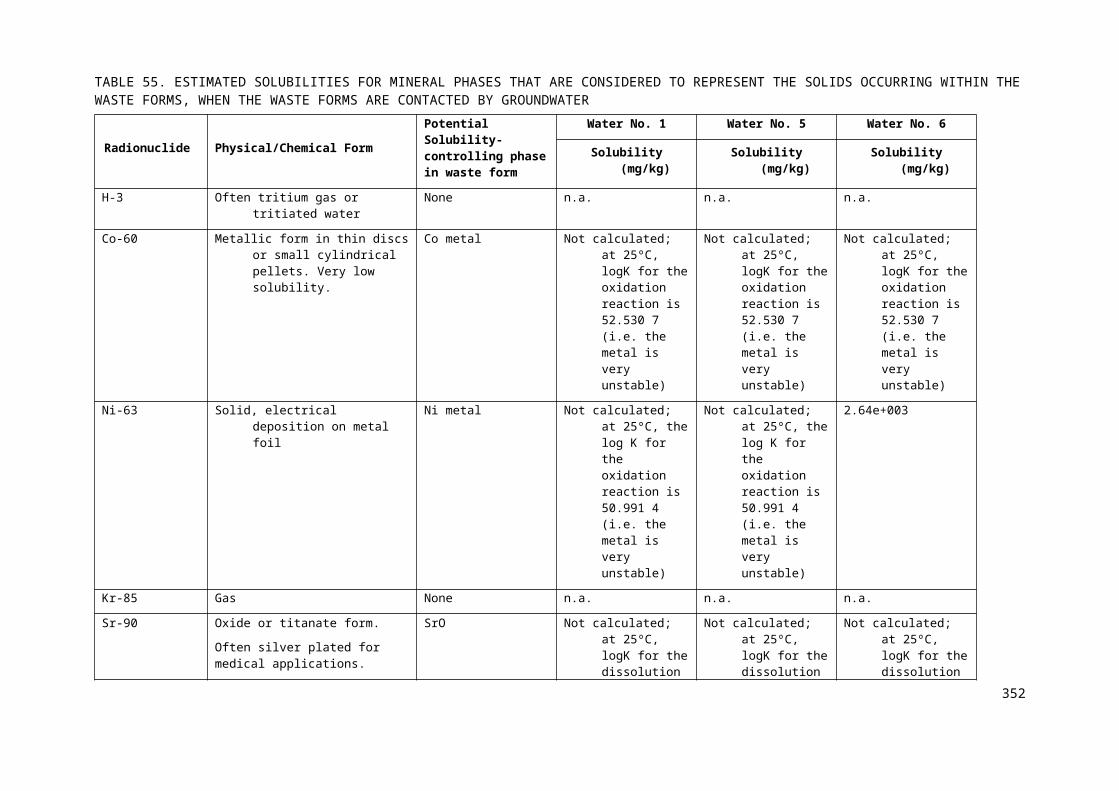
Saturated High Flow Porous Pu-239
1E+10 1E+11 1E+12 1E+13 1E+14 1E+15 1E+16 1E+17 1E+18
TOTAL ACTIVITY LEVELS FOR LIQUID RELEASE
Geosphere Kd reduced by 2 O.M
Cement Degradation increased by 1 O.M
Well at 10m Well at 1000m
Geosphere Kd increased by 2 O.M
Cement Kd reduced by 2 O.M Cement Kd increased by 2 O.M
Corrosion increased by 1 O.M
Drinking water only
No congruent release
Erosion
Erosion rate increased by 1 O.M
Erosion rate reduced by 1 O.M
Bathing only
Fishing only
Saturated High Flow Fractured Pu-239
1E+10 1E+11 1E+12 1E+13 1E+14 1E+15 1E+16 1E+17 1E+18
TOTAL ACTIVITY LEVELS FOR LIQUID RELEASE
Geosphere Kd reduced by 2 O.M
Cement Degradation increased by 1 O.M
Well at 10m Well at 1000m
Geosphere Kd increased by 2 O.M
Cement Kd reduced by 2 O.M Cement Kd increased by 2 O.M
Corrosion increased by 1 O.M
Drinking water only
No congruent release
Erosion
Erosion rate increased by 1 O.M
Erosion rate reduced by 1 O.M
Bathing only
Fishing only
Saturated Medium Flow Porous Pu-239
1E+10 1E+11 1E+12 1E+13 1E+14 1E+15 1E+16 1E+17 1E+18
TOTAL ACTIVITY LEVELS FOR LIQUID RELEASE
Geosphere Kd reduced by 2 O.M
Cement Degradation increased by 1 O.M
Well at 10m Well at 1000m
Geosphere Kd increased by 2 O.M
Cement Kd reduced by 2 O.M Cement Kd increased by 2 O.M
Corrosion increased by 1 O.M
Drinking water only
No congruent release
Erosion
Erosion rate increased by 1 O.M
Erosion rate reduced by 1 O.M
Bathing only
Fishing only
Saturated Low Flow Porous Pu-239
1E+10 1E+11 1E+12 1E+13 1E+14 1E+15 1E+16 1E+17 1E+18
TOTAL ACTIVITY LEVELS FOR LIQUID RELEASE
Geosphere Kd reduced by 2 O.M
Cement Degradation increased by 1 O.M
Well at 10m Well at 1000m
Geosphere Kd increased by 2 O.M
Cement Kd reduced by 2 O.M Cement Kd increased by 2 O.M
Corrosion increased by 1 O.M
Drinking water only
No congruent release
Erosion
Erosion rate increased by 1 O.M
Erosion rate reduced by 1 O.M
Bathing only
Fishing only
FIG. M.4. Pu-239 Doses for disposal in unsaturated zone for variant cases.
362
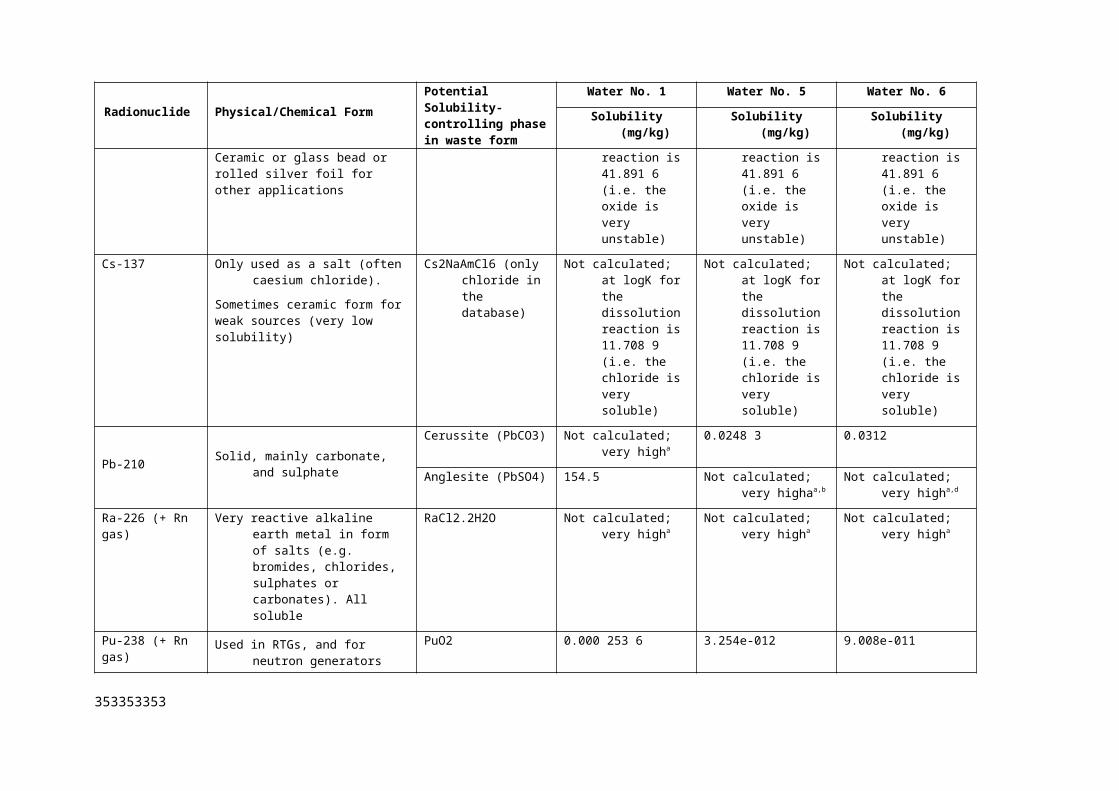
Unsaturated High Flow Porous Am-241
1E+10 1E+11 1E+12 1E+13 1E+14 1E+15 1E+16 1E+17 1E+18
TOTAL ACTIVITY LEVELS FOR LIQUID RELEASE
Geosphere Kd reduced by 2 O.M
Cement Degradation increased by 1 O.M
Well at 10mWell at 1000m
Geosphere Kd increased by 2 O.M
Cement Kd reduced by 2 O.M Cement Kd increased by 2 O.M
Corrosion increased by 1 O.M
Drinking water only
No congruent release
Erosion
Erosion rate increased by 1 O.M
Erosion rate reduced by 1 O.M
Unsaturated High Flow Fractured Am-241
1E+10 1E+11 1E+12 1E+13 1E+14 1E+15 1E+16 1E+17 1E+18
TOTAL ACTIVITY LEVELS FOR LIQUID RELEASE
Geosphere Kd reduced by 2 O.M
Cement Degradation increased by 1 O.M
Well at 10m Well at 1000m
Geosphere Kd increased by 2 O.M
Cement Kd reduced by 2 O.M Cement Kd increased by 2 O.M
Corrosion increased by 1 O.M
Drinking water only
No congruent release
Erosion
Erosion rate increased by 1 O.M
Erosion rate reduced by 1 O.M
Unsaturated Medium Flow Porous Am-241
1E+10 1E+11 1E+12 1E+13 1E+14 1E+15 1E+16 1E+17 1E+18
TOTAL ACTIVITY LEVELS FOR LIQUID RELEASE
Geosphere Kd reduced by 2 O.M
Cement Degradation increased by 1 O.M
Well at 10m Well at 1000m
Geosphere Kd increased by 2 O.M
Cement Kd reduced by 2 O.M Cement Kd increased by 2 O.M
Corrosion increased by 1 O.M
Drinking water only
No congruent release
Erosion
Erosion rate increased by 1 O.M
Erosion rate reduced by 1 O.M
Unsaturated Low Flow Porous Am-241
1E+10 1E+11 1E+12 1E+13 1E+14 1E+15 1E+16 1E+17 1E+18
TOTAL ACTIVITY LEVELS FOR LIQUID RELEASE
Geosphere Kd reduced by 2 O.M
Cement Degradation increased by 1 O.M
Well at 10m Well at 1000m
Geosphere Kd increased by 2 O.M
Cement Kd reduced by 2 O.M Cement Kd increased by 2 O.M
Corrosion increased by 1 O.M
Drinking water only
No congruent release
Erosion
Erosion rate increased by 1 O.M
Erosion rate reduced by 1 O.M
FIG. M.5. Am-241 Doses for disposal in unsaturated zone for variant cases.
363363363
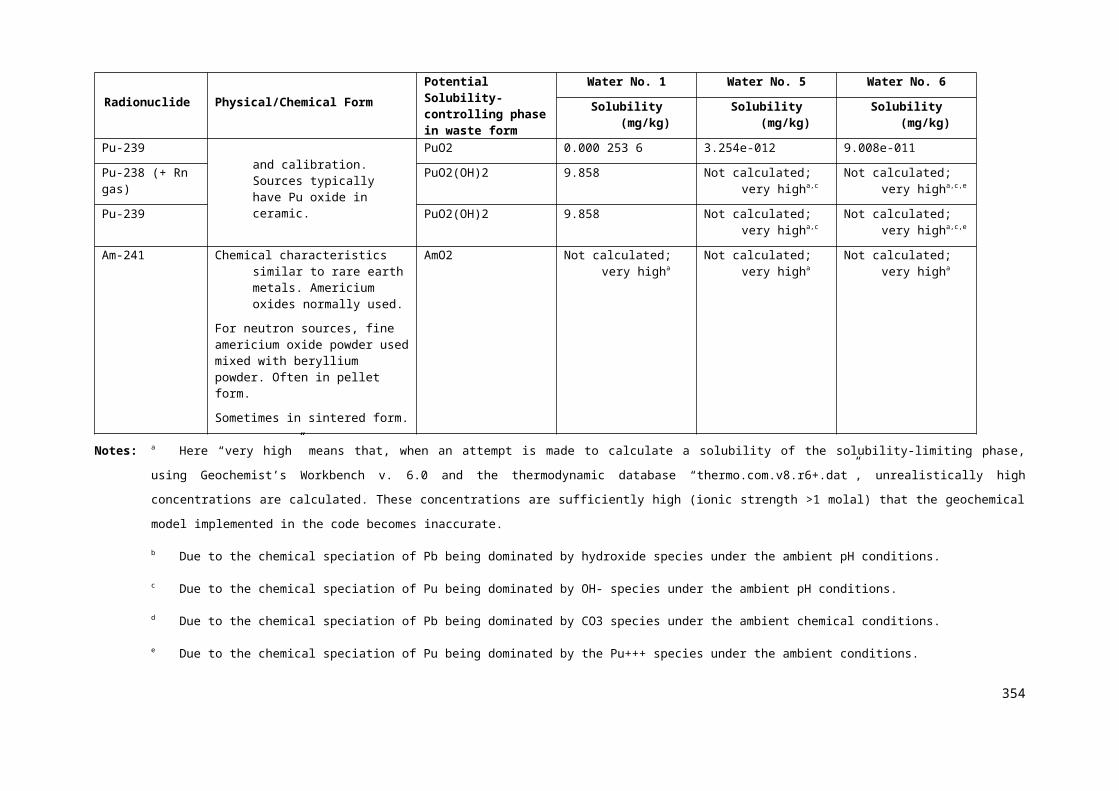
Saturated High Flow Porous Am-241
1E+10 1E+11 1E+12 1E+13 1E+14 1E+15 1E+16 1E+17 1E+18
TOTAL ACTIVITY LEVELS FOR LIQUID RELEASE
Geosphere Kd reduced by 2 O.M
Cement Degradation increased by 1 O.M
Well at 10m Well at 1000m
Geosphere Kd increased by 2 O.M
Cement Kd reduced by 2 O.M Cement Kd increased by 2 O.M
Corrosion increased by 1 O.M
Drinking water only
No congruent release
Erosion
Erosion rate increased by 1 O.M
Erosion rate reduced by 1 O.M
Bathing only
Fishing only
Saturated High Flow Fractured Am-241
1E+10 1E+11 1E+12 1E+13 1E+14 1E+15 1E+16 1E+17 1E+18
TOTAL ACTIVITY LEVELS FOR LIQUID RELEASE
Geosphere Kd reduced by 2 O.M
Cement Degradation increased by 1 O.M
Well at 10m Well at 1000m
Geosphere Kd increased by 2 O.M
Cement Kd reduced by 2 O.M Cement Kd increased by 2 O.M
Corrosion increased by 1 O.M
Drinking water only
No congruent release
Erosion
Erosion rate increased by 1 O.M
Erosion rate reduced by 1 O.M
Bathing only
Fishing only
Saturated Medium Flow Porous Am-241
1E+10 1E+11 1E+12 1E+13 1E+14 1E+15 1E+16 1E+17 1E+18
TOTAL ACTIVITY LEVELS FOR LIQUID RELEASE
Geosphere Kd reduced by 2 O.M
Cement Degradation increased by 1 O.M
Well at 10m Well at 1000m
Geosphere Kd increased by 2 O.M
Cement Kd reduced by 2 O.M Cement Kd increased by 2 O.M
Corrosion increased by 1 O.M
Drinking water only
No congruent release
Erosion
Erosion rate increased by 1 O.M
Erosion rate reduced by 1 O.M
Bathing only
Fishing only
Saturated Low Flow Porous Am-241
1E+10 1E+11 1E+12 1E+13 1E+14 1E+15 1E+16 1E+17 1E+18
TOTAL ACTIVITY LEVELS FOR LIQUID RELEASE
Geosphere Kd reduced by 2 O.M
Cement Degradation increased by 1 O.M
Well at 10m Well at 1000m
Geosphere Kd increased by 2 O.M
Cement Kd reduced by 2 O.M Cement Kd increased by 2 O.M
Corrosion increased by 1 O.M
Drinking water only
No congruent release
Erosion
Erosion rate increased by 1 O.M
Erosion rate reduced by 1 O.M
Bathing only
Fishing only
FIG.M.6. Am-241 Doses for disposal in saturated zone for variant cases.
364

CONTRIBUTORS TO DRAFTING AND REVIEW
Ahn, Sang-Myeon Korea Institute of Nuclear Safety, Republic of Korea
Ahonen, L. Geological Survey of Finland, Finland
Andrievskaya, L.A. Federal Agency of the Atomic Energy, Russian Federation
Ávila Moreno, R. Facilia AB, Sweden
Bérci, K. ETV-ERŐTERV Power Engineering and Contracting Co., Hungary
Bruno, G. Institut de Radioprotection et de Sûreté Nucléaire, France
Cochran, J.R. Sandia National Laboratories, United States of America
Crossland, I. Crossland Consulting Ltd., United Kingdom
Dadon, D. Israel Atomic Energy Commission, Israel
Gera, F. Private Consultant, Italy
Glover, E.T. Ghana Atomic Energy Commission, Ghana
Goldammer, W. Private Consultant, Germany
Guskov, Andrey MosNPO “Radon”, Russian Federation
Hazan, J. Israel Atomic Energy Commission, Israel
Ionescu, I.-A. National Commission for Nuclear Activities Control, Romania
Ji, Sung-Hoon Korea Atomic Energy Research Institute, Republic of Korea
Jova Sed, L.A. International Atomic Energy Agency
King, F. Integrity Corrosion Consulting Ltd., Canada
Kozak, M.W. Environmental Systems Assessment, United States of America
Little, R. Quintessa Limited, United Kingdom
Mbambo, Z. National Nuclear Regulator, South Africa
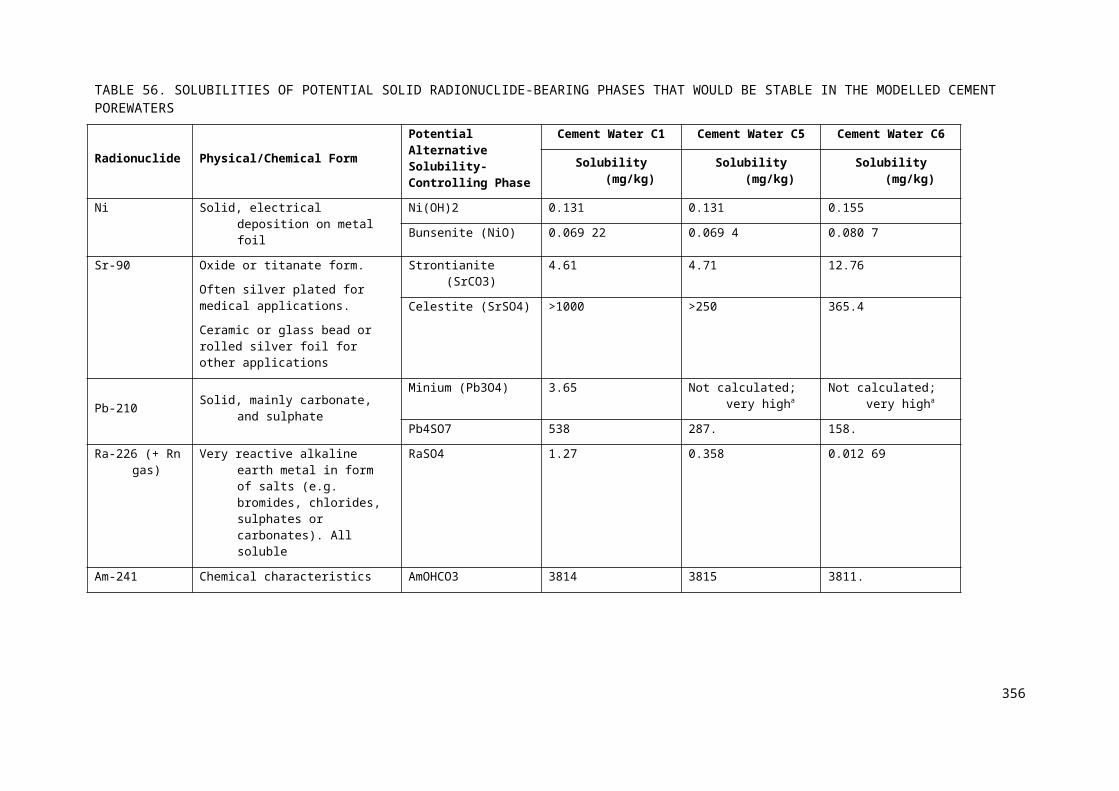
Motiejunas, S. Radioactive Waste Management Agency, Lithuania
Nair, R.N. Bhabha Atomic Research Centre, India
Nel, L. South African Nuclear Energy Corporation Limited, South Africa
Omondi Koteng, A. Radiation Protection Board, Kenya
Rizzo, S. Nucleco S.P.A., Italy
Schwartz, I. Israel Atomic Energy Commission, Israel
Seitz, R. Idaho Cleanup Project, United States of America
Steyn, I. National Nuclear Regulator, South Africa
Sun, Qinghong China Institute of Radiation Protection, China
Tkachenko, A. MosNPO “Radon”, Russian Federation
Veselic , M. Agency for Radwaste Management, Slovenia