Embed Size (px)
Citation preview
Hydraulics of floods upstream of horseshoecanyons and waterfallsMathieu G. A. Lapotre1 and Michael P. Lamb1
1Division of Geological and Planetary Sciences, California Institute of Technology, Pasadena, California, USA
Abstract Horseshoe waterfalls are ubiquitous in natural streams, bedrock canyons, and engineeringstructures. Nevertheless, water flow patterns upstream of horseshoe waterfalls are poorly known and likelydiffer from the better studied case of a one-dimensional linear step because of flow focusing into the horseshoe.This is a significant knowledge gap because the hydraulics at waterfalls controls sediment transport and bedrockincision, which can compromise the integrity of engineered structures and influence the evolution of rivercanyons on Earth and Mars. Here we develop new semiempirical theory for the spatial acceleration of waterupstream of, and the cumulative discharge into, horseshoe canyons and waterfalls. To this end, we performed110 numerical experiments by solving the 2-D depth-averaged shallow-water equations for a wide rangeof flood depths, widths and discharges, and canyon lengths, widths and bed gradients. We show that theupstream, normal flow Froude number is the dominant control on lateral flow focusing and acceleration into thecanyon head and that focusing is limited when the flood width is small compared to a cross-stream backwaterlength scale. In addition, for sheet floodsmuch wider than the canyon, flow focusing into the canyon head leadsto reduced discharge (and drying in cases) across the canyon sidewalls, which is especially pronounced forcanyons that are much longer than they are wide. Our results provide new expectations for morphodynamicfeedbacks between floods and topography, and thus canyon formation.
1. Introduction
The hydraulics of waterfalls have been studied for over a century [e.g., Bresse, 1860], largely in response tothe development of dams and other engineered structures [e.g., Chanson, 1994, 1995, 2002] (Figure 1f). Inaddition to their importance in hydraulic engineering, waterfalls play a major role in channel erosion [Flint,1973; Dietrich and Dunne, 1993] and often form because of changes in climate, tectonics, and sea level[Brush and Wolman, 1960; Leopold and Bull, 1979; Gardner, 1983; Howard et al., 1994; Bishop et al., 2005;DiBiase et al., 2014; Lamb et al., 2014; Mackey et al., 2014]. Waterfalls on Earth (Figures 1d, 1g, and 1h)[Gilbert, 1907], but also dry cataracts on Earth and Mars (Figures 1e, 1i, and 1j), are often horseshoeshaped and create canyons with amphitheater-shaped heads [Bretz, 1969; Baker and Milton, 1974;O’Connor, 1993; Lamb et al., 2008, 2014; Warner et al., 2010; DiBiase et al., 2014; Baynes et al., 2015]. Thisgeometry is observed at various scales, from decimeter-scale rills (Figure 1c) to meter-scale rivers andchannel heads (Figures 1a, 1b, and 1h) to hundreds of meters to kilometer-scale megaflood canyons(Figures 1e, 1i, and 1j).
The horseshoe shape of waterfalls likely influences plan view flow patterns upstream by focusing watertoward the center of the horseshoe [e.g., Pasternack et al., 2006, 2007]. Water accelerates as it movestoward a waterfall due to the reduction in pressure to atmospheric at the waterfall brink. Accelerationand lateral flow convergence (i.e., flow focusing) control the velocity, discharge, and size of the jetimpinging in the plunge pool [Chanson, 1994; Flores-Cervantes et al., 2006; Tokyay and Yildiz, 2007], whichultimately sets the pace of undercutting and potential collapse of the cliff face [Dietrich and Dunne, 1993;Stein et al., 1993; Alonso et al., 2002; Stein and LaTray, 2002; Lamb et al., 2007]. Flow acceleration alsoenhances the bed shear stress exerted by the flow at the waterfall brink [Stein and Julien, 1993; Havivet al., 2006] and thus promotes plucking and toppling of jointed rock [Annandale, 1995; Hancock et al.,1998; Whipple et al., 2000; Coleman et al., 2003; Wohl, 2008; Chatanantavet and Parker, 2009; Lamb andDietrich, 2009; Dubinski and Wohl, 2013]. Moreover, larger flow discharges into canyon heads allowtransport of larger sediment and higher sediment transport rates downstream of the waterfall as long assediment is available [Meyer-Peter and Muller, 1948; Fernandez Luque and Van Beek, 1976], which exertimportant controls on the stability of engineering dams and spillways, as well as canyon evolution over
LAPOTRE AND LAMB FLOOD HYDRAULICS UPSTREAM OF WATERFALLS 1227
PUBLICATIONSJournal of Geophysical Research: Earth Surface
RESEARCH ARTICLE10.1002/2014JF003412
Key Points:• Flow convergence at waterfallsincreases flow velocity, bed stress,and discharge
• Convergence is strong for laterallyextensive, subcritical floods
• Wall effects and drawdownhydrodynamics may set waterfallwidth
Correspondence to:M. G. A. Lapotre,[email protected]
Citation:Lapotre, M. G. A., and M. P. Lamb (2015),Hydraulics of floods upstream ofhorseshoe canyons and waterfalls,J. Geophys. Res. Earth Surf., 120, 1227–1250,doi:10.1002/2014JF003412.
Received 10 DEC 2014Accepted 11 MAY 2015Accepted article online 11 MAY 2015Published online 14 JUL 2015
©2015. American Geophysical Union.All Rights Reserved.
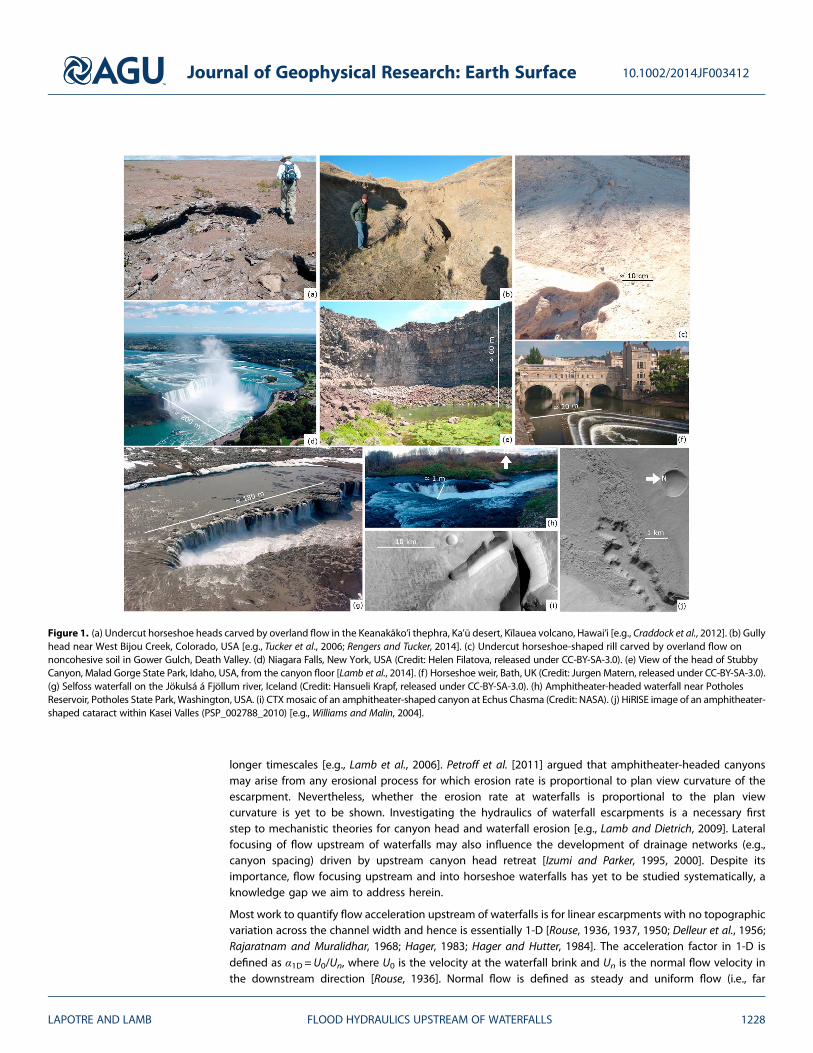
longer timescales [e.g., Lamb et al., 2006]. Petroff et al. [2011] argued that amphitheater-headed canyonsmay arise from any erosional process for which erosion rate is proportional to plan view curvature of theescarpment. Nevertheless, whether the erosion rate at waterfalls is proportional to the plan viewcurvature is yet to be shown. Investigating the hydraulics of waterfall escarpments is a necessary firststep to mechanistic theories for canyon head and waterfall erosion [e.g., Lamb and Dietrich, 2009]. Lateralfocusing of flow upstream of waterfalls may also influence the development of drainage networks (e.g.,canyon spacing) driven by upstream canyon head retreat [Izumi and Parker, 1995, 2000]. Despite itsimportance, flow focusing upstream and into horseshoe waterfalls has yet to be studied systematically, aknowledge gap we aim to address herein.
Most work to quantify flow acceleration upstream of waterfalls is for linear escarpments with no topographicvariation across the channel width and hence is essentially 1-D [Rouse, 1936, 1937, 1950; Delleur et al., 1956;Rajaratnam and Muralidhar, 1968; Hager, 1983; Hager and Hutter, 1984]. The acceleration factor in 1-D isdefined as α1D =U0/Un, where U0 is the velocity at the waterfall brink and Un is the normal flow velocity inthe downstream direction [Rouse, 1936]. Normal flow is defined as steady and uniform flow (i.e., far
Figure 1. (a) Undercut horseshoe heads carved by overland flow in the Keanakāko’i thephra, Ka’ū desert, Kīlauea volcano, Hawai’i [e.g., Craddock et al., 2012]. (b) Gullyhead near West Bijou Creek, Colorado, USA [e.g., Tucker et al., 2006; Rengers and Tucker, 2014]. (c) Undercut horseshoe-shaped rill carved by overland flow onnoncohesive soil in Gower Gulch, Death Valley. (d) Niagara Falls, New York, USA (Credit: Helen Filatova, released under CC-BY-SA-3.0). (e) View of the head of StubbyCanyon, Malad Gorge State Park, Idaho, USA, from the canyon floor [Lamb et al., 2014]. (f) Horseshoe weir, Bath, UK (Credit: Jurgen Matern, released under CC-BY-SA-3.0).(g) Selfoss waterfall on the Jökulsá á Fjöllum river, Iceland (Credit: Hansueli Krapf, released under CC-BY-SA-3.0). (h) Amphitheater-headed waterfall near PotholesReservoir, Potholes State Park, Washington, USA. (i) CTX mosaic of an amphitheater-shaped canyon at Echus Chasma (Credit: NASA). (j) HiRISE image of an amphitheater-shaped cataract within Kasei Valles (PSP_002788_2010) [e.g., Williams and Malin, 2004].
Journal of Geophysical Research: Earth Surface 10.1002/2014JF003412
LAPOTRE AND LAMB FLOOD HYDRAULICS UPSTREAM OF WATERFALLS 1228
upstream, where flow is not affected by thepresence of the waterfall) [Chow, 1959].Thus, α1D> 1 implies faster flow at thewaterfall brink due to spatial acceleration.
Natural horseshoe waterfalls and manyengineering structures depart from a purelyone-dimensional linear step, and flowvelocities at the waterfall brink anddischarge into canyon head likely differsignificantly from the 1-D case. In specificapplications, waterfall geometry has beenaccounted for using sophisticated 3-D flowsimulations [e.g., Feurich et al., 2011].However, no study has systematicallyinvestigated how flow acceleration,discharge into the canyon head, and lateralflow focusing are affected by waterfallplanform geometry across a wide rangeof canyon sizes, flood sizes, and Froudenumbers.
We aim to test the hypotheses that thehorseshoe geometry of waterfalls resultsin flow accelerations that differ from the1-D case and that flow discharge per unitwidth into the canyon head is increasedowing to lateral flow focusing. To do this,we performed a series of numericalexperiments. In section 2, we describe ourmodeling objectives, identify potentialcontrols on flow focusing upstream ofhorseshoe waterfalls, and explain ourmodeling strategy. In section 3, wedescribe the numerical model ANUGA[Roberts et al., 2008, 2009] which is used toinvestigate focusing of floods into canyonsof different sizes. In section 4, wesynthesize results of the experiments. Insection 5, we develop semiempirical
functional relationships for flow acceleration and cumulative head discharge. Last, we discuss applicationto engineered horseshoe spillways and controls on waterfall formation and shape.
2. Modeling Objectives
Ourmodeling goal is to systematically evaluate the cumulative discharge and flowacceleration factor around thebrink of 2-D horseshoe waterfalls as a function of canyon width, length, upstream bed slope, flood width, flooddischarge, and normal flow Froude number. In particular, we seek a generic relationship for the flow accelerationfactor and flow discharge for 2-D waterfalls. To accomplish our goal, in this section, we define quantitativemetrics that will be used to define the effects of 2-D flow focusing. Next, we use dimensional analysis toformulate quantitative hypotheses for the functional relationships between these metrics and the relevanttopographic and hydraulic parameters. Finally, we describe the modeling strategy and parameter space covered.
2.1. Two-Dimensional Flow Focusing Metrics
In 1-D open-channel flowwith constant channel width, the volumetric water discharge per unit width (q=Uh,where h is flow depth) is conserved such that the discharge over the waterfall (q0 =U0h0) is equal to the
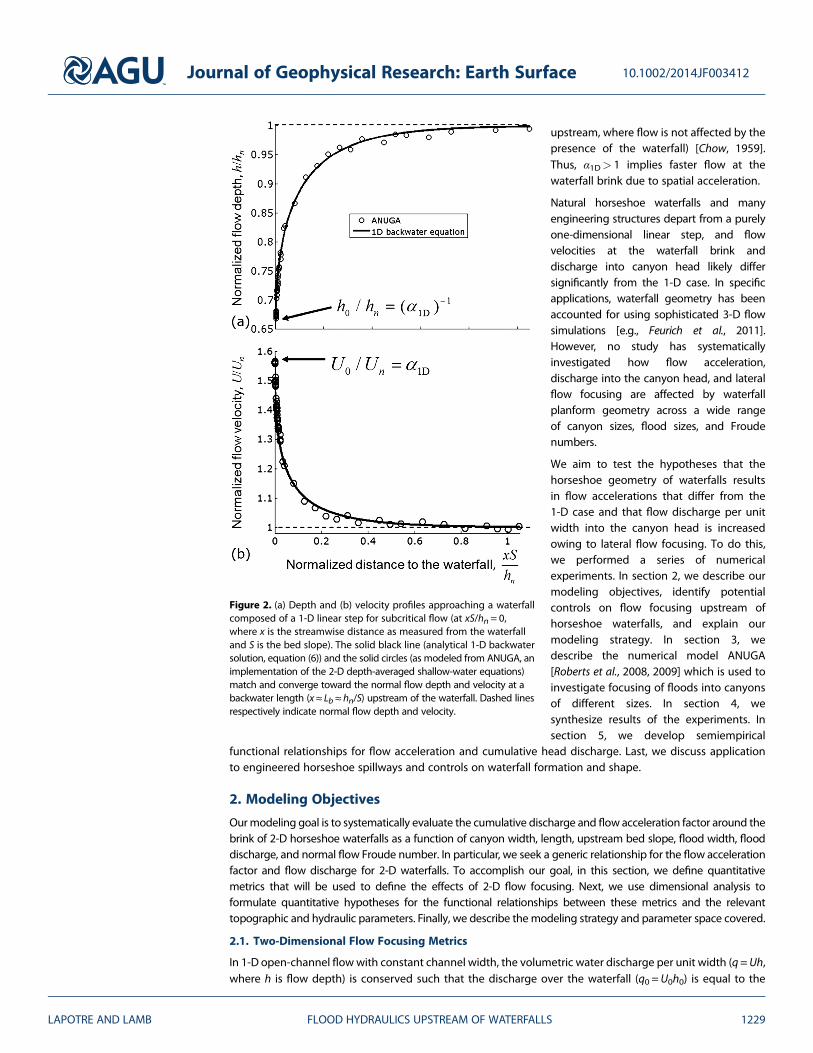
Figure 2. (a) Depth and (b) velocity profiles approaching a waterfallcomposed of a 1-D linear step for subcritical flow (at xS/hn = 0,where x is the streamwise distance as measured from the waterfalland S is the bed slope). The solid black line (analytical 1-D backwatersolution, equation (6)) and the solid circles (as modeled from ANUGA, animplementation of the 2-D depth-averaged shallow-water equations)match and converge toward the normal flow depth and velocity at abackwater length (x≈ Lb≈ hn/S) upstream of the waterfall. Dashed linesrespectively indicate normal flow depth and velocity.
Journal of Geophysical Research: Earth Surface 10.1002/2014JF003412
LAPOTRE AND LAMB FLOOD HYDRAULICS UPSTREAM OF WATERFALLS 1229
normal flow discharge upstream (qn=Unhn), and therefore, α1D =U0/Un= hn/h0 (Figure 2), where hn is thenormal flow depth and h0 is the flow depth at the waterfall brink. The acceleration factor in 1-D was foundto be well approximated by [Rouse, 1936; Hager, 1983]
α1D ≡U0
Un¼
1þ ε
Frn2=3; if Frn < 1
Frn2 þ εFrn2
; if Frn≥1
8>>><>>>:
(1)
where ε≈ 0.4 is an empirical constant that accounts for the deviation of pressure from hydrostatic atthe waterfall brink and Frn ¼ Un=
ffiffiffiffiffiffiffiffighn
pis the normal flow Froude number. For subcritical flows
(Frn< 1), equation (1) results in a Froude number at the waterfall brink, Fr0, of about 1.66 (i.e.,Fr0 = α1D
3/2Frn = (1 + ε)3/2 ≈ 1.66) regardless of the upstream Froude number (Frn). For supercritical flowupstream of the waterfall (Frn> 1), equation (1) results in an acceleration factor that approaches unity(i.e., Fr0 ≈ Frn) as Frn increases.
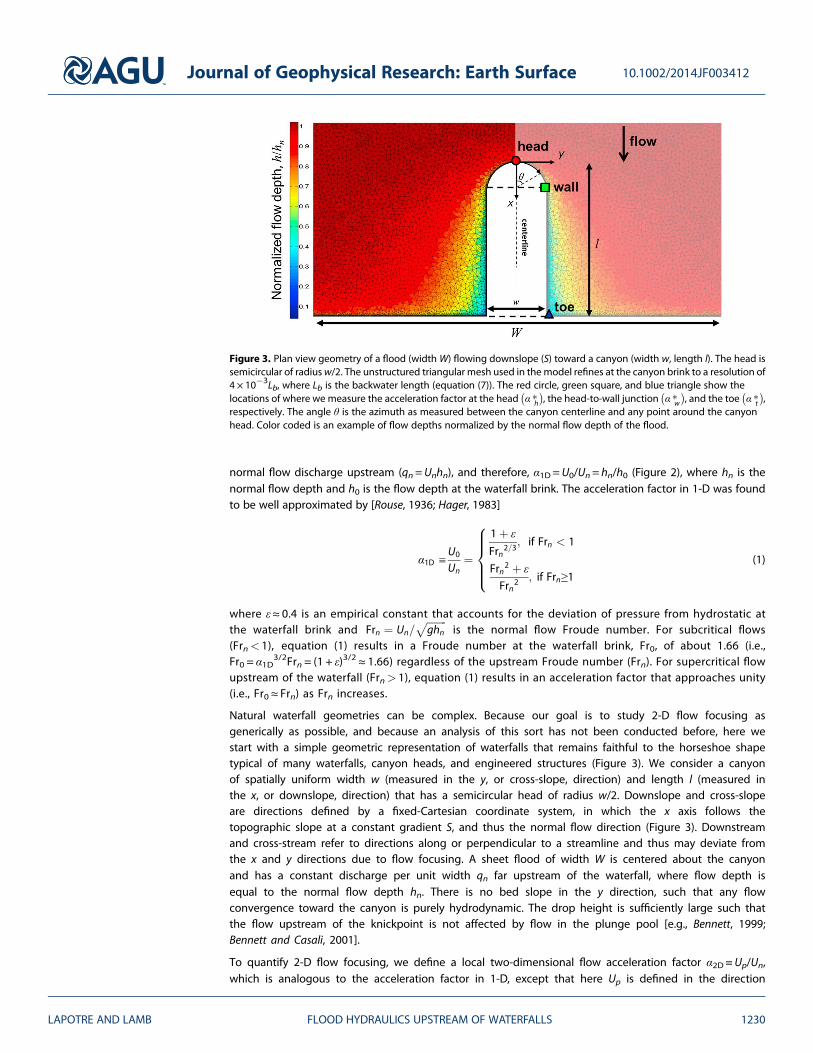
Natural waterfall geometries can be complex. Because our goal is to study 2-D flow focusing asgenerically as possible, and because an analysis of this sort has not been conducted before, here westart with a simple geometric representation of waterfalls that remains faithful to the horseshoe shapetypical of many waterfalls, canyon heads, and engineered structures (Figure 3). We consider a canyonof spatially uniform width w (measured in the y, or cross-slope, direction) and length l (measured inthe x, or downslope, direction) that has a semicircular head of radius w/2. Downslope and cross-slopeare directions defined by a fixed-Cartesian coordinate system, in which the x axis follows thetopographic slope at a constant gradient S, and thus the normal flow direction (Figure 3). Downstreamand cross-stream refer to directions along or perpendicular to a streamline and thus may deviate fromthe x and y directions due to flow focusing. A sheet flood of width W is centered about the canyonand has a constant discharge per unit width qn far upstream of the waterfall, where flow depth isequal to the normal flow depth hn. There is no bed slope in the y direction, such that any flowconvergence toward the canyon is purely hydrodynamic. The drop height is sufficiently large such thatthe flow upstream of the knickpoint is not affected by flow in the plunge pool [e.g., Bennett, 1999;Bennett and Casali, 2001].
To quantify 2-D flow focusing, we define a local two-dimensional flow acceleration factor α2D≡Up/Un,which is analogous to the acceleration factor in 1-D, except that here Up is defined in the direction
Figure 3. Plan view geometry of a flood (widthW) flowing downslope (S) toward a canyon (width w, length l). The head issemicircular of radiusw/2. The unstructured triangular mesh used in themodel refines at the canyon brink to a resolution of4 × 10�3Lb, where Lb is the backwater length (equation (7)). The red circle, green square, and blue triangle show thelocations of where we measure the acceleration factor at the head α �h
� �, the head-to-wall junction α �w
� �, and the toe α �t
� �,
respectively. The angle θ is the azimuth as measured between the canyon centerline and any point around the canyonhead. Color coded is an example of flow depths normalized by the normal flow depth of the flood.
Journal of Geophysical Research: Earth Surface 10.1002/2014JF003412
LAPOTRE AND LAMB FLOOD HYDRAULICS UPSTREAM OF WATERFALLS 1230
perpendicular to the local canyon brink (because it is this component only that will contribute to dischargeinto the canyon head), such that α2D is a local quantity that is likely to vary at different locations along thewaterfall brink. To highlight truly 2-D effects, throughout this paper, we will use an acceleration factor ratioα*, defined as
α* ≡α2Dα1D
(2)
such that α* = 1 corresponds to scenarios that show only 1-D flow acceleration.
To quantify changes in discharge to the waterfall as a result of lateral flow focusing, we define the localdischarge per unit width as q0 =Uph. The total discharge entering the semicircular canyon head is
then Qh ¼ ∫π=2
θ¼�π=2
q0 θð Þw2dθ , where θ is the azimuth with respect to the canyon centerline. The
normalized cumulative head discharge q* is defined as the ratio of Qh to Qn, in which Qn= qnw is thenormal flow discharge flowing across a length w, that is,
q* ≡Qh
Qn¼ 1
qn∫π=2
θ¼0
q0 θð Þdθ (3)
A normalized cumulative head discharge of unity (q* = 1) corresponds to the case where no lateral flowfocusing is observed.
2.2. Dimensional Analysis and Hypotheses
To identify the controlling variables on flow acceleration (α*) and normalized cumulative flow discharge (q*),we use dimensional analysis for flow acceleration at steady state. Consequently, the flow variables (velocitiesand depth) around the canyon are time independent and fully determined by seven dimensional variables:inflow discharge per unit width qn, acceleration of gravity g, normal flow depth hn, canyon width w, floodwidth W, canyon length l, and bed slope S. This problem can be recast in terms of five dimensionlessparameters,
α*; q*ð Þ ¼ f Frn;w*;W*; l*; Sð Þ (4)
where w* ¼ wW is the canyon width to flood width ratio, W* ¼ W�wð ÞS
2hnis herein called the flood width
limitation factor, and l* ¼ lShn
is herein called the downslope backwater factor (Figure 4). The normal flowdepth can be defined as hn ¼ Cf Un
2
gS , where Cf ¼ Un2
u2�is a bed friction coefficient and u* is the bed shear
velocity [e.g., Chow, 1959].
Dimensional analysis does not dictate which dimensionless numbers are best suited to describe the physicsof flow focusing. In the rest of this section, we describe why the dimensionless numbers we picked makeintuitive sense and are likely relevant to flow focusing upstream of canyons.
The normal flow Froude number Frn ¼ Un=ffiffiffiffiffiffiffiffighn
p� �describes the ratio of downstream oriented, normal flow
velocity to the shallow-water-wave speed. For Frn< 1, the velocity of shallow-water wavesffiffiffiffiffiffiffiffighn
p� �is
greater than the flow velocity (Un), and thus, waves can propagate in all directions. For Frn> 1, thevelocity of waves is smaller than that of the flow, and waves can only propagate downstream and cross-stream. Consequently, the Froude number sets the direction and distance at which hydraulic informationpropagates and is thus expected to exert a major control on the degree to which water is focusedtoward the canyon head.
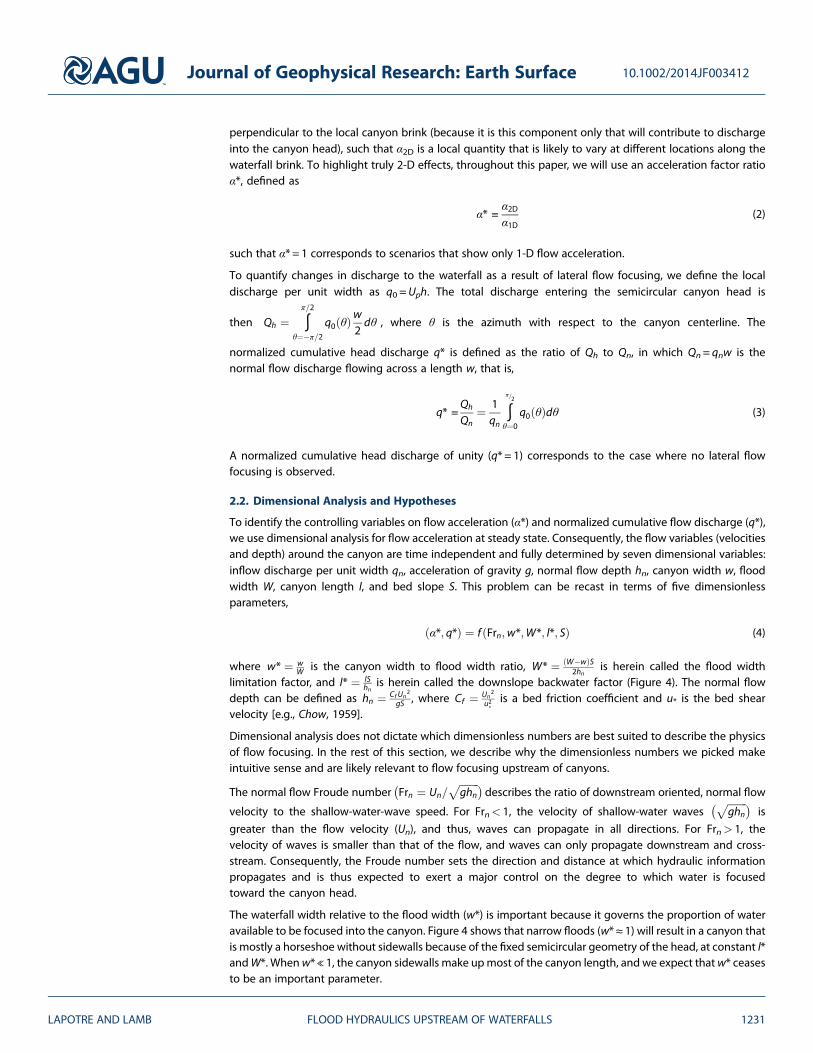
The waterfall width relative to the flood width (w*) is important because it governs the proportion of wateravailable to be focused into the canyon. Figure 4 shows that narrow floods (w*≈ 1) will result in a canyon thatis mostly a horseshoe without sidewalls because of the fixed semicircular geometry of the head, at constant l*andW*. Whenw*≪ 1, the canyon sidewalls make upmost of the canyon length, and we expect thatw* ceasesto be an important parameter.
Journal of Geophysical Research: Earth Surface 10.1002/2014JF003412
LAPOTRE AND LAMB FLOOD HYDRAULICS UPSTREAM OF WATERFALLS 1231
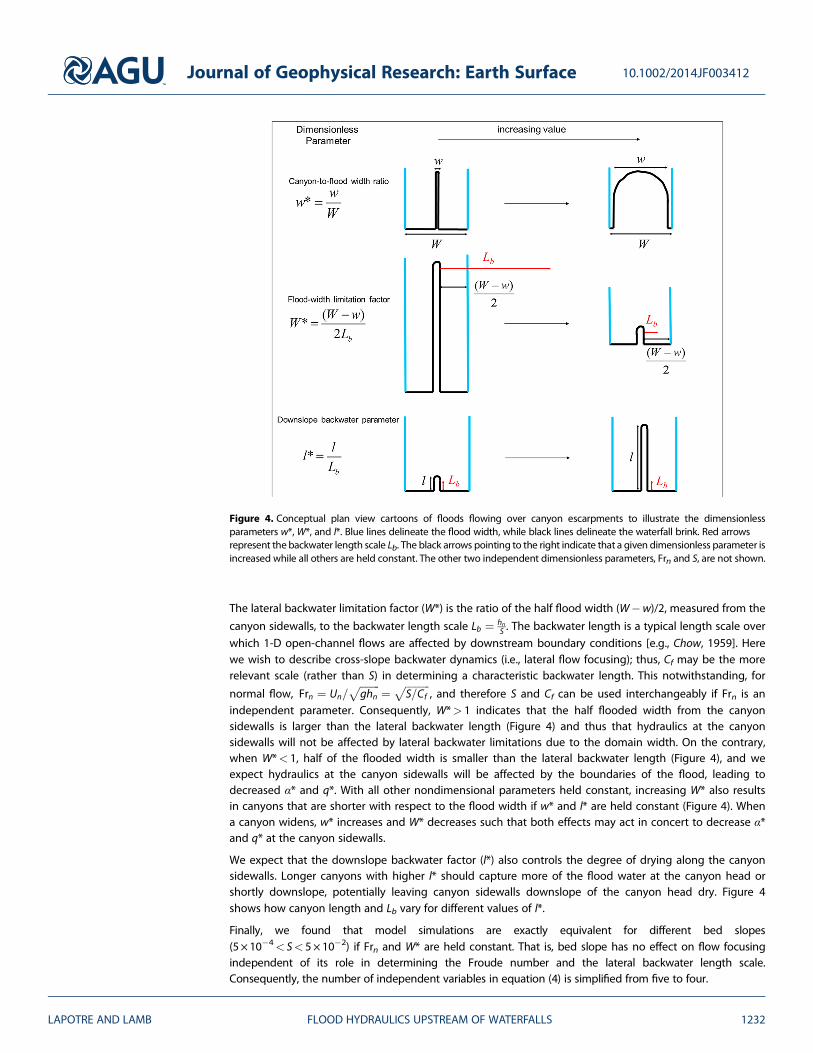
The lateral backwater limitation factor (W*) is the ratio of the half flood width (W�w)/2, measured from the
canyon sidewalls, to the backwater length scale Lb ¼ hnS . The backwater length is a typical length scale over
which 1-D open-channel flows are affected by downstream boundary conditions [e.g., Chow, 1959]. Herewe wish to describe cross-slope backwater dynamics (i.e., lateral flow focusing); thus, Cf may be the morerelevant scale (rather than S) in determining a characteristic backwater length. This notwithstanding, for
normal flow, Frn ¼ Un=ffiffiffiffiffiffiffiffighn
p ¼ ffiffiffiffiffiffiffiffiffiffiS=Cf
p, and therefore S and Cf can be used interchangeably if Frn is an
independent parameter. Consequently, W*> 1 indicates that the half flooded width from the canyonsidewalls is larger than the lateral backwater length (Figure 4) and thus that hydraulics at the canyonsidewalls will not be affected by lateral backwater limitations due to the domain width. On the contrary,when W*< 1, half of the flooded width is smaller than the lateral backwater length (Figure 4), and weexpect hydraulics at the canyon sidewalls will be affected by the boundaries of the flood, leading todecreased α* and q*. With all other nondimensional parameters held constant, increasing W* also resultsin canyons that are shorter with respect to the flood width if w* and l* are held constant (Figure 4). Whena canyon widens, w* increases and W* decreases such that both effects may act in concert to decrease α*and q* at the canyon sidewalls.
We expect that the downslope backwater factor (l*) also controls the degree of drying along the canyonsidewalls. Longer canyons with higher l* should capture more of the flood water at the canyon head orshortly downslope, potentially leaving canyon sidewalls downslope of the canyon head dry. Figure 4shows how canyon length and Lb vary for different values of l*.
Finally, we found that model simulations are exactly equivalent for different bed slopes(5× 10�4< S< 5×10�2) if Frn and W* are held constant. That is, bed slope has no effect on flow focusingindependent of its role in determining the Froude number and the lateral backwater length scale.Consequently, the number of independent variables in equation (4) is simplified from five to four.
Figure 4. Conceptual plan view cartoons of floods flowing over canyon escarpments to illustrate the dimensionlessparameters w*,W*, and l*. Blue lines delineate the flood width, while black lines delineate the waterfall brink. Red arrowsrepresent the backwater length scale Lb. The black arrows pointing to the right indicate that a given dimensionless parameter isincreased while all others are held constant. The other two independent dimensionless parameters, Frn and S, are not shown.
Journal of Geophysical Research: Earth Surface 10.1002/2014JF003412
LAPOTRE AND LAMB FLOOD HYDRAULICS UPSTREAM OF WATERFALLS 1232
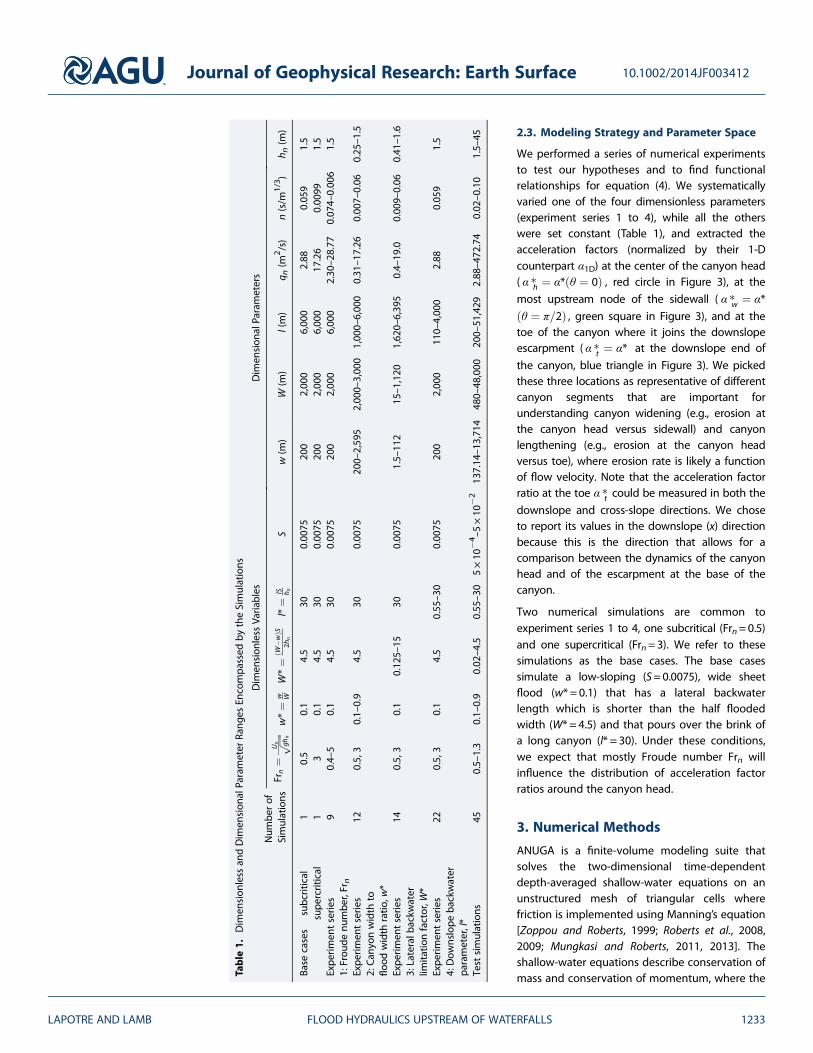
2.3. Modeling Strategy and Parameter Space
We performed a series of numerical experimentsto test our hypotheses and to find functionalrelationships for equation (4). We systematicallyvaried one of the four dimensionless parameters(experiment series 1 to 4), while all the otherswere set constant (Table 1), and extracted theacceleration factors (normalized by their 1-Dcounterpart α1D) at the center of the canyon head( α �h ¼ α* θ ¼ 0ð Þ , red circle in Figure 3), at the
most upstream node of the sidewall ( α �w ¼ α*θ ¼ π=2ð Þ , green square in Figure 3), and at thetoe of the canyon where it joins the downslopeescarpment ( α �t ¼ α* at the downslope end of
the canyon, blue triangle in Figure 3). We pickedthese three locations as representative of differentcanyon segments that are important forunderstanding canyon widening (e.g., erosion atthe canyon head versus sidewall) and canyonlengthening (e.g., erosion at the canyon headversus toe), where erosion rate is likely a functionof flow velocity. Note that the acceleration factorratio at the toe α �t could be measured in both the
downslope and cross-slope directions. We choseto report its values in the downslope (x) directionbecause this is the direction that allows for acomparison between the dynamics of the canyonhead and of the escarpment at the base of thecanyon.
Two numerical simulations are common toexperiment series 1 to 4, one subcritical (Frn=0.5)and one supercritical (Frn=3). We refer to thesesimulations as the base cases. The base casessimulate a low-sloping (S=0.0075), wide sheetflood (w* = 0.1) that has a lateral backwaterlength which is shorter than the half floodedwidth (W* = 4.5) and that pours over the brink ofa long canyon (l* = 30). Under these conditions,we expect that mostly Froude number Frn willinfluence the distribution of acceleration factorratios around the canyon head.
3. Numerical Methods
ANUGA is a finite-volume modeling suite thatsolves the two-dimensional time-dependentdepth-averaged shallow-water equations on anunstructured mesh of triangular cells wherefriction is implemented using Manning’s equation[Zoppou and Roberts, 1999; Roberts et al., 2008,2009; Mungkasi and Roberts, 2011, 2013]. Theshallow-water equations describe conservation ofmass and conservation of momentum, where theTa
ble
1.Dim
ension
less
andDim
ension
alParameter
Rang
esEn
compa
ssed
bytheSimulations
Num
berof
Simulations
Dim
ension
less
Varia
bles
Dim
ension
alParameters
Frn¼
Un ffiffiffiffiffiffi gh
n
pw*¼
w WW*¼
W�w
ðÞS
2hn
l*¼
lS h nS
w(m
)W
(m)
l(m)
q n(m
2/s)
n(s/m
1/3)
h n(m
)
Base
cases
subc
ritical
10.5
0.1
4.5
300.00
7520
02,00
06,00
02.88
0.05
91.5
supe
rcritical
13
0.1
4.5
300.00
7520
02,00
06,00
017
.26
0.00
991.5
Expe
rimen
tserie
s1:Frou
denu
mbe
r,Frn
90.4–
50.1
4.5
300.00
7520
02,00
06,00
02.30
–28.77
0.07
4–0.00
61.5
Expe
rimen
tserie
s2:Can
yonwidth
tofloo
dwidth
ratio
,w*
120.5,3
0.1–
0.9
4.5
300.00
7520
0–2,59
52,00
0–3,00
01,00
0–6,00
00.31
–17.26
0.00
7–0.06
0.25
–1.5
Expe
rimen
tserie
s3:Lateralb
ackw
ater
limita
tionfactor,W
*
140.5,3
0.1
0.12
5–15
300.00
751.5–
112
15–1
,120
1,62
0–6,39
50.4–
19.0
0.00
9–0.06
0.41
–1.6
Expe
rimen
tserie
s4:Dow
nslope
backwater
parameter,l*
220.5,3
0.1
4.5
0.55
–30
0.00
7520
02,00
011
0–4,00
02.88
0.05
91.5
Testsimulations
450.5–
1.3
0.1–
0.9
0.02
–4.5
0.55
–30
5×10
�4–5
×10
�2
137.14
–13,71
448
0–48
,000
200–
51,429
2.88
–472
.74
0.02
–0.10
1.5–
45
Journal of Geophysical Research: Earth Surface 10.1002/2014JF003412
LAPOTRE AND LAMB FLOOD HYDRAULICS UPSTREAM OF WATERFALLS 1233
forcing terms are gravity, friction, and pressure gradients. In the case of no bed slope in the y direction, theconservation equations are
∂h∂t
þ ∂ Uxhð Þ∂x
þ ∂ Uyh� �∂y
¼ 0
∂ Uxhð Þ∂t
þ ∂ U2xh
� �∂x
þ ∂ UxUyh� �
∂y¼ �gh
∂h∂x
� ghS� CfUx
h
ffiffiffiffiffiffiffiffiffiffiffiffiffiffiffiffiU2x þ U2
y
q
∂ Uyh� �∂t
þ ∂ UxUyh� �
∂xþ∂ U2
yh� �∂y
¼ �gh∂h∂y
� CfUy
h
ffiffiffiffiffiffiffiffiffiffiffiffiffiffiffiffiU2x þ U2
y
q
8>>>>>>>>><>>>>>>>>>:
(5)
in which Ux and Uy are the depth-averaged velocities in the x and y directions, respectively, and Cf is related toManning’s n through Cf ¼ n2g
h1=3.
These equations are derived by depth averaging the Navier-Stokes equations under the slender flowapproximation, which assumes that the vertical length scale is negligible compared to the horizontal. Aconsequence of this assumption is that vertical pressure gradients are hydrostatic. The modelimplementation is capable of reproducing wetting and drying, flow around structures, and hydraulicjumps due to the ability of the upwind central scheme to accommodate discontinuities in the solution[Kurganov et al., 2001].
Theoretically, the slender flow approximation does not hold at the waterfall brink because there pressure is nothydrostatic. It was shown that the distance upstream of a waterfall at which pressure becomes hydrostatic
is about one to two critical depths hc (i.e., the depth in which Fr = 1; for the 1-D case, hc ¼ q2n=g� �1=3
)
[Hager, 1983], which implies that the region that violates the shallow-water equations is limited to verynear the waterfall brink. Indeed, ANUGA has been successfully tested against dam break experiments[Nielsen et al., 2005] and was able to reproduce with great accuracy water surfaces and bed shear stress[Barnes and Baldock, 2006; Mungkasi and Roberts, 2013].
Despite that nonhydrostatic pressure at the brink is not accounted for in our modeling, its effect can beincorporated by assuming that the same nonhydrostatic pressure captured in the 1-D acceleration factor(equation (1)) holds for 2-D canyons. This approximation is likely to be true given that (1) the boundarycondition on pressure is the same all around the canyon brink—pressure at the waterfall is atmosphericand (2) the length scale over which nonhydrostatic effects are important (a few critical depths) is muchsmaller than the radius of curvature of most horseshoe waterfalls, such that enhanced flow accelerationdue to 2-D nonhydrostatic effects in such close proximity to the waterfall brink is unlikely to besignificant in the cross-stream direction. As a result, we expect the acceleration factor ratio α* to beunchanged by nonhydrostatic effects, and it is therefore possible to calculate the acceleration for a 2-Dwaterfall using our relationships for α*, combined with equation (1) that accounts for nonhydrostaticeffects in 1-D.
We also tested ANUGA against the solution to the one-dimensional backwater equation [e.g., Chow, 1959] forsubcritical flows (Figure 2) by solving
dhdx
¼ S� Cf Fr2
1� Fr2(6)
Like ANUGA, equation (6) also employs the slender flow approximation and does not capture nonhydrostaticeffects at the brink. The solution to equation (6) was computed with a predictor-corrector, central schemefinite difference code [e.g., Butcher, 2008]. In the 1-D model, we set Frn= 0.99 at the downstream boundary tosimulate the water surface drawdown at the waterfall. In ANUGA, we extracted flow depths along a line at theedge of a wide flood. Figure 2 shows that ANUGA is able to reproduce with good accuracy the water depthand velocity for 1-D flow toward a waterfall with no lateral flow focusing.
The user-defined parameters for ANUGA are (1) the mesh (topography and spatially variable resolution), (2)initial and boundary conditions, (3) Manning’s n, and (4) duration of the simulation, which are describedbelow. Time step intervals are internally determined from spatial resolution to enforce stability ofthe solution.
Journal of Geophysical Research: Earth Surface 10.1002/2014JF003412
LAPOTRE AND LAMB FLOOD HYDRAULICS UPSTREAM OF WATERFALLS 1234
3.1. Domain Geometry and Resolution
We model the same canyon and flood system as described in section 2. The numerical domain was set tooptimize computational time. We only model half of the domain, because it is symmetric with respect to thecanyon axis. Depth and velocity gradients get steeper toward the brink (Figure 2). In order to capture thesesteep gradients and better resolve the acceleration factor at the brink, we defined the cliff as a set of threeparallel lines, one downstream of the brink, one making up the brink, and one upstream of the brink. Thissetup allows us to extract flow variables along a line that runs parallel to the brink but is slightly upstream ofit and thus not affected by numerical noise induced by the near-vertical step at the brink. For subcriticalinput flows, these lines are separated by a small distance of 4 × 10�3Lb along the plane of the bed. Toestimate Lb, we used the analytical solution for subcritical flows in rectangular 1-D channels [Bresse, 1860],
Lb ¼ limr→1
hnS
r � hchn
� 1� Fr2n� �
Γ rð Þ � Γhchn
� �� � � �(7)
where Γ rð Þ ¼ 16 ln
r2þrþ1r�1ð Þ2
� �� 1ffiffi
3p arctan
ffiffi3
p2rþ1
� �and r ¼ h x¼Lbð Þ
hn¼ 0:95 is the assumed ratio of flow depths at the
backwater extent [e.g., Lamb et al., 2012]. For supercritical flows, we set the distance between the lines that
define the cliff to be 4× 10�3hc/S. Outside of these lines, the resolution of the unstructured triangular mesh is
about 25 times the brink resolution, which allows for a less dense sampling of flow variables where spatial
gradients are less steep.
3.2. Initial and Boundary Conditions
The domain length upstream of the canyon head is set to Lb for subcritical floods and hc/S for supercriticalfloods. This ensures that the flow depth at the inflow boundary is equal to the normal flow depth and thusthat brink vertices are not affected by the inflow boundary. The inflow boundary is set as a Dirichletcondition on stage and momenta, where stage is set to the normal flow depth, the downslopemomentum is set to the desired discharge per unit width qn, and the cross-slope momentum is set tozero. The side boundaries are reflective and frictionless, such that there is no flow across the edge of thedomain. Finally, the downstream boundary condition is located a few vertices downstream of the cliff andis fully transmissive, that is, all flow is transmitted outside of the domain. The drop height is set to 10critical depths. The initial depth is set to the normal flow depth hn everywhere, and the model is run intime until steady state is reached. We detect steady state by computing the quadratic residual in flowdepth between consecutive time steps. When this residual becomes smaller than a threshold of 0.1%, theexperiment is stopped.
The error bars on flow depths and velocities induced by instabilities at the brink are at most of 0.5% and 2% ofthe mean respectively as estimated from the variability of flow depth and velocity around the brink at 100consecutive time steps. Error bars associated with numerical variability are smaller than symbol sizes in allfigures of the paper.
4. Results4.1. Base Cases
The two base case simulations (see Table 1 for parameter values) correspond to the case where the canyonhead is not affected by the edges of the flood (w*≪ 1 andW*> 1) or the length of the canyon (l*≫ 1), that is,they correspond to a sheet flood.
Figures 5a and 5b show the distribution of normalized discharge per unit width (Uh)/qn in plan view for thesubcritical and supercritical base cases, respectively. Black lines with arrows follow streamlines, that is, thetrajectories of flow particles within the flood. In both base cases, discharge per unit width is slightlyenhanced around the canyon head (i.e., (Uh)/qn ≥ 1) and is progressively depleted as water flowsdownslope toward the canyon toe (i.e., (Uh)/qn< 1). The relative decrease in discharge per unit widthcompared to the normal flow discharge per unit width is caused by the loss of water into the canyonfurther upslope. The cross-slope extent of the relative decrease in discharge per unit width is larger in thesubcritical base case than in the supercritical base case and correlates with the plan view curvature of the
Journal of Geophysical Research: Earth Surface 10.1002/2014JF003412
LAPOTRE AND LAMB FLOOD HYDRAULICS UPSTREAM OF WATERFALLS 1235
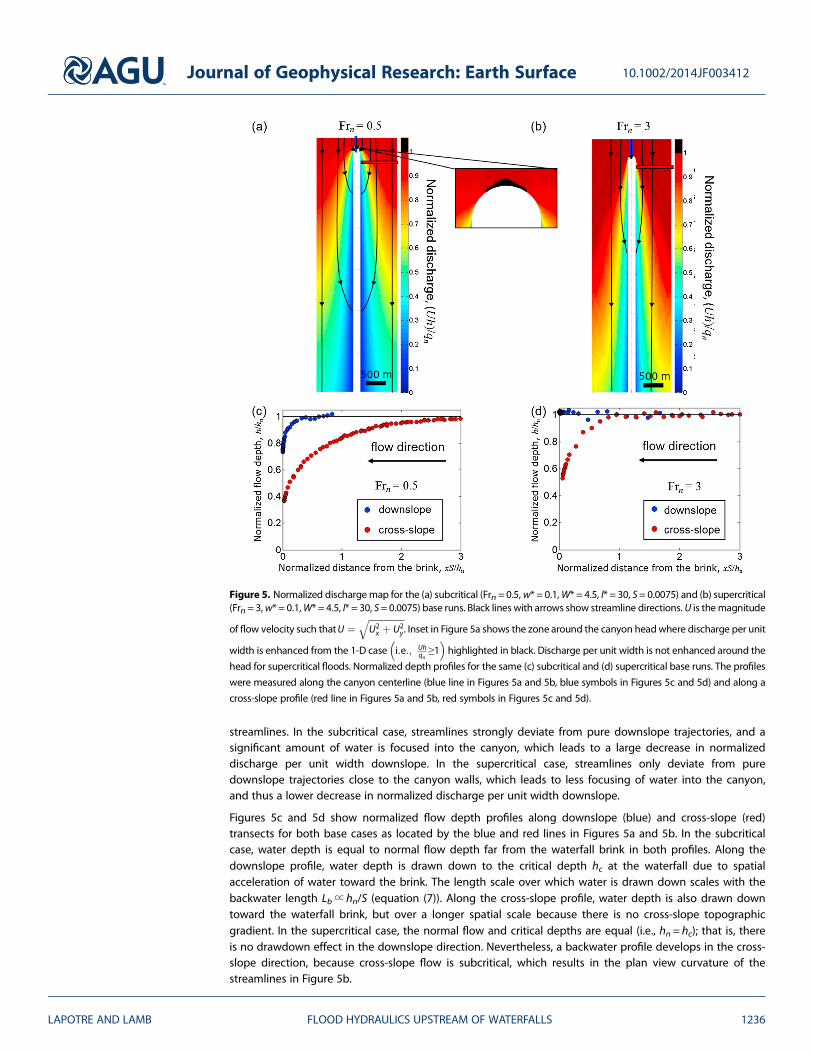
streamlines. In the subcritical case, streamlines strongly deviate from pure downslope trajectories, and asignificant amount of water is focused into the canyon, which leads to a large decrease in normalizeddischarge per unit width downslope. In the supercritical case, streamlines only deviate from puredownslope trajectories close to the canyon walls, which leads to less focusing of water into the canyon,and thus a lower decrease in normalized discharge per unit width downslope.
Figures 5c and 5d show normalized flow depth profiles along downslope (blue) and cross-slope (red)transects for both base cases as located by the blue and red lines in Figures 5a and 5b. In the subcriticalcase, water depth is equal to normal flow depth far from the waterfall brink in both profiles. Along thedownslope profile, water depth is drawn down to the critical depth hc at the waterfall due to spatialacceleration of water toward the brink. The length scale over which water is drawn down scales with thebackwater length Lb∝ hn/S (equation (7)). Along the cross-slope profile, water depth is also drawn downtoward the waterfall brink, but over a longer spatial scale because there is no cross-slope topographicgradient. In the supercritical case, the normal flow and critical depths are equal (i.e., hn= hc); that is, thereis no drawdown effect in the downslope direction. Nevertheless, a backwater profile develops in the cross-slope direction, because cross-slope flow is subcritical, which results in the plan view curvature of thestreamlines in Figure 5b.
Figure 5. Normalized dischargemap for the (a) subcritical (Frn = 0.5,w* = 0.1,W* = 4.5, l* = 30, S= 0.0075) and (b) supercritical(Frn = 3,w* = 0.1,W* = 4.5, l* = 30, S = 0.0075) base runs. Black lines with arrows show streamline directions. U is themagnitude
of flow velocity such thatU ¼ffiffiffiffiffiffiffiffiffiffiffiffiffiffiffiffiU2x þ U2
y
q. Inset in Figure 5a shows the zone around the canyon headwhere discharge per unit
width is enhanced from the 1-D case i:e:; Uhqn≥1
� �highlighted in black. Discharge per unit width is not enhanced around the
head for supercritical floods. Normalized depth profiles for the same (c) subcritical and (d) supercritical base runs. The profiles
were measured along the canyon centerline (blue line in Figures 5a and 5b, blue symbols in Figures 5c and 5d) and along a
cross-slope profile (red line in Figures 5a and 5b, red symbols in Figures 5c and 5d).
Journal of Geophysical Research: Earth Surface 10.1002/2014JF003412
LAPOTRE AND LAMB FLOOD HYDRAULICS UPSTREAM OF WATERFALLS 1236
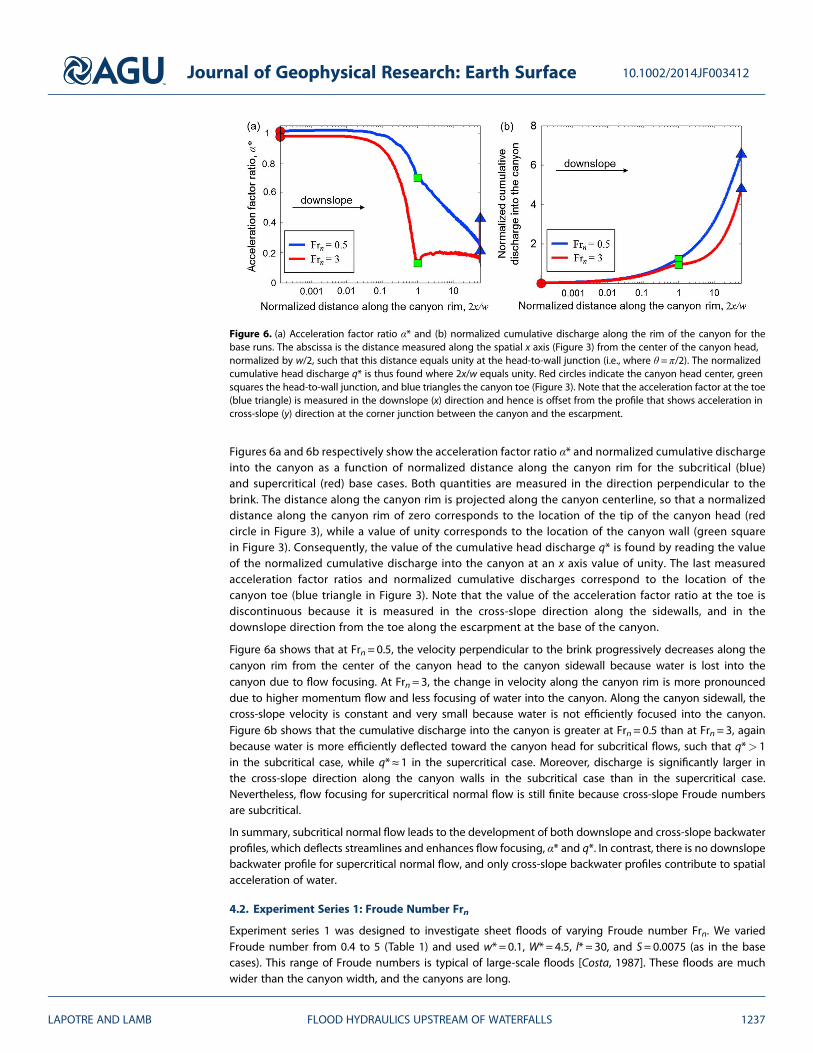
Figures 6a and 6b respectively show the acceleration factor ratio α* and normalized cumulative dischargeinto the canyon as a function of normalized distance along the canyon rim for the subcritical (blue)and supercritical (red) base cases. Both quantities are measured in the direction perpendicular to thebrink. The distance along the canyon rim is projected along the canyon centerline, so that a normalizeddistance along the canyon rim of zero corresponds to the location of the tip of the canyon head (redcircle in Figure 3), while a value of unity corresponds to the location of the canyon wall (green squarein Figure 3). Consequently, the value of the cumulative head discharge q* is found by reading the valueof the normalized cumulative discharge into the canyon at an x axis value of unity. The last measuredacceleration factor ratios and normalized cumulative discharges correspond to the location of thecanyon toe (blue triangle in Figure 3). Note that the value of the acceleration factor ratio at the toe isdiscontinuous because it is measured in the cross-slope direction along the sidewalls, and in thedownslope direction from the toe along the escarpment at the base of the canyon.
Figure 6a shows that at Frn=0.5, the velocity perpendicular to the brink progressively decreases along thecanyon rim from the center of the canyon head to the canyon sidewall because water is lost into thecanyon due to flow focusing. At Frn=3, the change in velocity along the canyon rim is more pronounceddue to higher momentum flow and less focusing of water into the canyon. Along the canyon sidewall, thecross-slope velocity is constant and very small because water is not efficiently focused into the canyon.Figure 6b shows that the cumulative discharge into the canyon is greater at Frn= 0.5 than at Frn= 3, againbecause water is more efficiently deflected toward the canyon head for subcritical flows, such that q*> 1in the subcritical case, while q*≈ 1 in the supercritical case. Moreover, discharge is significantly larger inthe cross-slope direction along the canyon walls in the subcritical case than in the supercritical case.Nevertheless, flow focusing for supercritical normal flow is still finite because cross-slope Froude numbersare subcritical.
In summary, subcritical normal flow leads to the development of both downslope and cross-slope backwaterprofiles, which deflects streamlines and enhances flow focusing, α* and q*. In contrast, there is no downslopebackwater profile for supercritical normal flow, and only cross-slope backwater profiles contribute to spatialacceleration of water.
4.2. Experiment Series 1: Froude Number Frn
Experiment series 1 was designed to investigate sheet floods of varying Froude number Frn. We variedFroude number from 0.4 to 5 (Table 1) and used w* = 0.1, W* = 4.5, l* = 30, and S= 0.0075 (as in the basecases). This range of Froude numbers is typical of large-scale floods [Costa, 1987]. These floods are muchwider than the canyon width, and the canyons are long.
Figure 6. (a) Acceleration factor ratio α* and (b) normalized cumulative discharge along the rim of the canyon for thebase runs. The abscissa is the distance measured along the spatial x axis (Figure 3) from the center of the canyon head,normalized by w/2, such that this distance equals unity at the head-to-wall junction (i.e., where θ = π/2). The normalizedcumulative head discharge q* is thus found where 2x/w equals unity. Red circles indicate the canyon head center, greensquares the head-to-wall junction, and blue triangles the canyon toe (Figure 3). Note that the acceleration factor at the toe(blue triangle) is measured in the downslope (x) direction and hence is offset from the profile that shows acceleration incross-slope (y) direction at the corner junction between the canyon and the escarpment.
Journal of Geophysical Research: Earth Surface 10.1002/2014JF003412
LAPOTRE AND LAMB FLOOD HYDRAULICS UPSTREAM OF WATERFALLS 1237
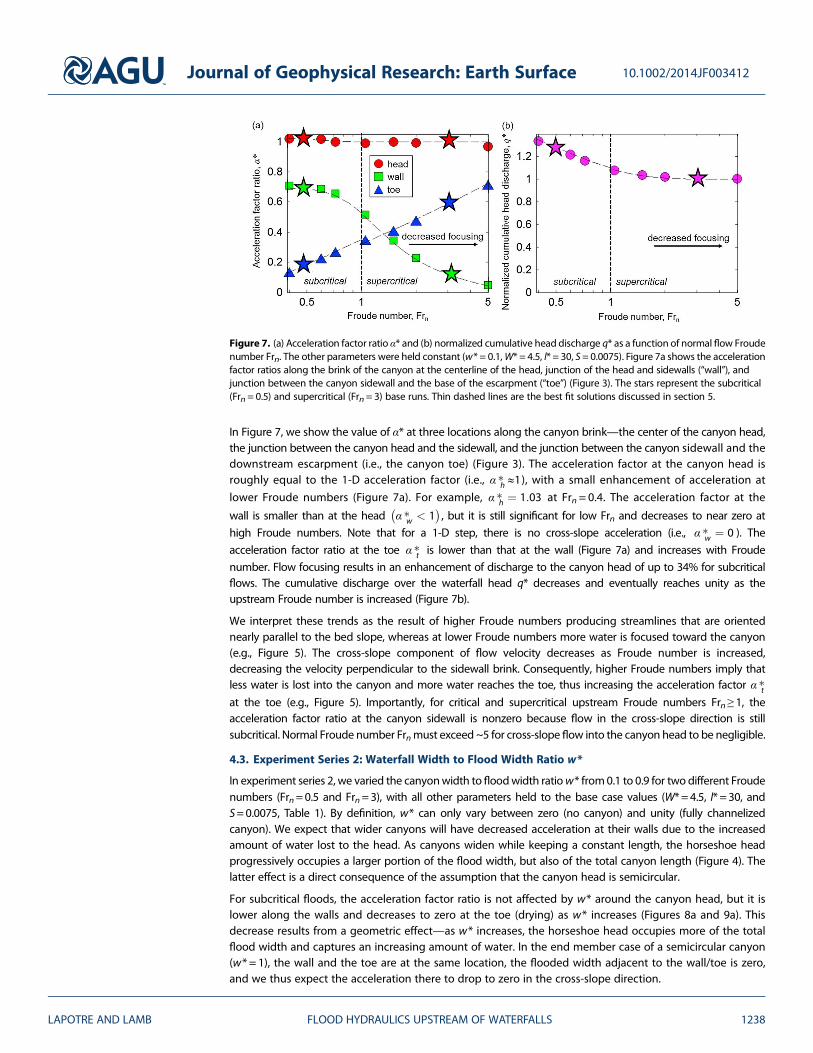
In Figure 7, we show the value of α* at three locations along the canyon brink—the center of the canyon head,the junction between the canyon head and the sidewall, and the junction between the canyon sidewall and thedownstream escarpment (i.e., the canyon toe) (Figure 3). The acceleration factor at the canyon head isroughly equal to the 1-D acceleration factor (i.e., α �h ≈1), with a small enhancement of acceleration at
lower Froude numbers (Figure 7a). For example, α �h ¼ 1:03 at Frn= 0.4. The acceleration factor at the
wall is smaller than at the head α �w < 1� �
, but it is still significant for low Frn and decreases to near zero at
high Froude numbers. Note that for a 1-D step, there is no cross-slope acceleration (i.e., α �w ¼ 0 ). The
acceleration factor ratio at the toe α �t is lower than that at the wall (Figure 7a) and increases with Froude
number. Flow focusing results in an enhancement of discharge to the canyon head of up to 34% for subcriticalflows. The cumulative discharge over the waterfall head q* decreases and eventually reaches unity as theupstream Froude number is increased (Figure 7b).
We interpret these trends as the result of higher Froude numbers producing streamlines that are orientednearly parallel to the bed slope, whereas at lower Froude numbers more water is focused toward the canyon(e.g., Figure 5). The cross-slope component of flow velocity decreases as Froude number is increased,decreasing the velocity perpendicular to the sidewall brink. Consequently, higher Froude numbers imply thatless water is lost into the canyon and more water reaches the toe, thus increasing the acceleration factor α �tat the toe (e.g., Figure 5). Importantly, for critical and supercritical upstream Froude numbers Frn≥ 1, theacceleration factor ratio at the canyon sidewall is nonzero because flow in the cross-slope direction is stillsubcritical. Normal Froude number Frnmust exceed ~5 for cross-slope flow into the canyon head to be negligible.
4.3. Experiment Series 2: Waterfall Width to Flood Width Ratio w*
In experiment series 2, we varied the canyonwidth to floodwidth ratiow* from0.1 to 0.9 for two different Froudenumbers (Frn=0.5 and Frn=3), with all other parameters held to the base case values (W*=4.5, l*=30, andS=0.0075, Table 1). By definition, w* can only vary between zero (no canyon) and unity (fully channelizedcanyon). We expect that wider canyons will have decreased acceleration at their walls due to the increasedamount of water lost to the head. As canyons widen while keeping a constant length, the horseshoe headprogressively occupies a larger portion of the flood width, but also of the total canyon length (Figure 4). Thelatter effect is a direct consequence of the assumption that the canyon head is semicircular.
For subcritical floods, the acceleration factor ratio is not affected by w* around the canyon head, but it islower along the walls and decreases to zero at the toe (drying) as w* increases (Figures 8a and 9a). Thisdecrease results from a geometric effect—as w* increases, the horseshoe head occupies more of the totalflood width and captures an increasing amount of water. In the end member case of a semicircular canyon(w* = 1), the wall and the toe are at the same location, the flooded width adjacent to the wall/toe is zero,and we thus expect the acceleration there to drop to zero in the cross-slope direction.
Figure 7. (a) Acceleration factor ratio α* and (b) normalized cumulative head discharge q* as a function of normal flow Froudenumber Frn. The other parameters were held constant (w* = 0.1,W* = 4.5, l* = 30, S = 0.0075). Figure 7a shows the accelerationfactor ratios along the brink of the canyon at the centerline of the head, junction of the head and sidewalls (“wall”), andjunction between the canyon sidewall and the base of the escarpment (“toe”) (Figure 3). The stars represent the subcritical(Frn = 0.5) and supercritical (Frn= 3) base runs. Thin dashed lines are the best fit solutions discussed in section 5.
Journal of Geophysical Research: Earth Surface 10.1002/2014JF003412
LAPOTRE AND LAMB FLOOD HYDRAULICS UPSTREAM OF WATERFALLS 1238
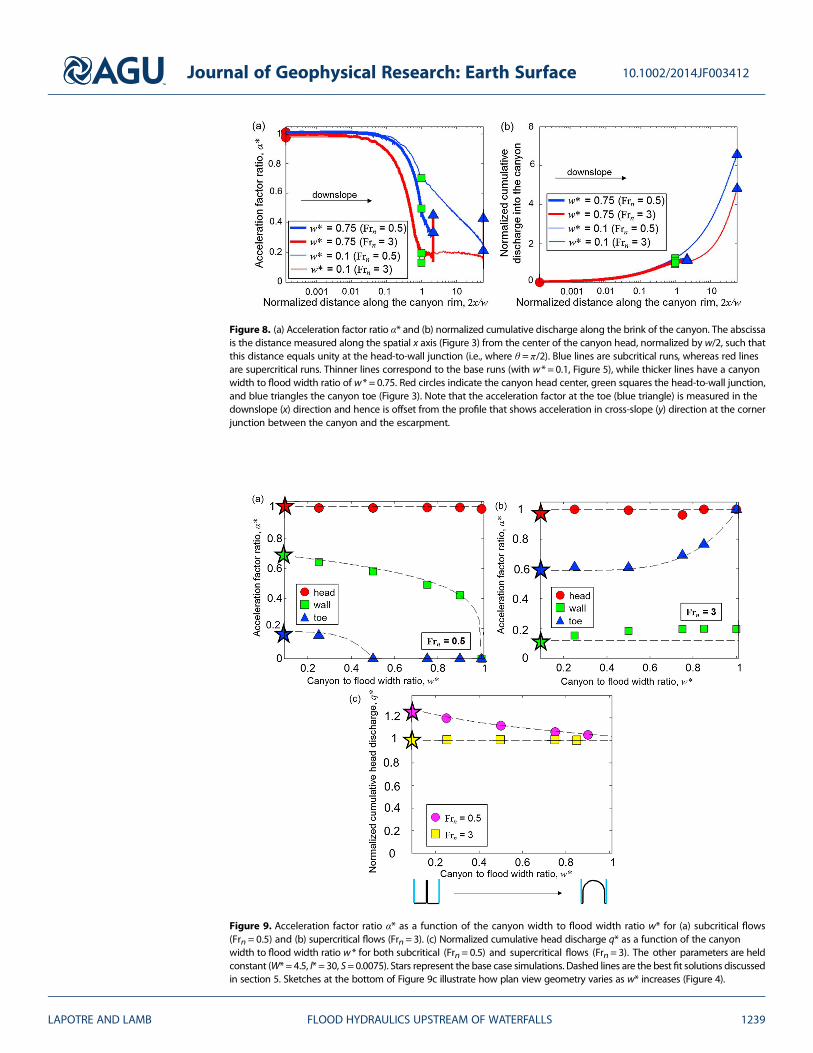
Figure 8. (a) Acceleration factor ratio α* and (b) normalized cumulative discharge along the brink of the canyon. The abscissais the distance measured along the spatial x axis (Figure 3) from the center of the canyon head, normalized by w/2, such thatthis distance equals unity at the head-to-wall junction (i.e., where θ = π/2). Blue lines are subcritical runs, whereas red linesare supercritical runs. Thinner lines correspond to the base runs (with w* = 0.1, Figure 5), while thicker lines have a canyonwidth to flood width ratio of w* = 0.75. Red circles indicate the canyon head center, green squares the head-to-wall junction,and blue triangles the canyon toe (Figure 3). Note that the acceleration factor at the toe (blue triangle) is measured in thedownslope (x) direction and hence is offset from the profile that shows acceleration in cross-slope (y) direction at the cornerjunction between the canyon and the escarpment.
Figure 9. Acceleration factor ratio α* as a function of the canyon width to flood width ratio w* for (a) subcritical flows(Frn = 0.5) and (b) supercritical flows (Frn= 3). (c) Normalized cumulative head discharge q* as a function of the canyonwidth to flood width ratio w* for both subcritical (Frn= 0.5) and supercritical flows (Frn = 3). The other parameters are heldconstant (W* = 4.5, l* = 30, S= 0.0075). Stars represent the base case simulations. Dashed lines are the best fit solutions discussedin section 5. Sketches at the bottom of Figure 9c illustrate how plan view geometry varies as w* increases (Figure 4).
Journal of Geophysical Research: Earth Surface 10.1002/2014JF003412
LAPOTRE AND LAMB FLOOD HYDRAULICS UPSTREAM OF WATERFALLS 1239
For supercritical floods, the acceleration factor ratio does not vary much around the head and the wall(Figure 8a). Figure 9b shows that the acceleration factor ratio is greater at the toe than at the wall, which weinterpret as the result of a decreased cross-slope component of velocity for supercritical floods (section 4.2).The acceleration factor ratio increases at the toe with increasing w* because the canyon sidewalls are shorterand a smaller fraction of the water is lost over the brink along the sidewalls (Figure 8b).
For subcritical floods, the cumulative head discharge q* decreases with increasing relative waterfall width (w*),whereas q* is constant for supercritical floods (Figures 8b and 9c). These trends correlate with the accelerationfactor ratio at the wall α �w . In subcritical cases, an increasingly wide horseshoe head captures more of the total
available water, leading to smaller flow depths near the wall, and thus decreased lateral backwater effects. Insupercritical cases, flow depth does not significantly deviate from its upstream value away from the canyonwall, such that lateral backwater effects are constant as w* increases. The cumulative head discharge q*should plateau at unity in both subcritical and supercritical cases because all of the water enters into thehead at w* =1 (Figure 9c).
4.4. Experiment Series 3: Flood Width Limitation Factor W*
In experiment series 3, we investigated the effect of varying lateral backwater lengths for a given flood width.We thus varied the flood width limitation factor W* from 0.12 to 15 for two different Froude numbers(Frn= 0.5 and Frn= 3), w* = 0.1, l* = 30, and S= 0.0075 (Table 1). Like the base cases, this corresponds to thecase of a wide flood pouring over the brink of a long canyon. In theory, W* can vary from values close tozero, when the lateral backwater length is very long compared to the flood width, to virtually infinity whenthe flood is very wide compared to the backwater length.
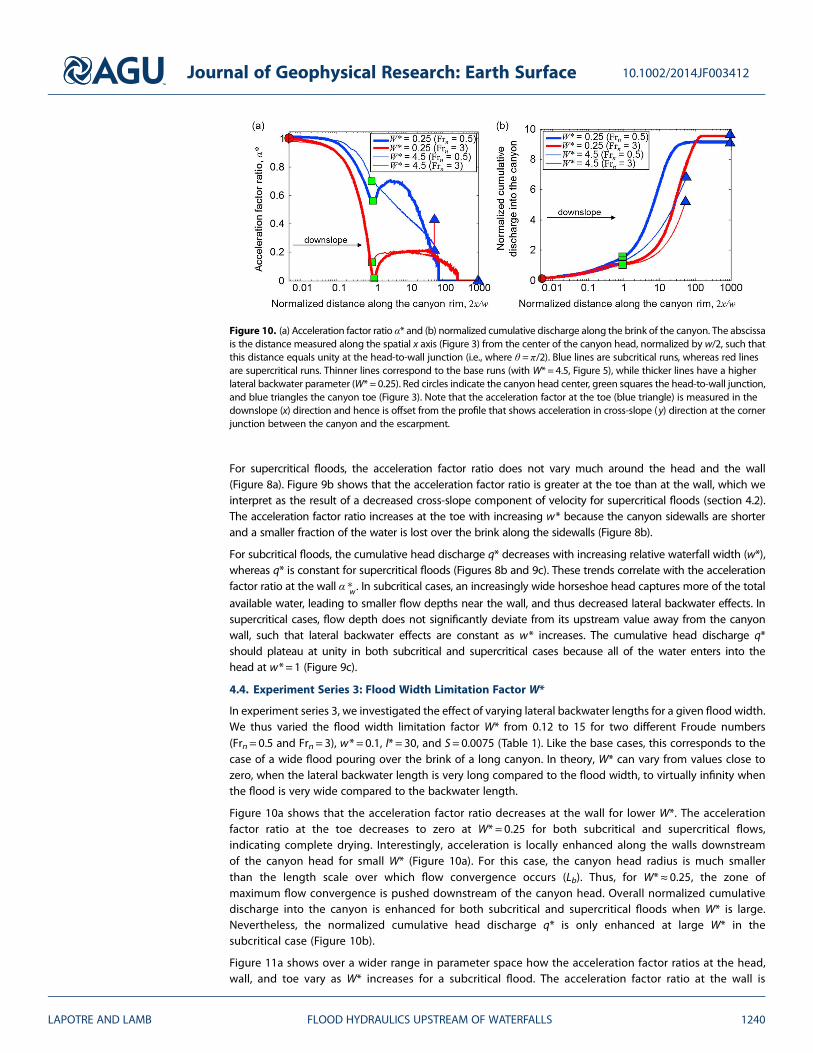
Figure 10a shows that the acceleration factor ratio decreases at the wall for lower W*. The accelerationfactor ratio at the toe decreases to zero at W* = 0.25 for both subcritical and supercritical flows,indicating complete drying. Interestingly, acceleration is locally enhanced along the walls downstreamof the canyon head for small W* (Figure 10a). For this case, the canyon head radius is much smallerthan the length scale over which flow convergence occurs (Lb). Thus, for W*≈ 0.25, the zone ofmaximum flow convergence is pushed downstream of the canyon head. Overall normalized cumulativedischarge into the canyon is enhanced for both subcritical and supercritical floods when W* is large.Nevertheless, the normalized cumulative head discharge q* is only enhanced at large W* in thesubcritical case (Figure 10b).
Figure 11a shows over a wider range in parameter space how the acceleration factor ratios at the head,wall, and toe vary as W* increases for a subcritical flood. The acceleration factor ratio at the wall is
Figure 10. (a) Acceleration factor ratio α* and (b) normalized cumulative discharge along the brink of the canyon. The abscissais the distance measured along the spatial x axis (Figure 3) from the center of the canyon head, normalized by w/2, such thatthis distance equals unity at the head-to-wall junction (i.e., where θ = π/2). Blue lines are subcritical runs, whereas red linesare supercritical runs. Thinner lines correspond to the base runs (with W* = 4.5, Figure 5), while thicker lines have a higherlateral backwater parameter (W* = 0.25). Red circles indicate the canyon head center, green squares the head-to-wall junction,and blue triangles the canyon toe (Figure 3). Note that the acceleration factor at the toe (blue triangle) is measured in thedownslope (x) direction and hence is offset from the profile that shows acceleration in cross-slope (y) direction at the cornerjunction between the canyon and the escarpment.
Journal of Geophysical Research: Earth Surface 10.1002/2014JF003412
LAPOTRE AND LAMB FLOOD HYDRAULICS UPSTREAM OF WATERFALLS 1240
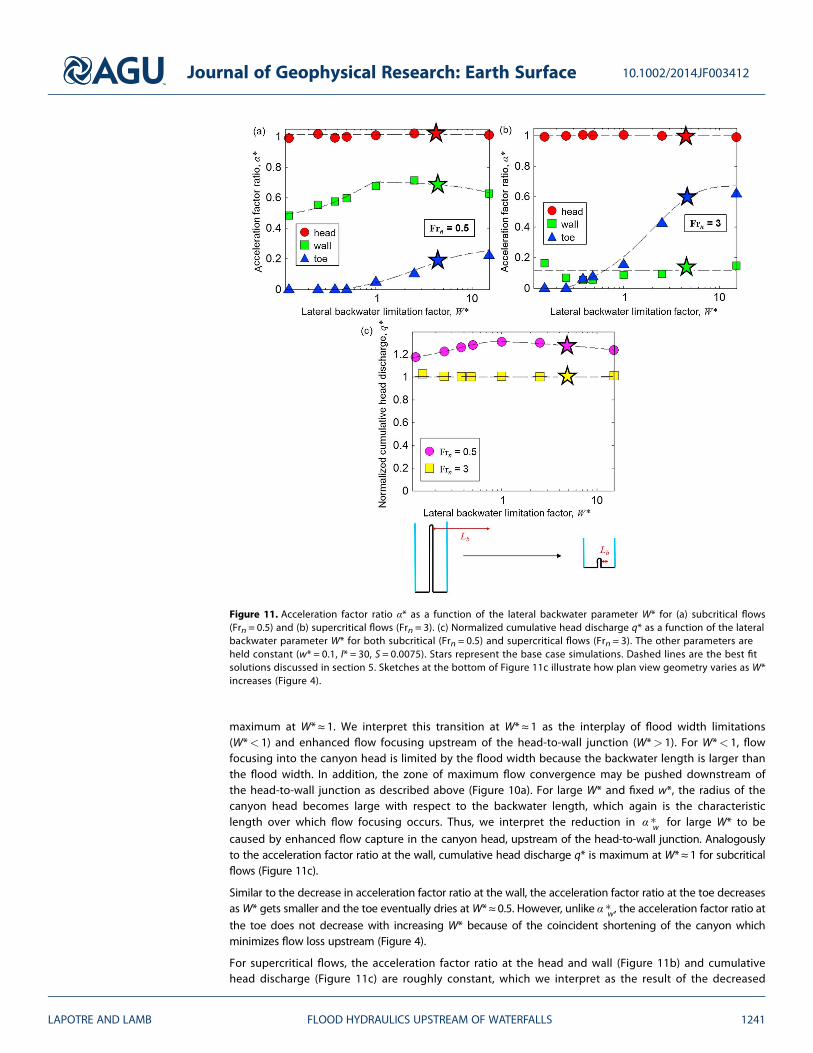
maximum at W*≈ 1. We interpret this transition at W* ≈ 1 as the interplay of flood width limitations(W*< 1) and enhanced flow focusing upstream of the head-to-wall junction (W*> 1). For W*< 1, flowfocusing into the canyon head is limited by the flood width because the backwater length is larger thanthe flood width. In addition, the zone of maximum flow convergence may be pushed downstream ofthe head-to-wall junction as described above (Figure 10a). For large W* and fixed w*, the radius of thecanyon head becomes large with respect to the backwater length, which again is the characteristiclength over which flow focusing occurs. Thus, we interpret the reduction in α �w for large W* to be
caused by enhanced flow capture in the canyon head, upstream of the head-to-wall junction. Analogouslyto the acceleration factor ratio at the wall, cumulative head discharge q* is maximum at W*≈ 1 for subcriticalflows (Figure 11c).
Similar to the decrease in acceleration factor ratio at the wall, the acceleration factor ratio at the toe decreasesasW* gets smaller and the toe eventually dries atW*≈ 0.5. However, unlike α �w, the acceleration factor ratio at
the toe does not decrease with increasing W* because of the coincident shortening of the canyon whichminimizes flow loss upstream (Figure 4).
For supercritical flows, the acceleration factor ratio at the head and wall (Figure 11b) and cumulativehead discharge (Figure 11c) are roughly constant, which we interpret as the result of the decreased
Figure 11. Acceleration factor ratio α* as a function of the lateral backwater parameter W* for (a) subcritical flows(Frn = 0.5) and (b) supercritical flows (Frn = 3). (c) Normalized cumulative head discharge q* as a function of the lateralbackwater parameter W* for both subcritical (Frn = 0.5) and supercritical flows (Frn = 3). The other parameters areheld constant (w* = 0.1, l* = 30, S = 0.0075). Stars represent the base case simulations. Dashed lines are the best fitsolutions discussed in section 5. Sketches at the bottom of Figure 11c illustrate how plan view geometry varies as W*increases (Figure 4).
Journal of Geophysical Research: Earth Surface 10.1002/2014JF003412
LAPOTRE AND LAMB FLOOD HYDRAULICS UPSTREAM OF WATERFALLS 1241
importance of lateral backwater effects for supercritical floods. However, the acceleration factor ratioat the toe integrates the backwater effects all along the canyon sidewalls upslope of the toe,and thus, α �t decreases with decreasing W* due to water lost to the canyon and drying at the toefor W*< 0.3.
4.5. Experiment Series 4: Downslope Backwater Parameter l*
In experiment series 4, we investigated the effect of canyon lengthening. We varied the downslopebackwater parameter l* between 0.55 and 30 for two different Froude numbers (Frn=0.5 and Frn=3), withall other parameters set to the base case values (w* = 0.1, W* = 4.5, and S= 0.0075, Table 1).
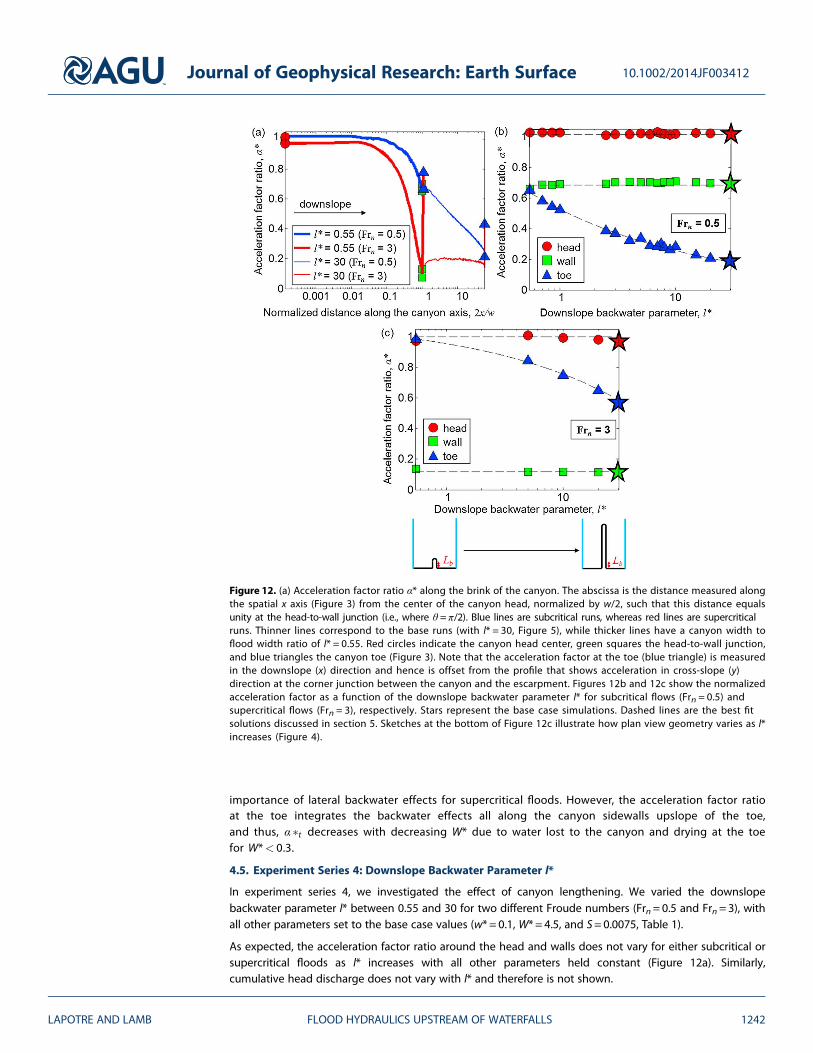
As expected, the acceleration factor ratio around the head and walls does not vary for either subcritical orsupercritical floods as l* increases with all other parameters held constant (Figure 12a). Similarly,cumulative head discharge does not vary with l* and therefore is not shown.
Figure 12. (a) Acceleration factor ratio α* along the brink of the canyon. The abscissa is the distance measured alongthe spatial x axis (Figure 3) from the center of the canyon head, normalized by w/2, such that this distance equalsunity at the head-to-wall junction (i.e., where θ = π/2). Blue lines are subcritical runs, whereas red lines are supercriticalruns. Thinner lines correspond to the base runs (with l* = 30, Figure 5), while thicker lines have a canyon width toflood width ratio of l* = 0.55. Red circles indicate the canyon head center, green squares the head-to-wall junction,and blue triangles the canyon toe (Figure 3). Note that the acceleration factor at the toe (blue triangle) is measuredin the downslope (x) direction and hence is offset from the profile that shows acceleration in cross-slope (y)direction at the corner junction between the canyon and the escarpment. Figures 12b and 12c show the normalizedacceleration factor as a function of the downslope backwater parameter l* for subcritical flows (Frn = 0.5) andsupercritical flows (Frn = 3), respectively. Stars represent the base case simulations. Dashed lines are the best fitsolutions discussed in section 5. Sketches at the bottom of Figure 12c illustrate how plan view geometry varies as l*increases (Figure 4).
Journal of Geophysical Research: Earth Surface 10.1002/2014JF003412
LAPOTRE AND LAMB FLOOD HYDRAULICS UPSTREAM OF WATERFALLS 1242
In contrast to the head and sidewalls, theacceleration factor at the toe is larger forrelatively short canyons (smaller l*). Weinterpret this trend as the result of waterpouring over a shorter sidewall distance,and thus, less water is lost along thewalls for smaller canyons (Figure 12a).For subcritical floods, we observe a rapiddecrease in acceleration at the toe ascanyons lengthen (Figure 12b). Forsupercritical floods, the reduction inacceleration factor ratio at the toe withincreasing l* is more gradual due toless water lost into the canyon upstream(Figure 12c).
5. Semiempirical Approximations
Because our 2-D hydraulic simulations arecomputationally demanding, it is of inter-est to obtain semiempirical approxima-tions to our results in order to predictthe acceleration factor ratios and cumula-tive head discharge, α �h, α �w, α �t , and q*, as
a function of Frn, w*, W*, and l* in a wayanalogous to equation (1). All parametersaffect the acceleration factor ratiosroughly independently. We were able tofit the data by addressing each parameterseparately in the regime where other
parameters do not matter through multiple nonlinear regressions. The fit relationships are given inAppendix A.
We first corrected the data for Froude number Frn by dividing the data by exponential or power functionfits to experiment series 1. We then identified and ranked by decreasing importance the otherdimensionless parameters driving the remaining variance (w* then W* for α �w and q*; l* then W* then w*
for α �t ). Finally, we sequentially corrected for the variance induced by each of the ranked parameters by
further dividing the data by the corresponding power law fits. When different functional fits wereneeded for different parameter ranges, we attempted to impose continuity of the fit across the rangeboundaries. Nevertheless, discontinuities in the fits still arise in cases because we did not model everypossible combination of parameters.
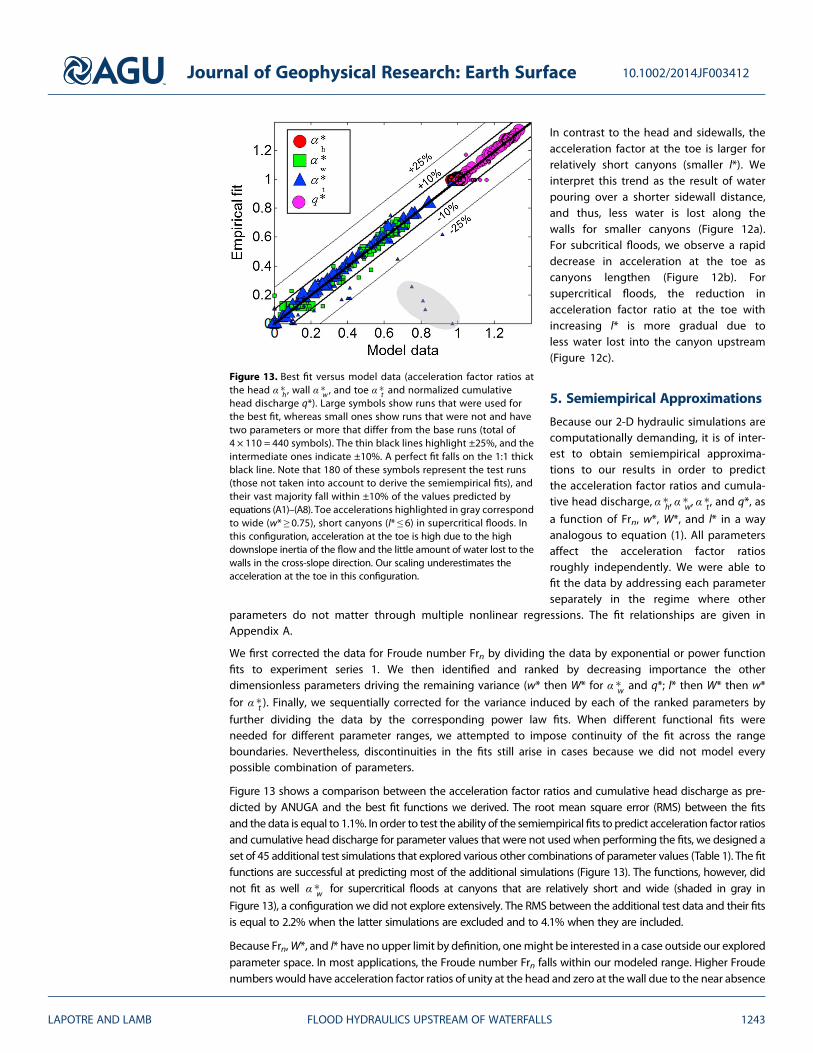
Figure 13 shows a comparison between the acceleration factor ratios and cumulative head discharge as pre-dicted by ANUGA and the best fit functions we derived. The root mean square error (RMS) between the fitsand the data is equal to 1.1%. In order to test the ability of the semiempirical fits to predict acceleration factor ratiosand cumulative head discharge for parameter values that were not used when performing the fits, we designed aset of 45 additional test simulations that explored various other combinations of parameter values (Table 1). The fitfunctions are successful at predicting most of the additional simulations (Figure 13). The functions, however, didnot fit as well α �w for supercritical floods at canyons that are relatively short and wide (shaded in gray in
Figure 13), a configuration we did not explore extensively. The RMS between the additional test data and their fitsis equal to 2.2% when the latter simulations are excluded and to 4.1% when they are included.
Because Frn,W*, and l* have no upper limit by definition, onemight be interested in a case outside our exploredparameter space. In most applications, the Froude number Frn falls within our modeled range. Higher Froudenumbers would have acceleration factor ratios of unity at the head and zero at the wall due to the near absence
Figure 13. Best fit versus model data (acceleration factor ratios atthe head α �h , wall α �w , and toe α �t and normalized cumulativehead discharge q*). Large symbols show runs that were used forthe best fit, whereas small ones show runs that were not and havetwo parameters or more that differ from the base runs (total of4 × 110 = 440 symbols). The thin black lines highlight ±25%, and theintermediate ones indicate ±10%. A perfect fit falls on the 1:1 thickblack line. Note that 180 of these symbols represent the test runs(those not taken into account to derive the semiempirical fits), andtheir vast majority fall within ±10% of the values predicted byequations (A1)–(A8). Toe accelerations highlighted in gray correspondto wide (w* ≥ 0.75), short canyons (l* ≤ 6) in supercritical floods. Inthis configuration, acceleration at the toe is high due to the highdownslope inertia of the flow and the little amount of water lost to thewalls in the cross-slope direction. Our scaling underestimates theacceleration at the toe in this configuration.
Journal of Geophysical Research: Earth Surface 10.1002/2014JF003412
LAPOTRE AND LAMB FLOOD HYDRAULICS UPSTREAM OF WATERFALLS 1243
of flow focusing. At the toe, its value would still vary greatly with the amount of water lost along the canyonsidewalls, and thus with the downslope backwater parameter l*. The flood width limitation factor W* doesnot significantly affect the hydraulics at values higher than the range we tested (at W* = 5, acceleration factorratios at the wall do not vary significantly, and normalized cumulative head discharge decreases to unity). Incases where Frn< 1 and W* are very small, one can assume that α �w and α �t are small. Finally, almost
no water is left at the toe of very long canyons (l* ≫ 1), such that α �t can be assumed to be zero. Most
of these end member cases are reproduced by the fits. When the fits predict negative values for accelera-tion factor ratios, they should be set to zero.
6. Discussion6.1. Flow Regimes
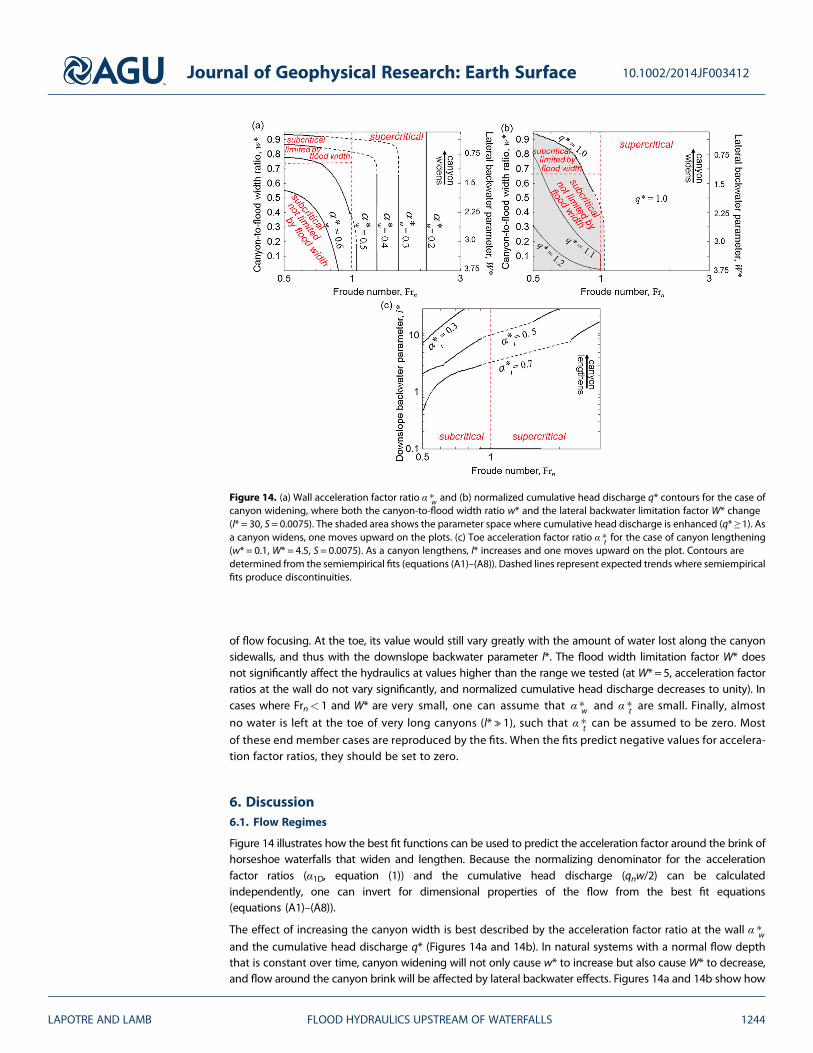
Figure 14 illustrates how the best fit functions can be used to predict the acceleration factor around the brink ofhorseshoe waterfalls that widen and lengthen. Because the normalizing denominator for the accelerationfactor ratios (α1D, equation (1)) and the cumulative head discharge (qnw/2) can be calculatedindependently, one can invert for dimensional properties of the flow from the best fit equations(equations (A1)–(A8)).
The effect of increasing the canyon width is best described by the acceleration factor ratio at the wall α �wand the cumulative head discharge q* (Figures 14a and 14b). In natural systems with a normal flow depththat is constant over time, canyon widening will not only cause w* to increase but also cause W* to decrease,and flow around the canyon brink will be affected by lateral backwater effects. Figures 14a and 14b show how
Figure 14. (a) Wall acceleration factor ratio α �w and (b) normalized cumulative head discharge q* contours for the case ofcanyon widening, where both the canyon-to-flood width ratio w* and the lateral backwater limitation factor W* change(l* = 30, S = 0.0075). The shaded area shows the parameter space where cumulative head discharge is enhanced (q* ≥ 1). Asa canyon widens, one moves upward on the plots. (c) Toe acceleration factor ratio α �t for the case of canyon lengthening(w* = 0.1, W* = 4.5, S = 0.0075). As a canyon lengthens, l* increases and one moves upward on the plot. Contours aredetermined from the semiempirical fits (equations (A1)–(A8)). Dashed lines represent expected trends where semiempiricalfits produce discontinuities.
Journal of Geophysical Research: Earth Surface 10.1002/2014JF003412
LAPOTRE AND LAMB FLOOD HYDRAULICS UPSTREAM OF WATERFALLS 1244
α �w and q* can be summarized in several flow regimes with coincident changes in w* and W*. In the
subcritical regime (Frn< 1) with focusing not limited by the width of the flood (W*> 1), acceleration atthe wall is mostly a function of Froude number, and cumulative head discharge is enhanced. As thecanyon widens (W*< 1), acceleration at the wall is mostly a function of canyon width and α �wdecreases. Likewise, with canyon widening, the cumulative head discharge goes from enhanced withrespect to the 1-D case (q*> 1) to normal (q* = 1). In the supercritical regime, acceleration at the wall isa function of the flood Froude number only and decreases with increasing Frn. Head discharge forsupercritical floods is roughly equal to the corresponding 1-D discharge.
Canyon lengthening affects mostly the acceleration factor at the toeα �t (Figure 14c). Acceleration at the toe is
reduced with larger canyons; however, this effect weakens at higher Froude numbers.
6.2. Engineering Applications
Hydraulic engineers typically employ full 3-D numerical models to study and design specific spillways withcomplex geometries [e.g., Feurich et al., 2011]. Nevertheless, our results have implications for the earlystages of designing spillways. A first important result of our modeling is that the acceleration factor ratioat the head of a horseshoe waterfall is only enhanced by less than 4% compared to the 1-D case as longas there is no cross-stream topographic gradient (e.g., Figure 7). Consequently, in applications wherethe required precision is of a few percent, it can be assumed that acceleration at the head can beapproximated by equation (1).
Moreover, understanding flow focusing is essential to optimize the discharge into the head of the canyon.For example, one might need to minimize erosion at the base of a horseshoe spillway. This can beaccomplished by decreasing the amount of flow focusing toward the canyon, and thus the velocity andwidth of the jet impinging the plunge pool. If flow focusing is minimized, by making the canyon as wideas the flood (w*≈ 1), the discharge per unit width at the center of the spillway will be that of the linearescarpment, and the discharge will be lower everywhere else along the brink, stabilizing the sidewalls. Ifenhanced discharge is desired to increase the generated power of a water turbine, a horseshoe spillwayshould be narrower than the total flood width (w*≪ 1) such that flow focusing is maximum at the tip ofthe horseshoe (e.g., W*≈ 1). Our results suggest that this design can enhance discharge by up to about35% (e.g., Figure 7). Because hydropower is proportional to discharge [e.g., Sayers, 1990], such a designcould increase energy production.
6.3. Implications for the Shape of Canyon Heads and Canyon Dynamics
Waterfalls retreat upstream as a consequence of erosion at the knickpoint, causing formation of canyons.Erosion occurs either through undercutting in the plunge pool or through plucking and toppling of rockblocks upstream of the brink [e.g., Gilbert, 1907; Haviv et al., 2006; Lamb et al., 2006, 2007; Lamb andDietrich, 2009; Mackey et al., 2014]. Undercutting occurs as a result of scouring of rocks where the water jetimpinges the plunge pool, by the combined mechanical action of water and transported sediments [e.g.,Stein and Julien, 1993; Flores-Cervantes et al., 2006]. In particular, Flores-Cervantes et al. [2006] showed thatbed shear stress at the base of the jet increases with flow velocity at the brink U0. Moreover, higher waterdischarges cause higher sediment capacity of the flow [e.g., Meyer-Peter and Muller, 1948; Fernandez Luqueand Van Beek, 1976], which enhances plunge pool erosion. Consequently, more focusing toward thecanyon head suggests that more erosional work is accomplished by water and sediment. Enhancederosion at the head combined with drying of the sidewalls promotes upstream propagation of the canyonhead as opposed to canyon widening. Our results indicate that higher head discharges are obtained forlower Froude numbers, and lateral backwater lengths smaller than the half flooded width.
Plucking and toppling occur through the action of bed shear stress applied by water flow upstream of thewaterfall brink [e.g., Coleman et al., 2003; Chatanantavet and Parker, 2009]. The bed shear stress at thebrink is given by
τb ¼ ρCfUp2 ¼ ρCfα*2Un
2 (8)
where ρ is the density of water and thus scales with the acceleration factor ratio squared. Assuming thaterosion rate is proportional to bed shear stress to some positive power [e.g., Howard and Kerby, 1983], higher
Journal of Geophysical Research: Earth Surface 10.1002/2014JF003412
LAPOTRE AND LAMB FLOOD HYDRAULICS UPSTREAM OF WATERFALLS 1245
acceleration factor ratios should lead to higher erosion rate [Stein and Julien, 1993; Haviv et al., 2006; Lamband Dietrich, 2009].
Our modeling suggests that flow focusing enhances acceleration factor ratios around the head of canyons forlow Froude numbers, and low lateral backwater lengths (equations (A1), (A2), (A4), and (A5)), and decreasesacceleration factor ratios along the walls and toes as canyons lengthen and widen (equations (A2)–(A7)). If wemake the assumption that erosion only occurs when a certain threshold shear stress is surpassed [e.g., Lamband Dietrich, 2009], erosion is more likely to prevail where α* is higher. Consequently, differentcombinations of bed shear stress at the head and at the head-to-wall junction may determine whetherthe canyon widens or narrows, while bed shear stress at the head and the toe may control whether thecanyon grows or shrinks.
We showed that plan view curvature of the canyon rim drives cross-slope flow, and thus convergence of theflood waters toward the canyon. Flow focusing can in turn drive the creation of more curvature. Indeed,variations in flow velocities around the brink may lead to variable erosion rates around the brink, withhigher erosion rates at the canyon head where velocities are enhanced and decreased erosion rates alongthe walls where velocities are decreased [e.g., Stein and Julien, 1993; Lamb and Dietrich, 2009].Consequently, feedbacks between flood hydraulics and canyon form may be similar to those observed inthe formation of amphitheater heads by groundwater sapping in sand [Howard and McLane, 1988] andmay help to explain the origin of amphitheater-headed canyons in competent rock [e.g., Lamb et al., 2006,2014] (Figure 1). It is likely that canyon head shape differs for different degrees of focusing and thus mightbe a function of flood attributes, such as Froude number Frn and flood width limitation factor W*. Thisconclusion modifies that of Petroff et al. [2011], who proposed that erosion rates are proportional to localplan view curvature of a canyon head. Our results suggest that erosion may be enhanced at the center ofthe canyon head due to flow focusing even in the absence of spatial changes in curvature (as in our caseof a semicircular head).
7. Conclusion
Horseshoe-shaped waterfalls modify the flow patterns upstream of waterfalls, flow acceleration at thewaterfall brink, and cumulative discharge into the waterfall. The distribution of the acceleration factoraround the canyon brink is mainly controlled by the normal flow Froude number, the width of the floodcompared to its lateral backwater length and the canyon width, and the downslope length of the canyonrelative to the backwater length.
In the case of a sheet flood, that is, when the canyon is much narrower than the flood and lateralbackwater effects do not limit flow focusing, the acceleration factor is entirely determined by theFroude number and the length of the canyon. Higher Froude numbers decrease the amount offocusing and thus decrease the acceleration factor around the canyon sidewalls (i.e., α �w →0 for
Frn ≫ 1), increase it at the canyon toe, and lower the cumulative discharge into the canyon head.Longer canyons lose more water along their sidewalls than shorter canyons and thus have decreasedacceleration factors at the canyon toe.
For nonsheet floods, the flow patterns are more complicated due to the influence of boundaries thatlimit flow focusing into the waterfall. Generally, wider waterfalls and/or higher lateral backwaterlengths decrease both the acceleration factor around the canyon head and walls and the cumulativedischarge into the canyon head. When the canyon is confined within the full width of the flood(w* ≈ 1), the walls and the toe are at the same location, and the acceleration factor in both the
cross-slope and downslope directions is zero α �w ≈α �t ≈0� �
. Finally, when the lateral backwater
limitation factor is much smaller than unity (W* ≪ 1), the acceleration factor along the walls tends to
zero α �w →0� �
.
The semiempirical relationships we derived to relate acceleration and discharge around the brink ofwaterfalls may provide some guidance during the early stages of spillway design and optimization. Theserelationships also provide a quantitative understanding of flow focusing that can be used to help explainthe shape of waterfalls, as well as their evolution.
Journal of Geophysical Research: Earth Surface 10.1002/2014JF003412
LAPOTRE AND LAMB FLOOD HYDRAULICS UPSTREAM OF WATERFALLS 1246
Appendix A: Fit Relationships
The acceleration factor ratio at the head α �h decreases with Froude number Frn for subcritical floods and is
roughly equal to unity for supercritical floods.
α �h¼ 1þ 0:05 1� Frnð Þ1:65 for Frn < 1
1 for Frn≥1
((A1)
In the case of a sheet flood (w*≪ 1 and W*> 1), the acceleration factor ratio at the wall α �w decreases withFroude number Frn, and the decrease is steeper for Frn between 1 and 3.
α �w;sf
¼ 1:47exp � Frn þ 1:181:58
� �2" #
� 0:53exp � Frn þ 0:030:53
� �2" #
þ 85550 exp � Frn þ 5114:7
� �2" #
(A2)
For a sheet flood, the acceleration factor ratio at the toe α �t increases with Froude number Frn and decreases
with the downslope backwater parameter l*.
α �t;sf
¼ 2:08Frn0:11 � 1:76� �
3:68l��0:31� �
for Frn < 1
2:08Frn0:11 � 1:76� �
2:02� 0:29l�0:35� �for Frn≥1
((A3)
For subcritical nonsheet floods, the acceleration factor at the wall α �w decreases with the canyon width to
flood width ratio w* and increases with the flood width limitation factor W* (as long as W*< 1). Forsupercritical nonsheet floods, the acceleration factor ratio at the wall α �w slightly increases with canyon
width to flood width ratio w*.
α �w¼
α �w;sf
1� w*ð Þ0:22G1 for Frn < 1
α �w;sf
for Frn≥1
8<: (A4)
in which
G1 ¼1:06� 0:38 1�W*ð Þ1:41 �
forW* < 1
1:07� 7:72�10�3W* �
for W*≥1
((A5)
The acceleration factor ratio at the toe α �t for subcritical nonsheet floods increases with w* and decreases
with W*. For supercritical nonsheet floods, the acceleration factor ratio at the toe α �t increases with both
w* and W*.
α �t¼
α �t;sf
0:87� 21:75w�4:65� �1:18 exp 0:01W*ð Þ � 1:39 exp �0:38W*ð Þ½ � for Frn < 1
α �t;sf
1þ 0:68w�5:09� �1:07� 1:21exp �0:49W*ð Þ½ � for Frn≥1
8<: (A6)
Normalized cumulative head discharge q* decreases with Froude number Frn, increases and then decreaseswith flood width limitation factor W*, and either decreases or is constant with canyon width to flood widthratio w* depending on whether the flood is subcritical or supercritical.
q* ¼ 1þ 0:79exp �2:16Frnð Þ½ � 1:14� 0:33w�0:37� �G2 for Frn < 1
1þ 0:79exp �2:16Frnð Þ½ � for Frn≥1
((A7)
in which
G2 ¼ 1:03� 0:16 1�W*ð Þ2:85 forW* < 1
1:08� 0:04W�0:31 forW*≥1
((A8)
Journal of Geophysical Research: Earth Surface 10.1002/2014JF003412
LAPOTRE AND LAMB FLOOD HYDRAULICS UPSTREAM OF WATERFALLS 1247
Note that these fit relationships are valid for the tested range and combinations of dimensionlessparameters listed in Table 1 but should be used with caution when applied near the edges of the parameterranges modeled in this study for nonsheet floods. They were tested against test simulations thatencompassed different parameter combinations (Figure 13 and Table 1) and are yet to be validated outside ofthe modeled ranges. Nevertheless, most of the acceleration factor ratios have predictable asymptoticalbehaviors (section 5).
Notations
Cf dimensionless friction coefficientFr Froude numberFrn normal Froude numberFr0 Froude number at the rimg acceleration of gravity (m/s2)h flow depth (m)hc critical flow depth (m)hn normal flow depth (m)h0 flow depth at the brink (m)l canyon length (m)l* downslope backwater parameterLb backwater length (m)n Manning’s n (s/m1/3)q discharge per unit width (m2/s)qn upstream discharge per unit width (m2/s)q0 discharge per unit width at the brink (m2/s)q* normalized cumulative head dischargeQh total discharge within the canyon head (m3/s)Qn normal discharge flowing across a width of a canyon radius (m3/s)r ratio of flow depth to normal flow depthS bed slope upstream of the waterfallt time (s)U depth-averaged flow velocity (m/s)Un depth-averaged normal flow velocity (m/s)Up depth-averaged flow velocity perpendicular to the brink (m/s)Ux depth-averaged downslope component of flow velocity (m/s)Uy depth-averaged cross-slope component of flow velocity (m/s)U0 depth-averaged flow velocity at the brink (m/s)u* shear velocity (m/s)w canyon width (m)w* canyon-to-flood width ratioW* lateral backwater flood width limitation factorW flood width (m)x downslope spatial coordinate (m)y cross-slope spatial coordinate (m)
α1D acceleration factor at the brink of a 1-D stepα2D acceleration factor at the brink of a 2-D canyonα* acceleration factor ratioα �
hacceleration factor ratio at the head center
α �w
acceleration factor ratio at the head-to-wall junctionα �
tacceleration factor ratio at the canyon toe
α �w;sf
acceleration factor ratio at the head-to-wall junction for a sheet floodα �t;sf
acceleration factor ratio at the canyon toe for a sheet floodε fractional acceleration caused by nonhydrostatic pressure at the rim
Journal of Geophysical Research: Earth Surface 10.1002/2014JF003412
LAPOTRE AND LAMB FLOOD HYDRAULICS UPSTREAM OF WATERFALLS 1248
θ azimuth with respect to the canyon centerlineρ density of water (kg/m3)τb bed shear stress (N/m2)
ReferencesAlonso, C. V., S. J. Bennett, and O. R. Stein (2002), Predicting head cut erosion and migration in concentrated flows typical of upland areas,
Water Resour. Res., 38(12), 1303, doi:10.1029/2001WR001173.Annandale, G. (1995), Erodibility, J. Hydraul. Res., 33(4), 471–494.Baker, V. R., and D. J. Milton (1974), Erosion by catastrophic floods on Mars and Earth, Icarus, 23(1), 27–41.Barnes, M. P., and T. E. Baldock (2006), Bed shear stress measurements in dam break and swash flows, paper presented at International
Conference on Civil and Environmental Engineering (ICCEE-2006).Baynes, E. R. C., M. Attal, S. Niedermann, L. A. Kirstein, A. J. Dugmore, and M. Naylor (2015), Erosion during extreme flood events dominates
Holocene canyon evolution in northeast Iceland, Proc. Natl. Acad. Sci. U.S.A., 112(8), 2355–2360, doi:10.1073/pnas.1415443112.Bennett, S. J. (1999), Effect of slope on the growth and migration of headcuts in rills, Geomorphology, 30(3), 273–290.Bennett, S. J., and J. Casali (2001), Effect of initial step height on headcut development in upland concentrated flows,Water Resour. Res., 37(5),
1475–1484, doi:10.1029/2000WR900373.Bishop, P., T. B. Hoey, J. D. Jansen, and I. L. Artza (2005), Knickpoint recession rate and catchment area: the case of uplifted rivers in Eastern
Scotland, Earth Surf. Processes Landforms, 30(6), 767–778.Bresse, J. A. C. (1860), Cours de Mecanique Appliquee: Professe a l’Ecole Imperiale des Ponts et Chaussees. Hydraulique, Gauthier-Villars, Paris.Bretz, J. H. (1969), The Lake Missoula floods and the channeled scabland, J. Geol., 77(5), 505–543.Brush, L. M., and M. G. Wolman (1960), Knickpoint behavior in noncohesive material: A laboratory study, Geol. Soc. Am. Bull., 71(1), 59–74.Butcher, J. C. (2008), Numerical Methods for Ordinary Differential Equations, John Wiley, Chichester, U. K.Chanson, H. (1994), Hydraulics of nappe flow regime above stepped chutes and spillways, Aust. Civ. Struct. Eng. Trans., CE36(1), 69–76.Chanson, H. (1995), Hydraulic Design of Stepped Cascades, Channels, Weirs and Spillways, Pergamon, Oxford, U. K.Chanson, H. (2002), Hydraulics of Stepped Chutes and Spillways, CRC Press, Balkema, Lisse, Netherlands.Chatanantavet, P., and G. Parker (2009), Physically based modeling of bedrock incision by abrasion, plucking, and macroabrasion, J. Geophys.
Res., 114, F04018, doi:10.1029/2008JF001044.Chow, V. (1959), Open Channel Hydraulics, McGraw-Hill Book Company, Inc., New York.Coleman, S. E., B. W. Melville, and L. Gore (2003), Fluvial entrainment of protruding fractured rock, J. Hydraul. Eng., 129(11), 872–884.Costa, J. E. (1987), Hydraulics and basin morphometry of the largest flash floods in the conterminous United States, J. Hydrol., 93(3), 313–338.Craddock, R. A., A. D. Howard, R. P. Irwin, S. Tooth, R. M. Williams, and P.-S. Chu (2012), Drainage network development in the Keanakako’i
tephra, Kilauea Volcano, Hawai’i: Implications for fluvial erosion and valley network formation on early Mars, J. Geophys. Res., 117, E08009,doi:10.1029/2012JE004074.
Delleur, J., J. Dooge, and K. Gent (1956), Influence of slope and roughness on the free overfall, J. Hydraul. Div., Am. Soc. Civ. Eng., 82(4), 1–35.DiBiase, R. A., K. X. Whipple, M. P. Lamb, and A. M. Heimsath (2014), The role of waterfalls and knickzones in controlling the style and pace of
landscape adjustment in the western San Gabriel Mountains, California, Geol. Soc. Am. Bull., 127(3/4), 539–559, doi:10.1130/B31113.1.Dietrich, W. E., and T. Dunne (1993), The channel head, in Channel Network Hydrology, edited by K. Beven and M. J. Kirkby, pp. 175–219,
John Wiley, Chichester, U. K.Dubinski, I. M., and E. Wohl (2013), Relationships between block quarrying, bed shear stress, and stream power: A physical model of block
quarrying of a jointed bedrock channel, Geomorphology, 180, 66–81.Fernandez Luque, R., and R. Van Beek (1976), Erosion and transport of bed-load sediment, J. Hydraul. Res., 14(2), 127–144.Feurich, R., F. Kettner, and N. Olsen (2011), Three-dimensional numerical investigation of spillway and reservoir hydraulics, paper presented
at Proceedings of the 34th World Congress of the International Association for Hydro-environment Research and Engineering: 33rdHydrology and Water Resources Symposium and 10th Conference on Hydraulics in Water Engineering, Engineers Australia.
Flint, J.-J. (1973), Experimental development of headward growth of channel networks, Geol. Soc. Am. Bull., 84(3), 1087–1094.Flores-Cervantes, J. H., E. Istanbulluoglu, and R. L. Bras (2006), Development of gullies on the landscape: A model of headcut retreat resulting
from plunge pool erosion, J. Geophys. Res., 111, F01010, doi:10.1029/2004JF000226.Gardner, T. W. (1983), Experimental study of knickpoint and longitudinal profile evolution in cohesive, homogeneous material, Geol. Soc. Am.
Bull., 94(5), 664–672.Gilbert, G. K. (1907), The rate of recession of Niagara Falls, U.S. Geol. Surv. Bull., 306, 1–31.Hager, W., and D. D. K. Hutter (1984), Approximate treatment of plane channel flow, Acta Mech., 51(1–2), 31–48.Hager, W. H. (1983), Hydraulics of plane free overfall, J. Hydraul. Eng., 109(12), 1683–1697.Hancock, G. S., R. S. Anderson, and K. X. Whipple (1998), Beyond power: Bedrock river incision process and form, in Rivers Over Rock: Fluvial
Processes in Bedrock Channels, pp. 35–60, AGU, Washington, D. C.Haviv, I., Y. Enzel, K. Whipple, E. Zilberman, J. Stone, A. Matmon, and L. Fifield (2006), Amplified erosion above waterfalls and oversteepened
bedrock reaches, J. Geophys. Res., 111, F04004, doi:10.1029/2006JF000461.Howard, A. D., and G. Kerby (1983), Channel changes in badlands, Geol. Soc. Am. Bull., 94(6), 739–752.Howard, A. D., and C. F. McLane (1988), Erosion of cohesionless sediment by groundwater seepage, Water Resour. Res., 24(10), 1659–1674,
doi:10.1029/WR024i010p01659.Howard, A. D., W. E. Dietrich, and M. A. Seidl (1994), Modeling fluvial erosion on regional to continental scales, J. Geophys. Res., 99(B7),
13971–13986, doi:10.1029/94JB00744.Izumi, N., and G. Parker (1995), Inception of channelization and drainage basin formation: Upstream-driven theory, J. Fluid Mech., 283, 341–363.Izumi, N., and G. Parker (2000), Linear stability analysis of channel inception: Downstream-driven theory, J. Fluid Mech., 419, 239–262.Kurganov, A., S. Noelle, and G. Petrova (2001), Semidiscrete central-upwind schemes for hyperbolic conservation laws and Hamilton-Jacobi
equations, SIAM J. Sci. Comput., 23(3), 707–740.Lamb, M. P., and W. E. Dietrich (2009), The persistence of waterfalls in fractured rock, Geol. Soc. Am. Bull., 121(7–8), 1123–1134.Lamb, M. P., A. D. Howard, J. Johnson, K. X. Whipple, W. E. Dietrich, and J. T. Perron (2006), Can springs cut canyons into rock?, J. Geophys. Res.,
111, E07002, doi:10.1029/2005JE002663.
AcknowledgmentsThis work benefited from discussionwith Gary Parker, Gareth Davies, andStephen Roberts. We thank CailanHaliday for assistance with and testingof the numerical model setup. We alsothank three anonymous reviewers forhelpful and constructive reviews thatimproved this paper. Support wasprovided by the NASA Earth and SpaceScience Fellowship 12-PLANET12F-0071, NSF Grant EAR-1147381, andNASA Grant NNX13AM83G. All data inthe present paper are available uponrequest to the corresponding author.
Journal of Geophysical Research: Earth Surface 10.1002/2014JF003412
LAPOTRE AND LAMB FLOOD HYDRAULICS UPSTREAM OF WATERFALLS 1249
Lamb, M. P., A. D. Howard, W. E. Dietrich, and J. T. Perron (2007), Formation of amphitheater-headed valleys by waterfall erosion afterlarge-scale slumping on Hawai’i, Geol. Soc. Am. Bull., 119(7–8), 805–822.
Lamb, M. P., W. E. Dietrich, S. M. Aciego, D. J. DePaolo, and M. Manga (2008), Formation of Box Canyon, Idaho, by megaflood: Implications forseepage erosion on Earth and Mars, Science, 320(5879), 1067–1070.
Lamb, M. P., J. A. Nittrouer, D. Mohrig, and J. Shaw (2012), Backwater and river plume controls on scour upstream of river mouths:Implications for fluvio-deltaic morphodynamics, J. Geophys. Res., 117, F01002, doi:10.1029/2011JF002079.
Lamb, M. P., B. H. Mackey, and K. A. Farley (2014), Amphitheater-headed canyons formed by megaflooding at Malad Gorge, Idaho, Proc. Natl.Acad. Sci. U.S.A., 111(1), 57–62.
Leopold, L. B., and W. B. Bull (1979), Base level, aggradation, and grade, Proc. Am. Philos. Soc., 168–202.Mackey, B. H., J. S. Scheingross, M. P. Lamb, and K. A. Farley (2014), Knickpoint formation, rapid propagation, and landscape response
following coastal cliff retreat at the last interglacial sea-level highstand: Kaua’i, Hawai’i, Geol. Soc. Am. Bull., 126, 925–942.Meyer-Peter, E., and R. Muller (1948), Formulas for bed-load transport, paper presented at Proceedings of the 2nd Meeting of the
International Association for Hydraulic Structures Research, International Association of Hydraulic Research Delft.Mungkasi, S., and S. G. Roberts (2011), A finite volume method for shallow water flows on triangular computational grids, paper presented at
2011 International Conference on Advanced Computer Science and Information System (ICACSIS), IEEE.Mungkasi, S., and S. G. Roberts (2013), Validation of ANUGA hydraulic model using exact solutions to shallow water wave problems, J. Phys.
Conf. Ser., 423, 012029.Nielsen, O., S. Roberts, D. Gray, A. McPherson, and A. Hitchman (2005), Hydrodynamic modelling of coastal inundation, paper presented at
MODSIM 2005 International Congress on Modelling and Simulation.O’Connor, J. E. (1993), Hydrology, hydraulics, and geomorphology of the Bonneville flood, Geol. Soc. Am. Spec. Pap., 274, 1–84.Pasternack, G. B., C. R. Ellis, K. A. Leier, B. L. Valle, and J. D. Marr (2006), Convergent hydraulics at horseshoe steps in bedrock rivers,
Geomorphology, 82(1), 126–145.Pasternack, G. B., C. R. Ellis, and J. D. Marr (2007), Jet and hydraulic jump near-bed stresses below a horseshoe waterfall,Water Resour. Res., 43,
W07449, doi:10.1029/2006WR005774.Petroff, A. P., O. Devauchelle, D. M. Abrams, A. E. Lobkovsky, A. Kudrolli, and D. H. Rothman (2011), Geometry of valley growth, J. Fluid Mech.,
673, 245–254, doi:10.1017/s002211201100053x.Rajaratnam, N., and D. Muralidhar (1968), Characteristics of the rectangular free overfall, J. Hydraul. Res., 6(3), 233–258.Rengers, F. K., and G. Tucker (2014), Analysis and modeling of gully headcut dynamics, North American high plains, J. Geophys. Res. Earth
Surf., 119, 983–1003, doi:10.1002/2013JF002962.Roberts, S., O. Nielsen, and J. Jakeman (2008), Simulation of tsunami and flash floods, in Modeling, Simulation and Optimization of Complex
Processes, edited, pp. 489–498, Springer, Berlin.Roberts, S., O. Nielsen, D. Gray, and J. Sexton (2009), ANUGA User Manual, Commonwealth of Australia (Geoscience Australia) and the
Australian National University, Canberra.Rouse, H. (1936), Discharge characteristics of the free overfall, Civ. Eng., 6, 257–260.Rouse, H. (1937), Pressure distribution and acceleration at the free overfall, Civ. Eng., 7(7), 518.Rouse, H. (1950), Engineering Hydraulics, John Wiley, New York.Sayers, A. T. (1990), Hydraulic and Compressible Flow Turbomachines, McGraw-Hill, London.Stein, O. R., and P. Julien (1993), Criterion delineating the mode of headcut migration, J. Hydraul. Eng., 119(1), 37–50.Stein, O. R., and D. A. LaTray (2002), Experiments and modeling of head cut migration in stratified soils, Water Resour. Res., 38(12), 1284,
doi:10.1029/2001WR001166.Stein, O. R., P. Julien, and C. Alonso (1993), Mechanics of jet scour downstream of a headcut, J. Hydraul. Res., 31(6), 723–738.Tokyay, N. D., and D. Yildiz (2007), Characteristics of free overfall for supercritical flows, Can. J. Civ. Eng., 34(2), 162–169.Tucker, G. E., L. Arnold, R. L. Bras, H. Flores, E. Istanbulluoglu, and P. Solyom (2006), Headwater channel dynamics in semiarid rangelands,
Colorado High Plains, USA, Geol. Soc. Am. Bull., 118(7–8), 959–974.Warner, N. H., S. Gupta, J.-R. Kim, S.-Y. Lin, and J.-P. Muller (2010), Retreat of a giant cataract in a long-lived (3.7–2.6 Ga) Martian outflow
channel, Geology, 38(9), 791–794.Whipple, K. X., G. S. Hancock, and R. S. Anderson (2000), River incision into bedrock: Mechanics and relative efficacy of plucking, abrasion, and
cavitation, Geol. Soc. Am. Bull., 112(3), 490–503.Williams, R. M., and M. C. Malin (2004), Evidence for late stage fluvial activity in Kasei Valles, Mars, J. Geophys. Res., 109, E06001, doi:10.1029/
2003JE002178.Wohl, E. (2008), The effect of bedrock jointing on the formation of straths in the Cache la Poudre River drainage, Colorado Front Range,
J. Geophys. Res., 113, F01007, doi:10.1029/2007JF000817.Zoppou, C., and S. Roberts (1999), Catastrophic collapse of water supply reservoirs in urban areas, J. Hydraul. Eng., 125(7), 686–695.
Journal of Geophysical Research: Earth Surface 10.1002/2014JF003412
LAPOTRE AND LAMB FLOOD HYDRAULICS UPSTREAM OF WATERFALLS 1250