Embed Size (px)
Citation preview
Proc. R. Soc. B
on July 13, 2018http://rspb.royalsocietypublishing.org/Downloaded from
* Autho
Electron1098/rsp
doi:10.1098/rspb.2010.0462
Published online
ReceivedAccepted
Submarine canyons: hotspots of benthicbiomass and productivity in the deep sea
Fabio C. De Leo1,*, Craig R. Smith1, Ashley A. Rowden2,
David A. Bowden2 and Malcolm R. Clark2
1Department of Oceanography, School of Ocean and Earth Science and Technology, University of Hawaii
at Manoa, 1000 Pope Road, Honolulu, HI 96822, USA2NIWA, National Institute of Water and Atmospheric Research, 301 Evans Bay Parade, Greta Point,
Private Bag 14-901, Wellington, New Zealand
Submarine canyons are dramatic and widespread topographic features crossing continental and island mar-
gins in all oceans. Canyons can be sites of enhanced organic-matter flux and deposition through entrainment
of coastal detrital export, dense shelf-water cascade, channelling of resuspended particulate material and
focusing of sediment deposition. Despite their unusual ecological characteristics and global distribution
along oceanic continental margins, only scattered information is available about the influence of submarine
canyons on deep-sea ecosystem structure and productivity. Here, we show that deep-sea canyons such as the
Kaikoura Canyon on the eastern New Zealand margin (428010 S, 1738030 E) can sustain enormous bio-
masses of infaunal megabenthic invertebrates over large areas. Our reported biomass values are 100-fold
higher than those previously reported for deep-sea (non-chemosynthetic) habitats below 500 m in the
ocean. We also present evidence from deep-sea-towed camera images that areas in the canyon that have
the extraordinary benthic biomass also harbour high abundances of macrourid (rattail) fishes likely to be
feeding on the macro- and megabenthos. Bottom-trawl catch data also indicate that the Kaikoura Canyon
has dramatically higher abundances of benthic-feeding fishes than adjacent slopes. Our results demonstrate
that the Kaikoura Canyon is one of the most productive habitats described so far in the deep sea. A new
global inventory suggests there are at least 660 submarine canyons worldwide, approximately 100 of
which could be biomass hotspots similar to the Kaikoura Canyon. The importance of such deep-sea canyons
as potential hotspots of production and commercial fisheries yields merits substantial further study.
Keywords: submarine canyons; benthic biomass hotspots; molpadiid holothurians; macrourid fishes;
eastern New Zealand margin
1. INTRODUCTIONContinental margins are considered major reservoirs of
marine biodiversity and productivity (Sanders & Hessler
1969; Rex 1983; Snelgrove et al. 1992; Levin et al. 2001;
Brandt et al. 2007) and have been, albeit controversially,
compared with the most diverse terrestrial and shallow-
water marine habitats (Rex 1983; Etter & Grassle 1992).
Submarine canyons are abundant and ubiquitous features
along continental and oceanic island margins that connect
continental shelves to deep ocean basins (Shepard & Dill
1966). Roughly, 20 per cent of the northeast Pacific shelf
edge between Alaska and the equator is interrupted by
steep, narrow and abrupt submarine canyons (Hickey
1997). The single global review available on canyon
distribution, origin, geology and sedimentation patterns
dates from 1966 and mapped 96 major canyons around
the world (Shepard & Dill 1966). Today’s more detailed,
readily available bathymetric data (still far from being
comprehensive, and compiled in the present paper for
the first time, to our knowledge) show at least 660 canyons
crossing continental margins globally (figure 1).
Patterns of benthic community structure and pro-
ductivity have been studied in relatively few submarine
r for correspondence ([email protected]).
ic supplementary material is available at http://dx.doi.org/10.b.2010.0462 or via http://rspb.royalsocietypublishing.org.
4 March 20108 April 2010 1
canyons (e.g. Vetter 1994; Vetter & Dayton 1999;
Hargrave et al. 2004; Schlacher et al. 2007). Some findings
suggest that increased habitat heterogeneity in canyons is
responsible for enhancing benthic biodiversity and creating
biomass hotspots (Rowe et al. 1982; Vetter 1994; Vetter
et al. 2010). Enhanced local fishery production in canyons,
when contrasted to regular slope environments, has also
been reported and attributed to the channelling and con-
centrating of detrital organic matter and pelagic animal
populations (Yoklavich et al. 2000; Brodeur 2001; Tudela
et al. 2003; Company et al. 2008). Many other unusual
ecological and physical characteristics have been attributed
to canyons such as concentrating diel vertical migrators
(Greene et al. 1988), displacing deep-water species to
coastal zones (King 1987), promoting topographically
induced upwelling (Klinck 1996; Hickey 1997; Sobarzo
et al. 2001), enhancing dyapicnal mixing via internal
wave generation (Kunze et al. 2002) and focusing of
internal tidal bores (Vetter & Dayton 1999).
Canyons are complex topographic features often charac-
terized by complicated patterns of hydrography, flow and
sediment transport and accumulation (Shepard et al.
1974; Oliveira et al. 2007; Garcia et al. 2008). Unusual
physical oceanographic conditions inside canyons, such as
accelerated currents and dense-water cascades, can be
caused by topographic and climate forcing, increasing
suspended particulate matter concentrations and transport
This journal is q 2010 The Royal Society
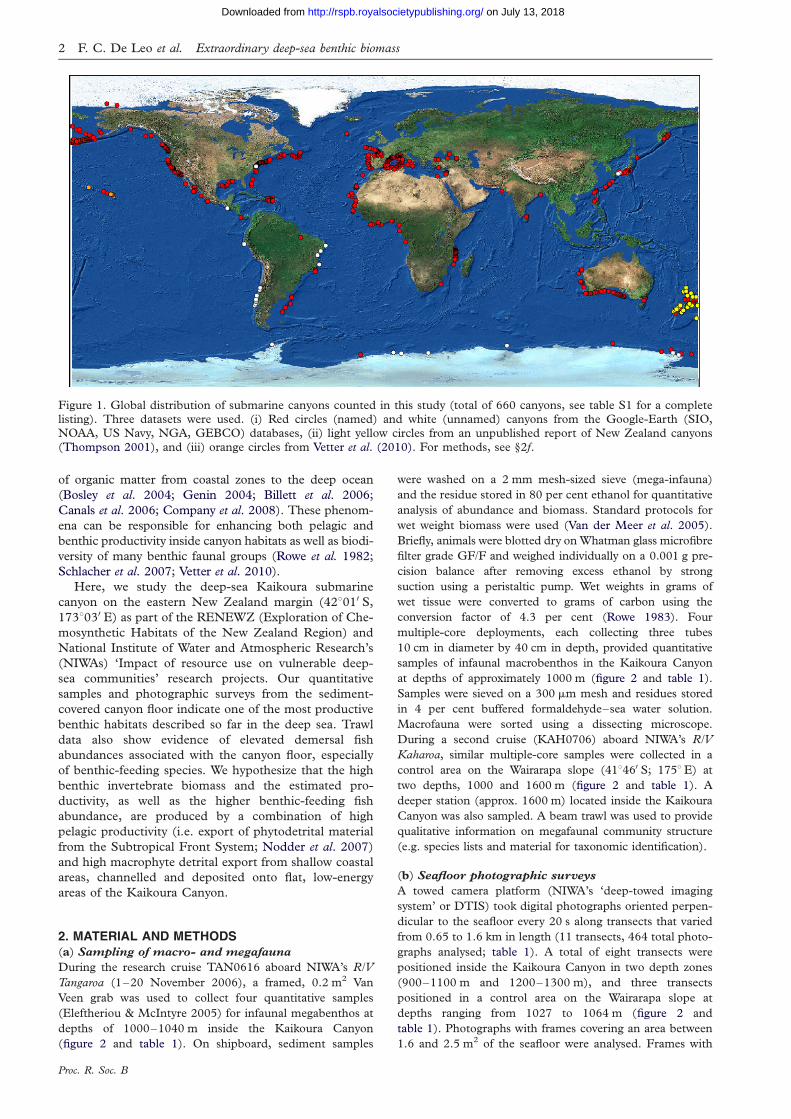
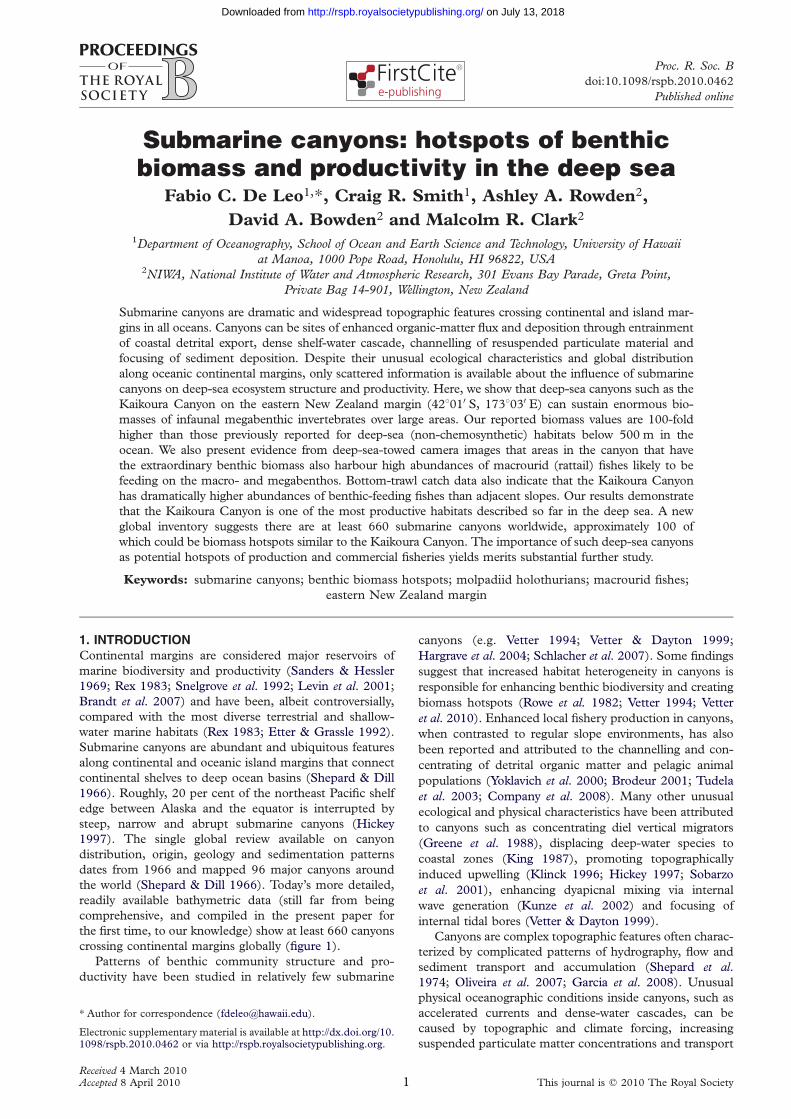
Figure 1. Global distribution of submarine canyons counted in this study (total of 660 canyons, see table S1 for a completelisting). Three datasets were used. (i) Red circles (named) and white (unnamed) canyons from the Google-Earth (SIO,NOAA, US Navy, NGA, GEBCO) databases, (ii) light yellow circles from an unpublished report of New Zealand canyons
(Thompson 2001), and (iii) orange circles from Vetter et al. (2010). For methods, see §2f.
2 F. C. De Leo et al. Extraordinary deep-sea benthic biomass
on July 13, 2018http://rspb.royalsocietypublishing.org/Downloaded from
of organic matter from coastal zones to the deep ocean
(Bosley et al. 2004; Genin 2004; Billett et al. 2006;
Canals et al. 2006; Company et al. 2008). These phenom-
ena can be responsible for enhancing both pelagic and
benthic productivity inside canyon habitats as well as biodi-
versity of many benthic faunal groups (Rowe et al. 1982;
Schlacher et al. 2007; Vetter et al. 2010).
Here, we study the deep-sea Kaikoura submarine
canyon on the eastern New Zealand margin (428010 S,
1738030 E) as part of the RENEWZ (Exploration of Che-
mosynthetic Habitats of the New Zealand Region) and
National Institute of Water and Atmospheric Research’s
(NIWAs) ‘Impact of resource use on vulnerable deep-
sea communities’ research projects. Our quantitative
samples and photographic surveys from the sediment-
covered canyon floor indicate one of the most productive
benthic habitats described so far in the deep sea. Trawl
data also show evidence of elevated demersal fish
abundances associated with the canyon floor, especially
of benthic-feeding species. We hypothesize that the high
benthic invertebrate biomass and the estimated pro-
ductivity, as well as the higher benthic-feeding fish
abundance, are produced by a combination of high
pelagic productivity (i.e. export of phytodetrital material
from the Subtropical Front System; Nodder et al. 2007)
and high macrophyte detrital export from shallow coastal
areas, channelled and deposited onto flat, low-energy
areas of the Kaikoura Canyon.
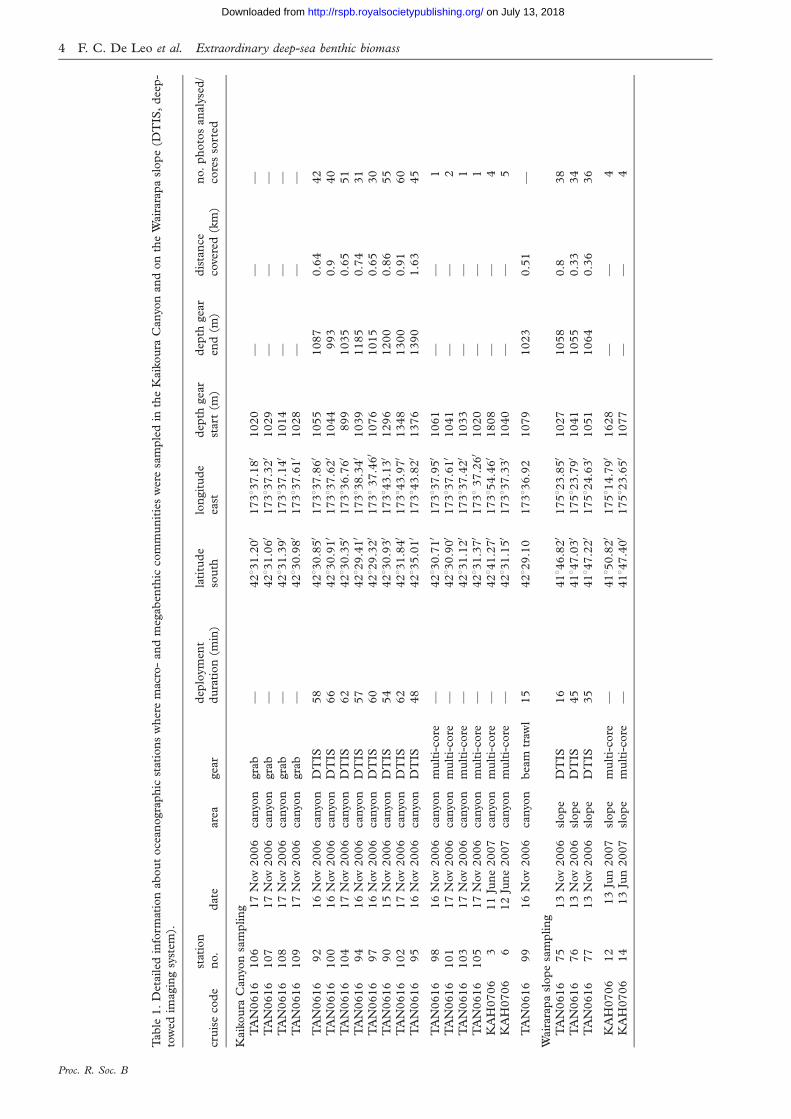
2. MATERIAL AND METHODS(a) Sampling of macro- and megafauna
During the research cruise TAN0616 aboard NIWA’s R/V
Tangaroa (1–20 November 2006), a framed, 0.2 m2 Van
Veen grab was used to collect four quantitative samples
(Eleftheriou & McIntyre 2005) for infaunal megabenthos at
depths of 1000–1040 m inside the Kaikoura Canyon
(figure 2 and table 1). On shipboard, sediment samples
Proc. R. Soc. B
were washed on a 2 mm mesh-sized sieve (mega-infauna)
and the residue stored in 80 per cent ethanol for quantitative
analysis of abundance and biomass. Standard protocols for
wet weight biomass were used (Van der Meer et al. 2005).
Briefly, animals were blotted dry on Whatman glass microfibre
filter grade GF/F and weighed individually on a 0.001 g pre-
cision balance after removing excess ethanol by strong
suction using a peristaltic pump. Wet weights in grams of
wet tissue were converted to grams of carbon using the
conversion factor of 4.3 per cent (Rowe 1983). Four
multiple-core deployments, each collecting three tubes
10 cm in diameter by 40 cm in depth, provided quantitative
samples of infaunal macrobenthos in the Kaikoura Canyon
at depths of approximately 1000 m (figure 2 and table 1).
Samples were sieved on a 300 mm mesh and residues stored
in 4 per cent buffered formaldehyde–sea water solution.
Macrofauna were sorted using a dissecting microscope.
During a second cruise (KAH0706) aboard NIWA’s R/V
Kaharoa, similar multiple-core samples were collected in a
control area on the Wairarapa slope (418460 S; 1758E) at
two depths, 1000 and 1600 m (figure 2 and table 1). A
deeper station (approx. 1600 m) located inside the Kaikoura
Canyon was also sampled. A beam trawl was used to provide
qualitative information on megafaunal community structure
(e.g. species lists and material for taxonomic identification).
(b) Seafloor photographic surveys
A towed camera platform (NIWA’s ‘deep-towed imaging
system’ or DTIS) took digital photographs oriented perpen-
dicular to the seafloor every 20 s along transects that varied
from 0.65 to 1.6 km in length (11 transects, 464 total photo-
graphs analysed; table 1). A total of eight transects were
positioned inside the Kaikoura Canyon in two depth zones
(900–1100 m and 1200–1300 m), and three transects
positioned in a control area on the Wairarapa slope at
depths ranging from 1027 to 1064 m (figure 2 and
table 1). Photographs with frames covering an area between
1.6 and 2.5 m2 of the seafloor were analysed. Frames with
New Zealand
Cook Strait
Wairarapa slope
Wellington
41°45' S
42°15' S
175° E173°20' E
175° E173°20' E
1000
200
1600
1500
2000
1000
2000
1000
Kaikoura Canyon
Figure 2. Map showing the areas sampled in the eastern New Zealand margin. Coloured symbols show positions of grab, multi-cores, DTIS photo-transects and bottom-trawl samples in the Kaikoura Canyon and the Wairarapa slope. Pink, grab samples;
orange, multi-core TAN0616; cyan, multi-core KAH0706; blue, photo transects; yellow, bottom trawling; red, beam trawl.
Extraordinary deep-sea benthic biomass F. C. De Leo et al. 3
on July 13, 2018http://rspb.royalsocietypublishing.org/Downloaded from
areas outside of this range (when the camera was either too
close or too far from the seafloor) were excluded from the
analysis. The total area of the seafloor analysed in the photo-
graphs was 920.4 m2 in the canyon and 280.8 m2 in slope
transects. We employed image analysis software (IMAGEJ;
Rasband 2009) to determine the abundance of megafauna
(invertebrate and fish) as well as of bioturbation features
(lebensspuren) from the images. Seafloor images were scaled
with two parallel laser beams 20 cm apart. Animal and
bioturbation feature densities measured from each frame
were then normalized to 1 m2 of the seafloor and plotted
along the transect length. Transects performed within
similar depth ranges and in close proximity were pooled
(transects 92, 100 and 104; 94 and 97; 90 and 102;
75–77; table 1).
(c) Multi-beam data and Geographical Information
System (GIS) analysis
A digital terrain map of the Kaikoura Canyon floor was pro-
duced using bathymetric data collected during the TAN0616
cruise by a multi-beam echo sounder (EM300). We used the
high-resolution bathymetry to estimate the total area of the
canyon that could be considered the invertebrate infaunal
megabenthos biomass hotspot. We based this estimate on
biomass measurements from grab samples collected in the
upper arm of the canyon and from the abundances of invert-
ebrate and bioturbation features observed in photographic
transects. We assumed that the high-biomass assemblages
were restricted to depositional canyon-floor regions with
gentle slopes of 108 or less, similar to the sites where infauna
were sampled, and within the depth range where the greatest
concentration of animal feeding and moving traces were
observed in photographs, i.e. 900–1100 m. The areal calcu-
lation was then performed using the functions ‘reclassify’ and
Proc. R. Soc. B
‘sum raster’ of the Spatial Analyst tool kit of ArcGIS 9 as fol-
lows: the original bathymetry grid data file (20 � 20 m cell
size) was first used to create another grid with the average
slope of each cell (. spatial analyst . surface analysis .
slope). This new grid file was then reclassified to provide
only the cells in which slopes were 108 or less. The next
reclassification step used the original bathymetry grid to pro-
duce a new layer with only cells filled by depths between 900
and 1100 m. The two new layers generated, i.e. (i) depths of
900–1000 m and (ii) slopes of 108 or less, were then overlaid.
The total number of 20 � 20 m cells in the overlaid layer
were counted (74 297) and multiplied by the area of
a single cell (0.0004 km2) to reach a total area of 29.719
or approximately 30 km2.
(d) Bottom-fish trawl data
Research trawl survey data from the area of 428000 –438000 S,
1738200 –1748000 E were extracted from the New Zealand
Ministry of Fisheries database Trawl. Several bottom-trawl
surveys for orange roughy were carried out in the 1980s
and 1990s, and trawls were taken on cruise TAN0616
(RENEWZ I). All cruises employed the standard NIWA
rough-bottom orange roughy trawl net and gear set-up.
Data from a total of 12 trawls from the canyon and the
nearby continental slope met the criteria of similarities in
depth, slope and apparent bottom type. Six trawls came
from the canyon; three from the upper, western side of
the canyon head at about 700 m depth, and three from
1300–1400 m on the northern and eastern sides of the
canyon head. Six tows were available from similar depths
away from the canyon to the south and east on the adjacent
slope (figure 2 and table S2). The catch composition of the
12 trawls included 66 fish and squid species, which were con-
sidered demersal rather than pelagic, and to be sufficiently
Tab
le1.
Det
ailed
info
rmat
ion
abou
toce
an
ogra
phic
stat
ion
sw
her
em
acro
-an
dm
egab
enth
icco
mm
un
itie
sw
ere
sam
ple
din
the
Kaik
ou
raC
anyo
nan
don
the
Wair
ara
pa
slope
(DT
IS,
dee
p-
tow
edim
agin
gsy
stem
).
cru
ise
cod
est
atio
nn
o.
dat
eare
agea
rd
eplo
ym
ent
du
rati
on
(min
)la
titu
de
sou
thlo
ngit
ud
eea
std
epth
gea
rst
art
(m)
dep
thgea
ren
d(m
)d
ista
nce
cove
red
(km
)n
o.
photo
san
aly
sed
/co
res
sort
ed
Kaik
ou
raC
anyo
nsa
mplin
gT
AN
0616
106
17
Nov
2006
canyo
ngra
b—
4283
1.2
00
17383
7.1
80
1020
——
—T
AN
0616
107
17
Nov
2006
canyo
ngra
b—
4283
1.0
60
17383
7.3
20
1029
——
—T
AN
0616
108
17
Nov
2006
canyo
ngra
b—
4283
1.3
90
17383
7.1
40
1014
——
—
TA
N0616
109
17
Nov
2006
canyo
ngra
b—
4283
0.9
80
17383
7.6
10
1028
——
—
TA
N0616
92
16
Nov
2006
canyo
nD
TIS
58
4283
0.8
50
17383
7.8
60
1055
1087
0.6
442
TA
N0616
100
16
Nov
2006
canyo
nD
TIS
66
4283
0.9
10
17383
7.6
20
1044
993
0.9
40
TA
N0616
104
17
Nov
2006
canyo
nD
TIS
62
4283
0.3
50
17383
6.7
60
899
1035
0.6
551
TA
N0616
94
16
Nov
2006
canyo
nD
TIS
57
4282
9.4
10
17383
8.3
40
1039
1185
0.7
431
TA
N0616
97
16
Nov
2006
canyo
nD
TIS
60
4282
9.3
20
1738
37.4
60
1076
1015
0.6
530
TA
N0616
90
15
Nov
2006
canyo
nD
TIS
54
4283
0.9
30
17384
3.1
30
1296
1200
0.8
655
TA
N0616
102
17
Nov
2006
canyo
nD
TIS
62
4283
1.8
40
17384
3.9
70
1348
1300
0.9
160
TA
N0616
95
16
Nov
2006
canyo
nD
TIS
48
4283
5.0
10
17384
3.8
20
1376
1390
1.6
345
TA
N0616
98
16
Nov
2006
canyo
nm
ult
i-co
re—
4283
0.7
10
17383
7.9
50
1061
——
1T
AN
0616
101
17
Nov
2006
canyo
nm
ult
i-co
re—
4283
0.9
00
17383
7.6
10
1041
——
2T
AN
0616
103
17
Nov
2006
canyo
nm
ult
i-co
re—
4283
1.1
20
17383
7.4
20
1033
——
1T
AN
0616
105
17
Nov
2006
canyo
nm
ult
i-co
re—
4283
1.3
70
1738
37.2
60
1020
——
1
KA
H0706
311
Jun
e2007
canyo
nm
ult
i-co
re—
4284
1.2
70
17385
4.4
60
1808
——
4K
AH
0706
612
Jun
e2007
canyo
nm
ult
i-co
re—
4283
1.1
50
17383
7.3
30
1040
——
5
TA
N0616
99
16
Nov
2006
canyo
nbea
mtr
awl
15
4282
9.1
017383
6.9
21079
1023
0.5
1—
Wair
ara
pa
slope
sam
plin
gT
AN
0616
75
13
Nov
2006
slope
DT
IS16
4184
6.8
20
17582
3.8
50
1027
1058
0.8
38
TA
N0616
76
13
Nov
2006
slope
DT
IS45
4184
7.0
30
17582
3.7
90
1041
1055
0.3
334
TA
N0616
77
13
Nov
2006
slope
DT
IS35
4184
7.2
20
17582
4.6
30
1051
1064
0.3
636
KA
H0706
12
13
Jun
2007
slope
mu
lti-
core
—4185
0.8
20
17581
4.7
90
1628
——
4K
AH
0706
14
13
Jun
2007
slope
mu
lti-
core
—4184
7.4
00
17582
3.6
50
1077
——
4
4 F. C. De Leo et al. Extraordinary deep-sea benthic biomass
Proc. R. Soc. B
on July 13, 2018http://rspb.royalsocietypublishing.org/Downloaded from
total Hol Echr Pol Echi0
250
500
750(a) (b)
indi
vidu
als
m–2
total Hol Echr Pol Echi0
500
1000
1500
2000
(gm
m–2
)
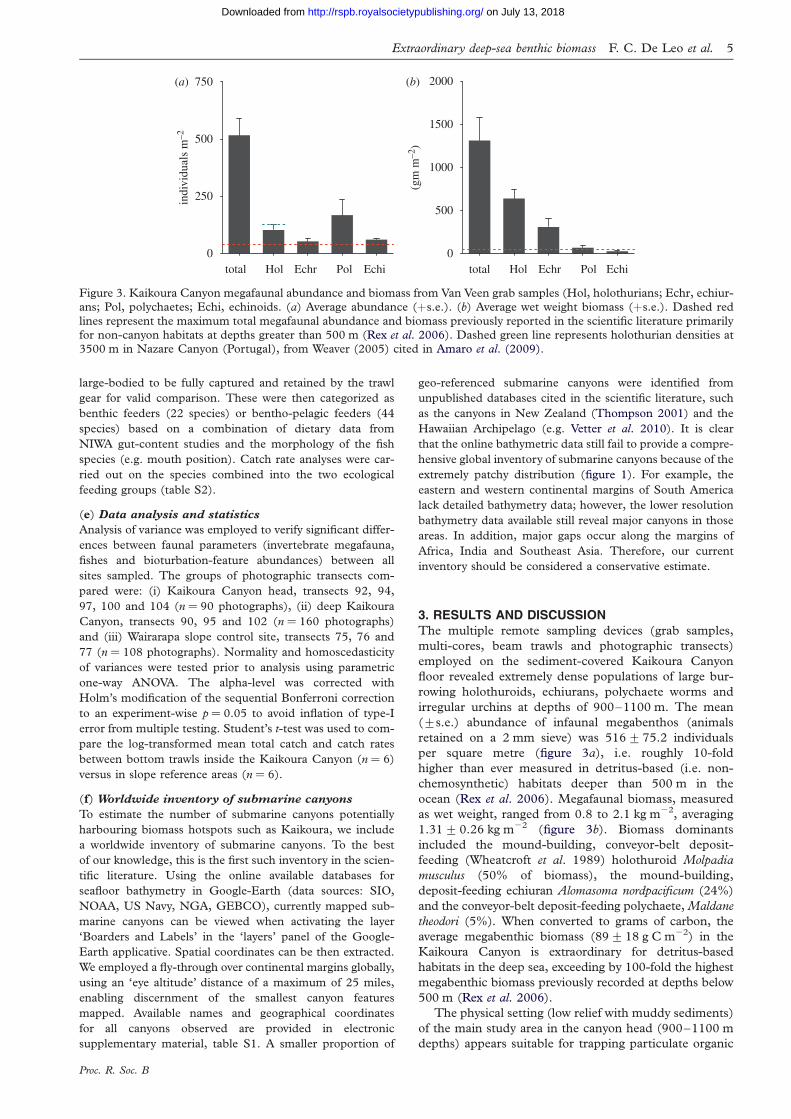
Figure 3. Kaikoura Canyon megafaunal abundance and biomass from Van Veen grab samples (Hol, holothurians; Echr, echiur-ans; Pol, polychaetes; Echi, echinoids. (a) Average abundance (þs.e.). (b) Average wet weight biomass (þs.e.). Dashed red
lines represent the maximum total megafaunal abundance and biomass previously reported in the scientific literature primarilyfor non-canyon habitats at depths greater than 500 m (Rex et al. 2006). Dashed green line represents holothurian densities at3500 m in Nazare Canyon (Portugal), from Weaver (2005) cited in Amaro et al. (2009).
Extraordinary deep-sea benthic biomass F. C. De Leo et al. 5
on July 13, 2018http://rspb.royalsocietypublishing.org/Downloaded from
large-bodied to be fully captured and retained by the trawl
gear for valid comparison. These were then categorized as
benthic feeders (22 species) or bentho-pelagic feeders (44
species) based on a combination of dietary data from
NIWA gut-content studies and the morphology of the fish
species (e.g. mouth position). Catch rate analyses were car-
ried out on the species combined into the two ecological
feeding groups (table S2).
(e) Data analysis and statistics
Analysis of variance was employed to verify significant differ-
ences between faunal parameters (invertebrate megafauna,
fishes and bioturbation-feature abundances) between all
sites sampled. The groups of photographic transects com-
pared were: (i) Kaikoura Canyon head, transects 92, 94,
97, 100 and 104 (n ¼ 90 photographs), (ii) deep Kaikoura
Canyon, transects 90, 95 and 102 (n ¼ 160 photographs)
and (iii) Wairarapa slope control site, transects 75, 76 and
77 (n ¼ 108 photographs). Normality and homoscedasticity
of variances were tested prior to analysis using parametric
one-way ANOVA. The alpha-level was corrected with
Holm’s modification of the sequential Bonferroni correction
to an experiment-wise p ¼ 0.05 to avoid inflation of type-I
error from multiple testing. Student’s t-test was used to com-
pare the log-transformed mean total catch and catch rates
between bottom trawls inside the Kaikoura Canyon (n ¼ 6)
versus in slope reference areas (n ¼ 6).
(f) Worldwide inventory of submarine canyons
To estimate the number of submarine canyons potentially
harbouring biomass hotspots such as Kaikoura, we include
a worldwide inventory of submarine canyons. To the best
of our knowledge, this is the first such inventory in the scien-
tific literature. Using the online available databases for
seafloor bathymetry in Google-Earth (data sources: SIO,
NOAA, US Navy, NGA, GEBCO), currently mapped sub-
marine canyons can be viewed when activating the layer
‘Boarders and Labels’ in the ‘layers’ panel of the Google-
Earth applicative. Spatial coordinates can be then extracted.
We employed a fly-through over continental margins globally,
using an ‘eye altitude’ distance of a maximum of 25 miles,
enabling discernment of the smallest canyon features
mapped. Available names and geographical coordinates
for all canyons observed are provided in electronic
supplementary material, table S1. A smaller proportion of
Proc. R. Soc. B
geo-referenced submarine canyons were identified from
unpublished databases cited in the scientific literature, such
as the canyons in New Zealand (Thompson 2001) and the
Hawaiian Archipelago (e.g. Vetter et al. 2010). It is clear
that the online bathymetric data still fail to provide a compre-
hensive global inventory of submarine canyons because of the
extremely patchy distribution (figure 1). For example, the
eastern and western continental margins of South America
lack detailed bathymetry data; however, the lower resolution
bathymetry data available still reveal major canyons in those
areas. In addition, major gaps occur along the margins of
Africa, India and Southeast Asia. Therefore, our current
inventory should be considered a conservative estimate.
3. RESULTS AND DISCUSSIONThe multiple remote sampling devices (grab samples,
multi-cores, beam trawls and photographic transects)
employed on the sediment-covered Kaikoura Canyon
floor revealed extremely dense populations of large bur-
rowing holothuroids, echiurans, polychaete worms and
irregular urchins at depths of 900–1100 m. The mean
(+s.e.) abundance of infaunal megabenthos (animals
retained on a 2 mm sieve) was 516+75.2 individuals
per square metre (figure 3a), i.e. roughly 10-fold
higher than ever measured in detritus-based (i.e. non-
chemosynthetic) habitats deeper than 500 m in the
ocean (Rex et al. 2006). Megafaunal biomass, measured
as wet weight, ranged from 0.8 to 2.1 kg m22, averaging
1.31+0.26 kg m22 (figure 3b). Biomass dominants
included the mound-building, conveyor-belt deposit-
feeding (Wheatcroft et al. 1989) holothuroid Molpadia
musculus (50% of biomass), the mound-building,
deposit-feeding echiuran Alomasoma nordpacificum (24%)
and the conveyor-belt deposit-feeding polychaete, Maldane
theodori (5%). When converted to grams of carbon, the
average megabenthic biomass (89+18 g C m22) in the
Kaikoura Canyon is extraordinary for detritus-based
habitats in the deep sea, exceeding by 100-fold the highest
megabenthic biomass previously recorded at depths below
500 m (Rex et al. 2006).
The physical setting (low relief with muddy sediments)
of the main study area in the canyon head (900–1100 m
depths) appears suitable for trapping particulate organic
fish
den
sity
(no
. m–2
)fi
sh d
ensi
ty (
no. m
–2)
1 10 20 30 40 50 60 70 80 90 1000
20
40
60
80
100
0
3
6
1 10 20 30 400
20
40
60
80
100
0
3
6
1 10 20 30 40 50 60 70 80 90 100 110 120 1300
20406080
100120360600
0
3
6
1 10 20 30 40 50 600
20406080
100120
360
0
3
6
1 10 20 30 40 50 60 70 80 90 100 1100
20
40
60
80
100
0
3
6
abun
danc
e (n
o. m
–2)
abun
danc
e (n
o. m
–2)
(a)
(b)
(c)
frame number
92, 100, 104
94, 97
90, 102
95
75, 76, 77
fish
den
sity
(no
. m–2
)fi
sh d
ensi
ty (
no. m
–2)
fish
den
sit y
(no
. m–2
)
abun
danc
e (n
o. m
–2)
abun
danc
e (n
o. m
–2)
abun
danc
e (n
o. m
–2)
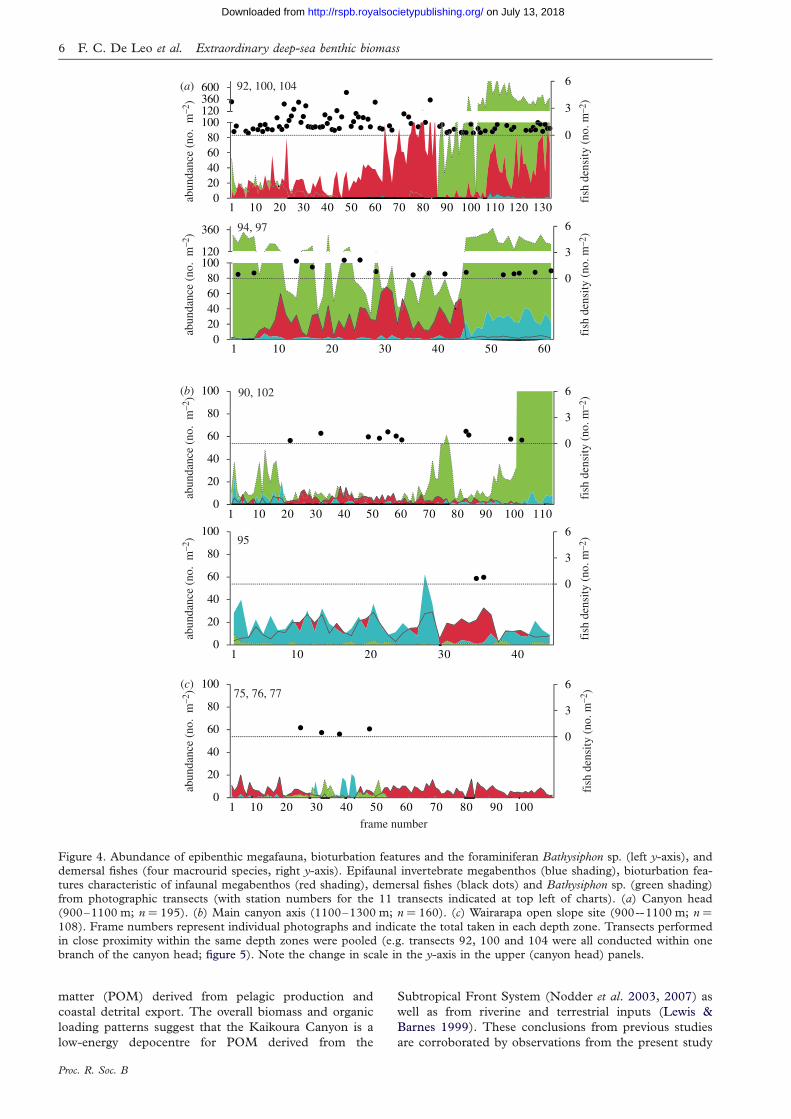
Figure 4. Abundance of epibenthic megafauna, bioturbation features and the foraminiferan Bathysiphon sp. (left y-axis), and
demersal fishes (four macrourid species, right y-axis). Epifaunal invertebrate megabenthos (blue shading), bioturbation fea-tures characteristic of infaunal megabenthos (red shading), demersal fishes (black dots) and Bathysiphon sp. (green shading)from photographic transects (with station numbers for the 11 transects indicated at top left of charts). (a) Canyon head(900–1100 m; n ¼ 195). (b) Main canyon axis (1100–1300 m; n ¼ 160). (c) Wairarapa open slope site (900--1100 m; n ¼108). Frame numbers represent individual photographs and indicate the total taken in each depth zone. Transects performedin close proximity within the same depth zones were pooled (e.g. transects 92, 100 and 104 were all conducted within onebranch of the canyon head; figure 5). Note the change in scale in the y-axis in the upper (canyon head) panels.
6 F. C. De Leo et al. Extraordinary deep-sea benthic biomass
on July 13, 2018http://rspb.royalsocietypublishing.org/Downloaded from
matter (POM) derived from pelagic production and
coastal detrital export. The overall biomass and organic
loading patterns suggest that the Kaikoura Canyon is a
low-energy depocentre for POM derived from the
Proc. R. Soc. B
Subtropical Front System (Nodder et al. 2003, 2007) as
well as from riverine and terrestrial inputs (Lewis &
Barnes 1999). These conclusions from previous studies
are corroborated by observations from the present study
600
500
700 800
900
1000
400 3001100
12001300
200
1400
100
500
100
500
400
400
300
400
200
600
500
700300
200
300
300
500
100
900
400600
700200
300
1100
100
200
400
200
300
300
500
400
200
(b)(a)
00
N
42°36' S
NIWA ©
©
102
90
95
104
97 94
92100New Zealand
Kaikoura
Kaikoura Canyon174° E
N
0 3 km
144 km2
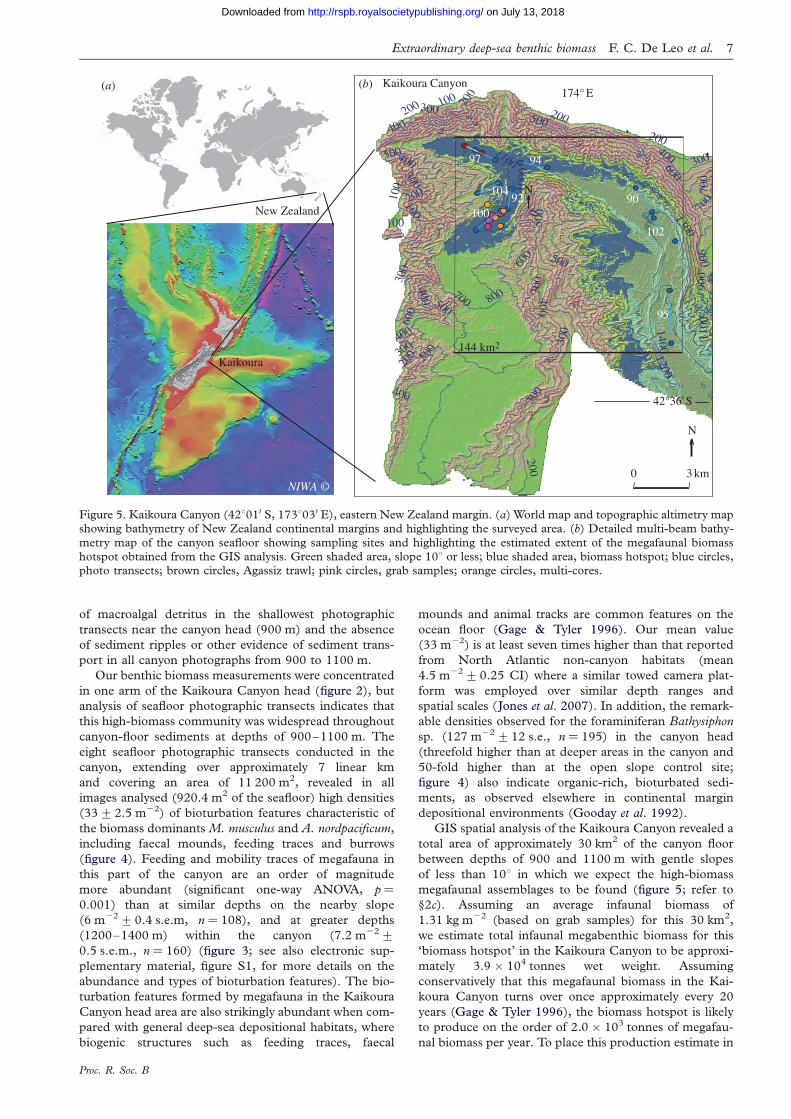
Figure 5. Kaikoura Canyon (428010 S, 1738030 E), eastern New Zealand margin. (a) World map and topographic altimetry mapshowing bathymetry of New Zealand continental margins and highlighting the surveyed area. (b) Detailed multi-beam bathy-
metry map of the canyon seafloor showing sampling sites and highlighting the estimated extent of the megafaunal biomasshotspot obtained from the GIS analysis. Green shaded area, slope 108 or less; blue shaded area, biomass hotspot; blue circles,photo transects; brown circles, Agassiz trawl; pink circles, grab samples; orange circles, multi-cores.
Extraordinary deep-sea benthic biomass F. C. De Leo et al. 7
on July 13, 2018http://rspb.royalsocietypublishing.org/Downloaded from
of macroalgal detritus in the shallowest photographic
transects near the canyon head (900 m) and the absence
of sediment ripples or other evidence of sediment trans-
port in all canyon photographs from 900 to 1100 m.
Our benthic biomass measurements were concentrated
in one arm of the Kaikoura Canyon head (figure 2), but
analysis of seafloor photographic transects indicates that
this high-biomass community was widespread throughout
canyon-floor sediments at depths of 900–1100 m. The
eight seafloor photographic transects conducted in the
canyon, extending over approximately 7 linear km
and covering an area of 11 200 m2, revealed in all
images analysed (920.4 m2 of the seafloor) high densities
(33+2.5 m22) of bioturbation features characteristic of
the biomass dominants M. musculus and A. nordpacificum,
including faecal mounds, feeding traces and burrows
(figure 4). Feeding and mobility traces of megafauna in
this part of the canyon are an order of magnitude
more abundant (significant one-way ANOVA, p ¼
0.001) than at similar depths on the nearby slope
(6 m22+0.4 s.e.m, n ¼ 108), and at greater depths
(1200–1400 m) within the canyon (7.2 m22+0.5 s.e.m., n ¼ 160) (figure 3; see also electronic sup-
plementary material, figure S1, for more details on the
abundance and types of bioturbation features). The bio-
turbation features formed by megafauna in the Kaikoura
Canyon head area are also strikingly abundant when com-
pared with general deep-sea depositional habitats, where
biogenic structures such as feeding traces, faecal
Proc. R. Soc. B
mounds and animal tracks are common features on the
ocean floor (Gage & Tyler 1996). Our mean value
(33 m22) is at least seven times higher than that reported
from North Atlantic non-canyon habitats (mean
4.5 m22+0.25 CI) where a similar towed camera plat-
form was employed over similar depth ranges and
spatial scales (Jones et al. 2007). In addition, the remark-
able densities observed for the foraminiferan Bathysiphon
sp. (127 m22+12 s.e., n ¼ 195) in the canyon head
(threefold higher than at deeper areas in the canyon and
50-fold higher than at the open slope control site;
figure 4) also indicate organic-rich, bioturbated sedi-
ments, as observed elsewhere in continental margin
depositional environments (Gooday et al. 1992).
GIS spatial analysis of the Kaikoura Canyon revealed a
total area of approximately 30 km2 of the canyon floor
between depths of 900 and 1100 m with gentle slopes
of less than 108 in which we expect the high-biomass
megafaunal assemblages to be found (figure 5; refer to
§2c). Assuming an average infaunal biomass of
1.31 kg m22 (based on grab samples) for this 30 km2,
we estimate total infaunal megabenthic biomass for this
‘biomass hotspot’ in the Kaikoura Canyon to be approxi-
mately 3.9 � 104 tonnes wet weight. Assuming
conservatively that this megafaunal biomass in the Kai-
koura Canyon turns over once approximately every 20
years (Gage & Tyler 1996), the biomass hotspot is likely
to produce on the order of 2.0 � 103 tonnes of megafau-
nal biomass per year. To place this production estimate in
600700
100030
01200
130020
030
0
700
300600
300
1000
500400
1200
1300800
900
1100
200
1400
100
600
1100
400
400
500
500
1000500 400
600
500
0
N
E W
N
E
SS
W4 8 12 162
km
catch rate (kg km–1)
500
800
900 400
1100 1400
100
600
1100
400
400
500500
1000500 400
600
500
0 4 8 12 162km
Kaikoura Canyon Kaikoura Canyon
174° E 174° E42
°36'
S
42°36' S
benthic
bentho-pelagic
40
proportion of total catch
benthic
bentho-pelagic
(a) (b)
1000
1500
1250
1000
1500
1250
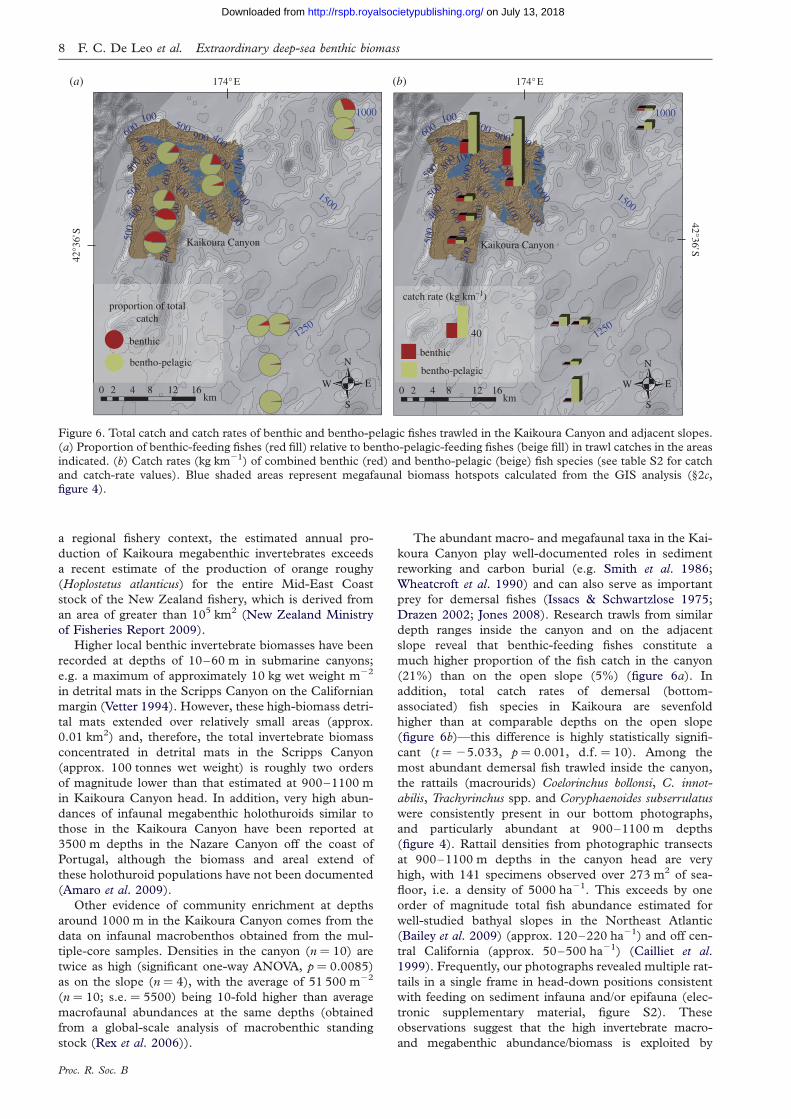
Figure 6. Total catch and catch rates of benthic and bentho-pelagic fishes trawled in the Kaikoura Canyon and adjacent slopes.(a) Proportion of benthic-feeding fishes (red fill) relative to bentho-pelagic-feeding fishes (beige fill) in trawl catches in the areas
indicated. (b) Catch rates (kg km21) of combined benthic (red) and bentho-pelagic (beige) fish species (see table S2 for catchand catch-rate values). Blue shaded areas represent megafaunal biomass hotspots calculated from the GIS analysis (§2c,figure 4).
8 F. C. De Leo et al. Extraordinary deep-sea benthic biomass
on July 13, 2018http://rspb.royalsocietypublishing.org/Downloaded from
a regional fishery context, the estimated annual pro-
duction of Kaikoura megabenthic invertebrates exceeds
a recent estimate of the production of orange roughy
(Hoplostetus atlanticus) for the entire Mid-East Coast
stock of the New Zealand fishery, which is derived from
an area of greater than 105 km2 (New Zealand Ministry
of Fisheries Report 2009).
Higher local benthic invertebrate biomasses have been
recorded at depths of 10–60 m in submarine canyons;
e.g. a maximum of approximately 10 kg wet weight m22
in detrital mats in the Scripps Canyon on the Californian
margin (Vetter 1994). However, these high-biomass detri-
tal mats extended over relatively small areas (approx.
0.01 km2) and, therefore, the total invertebrate biomass
concentrated in detrital mats in the Scripps Canyon
(approx. 100 tonnes wet weight) is roughly two orders
of magnitude lower than that estimated at 900–1100 m
in Kaikoura Canyon head. In addition, very high abun-
dances of infaunal megabenthic holothuroids similar to
those in the Kaikoura Canyon have been reported at
3500 m depths in the Nazare Canyon off the coast of
Portugal, although the biomass and areal extend of
these holothuroid populations have not been documented
(Amaro et al. 2009).
Other evidence of community enrichment at depths
around 1000 m in the Kaikoura Canyon comes from the
data on infaunal macrobenthos obtained from the mul-
tiple-core samples. Densities in the canyon (n ¼ 10) are
twice as high (significant one-way ANOVA, p ¼ 0.0085)
as on the slope (n ¼ 4), with the average of 51 500 m22
(n ¼ 10; s.e. ¼ 5500) being 10-fold higher than average
macrofaunal abundances at the same depths (obtained
from a global-scale analysis of macrobenthic standing
stock (Rex et al. 2006)).
Proc. R. Soc. B
The abundant macro- and megafaunal taxa in the Kai-
koura Canyon play well-documented roles in sediment
reworking and carbon burial (e.g. Smith et al. 1986;
Wheatcroft et al. 1990) and can also serve as important
prey for demersal fishes (Issacs & Schwartzlose 1975;
Drazen 2002; Jones 2008). Research trawls from similar
depth ranges inside the canyon and on the adjacent
slope reveal that benthic-feeding fishes constitute a
much higher proportion of the fish catch in the canyon
(21%) than on the open slope (5%) (figure 6a). In
addition, total catch rates of demersal (bottom-
associated) fish species in Kaikoura are sevenfold
higher than at comparable depths on the open slope
(figure 6b)—this difference is highly statistically signifi-
cant (t ¼ 25.033, p ¼ 0.001, d.f. ¼ 10). Among the
most abundant demersal fish trawled inside the canyon,
the rattails (macrourids) Coelorinchus bollonsi, C. innot-
abilis, Trachyrinchus spp. and Coryphaenoides subserrulatus
were consistently present in our bottom photographs,
and particularly abundant at 900–1100 m depths
(figure 4). Rattail densities from photographic transects
at 900–1100 m depths in the canyon head are very
high, with 141 specimens observed over 273 m2 of sea-
floor, i.e. a density of 5000 ha21. This exceeds by one
order of magnitude total fish abundance estimated for
well-studied bathyal slopes in the Northeast Atlantic
(Bailey et al. 2009) (approx. 120–220 ha21) and off cen-
tral California (approx. 50–500 ha21) (Cailliet et al.
1999). Frequently, our photographs revealed multiple rat-
tails in a single frame in head-down positions consistent
with feeding on sediment infauna and/or epifauna (elec-
tronic supplementary material, figure S2). These
observations suggest that the high invertebrate macro-
and megabenthic abundance/biomass is exploited by
Extraordinary deep-sea benthic biomass F. C. De Leo et al. 9
on July 13, 2018http://rspb.royalsocietypublishing.org/Downloaded from
bottom-feeding fishes in the Kaikoura Canyon, which his-
torically has been an important area of major deepwater
fishery catch off New Zealand (Clark et al. 2003).
Our findings suggest that the Kaikoura Canyon is one
of the most productive benthic habitats known for
the deep sea and may contribute significantly to deep-
sea ecosystem production in the immediate canyon
vicinity, which includes deep commercial fisheries for
hoki (Macruronus novaezelandiae) and orange roughy
(H. atlanticus) (Clark et al. 2003). Whether Kaikoura
Canyon production is important for fishes residing tem-
porarily in the canyon but commercially exploited more
broadly remains to be ascertained.
Submarine canyons are globally numerous but very
poorly sampled, which may explain why biomasses similar
to those in the Kaikoura Canyon have not been previously
recorded for the deep sea. How common are biomass hot-
spots such as the Kaikoura Canyon likely to be on ocean
margins? Approximately 15 per cent of the 96 submarine
canyons whose physical and geological features have been
reviewed in detail (Shepard & Dill 1966) exhibit charac-
teristics similar to those of the Kaikoura Canyon (and
the Nazare Canyon off Portugal margin, as potentially
another example; Amaro et al. 2009) including:
(i) heads positioned in coastal embayments with high
loads of terrestrial material, (ii) U-shaped canyon cross
sections, and (iii) substantial inputs of coastal sediments
(Lewis & Barnes 1999; Oliveira et al. 2007). Thus, on
the order of 15 per cent of submarine canyons globally
may support intense deep-sea biomass hotspots. Recent
global bathymetry data made available on Google-Earth
(refer to §2f ) indicate that there are 660 or more submar-
ine canyons cutting across the world’s continental
margins, excluding Antarctica (which exports little terres-
trial organic material to the ocean) (figure 1 shows the
first available map with submarine canyon distribution
on continental and island margins worldwide; see elec-
tronic supplementary material, table S1, for canyon
geographical coordinates). This suggests that globally
there could be on the order of 0.15 � 660 ¼ 99 deep-
sea canyons harbouring biomass hotspots like the
Kaikoura Canyon. Clearly, the role of submarine canyons
as hotspots of benthic biomass and potential fisheries pro-
duction in the deep sea merits further investigation,
especially owing to the steadily increasing human foot-
print on deep-sea ecosystems (Smith et al. 2008).
We thank the NOAA Office of Ocean Exploration (grant no.NA05OAR4171076) and NIWA for research and vesselsupport, the RENEWZ Project team for help at sea, andCAPES (Brazilian Ministry of Education) and Fulbright fora fellowship to F.D.L. We thank following specialists forassistance in identification of invertebrate megafauna: GeoffRead, polychaetes; Owen Anderson, sea urchins; PeterMcMillan, demersal fishes. Thanks also to Arne Pallentinfor initial processing of multi-beam data. This iscontribution 7926 from SOEST, and a product of NIWA’s‘Impact of resource use on vulnerable deep-seacommunities’ research project.
REFERENCESAmaro, T., Witte, H., Herndl, G. J., Cunha, M. R. & Billett,
D. S. M. 2009 Deep-sea bacterial communities in sedi-ments and guts of deposit-feeding holothurians in
Proc. R. Soc. B
Portuguese canyons (NE Atlantic). Deep Sea Res. Part I56, 1834–1843. (doi:10.1016/j.dsr.2009.05.014)
Bailey, D. M., Collins, M. A., Gordon, J. D. M., Zuur, A. F. &
Priede, I. G. 2009 Long-term changes in deep-water fishpopulations in the northeast Atlantic: a deeper reachingeffect of fisheries? Proc. R. Soc. B 276, 1965–1969.(doi:10.1098/rspb.2009.0098)
Billett, D. S. M., Bett, B. J., Jacobs, C. L., Rouse, I. P. &
Wigham, B. D. 2006 Mass deposition of jellyfish in thedeep Arabian Sea. Limnol. Oceanogr. 51, 2077–2083.
Bosley, K. L., Lavelle, J. W., Brodeur, R. D., Wakefield,W. W., Emmett, R. L., Baker, E. T. & Rehmke, K. M.
2004 Biological and physical processes in and aroundAstoria Submarine Canyon, Oregon, USA. J. Mar. Sys.50, 21–37. (doi:10.1016/j.jmarsys.2003.06.006)
Brandt, A. et al. 2007 First insights into the biodiversity andbiogeography of the Southern Ocean deep sea. Nature447, 307–311. (doi:10.1038/nature05827)
Brodeur, R. D. 2001 Habitat-specific distribution of Pacificocean perch (Sebastes alutus) in Pribilof Canyon, BeringSea. Cont. Shelf Res. 21, 207–224. (doi:10.1016/S0278-4343(00)00083-2)
Cailliet, G. M., Andrews, A. H., Wakefield, W. W., Moreno,G. & Rhodes, K. L. 1999 Fish faunal and habitat analysisusing trawls, camera sleds and submersibles in benthicdeep-sea habitats off central California. Oceanol. Acta22, 579–592. (doi:10.1016/S0399-1784(00)88949-5)
Canals, M., Canals, M., Puig, P., Durrieu de Madron, X.,Heussner, S., Palanques, A. & Fabres, J. 2006 Flushingsubmarine canyons. Nature 444, 354–357. (doi:10.1038/nature05271)
Clark, M. R., Anderson, O. F. & Dunn, M. R. 2003 NewZealand Fishery Assessment Report No. 2003/60. Minis-try of Fisheries, Wellington, New Zealand, p. 51.
Company, J. B. et al. 2008 Climate influence on deepsea populations. PLoS ONE E1431, 1–8. (doi:10.1371/
journal.pone.0001431)Drazen, J. C. 2002 Energy budgets and feeding rates of
Coryphaenoides acrolepis and C. armatus. Mar. Biol. 140,677–686.
Eleftheriou, A. & McIntyre, A. D. 2005 Methods for the studyof marine benthos, p. 418, 3rd edn. Oxford, UK: BlackwellScience.
Etter, R. J. & Grassle, J. F. 1992 Patterns of species diversityin the deep sea as a function of sediment particle sizediversity. Nature 360, 576–578. (doi:10.1038/360576a0)
Gage, J. & Tyler, P. 1996 Deep-sea biology: a natural historyof organisms at the deep-sea floor, p. 504, 2nd edn.Cambridge, UK: Cambridge University Press.
Garcia, R., Van Oevelen, D., Soetaert, K., Thomsen, L.,
De Stigter, H. C. & Epping, E. 2008 Deposition rates,mixing intensity and organic content in two contrastingsubmarine canyons. Prog. Oceanogr. 76, 192–215.(doi:10.1016/j.pocean.2008.01.001)
Genin, A. 2004 Bio-physical coupling in the formation of
zooplankton and fish aggregations over abrupt topogra-phies. J. Mar. Sys. 50, 3–20. (doi:10.1016/j.jmarsys.2003.10.008)
Gooday, A. J., Levin, L. A., Thomas, C. L. & Hecker, B.1992 The distribution and ecology of Bathysiphonfiliformis (Protista, Foraminiferida) on the continentalslope off North Carolina. J. Foram. Res. 22, 129–146.(doi:10.2113/gsjfr.22.2.129)
Greene, C. H., Wiebe, P. H., Burczynski, J. & Youngbluth,M. J. 1988 Acoustical detection of high-density krill demer-
sal layers in the submarine canyon off Georges Bank.Science 241, 359–361. (doi:10.1126/science.241.4863.359)
Hargrave, B. T., Kostylev, V. E. & Hawkins, C. M. 2004Benthic epifauna assemblages, biomass and respirationin the Gully region on the Scotian Shelf, NW Atlantic
10 F. C. De Leo et al. Extraordinary deep-sea benthic biomass
on July 13, 2018http://rspb.royalsocietypublishing.org/Downloaded from
Ocean. Mar. Ecol. Prog. Ser. 270, 55–70. (doi:10.3354/meps270055)
Hickey, B. M. 1997 The response of a steep-sided, narrow
canyon to time-variable wind forcing. J. Phys. Oceanogr.27, 697–726. (doi:10.1175/1520-0485(1997)027,
0697:TROASS.2.0.CO;2)Issacs, J. D. & Schwartzlose, R. A. 1975 Active animals of the
deep-sea floor. Sci. Am. 233, 85–91.
Jones, M. R. L. 2008 Dietary analysis of Coryphaenoidesserrulatus, C. subserrulatus and several other species ofmacrourid fish (Pisces: Macrouridae) from northeasternChatham Rise, New Zealand. NZ J. Mar. FreshwaterRes. 42, 73–84.
Jones, D. A., Bett, B. J. & Tyler, P. A. 2007 Megabenthicecology of the deep Faroe–Shetland channel: a photo-graphic study. Deep Sea Res. Part I 54, 1111–1128.(doi:10.1016/j.dsr.2007.04.001)
King, M. 1987 Distribution and ecology of deep-watercaridean shrimps (Crustacea: Natantia) near tropicalPacific Islands. Bull. Mar. Sci. 41, 192–203.
Klinck, J. M. 1996 Circulation near submarine canyons:a modeling study. J. Geophys. Res. 101, 1211–1223.
(doi:10.1029/95JC02901)Kunze, E., Rosenfeld, L. K., Carter, G. S. & Gregg, M. C.
2002 Internal waves in Monterey submarine canyon.J. Phys. Oceanogr. 32, 1890–1913. (doi:10.1175/1520-0485(2002)032,1890:IWIMSC.2.0.CO;2)
Levin, L., Etter, R. J., Rex, M. A., Gooday, A. J., Smith,C. R., Pineda, J., Stuart, C. T, Hessler, R. R & Pawson,D. 2001 Environmental influences on regional deep-seaspecies diversity. Annu. Rev. Ecol. Syst. 32, 51–93.
(doi:10.1146/annurev.ecolsys.32.081501.114002)Lewis, K. B. & Barnes, P. M. 1999 Kaikoura Canyon, New
Zealand: active conduit from near-shore sediment zonesto trench-axis channel. Mar. Geol. 162, 39–69. (doi:10.1016/S0025-3227(99)00075-4)
Ministry of Fisheries 2009 Report for the Fisheries Assess-ment Plenary, May 2009: stock assessments and yieldestimates, Wellington, New Zealand, p. 1036.
Nodder, S. D., Pilditch, C. A., Probert, P. K. & Hall, J. A.2003 Variability in benthic biomass and activity beneath
the Subtropical Front, Chatham Rise, SW PacificOcean. Deep Sea Res. Part I 50, 959–985. (doi:10.1016/S0967-0637(03)00094-3)
Nodder, S. D. et al. 2007 Focusing of phytodetritusdeposition beneath a deep-ocean front, Chatham Rise,
New Zealand. Limnol. Oceanogr. 52, 299–314.Oliveira, A., Santos, A. I., Rodrigues, A. & Vitorino, J. 2007
Sedimentary particle distribution and dynamics on theNazare canyon system and adjacent shelf (Portugal).
Mar. Geol. 246, 144–164. (doi:10.1016/j.margeo.2007.04.011)
Rasband, W. S. 2009 IMAGE J. Bethesda, MD: US NationalInstitutes of Health. See http://rsb.info.nih.gov/ij/.
Rex, M. A. 1983 Geographic patterns of species diversity
in the deep-sea benthos. In The sea (ed. G. T. Rowe),pp. 453–472. New York, NY: Wiley.
Rex, M. A. et al. 2006 Global bathymetric patterns of stand-ing stock and body size in the deep-sea benthos. Mar.Ecol. Prog. Ser. 317, 1–8. (doi:10.3354/meps317001)
Rowe, G. T. 1983 Biomass and production of the deep-seamacrobenthos. In The sea (ed. G. T. Rowe), pp. 96–121. New York, NY: Wiley.
Rowe, G. T., Polloni, P. T. & Haedrich, R. L. 1982 Thedeep-sea macrobenthos on the continental margin of the
Northwest Atlantic Ocean. Deep Sea Res. Part A 29,257–278. (doi:10.1016/0198-0149(82)90113-3)
Proc. R. Soc. B
Sanders, H. L. & Hessler, R. 1969 Ecology of the deep-seabenthos. Science 163, 1419–1424. (doi:10.1126/science.163.3874.1419)
Schlacher, T. A., Schlacher, T. A, Schlacher-Hoenlinger,M. A, Williams, A., Althaus, F., Hooper, J. N. A. &Kloser, R. 2007 Richness and distribution of spongemegabenthos in continental margin canyons off south-eastern Australia. Mar. Ecol. Prog. Ser. 340, 73–88.
(doi:10.3354/meps340073)Shepard, F. P. & Dill, R. F. 1966 Submarine canyons and other
sea valleys, p. 381. Chicago, IL: Rand McNally & Co.Shepard, F. P., Marshall, N. F. & McLoughlin, P. A. 1974
Internal waves advancing along submarine canyons. Science183, 195–198. (doi:10.1126/science.183.4121.195)
Smith, C. R., Jumars, P. A. & DeMaster, D. J. 1986 In situstudies of megafaunal mounds indicate rapid sedimentturnover and community response at the deep-sea floor.
Nature 323, 251–253. (doi:10.1038/323251a0)Smith, C. R., Levin, L. A., Koslow, A., Tyler, P. A. &
Glover, A. 2008 The near future of deep seafloor ecosys-tems. In Aquatic ecosystems: trends and global prospects(ed. N. V. C. Polunin), pp. 334–351. Cambridge, UK:
Cambridge University Press.Snelgrove, P. V. R., Grassle, J. F. & Petrecca, R. F. 1992
The role of food patches in maintaining high deep-seadiversity: field experiments with hydrodynamicallyunbiased colonization trays. Limnol. Oceanogr. 37,
1543–1550.Sobarzo, M., Figueroa, M. & Djurfeldt, L. 2001 Upwelling
of subsurface water into the rim of the Biobiosubmarine canyon as a response to surface winds. Cont.Shelf Res. 21, 279–299. (doi:10.1016/S0278-4343(00)00082-0)
Thompson, R. M. C. 2001 Gazetteer of seafloor features inthe New Zealand region. Technical report, NIWA, NewZealand, p. 64.
Tudela, S., Sarda, F., Maynou, F. & Demestre, M. 2003Influence of submarine canyons on the distribution ofthe deep-water shrimp, Aristeus antennatus (Risso, 1816)in the NW Mediterranean. Crustaceana 76, 217–225.(doi:10.1163/156854003321824567)
Van der Meer, J., Heip, C. H., Herman, P. J. M., Moens, T. &Van Oevelen, D. 2005 Measuring the flow ofenergy and matter in marine benthic animalpopulations. In Methods for the study of marine benthos(eds A. Eleftheriou & A. McIntyre), pp. 326–389,
3rd edn. Oxford, UK: Blackwell.Vetter, E. W. 1994 Hotspots of benthic production. Nature
372, 47. (doi:10.1038/372047a0)Vetter, E. W. & Dayton, P. K. 1999 Organic enrichment
by macrophyte detritus, and abundance patterns ofmegafaunal populations in submarine canyons. Mar.Ecol. Prog. Ser. 186, 137–148. (doi:10.3354/meps186137)
Vetter, E. W., Smith, C. R. & De Leo, F. C. 2010 Hawaiianhotspots: enhanced megafaunal abundance and diversity
in submarine canyons on the oceanic islands of Hawaii.Mar. Ecol. 31, 183–199. (doi:10.1111/j.1439-0485.2009.00351.x)
Wheatcroft, R. A., Jumars, P. A., Smith, C. R. & Nowell,A. R. M. 1990 A mechanistic view of the particulate bio-
diffusion coefficient: step lengths, rest intervals andtransport directions. J. Mar. Res. 48, 177–207. (doi:10.1357/002224090784984560)
Yoklavich, M. M., Greene, H. G., Cailliet, G. M., Sullivan,D. E., Lea, N. & Love, M. S. 2000 Habitat associations
of deep-water rockfishes in a submarine canyon: anexample of a natural refuge. Fish. Bull. 98, 625–641.