Embed Size (px)
Citation preview
11th World Congress on Computational Mechanics (WCCM XI) 5th European Conference on Computational Mechanics (ECCM V)
6th European Conference on Computational Fluid Dynamics (ECFD VI)
HYDRAULIC BULGE TEST FOR STRESS-STRAIN CURVE DETERMINATION AND DAMAGE CALIBRATION FOR ITO-GOYA
MODEL
HUGO CAMPOS1(*), ABEL D. SANTOS1,2, BRUNO MARTINS1, K. ITO3, N. MORI3 AND F. BARLAT4
1 INEGI, Institute of Mech. Eng. and Ind. Management, University of Porto Rua Dr. Roberto Frias 400, 4200-465 Porto, Portugal
[email protected], www.inegi.up.pt
2 FEUP– Faculty of Engineering, University of Porto
3 M&M Research, Inc., Tokyo, Japan
4 GIFT/POSTECH, Pohang, South Korea
Key Words: Bulge test, stress-strain curve, material characterization, sheet metal forming Abstract. Hydraulic bulge test represents an alternative method to obtain the stress-strain hardening curve for sheet metal materials. When compared to standard uniaxial tensile test it permits higher range of deformation, thus being possible a better material characterization, with fewer discrepancies when performing data extrapolation by using a selected material model. This paper presents a numerical and experimental study of flow curve determination using bulge test, in order to well understand the behavior of fundamental variables and have the better tuning for stress-strain data determination. Performed sensitivity analysis of such influencing variables used in bulge measurements will give guidelines for the evaluation of the material flow curve from experimental results. Additionally, bulge test results can also be used for evaluation and calibration of damage models when sheet material is deformed up to fracture. A methodology is presented to be used for evaluation and calibration of Ito-Goya damage model of damage prediction, which is applied to some experimental examples. 1 INTRODUCTION
Reliability of numerical results is dependent, among other factors, on the provided mechanical modelling of the material. A standard method to obtain such characterization of sheet metal materials is using the uniaxial tensile test, which is a widely accepted method, although the uniform strain range can be utilized due to the appearance of necking.
On the other hand the optimisation of sheet metal processes through the use of numerical simulations has become a key factor to a continuously increasing requirement for time and cost efficiency, for quality improvement and materials saving. This, in turn, will need accurate models to describe material behaviour and corresponding experimental data to tune model parameters.

Hugo Campos, Abel D. Santos, Bruno Martins, K. Ito, N. Mori and F. Barlat
2
Using tensile experimental data and needing additional information on material behaviour will need extrapolation of tensile data, obtained by using different hardening models, thus giving also dispersion and inducing different results. An alternative to including additional experimental information in hardening curve is using the hydraulic bulge test. This test has long been known as a suitable way to evaluate the formability, i.e., the ability to induce plastic strain at higher levels of deformation. This test has advantages such as the inexistence of frictional interactions, the simplicity of sample preparation and the stress-strain curve extending to the range of effective strain as found in many sheet metal forming processes. Higher plastic strain leads to a lower uncertainty on the material behaviour.
When obtaining the stress-strain data from bulge test, a common concept exists, which involves the need of the continuous measurement of some bulge variables, namely the bulge pressure, the bulge curvature and the thickness at the pole. Bulge pressure is obtained directly from bulge machine, while curvature and thickness data may have different procedures for its evaluation. A simplified approach may involve indirect methods by estimations of curvature or thickness based in analytical equations [1, 2]. Direct methods make use of continuous data acquisition of bulge geometry to evaluate such variables and two main approaches may be seen: optical and mechanical methods. Optical methods include a continuous strain analysis during the forming process with a CCD-camera device in combination with videogrammetic software [3, 4, 5], while mechanical systems uses physical tactile devices, thus permitting data acquisition to evaluate thickness and curvature [5, 6].
Another important issue to achieve a higher quality level of numerical results is concerned with failure modelling. Prediction of the internal damage evolution during straining in sheet metal processes is of paramount importance in order to avoid the onset of local geometry instabilities that can lead to fracture during processing. The model proposed by Ito et al. [11] is considered in this paper. To identify the parameters of the model, a methodology that uses bulge data up to fracture is proposed to calibrating its values.
2 THEORY FOR STRESS AND STRAIN MEASUREMENT
The stress-strain data determination is based on analysis of measurable parameters from bulge test. For this purpose, membrane theory is commonly used for determination of flow stress curve and its validity is related with a small sheet thickness/bulge diameter ratio, in which the effects of bending can be neglected when calculating the average membrane stresses [7]. Considering that thin sheets are used, the through thickness stress σ3 is zero and a relation between stresses, sheet geometry and bulge pressure can be established:
t
p
2
2
1
1
(1)
where σ1 and σ2 are the principal stresses on sheet surface, 1 and 2 are the corresponding
radius of the curved surface at mid-thickness, p is the hydraulic pressure and t is the sheet thickness. Considering the axisymmetric case of bulge test, both principal stresses can be
taken equivalent and equal to the so-called membrane stress (σ1 = σ2 = b ). The same reason
Hugo Campos, Abel D. Santos, Bruno Martins, K. Ito, N. Mori and F. Barlat
3
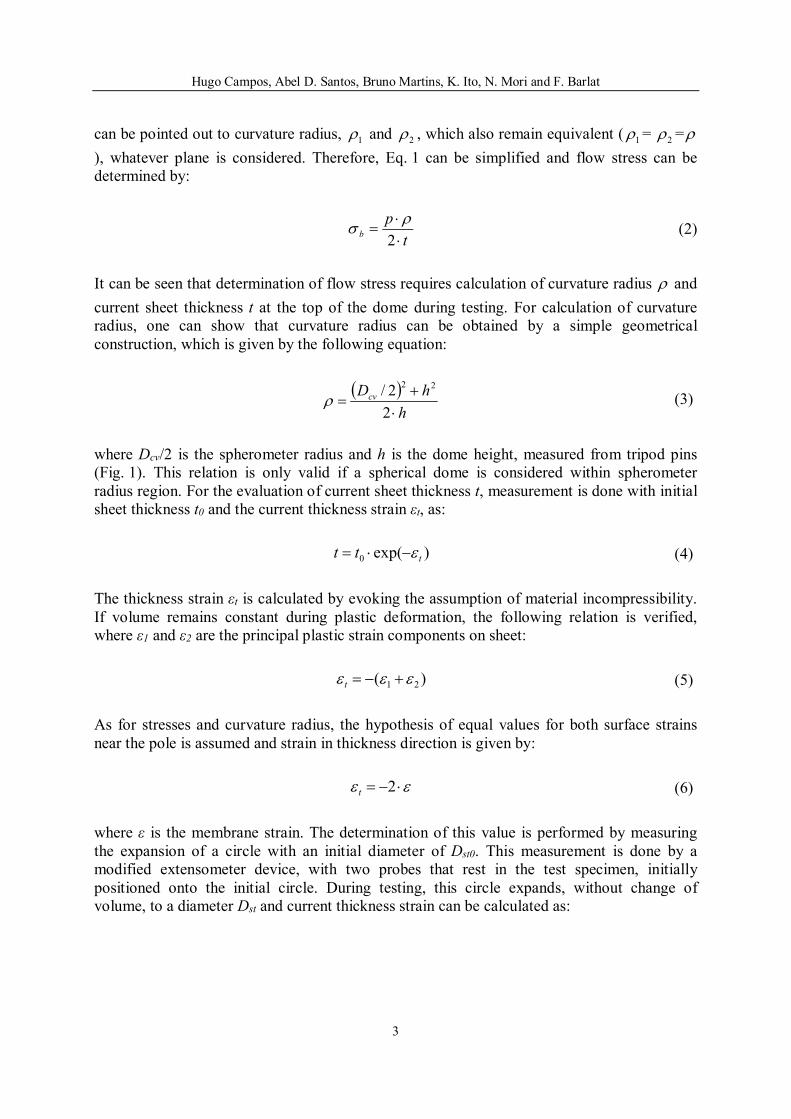
can be pointed out to curvature radius, 1 and 2 , which also remain equivalent ( 1 = 2 =
), whatever plane is considered. Therefore, Eq. 1 can be simplified and flow stress can be determined by:
t
pb
2
(2)
It can be seen that determination of flow stress requires calculation of curvature radius and
current sheet thickness t at the top of the dome during testing. For calculation of curvature radius, one can show that curvature radius can be obtained by a simple geometrical construction, which is given by the following equation:
h
hDcv
2
2/ 22
(3)
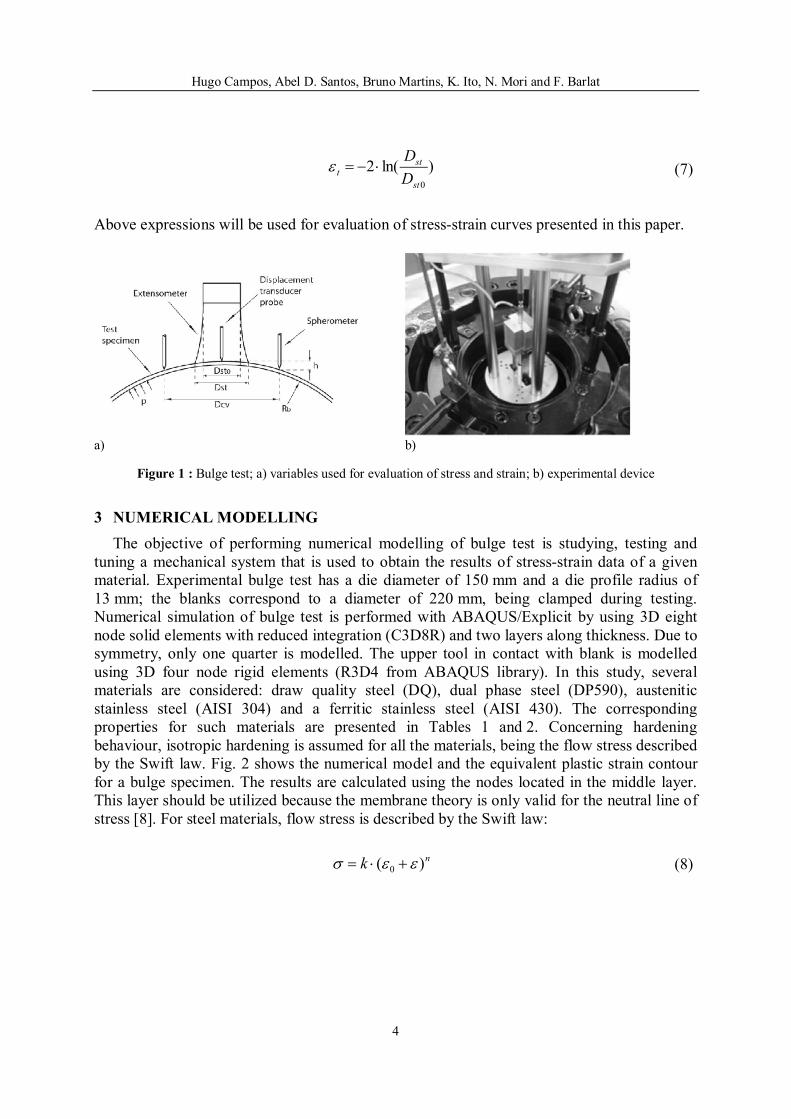
where Dcv/2 is the spherometer radius and h is the dome height, measured from tripod pins (Fig. 1). This relation is only valid if a spherical dome is considered within spherometer radius region. For the evaluation of current sheet thickness t, measurement is done with initial sheet thickness t0 and the current thickness strain εt, as:
)exp(0 ttt (4)
The thickness strain εt is calculated by evoking the assumption of material incompressibility. If volume remains constant during plastic deformation, the following relation is verified, where ε1 and ε2 are the principal plastic strain components on sheet:
)( 21 t (5)
As for stresses and curvature radius, the hypothesis of equal values for both surface strains near the pole is assumed and strain in thickness direction is given by:
2t (6)
where ε is the membrane strain. The determination of this value is performed by measuring the expansion of a circle with an initial diameter of Dst0. This measurement is done by a modified extensometer device, with two probes that rest in the test specimen, initially positioned onto the initial circle. During testing, this circle expands, without change of volume, to a diameter Dst and current thickness strain can be calculated as:
Hugo Campos, Abel D. Santos, Bruno Martins, K. Ito, N. Mori and F. Barlat
4
)ln(20st
stt
D
D (7)
Above expressions will be used for evaluation of stress-strain curves presented in this paper.
a) b)
Figure 1 : Bulge test; a) variables used for evaluation of stress and strain; b) experimental device
3 NUMERICAL MODELLING
The objective of performing numerical modelling of bulge test is studying, testing and tuning a mechanical system that is used to obtain the results of stress-strain data of a given material. Experimental bulge test has a die diameter of 150 mm and a die profile radius of 13 mm; the blanks correspond to a diameter of 220 mm, being clamped during testing. Numerical simulation of bulge test is performed with ABAQUS/Explicit by using 3D eight node solid elements with reduced integration (C3D8R) and two layers along thickness. Due to symmetry, only one quarter is modelled. The upper tool in contact with blank is modelled using 3D four node rigid elements (R3D4 from ABAQUS library). In this study, several materials are considered: draw quality steel (DQ), dual phase steel (DP590), austenitic stainless steel (AISI 304) and a ferritic stainless steel (AISI 430). The corresponding properties for such materials are presented in Tables 1 and 2. Concerning hardening behaviour, isotropic hardening is assumed for all the materials, being the flow stress described by the Swift law. Fig. 2 shows the numerical model and the equivalent plastic strain contour for a bulge specimen. The results are calculated using the nodes located in the middle layer. This layer should be utilized because the membrane theory is only valid for the neutral line of stress [8]. For steel materials, flow stress is described by the Swift law:
nk )( 0 (8)

Hugo Campos, Abel D. Santos, Bruno Martins, K. Ito, N. Mori and F. Barlat
5
Figure 2 : Model of bulge test used in numerical modelling and contours of equivalent plastic strain as well as
Mises Stress
Table 1 : Properties of selected steels
Property Young Modulus [GPa] 210
Poisson’s Ratio 0.3 Hardening Law Swift
Table 2 : Hardening law parameters
Hardening Law Parameter AISI304 AISI430 DP590 DQ σy0 313 394 364 151
Swift K 2250 990 1054 554 n 0.65 0.26 0.14 0.25 ε0 0.048 0.029 0.0005 0.0055
4 STUDY ON USING DIFFERENT DIAMETERS DCV/DST TO OBTAIN FLOW CURVE
The bulge test mechanical system evaluates the strain and the curvature by using selected diameters as defined on Fig. 1, Dst for strain calculation and Dcv for curvature calculation. The objective of this study is to evaluate and understand the influence of such diameters on the evaluated flow curve. For this study, there is a reference for flow curve, which is the one given as input for the simulation code, and printed in black on all the presented charts.
Being curvature evaluated using Dcv diameter (see Fig. 1) and strain evaluated using Dst diameter, the study consists of changing one of these diameters while the other is kept constant.
Using Dcv=45 mm and changing Dst values, Figs. 3 to 6, it is possible to infer that exists a similar tendency for all materials. As seen, strain diameters getting close to Dst=65 mm underestimate stresses (curves are usually under the reference curve), while diameters near to Dst=25 mm follow more closely the reference curve.
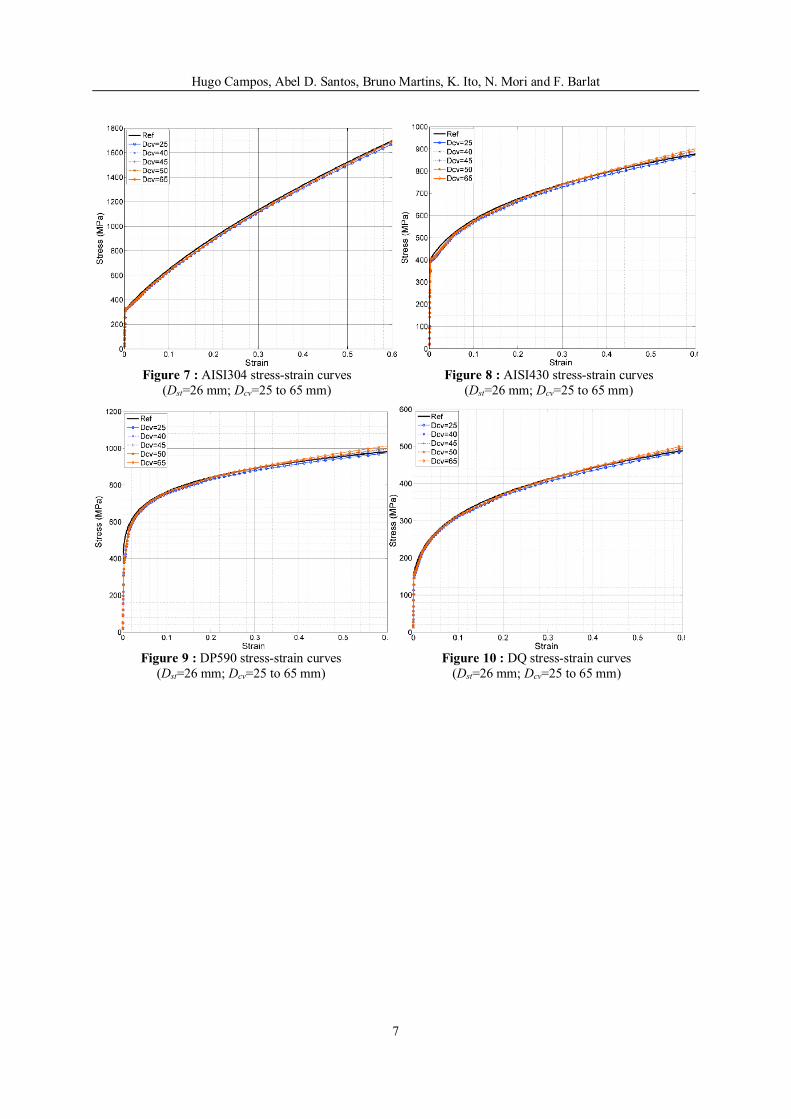
Using Dst=26 mm and changing Dcv values, Figs. 7 to 10, one sees that lower dispersion exists. Also, curvature diameters getting close to Dst=65 mm overestimate stresses (curves are usually above the reference curve). Curvature diameter of 45 mm suggests a good balance to

Hugo Campos, Abel D. Santos, Bruno Martins, K. Ito, N. Mori and F. Barlat
6
obtaining a closer result to reference hardening curve. This study for different materials also confirms that better results are obtained when Dst=26 and Dcv=45 mm, in accordance with previous works [9,10].
Figure 3 : AISI304 stress-strain curves (Dcv=45 mm; Dst=25 to 65 mm).
Figure 4 : AISI 430 stress-strain curves (Dcv=45 mm; Dst=25 to 65 mm).
Figure 5 : DP590 stress-strain curves
(Dcv=45 mm; Dst=25 to 65 mm)
Figure 6 : DQ stress-strain curves (Dcv=45 mm; Dst=25 to 65 mm)
Hugo Campos, Abel D. Santos, Bruno Martins, K. Ito, N. Mori and F. Barlat
7
Figure 7 : AISI304 stress-strain curves
(Dst=26 mm; Dcv=25 to 65 mm) Figure 8 : AISI430 stress-strain curves
(Dst=26 mm; Dcv=25 to 65 mm)
Figure 9 : DP590 stress-strain curves (Dst=26 mm; Dcv=25 to 65 mm)
Figure 10 : DQ stress-strain curves (Dst=26 mm; Dcv=25 to 65 mm)
Hugo Campos, Abel D. Santos, Bruno Martins, K. Ito, N. Mori and F. Barlat
8
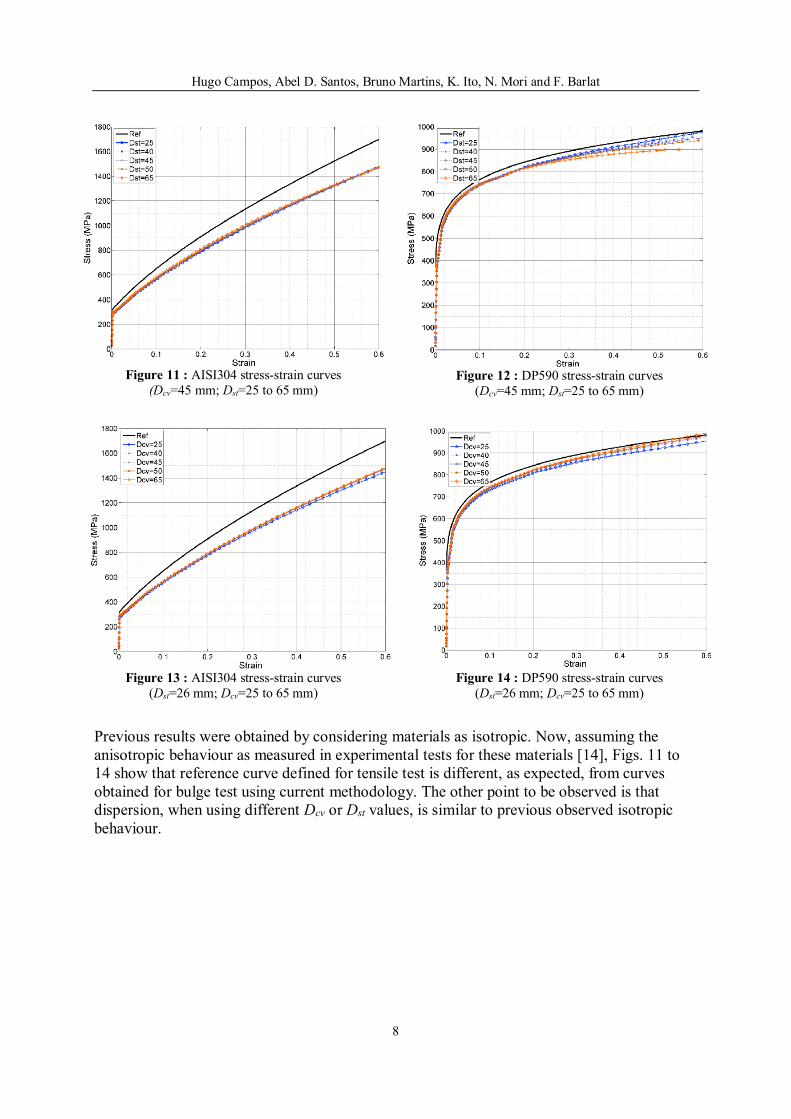
Figure 11 : AISI304 stress-strain curves (Dcv=45 mm; Dst=25 to 65 mm)
Figure 12 : DP590 stress-strain curves (Dcv=45 mm; Dst=25 to 65 mm)
Figure 13 : AISI304 stress-strain curves
(Dst=26 mm; Dcv=25 to 65 mm)
Figure 14 : DP590 stress-strain curves (Dst=26 mm; Dcv=25 to 65 mm)
Previous results were obtained by considering materials as isotropic. Now, assuming the anisotropic behaviour as measured in experimental tests for these materials [14], Figs. 11 to 14 show that reference curve defined for tensile test is different, as expected, from curves obtained for bulge test using current methodology. The other point to be observed is that dispersion, when using different Dcv or Dst values, is similar to previous observed isotropic behaviour.
Hugo Campos, Abel D. Santos, Bruno Martins, K. Ito, N. Mori and F. Barlat
9
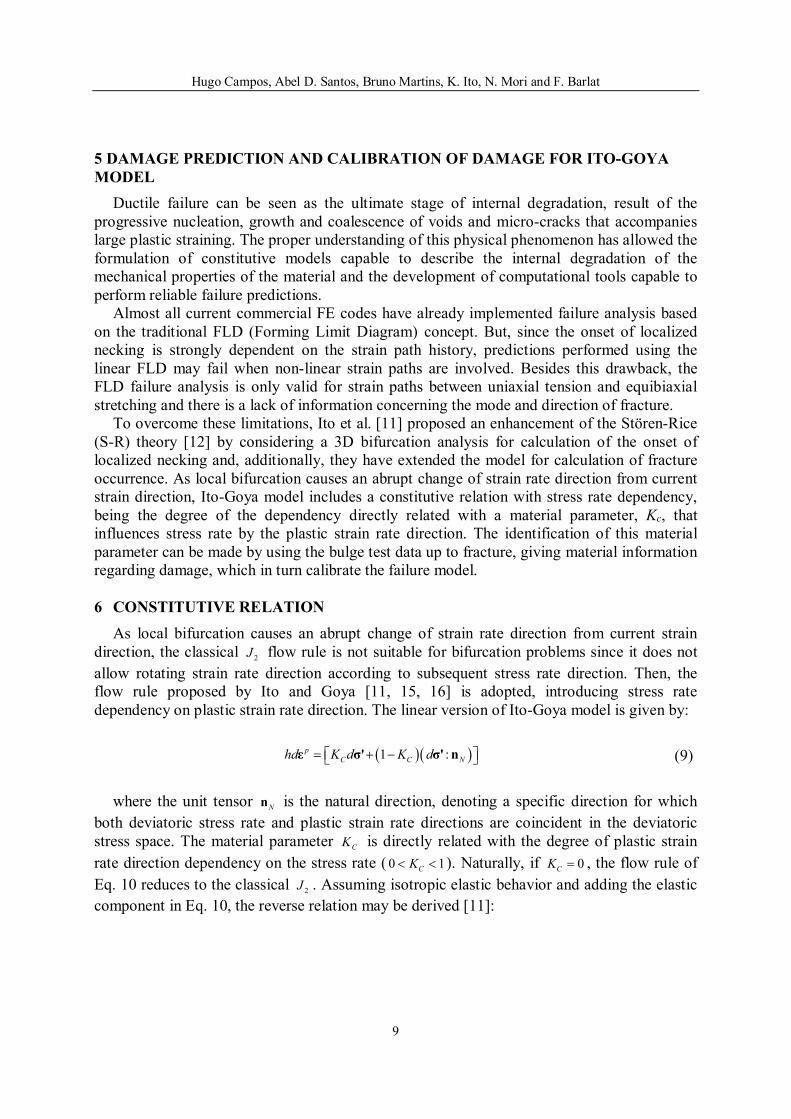
5 DAMAGE PREDICTION AND CALIBRATION OF DAMAGE FOR ITO-GOYA MODEL
Ductile failure can be seen as the ultimate stage of internal degradation, result of the progressive nucleation, growth and coalescence of voids and micro-cracks that accompanies large plastic straining. The proper understanding of this physical phenomenon has allowed the formulation of constitutive models capable to describe the internal degradation of the mechanical properties of the material and the development of computational tools capable to perform reliable failure predictions.
Almost all current commercial FE codes have already implemented failure analysis based on the traditional FLD (Forming Limit Diagram) concept. But, since the onset of localized necking is strongly dependent on the strain path history, predictions performed using the linear FLD may fail when non-linear strain paths are involved. Besides this drawback, the FLD failure analysis is only valid for strain paths between uniaxial tension and equibiaxial stretching and there is a lack of information concerning the mode and direction of fracture.
To overcome these limitations, Ito et al. [11] proposed an enhancement of the Stören-Rice (S-R) theory [12] by considering a 3D bifurcation analysis for calculation of the onset of localized necking and, additionally, they have extended the model for calculation of fracture occurrence. As local bifurcation causes an abrupt change of strain rate direction from current strain direction, Ito-Goya model includes a constitutive relation with stress rate dependency, being the degree of the dependency directly related with a material parameter, Kc, that influences stress rate by the plastic strain rate direction. The identification of this material parameter can be made by using the bulge test data up to fracture, giving material information regarding damage, which in turn calibrate the failure model.
6 CONSTITUTIVE RELATION
As local bifurcation causes an abrupt change of strain rate direction from current strain direction, the classical 2J flow rule is not suitable for bifurcation problems since it does not
allow rotating strain rate direction according to subsequent stress rate direction. Then, the flow rule proposed by Ito and Goya [11, 15, 16] is adopted, introducing stress rate dependency on plastic strain rate direction. The linear version of Ito-Goya model is given by:
(9)
where the unit tensor Nn is the natural direction, denoting a specific direction for which
both deviatoric stress rate and plastic strain rate directions are coincident in the deviatoric stress space. The material parameter CK is directly related with the degree of plastic strain
rate direction dependency on the stress rate ( 0 1 CK ). Naturally, if 0CK , the flow rule of
Eq. 10 reduces to the classical 2J . Assuming isotropic elastic behavior and adding the elastic
component in Eq. 10, the reverse relation may be derived [11]:
1 : p
C C Nhd K d K dε σ' σ' n
Hugo Campos, Abel D. Santos, Bruno Martins, K. Ito, N. Mori and F. Barlat
10
εDnnIσ ddS
GdGkdGd NN ):(
22(2
*
*** (10)
where k is the bulk modulus and *G and *S are calculated from the shear modulus G , applying the following relations:
hGG
1
2
21*
(11)
hGGGh
GK
S
K cc 1
2
21
2
)1(2**
(12)
7 EXPERIMENTAL AND NUMERICAL RESULTS FOR SELECTED MATERIALS
Two steels have been selected to perform the calibration of the Ito-Goya model, an AISI 304 austenitic stainless steel and dual phase DP 590 steel.
Bulge machine and current developed prototype equipment (bulge tester) to obtain stress/strain curve has been used to test and obtain experimental results. A comparison is performed between these experimental results (FEUP/INEGI) and those obtained from a different laboratory (GIFT/POSTECH - South Korea), which also uses a similar mechanical system for stress/strain determination, being implemented in a bulge machine with a 200 mm diameter die.
Current prototype (FEUP/INEGI) still needs additional tests and possible developments, in order to include device robustness up to specimen fracture. Therefore, experimental stress/strain curves, from this prototype, were obtained before reaching bursting pressure (about 10% less).
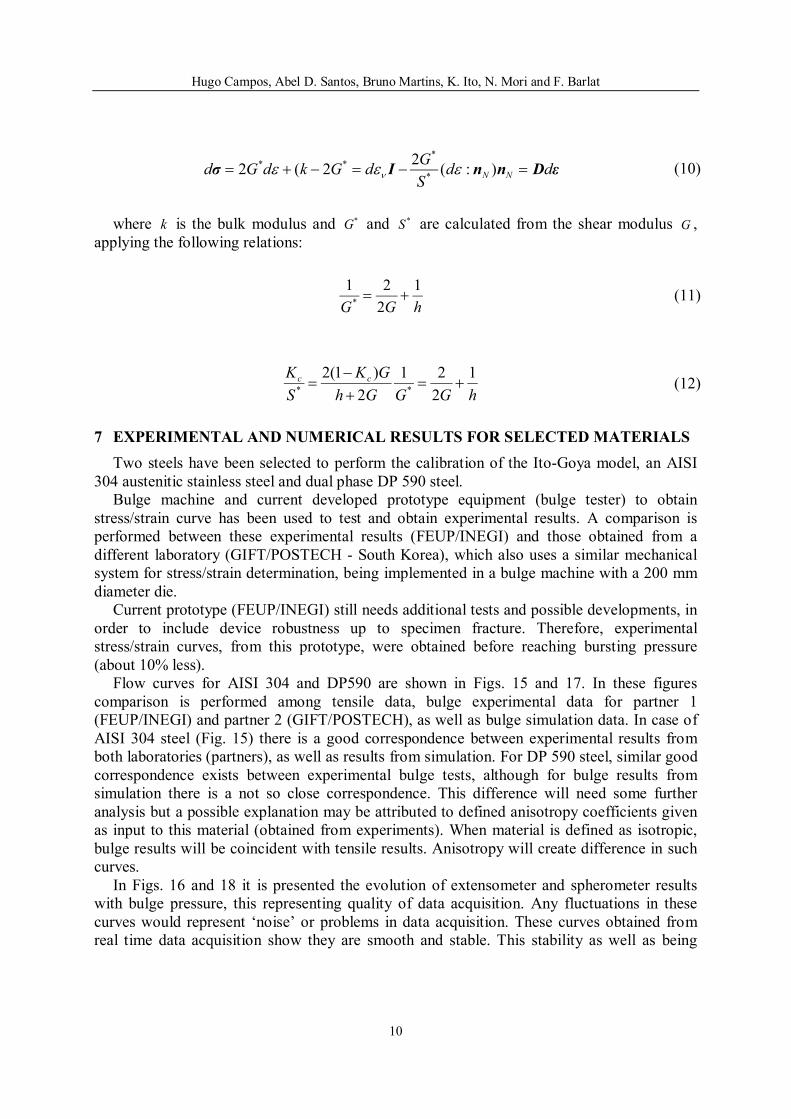
Flow curves for AISI 304 and DP590 are shown in Figs. 15 and 17. In these figures comparison is performed among tensile data, bulge experimental data for partner 1 (FEUP/INEGI) and partner 2 (GIFT/POSTECH), as well as bulge simulation data. In case of AISI 304 steel (Fig. 15) there is a good correspondence between experimental results from both laboratories (partners), as well as results from simulation. For DP 590 steel, similar good correspondence exists between experimental bulge tests, although for bulge results from simulation there is a not so close correspondence. This difference will need some further analysis but a possible explanation may be attributed to defined anisotropy coefficients given as input to this material (obtained from experiments). When material is defined as isotropic, bulge results will be coincident with tensile results. Anisotropy will create difference in such curves.
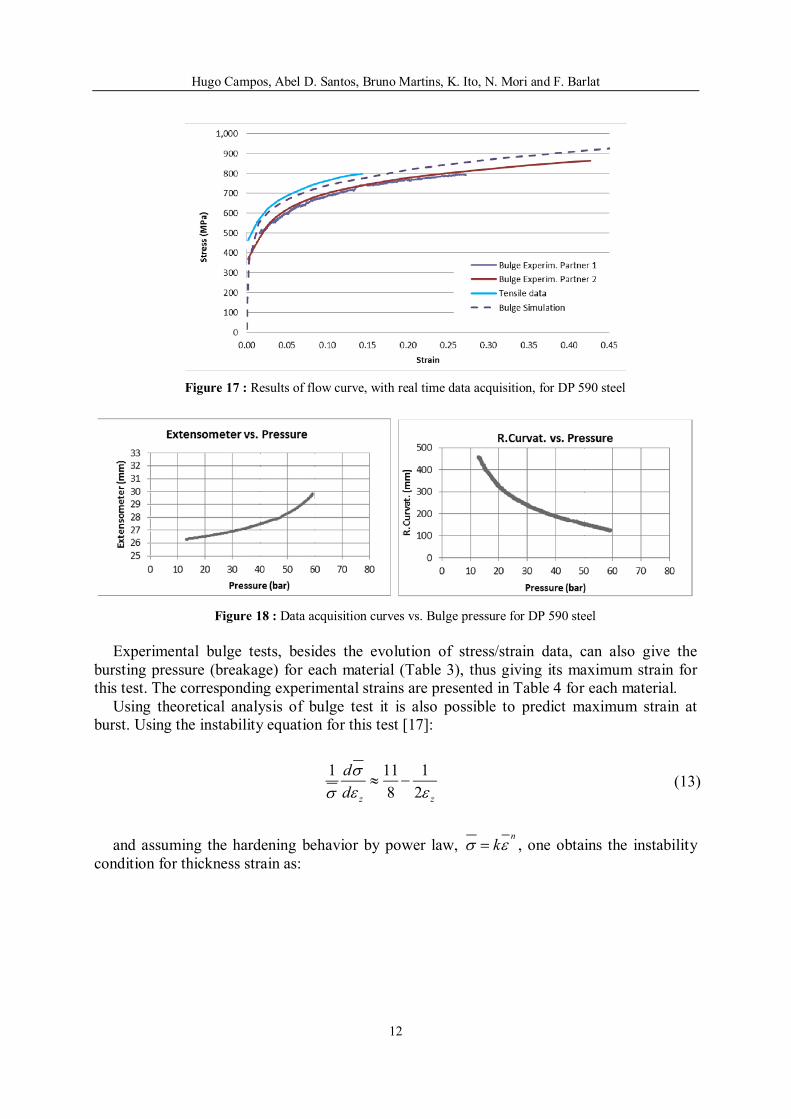
In Figs. 16 and 18 it is presented the evolution of extensometer and spherometer results with bulge pressure, this representing quality of data acquisition. Any fluctuations in these curves would represent ‘noise’ or problems in data acquisition. These curves obtained from real time data acquisition show they are smooth and stable. This stability as well as being

Hugo Campos, Abel D. Santos, Bruno Martins, K. Ito, N. Mori and F. Barlat
11
obtained from real time measurement gives the assurance and the possibility of controlling the bulge machine, in order to perform a constant strain rate test, an important point when testing and evaluating the flow curve for some materials.
Figure 15 : Results of flow curve, with real time data acquisition, for AISI 304 steel
Figure 16 : Data acquisition curves vs. Bulge pressure for AISI 304 steel
Hugo Campos, Abel D. Santos, Bruno Martins, K. Ito, N. Mori and F. Barlat
12
Figure 17 : Results of flow curve, with real time data acquisition, for DP 590 steel
Figure 18 : Data acquisition curves vs. Bulge pressure for DP 590 steel
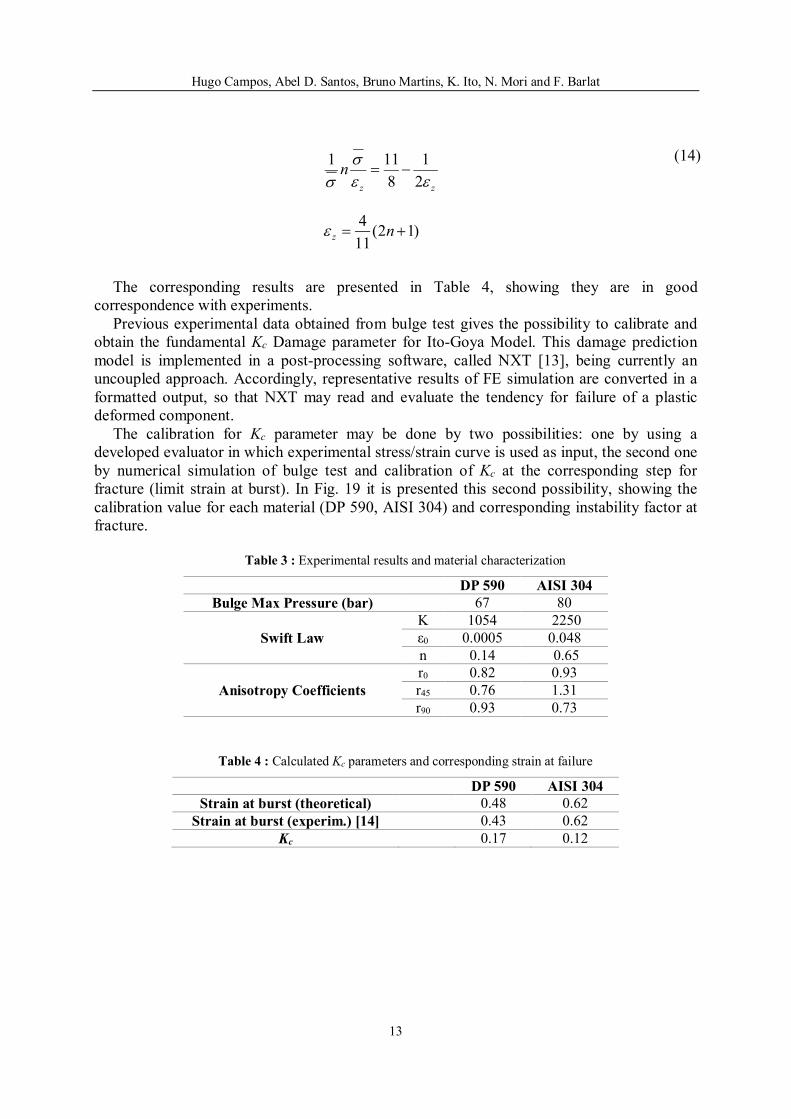
Experimental bulge tests, besides the evolution of stress/strain data, can also give the
bursting pressure (breakage) for each material (Table 3), thus giving its maximum strain for this test. The corresponding experimental strains are presented in Table 4 for each material.
Using theoretical analysis of bulge test it is also possible to predict maximum strain at burst. Using the instability equation for this test [17]:
zzd
d
2
1
8
111 (13)
and assuming the hardening behavior by power law, n
k , one obtains the instability condition for thickness strain as:
Hugo Campos, Abel D. Santos, Bruno Martins, K. Ito, N. Mori and F. Barlat
13
zz
n
2
1
8
111
)12(11
4 nz
(14)
The corresponding results are presented in Table 4, showing they are in good correspondence with experiments.
Previous experimental data obtained from bulge test gives the possibility to calibrate and obtain the fundamental Kc Damage parameter for Ito-Goya Model. This damage prediction model is implemented in a post-processing software, called NXT [13], being currently an uncoupled approach. Accordingly, representative results of FE simulation are converted in a formatted output, so that NXT may read and evaluate the tendency for failure of a plastic deformed component.
The calibration for Kc parameter may be done by two possibilities: one by using a developed evaluator in which experimental stress/strain curve is used as input, the second one by numerical simulation of bulge test and calibration of Kc at the corresponding step for fracture (limit strain at burst). In Fig. 19 it is presented this second possibility, showing the calibration value for each material (DP 590, AISI 304) and corresponding instability factor at fracture.
Table 3 : Experimental results and material characterization
DP 590 AISI 304 Bulge Max Pressure (bar) 67 80
Swift Law K 1054 2250 ε0 0.0005 0.048 n 0.14 0.65
Anisotropy Coefficients r0 0.82 0.93 r45 0.76 1.31 r90 0.93 0.73
Table 4 : Calculated Kc parameters and corresponding strain at failure
DP 590 AISI 304 Strain at burst (theoretical) 0.48 0.62
Strain at burst (experim.) [14] 0.43 0.62 Kc 0.17 0.12

Hugo Campos, Abel D. Santos, Bruno Martins, K. Ito, N. Mori and F. Barlat
14
Figure 19 : Instability factor for DP 590 (left) and AISI 304 (right) corresponding to failure for bulge test
Conclusions
Different steel materials have been used to perform sensitivity analysis for stress/strain determination using bulge test. It has been shown that different diameters used for determination of curvature and strain have a strong influence on obtained flow curve, especially for strains higher than 0.3 of the evaluated curve. The best results, even considering different materials, are obtained for suggested diameters of Dcv=45 mm and Dst=26 mm. These guidelines are used in a developed bulge system to obtain experimental data for material flow curve determination.
Bulge test results are also used to calibrate parameters included in damage models. The Ito-Goya model is considered in this paper and a methodology is presented and used to identify the parameters of this model, by considering bulge test data up to breakage.
Acknowledgments
Funding of FCT-Portuguese Foundation of Science and Technology, under grants PTDC/EME-TME/113410/2009 and PTDC/EMS-TEC/2404/2012 is greatly acknowledged, as well as the cooperation of Prof. Frederic Barlat and the availability of different types of steel used to perform bulge tests by POSCO steel company and GIFT – Graduate Institute of Ferrous Technology, Pohang, South Korea.
References
[1] Slota, J. and E. Spisak, Determination of flow stress by the hydraulic bulge test. Metallurgy, 2008. 47(1): p. 13-17.
[2] Stachowicz, F., Biaxial stress-strain relationship of sheet metal from hydraulic bulging test, in International multidisciplinary conference 2003: Vancouver B.C. p. 469-474.
Hugo Campos, Abel D. Santos, Bruno Martins, K. Ito, N. Mori and F. Barlat
15
[3] Keller, S., W. Hotz, and H. Friebe, Yield curve determination using the bulge test combined with optical measurement, in Proceedings of IDDRG2009 - International Deep Drawing Research Group Conference2009: Golden, Colorado, USA. p. 319-330.
[4] Mutrux, A., B. Hochholdinger, and P. Hora, Procedure for evaluation and validation of hydraulic biaxial experiment, in Numisheet2008: Switzerland Numisheet. p. 67-71.
[5] Sigvant, M., K. Mattiasson, H. Vegter, and P. Thilderkvist, A viscous pressure bulge test for determination of a plastic hardening curve and equibiaxial material data. Int. Journal Material Forming, 2009. 2: p. 235-242.
[6] Gutscher, G., H.-C. Wu, G. Ngaile, and T. Altan, Determination of flow stress for sheet metal forming using the viscous pressure bulge (VPB) test. Journal of Materials Processing Technology, 2004. 146(1): p. 1-7.
[7] Atkinson M., Accurate determination of biaxial stress-strain relationships from hydraulic bulging tests of sheet metals. International Journal of Mechanical Sciences, 1997. 39(7): p. 761-769.
[8] Ranta-Eskola, A.J., Use of the hydraulic bulge test in biaxial tensile testing. International Journal of Mechanical Sciences, 1979. 21(8): p. 457-465.
[9] Santos, A.D., P. Teixeira, and F. Barlat, Flow Stress Determination Using Hydraulic Bulge Test and a Mechanical Measurement System, in IDDRG2011. p. 10.
[10] Santos, A.D., P. Teixeira, A.B.d. Rocha, and F. Barlat, On the Determination of Flow Stress Using Bulge Test and Mechanical Measurement. NUMIFORM 2010. 1252(1): p. 845-852.
[11] Ito, K., K. Satoh, M. Goya, and T. Yoshida, Prediction of limit strain in sheet metalforming processes by 3D analysis of localized necking. International Journal of Mechanical Sciences, 2000. 42(11): p. 2233-2248.
[12] Stören, S. and J.R. Rice, Localized necking in thin sheets. Journal of the Mechanics and Physics of Solids, 1975. 23(6): p. 421-441.
[13] M&M Research Inc., NXT Defect Evaluator, 2012.
[14] Xu Le, Constitutive Modeling of High Strength Steel Sheets, Dep. Ferrous Technology, Graduate Institute of Ferrous Technology, Pohang University of Science and Technology, Doctoral Dissertation, 2011.
[15] Marta C. Oliveira, Jose L. Alves, Luis F. Menezes, Naomichi Mori, Gen Uemura, Koichi Ito, Prediction of fracture limit by instability condition for cleaving action on shear band after 3 dimensional localized bifurcation, Forming Technology Forum 2012, June 5-6, 2012, IVP, ETH Zurich, Switzerland, p. 33-38.
[16] P. Teixeira, F.M.A. Pires, A.D. Santos, J.M.A. César de Sá, K. Ito, N. Mori, Coupled and uncoupled criteria for fracture prediction in sheet metal forming, Forming Technology Forum 2012, June 5-6, 2012, IVP, ETH Zurich, Switzerland, p. 105-108.

Hugo Campos, Abel D. Santos, Bruno Martins, K. Ito, N. Mori and F. Barlat
16
[17] Rodrigues J. M. C. e Martins P. A. F., Tecnologia Mecânica (‘Mechanical Technology’), Vol. I e Vol.II, Escolar Editora, (in portuguese), 2005.