Embed Size (px)
Citation preview
Hudson Lima Mendonça
The Role of Open Innovation in the Energy Transition
Tese de Doutorado
Thesis presented to the Programa de Pós-Graduação em Administração de Empresas of PUC-Rio in partial fulfillment of requirements for the degree of Doutor em Administração de Empresas.
Advisor: Prof. Jorge Ferreira da Silva
Volume I
Rio de Janeiro November 2019

2
Hudson Lima Mendonça
The Role of Open Innovation in the Energy Transition
Thesis presented to the Programa de Pós-Graduação em Administração de Empresas da PUC-Rio in partial fulfillment of the requirements for the degree of Doutor em Administração de Empresas. Approved by undersigned Examination Committee.
Prof. Jorge Ferreira da Silva Advisor
Departamento de Administração – PUC-Rio
Profª. T. Diana L. van Aduard de Macedo-Soares Departamento de Administração – PUC-Rio
Prof. Fábio de Oliveira Paula
Departamento de Administração – PUC-Rio
Profª. Paula Castro Pires de Souza Chimenti COPPEAD – UFRJ
Prof. Fernando Bins Luce
Escola de Administração – UFRGS
Prof. Carlos Alberto Gonçalvez Faculdade de Ciências Econômicas – UFMG
Rio de Janeiro, November 27th, 2019
3
All rights reserved
Hudson Lima Mendonça
Graduated in Economics at the Federal University of Rio de Janeiro in 2007 and obtained him M.Sc. Degree in Industrial Engineering from the Federal University of Rio de Janeiro in 2018.
Bibliographic data Mendonça, Hudson Lima
The Role of Open Innovation in the Energy Transition / Hudson Lima Mendonça; advisor: Jorge Ferreira da Silva. – Rio de Janeiro: PUC-Rio, Departamento de Administração, 2019.
124 f. : il. ; 29,7cm
1. Tese (doutorado) – Pontifícia Universidade Católica do Rio de Janeiro, Departamento de Administração
Inclui referências bibliográficas
1. Administração – Teses. 2. Inovação. 3. Transição Energética. 4. Startups. 5.Corporate Venture. 6. Empreendedorismo. 7. Energia. I. da Silva, Jorge Ferreira. II. Pontifícia Universidade Católica do Rio de Janeiro. Departamento de Administração. III. Título.
CCD: 004

4
To Finep and the Postgraduate Incentive
Program (PIPG). Undoubtedly it would not
have been possible without their bet on me.
5
Acknowledgements
I would like to begin thanking my professor and advisor Jorge Ferreira da Silva
who, with patience and wisdom, has guided me until this moment. Likewise, I must
also mention Professor T. Diana L. van Aduard of Macedo-Soares and other
IAG/PUC-Rio teachers who also supported me in all gaps, discovered and then
fulfilled, in this process.
To friends and companions on this journey, I would not have enough space or words
to express my full gratitude. Even considering the risk of being betrayed by my
mind, I can't forget to mention the essential learning provided by Alexandre
Mosquim, Amure Pinho, Ana Luzia Ferreira, Elisa Moser, Eric Cabral, Felipe
Gelelete, Felipe Vogas, Igor Bueno, Igor Nazareth, José Alberto Aranha, José
Caetano Lacerda, Júlio Azevedo, Lindalia Junqueira, Livia Brando, Luis Felipe
Maciel, Marcos Vinicius Fonseca, Marcos Vinicius Souza, Michael Araki, Nádia
Armelin,Newton Campos, Newton Hamatsu, Paulo Ganime, Paulo Jordão, Rafael
Ribeiro, Raphael Braga, Renato Paquet, Ricardo Moraes, Roberto Falcão, Roberto
Motta, Rodrigo Secioso, Thiago Peixoto, Vitor Monteiro, William Respondovesk,
among many others who certainly put their own bricks in this work. As well as the
findings of this Thesis, the construction of this work can be considered a real
collaborative platform.
Particularly about my final sprint at Cambridge/MIT, I would like to highlight the
contributions and inspiration given by Fiona Murray, Flavio Marino, Javier
Escobar, Matthew Ashbourne, Michael Wahlen, Nina Minella, Panyu Zhang,
Patrick Teyssonneyre, Phill Budden, Rachel Freire, Rafael Polidoro, Rodrigo
Verdi, Sandonei Chiodini, Suelen Mello, Tarek El Sherif, Travis Hunter, Victor
Pamplona, and others. I will carry your presence for life.
Beyond my Thesis, I must thank my family for all they have done for me throughout
my life course. Hugo Mendonça, Harrison Mendonça, Hudna Mendonça, Azenate
Mendonça, Dhebora Pagano, Cândido Pagano, and Olga Pagano thank you for all
you have done in the solid formation of my character.
Last, but not least, to my love, Natalia Rezende, who has not let my morale drop
even in the most challenging times. She went beyond the role of wife and played a
crucial role in the content and form of these articles, always with constructive
suggestions. Thanking her, I also would like to thank my “extended” family José
Carlos Rezende, Tereza Paulos, Juliana Rezende, and Matheus Rezende.
6
Abstract
Mendonça, Hudson Lima; da Silva, Jorge Ferreira (Advisor). The Role of
Open Innovation in the Energy Transition. Rio de Janeiro, 2019. 124pp.
Tese de Doutorado - Departamento de Administração, Pontifícia
Universidade Católica do Rio de Janeiro.
The energy transition is one of the most significant challenges of our time.
By 2050, more than US$ 13 trillion of investments are expected in the electricity
sector, with 77% from renewable sources. In this context, the open innovation
paradigm should play a key role in reducing the costs of current technologies,
creating new markets and reshaping the existing ones through the interaction of the
five main stakeholders in this process: universities, corporations, governments,
entrepreneurs and venture capitalists. In the first article, we show the importance of
the interaction of the first three actors around mission-oriented public policies. We
build a framework that can address the best practices of this type of policy when
applied to the energy transition context. In the second, we seek to identify the
patterns that have led energy startups to success or failure over the past 20 years.
We find that business models, invested values, and investor profiles play a key role
in these trajectories. Finally, considering the relevance of the relationship between
startups and corporations during the energy transition, we analyzed in the third
article the role of corporate venture capital (CVC) over the last 25 years and we
recognize the fifth wave of CVC, which has many particularities and drives the
CVC units to the innovation's strategic center of modern corporations. Overall, we
conclude that all these main five stakeholders have a distinct but fundamental role
in the energy transition.
Keywords
Open Innovation; Energy Transition; Startups; Corporate Venture;
Entrepreneurship; Energy.
7
Resumo
Mendonça, Hudson Lima; da Silva, Jorge Ferreira (Orientador). O Papel da
Inovação Aberta na Transição Energética. Rio de Janeiro, 2019. 124pp.
Tese de Doutorado - Departamento de Administração, Pontifícia
Universidade Católica do Rio de Janeiro.
A transição energética se põe como um dos grandes desafios de nosso
tempo. Até 2050 são previstos mais de US$ 13 trilhões de investimentos só em
energia elétrica, sendo 77% em fontes renováveis. Nesse contexto o paradigma das
inovações abertas deve exercer um papel fundamental, reduzindo os custos das
tecnologias atuais, criando novos mercados e remodelando os existentes através da
interação dos cinco principais atores desse processo: universidades, corporações,
governos, empreendedores e capitalistas de risco. No nosso primeiro artigo,
mostramos a importância da interação desses três primeiros atores ao redor de
políticas públicas orientadas às missões. Construímos um framework capaz de
endereçar as melhores práticas desse tipo de política quando estas são aplicadas à
transição energética. No segundo, buscamos identificar os padrões que levaram
startups de energia ao sucesso ou ao fracasso o longo dos últimos 20 anos.
Descobrimos que os modelos de negócio, os valores investidos e o perfil dos
investidores exerceram um papel fundamental nestas trajetórias. Por fim, dada a
relevância da relação entre startups e corporações na transição energética,
analisamos no terceiro artigo o papel do corporate venture capital (CVC) ao longo
dos últimos 25 anos e identificamos a existência de uma quinta onda de CVC, que
possui notáveis particularidades e que leva as unidades de CVC ao centro
estratégico de inovação das corporações modernas. De modo geral concluímos que
todos os cinco principais atores possuem papeis distintos, mas fundamentais, na
transição energética.
Keywords
Inovação Aberta; Transição Energética; Startups; Corporate Venture;
Empreendedorismo; Energia.
8
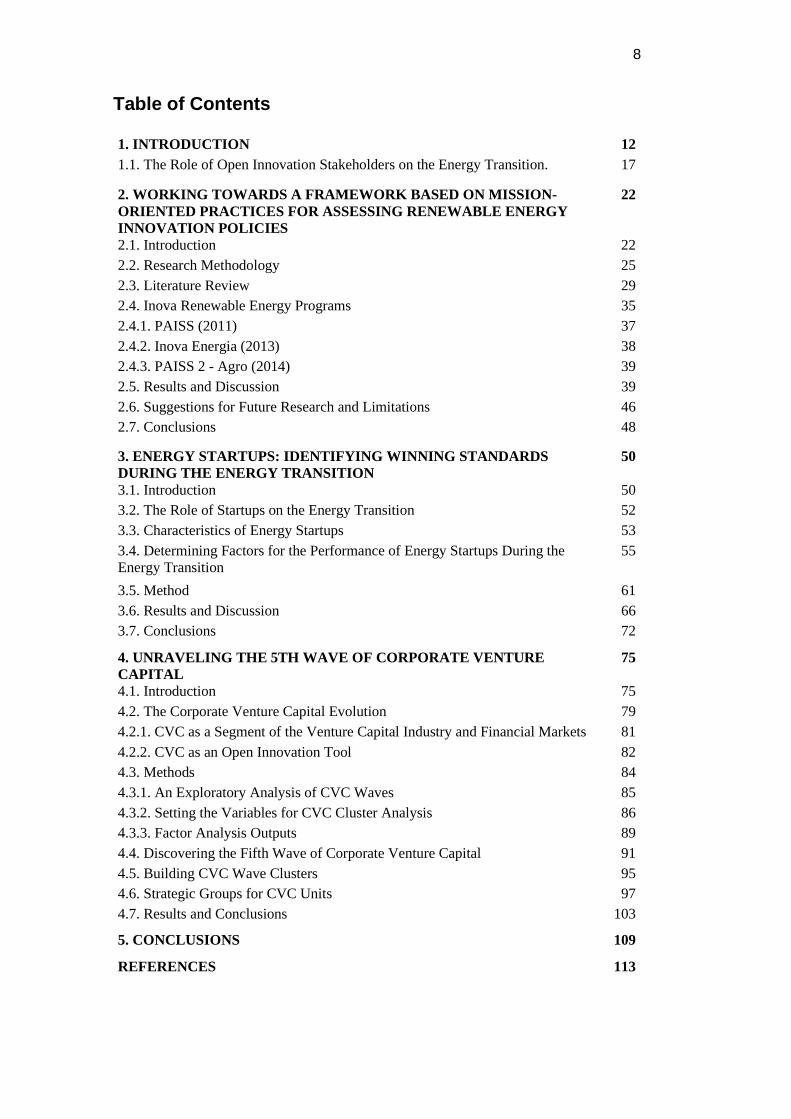
Table of Contents 1. INTRODUCTION 12
1.1. The Role of Open Innovation Stakeholders on the Energy Transition. 17
2. WORKING TOWARDS A FRAMEWORK BASED ON MISSION-
ORIENTED PRACTICES FOR ASSESSING RENEWABLE ENERGY
INNOVATION POLICIES
22
2.1. Introduction 22
2.2. Research Methodology 25
2.3. Literature Review 29
2.4. Inova Renewable Energy Programs 35
2.4.1. PAISS (2011) 37
2.4.2. Inova Energia (2013) 38
2.4.3. PAISS 2 - Agro (2014) 39
2.5. Results and Discussion 39
2.6. Suggestions for Future Research and Limitations 46
2.7. Conclusions 48
3. ENERGY STARTUPS: IDENTIFYING WINNING STANDARDS
DURING THE ENERGY TRANSITION
50
3.1. Introduction 50
3.2. The Role of Startups on the Energy Transition 52
3.3. Characteristics of Energy Startups 53
3.4. Determining Factors for the Performance of Energy Startups During the
Energy Transition
55
3.5. Method 61
3.6. Results and Discussion 66
3.7. Conclusions 72
4. UNRAVELING THE 5TH WAVE OF CORPORATE VENTURE
CAPITAL
75
4.1. Introduction 75
4.2. The Corporate Venture Capital Evolution 79
4.2.1. CVC as a Segment of the Venture Capital Industry and Financial Markets 81
4.2.2. CVC as an Open Innovation Tool 82
4.3. Methods 84
4.3.1. An Exploratory Analysis of CVC Waves 85
4.3.2. Setting the Variables for CVC Cluster Analysis 86
4.3.3. Factor Analysis Outputs 89
4.4. Discovering the Fifth Wave of Corporate Venture Capital 91
4.5. Building CVC Wave Clusters 95
4.6. Strategic Groups for CVC Units 97
4.7. Results and Conclusions 103
5. CONCLUSIONS 109
REFERENCES 113
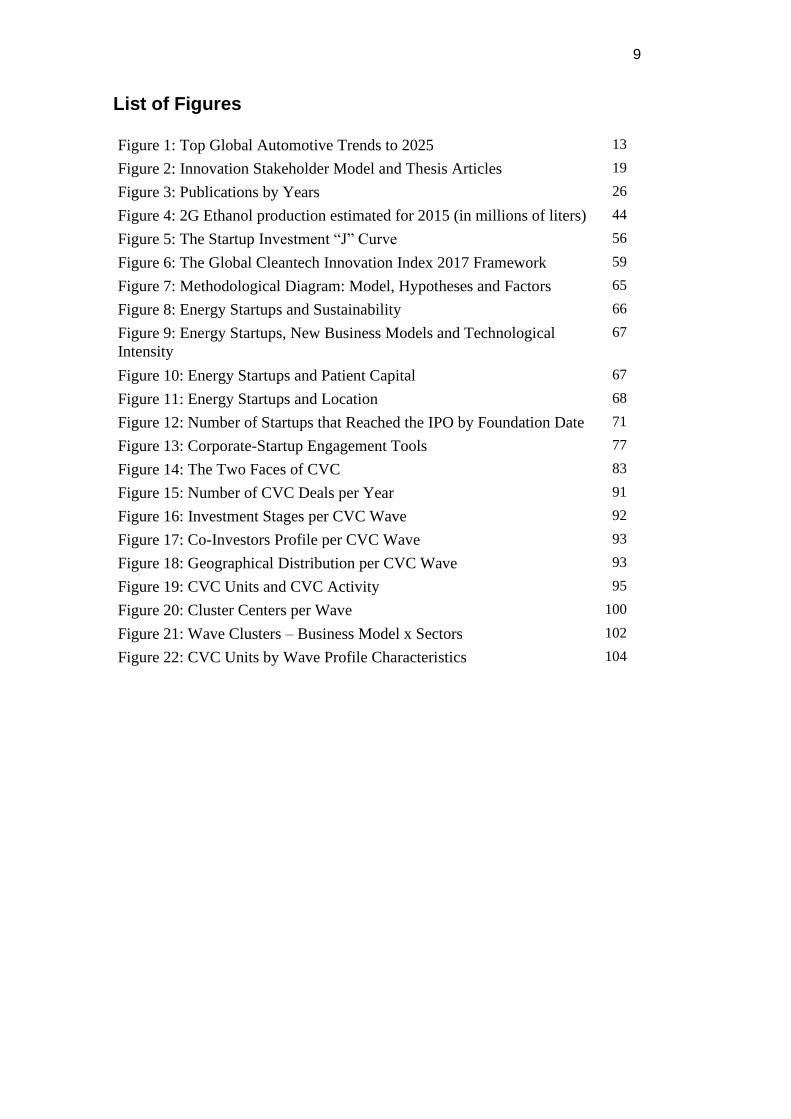
9
List of Figures Figure 1: Top Global Automotive Trends to 2025 13
Figure 2: Innovation Stakeholder Model and Thesis Articles 19
Figure 3: Publications by Years 26
Figure 4: 2G Ethanol production estimated for 2015 (in millions of liters) 44
Figure 5: The Startup Investment “J” Curve 56
Figure 6: The Global Cleantech Innovation Index 2017 Framework 59
Figure 7: Methodological Diagram: Model, Hypotheses and Factors 65
Figure 8: Energy Startups and Sustainability 66
Figure 9: Energy Startups, New Business Models and Technological
Intensity
67
Figure 10: Energy Startups and Patient Capital 67
Figure 11: Energy Startups and Location 68
Figure 12: Number of Startups that Reached the IPO by Foundation Date 71
Figure 13: Corporate-Startup Engagement Tools 77
Figure 14: The Two Faces of CVC 83
Figure 15: Number of CVC Deals per Year 91
Figure 16: Investment Stages per CVC Wave 92
Figure 17: Co-Investors Profile per CVC Wave 93
Figure 18: Geographical Distribution per CVC Wave 93
Figure 19: CVC Units and CVC Activity 95
Figure 20: Cluster Centers per Wave 100
Figure 21: Wave Clusters – Business Model x Sectors 102
Figure 22: CVC Units by Wave Profile Characteristics 104
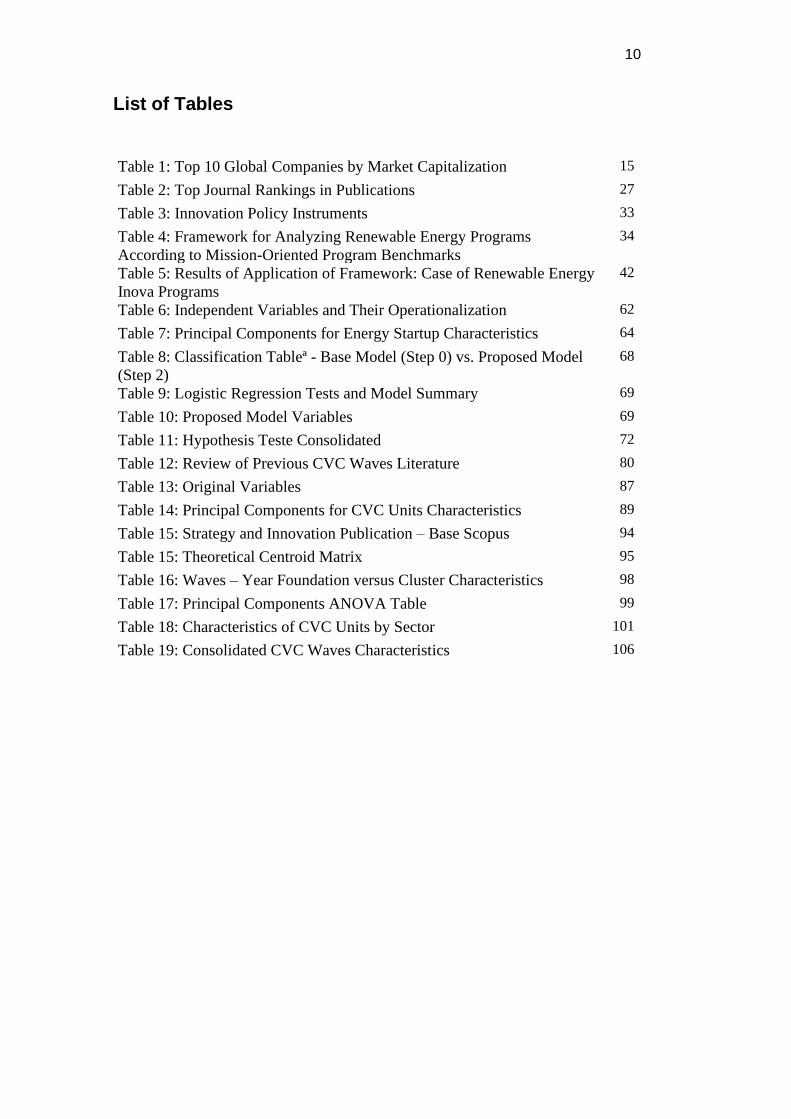
10
List of Tables Table 1: Top 10 Global Companies by Market Capitalization 15
Table 2: Top Journal Rankings in Publications 27
Table 3: Innovation Policy Instruments 33
Table 4: Framework for Analyzing Renewable Energy Programs
According to Mission-Oriented Program Benchmarks
34
Table 5: Results of Application of Framework: Case of Renewable Energy
Inova Programs
42
Table 6: Independent Variables and Their Operationalization 62
Table 7: Principal Components for Energy Startup Characteristics 64
Table 8: Classification Tableª - Base Model (Step 0) vs. Proposed Model
(Step 2)
68
Table 9: Logistic Regression Tests and Model Summary 69
Table 10: Proposed Model Variables 69
Table 11: Hypothesis Teste Consolidated 72
Table 12: Review of Previous CVC Waves Literature 80
Table 13: Original Variables 87
Table 14: Principal Components for CVC Units Characteristics 89
Table 15: Strategy and Innovation Publication – Base Scopus 94
Table 15: Theoretical Centroid Matrix 95
Table 16: Waves – Year Foundation versus Cluster Characteristics 98
Table 17: Principal Components ANOVA Table 99
Table 18: Characteristics of CVC Units by Sector 101
Table 19: Consolidated CVC Waves Characteristics 106

11
Throughout the centuries there were men who took first
steps, down new roads, armed with nothing but their own
vision.
Ayn Rand.
12
1 INTRODUCTION The energy transition can be defined as a long-term structural change in energy
systems (WORLD ENERGY COUNCIL, 2019). From various theoretical and
empirical aspects, we can say that we are living one of these most structuring
changes in the energy sector (GREENPEACE, 2015; IEA, 2019a; SMIL, 2010).
According to the U.S. Energy Information Administration (EIA), 86% of the
world's primary energy is still from fossil origin (HARTLEY; MEDLOCK, 2017).
However, investments in renewable energy and energy efficiency are growing at a
substantially faster rate and are already the most significant investments. In 2018,
US$ 1.8 trillion was invested in the energy sector, but US$ 1.03 trillion (or 57%)
was invested in renewables and energy efficiency (IEA, 2019b).
The forecast is that this speed will be even higher going forward. Bloomberg New
Energy Finance predicts investments of US$ 13.3 trillion by 2050 in the electricity
sector, with 77% of this volume just in renewable energy (BLOOMBERGNEF,
2019). There is some consensus on the general direction of the energy transition
(renewables and energy efficiency). Although, the same cannot be said about the
speed or exact shape/change that will occur.
On speed specifically, sustainability-related institutions claim that change will
occur much faster than expected by fossil fuel related institutions. Although, both
agree on the rapid growth of renewables over the coming decades. Considering the
percentage of energy generated from renewable sources in 2035 as an indicator,
forecasts made in similar periods range from only 6% (BP, 2014) to 57% (WWF;
ECOFYS; OMA, 2011). At this point, it is interesting to note that BP has been
systematically “adjusting” its forecasts in recent years to 9% in 2016 and 13% in
2018 (BP, 2016, 2018).
Regarding the way/configuration of this energy transition, the complexity tends to
be even higher. The three “Ds” of this energy transition (Decarbonization,
Decentralization, and Digitization) can take many forms. Many possible paths
could completely change the sector where variables outside the energy area itself
have a considerable impact on the sector.
13
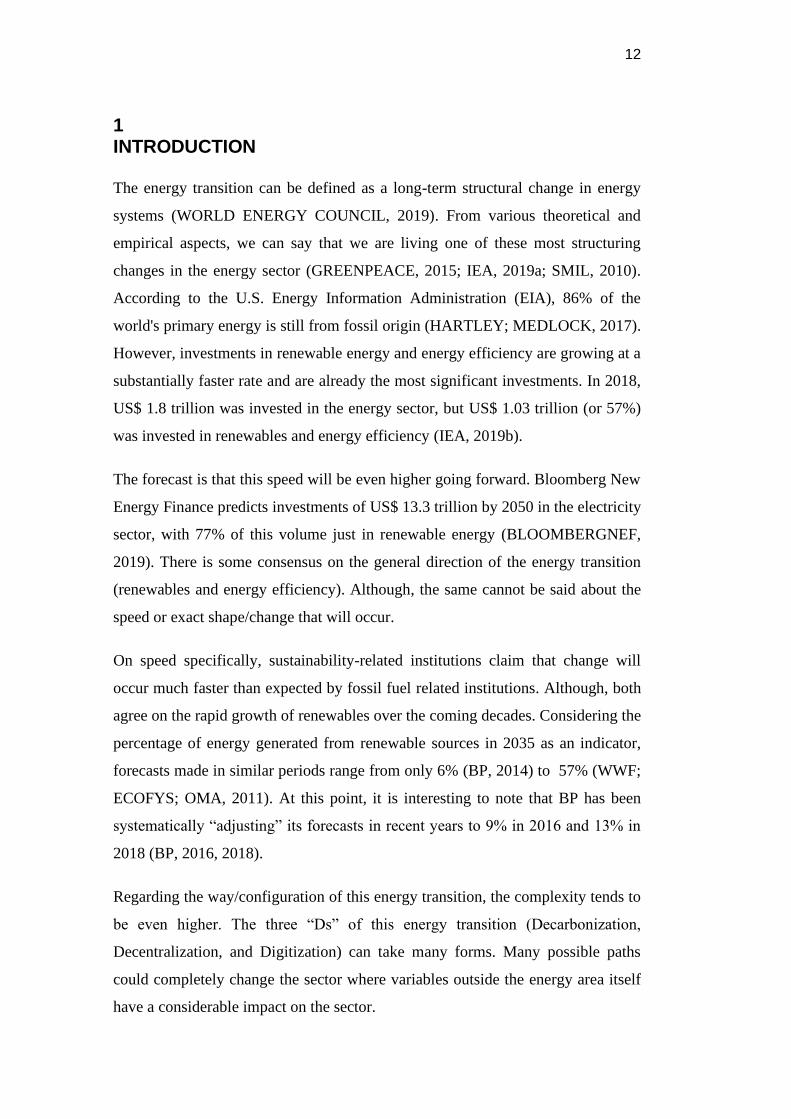
These examples include new technologies and business models that are already
impacting the automotive industry. Electromobility (electric and hybrid vehicles),
connectivity, autonomous vehicles, and fuel cells are among the key trends for this
industry in the future. The Global Automotive Survey conducted by KPMG
annually (Figure 1) shows that, since 2016, bets on cars with internal combustion
engines (ICEs like gasoline, diesel, ethanol, etc.) are no longer a priority for
industry executives (KPMG, 2018). The number of electric vehicles has grown
exponentially from 400,000 in 2013 to 5.1 million in 2018, a compounded average
growth of 155% per year over the last five years (IEA, 2019c). However, 94% of
the world's transportation sector's energy consumption is still based on oil, and most
of the world's oil consumption is carried by the transportation sector (BP, 2018).
Thus, we can conclude that changes in the automotive sector could be a significant
catalyst for the energy transition in the coming years. Along the same lines, business
models that advocate automobiles as a service could rapidly expand the impact of
electromobility also to current power and oil distribution models.
Figure 1: Top Global Automotive Trends to 2025
Source: (KPMG, 2018)
14
Concerning the digitization and decentralization of the energy sector, distributed
generation, smart grids, and smart contracts (utilizing blockchain technology) are
also trends with disruptive potential. They can change the sector, but also bring new
actors to the energy fields. The exponential fall in the price of photovoltaic solar
panels and energy efficiency solutions is already a reality (IEA, 2019b) and has
stimulated the emergence of several startups in a sector. Until recently, it was
considered unfeasible for them due to the need for high investments since the
earliest moments.
The role of biomass in power generation (or even liquid biofuels) is still unknown,
has significant potential, but also great uncertainties in its use within the expected
changes in the sector. Together, these technological and business model innovations
(among many others) could substantially affect every energy production and
distribution chain in the world.
What we can see in general is that this "certainty" about the direction of a major
change coupled with a considerable "uncertainty" about how and in what step this
will occur, closely resembles the period well known as the dot-com boom that
occurred in the late 1990s and early 2000s (MENDONÇA, 2017). At that time,
there was some consensus that the internet and its applications had a promising
future, but there was little certainty about the speed and way/configuration that
some trends would materialize. One of the big bets of the period, content portals
(Yahoo, AOL etc), today play a much less relevant role than experimental concepts
from that time such as search engines without manual indexing (Google, founded
in 1998), social networks (Facebook, founded in 2003), and e-commerce platforms
(Amazon, founded in 1994). These three firms (Google, Facebook, and Amazon),
which took the lead in their segments during the disruption, are now among the top
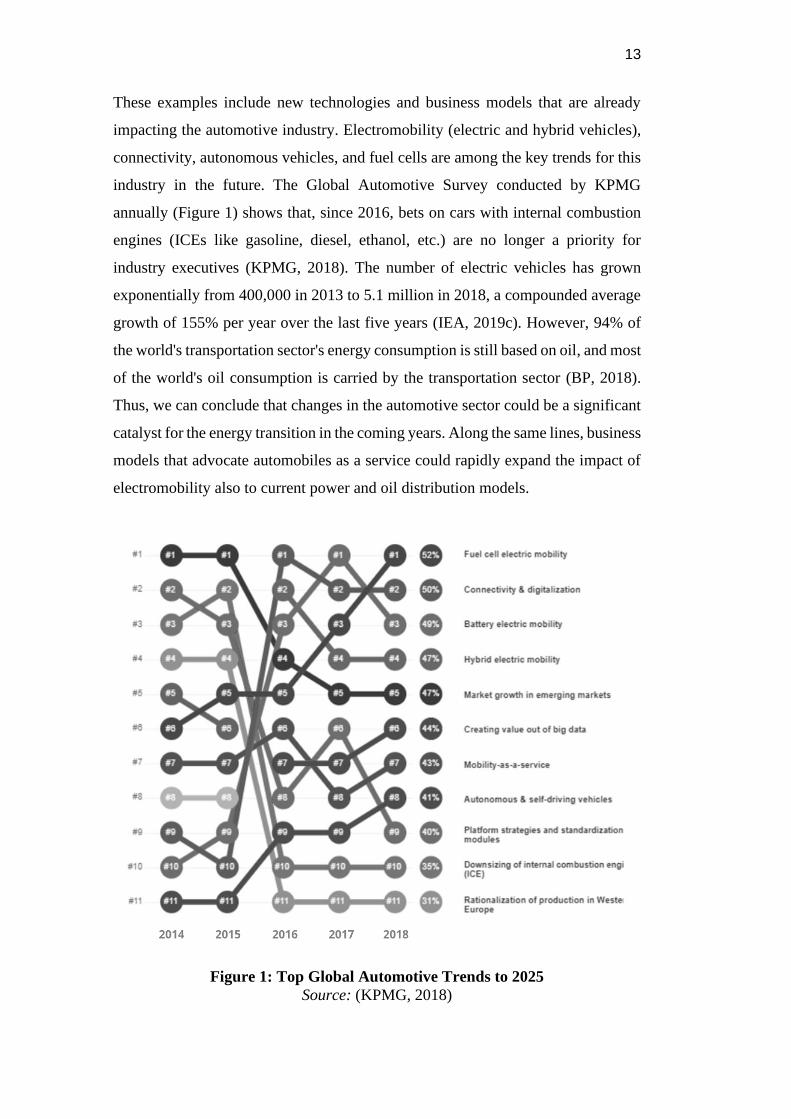
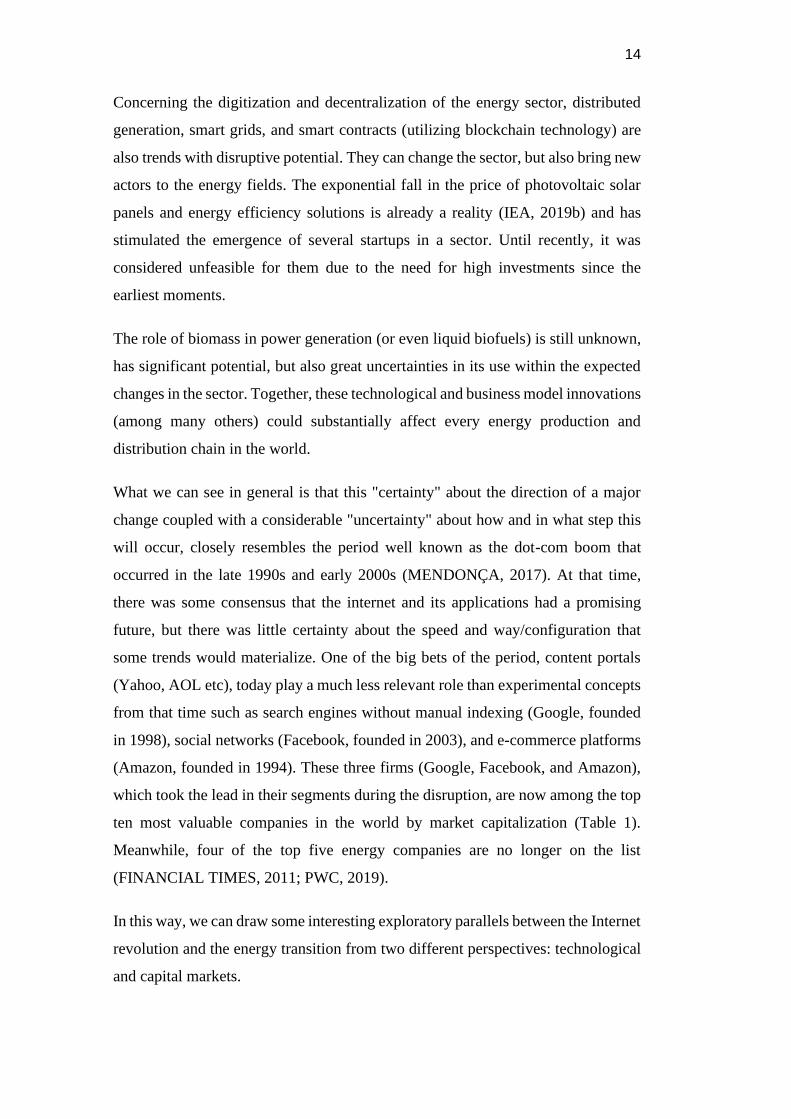
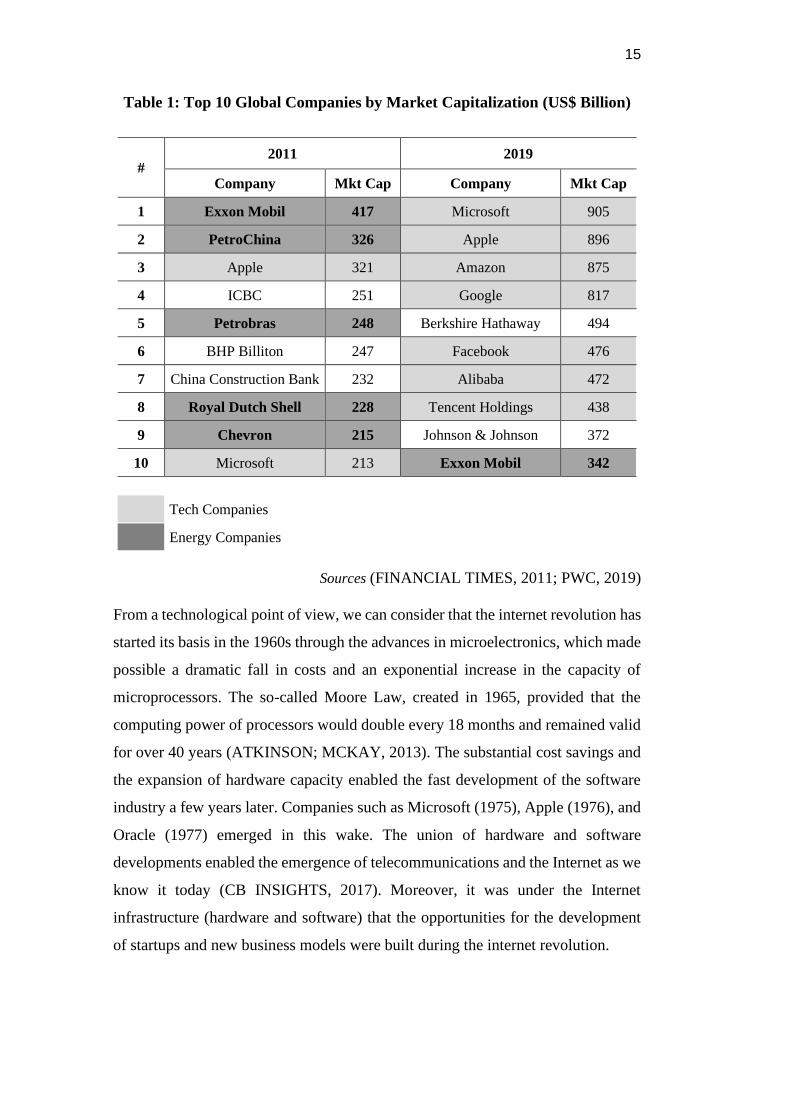
ten most valuable companies in the world by market capitalization (Table 1).
Meanwhile, four of the top five energy companies are no longer on the list
(FINANCIAL TIMES, 2011; PWC, 2019).
In this way, we can draw some interesting exploratory parallels between the Internet
revolution and the energy transition from two different perspectives: technological
and capital markets.
15
Table 1: Top 10 Global Companies by Market Capitalization (US$ Billion)
# 2011 2019
Company Mkt Cap Company Mkt Cap
1 Exxon Mobil 417 Microsoft 905
2 PetroChina 326 Apple 896
3 Apple 321 Amazon 875
4 ICBC 251 Google 817
5 Petrobras 248 Berkshire Hathaway 494
6 BHP Billiton 247 Facebook 476
7 China Construction Bank 232 Alibaba 472
8 Royal Dutch Shell 228 Tencent Holdings 438
9 Chevron 215 Johnson & Johnson 372
10 Microsoft 213 Exxon Mobil 342
Tech Companies
Energy Companies
Sources (FINANCIAL TIMES, 2011; PWC, 2019)
From a technological point of view, we can consider that the internet revolution has
started its basis in the 1960s through the advances in microelectronics, which made
possible a dramatic fall in costs and an exponential increase in the capacity of
microprocessors. The so-called Moore Law, created in 1965, provided that the
computing power of processors would double every 18 months and remained valid
for over 40 years (ATKINSON; MCKAY, 2013). The substantial cost savings and
the expansion of hardware capacity enabled the fast development of the software
industry a few years later. Companies such as Microsoft (1975), Apple (1976), and
Oracle (1977) emerged in this wake. The union of hardware and software
developments enabled the emergence of telecommunications and the Internet as we
know it today (CB INSIGHTS, 2017). Moreover, it was under the Internet
infrastructure (hardware and software) that the opportunities for the development
of startups and new business models were built during the internet revolution.
16
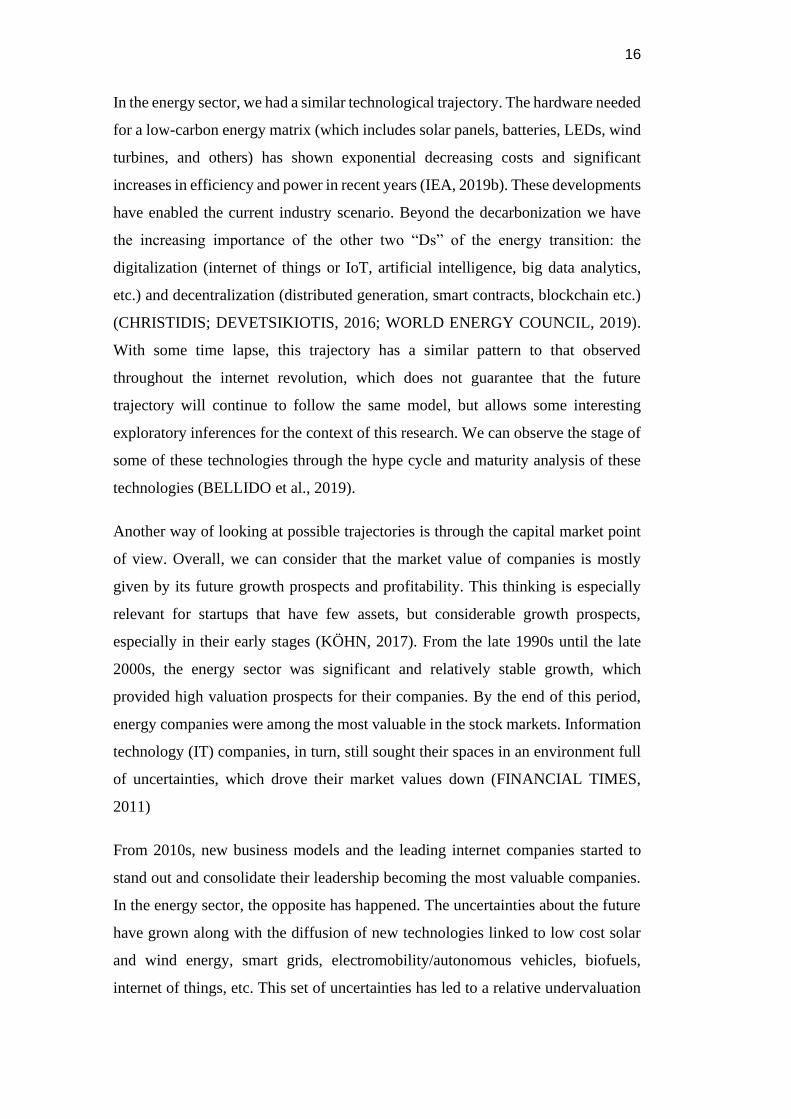
In the energy sector, we had a similar technological trajectory. The hardware needed
for a low-carbon energy matrix (which includes solar panels, batteries, LEDs, wind
turbines, and others) has shown exponential decreasing costs and significant
increases in efficiency and power in recent years (IEA, 2019b). These developments
have enabled the current industry scenario. Beyond the decarbonization we have
the increasing importance of the other two “Ds” of the energy transition: the
digitalization (internet of things or IoT, artificial intelligence, big data analytics,
etc.) and decentralization (distributed generation, smart contracts, blockchain etc.)
(CHRISTIDIS; DEVETSIKIOTIS, 2016; WORLD ENERGY COUNCIL, 2019).
With some time lapse, this trajectory has a similar pattern to that observed
throughout the internet revolution, which does not guarantee that the future
trajectory will continue to follow the same model, but allows some interesting
exploratory inferences for the context of this research. We can observe the stage of
some of these technologies through the hype cycle and maturity analysis of these
technologies (BELLIDO et al., 2019).
Another way of looking at possible trajectories is through the capital market point
of view. Overall, we can consider that the market value of companies is mostly
given by its future growth prospects and profitability. This thinking is especially
relevant for startups that have few assets, but considerable growth prospects,
especially in their early stages (KÖHN, 2017). From the late 1990s until the late
2000s, the energy sector was significant and relatively stable growth, which
provided high valuation prospects for their companies. By the end of this period,
energy companies were among the most valuable in the stock markets. Information
technology (IT) companies, in turn, still sought their spaces in an environment full
of uncertainties, which drove their market values down (FINANCIAL TIMES,
2011)
From 2010s, new business models and the leading internet companies started to
stand out and consolidate their leadership becoming the most valuable companies.
In the energy sector, the opposite has happened. The uncertainties about the future
have grown along with the diffusion of new technologies linked to low cost solar
and wind energy, smart grids, electromobility/autonomous vehicles, biofuels,
internet of things, etc. This set of uncertainties has led to a relative undervaluation
17
of energy companies compared with internet companies (PWC, 2019), but the
energy sector remains quite large, and, regardless of the form, energy remains one
of the main drivers of human development (SMIL, 2010).
These comparative perceptions between the internet revolution and the energy
transition over the past two decades have allowed us to move to the central
framework of this research's investigation, where we use multi-stakeholder models
in the context of open innovation. This approach was critical to building the current
dominance scenario of Internet companies, but it has not been analyzed in enough
depth in the context of the energy transition.
1.1 The Role of Open Innovation Stakeholders on the Energy
Transition.
The construction logic of this Thesis follows a timeline that considers three aspects:
the writing of the articles themselves, theoretical development on stakeholder
engagement in the open innovation process, and my career as a professional and
researcher.
From the conceptual point of view, we must highlight some points before we begin
with the timeline perspective. The first key concept, the energy transition, has
already been broadly addressed before, and we only reinforce that it is a large-scale
movement with a global reach, where significant uncertainties remain over the
trillions of dollars invested. The direction of this energy transition is from fossil and
centralized sources to digital and decentralized arrangements with a focus on
decarbonization.
It is also essential to conceptualize what is open innovation, that can be understood
as “the antithesis of the traditional vertical integration model where internal R&D
activities lead to internally developed products that are then distributed by the firm”
(CHESBROUGH, 2006). The most relevant underlying perception behind this
definition is that in the new paradigm, innovations are no longer only generated
within the company boundaries, but in cooperative processes with other
stakeholders outside them. Open innovation is also related with strategic alliances
18
concept when it is linked with the corporation’s efforts to leverage and absorb
external innovation (MACEDO-SOARES; PAULA; MENDONÇA, 2017)
The union of these two core concepts – energy transition and open innovation –
leads us to the main objective of this Thesis, which is to investigate the role that
open innovation may (or should) have during the energy transition.
In this sense, the first article “WORKING TOWARDS A FRAMEWORK BASED
ON MISSION-ORIENTED PRACTICES FOR ASSESSING RENEWABLE
ENERGY INNOVATION POLICIES” sought to report the classic interactions of
triple helix stakeholders (universities, government, and corporations) through
mission-oriented public policy concept (MENDONÇA; VAN ADUARD DE
MACEDO-SOARES; FONSECA, 2018). Although the concept of the triple helix
(ETZKOWITZ; LEYDESDORFF, 2000) predates the concept of open innovation
(CHESBROUGH, 2003a), in this article, we have found that cooperation between
institutions, outside corporate boundaries and driven by government programs,
were crucial in the development of radical and high-impact innovations, such as
those required in mission-oriented energy sector programs.
Greco, Locatelli & Lisi (2017) highlight the role of open innovation efforts and
cooperation between university, corporations, and government in the energy sector.
Due to its strategic nature, the energy sector is often heavily regulated and
subsidized, and the role of the government tends to be critical in the energy
transition process. The mission-oriented approach has been an essential driver for
the public policy toolkit in the efforts to reduce the environmental impact of the
energy sector (decarbonization). The needs for clear objectives and goals are highly
relevant in the broader context of sustainable development challenges demanded by
the current energy transition.
A systematic literature review is one of the most relevant findings of the first article.
However, its application test with three real Brazilian programs (PAISS, Inova
Energia, and PAISS 2) is also quite relevant in the context of this Thesis, going
beyond the article itself. We also must highlight my involvement with the
program’s design and execution as Finep’s Manager and Superintendent. This
condition also leads to another adjacent perception that is one of the primary
19
motivations for the second article: the notable absence of startups and venture
capital funds in a more structured way within the scope of the programs.
The second article, “ENERGY STARTUPS: IDENTIFYING WINNING
STANDARDS DURING THE ENERGY TRANSITION”, focuses precisely on
startups and venture capital investors, two other stakeholders not directly addressed
by the triple helix model, but which had a pivotal role during the internet revolution.
Investigating their role also during the energy transition is a key-point for the
comparative understanding of the two phenomena. More specifically, in this article,
we have tried to observe and analyze the standards that defined the success (IPO)
or failure (Closing) of energy startups in the last 20 years (MENDONÇA;
FERREIRA; VINICIUS, 2018). We have considered, among many other variables,
the importance of investments and the profile of investors in their trajectories.
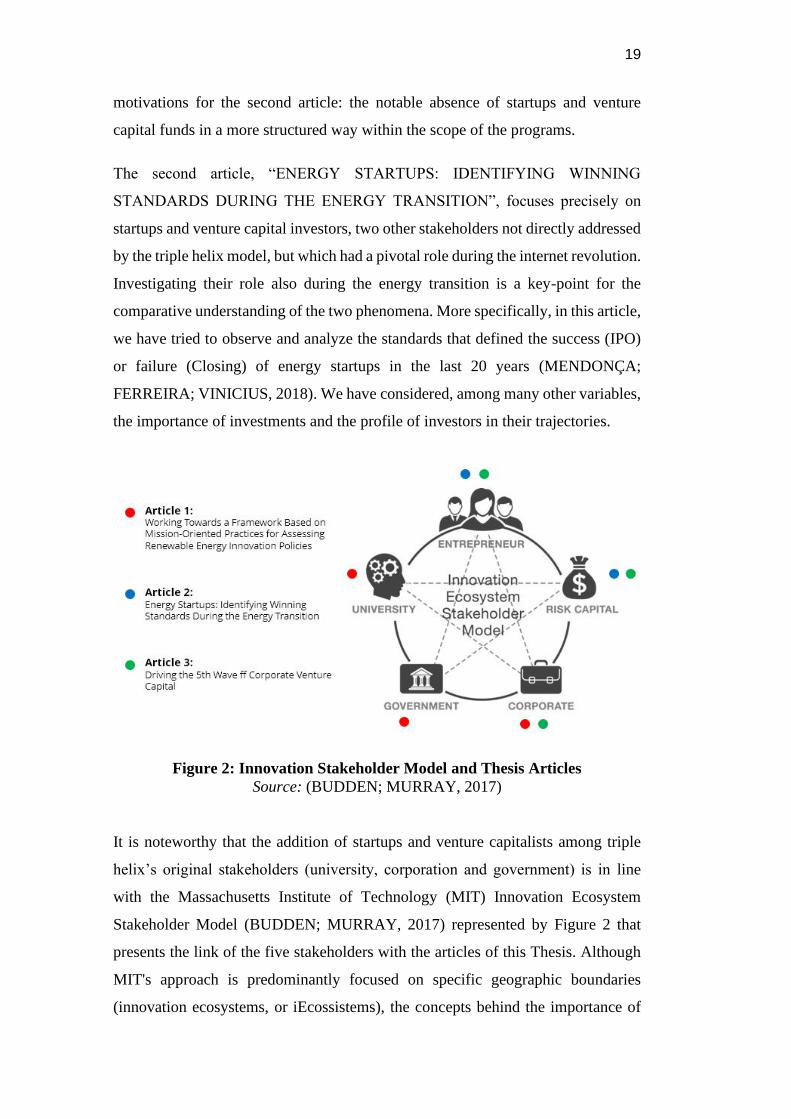
Figure 2: Innovation Stakeholder Model and Thesis Articles
Source: (BUDDEN; MURRAY, 2017)
It is noteworthy that the addition of startups and venture capitalists among triple
helix’s original stakeholders (university, corporation and government) is in line
with the Massachusetts Institute of Technology (MIT) Innovation Ecosystem
Stakeholder Model (BUDDEN; MURRAY, 2017) represented by Figure 2 that
presents the link of the five stakeholders with the articles of this Thesis. Although
MIT's approach is predominantly focused on specific geographic boundaries
(innovation ecosystems, or iEcossistems), the concepts behind the importance of
20
each of the five stakeholders remain valid even for broader concepts linked to open
innovation.
Once again, the theoretical and writing course of the article meets the personal
aspect. Throughout this Thesis writing process, I had the opportunity to study the
model personally with the professors who created this approach at MIT: Prof. Fiona
Murray and Prof. Phil Budden, and empirically check the challenges experienced
by energy startups as Cleantech Director at the Brazilian Startups Association.
Finally, in the last article, we face the latest theme from the literature’s point of
view: The relationship between startups and corporations. While the triple-helix
concept began to spread widely in the early 1990s (ETZKOWITZ;
LEYDESDORFF, 2000) and the boom in startups and venture capital funds occurs
in the early 2000s (CB INSIGHTS, 2017; RIES, 2011) the use of cooperation
between corporations and startups as an innovation tool is more recent.
In the third article, “UNRAVELING THE 5TH WAVE OF CORPORATE
VENTURE CAPITAL”, we have investigated one of the latest trends within the
field of open innovation: The Corporate Venture Capital (CVC) activity. In this
manuscript, we discovered the existence of a fifth wave that has characteristics quite
peculiar when compared to the previous ones. While the first three waves had
mainly financial motivations, and the fourth wave would be considered as a learning
period, the fifth wave of CVC is a real candidate for the new mainstream of
innovation management, increasingly being linked to the strategic core of
corporations. We realize that on the fifth wave, large corporations are starting to
use their CVC units as value capture platforms within their innovation ecosystems
(COVIN; MILES, 2007).
We were able to highlight the existence of a new cycle analyzing the general
characteristics of the waves (13,012 CVC unit investment operations) and taking a
closer look at the 101 most active CVC units in the world over the last 25 years. It
is a novelty to CVC industry and not yet reported by the academic business
literature.
The union of the three articles using the MIT approach as the base model can be
pointed in Figure 2 and shows the clear connection between the stakeholders and

21
articles. Altogether, the research shows that in the energy transition would be
expected a more significant balance between the five stakeholders compared to the
internet revolution.
22
2 WORKING TOWARDS A FRAMEWORK BASED ON MISSION-ORIENTED PRACTICES FOR ASSESSING RENEWABLE ENERGY INNOVATION POLICIES
Abstract
Mission-oriented programs have regularly been used as innovation policies when
governments (or societies) are faced with complex challenges that demand radical
innovations and multiplayer coordination. Nowadays, the global climate-change
question, including the energy source issue, is an example of a mission-oriented
challenge. Several countries have adopted energy programs with mission-oriented
characteristics. Brazil, for example, launched three programs (PAISS, PAISS 2 and
Inova Energia) to foster innovations in renewable energy sources such as biofuels,
solar and wind power. These programs dealt with radical innovations, big
challenges and multiplayer coordination, but did not use some important mission-
oriented best practices. Based on an extensive literature review, this article’s aim
is to present a framework developed to verify whether renewable energy innovation
programs meet the requirements for being classified as mission-oriented programs.
It is assumed that mission-oriented programs can contribute to the effectiveness of
renewable energy innovation policies. The case of Brazil and its Inova programs is
used as an example of how to apply this framework, although the latter was
designed for application to any renewable energy mission-oriented program.
2.1. Introduction
The landscape of global integration and the threat posed by climate change has been
pushing leaders in many countries to pay closer heed to sustainable development.
In this context, the discussion of the energy sector and the necessary energy
transition is particularly important since 77% of the world’s installed energy
capacity is based on non-renewable sources such as coal, oil and gas (WORLD
ECONOMIC FORUM, 2016). It is estimated, that 53% of the efforts needed to
contain global warming should come from the energy sector (IEA, 2016).
23
This trend has gradually been transformed into concrete global investments in
renewable energy, which have been growing in recent years, reaching US$ 285.9
billion in 2015, equivalent to an addition of 147 gigawatts (GW) to global energy
supply. This is the first time since the industrial revolution that investments in
renewable sources of energy exceeded investments in fossil sources (REN21,
2016).
Important specialized energy sector institutions predict continuous growth of
renewable sources in the world energy mix. The International Energy Agency (IEA)
and even some oil companies like British Petroleum (BP) forecast that renewable
sources will continue to rise in the next decades, becoming responsible, in relative
terms, for the greater part of additional energy generation in the world. (BP, 2016;
IEA, 2015).
Reaffirming this trend, 195 countries, including the most important economies of
the world such as China, Japan, Russia, India, Germany, France, UK and Brazil,
signed a cooperation agreement in Paris during the 21st Conference of the Parties
(COP) of the United Nations Framework Convention on Climate Change
(UNFCCC) in 2015. Note that the United States originally signed the climate
change agreement in 2015, but the new president, Donald Trump, decided to
withdraw the country from the agreement in June 2017, in accordance with one of
his campaign promises (THE NEW YORK TIMES, 2017). In this agreement these
countries committed to use their best efforts to keep global warming below 1.5 ºC
(UNFCCC, 2016). Researchers from the UNFCCC, other institutions and
specialists agree that this goal will only be reached with the improvement and
diffusion of renewable energy sources and new low-carbon technologies (BP, 2016;
IEA, 2015; REN21, 2016; UNFCCC, 2016).
Long-term and large-scale global change necessarily involves a concerted effort by
various sectors of society, with large volumes of investment and sound and well-
structured public policies. The energy transition to a low carbon economy is a global
challenge that demands local action to be carried out effectively.
In this scenario, and using some of its competitive advantages, Brazil has been
seeking to position itself as a global leader in this transformation process. Host to
24
two major climate conferences (Rio 92 and Rio +20), Brazil already produces
43.5% of its primary energy from renewable sources (EPE, 2015), and still has huge
expansion potential in biomass (Ferreira-Leitao et al., 2010; EPE, 2015), solar
(UFPE, CEPEL, & CHESF, 2000), wind (CRESESB, CEPEL, Camargo Schubert,
& True Wind, 2001) and other sources. However, the country only ranked in 69th
place (1998) in the Global Innovation Index (Cornell University, INSEAD, &
WIPO, 2015).
With the objective of harnessing the country’s potential strategic position and also
overcoming part of its deficiencies regarding the innovation environment, the
Brazilian government has included the energy sector, especially renewable energy,
at the center of its main innovation policy in recent years: the plan called “Inova
Empresa” (“Company Innovation”). Launched in March 2013 by the Brazilian
government, this plan was the largest innovation financing initiative in Brazil’s
recent history. From the beginning, the plan had an unprecedented budget (by
Brazilian standards) of US$ 16.5 billion, just to support technological innovation in
a wide range of initiatives. The core of the policy, called “Inova Programs” or
“Inova Family”, was composed of 11 sectorial and thematic initiatives, and
corresponded to 65% (US$ 10.6 billion) of the whole budget (BRAZIL, 2013).
These “Inova Family” initiatives had a unique set of characteristics, which were
unprecedented in Brazil. The most important aspect of these programs was each
initiative’s attempt to integrate all federal efforts around a specific theme, aiming
to improve the efficiency of investments in innovation. To reach this goal, these
initiatives were structured as mission-oriented programs (MAZZUCATO; PENNA,
2015).
Three of the Inova programs (and 17% of the entire budget) were concerned with
renewable energy: PAISS (2011), Inova Energia (2013), and PAISS 2 (2014). The
PAISS and PAISS 2 aimed to bring Brazil “back into the game” of ethanol
productivity and other advanced sugarcane bio-products. The second one, Inova
Energia, targeted a wider scope, with three different lines designed to rethink the
Brazilian electrical sector, calling for new technologies in smart grids, solar and
wind generation, in addition to electric cars and their components (motors, batteries
etc.).
25
Considering the energy transition scenario and based on an extensive literature
review, this article’s main objective is to present a framework that was developed
to verify whether renewable energy innovation programs meet the requirements for
being mission-oriented programs. We assume that mission-oriented programs can
contribute to the effectiveness of renewable energy innovation policies. The case of
Brazil and its Inova programs is used as an example of how to apply this framework.
The main objective is to help assess and formulate new renewable energy policies
also in other countries.
To achieve our main objective, we established the following intermediate
objectives:
- Identify which characteristics a renewable energy innovation program must
have to be considered a mission-oriented program;
- Develop a framework with mission-oriented constructs to verify to what
extent a renewable energy innovation program/policy meets the
requirements to be a mission-oriented program; and
- Apply this framework to the case of the Inova programs to illustrate how it
can be used.
2.2. Research Methodology
To achieve these objectives, it was important to first find comparable parameters to
analyze renewable energy programs in terms of being mission-oriented programs.
We did this by an extensive systematic literature review of mission-oriented
innovation programs and policies, focused on initiatives in energy as the sector and
Brazil as the region. We ran four searches in the Scopus database, restricted to the
last 10 years and to articles and reviews.
In the first search we looked for mission-oriented public policies to establish recent
benchmarks. Then, we used “mission-oriented” AND “public policy” keywords to
conduct the search. We also searched for the concept of mission-orientation
associated with innovation efforts. We used “mission-oriented” AND “innovation”
26
as keywords in this case. We refer to these two searches as “mission-oriented
searches”.
To improve the scope of energy as a sector and Brazil as a region, we ran two more
searches: one with “Brazil” AND “energy” AND “innovation”, to increase
knowledge regarding the latest efforts in energy sector innovations in Brazil; and
the other using “Brazil” AND “energy” AND “public policy" to better understand
public energy policies in Brazil in recent years. We refer to these other two searches
as “Brazil and energy searches”.
The combination of these searches returned 188 articles/reviews. We applied a
thematic filter to exclude purely technical papers and restrict subject areas to those
linked to the scope of this article: Business, Management and Accounting; Social
Sciences; Economics, Econometrics and Finance; and Decision Sciences. We thus
obtained 74 articles.
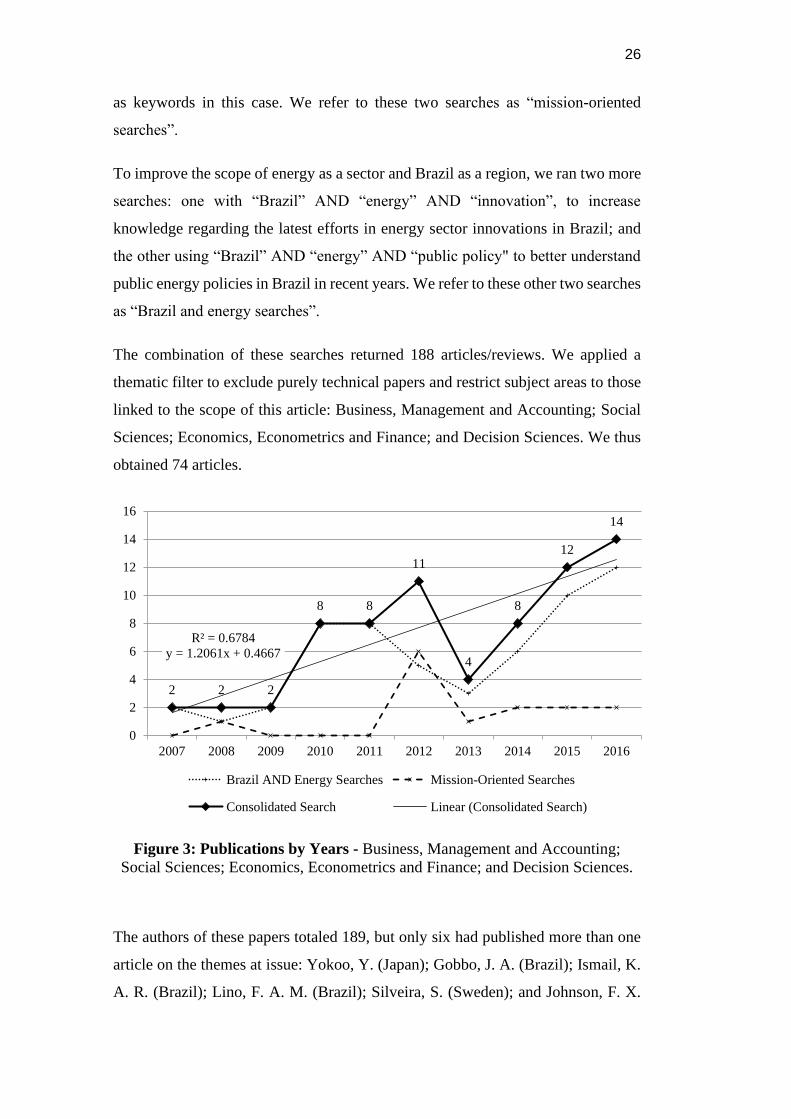
Figure 3: Publications by Years - Business, Management and Accounting;
Social Sciences; Economics, Econometrics and Finance; and Decision Sciences.
The authors of these papers totaled 189, but only six had published more than one
article on the themes at issue: Yokoo, Y. (Japan); Gobbo, J. A. (Brazil); Ismail, K.
A. R. (Brazil); Lino, F. A. M. (Brazil); Silveira, S. (Sweden); and Johnson, F. X.
2 2 2
8 8
11
4
8
12
14
R² = 0.6784
y = 1.2061x + 0.4667
0
2
4
6
8
10
12
14
16
2007 2008 2009 2010 2011 2012 2013 2014 2015 2016
Brazil AND Energy Searches Mission-Oriented Searches
Consolidated Search Linear (Consolidated Search)
27
(Sweden). Even these authors had written only two articles each out of those
returned by our searches. The diversity of authors on these themes, but with no
single one standing out, provided us with some interesting insights, such as the
prevalence of Brazilian and Swedish researches in these themes.
The timeline of the number of articles/reviews in Figure 3 shows a growth trend in
publications in the areas investigated (β > 0 and R² = 0.678). There are also more
publications about Brazil and energy than the mission-orientation concept. The
peak of publication about mission-orientation in 2012 occurred because a special
issue of Research Policy was published that year, entitled: “The need for a new
generation of policy instruments to respond to the Grand Challenges” (volume 41,
issue 10).
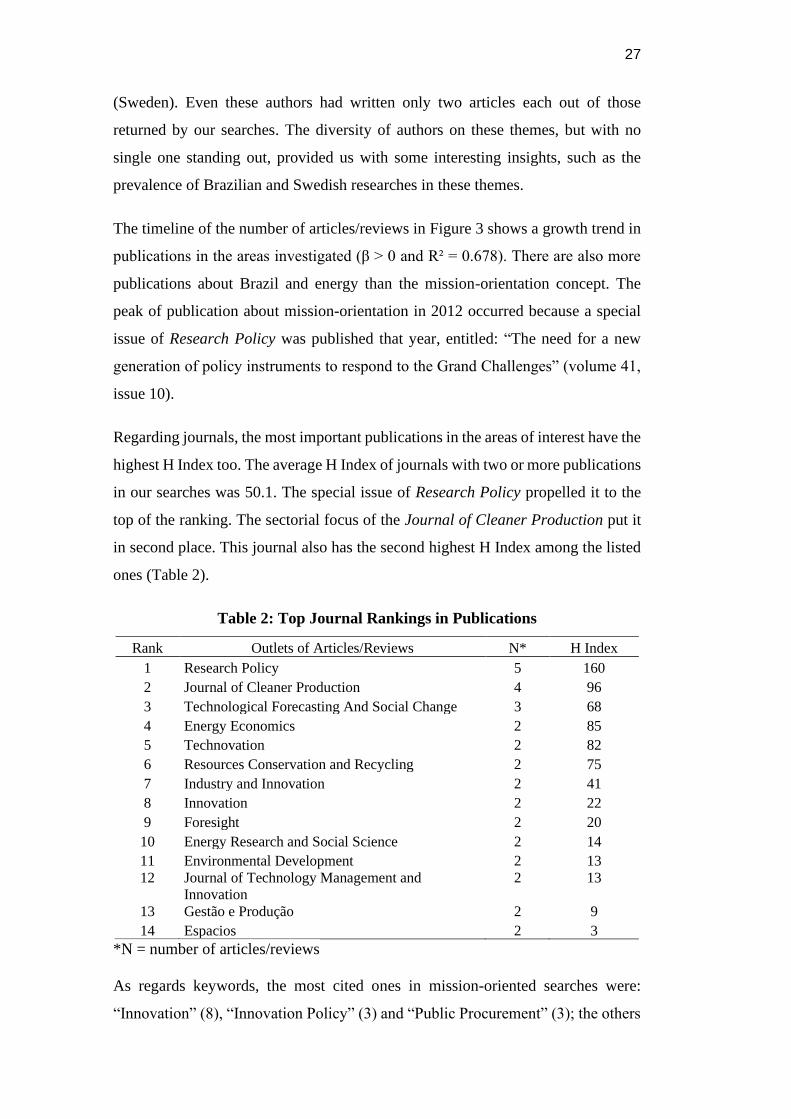
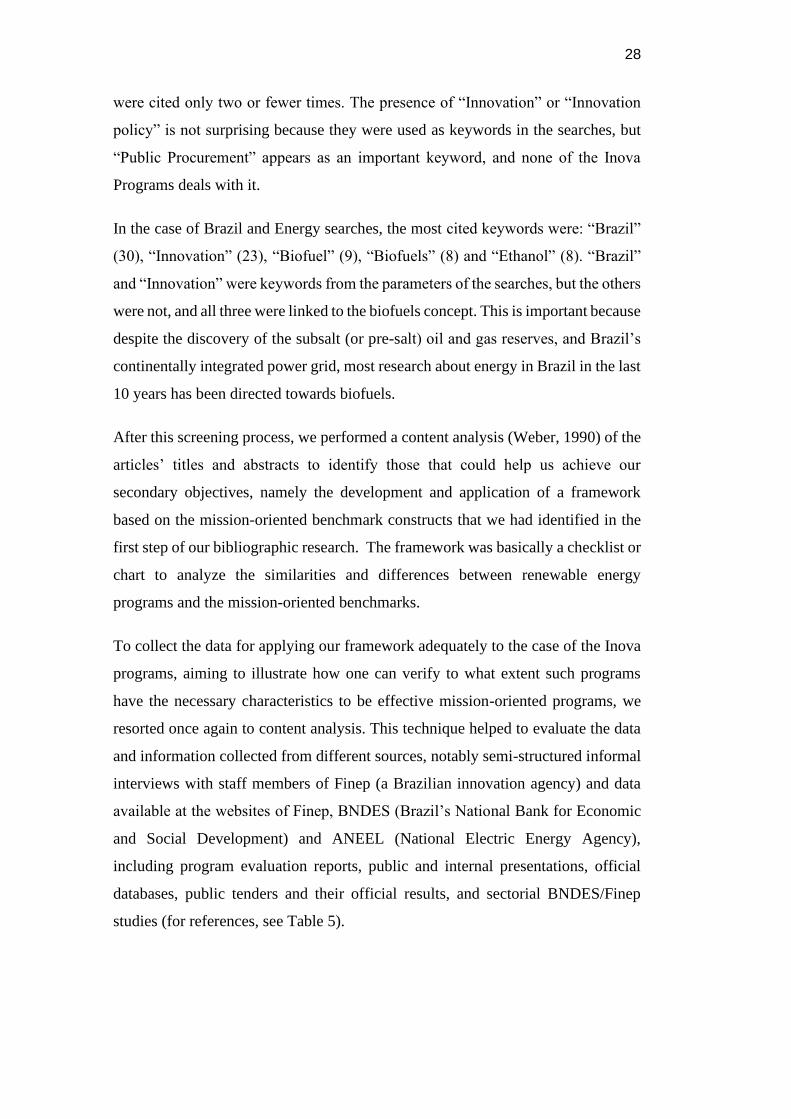
Regarding journals, the most important publications in the areas of interest have the
highest H Index too. The average H Index of journals with two or more publications
in our searches was 50.1. The special issue of Research Policy propelled it to the
top of the ranking. The sectorial focus of the Journal of Cleaner Production put it
in second place. This journal also has the second highest H Index among the listed
ones (Table 2).
Table 2: Top Journal Rankings in Publications
Rank Outlets of Articles/Reviews N* H Index
1 Research Policy 5 160
2 Journal of Cleaner Production 4 96
3 Technological Forecasting And Social Change 3 68
4 Energy Economics 2 85
5 Technovation 2 82
6 Resources Conservation and Recycling 2 75
7 Industry and Innovation 2 41
8 Innovation 2 22
9 Foresight 2 20
10 Energy Research and Social Science 2 14
11 Environmental Development 2 13
12 Journal of Technology Management and
Innovation
2 13
13 Gestão e Produção 2 9
14 Espacios 2 3
*N = number of articles/reviews
As regards keywords, the most cited ones in mission-oriented searches were:
“Innovation” (8), “Innovation Policy” (3) and “Public Procurement” (3); the others
28
were cited only two or fewer times. The presence of “Innovation” or “Innovation
policy” is not surprising because they were used as keywords in the searches, but
“Public Procurement” appears as an important keyword, and none of the Inova
Programs deals with it.
In the case of Brazil and Energy searches, the most cited keywords were: “Brazil”
(30), “Innovation” (23), “Biofuel” (9), “Biofuels” (8) and “Ethanol” (8). “Brazil”
and “Innovation” were keywords from the parameters of the searches, but the others
were not, and all three were linked to the biofuels concept. This is important because
despite the discovery of the subsalt (or pre-salt) oil and gas reserves, and Brazil’s
continentally integrated power grid, most research about energy in Brazil in the last
10 years has been directed towards biofuels.
After this screening process, we performed a content analysis (Weber, 1990) of the
articles’ titles and abstracts to identify those that could help us achieve our
secondary objectives, namely the development and application of a framework
based on the mission-oriented benchmark constructs that we had identified in the
first step of our bibliographic research. The framework was basically a checklist or
chart to analyze the similarities and differences between renewable energy
programs and the mission-oriented benchmarks.
To collect the data for applying our framework adequately to the case of the Inova
programs, aiming to illustrate how one can verify to what extent such programs
have the necessary characteristics to be effective mission-oriented programs, we
resorted once again to content analysis. This technique helped to evaluate the data
and information collected from different sources, notably semi-structured informal
interviews with staff members of Finep (a Brazilian innovation agency) and data
available at the websites of Finep, BNDES (Brazil’s National Bank for Economic
and Social Development) and ANEEL (National Electric Energy Agency),
including program evaluation reports, public and internal presentations, official
databases, public tenders and their official results, and sectorial BNDES/Finep
studies (for references, see Table 5).
29
2.3. Literature Review
We started our literature review by looking for a definition for the central concept
of our research: mission-oriented policies. For policy formulation, a correct
definition of a mission-oriented policy and identification of its characteristics is
critical because of economic and social implications (Amanatidou et al., 2014;
Foray et al., 2012; Mazzucato and Penna, 2015). Although this central concept has
been described very differently by many authors, there is a consensus that what
characterizes these policies are that they are centralized and focused on contending
with big national challenges (DASGUPTA; STONEMAN, 2005; EDQUIST;
ZABALA-ITURRIAGAGOITIA, 2012). These policies are more focused on
radical innovations needed to achieve clearly set goals of national importance
(CANTNER; PYKA, 2001; ERGAS, 1987). In contrast to those developed
according to the mission-orientation concept, diffusion-oriented policies focus on
providing general innovation-related public goods to diffuse technological
capabilities throughout industrial infrastructure and produce a large volume of
incremental innovations (ERGAS, 1987).
The original mission-orientation concept was used to classify countries’ policies.
Researchers in the innovation policy area tried to classify countries’ policies as
mission- or diffusion-oriented (CANTNER; PYKA, 2001; CHIANG, 1991;
ERGAS, 1987). However, even they, and many other authors, admitted that this
could be complicated because countries might adopt different strategies in different
sectors, regions or innovation contexts and with different time frames (ANADÓN,
2012; ERGAS, 1987; HAHN; YU, 1999). We can cite as examples of changing
policy directions/strategies, the defense innovation policies between 1948 and 1989
during the Cold War (MOWERY, 2012); the increase in the number and direction
of energy innovation policies after the 1970’s oil and gas crises (ANADÓN, 2012);
or the current discussion regarding the generation of radical innovation versus
diffusion of incremental clean technologies (ELEFTHERIADIS;
ANAGNOSTOPOULOU, 2015; MAZZUCATO; PENNA, 2015). A radical
innovation (Leifer et al., 2000, p. 5) “is a product, process, or service with either
unprecedented performance features or familiar features that offer potential for
significant improvements in performance or cost. Radical innovations create such
30
a dramatic change in products, processes or services that they transform existing
markets or industries, or create new ones.”
We assumed that mission-oriented programs can contribute significantly to enhance
the effectiveness of innovation policies, including renewable energy innovation
policies. This assumption is based on the studies of Amanatidou et al. (2014), Foray
et al. (2012) and Mazzucato and Penna (2015), who highlight the importance and
positive impact of mission-oriented policies in technology and innovation
environments.
We adopted the institutional research approach, using public agents as sources. As
unit of analysis we used specific programs (DOSI, 2016; FORAY; MOWERY;
NELSON, 2012; RUMPF, 2012; SANTOS; IANDA; PADULA, 2014). This
approach enables a more accurate analysis of the characteristics and results of
policies in specific sectorial, regional and time contexts. Below we describe the
characteristics of a mission-oriented program, based on the literature review.
The first is the alignment of the program with the country’s general policies
(economic, industrial, environmental etc.) (ERGAS, 1987; MAZZUCATO;
PENNA, 2016). An example is the Chinese Renewable Energy Scale-up Program
(CRESP), created to build a legal, regulatory, and institutional environment
conducive to large-scale, renewable-based electricity generation. It was created in
full alignment with the 10th Chinese Five-Year Plan, the national plan which
establishes China’s priorities (ABDMOULEH; ALAMMARI; GASTLI, 2015;
WORLD BANK, 2016).
The second characteristic is the need for a clear objective involving a major
challenge to be solved. Generally, it involves the development of a set of new
technologies to achieve this major objective. Defining measurable intermediate
goals is important for managing and evaluating the progress of mission-oriented
programs. The Apollo Program, whose aim was to send the first human being to the
Moon, is an eloquent example of a clear objective mission-oriented program
(MAZZUCATO; PENNA, 2016; VEUGELERS, 2012).
The third characteristic is a focus on high impact radical innovations. It is important
to be able to justify politically, economically or socially the choice of one program
31
over another (AMANATIDOU et al., 2014; DASGUPTA; STONEMAN, 2005).
By definition, in diffusion-oriented policies there is no focus on requiring the
achievement of a few specific targets, so policymakers can spread funds more
widely and foster more incremental innovations. An example of a mission-oriented
program focused on radical innovation is the Manhattan Project to develop nuclear
bomb technology during World War II (FORAY; MOWERY; NELSON, 2012;
MAZZUCATO; PENNA, 2016; MOWERY, 2012).
The fourth characteristic of a mission-oriented program is the focus on generating
new technologies instead of the diffusion of existing ones (ERGAS, 1987). Some
authors refer to the importance of balancing the generation of new technologies
with diffusion of innovations (GLENNIE; BOUND, 2016; HAHN; YU, 1999), but
it is widely agreed that mission-oriented programs are generally more focused on
the generation of new technologies.
The fifth characteristic is the time frame for results. A long-term view is generally
necessary, but less required than in the case of diffusion-oriented policies
(CHIANG, 1991). It also depends on the kind of mission being specified. The
Manhattan Project delivered expected results in less than six years, but challenges
like climate-change prevention demand much more time to be effectively addressed
(AMANATIDOU et al., 2014; VEUGELERS, 2012). The concern about long-term
missions versus political cycles is a significant risk factor in mission-oriented
programs (AMANATIDOU et al., 2014).
The sixth characteristic that differentiates mission-oriented programs from other
ones is the role of government. The government’s priority-setting role is always
critical in the mission-oriented paradigm (ERGAS, 1987; MAKHOBA; POURIS,
2016; MAZZUCATO; PENNA, 2015; RUMPF, 2012). But the government’s role
can sometimes be extended to more active participation, including the execution of
part of the program in public facilities such as technological institutes, universities
or companies (MAZZUCATO, 2016; MOWERY, 2012).
The seventh characteristic refers to program governance. Mission-oriented
programs generally have a more centralized decision process than other technology
policies, with just one (or a few) government agencies making the critical decisions
32
(ERGAS, 1987; MAZZUCATO, 2013; MAZZUCATO; PENNA, 2015). However,
the programs’ governance models can differentiate the decision process according
to whether this involves setting priorities, monitoring overall progress or evaluating
performance (FORAY; MOWERY; NELSON, 2012). Ergas (1987) emphasizes the
need to centralize all decisions in one agency that can combine technical expertise,
financial resources and decision-making autonomy.
The eighth characteristic refers to success factors of a mission-oriented program.
The evaluation process in diffusion-oriented programs has broader indicators of
success, like the number of PhDs in the private sector, percentage of GDP invested
in R&D, number of innovative companies etc. (DUTTA, 2011). Mission-oriented
programs usually have a “mission accomplished” target (ERGAS, 1987). However,
mission-oriented programs have frequently generated spillovers. Defense-backed
technologies such as GPS, Internet, microprocessors and touch screens, are spinoffs
of mission-oriented initiatives (MAZZUCATO, 2013; MOWERY, 2012).
The ninth characteristic concerns program participants. While other technology
programs could aim at just one part of the innovation chain (universities, SMEs, big
corporations, technological institutes, government facilities, regulators etc.),
mission-oriented programs need to act in the whole universe of involved players
and coordinate them in the same direction (AMANATIDOU et al., 2014;
CHOUNG; HWANG; SONG, 2014). This big challenge is one of the reasons that
a centralized governance model is required in mission-oriented programs
(CANTNER; PYKA, 2001). Regarding this point, Ergas (1987) recommends that
the project leader be a big corporation in order to guarantee the financial support
and technical quality and diversity needed to deal with the challenges and
oscillations during the process.
The tenth and final mapped critical characteristic of a mission-oriented program
refers to its public policy instruments. To solve a big and complex question, all
efforts need to be analyzed and aligned. Table 3, based on Borrás and Edquist
(2013), provides a guide to understand the diversity of innovation policy
instruments that can be used in mission-oriented programs.
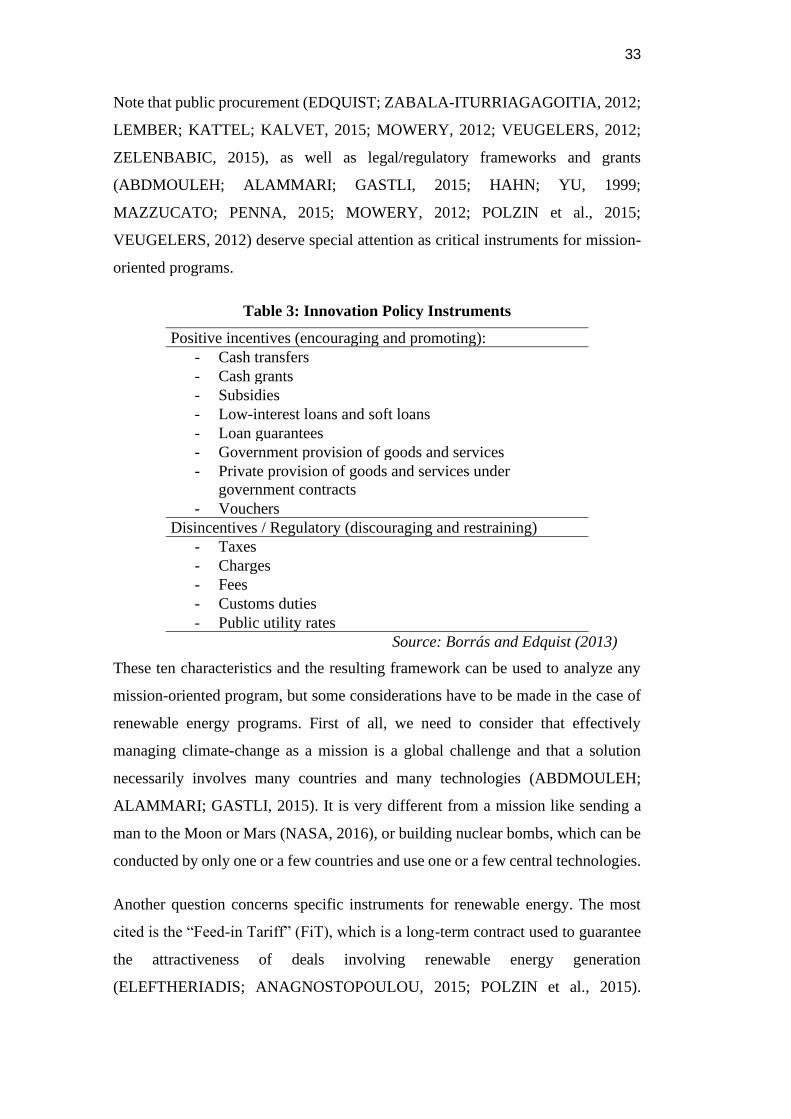
33
Note that public procurement (EDQUIST; ZABALA-ITURRIAGAGOITIA, 2012;
LEMBER; KATTEL; KALVET, 2015; MOWERY, 2012; VEUGELERS, 2012;
ZELENBABIC, 2015), as well as legal/regulatory frameworks and grants
(ABDMOULEH; ALAMMARI; GASTLI, 2015; HAHN; YU, 1999;
MAZZUCATO; PENNA, 2015; MOWERY, 2012; POLZIN et al., 2015;
VEUGELERS, 2012) deserve special attention as critical instruments for mission-
oriented programs.
Table 3: Innovation Policy Instruments
Positive incentives (encouraging and promoting):
- Cash transfers
- Cash grants
- Subsidies
- Low-interest loans and soft loans
- Loan guarantees
- Government provision of goods and services
- Private provision of goods and services under
government contracts
- Vouchers
Disincentives / Regulatory (discouraging and restraining)
- Taxes
- Charges
- Fees
- Customs duties
- Public utility rates
Source: Borrás and Edquist (2013)
These ten characteristics and the resulting framework can be used to analyze any
mission-oriented program, but some considerations have to be made in the case of
renewable energy programs. First of all, we need to consider that effectively
managing climate-change as a mission is a global challenge and that a solution
necessarily involves many countries and many technologies (ABDMOULEH;
ALAMMARI; GASTLI, 2015). It is very different from a mission like sending a
man to the Moon or Mars (NASA, 2016), or building nuclear bombs, which can be
conducted by only one or a few countries and use one or a few central technologies.
Another question concerns specific instruments for renewable energy. The most
cited is the “Feed-in Tariff” (FiT), which is a long-term contract used to guarantee
the attractiveness of deals involving renewable energy generation
(ELEFTHERIADIS; ANAGNOSTOPOULOU, 2015; POLZIN et al., 2015).
34
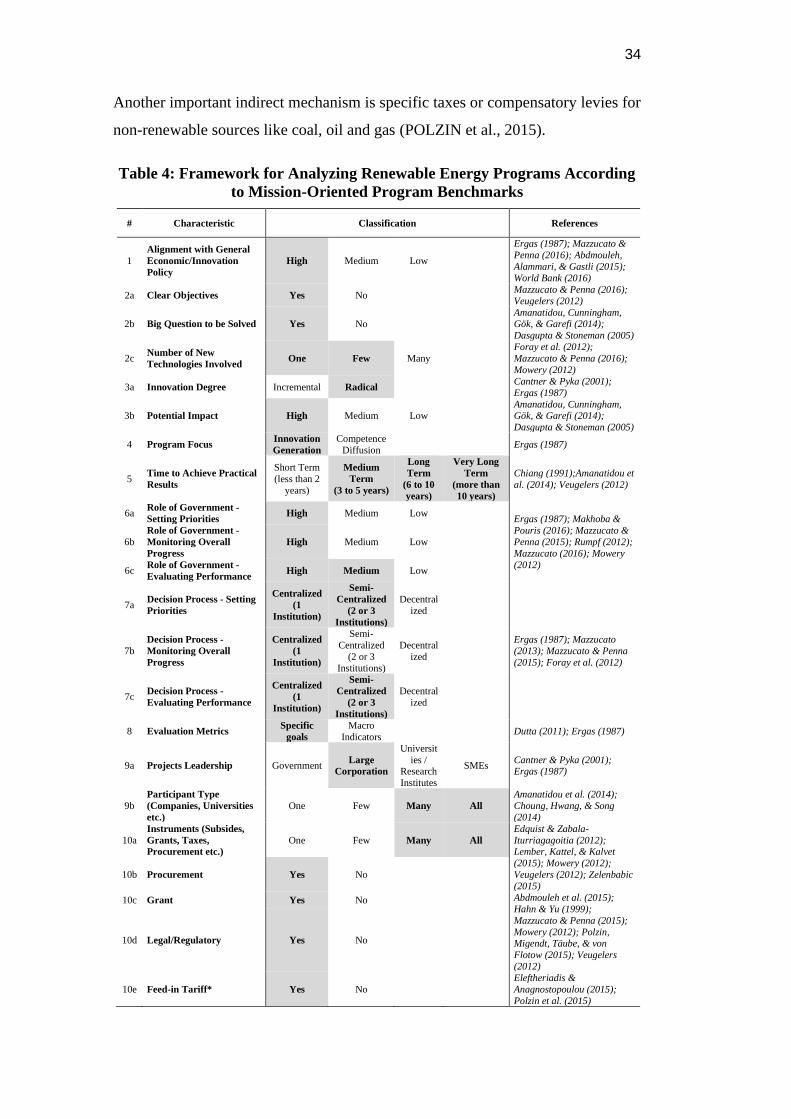
Another important indirect mechanism is specific taxes or compensatory levies for
non-renewable sources like coal, oil and gas (POLZIN et al., 2015).
Table 4: Framework for Analyzing Renewable Energy Programs According
to Mission-Oriented Program Benchmarks
# Characteristic Classification References
1
Alignment with General
Economic/Innovation
Policy
High Medium Low
Ergas (1987); Mazzucato &
Penna (2016); Abdmouleh,
Alammari, & Gastli (2015);
World Bank (2016)
2a Clear Objectives Yes No Mazzucato & Penna (2016);
Veugelers (2012)
2b Big Question to be Solved Yes No Amanatidou, Cunningham, Gök, & Garefi (2014);
Dasgupta & Stoneman (2005)
2c Number of New
Technologies Involved One Few Many
Foray et al. (2012);
Mazzucato & Penna (2016);
Mowery (2012)
3a Innovation Degree Incremental Radical Cantner & Pyka (2001);
Ergas (1987)
3b Potential Impact High Medium Low Amanatidou, Cunningham, Gök, & Garefi (2014);
Dasgupta & Stoneman (2005)
4 Program Focus Innovation
Generation
Competence
Diffusion Ergas (1987)
5 Time to Achieve Practical
Results
Short Term
(less than 2
years)
Medium
Term
(3 to 5 years)
Long
Term
(6 to 10
years)
Very Long
Term
(more than
10 years)
Chiang (1991);Amanatidou et
al. (2014); Veugelers (2012)
6a Role of Government -
Setting Priorities High Medium Low
Ergas (1987); Makhoba &
Pouris (2016); Mazzucato &
Penna (2015); Rumpf (2012);
Mazzucato (2016); Mowery
(2012)
6b
Role of Government -
Monitoring Overall
Progress
High Medium Low
6c Role of Government -
Evaluating Performance High Medium Low
7a Decision Process - Setting
Priorities
Centralized
(1
Institution)
Semi-
Centralized
(2 or 3
Institutions)
Decentral
ized
Ergas (1987); Mazzucato
(2013); Mazzucato & Penna
(2015); Foray et al. (2012)
7b
Decision Process -
Monitoring Overall
Progress
Centralized
(1
Institution)
Semi-
Centralized
(2 or 3
Institutions)
Decentral
ized
7c Decision Process -
Evaluating Performance
Centralized
(1
Institution)
Semi-
Centralized
(2 or 3
Institutions)
Decentral
ized
8 Evaluation Metrics Specific
goals
Macro
Indicators Dutta (2011); Ergas (1987)
9a Projects Leadership Government Large
Corporation
Universit
ies / Research
Institutes
SMEs Cantner & Pyka (2001); Ergas (1987)
9b
Participant Type
(Companies, Universities
etc.)
One Few Many All
Amanatidou et al. (2014);
Choung, Hwang, & Song
(2014)
10a
Instruments (Subsides,
Grants, Taxes,
Procurement etc.)
One Few Many All
Edquist & Zabala-
Iturriagagoitia (2012); Lember, Kattel, & Kalvet
(2015); Mowery (2012);
Veugelers (2012); Zelenbabic
(2015)
10b Procurement Yes No
10c Grant Yes No Abdmouleh et al. (2015);
Hahn & Yu (1999);
Mazzucato & Penna (2015);
Mowery (2012); Polzin, Migendt, Täube, & von
Flotow (2015); Veugelers
(2012)
10d Legal/Regulatory Yes No
10e Feed-in Tariff* Yes No
Eleftheriadis &
Anagnostopoulou (2015);
Polzin et al. (2015)
35
Table 4 presents our framework for checking whether renewable energy programs
have mission-oriented benchmark characteristics. Each characteristic can be
classified as shown in column 2 “Classification”, based on “References” regarding
benchmarks in column 3. The highlighted attribute in column 2 is considered the
benchmark in terms of ensuring effectiveness of the mission-oriented program.
Items #1 to #10c are general characteristics of any mission-oriented program, while
items #10d and #10e more specifically apply to renewable energy mission-oriented
programs.
Before presenting the results of our research, it is important to explain what the
Inova programs are so we can show how our framework can be applied.
2.4. Inova Renewable Energy Programs
The “Inova Empresa” plan had three specific renewable energy programs: PAISS,
PAISS 2 and Inova Energia. These programs had some common characteristics,
and it is important to understand their range and novelty. The first common
characteristic was the nature of the programs themselves. Though the specific goals
of each program were completely different, all of them were directed towards
dealing with a really big problem that could only be solved through innovations or
diffusion of new technologies. All these programs aimed to provide total support
for each step in achieving these objectives, from scientific efforts, followed by
development and prototyping, until the initial phase of marketing the innovations
(FINEP; BNDES, 2011, 2014; FINEP; BNDES; ANEEL, 2013).
As regards coordination, all of it was led, formulated and operated jointly by Finep
and BNDES, The “Inova Energia” program also included ANEEL. The integration
and cooperation of these key Brazilian institutions around the same goals was the
first step and a big novelty of the Inova programs (BRAZIL, 2013). These
institutions were the sponsors of each program. The related ministries (Science,
Technology and Innovation; Development, Industry and Foreign Trade;
Agriculture; and Mining and Energy) acted as a higher council and were more
active in the macro-formulation and general evaluation of the progress achieved.
36
The three programs tried to combine all these sponsors’ innovation support
instruments. In Finep`s case, this was grants and loans to universities, technological
institutes, startups, SMEs and large companies. Finep could also invest in the equity
of program-selected companies. BNDES used similar instruments, with the
exception of grants to companies, because according to Brazilian legislation, only
Finep can operate this kind of resource. The conditions and amount of funding
offered by BNDES was also different. In ANEEL’s case, the mechanism for
supporting innovation in the program was different. One of the regulatory
obligations of power companies in Brazil is to invest at least 1% of their turnover
in research and development (R&D). The acceptance of these expenditures is up to
ANEEL. Companies that were approved in the Inova Energia program could
automatically include this R&D expenditure in ANEEL’s regulatory 1% provision.
The process and governance of the programs were very similar. They started with
a public tender notice in which participants needed to sign a letter of interest
containing basic information about the institution (firm, university or research
institute), the key team and its alignment with the notice’s objectives. At this stage
the sponsors simply performed a single filter of the participants, then promoted
match-making events and distributed material with basic information about the
approved institutions. The aim of this first stage was to introduce institutions with
similar interests and technological solutions to each other in an organized and
secure way.
The second step involved encouraging leading companies to form consortiums with
SMEs, universities, technological institutes, etc. to provide an entire solution to one
or more of the problems mapped in the public tender notice. Wider scopes of
collaboration guaranteed more access to grants and better loan and investment
conditions. The main objective of this arrangement was to foster complete
innovative solutions (basic/applied research, technological development, testing
and initial marketing) on the part of the participants and financial support as
counterparts of the leading companies.
In the third phase, the sponsors divided the innovation and business plans sent by
consortiums into specific projects. Each project was directed to a specific
combination of instruments (grant, credit etc.) and sponsors (Finep, BNDES and/or
37
ANEEL) already approved on merit. The guarantees, certifications, legal issues and
other bureaucratic requirements were handled only by the specific sponsor of the
project. Each sponsor had its own internal rules to be observed by participants.
During the whole process, the selection of instruments, projects and supported
companies, universities and technological institutes was undertaken jointly by a
technical committee composed of managers of the sponsors: representatives of
BNDES and Finep sat on all committees, and people from BNDES, Finep and
ANEEL were members of those related to the Inova Energia program. Once
approved by a committee, the final arrangement was approved by each sponsor’s
board of directors.
Having a common general concept, process and governance can help the external
public better understand the innovative points of these programs, but each one
obviously has its own characteristics.
2.4.1. PAISS (2011)
The first of the Inova programs, launched even before the general Inova Empresa
Plan, the PAISS (Joint BNDES-FINEP Plan to Support Technological Industrial
Innovation in the Sugar-Energy and Sugar-Chemical Sectors) acted as a pilot
project of BNDES-Finep institutional cooperation in the Inova Empresa Plan.
The aim of this program was to support the development, production and sale of
new industrial technologies to process sugarcane biomass. The program had
specific subthemes that could be aggregated into three main areas, with all of them
exclusively using sugarcane biomass as raw material (FINEP; BNDES, 2011).
- 2nd generation (2G) bioethanol from sugarcane;
- New biochemical products from sugarcane; and
- Gasification of sugarcane biomass.
The motivations behind this option were the huge amount of residues (bagasse,
straw and leaves) produced by the first-generation bioethanol industry: 64%
sugarcane biomass or 415 million metric tons a year (FERREIRA-LEITAO et al.,
2010). The second-generation technology could increase Brazilian bioethanol
production by 50% with no additional land use (MILANEZ et al., 2015). Biogas
38
and other biochemicals could increase the added value of sugarcane and related
industrial sectors, mainly considering the biorefinery trends (MENDONÇA;
FONSECA; FRENKEL, 2017).
As usual, the PAISS program suffered from “first-mover effects”, and feedback
from the players involved was used to improve the others. The program’s budget
totaled US$ 600 million, with US$ 300 million from Finep and US$ 300 million
from BNDES (FINEP; BNDES, 2011).
2.4.2. Inova Energia (2013)
Following the changes that were occurring in the world electricity sector, Inova
Energia included ANEEL, the Brazilian electricity regulator, along with Finep and
BNDES to support innovation. This inclusion was critical because most of Brazil’s
electricity sector operates through a centralized system and this market is highly
regulated. ANEEL is also important in Brazilian R&D efforts because power
distribution companies have a legal obligation to invest in innovations.
Inova Energia had three macro objectives:
- To support the development and diffusion of technological solutions for
implementing smart grids in Brazil;
- To support the development and technological mastery of Brazilian
companies in the solar and wind energy value chain; and
- To support industrial development and integration in the hybrid/electrical
vehicle segment and foster greater energy efficiency in Brazil’s auto
industry.
These three goals were encapsulated into three specific lines, with a total of 10
subthemes. Here, we do not discuss each subtheme, merely the overall features.
The budget of the program was R$ 3 billion, with R$ 1.2 billion from Finep, R$ 1.2
billion from BNDES and R$600 million from ANEEL (FINEP; BNDES; ANEEL,
2013).
39
2.4.3. PAISS 2 - Agro (2014)
PAISS 2, also known as PAISS Agro, had objectives that complemented those of
the first PAISS. While PAISS focused on industrial solutions aimed at adding value
to, and increasing the productivity of, sugarcane bioproducts, PAISS 2 focused on
improving performance “outside and inside the gate”. PAISS 2 addressed the
following five lines (FINEP; BNDES, 2014):
- New varieties of sugarcane with more biomass and/or total recoverable
sugars (TRS);
- Equipment to improve sugarcane planting or harvesting;
- Systems for planning, managing and controlling sugar production;
- Biotechnology applied to sugarcane;
- Development of agro-industrial solutions and complementary varieties of
sugarcane.
Both PAISS and PAISS 2 brought Brazil “back into the game” in the advanced
biofuels world stage (NYKO et al., 2013). The PAISS 2 budget (Agro) totaled R$
1.48 billion, with R$740 million from Finep and another R$ 740 million from
BNDES.
2.5. Results and Discussion
Below we describe some of the most significant results of the application of our
framework to the case of the Inova programs, as summarized in Table 5 (note that
the results in gray refer to those that fully satisfy the requirements of a mission-
oriented program; those in yellow only partially meet the requirements, and those
in red do not satisfy any of them).
With respect to the first characteristic of an effective mission-oriented program,
‘alignment’ (see item 1 Table 4), we found that the Inova programs had
considerable alignment with the country´s macro policies (see Table 5). During the
Inova program period, Brazil had two major guidelines for economic/innovation
policies: the Greater Brazil Plan 2011-2014 (PBM), which acted as an industrial
policy (ABDI, 2014), and the National Science, Technology and Innovation
40
Strategy 2012-2015 (ENCTI) (BRAZIL, 2012). Both established renewable energy
as a national priority.
As regards the second necessary characteristic ‘having clear objectives’ (see item
2a, Table 4), according to the documents investigated, PAISS and PAISS 2 had
more specific goals and involved fewer technologies than Inova Energia. While
PAISS and PAISS 2 had closer thematic points, like “Optimization of pre-treatment
processes of sugarcane biomass for hydrolysis” (FINEP, 2011) and “New sugarcane
varieties with higher amounts of biomass and/or total recoverable sugars, with
emphasis on the use of transgenic enhancement” (FINEP, 2014), Inova Energia had
a broader approach, with thematic issues like “Support the development and
diffusion of electronic devices, microelectronics, systems, integrated solutions and
standards for the implementation of smart grids in Brazil” (FINEP, 2013). Despite
this, both objectives were very clear and their aim was to solve big questions (item
2b), such as changing the energy mix to be more sustainable (EPE, 2015; NYKO et
al., 2013; PARENTE, 2016; UFPE; CEPEL; CHESF, 2000). The large number of
new technologies (item 2c), and challenges established in Inova Energia was
noteworthy when compared with the literature’s recommendations.
The three programs were mainly focused on radical innovations (item 3a), but Inova
Energia had some incremental innovation challenges too, such as new equipment
to measure bidirectional electricity flows (FINEP; BNDES; ANEEL, 2013). In
addition, the three were more focused on generating new products (item 4),
processes and technologies instead of just improving or diffusing existing solutions
(FINEP, 2011, 2013, 2014).
The innovations demanded by PAISS, PAISS 2 and Inova Energia required a long
time frame (item 5 in Table 4 and results for this item in Table 5) to reach practical
results, but for different reasons. The two biggest players in biofuels market, the
U.S. and Brazil, have been investing in this technology since the 1970s (ALLAIRE;
BROWN, 2015; MILANEZ et al., 2015). The challenges of biotechnology and
advanced chemicals usually require a long time to overcome. For different reasons,
systemic changes in the energy mix, as expected in Inova Energia outputs, also
demand a longer-term view (BP, 2017; WWF; ECOFYS; OMA, 2011).
41
The role of government (item 6a) was critical throughout the process – setting
priorities, monitoring progress, and evaluating performance – of the three programs.
All the discussions and application of subsidies were carried out by national
agencies (Finep, BNDES or ANEEL) or ministries. The General Committee was
composed of representatives from five ministries important to the economy (Office
of the President, Finance, Science & Technology, Industry & Commerce, and Small
Business), and this committee was responsible for setting priorities, monitoring
overall progress and evaluating performance (BNDES, 2011; IEA/USP, 2013).
But regarding this point, we found an important difference when we compared the
Inova programs based on the documents investigated using our framework (Table
4) and other literature review findings. The literature strongly recommends that this
process be conducted in a centralized manner. The top governance of Inova
programs was conducted by five ministries and two agencies: Finep and BNDES
(Brazil, 2013). Operational issues, such as selecting and monitoring projects, were
dealt with by Finep and BNDES in PAISS and PAISS 2, and included ANEEL in
the case of Inova Energia. Each agency had its own internal approval process,
budget and other rules, which resulted in an increase in the programs’ management
complexity, as observed in the public tender notice in both cases.
“The support indicated in the Joint Support Plan will depend on compliance
with the usual processes of each sponsor institution, including technical,
finance, legal and guarantee analysis, as well as the approval, contracting
and follow-up processes.”
Finep, BNDES & ANEEL (2013, p. 3)
All their evaluation metrics (item 8) are in line with the literature, targeting specific
goals such as 2G ethanol enzymes or high-performance pretreatments in PAISS
(FINEP; BNDES, 2011), biotechnological seedling manipulation or new sugarcane
varieties with more biomass in PAISS 2 (FINEP; BNDES, 2014), and new
supercapacitor/battery technologies or thin film solar panels in the case of Inova
Energia (FINEP; BNDES; ANEEL, 2013).
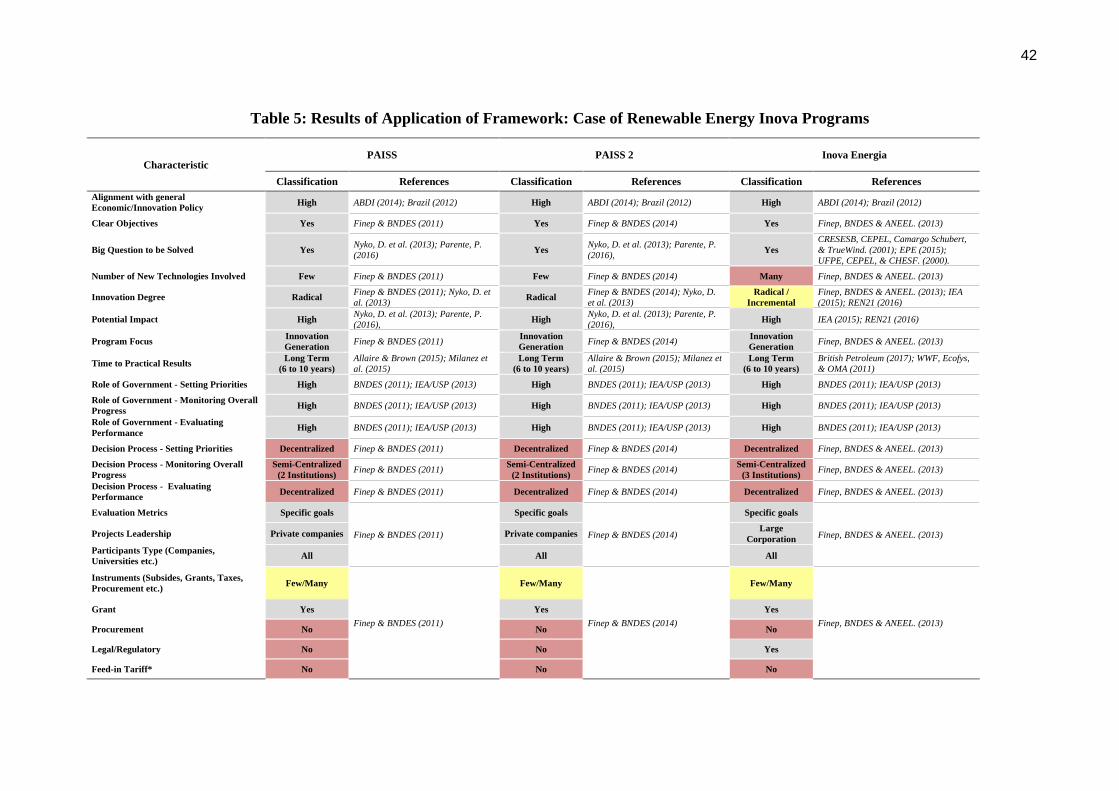
42
Table 5: Results of Application of Framework: Case of Renewable Energy Inova Programs
Characteristic PAISS PAISS 2 Inova Energia
Classification References Classification References Classification References
Alignment with general
Economic/Innovation Policy High ABDI (2014); Brazil (2012) High ABDI (2014); Brazil (2012) High ABDI (2014); Brazil (2012)
Clear Objectives Yes Finep & BNDES (2011) Yes Finep & BNDES (2014) Yes Finep, BNDES & ANEEL. (2013)
Big Question to be Solved Yes Nyko, D. et al. (2013); Parente, P.
(2016) Yes
Nyko, D. et al. (2013); Parente, P.
(2016), Yes
CRESESB, CEPEL, Camargo Schubert,
& TrueWind. (2001); EPE (2015);
UFPE, CEPEL, & CHESF. (2000).
Number of New Technologies Involved Few Finep & BNDES (2011) Few Finep & BNDES (2014) Many Finep, BNDES & ANEEL. (2013)
Innovation Degree Radical Finep & BNDES (2011); Nyko, D. et
al. (2013) Radical
Finep & BNDES (2014); Nyko, D.
et al. (2013)
Radical /
Incremental
Finep, BNDES & ANEEL. (2013); IEA
(2015); REN21 (2016)
Potential Impact High Nyko, D. et al. (2013); Parente, P.
(2016), High
Nyko, D. et al. (2013); Parente, P.
(2016), High IEA (2015); REN21 (2016)
Program Focus Innovation
Generation Finep & BNDES (2011)
Innovation
Generation Finep & BNDES (2014)
Innovation
Generation Finep, BNDES & ANEEL. (2013)
Time to Practical Results Long Term
(6 to 10 years)
Allaire & Brown (2015); Milanez et
al. (2015)
Long Term
(6 to 10 years)
Allaire & Brown (2015); Milanez et
al. (2015)
Long Term
(6 to 10 years)
British Petroleum (2017); WWF, Ecofys,
& OMA (2011)
Role of Government - Setting Priorities High BNDES (2011); IEA/USP (2013) High BNDES (2011); IEA/USP (2013) High BNDES (2011); IEA/USP (2013)
Role of Government - Monitoring Overall
Progress High BNDES (2011); IEA/USP (2013) High BNDES (2011); IEA/USP (2013) High BNDES (2011); IEA/USP (2013)
Role of Government - Evaluating
Performance High BNDES (2011); IEA/USP (2013) High BNDES (2011); IEA/USP (2013) High BNDES (2011); IEA/USP (2013)
Decision Process - Setting Priorities Decentralized Finep & BNDES (2011) Decentralized Finep & BNDES (2014) Decentralized Finep, BNDES & ANEEL. (2013)
Decision Process - Monitoring Overall
Progress
Semi-Centralized
(2 Institutions) Finep & BNDES (2011)
Semi-Centralized
(2 Institutions) Finep & BNDES (2014)
Semi-Centralized
(3 Institutions) Finep, BNDES & ANEEL. (2013)
Decision Process - Evaluating
Performance Decentralized Finep & BNDES (2011) Decentralized Finep & BNDES (2014) Decentralized Finep, BNDES & ANEEL. (2013)
Evaluation Metrics Specific goals
Finep & BNDES (2011)
Specific goals
Finep & BNDES (2014)
Specific goals
Finep, BNDES & ANEEL. (2013) Projects Leadership Private companies Private companies Large
Corporation
Participants Type (Companies,
Universities etc.) All All All
Instruments (Subsides, Grants, Taxes,
Procurement etc.) Few/Many
Finep & BNDES (2011)
Few/Many
Finep & BNDES (2014)
Few/Many
Finep, BNDES & ANEEL. (2013)
Grant Yes Yes Yes
Procurement No No No
Legal/Regulatory No No Yes
Feed-in Tariff* No No No
43
The three programs considered that all kinds of institutions (item 9b) (universities,
technology institutes, SMEs etc.) were eligible to send proposals, but each project
needed to be led by a private company. Inova Energia advanced in this issue and
proposals had to be led by a corporation with a minimum of resources to support
the project as an integrated solution, as is evident in the literature (CANTNER;
PYKA, 2001; ERGAS, 1987), and as is stated clearly in the official website of the
program.
“6.2. Lead Companies –Independent companies or those belonging to
business groups whose gross operating revenues are equal to or greater
than US$ 16 million, or total equity is greater than US$ 4 million in the last
fiscal year are eligible to submit Business Plan proposals. They can do so
individually or in partnership with companies of any size or with science
and technological institutions.”
Finep, BNDES & ANEEL (2013, p. 10)
This format is completely aligned with what is recommended in the literature, and
helped to increase the breadth and robustness of proposed solutions.
Lastly, these Inova programs had a good set of financial instruments, such as grants,
subsidized loans and equity options, but they were restricted to merely financial
instruments (FINEP, 2011, 2014). Inova Energia had the R&D expenditure
obligation specified by ANEEL, but in practical terms this was very similar to a
financial instrument (FINEP, 2013). According to the literature, the most important
instruments for mission-oriented programs are grants, procurement and
legal/regulatory incentives (items 10a, 10b, 10c). The Inova programs were not able
to incorporate procurement or substantial legal/regulatory incentives and provided
smaller grants than the other financial instruments – 73.4% of the available funds
were subsidized loans (BRAZIL, 2013).
Table 5 reveals that most mission-oriented constructs were used by the Inova
programs to reach their goals, including the main ones: alignment with major
policies, clear targets, and radical innovation generation. However, the
decentralized governance of the programs and their lack of integration with
legal/regulatory and procurement instruments deserve some attention. Together,
they constitute two important operational points that could have caused the
programs to deviate from their planned route.
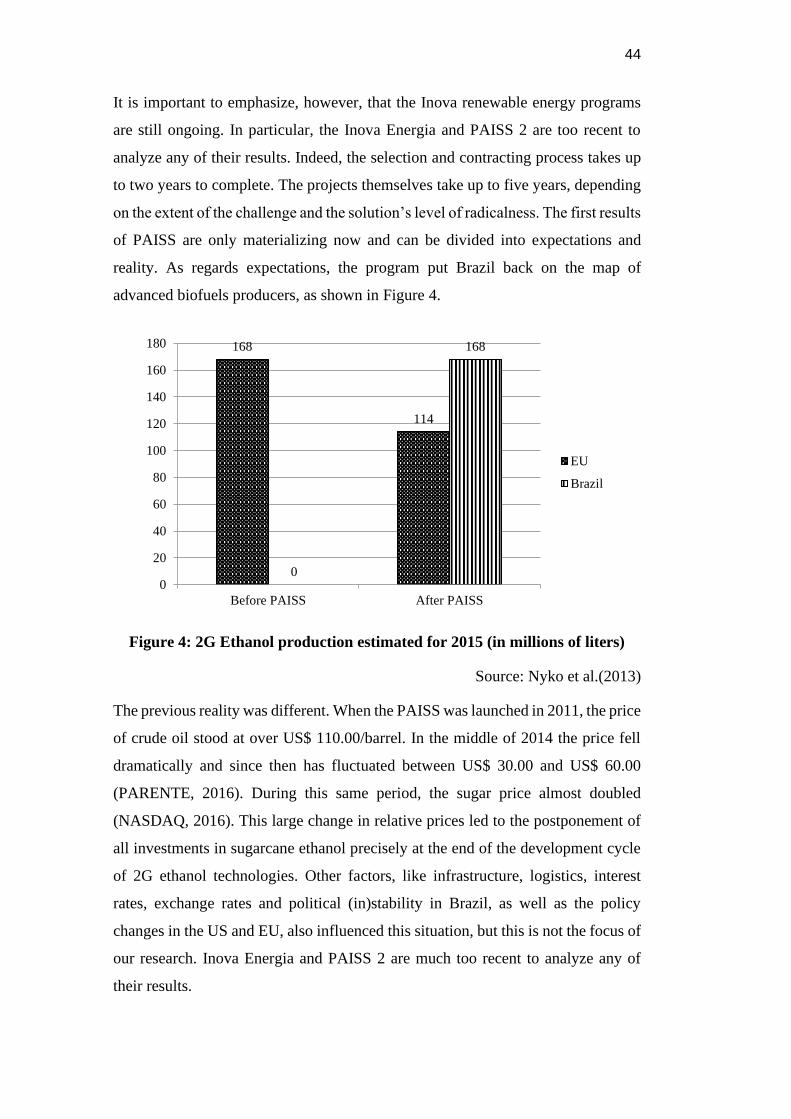
44
It is important to emphasize, however, that the Inova renewable energy programs
are still ongoing. In particular, the Inova Energia and PAISS 2 are too recent to
analyze any of their results. Indeed, the selection and contracting process takes up
to two years to complete. The projects themselves take up to five years, depending
on the extent of the challenge and the solution’s level of radicalness. The first results
of PAISS are only materializing now and can be divided into expectations and
reality. As regards expectations, the program put Brazil back on the map of
advanced biofuels producers, as shown in Figure 4.
Figure 4: 2G Ethanol production estimated for 2015 (in millions of liters)
Source: Nyko et al.(2013)
The previous reality was different. When the PAISS was launched in 2011, the price
of crude oil stood at over US$ 110.00/barrel. In the middle of 2014 the price fell
dramatically and since then has fluctuated between US$ 30.00 and US$ 60.00
(PARENTE, 2016). During this same period, the sugar price almost doubled
(NASDAQ, 2016). This large change in relative prices led to the postponement of
all investments in sugarcane ethanol precisely at the end of the development cycle
of 2G ethanol technologies. Other factors, like infrastructure, logistics, interest
rates, exchange rates and political (in)stability in Brazil, as well as the policy
changes in the US and EU, also influenced this situation, but this is not the focus of
our research. Inova Energia and PAISS 2 are much too recent to analyze any of
their results.
168
114
0
168
0
20
40
60
80
100
120
140
160
180
Before PAISS After PAISS
EU
Brazil
45
As a country, Brazil has the potential to be a big global player in terms of renewable
energy. Its continental dimensions, high incidence of solar radiation, the unexplored
wind and hydro power potential, and the urban and agricultural biomass surplus, all
place it in a privileged position in the renewable energy market.
The aim of PAISS, PAISS 2 and Inova Energia was not only to bring to Brazil the
application of renewable energy generation, but also to boost these industries’
innovations and production chains. They were a great advance in terms of
innovation policies in Brazil, and the integration of financing instruments and
federal institutions in the same direction was unprecedented and desirable. But
despite this great alignment of objectives, some issues limited the programs’ reach,
notably the design of their governance and lack of critical instruments.
As regards the instruments, most funds were composed of subsidized loans
(73.4%), a policy instrument that is not fully appropriate for radical and high-risk
innovations. The low level of grants available put a cap on the programs’ ambitions.
In 2011 alone, the US Department of Defense (DoE) provided 68 times more grants
than the sum of PAISS, PAISS 2 and Inova Energia grants during the whole process
(ANADÓN, 2012; BRAZIL, 2013).
The lack of formal integration with regulatory, procurement and fiscal efforts is a
point that should be observed in future efforts. During the period, some of the
government’s actions were even at odds with incentives for biofuel and renewable
electricity sources: coal/gas thermoelectricity auctions (to provide emergency
energy security) or gasoline prices artificially kept at low levels (to control
inflation) are two examples.
The governance of the programs could be improved according to the identified
benchmarks. The number of institutions setting priorities, monitoring the process
and evaluating performance delayed the process and made priority investments and
project integration less effective than they could have been. In the Inova Energia
case, the scope became wider than it should have been to foster a real transformation
in the sector. The lack of integration of the operational systems and processes of
Finep, BNDES and ANEEL also hampered integration efforts.
46
One of the programs’ strong points was the collaborative design of phases. In each
selection step the participant could build new relationships. Official events,
workshops and technology supply books helped the participants to establish
cooperation agreements and improved their projects during the process. This
suggests alignment between mission-orientation and open innovation
(CHESBROUGH, 2003a) concepts.
As mentioned in the literature review, it is important to address specifically the case
of biofuels. Brazil had success in this respect starting in the 1970s, when the
mission-oriented Proálcool program created complete infrastructure for sugarcane
ethanol consumption (from sugarcane planting to ethanol sale at the pump). In this
respect, the flex-fuel powertrains developed at the beginning of the 2000s also
deserve attention (MAZZUCATO; PENNA, 2016). It is relevant here that PAISS
and PAISS 2 helped to provide the sector with a new direction, aimed at increasing
productivity and international competitiveness.
In the electricity sector, Inova Energia contributed with some important technology
inputs, although in the nationally integrated electricity grid, the critical issue is
regulation. The role of energy auctions and smart grid rules were much more critical
to accomplishing the program’s mission than the technologies themselves. In the
case of the electric/hybrid vehicle powertrains and batteries line, the main question
was the difficulty of setting national priorities. The pre-salt hydrocarbon
discoveries, incentives for biofuels (including PAISS and PAISS 2) and the strategy
of multinational automobile companies in Brazil (they preferred to keep their
electric vehicle R&D efforts at home) sent contradictory signals to investors in this
sector.
2.6. Suggestions for Future Research and Limitations
The main contribution of this study is to be a starting point to formulate, classify,
assess and evaluate concluded, operating or future mission-oriented renewable
energy programs. Therefore, suggestions for future research are particularly
relevant.
47
One point that should be emphasized is the fact that out of the 189 authors found,
only six had more than one article published on the subject in question. This may
have to do with a lack of specialists, of consensus or of interest in this field, reasons
that could be investigated in future studies, such as longitudinal investigations into
the results of not only Inova programs, but also renewable energy mission-oriented
programs in other countries.
Another suggestion is the application of the proposed framework (Table 4) to help
evaluate the impact and results of the Inova programs, or compare the biofuels
mission-oriented programs in Brazil, United States, Europe, China and other
countries. Correlating the results of such assessments and comparisons with
innovation or climate-change mitigation results from a longitudinal perspective
would be particularly interesting.
We also recommend that when applying the framework in other countries to gain
insights for policymakers, comparisons between countries should consider different
institutional contexts.
The advances in knowledge, even if the mission goals are not reached, and the
adequate time to reach each goal, are other important issues to be discussed in a
much deeper analysis of renewable energy programs from a mission-oriented
perspective.
Evaluating not only the program, but also agencies’ internal processes, including
management, competencies and technical expertise, could provide new insights into
the coordination, monitoring and instrumental operation design. This would enable
better identification of the strengths and weaknesses of these programs.
A survey to transform the qualitative analysis of mission-oriented constructs into a
quantitative one could contribute to a better understanding of the factors involved
and produce more finely tuned suggestions.
Last, but not least, the combination of mission-orientation and open innovation
concepts could help find new relevant constructs for mission-oriented programs in
the energy transition scenario.
48
Our study had some limitations. The parameters of some mission-oriented
constructs could be better defined through a structured survey using a Likert scale.
Another limitation has to do with the evaluation of the programs’ results, a
particularly important issue, although this was not the focus of our article. The
evaluation process is not formalized or described in the literature, or in official
documents or reports. Obviously, the task of establishing a cutoff point for mission
accomplishment and of evaluating the externalities of these programs has become
harder. In the Inova programs, for example, two significant exogenous factors also
create some noise in program evaluation: the dramatic drop in oil prices since 2014
and the current economic and institutional crisis in Brazil, which began at the end
of 2015.
2.7. Conclusions
Our main objective was to propose a framework developed to verify to what extent
renewable energy programs have the characteristics of mission-oriented programs,
and thus to contribute to the effectiveness of renewable energy innovation policies.
The case of Brazil and its Inova programs was used as an example of how to apply
this framework. The wider objective was to help with the formulation, comparison
and evaluation of renewable energy mission-oriented programs also in other
countries and contexts.
We started our research with an extensive literature review to find the general and
renewable energy specific characteristics of mission-oriented programs with a view
to developing the framework (Table 4). Next, we used the data from reports, studies,
official documents, official websites, public notices etc. regarding the three most
recent renewable energy mission-oriented policies in Brazil – the Inova programs -
to illustrate how the framework can be applied.
More than an analysis of the three programs addressed in the research, our study
sought to consolidate knowledge on the characteristics of mission-oriented
programs. This type of public policy has great appeal for applications that involve
major challenges, which are complex and require extensive multi-institutional
coordination. The framework (Table 4) was developed for application to any energy
49
mission-oriented program. In fact, it was developed as an analytical tool to be used
by public policymakers who are dealing with challenges of this nature in the energy
sector without being restricted to a specific country. We believe this is the main
contribution of this research.
However, depending on the country, some adjustments may have to be made to our
framework. In this respect, where the energy sector is concerned the discussion of
the support instruments (item 10 of Table 4) is fundamental. Indeed, the presence
of specific regulations and the commodity characteristic of the sector can enable,
or restrict, a specific group of new instruments such as tariff incentives, restrictions
on the use of polluting energy sources or government purchases. It is necessary to
identify the set of instruments that is appropriate for the energy policy of each
country, considering its demographic, geographic, political and economic
characteristics. Mission-oriented programs for countries with large biomass
production such as Brazil, India and the United States are likely to be quite different
from those in countries with a larger presence of nuclear energy such as France,
coal like China and South Africa, or oil and natural gas like Russia. From the
portfolio of public policy instruments, choices appropriate to national contexts can
make the difference between a successful or unsuccessful program in the context of
the transition to a low carbon economy.
50
3 ENERGY STARTUPS: IDENTIFYING WINNING STANDARDS DURING THE ENERGY TRANSITION
Abstract
Similarly to what happened to the communications sector during the internet
revolution, startups may have a pivotal role in the energy sector during the current
energy transition to a low-carbon economy. The particularities of energy startups,
however, mean that the growth model based on venture capital investments, which
leveraged digital startups of the beginning of the 21st century, may not work equally
well for clean energy startups. Thus, this article aims to identify the patterns
associated with the success of energy startups in the last 20 years and develop a
predictive model utilizing logistic regression. Results show that there are, in fact,
some identifiable standards among the winners, such as the volume of resources
previously received and their foundation date. However, being linked to
sustainability or having received corporate or angel investments were not found to
be determining factors for the success of energy startups in the period.
3.1. Introduction
The challenge of climate change is posed as one of the greatest concerns of the
present time. Environmental, economic and social impacts of climate change have
mobilized governments and other stakeholders, with 170 countries ratifying the
Paris Climate Agreement (UNFCC, 2017).
Several sectors of the economy will undergo structural changes due to the
worldwide striving to contain the temperature increase, and the energy sector is
pivotal in this matter. The International Energy Agency (IEA, 2016) predicts that
53% of the efforts to reduce CO2 emissions after the signature of the Paris
Agreement will involve, directly or indirectly, the energy sector. In this scenario,
technological changes will be especially relevant for the elaboration of new climate
policies (RAO; KEPPO; RIAHI, 2006). The generation of energy from renewable
sources (e.g., solar, wind, etc.), new arrangements and business models resulting
51
from the utilization smart grids, the use of distributed energy, and new industrial
paradigms, such as electric automotive motorization and advanced manufacturing,
may have a substantial impact on the conformation to a new worldwide energy
matrix. (GREENPEACE, 2015; UNEP; BLOOMBERG; FRANKFURT SCHOOL,
2016).
The process of change in the energy sector toward a model of low carbon emissions
has been called “energy transition” (LIVIERATOS; LEPENIOTIS, 2017; POLZIN
et al., 2015). However, while there is some agreement regarding a new energy
matrix that is less dependent on fossil fuels, there is no consensus about the velocity
of this transition, or in which ways it can be carried out. The lack of consensus
concerning the velocity of this transition can be exposed by the gap between
different predictions on the level of participation of renewable energy in the total
global generation. While British Petroleum (2017) predicts a 16% share of
participation of renewable energy in the global generation by 2035, Ecofys (WWF;
ECOFYS; OMA, 2011) predicts a scenario where 57% of the world’s demand for
energy will be supplied by renewable sources by the same year.
In this scenario, independently of the rate of change, the energy transition will
involve investments of trillions of dollars in the next years. Investments on the
energy sector reached US$ 1.7 trillion in 2016, in which US$ 724 billion were
destined in renewable energy, electric grids and energetic efficiency (IEA, 2017).
At the same time, the share of investments on fossil fuels fell from 68.9% in 2014
to 57.1% in 2016, a 17.1% decline in only two years (IEA, 2017).
In this light, the problem of efficient investment allocation becomes increasingly
relevant, not only from the social-environmental aspect but also from an
economical perspective. Thus, the role of startups, by developing new technologies
and novel business models, is a prominent one. The optimization of resources that
will be invested in them is, then, a important issue and it should be better
understood. Thereby, the objective of this article is to develop a predictive statistical
model that is able to identify the factors the influence the success or failure of
energy startups.
52
3.2. The Role of Startups on the Energy Transition
It is possible to draw some analogies of the current period of energy transition with
the changes underwent by the communication sector around 20 years ago. At that
time—the end of the 1990’s and the beginning of the 2000’s—there was some
consensus among the stakeholders of the communication sector that their business
could change substantially, from a “few to many” paradigm (newspapers, radio and
TV stations) to “many to many” paradigm, with the diffusion of the internet.
However, it was difficult to predict how, and in which proportion and speed, the
changes propelled by the internet would affect the current models of television,
radio and newspapers at the time.
History has shown that, in the communication sector transition, startups had a
fundamental role, bringing new technologies and novel business models that altered
the paradigms of the sector. At the same time that startups were leading these big
changes, the established firms could not adapt to the new and dynamic landscape,
falling in the incumbent's trap and being disrupted by innovations that they could
not foresee (CHRISTENSEN; RAYNOR, 2003). Today, out of the ten most
valuable companies in the world (in market capitalization), four — Amazon (1994),
Google/Alphabet (1998), Tencent (1998) e Facebook (2003) — were startups
created in that period.
Eric Ries (2011, 37) defines startup as “a human institution designed to create a
new product or service under conditions of extreme uncertainty”. When the concept
is applied to the energy sector, it is possible to imagine that some startups will be
able to reach a prominent position, taking advantage of the period of uncertainty
and the context of change that involves the energy transition.
Some researchers and recent sectorial studies indicate a fairly high probability of
startup companies achieving prominent roles in the energy sector (DONADA;
LEPOUTRE, 2016; GLOBAL CORPORATE VENTURING, 2016; KPMG, 2015;
LIVIERATOS; LEPENIOTIS, 2017). Other studies point out that incumbent firms
could learn some of the attributes that are characteristic of startups (BIERWERTH
et al., 2015; DUSHNITSKY; LENOX, 2005; LEE; KANG, 2015), thus being able
to conduct the energy transition themselves. A third opinion highlights that the
cooperation of established firms and startups, usually called corporate venturing,
53
can also be an interesting strategy (LIVIERATOS; LEPENIOTIS, 2017;
NARAYANAN; YANG; ZAHRA, 2009).
In each case: (1) the accelerated growth of startups; (2) the learning by the
incumbents, and (3) the cooperation between startups and stablished firms, it is
important to understand the elements that differ a successful startup from a failed
one. This issue is particularly relevant in the renewable energy sector (and to other
clean technologies) since the investments of venture capital, the leading model to
finance startup growth, are often questioned regarding the results obtained in the
energy sector (GADDY et al., 2017; MARCUS; MALEN; ELLIS, 2013).
3.3. Characteristics of Energy Startups
An energy startup is defined in this article as a startup that operates in some link in
the chain of generation, transmission, distribution or commercialization of energy.
In addition, we consider as energy startups those which operate in an adjacent chain,
whose innovations may substantially affect the supply or demand of future energy,
such as energy efficiency initiatives, electric/hybrids automobiles, or advanced
stationary batteries.
In general, energy startups possess characteristics that differentiate them from
typical software and internet startups (digital startups), which are usually covered
in the literature. Understanding these differences is fundamental for the elaboration
in our predictive model (GADDY et al., 2017; MARCUS; MALEN; ELLIS, 2013).
Although there are exceptions, the first differentiating feature of energy startups is
the high need for capital from its early stages. A digital startup, in general, can start
with a smaller volume of resources and increasingly capture the additional
resources necessary for its growth through several rounds of investments
(DAVILA; FOSTER; GUPTA, 2003; KIM; WAGMAN, 2014; LAHR; MINA,
2016; RIES, 2011). Energy startups, on the other hand, typically require a greater
amount of resources, even at the beginning of their operations, as they are usually
associated with physical assets, which are more complex and costly to scale than
54
businesses that rely only on data (MARCUS; MALEN; ELLIS, 2013; VOLANS,
2014).
A second important feature refers to the maturation period. Because of the high
scalability potential of internet-based businesses, they tend to have shorter business
cycles when compared to energy startups (LIVIERATOS; LEPENIOTIS, 2017;
VOLANS, 2014). Thus, the need for patient capital (WEST, 2014) is another key
element for the success of energy startups (MARCUS; MALEN; ELLIS, 2013;
MOORE; WUSTENHAGEN, 2004).
As a contrast to the increased capital needs and longer investment cycles, energy
startups have better access to a rare and precious resource type for innovative and
high-risk initiatives: grants. Because the new technologies associated with the
energy transition are likely to produce positive externalities, energy startups have
the possibility of being supported by governments and philanthropic institutions
through various forms of subsidies (ABDMOULEH; ALAMMARI; GASTLI,
2015; FORAY; MOWERY; NELSON, 2012; GLENNIE; BOUND, 2016;
GRECO; LOCATELLI; LISI, 2017; VEUGELERS, 2012; WORLD ECONOMIC
FORUM, 2016).
The demands of larger investments along with the long payback rates create barriers
to both entry and exit of new actors. While both markets are large and global, the
number of active energy startups is 12 times lower than that of software startups
(CRUNCHBASE, 2019). The greater technological intensity present in the energy
startups also acts as a barrier to entry, since this kind of business is based on more
complex technical knowledge (GRECO; LOCATELLI; LISI, 2017; LIVIERATOS;
LEPENIOTIS, 2017).
The profile of energy startups entrepreneurs is also different from the typical profile
of digital entrepreneurs. Digital startups, because they are more intensive in hours
of work / dedication and less in initial capital volume and advanced technical
knowledge, are very attractive options for young entrepreneurs (MORONI;
ARRUDA; ARAUJO, 2015; RIES, 2011; SPENDER et al., 2017; TIDD;
BESSANT; PAVITT, 2005). For the opposite reasons, entrepreneurs of energy
startups tend to be former executives of companies in the sector or researchers with
55
expertise in the area (TEPPO; WÜSTENHAGEN, 2009; UNEP; BLOOMBERG;
FRANKFURT SCHOOL, 2016).
Another point to be highlighted regarding the differences between energy startups
and digital ones is that the former usually act in regulated environments. The energy
market is regulated, with different degrees of intensity, in virtually all countries.
That partially limits the speed of diffusion of technologies and increases the costs
of market entry. Some researchers pose that the regulatory framework is among the
most important issues in the debate on the introduction and diffusion of new
technologies in the energy sector (ALMEIDA et al., 2017; ANADÓN, 2012;
MARCUS; MALEN; ELLIS, 2013; OLMOS; RUESTER; LIONG, 2012; UNEP;
BLOOMBERG; FRANKFURT SCHOOL, 2016).
Understanding the particular characteristics of energy startups is vital for the
identification of the factors that affect the performance of these startups. Also, it
becomes a prerequisite for a more accurate understanding of how to properly
evaluate the performance of startups and their possible value appreciation on the
long-term.
3.4. Determining Factors for the Performance of Energy Startups
During the Energy Transition
An energy transition is defined as a structural and long-term change in energy
systems, which, in a historical perspective, may have happened in other occasions
and in different manners (SMIL, 2010). This article refers only to the current
transition, resulting from global efforts, from the late twentieth and early twenty-
first century, to achieve a low carbon economy (HUISINGH et al., 2015; IEA, 2017;
OLMOS; RUESTER; LIONG, 2012).
Having defined the general context, it is necessary, for the construction of the
predictive model, to determine the main general and specific factors that can
determine success and failure. In this article, we organize these factors into one
general hypothesis and four specific hypotheses, whose validation depends on the
first one. The general hypothesis can be defined as:
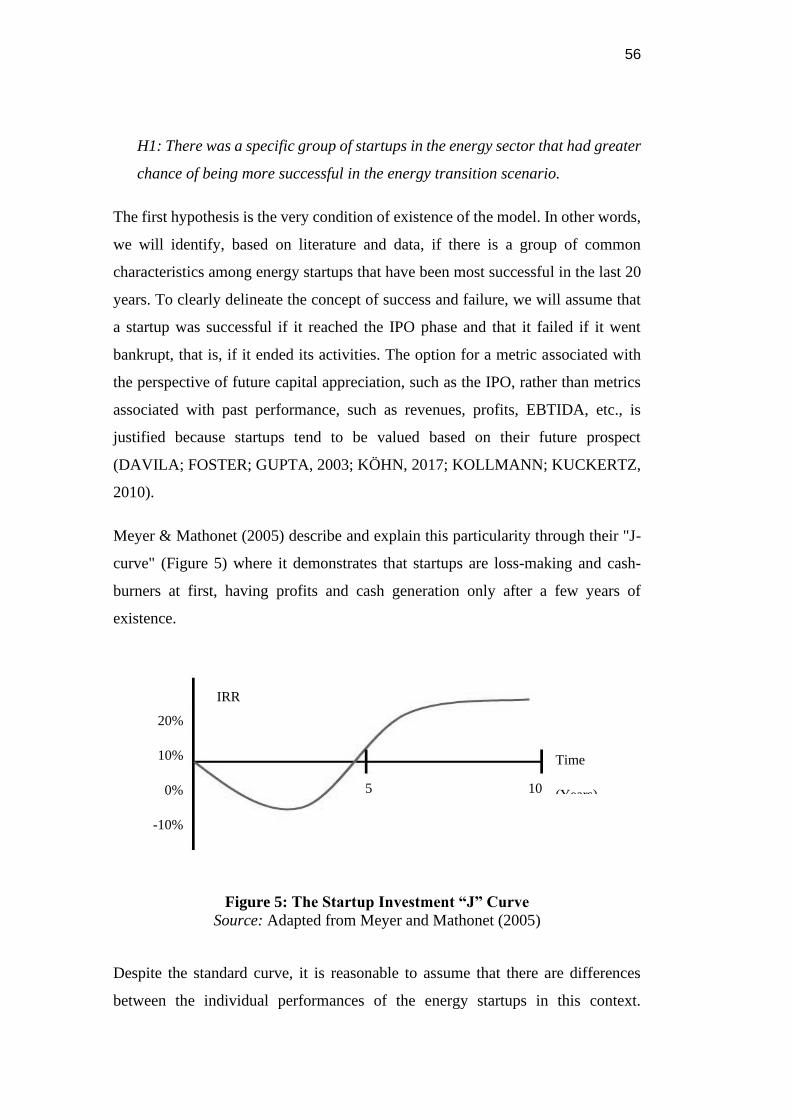
56
H1: There was a specific group of startups in the energy sector that had greater
chance of being more successful in the energy transition scenario.
The first hypothesis is the very condition of existence of the model. In other words,
we will identify, based on literature and data, if there is a group of common
characteristics among energy startups that have been most successful in the last 20
years. To clearly delineate the concept of success and failure, we will assume that
a startup was successful if it reached the IPO phase and that it failed if it went
bankrupt, that is, if it ended its activities. The option for a metric associated with
the perspective of future capital appreciation, such as the IPO, rather than metrics
associated with past performance, such as revenues, profits, EBTIDA, etc., is
justified because startups tend to be valued based on their future prospect
(DAVILA; FOSTER; GUPTA, 2003; KÖHN, 2017; KOLLMANN; KUCKERTZ,
2010).
Meyer & Mathonet (2005) describe and explain this particularity through their "J-
curve" (Figure 5) where it demonstrates that startups are loss-making and cash-
burners at first, having profits and cash generation only after a few years of
existence.
Figure 5: The Startup Investment “J” Curve
Source: Adapted from Meyer and Mathonet (2005)
Despite the standard curve, it is reasonable to assume that there are differences
between the individual performances of the energy startups in this context.
20%
10%
0%
-10%
5 10
IRR
Time
(Years)
57
However, it is necessary to test whether performance differences obey an
observable standard or are in fact random, which would validate the hypothesis that
there is at least one group with the best observable performance, and that this group
has common identifiable characteristics.
H2: Startups linked to renewable energy and sustainability, or to new business
models, tend to perform better in the energy transition scenario.
The literature on the current energy transition has strongly associated this process
with the underlying concepts of sustainability (GREENPEACE, 2015; LIEDTKE
et al., 2015), clean energy (ALMEIDA et al., 2017; FARFAN; BREYER, 2017)
and energy efficiency (ALEXANDER et al., 2012; WWF; ECOFYS; OMA, 2011).
The IEA predicts that by 2035 the energy sector will account for 39% of direct
efforts to reduce CO2 emissions (power generation) plus 14% through indirect
efforts in the transportation, manufacturing and civil construction sectors (IEA,
2014, 2016), being responsible for more than half of the world's efforts in the
transition to a low-carbon economy. Considering that US$ 724 billion, resulting
from a bullish trend, were invested in renewable energy, electricity grids and energy
efficiency in 2016, and that the relative share of fossil fuels in investments fell from
68.9% in 2014 to 57.1 % in 2016, a deceleration of 17.1% in just two years (IEA,
2017), we can consider sustainability as central and a trend of the current process
of energy transition.
Another trend observed, which is closely linked to the concept of digital startups,
are smart grids and distributed generation. Advancements regarding solar energy;
sensors, predictive algorithms / artificial intelligence; energy storage systems;
internet of things, smart homes / offices, blockchain - among others
(CHESBROUGH, 2012; CHRISTIDIS; DEVETSIKIOTIS, 2016; LIVIERATOS;
LEPENIOTIS, 2017) have allowed for the entry of new players and the advent of
new business models for the energy sector, mainly related to residential and
commercial demands. Electromobility and transport digitization are also pointed
out as trends with growth prospects (ALEXANDER et al., 2012; DONADA;
LEPOUTRE, 2016; GREENPEACE, 2015; IEA, 2016; KPMG, 2016) and which
can indirectly influence the energy matrix, especially when considering the ongoing
58
changes in road transport, which now account for 90% of all energy consumption
with transportation at the global level (GREENPEACE, 2015).
The above factors indicate that new business models and businesses related to
sustainability tend to have a greater perspective of future value appreciation, and
consequently, better overall performance.
H3: Startups located in countries where the innovation environment for
cleantechs is more developed have better performance.
Geographic location is crucial for a series of starting conditions for a new business
such as: regulatory efficiency, potential market size and access to capital that an
energy enterprise has at its disposal at the beginning of its journey
(AMANATIDOU et al., 2014; FARFAN; BREYER, 2017; UNEP;
BLOOMBERG; FRANKFURT SCHOOL, 2016; WORLD ECONOMIC FORUM,
2016). Such conditions, which may act as barriers or incentives to new entrants, are
especially relevant for startups who, especially in the ideation phase, have low exit
barriers.
Still on localization, from the point of view of knowledge, the literature highlights
advantages for businesses close to poles of excellence in technologies related to
products and services offered by startup (ANADÓN, 2012; MARCUS; MALEN;
ELLIS, 2013; WEST, 2014). These advantages are mainly due to the intensification
of knowledge generation in the local network, the associated R&D infrastructure
and the availability of qualified human resources to initiate and support startup
growth.
This set of local preconditions regarding the business and technology environment
form the so-called "innovation and entrepreneurial ecosystems" (BUDDEN;
MURRAY, 2017). Startups are embedded in such ecosystems, which are also
highlighted as an important and influential factor in the performance of startups of
virtually all sectors (HERMANN et al., 2015). In this sense, Teece, Pisano, & Shuen
(1997) point out that local and regional forces shape the skills and capabilities of
the firms, especially in the early stages.
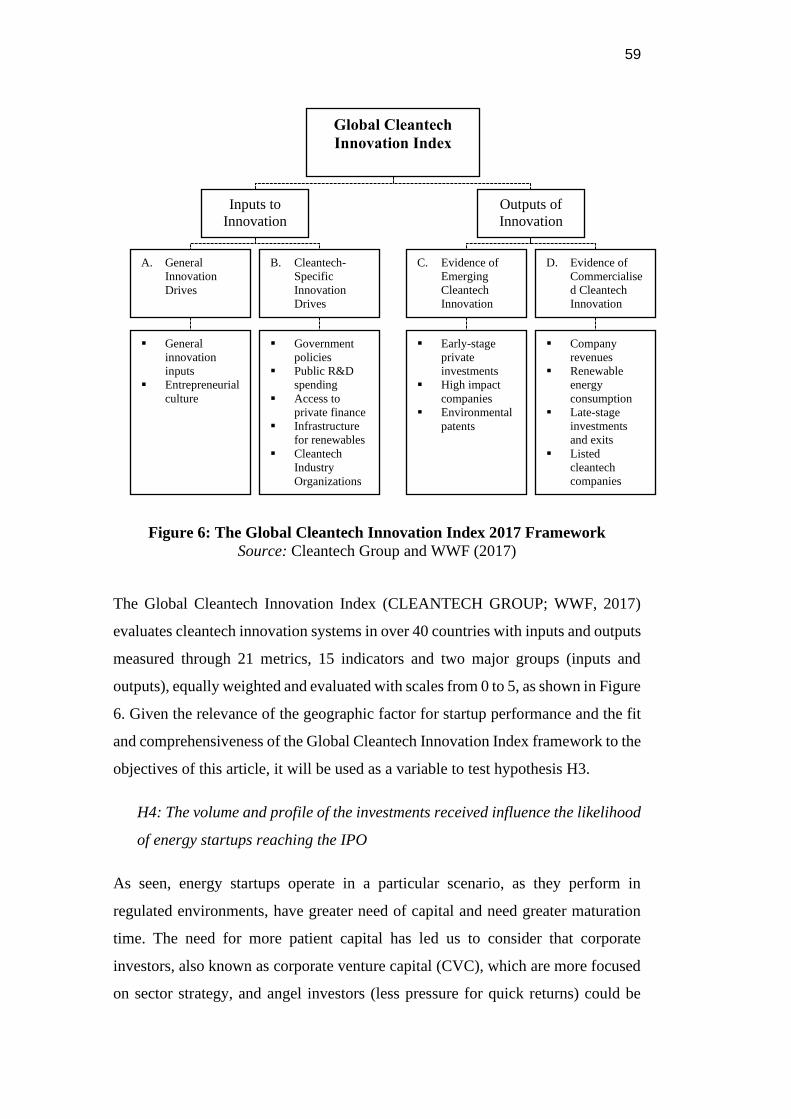
59
Figure 6: The Global Cleantech Innovation Index 2017 Framework
Source: Cleantech Group and WWF (2017)
The Global Cleantech Innovation Index (CLEANTECH GROUP; WWF, 2017)
evaluates cleantech innovation systems in over 40 countries with inputs and outputs
measured through 21 metrics, 15 indicators and two major groups (inputs and
outputs), equally weighted and evaluated with scales from 0 to 5, as shown in Figure
6. Given the relevance of the geographic factor for startup performance and the fit
and comprehensiveness of the Global Cleantech Innovation Index framework to the
objectives of this article, it will be used as a variable to test hypothesis H3.
H4: The volume and profile of the investments received influence the likelihood
of energy startups reaching the IPO
As seen, energy startups operate in a particular scenario, as they perform in
regulated environments, have greater need of capital and need greater maturation
time. The need for more patient capital has led us to consider that corporate
investors, also known as corporate venture capital (CVC), which are more focused
on sector strategy, and angel investors (less pressure for quick returns) could be
Global Cleantech
Innovation Index
Inputs to
Innovation Outputs of
Innovation
A. General
Innovation
Drives
B. Cleantech-
Specific
Innovation
Drives
C. Evidence of
Emerging
Cleantech
Innovation
D. Evidence of
Commercialise
d Cleantech
Innovation
▪ General
innovation
inputs
▪ Entrepreneurial
culture
▪ Government
policies
▪ Public R&D
spending
▪ Access to
private finance
▪ Infrastructure
for renewables
▪ Cleantech
Industry
Organizations
▪ Early-stage
private
investments
▪ High impact
companies
▪ Environmental
patents
▪ Company
revenues
▪ Renewable
energy
consumption
▪ Late-stage
investments
and exits
▪ Listed
cleantech
companies
▪ Employees
60
more desirable by these startups than financial investors, such as banks and
independent venture capital funds (IVCs), which yearn for faster returns and must
justify the allocation of their resources to their shareholders (CZARNITZKI; DICK;
HUSSINGER, 2010; GUO; LOU; PÉREZ-CASTRILLO, 2015; LIVIERATOS;
LEPENIOTIS, 2017; VOLANS, 2014).
On the amount and volumes invested, it is expected that startups that have received
more resources and more pre-IPO investment rounds will be more successful, since
energy startups generally depend on a longer cycle and they need more capital to
both start and maintain their operation (MARCUS; MALEN; ELLIS, 2013; WEST,
2014). Thereby, it is possible to consider that both the quantity and the possession
of a patient capital profile of investments can positively influence the performance
of energy startups.
H5: The date of the startup’s foundation influences its performance.
As discussed earlier, the growth of an energy startup tends to be slower than that of
typical digital startups (MARCUS; MALEN; ELLIS, 2013; MOORE;
WUSTENHAGEN, 2004; WEST, 2014). Thus, an older energy startup is expected
to have had more time to mature its investment and turn it into value.
Another factor that may be associated with the relationship between the foundation
date and the performance of energy startups is the consolidation of large agreements
and public policies (HAHN; YU, 1999; IPCC, 2014), mainly related to sustainable
development and climate change. The energy transition has been driven in large
part by major sustainability milestones such as the Kyoto Protocol and the recent
Paris Agreement, as well as local government incentives / benefits. The association
of the moment of foundation, traction, IPO, or the termination of energy startups
may be correlated with the start and end dates of these policies and agreement.
Finally, having defined the theoretical factors that can influence energy startups in
the context of energy transition, we can develop the method capable of testing the
associated hypotheses and develop a predictive model capable of pointing out some
observable patterns in the last 20 years, which may be used by investors, managers
and policy makers in the coming years.
61
3.5. Method
The methodological approach for the elaboration of the predictive model of this
study was based on the technique of binary logistic regression. Such a technique is
appropriate for dividing samples into two distinct groups by considering a set of
independent variables and their relations to a dichotomous dependent variable
(HAIR JR et al., 2010).
In our specific case, the primary interest is to identify the common factors regarding
the energy startups founded in the last 20 years that reached the IPO (success) that
differentiate them from the startups of energy that ended their activities (failure) in
the same period. For this, the study was developed with the following steps:
Step 1: Selection of independent variables based on the literature and
hypotheses formulated.
Step 2: Collection and treatment of data regarding energy startups founded
in the last 20 years that also made IPOs or ended their activities in the period.
Step 3: Exploratory factor analysis to reduce the complexity of the model,
and the treatment of eventual problems of correlation between the variables.
Step 4: Execution of the logistic regression method to identify the factors
that were the most influential for the success (IPO) or failure of the energy
startups.
Step 5: Analysis of the predictive capacity of the model as well as the
variables that are individually related to the success or failure of the startups.
In Step 1, based on factors identified in the literature, we selected 10 independent
variables whose coefficient estimates allow for the testing of the research
hypotheses. Table 6 shows the selected variables and operational definitions that
were used in the study.
Each variable or set of variables was selected with the objective of testing one or
more of the established hypotheses and their respective trends observed in the
literature on startups and energy transition. The values of the "Sustain" and
"NBModel" variables were filled using the Crunchbase database (CRUNCHBASE,
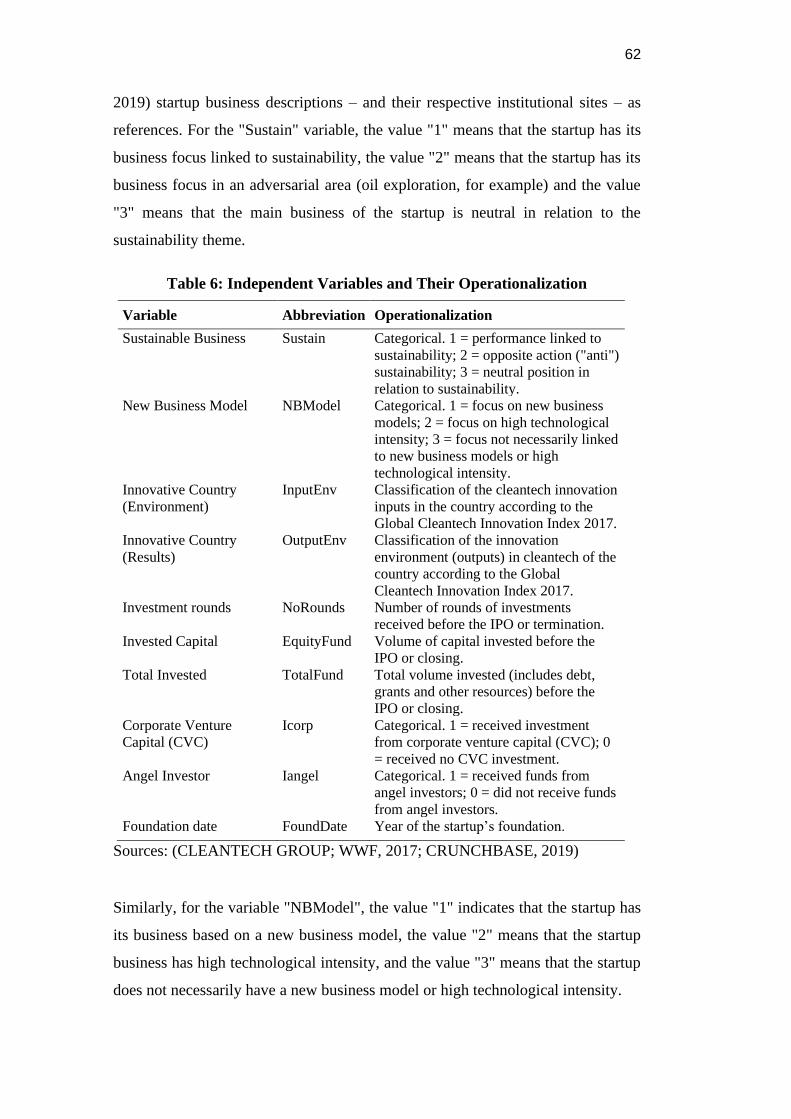
62
2019) startup business descriptions – and their respective institutional sites – as
references. For the "Sustain" variable, the value "1" means that the startup has its
business focus linked to sustainability, the value "2" means that the startup has its
business focus in an adversarial area (oil exploration, for example) and the value
"3" means that the main business of the startup is neutral in relation to the
sustainability theme.
Table 6: Independent Variables and Their Operationalization
Variable Abbreviation Operationalization
Sustainable Business Sustain Categorical. 1 = performance linked to
sustainability; 2 = opposite action ("anti")
sustainability; 3 = neutral position in
relation to sustainability.
New Business Model NBModel Categorical. 1 = focus on new business
models; 2 = focus on high technological
intensity; 3 = focus not necessarily linked
to new business models or high
technological intensity.
Innovative Country
(Environment)
InputEnv Classification of the cleantech innovation
inputs in the country according to the
Global Cleantech Innovation Index 2017.
Innovative Country
(Results)
OutputEnv Classification of the innovation
environment (outputs) in cleantech of the
country according to the Global
Cleantech Innovation Index 2017.
Investment rounds NoRounds Number of rounds of investments
received before the IPO or termination.
Invested Capital EquityFund Volume of capital invested before the
IPO or closing.
Total Invested TotalFund Total volume invested (includes debt,
grants and other resources) before the
IPO or closing.
Corporate Venture
Capital (CVC)
Icorp Categorical. 1 = received investment
from corporate venture capital (CVC); 0
= received no CVC investment.
Angel Investor Iangel Categorical. 1 = received funds from
angel investors; 0 = did not receive funds
from angel investors.
Foundation date FoundDate Year of the startup’s foundation.
Sources: (CLEANTECH GROUP; WWF, 2017; CRUNCHBASE, 2019)
Similarly, for the variable "NBModel", the value "1" indicates that the startup has
its business based on a new business model, the value "2" means that the startup
business has high technological intensity, and the value "3" means that the startup
does not necessarily have a new business model or high technological intensity.
63
The "InputEnv" and "OutputEnv" variables have been filled with the original values
for innovation inputs and outputs of the Global Cleantech Innovation Index 2017
(CLEANTECH GROUP; WWF, 2017). Four startups were from countries that did
not appear in the report; they were assigned the value relative to the lowest-ranking
countries.
The variables "Icorp" and "Iangel" were transformed into binary categorical
variables based on the lists of investors of each startup from the Crunchbase
database, with the variable "Icorp" being indicative of corporate venture capital
investments (1 = CVC, 0 = lack of CVC) and "Iangel" being indicative of angel
investments (1 = received angel investments, 0 did not receive angel investments).
The other variables presented in Table 1, "NoRounds", "EquityFund", "TotalFund"
and "FoundDate, were obtained directly from the database (CRUNCHBASE,
2019).
In Step 2, 537 companies from the Crunchbase database were initially found that
met the filters primarily established in the research design. The filters were: (i)
having been founded in the last 20 years; (ii) being from the energy sector, and (iii)
having either reached the IPO or having closed down its activities in the period.
After this selection, cases with more than 25% of missing data and companies that
did not conceptually fall into the startup category were eliminated (the original base
included legal structures created by large energy companies only for the
management of specific projects related to their final activity). The final result of
the process was a dataset — with no missing values — of 195 startups, of which 93
closed out their activities (47.7%) and 102 did IPO (52.3%).
We do not consider energy startups with acquired status because it is not possible
to know if this meant success or failure without further analysis of the valuations of
the acquisition and previous rounds. In other words, if the acquisition were made
considering a lower valuation than the previous rounds, it would be a proxy for
startup failure. Otherwise, if the startup were acquired by higher valuations, it could
mean success from a business standpoint. We have not considered energy startups
still in operation too, because we do not know what will happen to them in the future
(whether they will reach the IPO, will be acquired, will terminate activities or none
of the previous options).
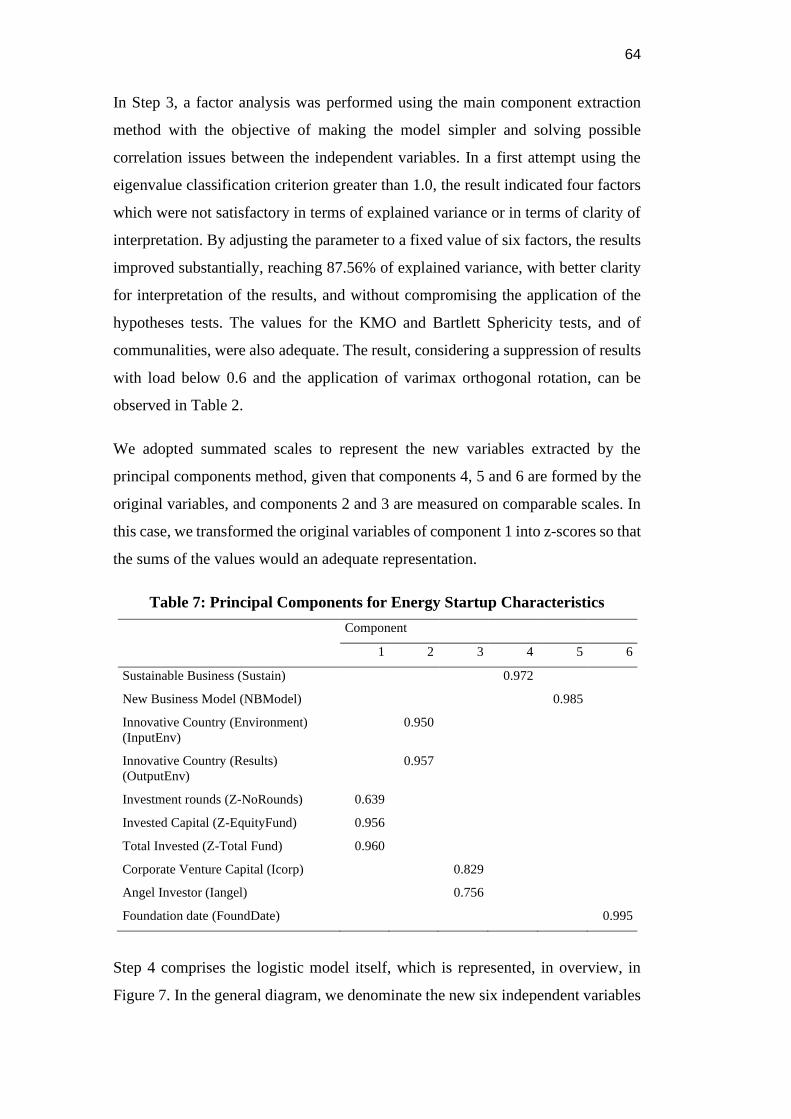
64
In Step 3, a factor analysis was performed using the main component extraction
method with the objective of making the model simpler and solving possible
correlation issues between the independent variables. In a first attempt using the
eigenvalue classification criterion greater than 1.0, the result indicated four factors
which were not satisfactory in terms of explained variance or in terms of clarity of
interpretation. By adjusting the parameter to a fixed value of six factors, the results
improved substantially, reaching 87.56% of explained variance, with better clarity
for interpretation of the results, and without compromising the application of the
hypotheses tests. The values for the KMO and Bartlett Sphericity tests, and of
communalities, were also adequate. The result, considering a suppression of results
with load below 0.6 and the application of varimax orthogonal rotation, can be
observed in Table 2.
We adopted summated scales to represent the new variables extracted by the
principal components method, given that components 4, 5 and 6 are formed by the
original variables, and components 2 and 3 are measured on comparable scales. In
this case, we transformed the original variables of component 1 into z-scores so that
the sums of the values would an adequate representation.
Table 7: Principal Components for Energy Startup Characteristics
Component
1 2 3 4 5 6
Sustainable Business (Sustain) 0.972
New Business Model (NBModel) 0.985
Innovative Country (Environment)
(InputEnv)
0.950
Innovative Country (Results)
(OutputEnv)
0.957
Investment rounds (Z-NoRounds) 0.639
Invested Capital (Z-EquityFund) 0.956
Total Invested (Z-Total Fund) 0.960
Corporate Venture Capital (Icorp) 0.829
Angel Investor (Iangel) 0.756
Foundation date (FoundDate) 0.995
Step 4 comprises the logistic model itself, which is represented, in overview, in
Figure 7. In the general diagram, we denominate the new six independent variables
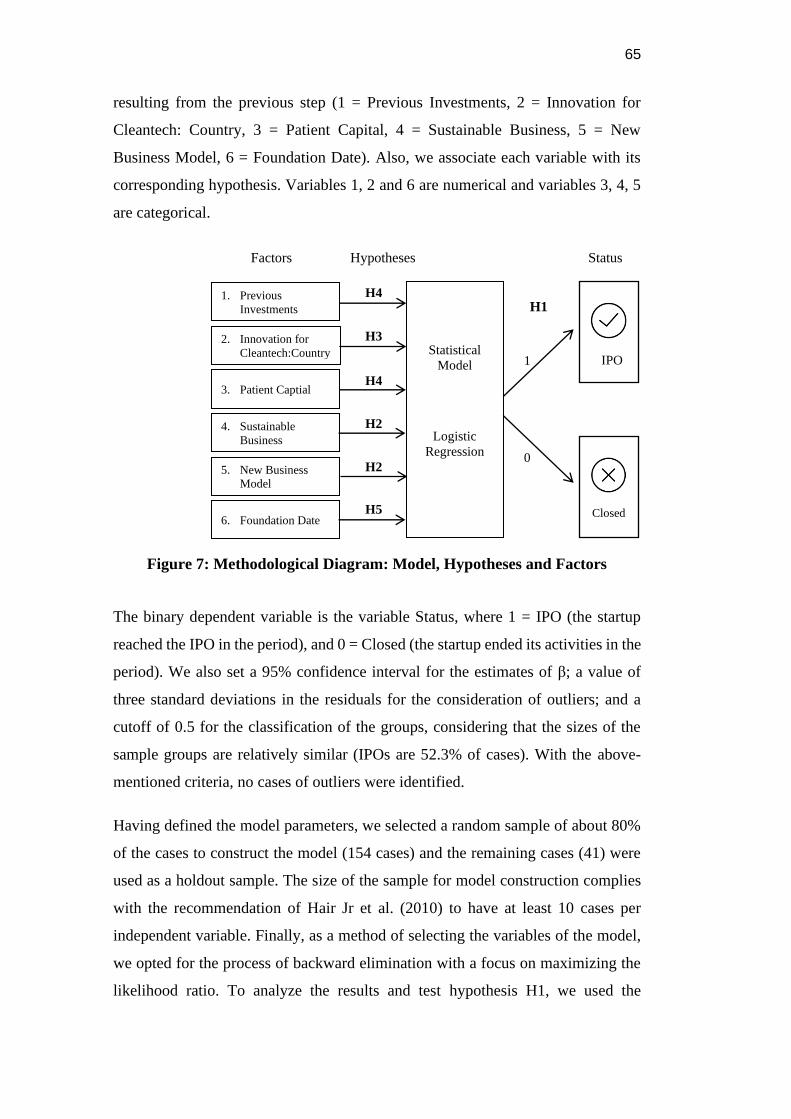
65
resulting from the previous step (1 = Previous Investments, 2 = Innovation for
Cleantech: Country, 3 = Patient Capital, 4 = Sustainable Business, 5 = New
Business Model, 6 = Foundation Date). Also, we associate each variable with its
corresponding hypothesis. Variables 1, 2 and 6 are numerical and variables 3, 4, 5
are categorical.
Figure 7: Methodological Diagram: Model, Hypotheses and Factors
The binary dependent variable is the variable Status, where 1 = IPO (the startup
reached the IPO in the period), and 0 = Closed (the startup ended its activities in the
period). We also set a 95% confidence interval for the estimates of β; a value of
three standard deviations in the residuals for the consideration of outliers; and a
cutoff of 0.5 for the classification of the groups, considering that the sizes of the
sample groups are relatively similar (IPOs are 52.3% of cases). With the above-
mentioned criteria, no cases of outliers were identified.
Having defined the model parameters, we selected a random sample of about 80%
of the cases to construct the model (154 cases) and the remaining cases (41) were
used as a holdout sample. The size of the sample for model construction complies
with the recommendation of Hair Jr et al. (2010) to have at least 10 cases per
independent variable. Finally, as a method of selecting the variables of the model,
we opted for the process of backward elimination with a focus on maximizing the
likelihood ratio. To analyze the results and test hypothesis H1, we used the
H4
1
0
H1
Closed
Statistical
Model
Logistic
Regression
1. Previous
Investments
2. Innovation for
Cleantech:Country
3. Patient Captial
4. Sustainable
Business
5. New Business
Model
6.
6. Foundation Date
H3
H4
H2
H5
H2
Factors Status Hypotheses
IPO
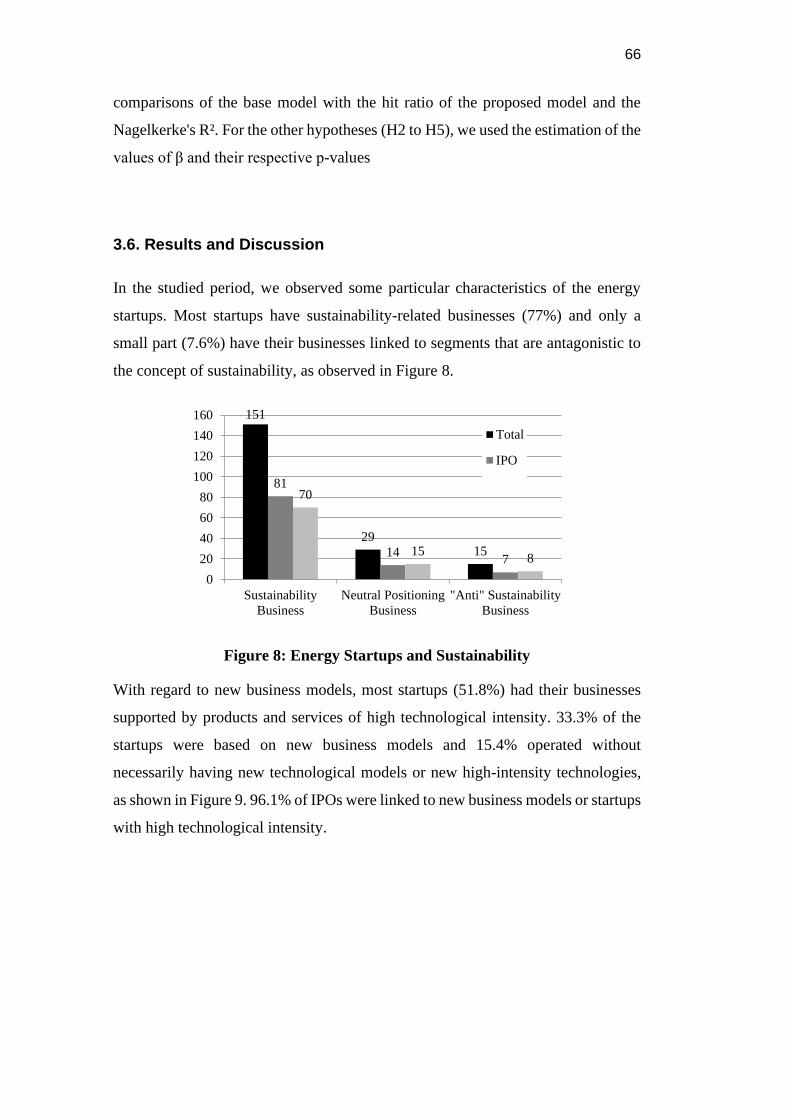
66
comparisons of the base model with the hit ratio of the proposed model and the
Nagelkerke's R². For the other hypotheses (H2 to H5), we used the estimation of the
values of β and their respective p-values
3.6. Results and Discussion
In the studied period, we observed some particular characteristics of the energy
startups. Most startups have sustainability-related businesses (77%) and only a
small part (7.6%) have their businesses linked to segments that are antagonistic to
the concept of sustainability, as observed in Figure 8.
Figure 8: Energy Startups and Sustainability
With regard to new business models, most startups (51.8%) had their businesses
supported by products and services of high technological intensity. 33.3% of the
startups were based on new business models and 15.4% operated without
necessarily having new technological models or new high-intensity technologies,
as shown in Figure 9. 96.1% of IPOs were linked to new business models or startups
with high technological intensity.
151
2915
81
147
70
158
0
20
40
60
80
100
120
140
160
Sustainability
Business
Neutral Positioning
Business
"Anti" Sustainability
Business
Total
IPO
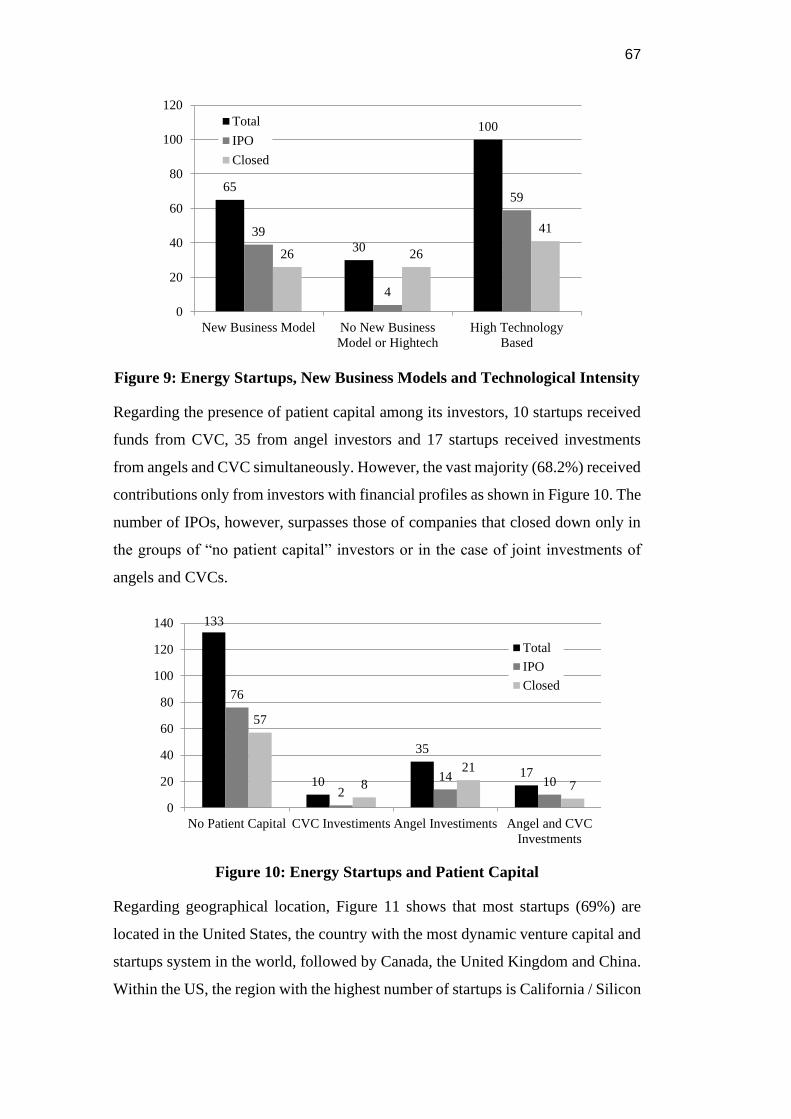
67
Figure 9: Energy Startups, New Business Models and Technological Intensity
Regarding the presence of patient capital among its investors, 10 startups received
funds from CVC, 35 from angel investors and 17 startups received investments
from angels and CVC simultaneously. However, the vast majority (68.2%) received
contributions only from investors with financial profiles as shown in Figure 10. The
number of IPOs, however, surpasses those of companies that closed down only in
the groups of “no patient capital” investors or in the case of joint investments of
angels and CVCs.
Figure 10: Energy Startups and Patient Capital
Regarding geographical location, Figure 11 shows that most startups (69%) are
located in the United States, the country with the most dynamic venture capital and
startups system in the world, followed by Canada, the United Kingdom and China.
Within the US, the region with the highest number of startups is California / Silicon
65
30
100
39
4
59
26 26
41
0
20
40
60
80
100
120
New Business Model No New Business
Model or Hightech
High Technology
Based
Total
IPO
Closed
133
10
35
17
76
2
14 10
57
8
21
7
0
20
40
60
80
100
120
140
No Patient Capital CVC Investiments Angel Investiments Angel and CVC
Investments
Total
IPO
Closed
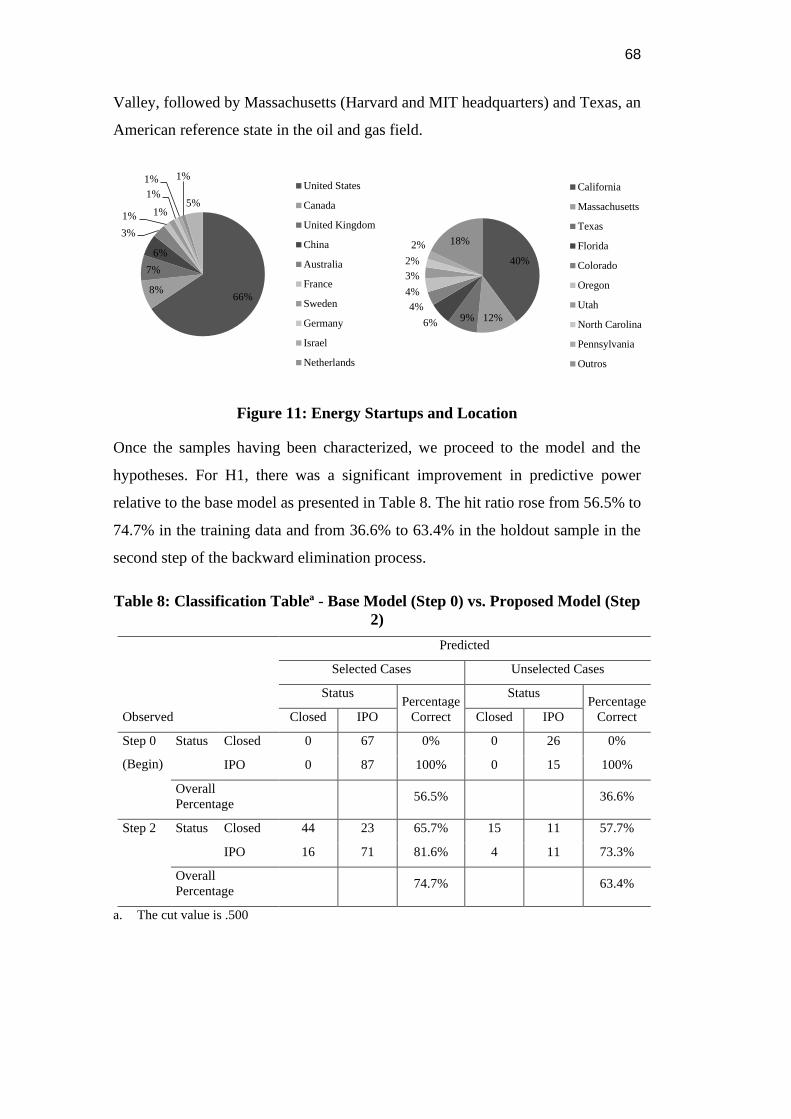
68
Valley, followed by Massachusetts (Harvard and MIT headquarters) and Texas, an
American reference state in the oil and gas field.
Figure 11: Energy Startups and Location
Once the samples having been characterized, we proceed to the model and the
hypotheses. For H1, there was a significant improvement in predictive power
relative to the base model as presented in Table 8. The hit ratio rose from 56.5% to
74.7% in the training data and from 36.6% to 63.4% in the holdout sample in the
second step of the backward elimination process.
Table 8: Classification Tableª - Base Model (Step 0) vs. Proposed Model (Step
2)
Observed
Predicted
Selected Cases Unselected Cases
Status Percentage
Correct
Status Percentage
Correct Closed IPO Closed IPO
Step 0
(Begin)
Status Closed 0 67 0% 0 26 0%
IPO 0 87 100% 0 15 100%
Overall
Percentage 56.5% 36.6%
Step 2 Status Closed 44 23 65.7% 15 11 57.7%
IPO 16 71 81.6% 4 11 73.3%
Overall
Percentage 74.7% 63.4%
a. The cut value is .500
66%8%
7%
6%
3%
1% 1%
1%
1% 1%
5%
United States
Canada
United Kingdom
China
Australia
France
Sweden
Germany
Israel
Netherlands
40%
12%9%6%
4%
4%
3%
2%
2% 18%
California
Massachusetts
Texas
Florida
Colorado
Oregon
Utah
North Carolina
Pennsylvania
Outros
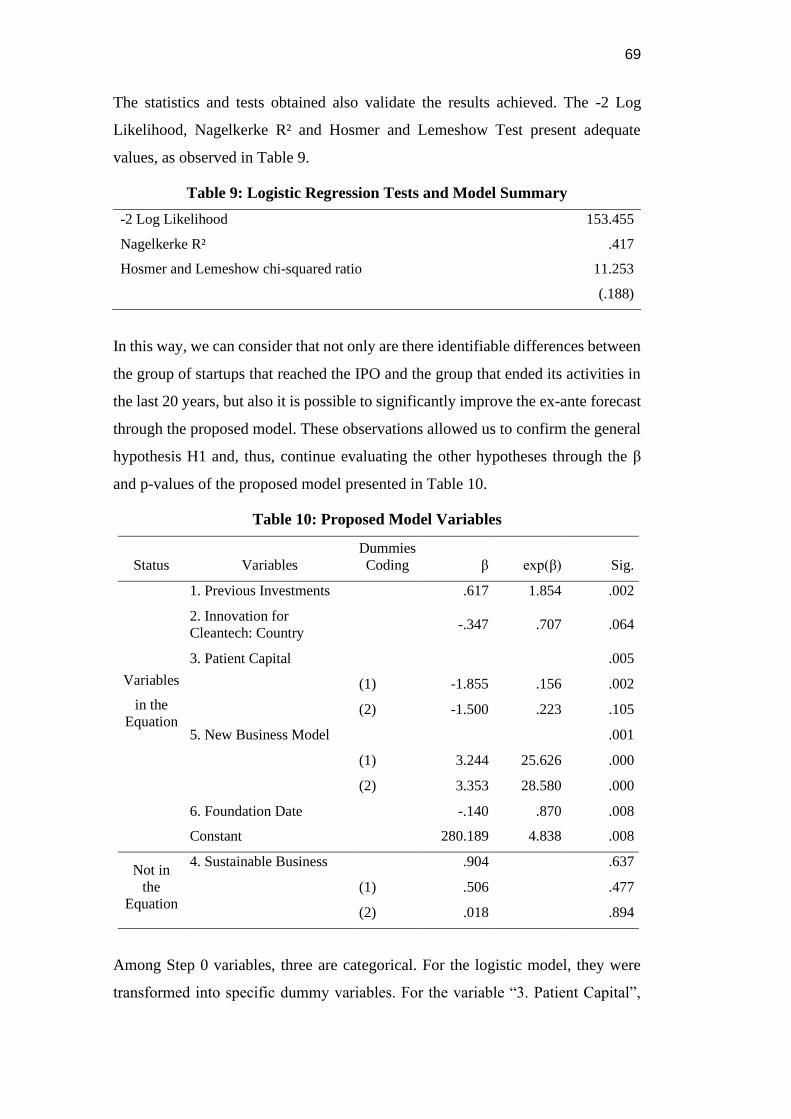
69
The statistics and tests obtained also validate the results achieved. The -2 Log
Likelihood, Nagelkerke R² and Hosmer and Lemeshow Test present adequate
values, as observed in Table 9.
Table 9: Logistic Regression Tests and Model Summary
-2 Log Likelihood
Nagelkerke R²
Hosmer and Lemeshow chi-squared ratio
153.455
.417
11.253
(.188)
In this way, we can consider that not only are there identifiable differences between
the group of startups that reached the IPO and the group that ended its activities in
the last 20 years, but also it is possible to significantly improve the ex-ante forecast
through the proposed model. These observations allowed us to confirm the general
hypothesis H1 and, thus, continue evaluating the other hypotheses through the β
and p-values of the proposed model presented in Table 10.
Table 10: Proposed Model Variables
Status Variables
Dummies
Coding β exp(β) Sig.
Variables
in the
Equation
1. Previous Investments .617 1.854 .002
2. Innovation for
Cleantech: Country
-.347 .707 .064
3. Patient Capital
.005
(1) -1.855 .156 .002
(2) -1.500 .223 .105
5. New Business Model
.001
(1) 3.244 25.626 .000
(2) 3.353 28.580 .000
6. Foundation Date -.140 .870 .008
Constant 280.189 4.838 .008
Not in
the
Equation
4. Sustainable Business
.904 .637
(1) .506 .477
(2) .018 .894
Among Step 0 variables, three are categorical. For the logistic model, they were
transformed into specific dummy variables. For the variable “3. Patient Capital”,
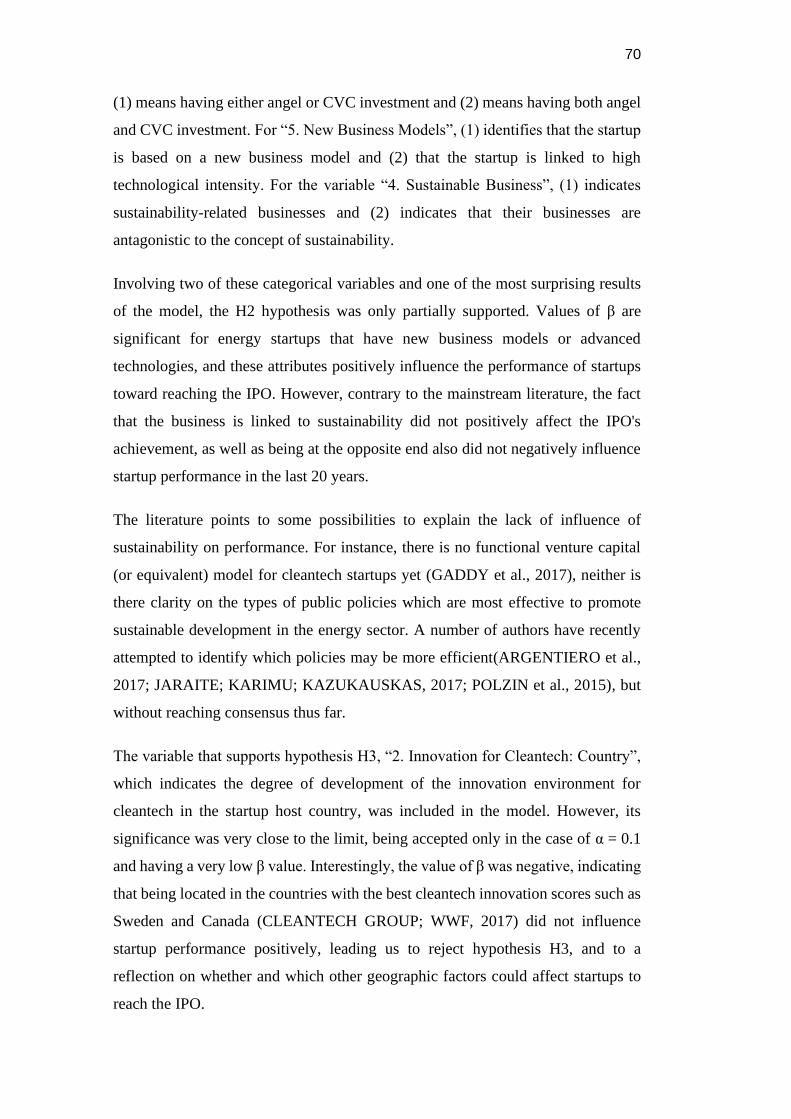
70
(1) means having either angel or CVC investment and (2) means having both angel
and CVC investment. For “5. New Business Models”, (1) identifies that the startup
is based on a new business model and (2) that the startup is linked to high
technological intensity. For the variable “4. Sustainable Business”, (1) indicates
sustainability-related businesses and (2) indicates that their businesses are
antagonistic to the concept of sustainability.
Involving two of these categorical variables and one of the most surprising results
of the model, the H2 hypothesis was only partially supported. Values of β are
significant for energy startups that have new business models or advanced
technologies, and these attributes positively influence the performance of startups
toward reaching the IPO. However, contrary to the mainstream literature, the fact
that the business is linked to sustainability did not positively affect the IPO's
achievement, as well as being at the opposite end also did not negatively influence
startup performance in the last 20 years.
The literature points to some possibilities to explain the lack of influence of
sustainability on performance. For instance, there is no functional venture capital
(or equivalent) model for cleantech startups yet (GADDY et al., 2017), neither is
there clarity on the types of public policies which are most effective to promote
sustainable development in the energy sector. A number of authors have recently
attempted to identify which policies may be more efficient(ARGENTIERO et al.,
2017; JARAITE; KARIMU; KAZUKAUSKAS, 2017; POLZIN et al., 2015), but
without reaching consensus thus far.
The variable that supports hypothesis H3, “2. Innovation for Cleantech: Country”,
which indicates the degree of development of the innovation environment for
cleantech in the startup host country, was included in the model. However, its
significance was very close to the limit, being accepted only in the case of α = 0.1
and having a very low β value. Interestingly, the value of β was negative, indicating
that being located in the countries with the best cleantech innovation scores such as
Sweden and Canada (CLEANTECH GROUP; WWF, 2017) did not influence
startup performance positively, leading us to reject hypothesis H3, and to a
reflection on whether and which other geographic factors could affect startups to
reach the IPO.
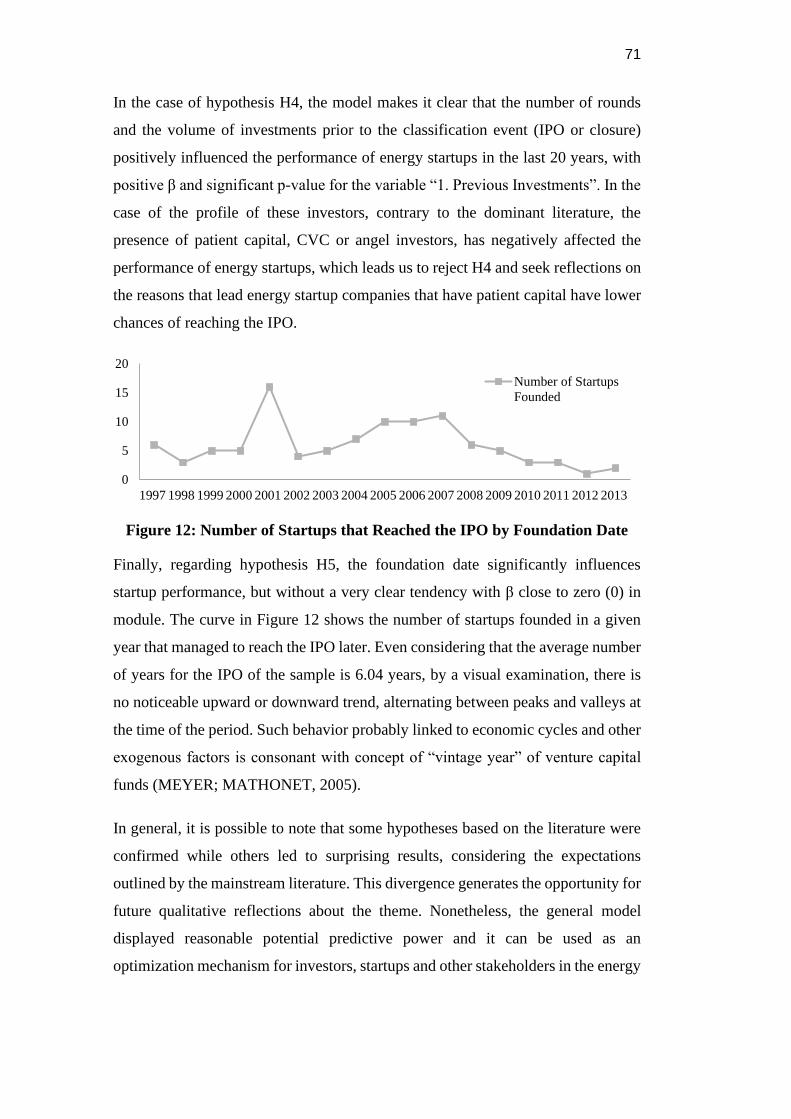
71
In the case of hypothesis H4, the model makes it clear that the number of rounds
and the volume of investments prior to the classification event (IPO or closure)
positively influenced the performance of energy startups in the last 20 years, with
positive β and significant p-value for the variable “1. Previous Investments”. In the
case of the profile of these investors, contrary to the dominant literature, the
presence of patient capital, CVC or angel investors, has negatively affected the
performance of energy startups, which leads us to reject H4 and seek reflections on
the reasons that lead energy startup companies that have patient capital have lower
chances of reaching the IPO.
Figure 12: Number of Startups that Reached the IPO by Foundation Date
Finally, regarding hypothesis H5, the foundation date significantly influences
startup performance, but without a very clear tendency with β close to zero (0) in
module. The curve in Figure 12 shows the number of startups founded in a given
year that managed to reach the IPO later. Even considering that the average number
of years for the IPO of the sample is 6.04 years, by a visual examination, there is
no noticeable upward or downward trend, alternating between peaks and valleys at
the time of the period. Such behavior probably linked to economic cycles and other
exogenous factors is consonant with concept of “vintage year” of venture capital
funds (MEYER; MATHONET, 2005).
In general, it is possible to note that some hypotheses based on the literature were
confirmed while others led to surprising results, considering the expectations
outlined by the mainstream literature. This divergence generates the opportunity for
future qualitative reflections about the theme. Nonetheless, the general model
displayed reasonable potential predictive power and it can be used as an
optimization mechanism for investors, startups and other stakeholders in the energy
0
5
10
15
20
1997 1998 1999 2000 2001 2002 2003 2004 2005 2006 2007 2008 2009 2010 2011 2012 2013
Number of Startups
Founded
72
sector who seek to understand the role of energy startups during the energy
transition.
3.7. Conclusions
In this study, we collected data of energy startups that either reached the IPO or
closed down their activities in recent years. Through the proposed statistical model
it is possible to note that there is an identifiable pattern among the most successful
startups and that some of their common characteristics can indeed be mapped. The
model achieved was able to improve the hit ratio by 18.2% using only six factors.
Confirmation of hypothesis H1 has allowed us to proceed with the test of other
hypotheses and suggest future research that includes new endogenous variables in
order to increase the explanatory capacity of the model. Table 11 shows a general
picture of the hypotheses and their conclusions.
Table 11: Hypothesis Tests Consolidated
# Hypothesis Status Evidence
H1
There is a specific group of startups in the
energy sector that has greater chance of
being more successful in the energy
transition scenario.
Confirmed
R² (NagelKerke) = 0,417;
Hosmer & Lemeshow Sig. =
0,188;
"Hit Ratio" Increase +18,2%
H2
Startups linked to renewable energy and
sustainability, or to new business models,
tend to perform better in the energy
transition scenario.
Partially
Supported
Sustainability:
Sig. β = 0.637
New Business Model:
Sig. β = 0.001; β(1) = 3.244;
β(2) = 3.353
H3
Startups located in countries where the
innovation environment for cleantechs is
more developed have better performance.
Rejected Sig. β = 0.064; β = -0.347
H4
The volume and profile of the investments
received influence the likelihood of energy
startups reaching the IPO
Partially
Supported
Previous Investments:
Sig. β = 0.002; β = 0.617
Patient Capital:
Sig. β(1) = 0.002; β(1) = -
1.85
Sig. β(2) = 0.105; β(2) = -1.5
H5 The date of the startup’s foundation
influences its performance. Confirmed Sig. β = 0.008; β = -0.140
Confirming the theoretical predictions of the literature, the number of rounds and
the volume of external investments positively affect the likelihood of reaching the
73
IPO. This finding is important because it reinforces empirically that energy startups
have more capital-intensive investment cycles. The utilization of new business
models also led to a higher chance of IPO among the energy startups founded in the
last 20 years. At this point, the growth of new trends related to digitization and
decentralization of the sector, such as smart grids, blockchain/smart contracts,
distributed generation, big data, data analytics, among others, shows enabling new
business models that were previously unviable.
The startup's foundation date also affects the success rate, probably due to
exogenous factors to the startup, such as the economic environment, the existence
of specific policies for the sector, etc. However, there is no clearly defined linear
trend. The foundation date affects success rate across the cycles, as reported in
economic theories and the vintage year concept adopted by the venture capital
industry (MEYER; MATHONET, 2005).
The startup's host country also influences success, but it is not as significant as the
cleantech-specific innovation environment. The results indicate that being based in
countries at the top of cleantech ranking (CLEANTECH GROUP; WWF, 2017),
like Sweden and Canada, did not contribute much to a company to reach the IPO.
This result can be considered a little biased, given the sizeable relative share of US
startups at the base (66%). We may consider this limitation of this research as an
opportunity for future research involving databases focused on other countries.
However, two of the main findings of this study are related to the partial rejection
of two hypotheses that are traditionally supported by the literature. Based on the
empirical data of the last 20 years, having the business focus linked to sustainability,
or even operating in areas that are antagonistic to sustainability, both are not
significant for a startup's performance in terms of reaching the IPO. Here is a new
suggestion for future research that qualitatively analyzes the reason for the low
significance of the energy startups' sector in their performance in relation to IPOs.
The same occurs with the presence of angel investors and corporate venture capital
units, the so-called patient capital, which empirically exerted a negative influence
on performance, in a clear contrast to the literature, which predicted the opposite in
theoretical terms. The longer cycles of energy startups should point to a positive
74
difference in this regard, which leads us to another research suggestion related to a
qualitative investigation into the phenomenon.
Finally, given the scenario whereby intense efforts to contain climate change after
the Paris Agreement are being made (UNFCC, 2017), investments related to new
sources of renewable energy, smart grids and energy efficiency are in constant
growth, and startups are playing an increasingly pivotal role, the proposed model
can be posed as a starting point, being of practical use for investors, policy makers,
startups and researchers interested in improving the concept through the
introduction of new variables or by deepening the understanding of those variables
already discussed in this study.
75
4 UNRAVELING THE 5TH WAVE OF CORPORATE VENTURE CAPITAL
Abstract
Corporate venture capital (CVC) activity reached its historical investment peak in
2018 (US$ 53 billion) after sustaining a compound annual growth rate of 38% since
2013. The literature usually named this time the fourth wave of CVC, which started
in the middle of the 2000s and lasts until the present. In our research, we have
identified two different waves underlying to this period. The actual fourth wave
(2003-2009) could be described as a learning period. During this time the CVC
units started to leave their financial focus and began to be more strategic and
innovation-oriented. On the other hand, the fifth wave (2010-Present) consolidated
the previous learning and increased the stakes on strategic innovation. Using
Multivariate k-Means Cluster Analysis and ANOVAs, we dive deeply into data from
the world most active CVC units. The goal was to identify the general patterns and
the group formation across the three last CVC waves. We have discovered that CVC
units in the fifth wave have unusual behavior. The new standards include raising
their overall investments exponentially, taking more risks with startups in the early
stages, and spreading across new sectors and world regions.
4.1. Introduction
In the early 2000s, both the growing number and the mobility of skilled
professionals increased the knowledge exchange stock exponentially. In addition,
the explosion of venture capital available for innovative new companies ushered in
a period known as the era of open innovation (CHESBROUGH, 2003b). Among
the many possible models of open innovation, the instruments of cooperation
between startups and large corporations, also known as corporate-startup
engagement (CSE) (KOHLER, 2016; WEIBLEN; CHESBROUGH, 2015) or
76
corporate venturing (CV) (GUTMANN, 2019; NARAYANAN; YANG; ZAHRA,
2009), have gained particular prominence in recent years.
This “open” mindset led corporations to realize that cooperating could be a more
effective way of protecting themselves from startup disruptions. In fact, in the
current context, the relationship between corporations and other stakeholders in
their external environment becomes somewhat interdependent in managing
innovation. (ADNER; KAPOOR, 2010; JACOBIDES; CENNAMO; GAWER,
2018). Repeating the past behavior of facing them in the competitive field would
not be the best strategy after all (INSEAD; 500 STARTUPS, 2016). By embracing
startup engagement as a possible way to innovate, large corporations can add to
their material resources, scalability, market power, and consolidated processes a
good deal of startups' positive traits such as creativity, agility, risk propensity, and
rapid growth in new markets (WEIBLEN; CHESBROUGH, 2015). Because of
these characteristics, in the innovation environment, startups tend to be more
prepared institutions to deal with the volatile, uncertain, complex, and ambiguous
(VUCA) world we live in today (SCHOEMAKER; HEATON; TEECE, 2018).
To optimize and manage these interactions, corporations have created a variety of
instruments, ranging from one-off events, shared spaces, support services, corporate
incubators and accelerators to capital investments and acquisitions (INSEAD; 500
STARTUPS, 2016). These instruments - represented by Figure 13 - often serve
different purposes and require different levels of commitment from both startups
and corporations. In general, the higher the commitment of the parties, the more the
partnerships are associated with strategic objectives (MOCKER; BIELLI; HALEY,
2015).
In this context, the consistent growth in the number and volume of corporate venture
capital (CVC) units in recent years can be considered a relevant indicator of the
increased strategic relevance of CSE instruments for corporations (BRIGL et al.,
2016). Over the past five years, investments via CVC have a compound annual
growth rate of 38%, reaching a volume of US$ 53 billion in 2018 through 2,740
operations (almost ten times the pre-bubble peak of the internet during that period).
(CB INSIGHTS, 2019). In addition to absolute growth, there was also a significant
increase in the relative importance of CVC. From 2013 to 2018, the relative share
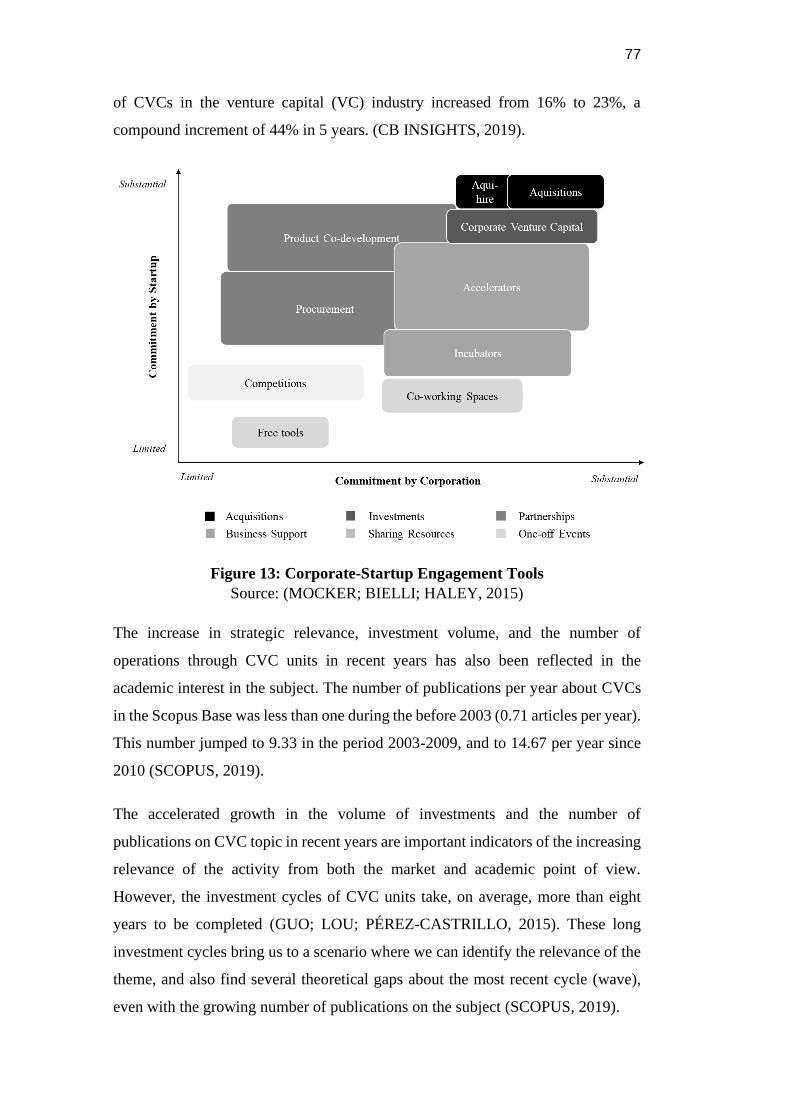
77
of CVCs in the venture capital (VC) industry increased from 16% to 23%, a
compound increment of 44% in 5 years. (CB INSIGHTS, 2019).
Figure 13: Corporate-Startup Engagement Tools
Source: (MOCKER; BIELLI; HALEY, 2015)
The increase in strategic relevance, investment volume, and the number of
operations through CVC units in recent years has also been reflected in the
academic interest in the subject. The number of publications per year about CVCs
in the Scopus Base was less than one during the before 2003 (0.71 articles per year).
This number jumped to 9.33 in the period 2003-2009, and to 14.67 per year since
2010 (SCOPUS, 2019).
The accelerated growth in the volume of investments and the number of
publications on CVC topic in recent years are important indicators of the increasing
relevance of the activity from both the market and academic point of view.
However, the investment cycles of CVC units take, on average, more than eight
years to be completed (GUO; LOU; PÉREZ-CASTRILLO, 2015). These long
investment cycles bring us to a scenario where we can identify the relevance of the
theme, and also find several theoretical gaps about the most recent cycle (wave),
even with the growing number of publications on the subject (SCOPUS, 2019).
78
The specific gap we will explore in this research is the lack of understanding of
using CVC units as a strategic innovation tool. Recent literature points out that CVC
units have been used as a tool for innovation by corporations, and that there is a
great diversity of investment focus, exit strategies, investment durations,
positioning in relation to pre-existing R&D structures, approach related to the
geographical aspect, etc. (BELDERBOS; JACOB; LOKSHIN, 2018; DA GBADJI;
GAILLY, 2009; GUO; LOU; DAVID, 2012; LIVIERATOS; LEPENIOTIS, 2017).
However, the use of CVC by corporations has not always been associated with
innovations. In the first three waves (the 1960s, 1980s, and 1990s), there was a
predominance of financial motivations where corporations operating with CVC
tended to follow other moves from the venture capital industry and the financial
market (BIELESCH et al., 2012). From the 2000s onwards, companies began to
realize that CVC units could also be great strategic tools for searching and
internalizing innovations (BARRETTO-KO, 2011; DA GBADJI; GAILLY, 2009;
MAULA, 2007).
Thus, the first objective of this research is to understand the pathway of use of CVCs
units, from a financial focus to their use as an innovation tool. To achieve this first
objective, we have conducted an exploratory analysis of the characteristics of
13,012 investments made by CVC units between 1995 and 2019 (March)
(CRUNCHBASE, 2019). We have considered variables such as investment stage,
geographic region, sectors, investment values, presence of co-investors, etc.
Once we have identified the general aspects of the cycles (waves), we have analyzed
the strategic positioning of the most active CVC units in the world, according to
Crunchbase (CRUNCHBASE, 2019). For this, we deepen the investigation of the
CVC units themselves through the cluster analysis method, where we have
compared their empirical characteristics with those predicted by the clustering
model. The combination of both procedures - exploratory wave analysis with
clustering of CVC units - pointed to important insights into the current context of
the use of CVC units as a tool for corporate innovation.
79
4.2. The Corporate Venture Capital Evolution
Several authors investigating the characteristics and evolution of CVC around the
world divide this story into cycles or “waves” (BARRETTO-KO, 2011; BENSON;
ZIEDONIS, 2010; BIELESCH et al., 2012; CB INSIGHTS, 2017; DUSHNITSKY,
2011; FAN, 2018; GOMPERS, 2002; MA, 2016). Although there are
disagreements about the exact periods of each wave, there was some consensus on
the existence of four of them.
Until the early 2000s, CVC was just considered a secondary force in the venture
capital industry (FAN, 2018), and its cycles generally followed the movements of
independent VC funds and the financial market (BIELESCH et al., 2012;
DUSHNITSKY, 2011). This macro period encompassed the first three waves of
CVC reported in the literature (BENSON; ZIEDONIS, 2010; BIELESCH et al.,
2012; CB INSIGHTS, 2017). The first, in the 1960s, was led by large industrial
conglomerates that, using their success in the capital markets, sought to diversify
their businesses. Because of this focus, we call the first wave by “Conglomerate
Diversification Wave”. The second one, in the 1980s, we call it “Silicon Valley
Rising Wave” because it coincides with the emergence of the first tech companies
like Apple, HP, Oracle, and others that shaped Silicon Valley as we know it today.
The third, from 1995 to 2002, we named "Venture Capital Euphoria Wave" due to
its association with the fast growth of venture capital in the period called "dotcom
companies boom".
Only in the fourth wave reported in the literature, after the year 2002, we began to
have CVC activity mainly as a corporate innovation tool (BARRETTO-KO, 2011;
BIELESCH et al., 2012; CB INSIGHTS, 2017; DUSHNITSKY, 2011;
LIVIERATOS; LEPENIOTIS, 2017). This view is closely related to the diffusion
of the concept of open innovation and corporate-startup engagement (CSE) among
corporations, which is why we call it “Open Innovation Learning Wave”. Table 12
below shows in a consolidated way the four waves reported in the literature so far.
We will go into the characteristics of each of these waves next.
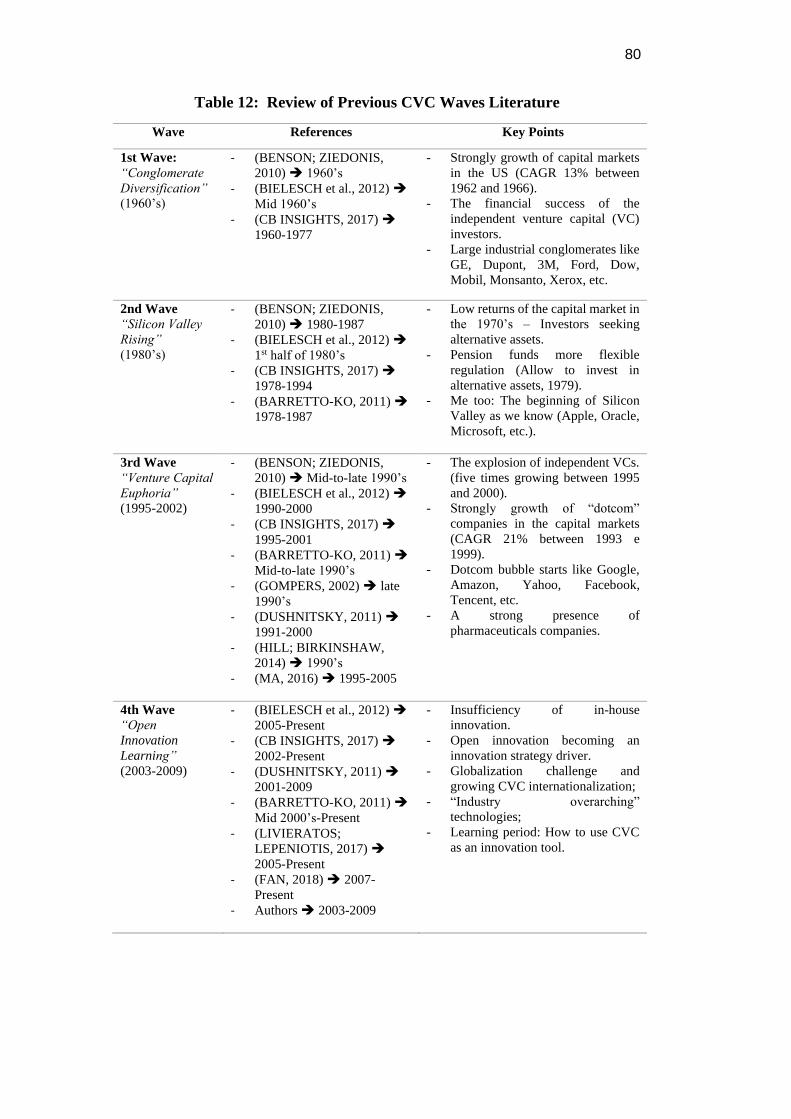
80
Table 12: Review of Previous CVC Waves Literature
Wave References Key Points
1st Wave:
“Conglomerate
Diversification”
(1960’s)
- (BENSON; ZIEDONIS,
2010) ➔ 1960’s
- (BIELESCH et al., 2012) ➔
Mid 1960’s
- (CB INSIGHTS, 2017) ➔
1960-1977
- Strongly growth of capital markets
in the US (CAGR 13% between
1962 and 1966).
- The financial success of the
independent venture capital (VC)
investors.
- Large industrial conglomerates like
GE, Dupont, 3M, Ford, Dow,
Mobil, Monsanto, Xerox, etc.
2nd Wave
“Silicon Valley
Rising”
(1980’s)
- (BENSON; ZIEDONIS,
2010) ➔ 1980-1987
- (BIELESCH et al., 2012) ➔
1st half of 1980’s
- (CB INSIGHTS, 2017) ➔
1978-1994
- (BARRETTO-KO, 2011) ➔
1978-1987
- Low returns of the capital market in
the 1970’s – Investors seeking
alternative assets.
- Pension funds more flexible
regulation (Allow to invest in
alternative assets, 1979).
- Me too: The beginning of Silicon
Valley as we know (Apple, Oracle,
Microsoft, etc.).
3rd Wave
“Venture Capital
Euphoria”
(1995-2002)
- (BENSON; ZIEDONIS,
2010) ➔ Mid-to-late 1990’s
- (BIELESCH et al., 2012) ➔
1990-2000
- (CB INSIGHTS, 2017) ➔
1995-2001
- (BARRETTO-KO, 2011) ➔
Mid-to-late 1990’s
- (GOMPERS, 2002) ➔ late
1990’s
- (DUSHNITSKY, 2011) ➔
1991-2000
- (HILL; BIRKINSHAW,
2014) ➔ 1990’s
- (MA, 2016) ➔ 1995-2005
- The explosion of independent VCs.
(five times growing between 1995
and 2000).
- Strongly growth of “dotcom”
companies in the capital markets
(CAGR 21% between 1993 e
1999).
- Dotcom bubble starts like Google,
Amazon, Yahoo, Facebook,
Tencent, etc.
- A strong presence of
pharmaceuticals companies.
4th Wave
“Open
Innovation
Learning”
(2003-2009)
- (BIELESCH et al., 2012) ➔
2005-Present
- (CB INSIGHTS, 2017) ➔
2002-Present
- (DUSHNITSKY, 2011) ➔
2001-2009
- (BARRETTO-KO, 2011) ➔
Mid 2000’s-Present
- (LIVIERATOS;
LEPENIOTIS, 2017) ➔
2005-Present
- (FAN, 2018) ➔ 2007-
Present
- Authors ➔ 2003-2009
- Insufficiency of in-house
innovation.
- Open innovation becoming an
innovation strategy driver.
- Globalization challenge and
growing CVC internationalization;
- “Industry overarching”
technologies;
- Learning period: How to use CVC
as an innovation tool.
81
4.2.1. CVC as a Segment of the Venture Capital Industry and Financial
Markets
The first CVC wave, the “Conglomerate Diversification” Wave, started in the mid-
1960s and was primarily motivated by the growth of the capital market in the period
and the financial success of the first VC funds (BIELESCH et al., 2012). Taking
advantage of this environment, large industrial conglomerates sought to replicate
VC fund models using their technical and market knowledge for financial gain.
Another important motivation for the growth of the number of CVC units at this
time was conglomerate diversification. Corporations started to use CVCs to expand
the scope of their activities or to minimize the effects of the antitrust laws that
emerged during the period. Companies like GE, Dupont, 3M, Ford, Dow, Exxon
Mobil, Monsanto, Johnson & Johnson, etc are examples of companies that set up
CVC initiatives in this first wave. (BIELESCH et al., 2012; CB INSIGHTS, 2017).
The second wave, which we called the “Silicon Valley Rising”, was also induced
by capital market movements, but for different reasons. In the late 1970s, capital
market returns declined substantially and the search for higher-yielding alternative
assets grew in the same proportion (BIELESCH et al., 2012). The relaxation of US
pension funds' regulation of alternative asset investments in 1979 resulted in a large
growth in VC investments, which once again was reflected in a parallel increase in
CVC activities (BARRETTO-KO, 2011). The more financial and less strategic
motivation of this wave can be evidenced by the high number of funds with
outsourced managers, multi-corporate funds and corporate investments in
independent VC funds - 20% of the total investments of the CVCs of the period
(CB INSIGHTS, 2017). From the corporate point of view, the great fact of the
period was the arrival of personal computers and consumer electronics in the late
1970s and early 1980s. These technologies marked the beginning of Silicon Valley
as we know it today and the origin of companies like Apple, Microsoft, Oracle etc
(CB INSIGHTS, 2017). The investment peak of this wave occurred in 1986 when
the total volume reached US $ 2 billion, 12% of all investment in VC that year
(BARRETTO-KO, 2011).
The third wave, which began in the mid-1990s was, once again, driven by strong
growth in the VC market in the period known as the dotcom boom, which spawned
82
companies like Amazon, eBay, Google, Yahoo, Facebook, Tencent etc. The late
1990s and early 2000s were an unprecedented period of growth for the VC industry.
The capital market “euphoria” with dotcom companies resulted in an average
annual growth rate of 21% of the S&P 500 index between 1993 and 1999
(BIELESCH et al., 2012). At the peak of this wave in 2000, CVC investments
reached $ 17 billion or 25% of total VC investments in the period, more than seven
times the previous peak in 1986. During the third wave a considerable discussion
about the governance models and the relationship between the corporations and
their CVC units started. To avoid undue interferences from corporations in the CVC
units, most of the initiatives of the period sought to replicate exactly the structures
of independent VC funds, with phased investments, rounds with many co-investors
and remuneration model with stakes for managers (BARRETTO-KO, 2011).
This strategy did not work as expected, and the cycles of CVC units were even
shorter than the wave itself, which ended quite abruptly along with the dotcom
bubble after 2001. The average time of existence of CVCs during this wave was
only 2.2 years (HILL; BIRKINSHAW, 2014). However, the third wave left a
significant cultural legacy. Founded and invested startups in the period became
some of the most valuable companies in the world 20 years later and their “way of
being” influenced business management radically, making corporations more
aware of the need to continually innovate, more openly, cooperative and agile
(RIES, 2017).
4.2.2. CVC as an Open Innovation Tool
Over the course of the third wave, some companies began to realize that there were
potential underlying strategic gains in CVC activity. In addition to the potential
financial benefits, they could create more outside-in innovations closely aligned
with the concepts of open innovation (CHESBROUGH, 2002; DUSHNITSKY;
LENOX, 2006; GOMPERS, 2002; WADHWA; PHELPS; KOTHA, 2016).
Notably, outside the IT segment, pharmaceutical companies such as Takeda,
Sanofi, Lilly, Novartis etc. have begun to stand out and make significant
investments using CVC units (DUSHNITSKY, 2011; MA, 2016). This change in
the direction of CVC use represented the beginning of the next wave almost
immediately, and conceptually can be seen in Figure 14.
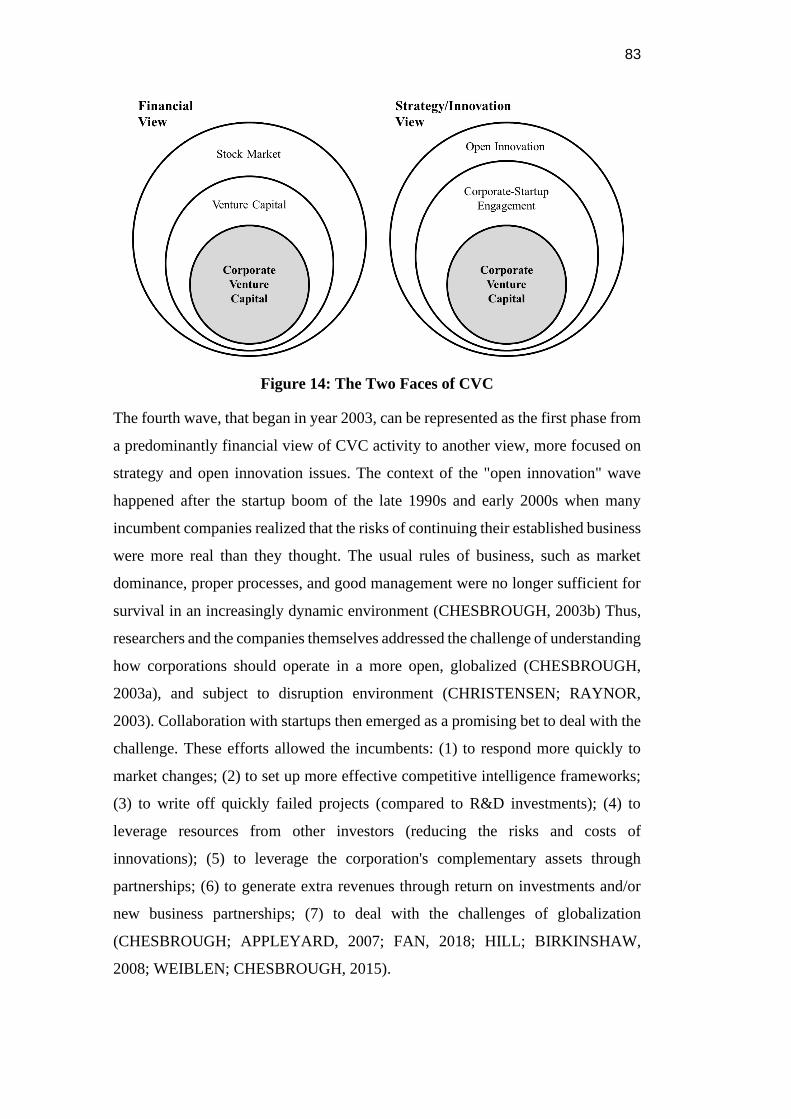
83
Figure 14: The Two Faces of CVC
The fourth wave, that began in year 2003, can be represented as the first phase from
a predominantly financial view of CVC activity to another view, more focused on
strategy and open innovation issues. The context of the "open innovation" wave
happened after the startup boom of the late 1990s and early 2000s when many
incumbent companies realized that the risks of continuing their established business
were more real than they thought. The usual rules of business, such as market
dominance, proper processes, and good management were no longer sufficient for
survival in an increasingly dynamic environment (CHESBROUGH, 2003b) Thus,
researchers and the companies themselves addressed the challenge of understanding
how corporations should operate in a more open, globalized (CHESBROUGH,
2003a), and subject to disruption environment (CHRISTENSEN; RAYNOR,
2003). Collaboration with startups then emerged as a promising bet to deal with the
challenge. These efforts allowed the incumbents: (1) to respond more quickly to
market changes; (2) to set up more effective competitive intelligence frameworks;
(3) to write off quickly failed projects (compared to R&D investments); (4) to
leverage resources from other investors (reducing the risks and costs of
innovations); (5) to leverage the corporation's complementary assets through
partnerships; (6) to generate extra revenues through return on investments and/or
new business partnerships; (7) to deal with the challenges of globalization
(CHESBROUGH; APPLEYARD, 2007; FAN, 2018; HILL; BIRKINSHAW,
2008; WEIBLEN; CHESBROUGH, 2015).
84
On the startup side, besides being a relevant additional source of financial capital,
corporations could provide a wide range of complementary assets such as visibility,
credibility, access, market knowledge, technologies, physical infrastructure, etc.
(BANNERJEE; BIELLI; HALEY, 2016; MOCKER; BIELLI; HALEY, 2015).
These relationships, which are also subject to the other kinds of strategic alliances,
are exacerbated in intensity precisely by the significant difference between the
parties (startups and large corporations). Questions such as misalignment of
strategic objectives, lack of commitment from one party, negotiation and trust,
intellectual property, etc. re starting to appear more frequently now that the focus
has changed to innovation and strategic instead of financial issues. (BANNERJEE;
BIELLI; HALEY, 2016; MOCKER; BIELLI; HALEY, 2015).
Also, during the fourth wave, globalization and internationalization of the CVCs
began to intensify. Even though most initiatives were still US-based, CVC units
were beginning to expand rapidly to other continents - notably Europe and Asia -
increasing their relevance not only absolutely, but also relatively (BIELESCH et
al., 2012).
By the end, the exact starting-year of the fourth wave changes for many authors:
2001 for (BARRETTO-KO, 2011; DUSHNITSKY, 2011), 2002 for (CB
INSIGHTS, 2017), 2005 for (BIELESCH et al., 2012; LIVIERATOS;
LEPENIOTIS, 2017), and 2007 for (FAN, 2018). However, they all agree with the
innovation-driven approach of most of CVC units founded in this period. These
distinctive characteristics of this wave are one of the main reason to investigate the
CVC phenomena at this time.
4.3. Methods
Methodologically the investigation involves two moments. The first one covers an
exploratory analysis of the general characteristics, differences, and similarities of
the CVC waves beginning from the last financial one (the third wave). For this
stage, we have used frequency analyses and comparisons with the literature to
present the topic.
85
Then, in a second moment, we have proceeded with a cluster analysis (K-means)
using as a starting point a theoretical centroid matrix with wave segmentation
characteristics to find the first centroids. Then we follow the standard procedures
of this method recommended by (HAIR JR et al., 2010) to identify possible
underlying patterns of CVC units based on each of these periods. For data analysis,
we also used ANOVAs, posthoc tests, and crosstabs.
4.3.1. The Exploratory Analysis of CVC Waves
For the first part (exploratory), our first step was to conduct a literature review on
the subject. For this purpose, we use the following combination of keywords
"corporate ventur*" AND (strateg* OR innovation OR entrepreneur* OR wave OR
cycle) at Scopus database in order to map articles dealing with CVCs as innovation
tools. We have identified 148 articles. We have analyzed first their titles and
abstracts and then the full content of selected ones. We also checked the references
of the most relevant articles to generate valuable insights and additional readings,
mainly books and reports.
After the literature review, we have collected data about the investment deals made
by CVCs from 1995 (the beginning of the third wave). To this purpose, we have
chosen Crunchbase as our preferred database, a renowned source of information on
VC and CVC deals in both the market and academia (DAHLANDER; PIEZUNKA,
2014; GADDY et al., 2017; HERMANN et al., 2015; RÖHM; MERZ;
KUCKERTZ, 2019). We have applied the filters “Investor Type: Corporate
Venture Capital” and “Announced Date: after 12/31/1994” for the selection of
investments at “Funding Rounds” tab. According to Crunchbase, “CVC is an arm
of a corporation that invests in innovative start-up companies” (RÖHM; MERZ;
KUCKERTZ, 2019). Using these filters, we have reached 13,012 investments made
by CVCs in the indicated period.
We have indexed the found deals by wave based on their announcement date, and
we have extracted the number of investments per year, geographic location of these
investments, average number of co-investors, stage of such investments, etc. For
this first phase, this exploratory frequency analysis was useful for indicating that
there were indeed significant differences between the characteristics of each wave
and that it was essential to go a step further. The use of frequency analysis in
86
investigative exploratory steps can be an essential tool for adjusting research
priorities, supporting the identification of theoretical gaps and setting new research
agendas (RANDHAWA; WILDEN; HOHBERGER, 2016).
4.3.2. Setting the Variables for CVC Cluster Analysis
In the second stage, we have performed the necessary procedures for a cluster
analysis (K-means) guided by the method recommended by (CARNEIRO; DA
SILVA; DA ROCHA, 2011; HAIR JR et al., 2010), and based on a theoretical
centroid matrix constructed from the literature and empirical evidence of the first
exploratory stage. The objective of this stage is to identify differences and
similarities between CVC units over the waves and to compare their expected
characteristics (given by their date of foundation) with those observed by empirical
behavior (clustering membership based on their actual characteristics).
For the construction of the database, we have used the Crunchbase as a reference
adding data from other complementary sources such as Mattermark, Pitchbook and
Capital IQ (S&P Global Market Intelligence) databases. We have identified 685
CVC units initially that were reduced to 105 CVC units after applying the following
criteria: (a) has a presence in Crunchbase and at least one of the other two databases
used; (b) is in fact a CVC according to the criteria set forth in this article (there were
among the original CVCs some multi-corporation funds and third-party corporate
managers that have classified as CVCs); and (c) has made at least 25 investments
(to ensure the representativeness of this unit considering the chosen variables). We
also consider the CVC units that already closed because these investors, even if no
longer operational, may have been relevant in their respective periods of operation
(third or fourth wave).
As the first step, we have selected 19 variables and segmented them into eight
representative categories of the characteristics of the CVC units (unit of analysis)
and their investment portfolio. We choose the clustering variables of this research,
among many available because of their ability to reflect CVC units' investment
policy choices, as well as their key characteristics. It is noteworthy that in the cluster
analysis method, it is expected that the researchers choosing the variables as part of
their research design preferences to achieve the related objectives.
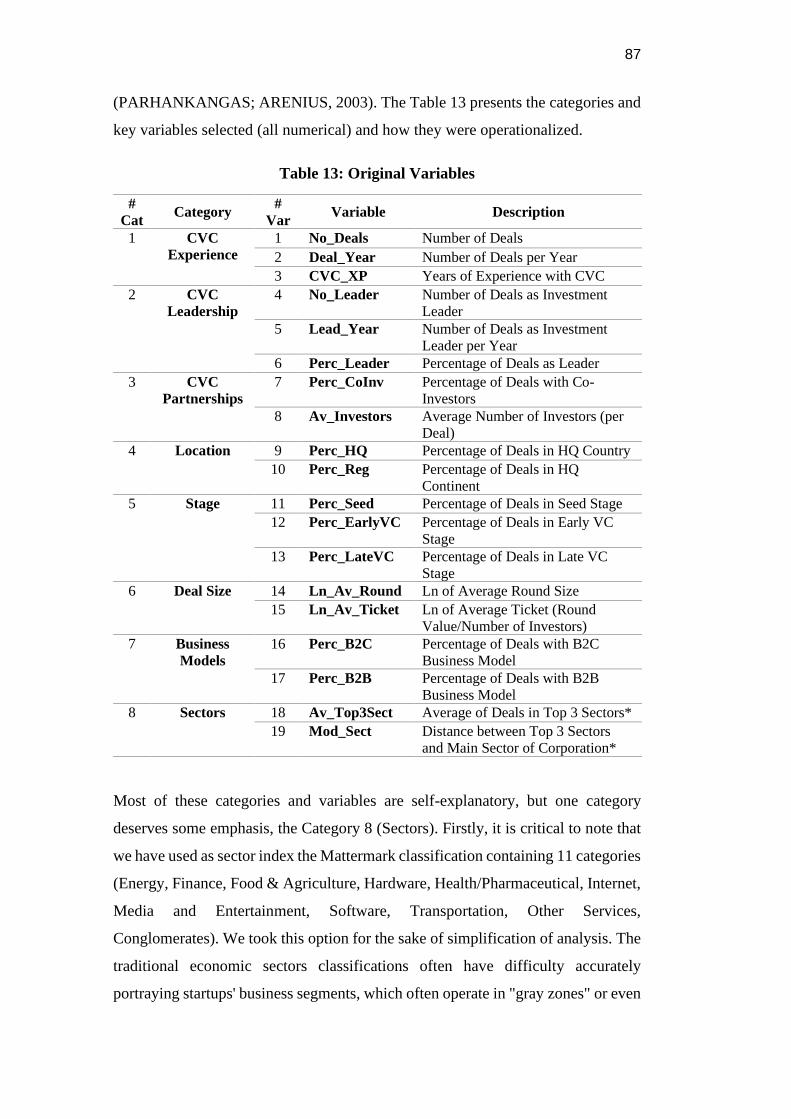
87
(PARHANKANGAS; ARENIUS, 2003). The Table 13 presents the categories and
key variables selected (all numerical) and how they were operationalized.
Table 13: Original Variables
#
Cat Category
#
Var Variable Description
1 CVC
Experience
1 No_Deals Number of Deals
2 Deal_Year Number of Deals per Year
3 CVC_XP Years of Experience with CVC
2 CVC
Leadership
4 No_Leader Number of Deals as Investment
Leader
5 Lead_Year Number of Deals as Investment
Leader per Year
6 Perc_Leader Percentage of Deals as Leader
3 CVC
Partnerships
7 Perc_CoInv Percentage of Deals with Co-
Investors
8 Av_Investors Average Number of Investors (per
Deal)
4 Location 9 Perc_HQ Percentage of Deals in HQ Country
10 Perc_Reg Percentage of Deals in HQ
Continent
5 Stage 11 Perc_Seed Percentage of Deals in Seed Stage
12 Perc_EarlyVC Percentage of Deals in Early VC
Stage
13 Perc_LateVC Percentage of Deals in Late VC
Stage
6 Deal Size 14 Ln_Av_Round Ln of Average Round Size
15 Ln_Av_Ticket Ln of Average Ticket (Round
Value/Number of Investors)
7 Business
Models
16 Perc_B2C Percentage of Deals with B2C
Business Model
17 Perc_B2B Percentage of Deals with B2B
Business Model
8 Sectors 18 Av_Top3Sect Average of Deals in Top 3 Sectors*
19 Mod_Sect Distance between Top 3 Sectors
and Main Sector of Corporation*
Most of these categories and variables are self-explanatory, but one category
deserves some emphasis, the Category 8 (Sectors). Firstly, it is critical to note that
we have used as sector index the Mattermark classification containing 11 categories
(Energy, Finance, Food & Agriculture, Hardware, Health/Pharmaceutical, Internet,
Media and Entertainment, Software, Transportation, Other Services,
Conglomerates). We took this option for the sake of simplification of analysis. The
traditional economic sectors classifications often have difficulty accurately
portraying startups' business segments, which often operate in "gray zones" or even
88
disrupt the borders of the traditional sectors. That said, the variable 18
(Av_Top3Sect) is represented by the average of the percentages of the three main
sectors of that CVC unit. Shell Ventures, for example, has 45%, 45% and 40% in
the Cleantech, Energy and Wind Power sectors, making an average of 43.3% of its
investments in its three main sectors. Otherwise, Lilly Ventures fund has in its three
main sectors (Healthcare, Pharmaceutical, and Biotechnology) respectively 93%,
89% and 86%, an average of 89.3%, considerably more concentrated in its core-
business than the Shell Ventures.
Variable 19 (Mod_Set), on the other hand, is a modifier aiming to relate the
corporate sector with that of the actual investments made. For each of the three
sectors directly related to the parent corporation, the CVC unit receives one point.
Conglomerates receive just 0.5 for each sector considering a certain multi-specialty.
For example, consider CVC units Takeda Ventures, Alexa Fund (Amazon), BMW
iVentures, and Mitsui Global Investment. The Takeda Ventures fund received the
3 points because its three main investment sectors according to Mattermark
(Pharmaceutical, HealthCare, and Biotechnology) were directly related to its parent
corporation's macro category (Takeda / Health/Pharmaceutical). In the case of the
Alexa Fund, the score was 0 (zero) because none of the fund's three main sectors
(Hardware, Consumer Electronics, and Internet of Things) were directly related to
the parent corporation's leading sector (Amazon / Software / Internet). In this case,
we can suppose that the objective of this fund is to diversify Amazon's business
sectors out of its core e-commerce business. In the case of BMW iVentures, the
score was 1 since one of the sectors is directly linked (Automotive) to the core
sector of BMW (Transportation), but the others are not (Consumer Services and
Mobile). Finally, Mitsui Global Investment is linked to a conglomerate with various
sectors of activity receiving the overall score of 1.5, or 0.5 for each sector.
Having defined the variables and the final database, we have started the data
processing phase. In this context, no treatments for missing values were necessary.
For outliers, the Mahalanobis distance was used, which pointed out four cases as
outliers (Prob_MAH1 <0.001). We have excluded these four cases (Intel Capital,
Brand Capital, M12, and GE Capital) from the sample for the remaining process
steps.
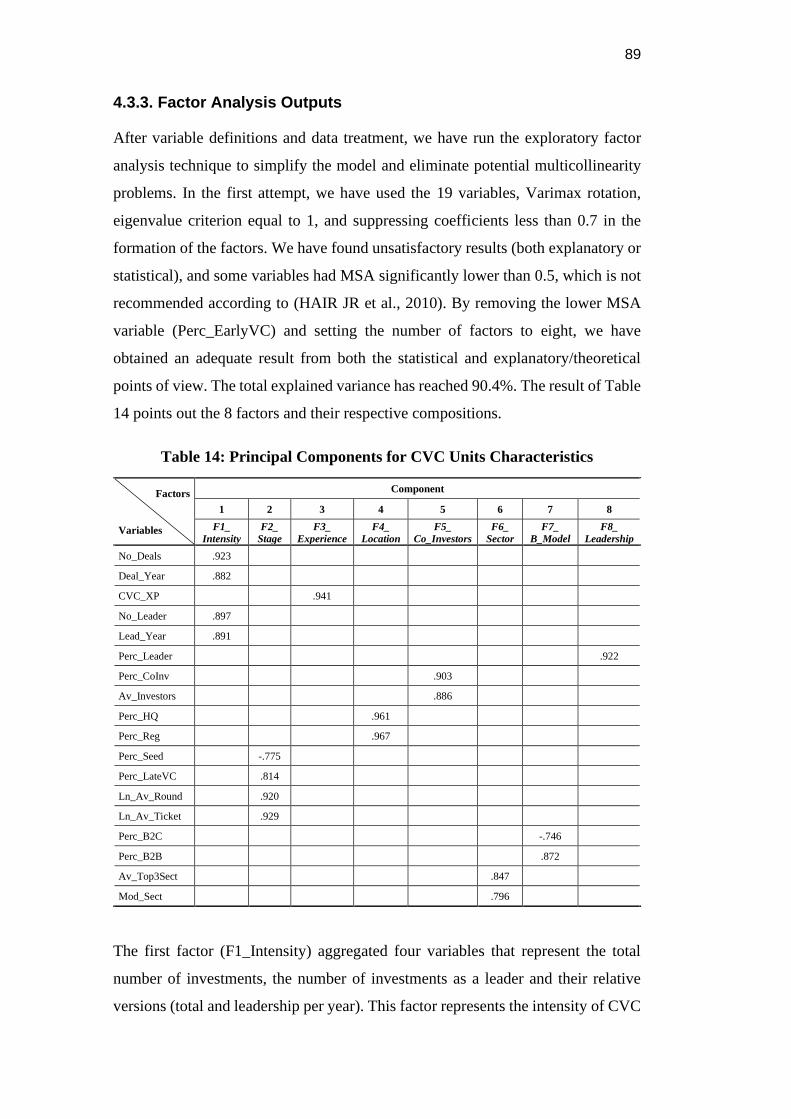
89
4.3.3. Factor Analysis Outputs
After variable definitions and data treatment, we have run the exploratory factor
analysis technique to simplify the model and eliminate potential multicollinearity
problems. In the first attempt, we have used the 19 variables, Varimax rotation,
eigenvalue criterion equal to 1, and suppressing coefficients less than 0.7 in the
formation of the factors. We have found unsatisfactory results (both explanatory or
statistical), and some variables had MSA significantly lower than 0.5, which is not
recommended according to (HAIR JR et al., 2010). By removing the lower MSA
variable (Perc_EarlyVC) and setting the number of factors to eight, we have
obtained an adequate result from both the statistical and explanatory/theoretical
points of view. The total explained variance has reached 90.4%. The result of Table
14 points out the 8 factors and their respective compositions.
Table 14: Principal Components for CVC Units Characteristics
Factors
Variables
Component
1 2 3 4 5 6 7 8
F1_
Intensity
F2_
Stage
F3_
Experience
F4_
Location
F5_
Co_Investors
F6_
Sector
F7_
B_Model
F8_
Leadership
No_Deals .923
Deal_Year .882
CVC_XP .941
No_Leader .897
Lead_Year .891
Perc_Leader .922
Perc_CoInv .903
Av_Investors .886
Perc_HQ .961
Perc_Reg .967
Perc_Seed -.775
Perc_LateVC .814
Ln_Av_Round .920
Ln_Av_Ticket .929
Perc_B2C -.746
Perc_B2B .872
Av_Top3Sect .847
Mod_Sect .796
The first factor (F1_Intensity) aggregated four variables that represent the total
number of investments, the number of investments as a leader and their relative
versions (total and leadership per year). This factor represents the intensity of CVC
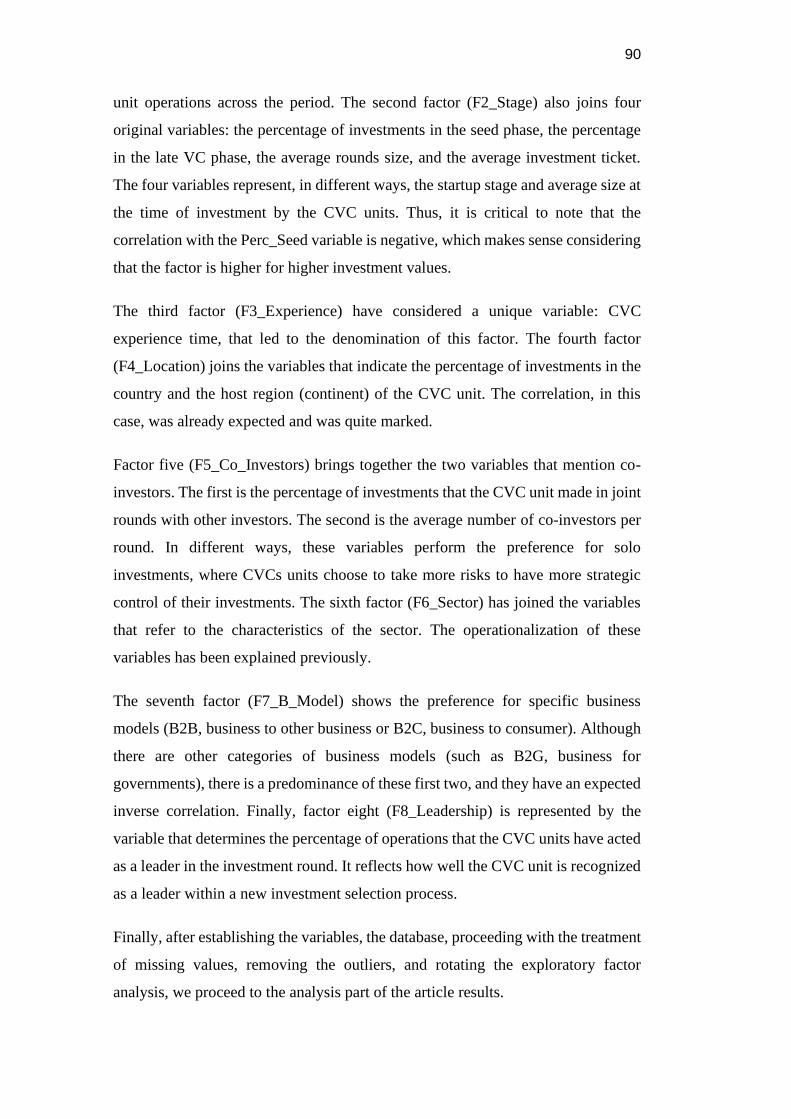
90
unit operations across the period. The second factor (F2_Stage) also joins four
original variables: the percentage of investments in the seed phase, the percentage
in the late VC phase, the average rounds size, and the average investment ticket.
The four variables represent, in different ways, the startup stage and average size at
the time of investment by the CVC units. Thus, it is critical to note that the
correlation with the Perc_Seed variable is negative, which makes sense considering
that the factor is higher for higher investment values.
The third factor (F3_Experience) have considered a unique variable: CVC
experience time, that led to the denomination of this factor. The fourth factor
(F4_Location) joins the variables that indicate the percentage of investments in the
country and the host region (continent) of the CVC unit. The correlation, in this
case, was already expected and was quite marked.
Factor five (F5_Co_Investors) brings together the two variables that mention co-
investors. The first is the percentage of investments that the CVC unit made in joint
rounds with other investors. The second is the average number of co-investors per
round. In different ways, these variables perform the preference for solo
investments, where CVCs units choose to take more risks to have more strategic
control of their investments. The sixth factor (F6_Sector) has joined the variables
that refer to the characteristics of the sector. The operationalization of these
variables has been explained previously.
The seventh factor (F7_B_Model) shows the preference for specific business
models (B2B, business to other business or B2C, business to consumer). Although
there are other categories of business models (such as B2G, business for
governments), there is a predominance of these first two, and they have an expected
inverse correlation. Finally, factor eight (F8_Leadership) is represented by the
variable that determines the percentage of operations that the CVC units have acted
as a leader in the investment round. It reflects how well the CVC unit is recognized
as a leader within a new investment selection process.
Finally, after establishing the variables, the database, proceeding with the treatment
of missing values, removing the outliers, and rotating the exploratory factor
analysis, we proceed to the analysis part of the article results.
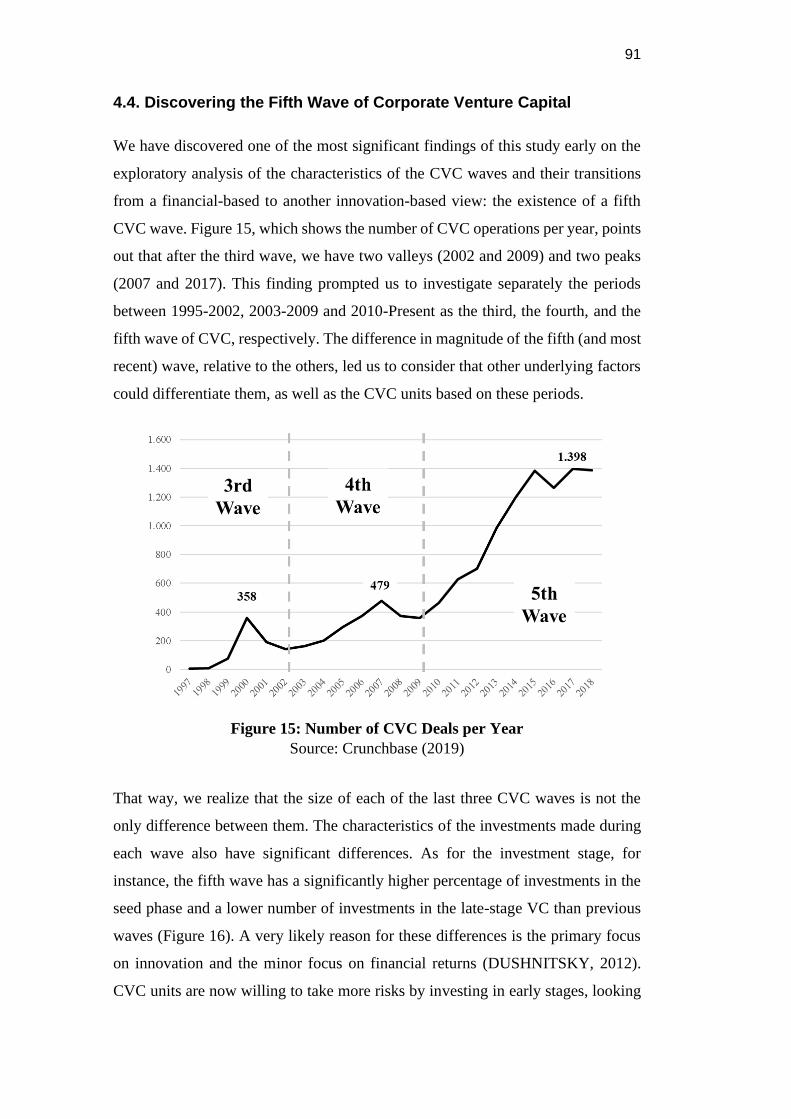
91
4.4. Discovering the Fifth Wave of Corporate Venture Capital
We have discovered one of the most significant findings of this study early on the
exploratory analysis of the characteristics of the CVC waves and their transitions
from a financial-based to another innovation-based view: the existence of a fifth
CVC wave. Figure 15, which shows the number of CVC operations per year, points
out that after the third wave, we have two valleys (2002 and 2009) and two peaks
(2007 and 2017). This finding prompted us to investigate separately the periods
between 1995-2002, 2003-2009 and 2010-Present as the third, the fourth, and the
fifth wave of CVC, respectively. The difference in magnitude of the fifth (and most
recent) wave, relative to the others, led us to consider that other underlying factors
could differentiate them, as well as the CVC units based on these periods.
Figure 15: Number of CVC Deals per Year
Source: Crunchbase (2019)
That way, we realize that the size of each of the last three CVC waves is not the
only difference between them. The characteristics of the investments made during
each wave also have significant differences. As for the investment stage, for
instance, the fifth wave has a significantly higher percentage of investments in the
seed phase and a lower number of investments in the late-stage VC than previous
waves (Figure 16). A very likely reason for these differences is the primary focus
on innovation and the minor focus on financial returns (DUSHNITSKY, 2012).
CVC units are now willing to take more risks by investing in early stages, looking
92
for innovations that would be more promising to open new markets, protect against
disruption or even absorb new technologies for the corporation (BANNERJEE;
BIELLI; HALEY, 2016; MOCKER; BIELLI; HALEY, 2015). Another likely
reason for this change is the learning acquired from the fourth wave. The previous
knowledge about the use of CVC as an innovation tool made the CVC units feel
more comfortable to invest and cooperate with less structured startups/businesses.
Figure 16: Investment Stages per CVC Wave
Source: Crunchbase (2019)
For the number of co-investors, there are also interesting insights into the
differences between the waves. Figure 17 shows that the number of solo
investments from the fourth wave (with no other co-investors) rose substantially,
reflecting the importance of controlling the strategic investments from the
corporations behind CVC units. However, from the fourth to the fifth wave there is
a growth at the other end of the graph. The relative number of investments with
more than five co-investors rose again, pointing to a growth of the syndicate model
in fifth wave CVC investments.
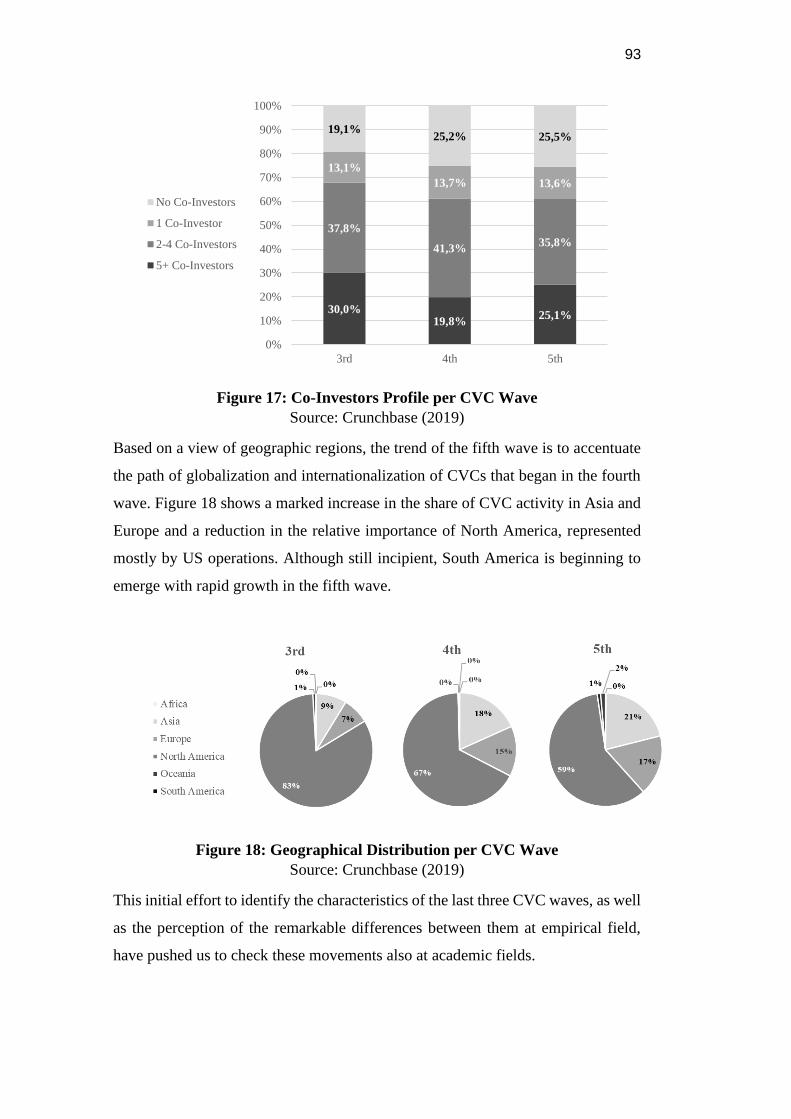
93
Figure 17: Co-Investors Profile per CVC Wave
Source: Crunchbase (2019)
Based on a view of geographic regions, the trend of the fifth wave is to accentuate
the path of globalization and internationalization of CVCs that began in the fourth
wave. Figure 18 shows a marked increase in the share of CVC activity in Asia and
Europe and a reduction in the relative importance of North America, represented
mostly by US operations. Although still incipient, South America is beginning to
emerge with rapid growth in the fifth wave.
Figure 18: Geographical Distribution per CVC Wave
Source: Crunchbase (2019)
This initial effort to identify the characteristics of the last three CVC waves, as well
as the perception of the remarkable differences between them at empirical field,
have pushed us to check these movements also at academic fields.
30,0%19,8%
25,1%
37,8%
41,3%35,8%
13,1%
13,7% 13,6%
19,1%25,2% 25,5%
0%
10%
20%
30%
40%
50%
60%
70%
80%
90%
100%
3rd 4th 5th
No Co-Investors
1 Co-Investor
2-4 Co-Investors
5+ Co-Investors
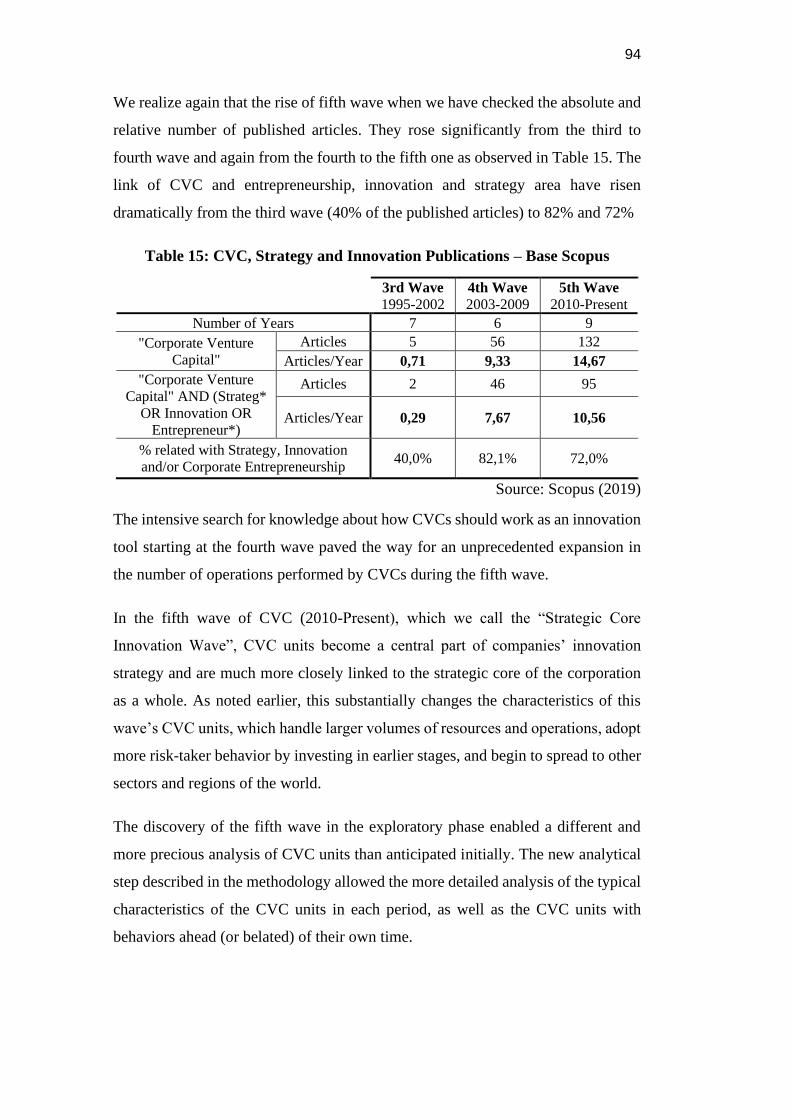
94
We realize again that the rise of fifth wave when we have checked the absolute and
relative number of published articles. They rose significantly from the third to
fourth wave and again from the fourth to the fifth one as observed in Table 15. The
link of CVC and entrepreneurship, innovation and strategy area have risen
dramatically from the third wave (40% of the published articles) to 82% and 72%
Table 15: CVC, Strategy and Innovation Publications – Base Scopus
3rd Wave
1995-2002
4th Wave
2003-2009
5th Wave
2010-Present
Number of Years 7 6 9
"Corporate Venture
Capital"
Articles 5 56 132
Articles/Year 0,71 9,33 14,67
"Corporate Venture
Capital" AND (Strateg*
OR Innovation OR
Entrepreneur*)
Articles 2 46 95
Articles/Year 0,29 7,67 10,56
% related with Strategy, Innovation
and/or Corporate Entrepreneurship 40,0% 82,1% 72,0%
Source: Scopus (2019)
The intensive search for knowledge about how CVCs should work as an innovation
tool starting at the fourth wave paved the way for an unprecedented expansion in
the number of operations performed by CVCs during the fifth wave.
In the fifth wave of CVC (2010-Present), which we call the “Strategic Core
Innovation Wave”, CVC units become a central part of companies’ innovation
strategy and are much more closely linked to the strategic core of the corporation
as a whole. As noted earlier, this substantially changes the characteristics of this
wave’s CVC units, which handle larger volumes of resources and operations, adopt
more risk-taker behavior by investing in earlier stages, and begin to spread to other
sectors and regions of the world.
The discovery of the fifth wave in the exploratory phase enabled a different and
more precious analysis of CVC units than anticipated initially. The new analytical
step described in the methodology allowed the more detailed analysis of the typical
characteristics of the CVC units in each period, as well as the CVC units with
behaviors ahead (or belated) of their own time.
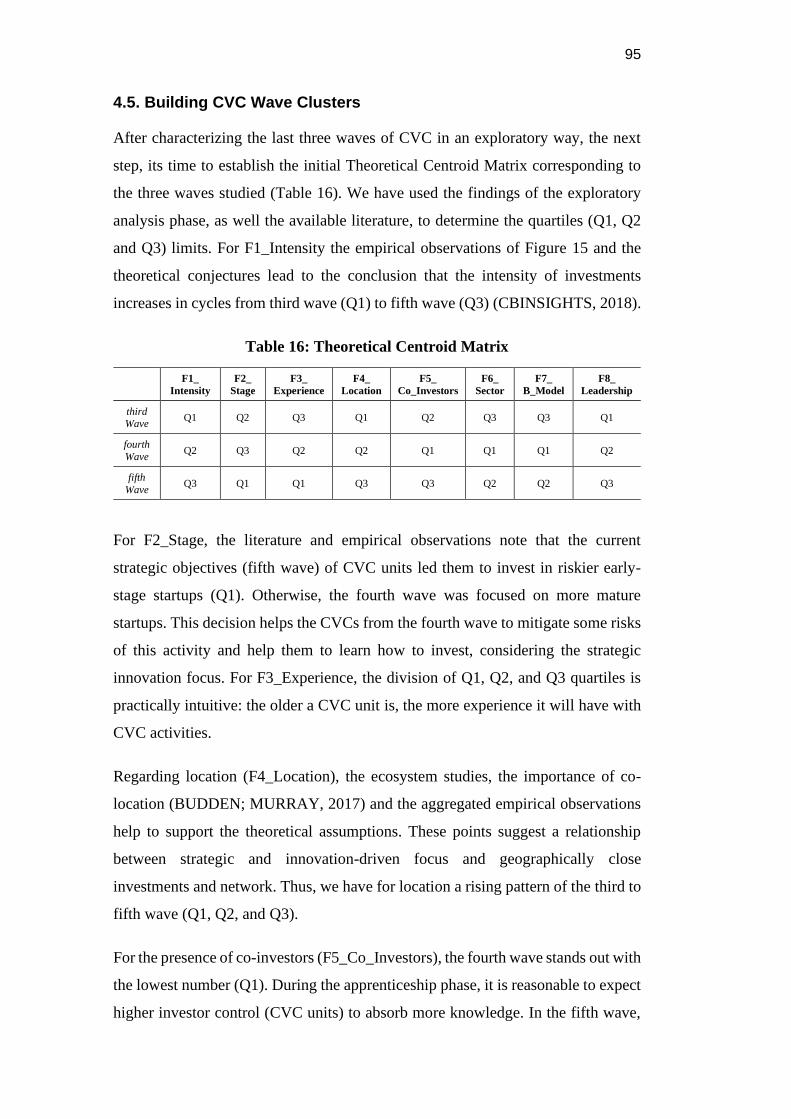
95
4.5. Building CVC Wave Clusters
After characterizing the last three waves of CVC in an exploratory way, the next
step, its time to establish the initial Theoretical Centroid Matrix corresponding to
the three waves studied (Table 16). We have used the findings of the exploratory
analysis phase, as well the available literature, to determine the quartiles (Q1, Q2
and Q3) limits. For F1_Intensity the empirical observations of Figure 15 and the
theoretical conjectures lead to the conclusion that the intensity of investments
increases in cycles from third wave (Q1) to fifth wave (Q3) (CBINSIGHTS, 2018).
Table 16: Theoretical Centroid Matrix
F1_
Intensity
F2_
Stage
F3_
Experience
F4_
Location
F5_
Co_Investors
F6_
Sector
F7_
B_Model
F8_
Leadership
third Wave
Q1 Q2 Q3 Q1 Q2 Q3 Q3 Q1
fourth
Wave Q2 Q3 Q2 Q2 Q1 Q1 Q1 Q2
fifth
Wave Q3 Q1 Q1 Q3 Q3 Q2 Q2 Q3
For F2_Stage, the literature and empirical observations note that the current
strategic objectives (fifth wave) of CVC units led them to invest in riskier early-
stage startups (Q1). Otherwise, the fourth wave was focused on more mature
startups. This decision helps the CVCs from the fourth wave to mitigate some risks
of this activity and help them to learn how to invest, considering the strategic
innovation focus. For F3_Experience, the division of Q1, Q2, and Q3 quartiles is
practically intuitive: the older a CVC unit is, the more experience it will have with
CVC activities.
Regarding location (F4_Location), the ecosystem studies, the importance of co-
location (BUDDEN; MURRAY, 2017) and the aggregated empirical observations
help to support the theoretical assumptions. These points suggest a relationship
between strategic and innovation-driven focus and geographically close
investments and network. Thus, we have for location a rising pattern of the third to
fifth wave (Q1, Q2, and Q3).
For the presence of co-investors (F5_Co_Investors), the fourth wave stands out with
the lowest number (Q1). During the apprenticeship phase, it is reasonable to expect
higher investor control (CVC units) to absorb more knowledge. In the fifth wave,
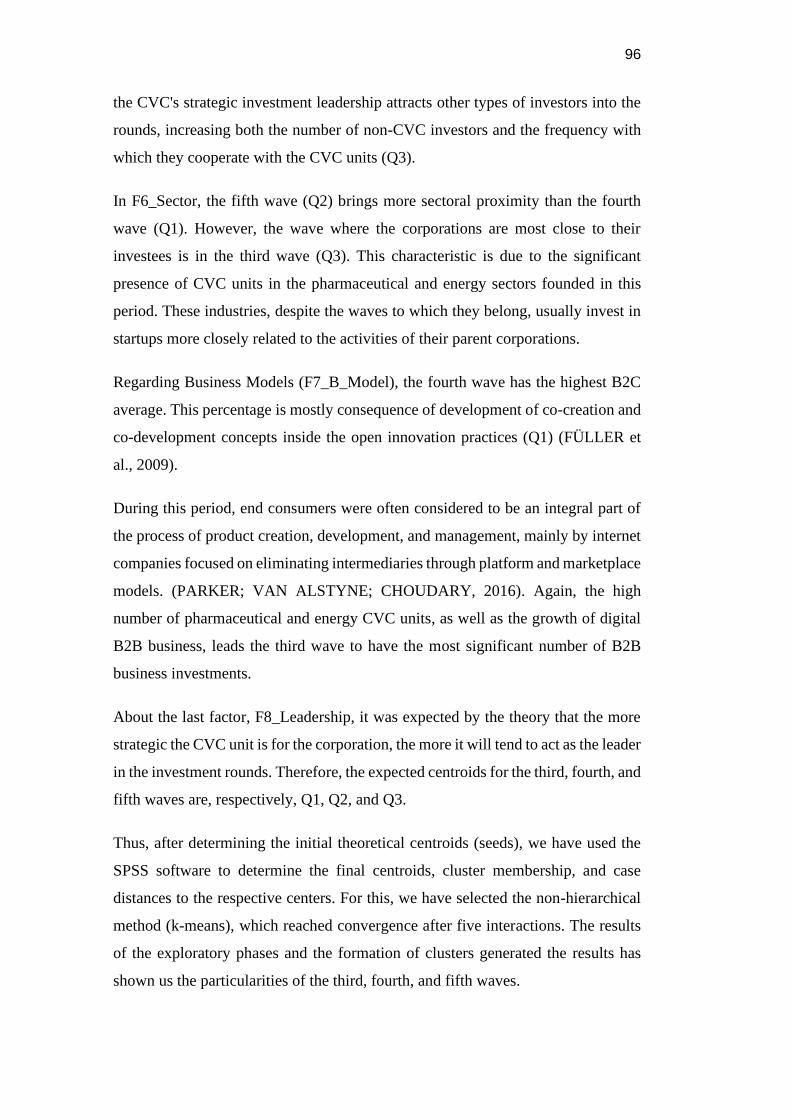
96
the CVC's strategic investment leadership attracts other types of investors into the
rounds, increasing both the number of non-CVC investors and the frequency with
which they cooperate with the CVC units (Q3).
In F6_Sector, the fifth wave (Q2) brings more sectoral proximity than the fourth
wave (Q1). However, the wave where the corporations are most close to their
investees is in the third wave (Q3). This characteristic is due to the significant
presence of CVC units in the pharmaceutical and energy sectors founded in this
period. These industries, despite the waves to which they belong, usually invest in
startups more closely related to the activities of their parent corporations.
Regarding Business Models (F7_B_Model), the fourth wave has the highest B2C
average. This percentage is mostly consequence of development of co-creation and
co-development concepts inside the open innovation practices (Q1) (FÜLLER et
al., 2009).
During this period, end consumers were often considered to be an integral part of
the process of product creation, development, and management, mainly by internet
companies focused on eliminating intermediaries through platform and marketplace
models. (PARKER; VAN ALSTYNE; CHOUDARY, 2016). Again, the high
number of pharmaceutical and energy CVC units, as well as the growth of digital
B2B business, leads the third wave to have the most significant number of B2B
business investments.
About the last factor, F8_Leadership, it was expected by the theory that the more
strategic the CVC unit is for the corporation, the more it will tend to act as the leader
in the investment rounds. Therefore, the expected centroids for the third, fourth, and
fifth waves are, respectively, Q1, Q2, and Q3.
Thus, after determining the initial theoretical centroids (seeds), we have used the
SPSS software to determine the final centroids, cluster membership, and case
distances to the respective centers. For this, we have selected the non-hierarchical
method (k-means), which reached convergence after five interactions. The results
of the exploratory phases and the formation of clusters generated the results has
shown us the particularities of the third, fourth, and fifth waves.
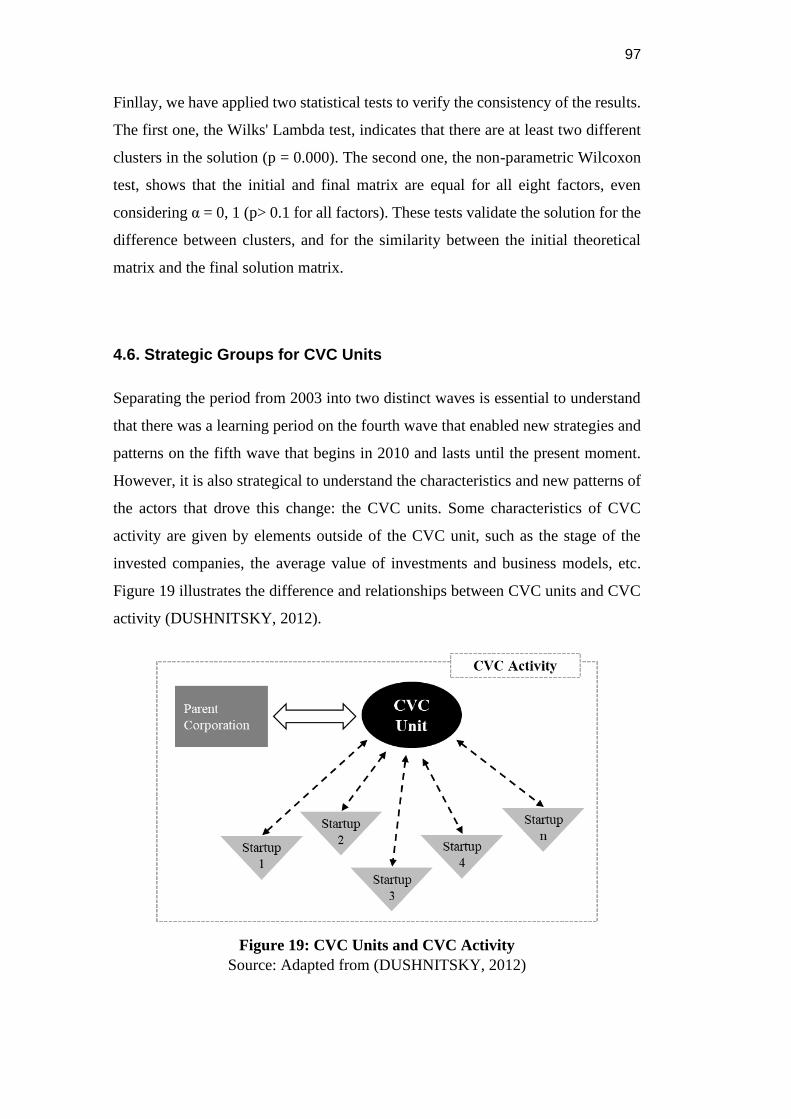
97
Finllay, we have applied two statistical tests to verify the consistency of the results.
The first one, the Wilks' Lambda test, indicates that there are at least two different
clusters in the solution (p = 0.000). The second one, the non-parametric Wilcoxon
test, shows that the initial and final matrix are equal for all eight factors, even
considering α = 0, 1 (p> 0.1 for all factors). These tests validate the solution for the
difference between clusters, and for the similarity between the initial theoretical
matrix and the final solution matrix.
4.6. Strategic Groups for CVC Units
Separating the period from 2003 into two distinct waves is essential to understand
that there was a learning period on the fourth wave that enabled new strategies and
patterns on the fifth wave that begins in 2010 and lasts until the present moment.
However, it is also strategical to understand the characteristics and new patterns of
the actors that drove this change: the CVC units. Some characteristics of CVC
activity are given by elements outside of the CVC unit, such as the stage of the
invested companies, the average value of investments and business models, etc.
Figure 19 illustrates the difference and relationships between CVC units and CVC
activity (DUSHNITSKY, 2012).
Figure 19: CVC Units and CVC Activity
Source: Adapted from (DUSHNITSKY, 2012)
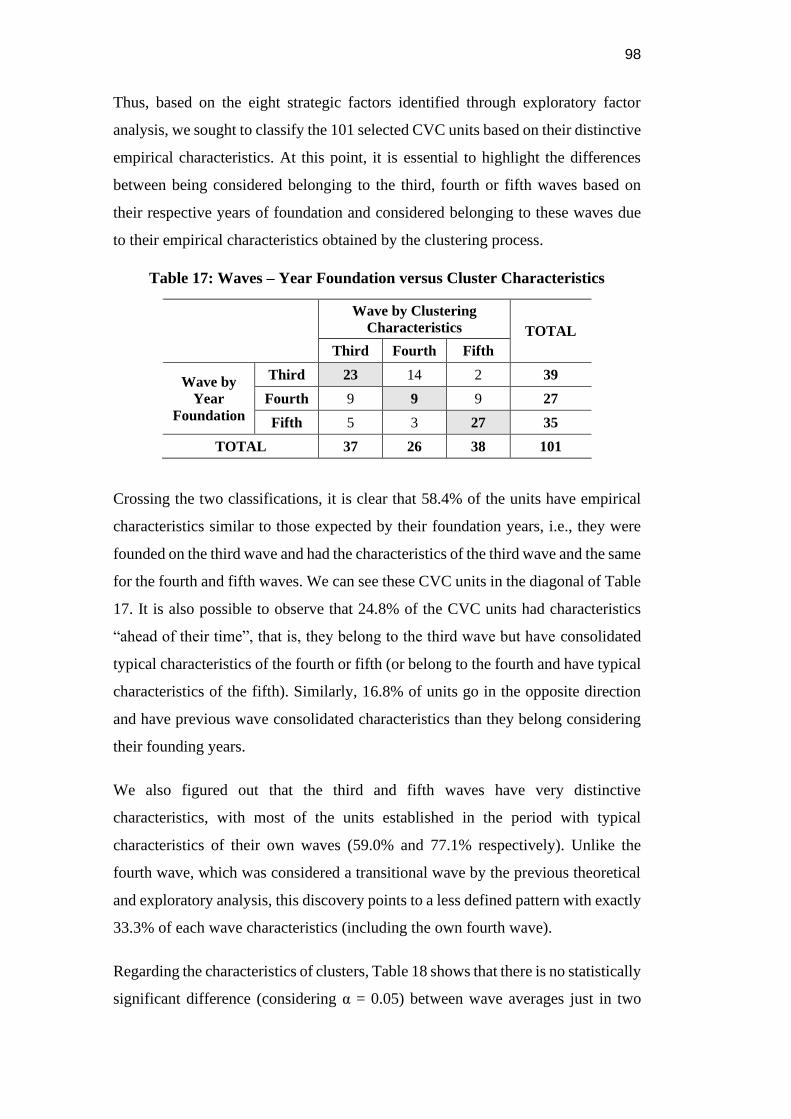
98
Thus, based on the eight strategic factors identified through exploratory factor
analysis, we sought to classify the 101 selected CVC units based on their distinctive
empirical characteristics. At this point, it is essential to highlight the differences
between being considered belonging to the third, fourth or fifth waves based on
their respective years of foundation and considered belonging to these waves due
to their empirical characteristics obtained by the clustering process.
Table 17: Waves – Year Foundation versus Cluster Characteristics
Wave by Clustering
Characteristics TOTAL
Third Fourth Fifth
Wave by
Year
Foundation
Third 23 14 2 39
Fourth 9 9 9 27
Fifth 5 3 27 35
TOTAL 37 26 38 101
Crossing the two classifications, it is clear that 58.4% of the units have empirical
characteristics similar to those expected by their foundation years, i.e., they were
founded on the third wave and had the characteristics of the third wave and the same
for the fourth and fifth waves. We can see these CVC units in the diagonal of Table
17. It is also possible to observe that 24.8% of the CVC units had characteristics
“ahead of their time”, that is, they belong to the third wave but have consolidated
typical characteristics of the fourth or fifth (or belong to the fourth and have typical
characteristics of the fifth). Similarly, 16.8% of units go in the opposite direction
and have previous wave consolidated characteristics than they belong considering
their founding years.
We also figured out that the third and fifth waves have very distinctive
characteristics, with most of the units established in the period with typical
characteristics of their own waves (59.0% and 77.1% respectively). Unlike the
fourth wave, which was considered a transitional wave by the previous theoretical
and exploratory analysis, this discovery points to a less defined pattern with exactly
33.3% of each wave characteristics (including the own fourth wave).
Regarding the characteristics of clusters, Table 18 shows that there is no statistically
significant difference (considering α = 0.05) between wave averages just in two
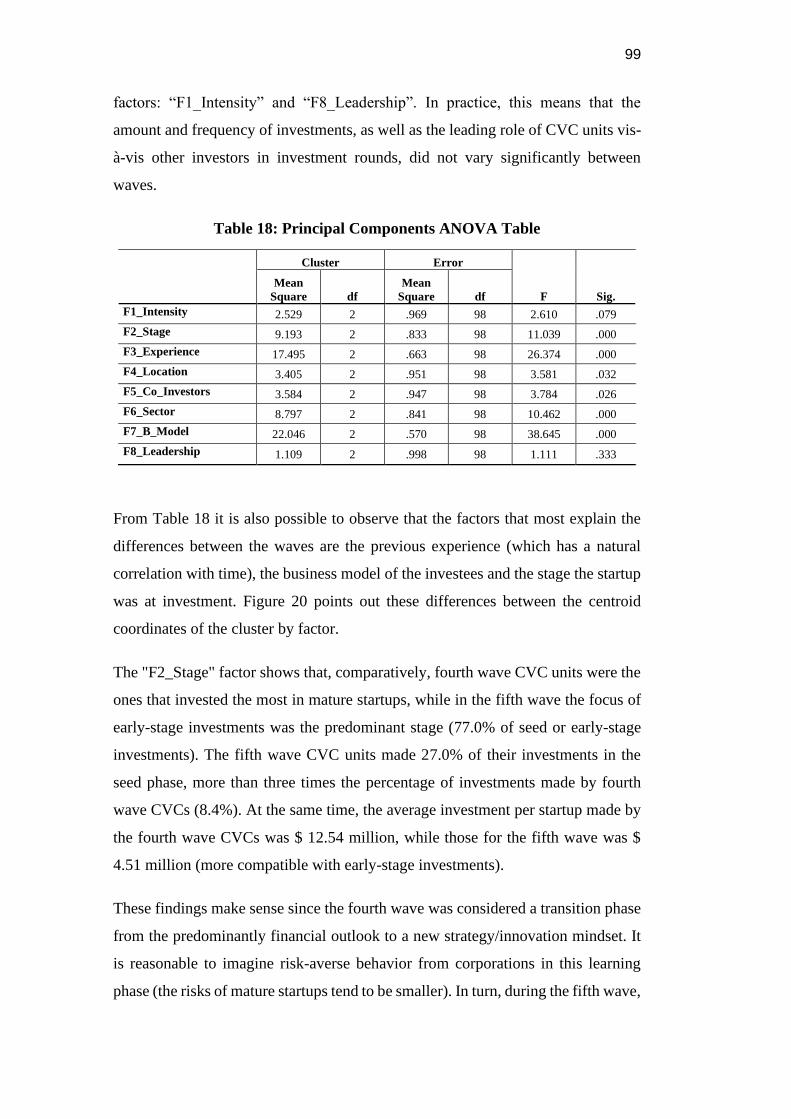
99
factors: “F1_Intensity” and “F8_Leadership”. In practice, this means that the
amount and frequency of investments, as well as the leading role of CVC units vis-
à-vis other investors in investment rounds, did not vary significantly between
waves.
Table 18: Principal Components ANOVA Table
Cluster Error
F Sig.
Mean
Square df
Mean
Square df
F1_Intensity 2.529 2 .969 98 2.610 .079
F2_Stage 9.193 2 .833 98 11.039 .000
F3_Experience 17.495 2 .663 98 26.374 .000
F4_Location 3.405 2 .951 98 3.581 .032
F5_Co_Investors 3.584 2 .947 98 3.784 .026
F6_Sector 8.797 2 .841 98 10.462 .000
F7_B_Model 22.046 2 .570 98 38.645 .000
F8_Leadership 1.109 2 .998 98 1.111 .333
From Table 18 it is also possible to observe that the factors that most explain the
differences between the waves are the previous experience (which has a natural
correlation with time), the business model of the investees and the stage the startup
was at investment. Figure 20 points out these differences between the centroid
coordinates of the cluster by factor.
The "F2_Stage" factor shows that, comparatively, fourth wave CVC units were the
ones that invested the most in mature startups, while in the fifth wave the focus of
early-stage investments was the predominant stage (77.0% of seed or early-stage
investments). The fifth wave CVC units made 27.0% of their investments in the
seed phase, more than three times the percentage of investments made by fourth
wave CVCs (8.4%). At the same time, the average investment per startup made by
the fourth wave CVCs was $ 12.54 million, while those for the fifth wave was $
4.51 million (more compatible with early-stage investments).
These findings make sense since the fourth wave was considered a transition phase
from the predominantly financial outlook to a new strategy/innovation mindset. It
is reasonable to imagine risk-averse behavior from corporations in this learning
phase (the risks of mature startups tend to be smaller). In turn, during the fifth wave,
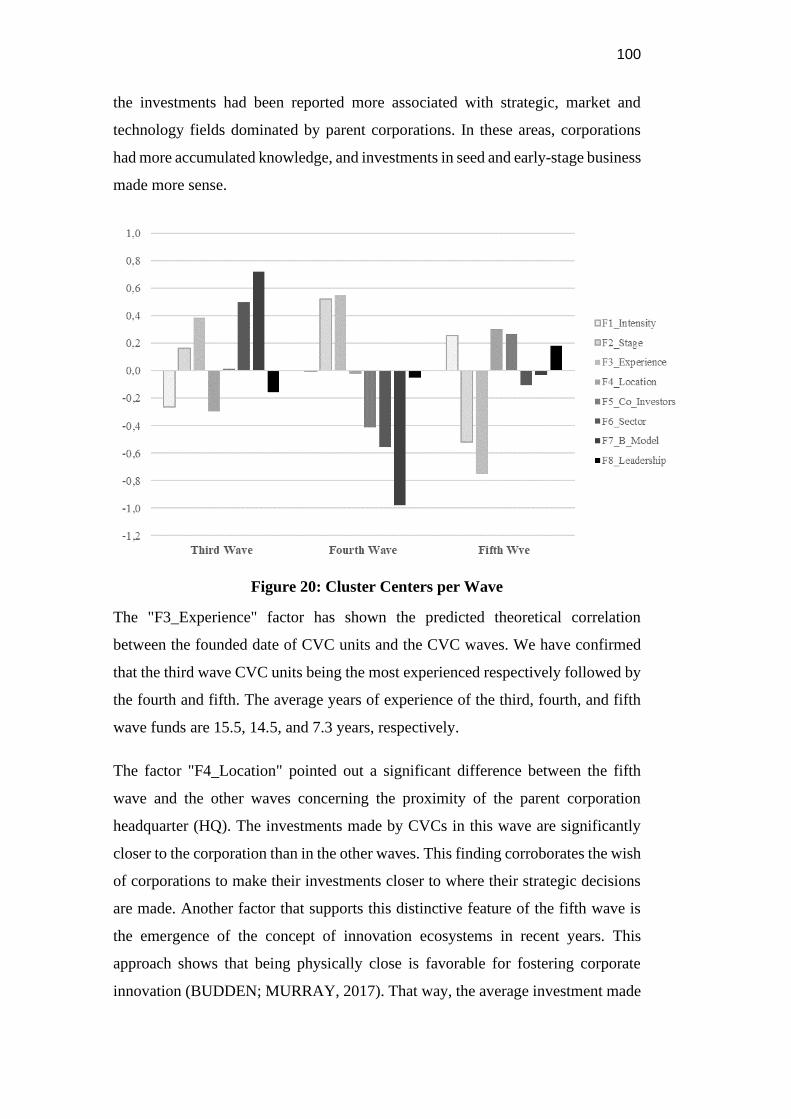
100
the investments had been reported more associated with strategic, market and
technology fields dominated by parent corporations. In these areas, corporations
had more accumulated knowledge, and investments in seed and early-stage business
made more sense.
Figure 20: Cluster Centers per Wave
The "F3_Experience" factor has shown the predicted theoretical correlation
between the founded date of CVC units and the CVC waves. We have confirmed
that the third wave CVC units being the most experienced respectively followed by
the fourth and fifth. The average years of experience of the third, fourth, and fifth
wave funds are 15.5, 14.5, and 7.3 years, respectively.
The factor "F4_Location" pointed out a significant difference between the fifth
wave and the other waves concerning the proximity of the parent corporation
headquarter (HQ). The investments made by CVCs in this wave are significantly
closer to the corporation than in the other waves. This finding corroborates the wish
of corporations to make their investments closer to where their strategic decisions
are made. Another factor that supports this distinctive feature of the fifth wave is
the emergence of the concept of innovation ecosystems in recent years. This
approach shows that being physically close is favorable for fostering corporate
innovation (BUDDEN; MURRAY, 2017). That way, the average investment made
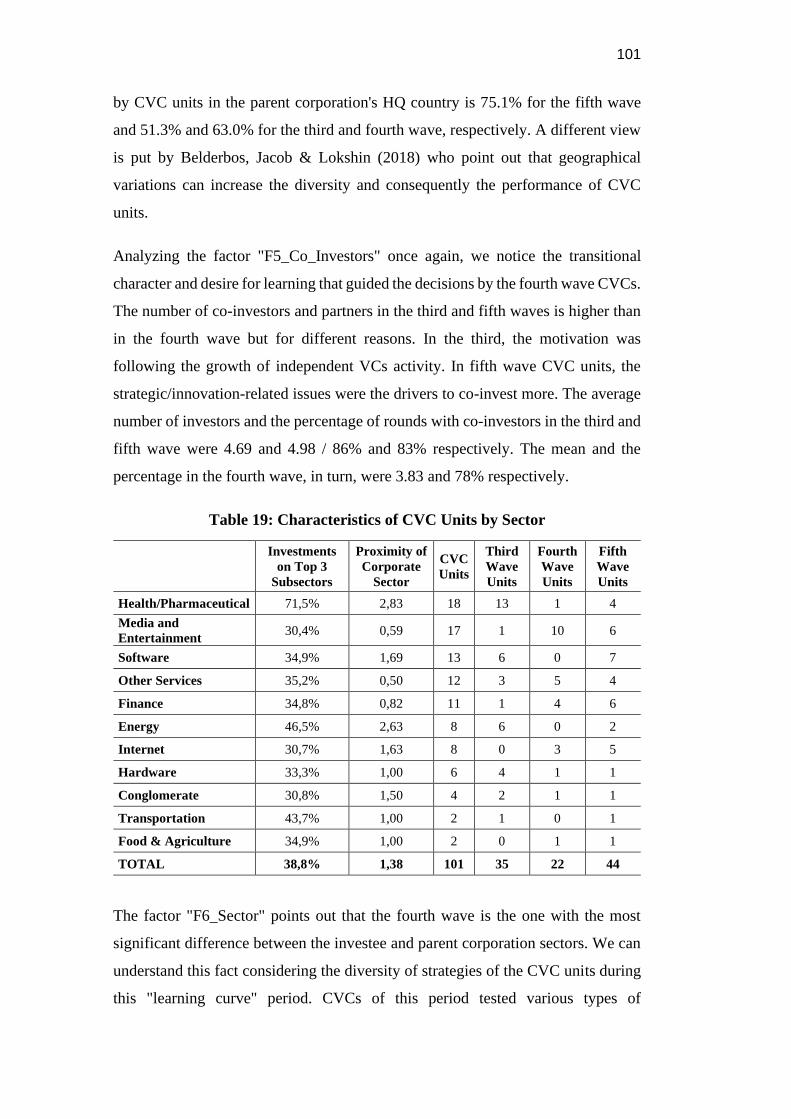
101
by CVC units in the parent corporation's HQ country is 75.1% for the fifth wave
and 51.3% and 63.0% for the third and fourth wave, respectively. A different view
is put by Belderbos, Jacob & Lokshin (2018) who point out that geographical
variations can increase the diversity and consequently the performance of CVC
units.
Analyzing the factor "F5_Co_Investors" once again, we notice the transitional
character and desire for learning that guided the decisions by the fourth wave CVCs.
The number of co-investors and partners in the third and fifth waves is higher than
in the fourth wave but for different reasons. In the third, the motivation was
following the growth of independent VCs activity. In fifth wave CVC units, the
strategic/innovation-related issues were the drivers to co-invest more. The average
number of investors and the percentage of rounds with co-investors in the third and
fifth wave were 4.69 and 4.98 / 86% and 83% respectively. The mean and the
percentage in the fourth wave, in turn, were 3.83 and 78% respectively.
Table 19: Characteristics of CVC Units by Sector
Investments
on Top 3
Subsectors
Proximity of
Corporate
Sector
CVC
Units
Third
Wave
Units
Fourth
Wave
Units
Fifth
Wave
Units
Health/Pharmaceutical 71,5% 2,83 18 13 1 4
Media and
Entertainment 30,4% 0,59 17 1 10 6
Software 34,9% 1,69 13 6 0 7
Other Services 35,2% 0,50 12 3 5 4
Finance 34,8% 0,82 11 1 4 6
Energy 46,5% 2,63 8 6 0 2
Internet 30,7% 1,63 8 0 3 5
Hardware 33,3% 1,00 6 4 1 1
Conglomerate 30,8% 1,50 4 2 1 1
Transportation 43,7% 1,00 2 1 0 1
Food & Agriculture 34,9% 1,00 2 0 1 1
TOTAL 38,8% 1,38 101 35 22 44
The factor "F6_Sector" points out that the fourth wave is the one with the most
significant difference between the investee and parent corporation sectors. We can
understand this fact considering the diversity of strategies of the CVC units during
this "learning curve" period. CVCs of this period tested various types of
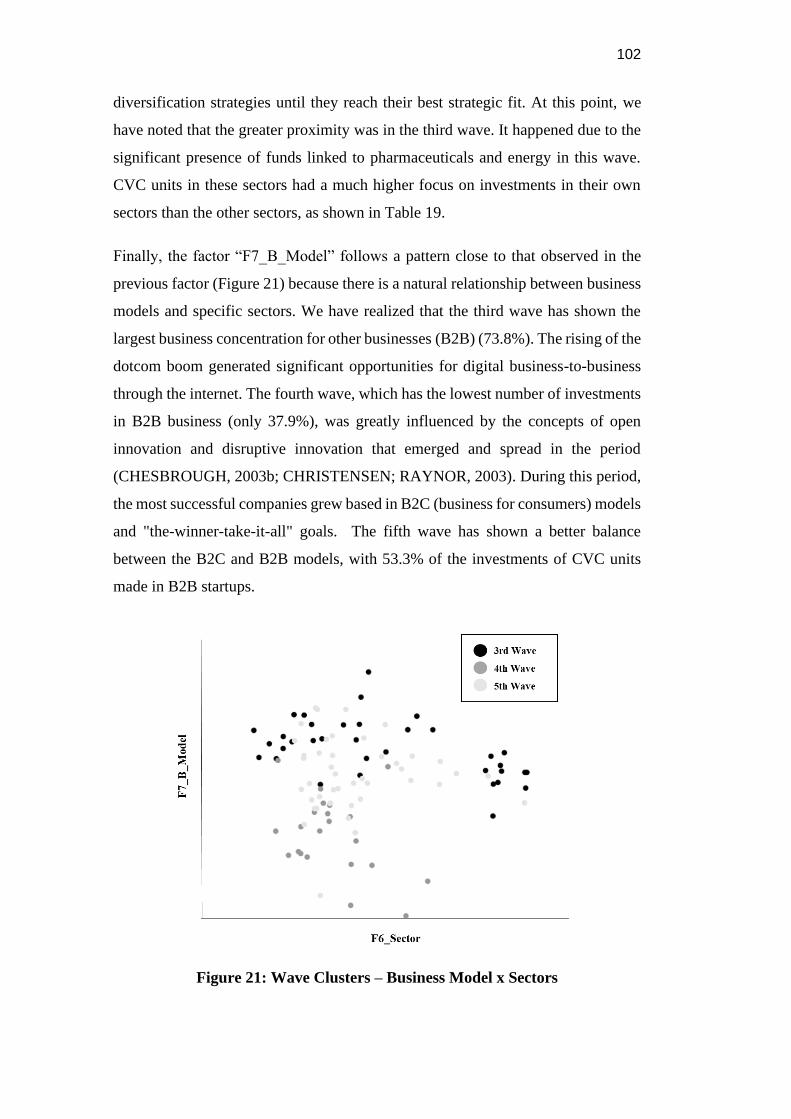
102
diversification strategies until they reach their best strategic fit. At this point, we
have noted that the greater proximity was in the third wave. It happened due to the
significant presence of funds linked to pharmaceuticals and energy in this wave.
CVC units in these sectors had a much higher focus on investments in their own
sectors than the other sectors, as shown in Table 19.
Finally, the factor “F7_B_Model” follows a pattern close to that observed in the
previous factor (Figure 21) because there is a natural relationship between business
models and specific sectors. We have realized that the third wave has shown the
largest business concentration for other businesses (B2B) (73.8%). The rising of the
dotcom boom generated significant opportunities for digital business-to-business
through the internet. The fourth wave, which has the lowest number of investments
in B2B business (only 37.9%), was greatly influenced by the concepts of open
innovation and disruptive innovation that emerged and spread in the period
(CHESBROUGH, 2003b; CHRISTENSEN; RAYNOR, 2003). During this period,
the most successful companies grew based in B2C (business for consumers) models
and "the-winner-take-it-all" goals. The fifth wave has shown a better balance
between the B2C and B2B models, with 53.3% of the investments of CVC units
made in B2B startups.
Figure 21: Wave Clusters – Business Model x Sectors
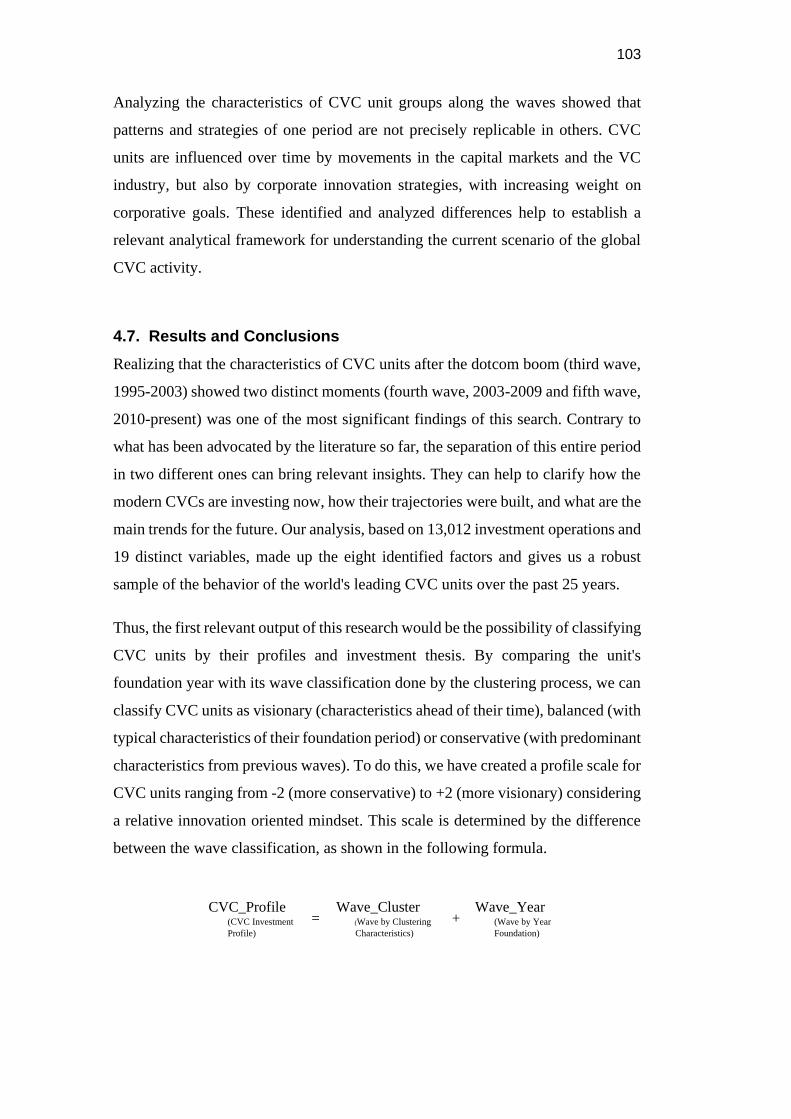
103
Analyzing the characteristics of CVC unit groups along the waves showed that
patterns and strategies of one period are not precisely replicable in others. CVC
units are influenced over time by movements in the capital markets and the VC
industry, but also by corporate innovation strategies, with increasing weight on
corporative goals. These identified and analyzed differences help to establish a
relevant analytical framework for understanding the current scenario of the global
CVC activity.
4.7. Results and Conclusions
Realizing that the characteristics of CVC units after the dotcom boom (third wave,
1995-2003) showed two distinct moments (fourth wave, 2003-2009 and fifth wave,
2010-present) was one of the most significant findings of this search. Contrary to
what has been advocated by the literature so far, the separation of this entire period
in two different ones can bring relevant insights. They can help to clarify how the
modern CVCs are investing now, how their trajectories were built, and what are the
main trends for the future. Our analysis, based on 13,012 investment operations and
19 distinct variables, made up the eight identified factors and gives us a robust
sample of the behavior of the world's leading CVC units over the past 25 years.
Thus, the first relevant output of this research would be the possibility of classifying
CVC units by their profiles and investment thesis. By comparing the unit's
foundation year with its wave classification done by the clustering process, we can
classify CVC units as visionary (characteristics ahead of their time), balanced (with
typical characteristics of their foundation period) or conservative (with predominant
characteristics from previous waves). To do this, we have created a profile scale for
CVC units ranging from -2 (more conservative) to +2 (more visionary) considering
a relative innovation oriented mindset. This scale is determined by the difference
between the wave classification, as shown in the following formula.
CVC_Profile (CVC Investment
Profile)
Wave_Cluster (Wave by Clustering
Characteristics)
Wave_Year (Wave by Year
Foundation) = +
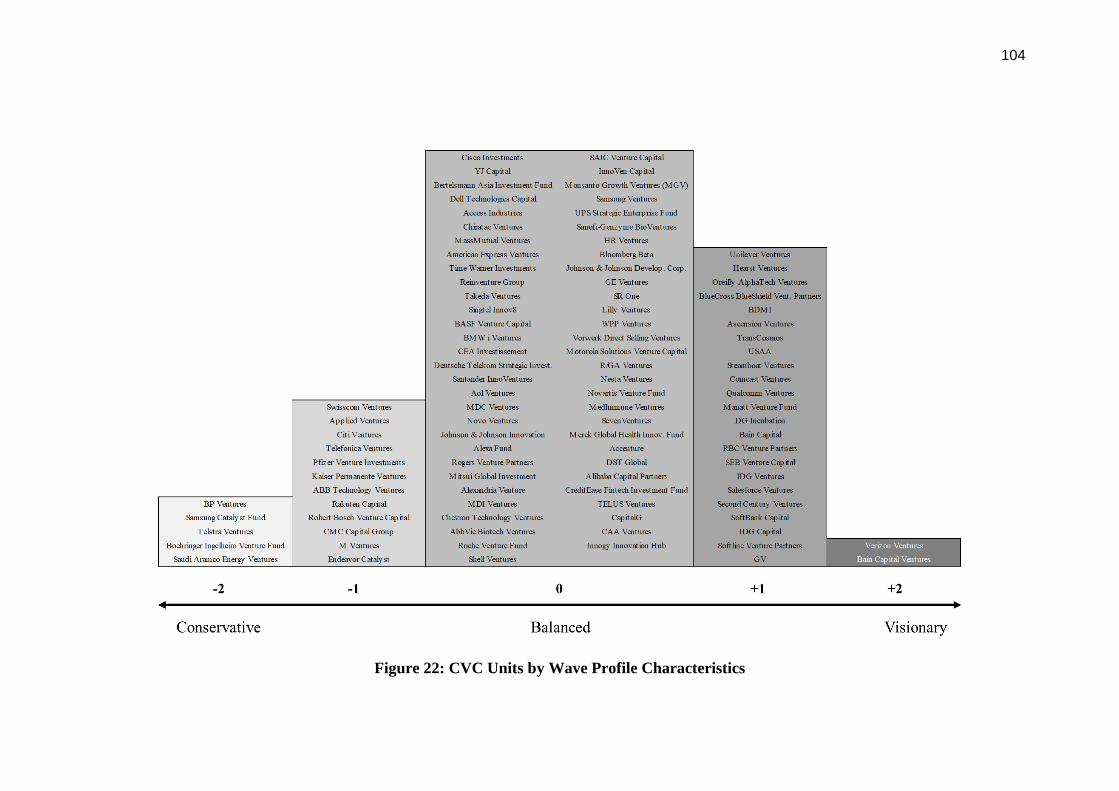
104
Figure 22: CVC Units by Wave Profile Characteristics
105
At this point, it is relevant to consider that we analyze CVC units by their overall
consolidated characteristics. Some of these units may have changed their investment
patterns over time and/or may change it from now on. This finding can be seen both as a
research limitation and as a suggestion for future research, notably longitudinal studies
on the characteristics of CVC units using this classification.
It is essential to note that this scale could be used as a relevant parameter when we are
considering the investment profile, but the scale is not able to analyze the internal
particularities of each unit. By other distinctive criteria, we could classify a CVC as
visionary or conservative using another logical framework. At this point, we may even
suggest that future research look at the internal aspects of CVC units such as governance,
processes, and absorptive capacity. Other works have been dealing with the subject of
governance and processes in CVC such as (ANOKHIN; PECK; WINCENT, 2016;
COOPER, 2008; HILL; BIRKINSHAW, 2008; LIN; LEE, 2011), but the separation of
the last three waves made in this article may help elucidate substantial questions about
the learning curve and future pathways inside the CVC units, the invested startups, and
the parent corporations.
Using the developed scale, we have performed the exercise of classifying the 101 units
of CVC used in this study as shown in Figure 22. As we can see, the vast majority of units
(58.4%) are in scale 0, showing a considerable fit between theory and practice. However,
we can also observe that there is a small amount of high conservative (5) or high visionary
(2) units.
Another critical finding is the detailed characterization of the last three waves that can be
used as a comparative guide for CVC units in operation today or other ones that will be
created in the future. In a general analysis, the fourth wave, which began in the same year
as the concept of open innovation, can be considered a transition phase from CVCs based
on independent VC practices (financial focus typical from the third wave and previous
ones) to an innovation-driven CVC mindset. The strategic and innovation-related
approach has become the mainstream in the CVC area during the fifth wave. The learning
curve provided by the fourth wave concludes that the mutual advantages of cooperation
between corporations and startups for innovation are very relevant. The combination of
access to capital, market, and complementary assets of corporations with the flexibility
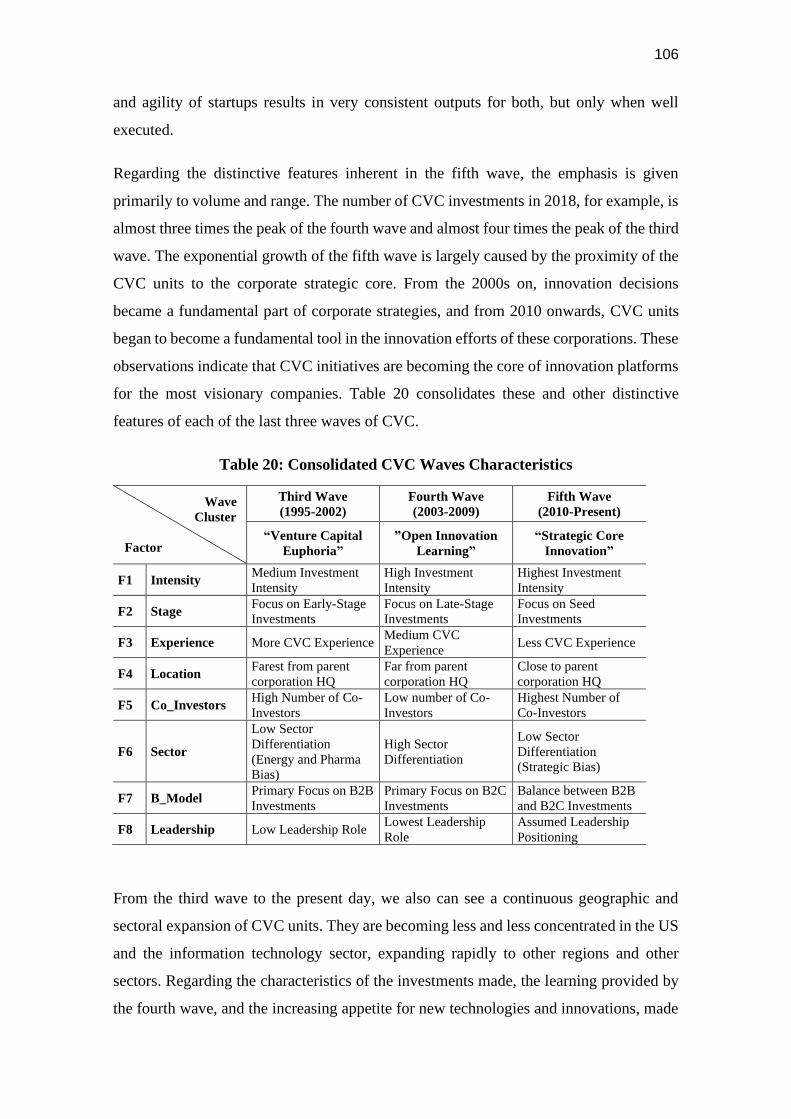
106
and agility of startups results in very consistent outputs for both, but only when well
executed.
Regarding the distinctive features inherent in the fifth wave, the emphasis is given
primarily to volume and range. The number of CVC investments in 2018, for example, is
almost three times the peak of the fourth wave and almost four times the peak of the third
wave. The exponential growth of the fifth wave is largely caused by the proximity of the
CVC units to the corporate strategic core. From the 2000s on, innovation decisions
became a fundamental part of corporate strategies, and from 2010 onwards, CVC units
began to become a fundamental tool in the innovation efforts of these corporations. These
observations indicate that CVC initiatives are becoming the core of innovation platforms
for the most visionary companies. Table 20 consolidates these and other distinctive
features of each of the last three waves of CVC.
Table 20: Consolidated CVC Waves Characteristics
Wave
Cluster
Factor
Third Wave
(1995-2002)
Fourth Wave
(2003-2009)
Fifth Wave
(2010-Present)
“Venture Capital
Euphoria”
”Open Innovation
Learning”
“Strategic Core
Innovation”
F1 Intensity Medium Investment
Intensity
High Investment
Intensity
Highest Investment
Intensity
F2 Stage Focus on Early-Stage
Investments
Focus on Late-Stage
Investments
Focus on Seed
Investments
F3 Experience More CVC Experience Medium CVC
Experience Less CVC Experience
F4 Location Farest from parent
corporation HQ
Far from parent
corporation HQ
Close to parent
corporation HQ
F5 Co_Investors High Number of Co-
Investors
Low number of Co-
Investors
Highest Number of
Co-Investors
F6 Sector
Low Sector
Differentiation
(Energy and Pharma
Bias)
High Sector
Differentiation
Low Sector
Differentiation
(Strategic Bias)
F7 B_Model Primary Focus on B2B
Investments
Primary Focus on B2C
Investments
Balance between B2B
and B2C Investments
F8 Leadership Low Leadership Role Lowest Leadership
Role
Assumed Leadership
Positioning
From the third wave to the present day, we also can see a continuous geographic and
sectoral expansion of CVC units. They are becoming less and less concentrated in the US
and the information technology sector, expanding rapidly to other regions and other
sectors. Regarding the characteristics of the investments made, the learning provided by
the fourth wave, and the increasing appetite for new technologies and innovations, made
107
the investments in startups in earlier phases grow considerably. Seed phase investments
nearly tripled in relative share between fourth and fifth wave investments (8.3% versus
24.7%). Otherwise, the investments in late-stage VC fell by almost a third following the
same comparison (33.4% versus 22.8% respectively).
The strategic approach of startup investments has also made the corporations increase
their positions as leaders in investment rounds during the fifth wave. The percentage of
rounds led by CVC units in the third wave was 22.9% and rose to 29.9% in the fifth wave.
The percentage of solo rounds, i.e., without any co-investor, rose from 14% in the third
wave to 22.5% in the fourth and fell again, going to 17.4% in the fifth wave. We can
explain this latest move against an upward linear trend in many ways. The CVCs have
found ideal partners along previous waves, they have expanded to other sectors, or they
have tried to mitigate their risk through diversification strategies when they lead
investment rounds. For the scope of this research, we have not explored these reasons in
depth, which would undoubtedly be an interesting topic to investigate in future research.
The most active sectors considering the number of CVC units are Health (18), Media /
Entertainment (17), Software (13), Finance (11), Energy (8) and Internet (8) and there is
no pre-established standard common to all. First of all, we have to highlight the
Media/Entertainment and Internet sectors. These sectors had recently experienced major
disruptions and had almost no presence in the third wave. In a general way, they were just
starting their CVC activity during the fourth wave, already with innovation bias.
Another interesting factor is the absence of Health, Energy, and Software CVC units in
the fourth wave. These sectors, older than the Internet companies, apparently jumped the
fourth wave from a more financial logic to one directly linked to strategic innovations in
their core business. The reason why could be that these sectors were less pressured by
the rapid disruption than the Media/Entertainment or Finance sectors, for instance. This
unsurprising, as they are the three sectors that have the highest percentage of investments
in startups linked to core sectors (Health 71.5%, Energy 46.5% and Software 34.9%).
In this analysis, Health and Energy deserve special mention because of their unique
characteristics. They are sectors that involve investments in what are called "hardtech
startups", i.e., startups that go beyond the digital world and deal with physical world
problems such as scientific research, manufacturing, supply chain, verticalization,
108
expansion adjustment, and others (WERWATH, 2019). Thus, the CVC units in these
sectors have quite different characteristics, such as the lowest B2C business percentages
(12.8% and 11.2%) and the highest business percentages within their own sector.
Building a qualitative comparison between these sectors with each other and with
Software/Internet from the perspective of CVCs and the fifth wave may be an interesting
object for future research and it could complement the independent VC view presented
by (GADDY et al., 2017).
Finally, the current volume of investments, the accelerated growth in recent years, the
strategic focus of investments, and the higher degree of commitment among the parties
(startups and corporations) are leading the CVC activity to another level. We can
conclude in this context that the fifth wave is paving the way for CVC units acting as
central platforms for a broader network of strategic innovation. These structures could be
one of the best ways to capture value in co-development and other cooperation with
startups in the primary and adjacent parent corporations' chains.
In the past, the R&D centers, the innovation funnels and, most recently, the open
innovation process all played a central role in the innovation management field. At the
current rate, the proliferation of CVC units is becoming more and more relevant in the
context of corporate innovation, and it could become a new mainstream in a few years.
The correct identification and characterization of the fifth wave of CVC can have been a
relevant step in this path.
109
5 CONCLUSIONS
Throughout the three articles, we have observed different perspectives and the role of the
main actors in the open innovation process facing the great challenge of the energy
transition. In the last article, we have analyzed the phenomenon of the fifth wave without
the restricted sectorial energy view because the use of CVCs as a strategic innovation tool
is still a recent phenomenon. An analysis with the specific energy cut would address only
eight CVC units (CRUNCHBASE, 2019). However, ignoring the CVCs phenomena
during the energy transition would be a mistake considering that the cooperation between
corporations and startups in the energy sector is readily increasing in the context of open
innovations (GLOBAL CORPORATE VENTURING, 2016; LIVIERATOS;
LEPENIOTIS, 2017).
The energy sector will invest trillions of dollars in the coming years (BP 2018; IEA
2019a). The standards set over the last century in the energy sector are expected to change
in the coming decades, but there is still no consensus on the exact ways. We have just
established today the macro trend of the three "Ds": Decarbonization, Decentralization,
and Digitization.
This context, including the certainty about directions but uncertainty about the path, is
pretty similar to the internet diffusion way. That similarity favors the adoption of the open
innovation model where multiple collaborative fronts can be executed simultaneously in
an organized fashion, both inside and outside incumbent companies in the sector. The
platform strategy present in eight of the ten most valuable companies in the world today
(PARKER; VAN ALSTYNE; CHOUDARY, 2016) proved to be the "right way" for
internet companies after the dotcom boom. However, the "right way" is not clear enough
for energy companies. To understand this way is critical to understanding the role of the
top five actors in the open innovation process throughout the energy transition:
universities, corporations, government, startups, and venture capitalists.
In the first article, we realized the importance of the government's role in the face of
significant challenges such as the post by the energy transition. Mission-oriented program
structures such as the used in the development of the atomic bomb (Project Manhattan)
and the man-to-moon travel (Project Apollo), when correctly adapted, gave us relevant
110
insights into how to address the decarbonization challenge of the energy matrix. In this
paper, we review the literature on mission-oriented public policies, adapting these
findings to the context of the energy sector. We also have established an analytical
framework that can guide the construction of future mission-oriented programs by
funding agencies. Applying the framework to three real Brazilian cases (PAISS, PAISS
2 and Inova Energia Programs), we realize the importance of coordinated actions between
instruments to foster innovation, from different government entities, and among
corporations and universities.
In the second article, our focus was on the other two actors who are not part of the original
triple-helix: startups and venture capital funds. We have analyzed ten variables related to
energy startups that received venture capital investments and that have reached the IPO
or closed their activities in the last 20 years. We realize that the volume invested before
the IPO and the existence of new business models are the two main factors that determine
the success of an energy startup. However, the most significant value of this study is the
very operation of the model, which can improve by 18% the accuracy of the selection
process of a successful energy startup. Considering that a cleantech investor looks at
about 100 business plans to make a single investment (MARCUS; MALEN; ELLIS,
2013), applying and improving this model can be an excellent opportunity for venture
capitalists and innovation agencies.
In the third article, our focus was on characterizing the fifth wave of corporate venture
capital (CVC). The previous literature reports that the first waves of CVC were motivated
for financial reasons. However, recently, the CVC units have been used more widely as
tools for fostering innovation within large companies. We realize that this change of
mindset is radically changing this industry. They are bringing it to much higher levels
than previous waves due to the current proximity of CVC units to the strategic core of
corporations. The current key characteristics of the fifth wave include more seed-stage
investments, more global CVC presence (but the CVC units are getting closer to their
headquarters), more sectoral diversification with particular pharmaceutical and energy
CVC profiles. In this article, we had a limitation trying to analyze energy funds alone
because there were not enough cases for an industry-focused cluster analysis. However,
this initial limitation has turned out to be a good thing. The comparison with other sectors
has generated valuable insights into how this phenomenon may expand in different areas.
111
The overall conclusion from the joint analysis of the three articles is that all five key
players in the innovative process (university, business, government, startups and venture
capitalists) will play critical roles during the energy transition. In the internet revolution
in the early 2000s, there was a vast preponderance of startups and venture capitalists over
the other players of the traditional triple-helix (universities, corporations, and
government). There have even been cases of specific antagonisms between these
institutions. Some well-known entrepreneurs were positively recognized for leaving their
universities to set up their companies such as Mark Zuckerberg (Facebook), Steve Jobs
(Apple) and Bill Gates (Microsoft). At the same time, some startups were focused on
creating disruptions that could wipe out established corporations in traditional industries.
About government, The idea of free enterprise and the visionary ability of venture
capitalists sometimes contrasted with the slower and more centralized design common to
governments. However, the perception built over the three articles leads us to consider
that this will be different during the energy transition.
The diffusion of innovations in the energy sector requires a large amount of accumulated
capital, usually found in large corporations. In this sense, we realize that the cooperation
between startups and corporations through the CVC units (third article) is multiplying
and should play a critical role in the energy transition. The learning absorbed during the
fourth wave of CVC makes the fifth wave's units operate much more efficiently in the
generation, the diffusion, and the absorption of innovations.
Likewise, the prioritizing process, the coordination of incentive mechanisms, and also the
regulatory issues (critical in the context of the energy sector) highlights the crucial role
to be played by governments. The mission-oriented approach (First article) when facing
big challenges seems to us to be very promising in this scenario because of its multi-effort
and stakeholder coordination characteristics. The role of the State in the energy matrix
decarbonization has been and will continue to be vital.
Finally, the startups and venture capitalists will also be relevant in the energy transition
context. The second article shows that some patterns of success are beginning to emerge.
The business model innovations generated by energy startups can set new standards,
especially regarding digitization and decentralization of the energy sector. With the
perception of an equalized importance among the Penta-helix stakeholders, the great
challenge will become the construction of the even more complex model of cooperation

112
between the parties, a great suggestion for future researches.
113
REFERENCES
ABDI. Plano Brasil Maior: Balanço Executivo 2011-2014. Brasília, DF: 2012.
ABDMOULEH, Z.; ALAMMARI, R. A. M.; GASTLI, A. Review of Policies
Encouraging Renewable Energy Integration & Best Practices. Renewable and
Sustainable Energy Reviews, v. 45, n. 1, p. 249–262, 2015.
ADNER, R.; KAPOOR, R. Value Creation in Innovation Ecosystems: How the Structure
of Technological Interdependence Affects Firm Performance in New Technology
Generations. Strategic Management Journal, v. 31, n.1 p. 306–333, 2010.
ALEXANDER, B. et al. Alphabet Energy: Thermoelectrics and Market Entry. California
Management Review, v. 55, n. 1, p. 1–19, 2012.
ALLAIRE, M.; BROWN, S. P. A. The Green Paradox of U.S. Biofuel Subsidies: Impact
on Greenhouse Gas Emissions. Economics of Energy and Environmental Policy, v. 4,
n. 2, 2015.
ALMEIDA, C. M. V. B. et al. Cleaner Production towards a Sustainable Transition.
Journal of Cleaner Production, v. 142, n. 2017 p. 1–7, 2017.
AMANATIDOU, E. et al. Using Evaluation Research as a Means for Policy Analysis in
a ‘New’ Mission-Oriented Policy Context. Minerva, v. 52, n. 4, p. 419–438, 2014.
ANADÓN, L. D. Missions-Oriented RD&D Institutions in Energy between 2000 and
2010: A comparative analysis of China, the United Kingdom, and the United States.
Research Policy, v. 41, n. 10, p. 1742–1756, 2012.
ANOKHIN, S.; PECK, S.; WINCENT, J. Corporate Venture Capital: The Role of
Governance Factors. Journal of Business Research, v. 69, n. 11, p. 4744–4749, 2016.
ARGENTIERO, A. et al. Comparing Renewable Energy Policies in E.U.15, U.S. and
China : A Bayesian DSGE Model. The Energy Journal, v. 38, n. SI1, p. 77–96, 2017.
ATKINSON, R. D.; MCKAY, A. S. Digital Prosperity: Understanding the Economic
Benefits of the Information Technology Revolution. Washington, D.C.: The
Information Technology and Innovation Foundation, 2013.
BANNERJEE, S.; BIELLI, S.; HALEY, C. Scaling Together: Overcoming Barries in
Corporate-Startups Collaboration. London: NESTA, 2016.
BARRETTO-KO, P. Corporate Venture Capital: Transforming CVC into an
Effective Corporate Strategic Tool for Seeking Innovation and Growth in the 21st
Century. p. 77, M.Sc. - Sloan School of Management, Massachusetts Institute of
Technology, 2011.
BELDERBOS, R.; JACOB, J.; LOKSHIN, B. Corporate Venture Capital (CVC)
Investments and Technological Performance: Geographic Diversity and the Interplay
with Technology Alliances. Journal of Business Venturing, v. 33, n. 1, p. 20–34, 2018.
114
BELLIDO, M. M. H. et al. Maturity-Based Analysis of Emerging Technologies in the
Brazilian Power Sector. Journal of Cleaner Production, v. 243, n. 1 p. 118-132, 2019.
BENSON, D.; ZIEDONIS, R. H. R. H. Corporate Venture Capital and the Returns to
Acquiring Portfolio Companies. Journal of Financial Economics, v. 98, n. 3, p. 478–
499, 2010.
BIELESCH, F. et al. Corporate Venture Capital: Avoid the Risk, Miss the Rewards.
Boston, MA: BCG, 2012.
BIERWERTH, M. et al. Corporate Entrepreneurship and Performance: A Meta-Analysis.
Small Business Economics, v. 45, n. 2, p. 255–278, 2015.
BLOOMBERGNEF. New Energy Outlook 2019. New York, NY: 2019.
BNDES. Plano Inova Empresa Website. Retrieved from:
<http://www.bndes.gov.br/wps/portal/site/home/financiamento/plano-inova-
empresa/plano-inova-empresa>. Access at: August, 24th. 2017.
BORRÁS, S.; EDQUIST, C. The Choice of Innovation Policy Instruments.
Technological Forecasting and Social Change, v. 80, n. 8, p. 1513–1522, 2013.
BP. BP Energy Outlook 2014. London, UK: 2014.
BP. BP Energy Outlook 2016. London, UK: 2016.
BP. BP Energy Outlook 2017. London, UK: 2017.
BP. BP Energy Outlook 2018. London, UK: 2018.
BRAZIL. Estratégia Nacional de Ciência, Tecnologia e Inovação 2012 - 2015.
Brasília, DF: Ministério da Ciência, Tecnologia e Inovação, 2012.
BRAZIL. Plano Inova Empresa. Brasília, DF: Ministério da Ciência, Tecnologia e
Inovação, 2013.
BRIGL, M. et al. Corporate Venturing Shifts Gears: How the Largest Companies
Apply a Broad Set of Tools to Speed Innovation. Boston, MA: BCG, 2014.
BUDDEN, P.; MURRAY, F. A Systematic MIT Approach for Assessing “Innovation-
Driven Entrepreneurship” in Ecosystems (iEcosystems). Cambridge, MA: MIT Lab
for Innovation Science and Policy, 2017.
CANTNER, U.; PYKA, A. Classifying Technological Policy from an Evolutionary
Perspective. Research Policy, v. 30, p. 759–775, 2001.
CARNEIRO, J.; DA SILVA, J. F.; DA ROCHA, A. Strategic Profiles of Brazilian
Exporters and Performance Implications. Journal of Business Research, v. 64, n. 3, p.
250–257, 2011.
CB INSIGHTS. The History Of CVC: From Exxon And DuPont To Xerox And
Microsoft, How Corporates Began Chasing ‘The Future’. New York, NY: 2017.
115
CB INSIGHTS. The 2018 Global CVC Report. New York, NY: 2018.
CB INSIGHTS. The 2017 Global CVC Report. New York, NY: 2017.
CHESBROUGH, H. GE’s Ecomagination Challenge: An Experiment in Open
Innovation. California Management Review, v. 54, n. 3, p. 140–154, 2012.
CHESBROUGH, H. W. Making Sense of Corporate Venture Capital. Harvard Business
Review, v. 80, n. 3, p. 90, 2002.
CHESBROUGH, H. W. Open Innovation: The New Imperative for Creating and
Profiting from Technology. Watertown, MA: Harvard Business School Press, 2003a.
CHESBROUGH, H. W. The Era of Open Iinnovation. Management Review, v. 44, n. 3,
p. 35–41, 2003b.
CHESBROUGH, H. W. Open Innovation: A New Paradigm for Understanding Industrial
Innovation. In: Open Innovation: Researching a New Paradigm. Berkeley, CA:
Oxford University Press, 2006. p. 1–12.
CHESBROUGH, H. W.; APPLEYARD, M. M. Open Innovation and Strategy.
California Management Review, v. 50, n. 1, p. 57–76, 2007.
CHIANG, J. T. From “Mission-Oriented” to “Diffusion-Oriented” Paradigm: The New
Trend of U.S. Industrial Technology Policy. Technovation, v. 11, n. 6, p. 339–356, 1991.
CHOUNG, J. Y.; HWANG, H. R.; SONG, W. Transitions of Innovation Activities in
Latecomer Countries: An Exploratory Case Study of South Korea. World Development,
v. 54, n. 1, p. 156–167, 2014.
CHRISTENSEN, C.; RAYNOR, M. The Innovator’s Solution: Creating and
Sustaining Successful Growth. Watertown, MA: Harvard Business Press, 2003.
CHRISTIDIS, K.; DEVETSIKIOTIS, M. Blockchains and Smart Contracts for the
Internet of Things. IEEE Access, v. 4, n. 1, p. 2292–2303, 2016.
CLEANTECH GROUP; WWF. The Global Cleantech Innovation Index 2017. San
Francisco, US: 2017.
COOPER, R. G. Perspective: The Stage-Gate Idea-to-Launch Process - Update, What’s
New, and NexGen Systems. Journal of Product Innovation Management, v. 25, n. 3,
p. 213–232, 2008.
COVIN, J. G.; MILES, M. P. Strategic Use of Corporate Venturing. Entrepreneurship:
Theory and Practice, v. 31, n. 2, p. 183–207, 2007.
CRUNCHBASE. Crunchbase: Discover innovative companies and the people behind
them. Retrieved from <https://www.crunchbase.com/>. Access at: April, 11st. 2017.
CZARNITZKI, D.; DICK, J.; HUSSINGER, K. The Contribution of Corporate
Ventures to Radical Innovation. Leuven, Belgium: Katholieke Universiteit Leuven,
2010.
116
DA GBADJI, L. A. G.; GAILLY, B. The Use of Corporate Venture Capital as a
Strategic Tool : Literature Review and Key Characteristics of CVC Investments. Louvain, Belgium: Univerité Catholique de Louvain, 2009.
DAHLANDER, L.; PIEZUNKA, H. Open To Suggestions: How Organizations Elicit
Suggestions through Proactive and Reactive Attention. Research Policy, v. 43, n. 5, p.
812–827, 2014.
DASGUPTA, P.; STONEMAN, P. Economic Policy and Technological Performance.
Cambridge, UK: Cambridge University Press, 2005.
DAVILA, A.; FOSTER, G.; GUPTA, M. Venture Capital Financing and the Growth of
Startup Firms. Journal of Business Venturing, v. 18, n. 6, p. 689–708, 2003.
DONADA, C.; LEPOUTRE, J. How can Startups Create the Conditions for a Dominant
Position in the Nascent Industry of Electromobility 2.0? International Journal of
Automotive Technology and Management, v. 16, n. 1, p. 16–29, 2016.
DOSI, G. Beyond the ‘Magic Of The Market’. The Slow Return of Industrial Policy (But
Not Yet in Italy). Economia e Politica Industriale, v. 43, n. 3, p. 261–264, 2016.
DUSHNITSKY, G. Riding the Next Wave of Corporate Venture Capitial. Business
Strategy Review, v. 22, n. 3, p. 44–49, 2011.
DUSHNITSKY, G. Corporate Venture Capital in the 21st Century: An Integral Part of
Firms’ Innovation Toolkit. In: The Oxford Handbook of Venture Capital. Oxford, UK:
Oxford University Press, 2012.
DUSHNITSKY, G.; LENOX, M. J. When Do Incumbents Learn from Entrepreneurial
Ventures?: Corporate Venture Capital and Investing Firm Innovation Rates. Research
Policy, v. 34, n. 5, p. 615–639, 2005.
DUSHNITSKY, G.; LENOX, M. J. When does corporate venture capital investment
create firm value? Journal of Business Venturing, v. 21, n. 6, p. 753–772, 2006.
DUTTA, S. The Global Innovation Index 2011: Accelerating Growth and
Development. Fontainebleau, France: INSEAD, 2011.
EDQUIST, C.; ZABALA-ITURRIAGAGOITIA, J. M. J. M. Public Procurement for
Innovation as Mission-Oriented Innovation Policy. Research Policy, v. 41, n. 10, p.
1757–1769, 2012.
ELEFTHERIADIS, I. M.; ANAGNOSTOPOULOU, E. G. Identifying Barriers in the
Diffusion of Renewable Energy Sources. Energy Policy, v. 80, n. 1, p. 153–164, 2015.
EPE. Balanço Energético Nacional 2015. Rio de Janeiro, RJ: 2015.
ERGAS, H. The Importance of Technology Policy. In: Economic Policy and
Technological Performance. Cambridge, UK: Cambridge University Press, 1987. p. 45.
ETZKOWITZ, H.; LEYDESDORFF, L. The Dynamics of Innovation: From National
Systems and “Mode 2” to a Triple Helix of University–Industry–Government Relations.
117
Research Policy, v. 29, n. 2, p. 109–123, 2000.
FAN, J. S. Catching Disruption: Regulating Corporate Venture Capital. Columbia
Business Law Review, v. 341, n. 1, p. 342–425, 2018.
FARFAN, J.; BREYER, C. Structural Changes of Global Power Generation Capacity
towards Sustainability and the Risk of Stranded Investments Supported by a
Sustainability Indicator. Journal of Cleaner Production, v. 141, n. 1, p. 370–384, 2017.
FERREIRA-LEITAO, V. et al. Biomass Residues in Brazil: Availability and Potential
Uses. Waste and Biomass Valorization, v. 1, n. 1, p. 65–76, 2010.
FINANCIAL TIMES. FT Global 500 2011. London, UK: 2011.
FINEP. PAISS Website. Retrieved from: <http://www.finep.gov.br/apoio-e-
financiamento-externa/programas-e-linhas/programas-inova/paiss>. Access at: August,
23rd. 2017.
FINEP. Inova Energia Website. Retrieved from: <http://www.finep.gov.br/apoio-e-
financiamento-externa/programas-e-linhas/programas-inova/inova-energia>. Access at:
August, 23rd. 2017.
FINEP. PAISS Agrícola Website. Retrieved from: <http://www.finep.gov.br/apoio-e-
financiamento-externa/programas-e-linhas/programas-inova/paiss-agricola>. Access at:
August, 23rd. 2017.
FINEP; BNDES. Edital FINEP/BNDES - Plano Conjunto de Apoio à Inovação
Tecnológica Industrial dos Setores Sucroenergético e Sucroquímico (PAISS). Rio de
Janeiro, RJ: 2011.
FINEP; BNDES. Edital FINEP/BNDES - Plano Conjunto de Apoio à Inovação
Tecnológica Agrícola dos Setores Sucroenergético e Sucroquímico (PAISS
Agrícola). Rio de Janeiro, RJ: 2014.
FINEP; BNDES; ANEEL. Edital ANEEL/BNDES/FINEP - Plano Conjunto de Apoio
à Inovação Tecnológica no Setor Elétrico - Inova Energia. Rio de Janeiro, RJ: 2013.
FORAY, D.; MOWERY, D. C.; NELSON, R. R. Public R&D and Social Challenges:
What Lessons from Mission R&D Programs? Research Policy, v. 41, n. 10, p. 1697–
1702, 2012.
FÜLLER, J. et al. Consumer Empowerment Through Internet-Based Co-creation.
Journal of Management Information Systems, v. 26, n. 3, p. 71–102, 2009.
GADDY, B. et al. Venture Capital and Cleantech: The Wrong Model for Energy
Innovation. Energy Policy, v. 102, n. July, p. 385–395, 2017.
GLENNIE, A.; BOUND, K. How Innovation Agencies Work: International lessons
to inspire and inform national strategies. London, UK: NESTA, 2016.
GLOBAL CORPORATE VENTURING. Oil and Gas Sector Review Venturing 2016.
London, UK: 2016.
118
GOMPERS, P. A. Corporations and the Financing of Innovation: The Corporate
Venturing Experience. Economic Review, v. 1, n. 4, p. 1–23, 2002.
GRECO, M.; LOCATELLI, G.; LISI, S. Open Innovation in the Power & Energy Sector:
Bringing together government policies, companies’ interests, and academic essence.
Energy Policy, v. 104, n. 3, p. 316–324, 2017.
GREENPEACE. Energy [R]evolution. Sttutgart, Germany: 2015.
GUO, B.; LOU, Y.; DAVID, P. Investment , Duration , and Exit Strategies for Corporate
and Independent Venture. Barcelona GSE Working Paper Series, p. 1–54, 2012.
GUO, B.; LOU, Y.; PÉREZ-CASTRILLO, D. Investment, Duration, and Exit Strategies
for Corporate and Independent Venture Capital-Backed Start-Ups. Journal of
Economics and Management Strategy, v. 24, n. 2, p. 415–455, 2015.
GUTMANN, T. Harmonizing Corporate Venturing Modes: An Integrative Review and
Research Agenda. Management Review Quarterly, v. 69, n. 2, p. 121–157, 2019.
HAHN, Y.-H.; YU, P.-I. Towards a New Technology Policy: The Integration of
Generation and Diffusion. Technovation, v. 19, n. 3, p. 177–186, 1999.
HAIR JR, J. F. et al. Multivariate Data Analysis. 7th. ed. London, UK: Pearson Prentice
Hall, 2010.
HARTLEY, P. R.; MEDLOCK, K. B. The Valley of Death for New Energy
Technologies. The Energy Journal, v. 38, n. 3, p. 34–61, 2017.
HERMANN, B. L. et al. The Global Startup Ecosystem Ranking 2015. San Francisco,
US: 2015.
HILL, S. A.; BIRKINSHAW, J. Strategy-Organization Configurations in Corporate
Venture Units: Impact on Performance and Survival. Journal of Business Venturing, v.
23, n. 4, p. 423–444, 2008.
HILL, S. A.; BIRKINSHAW, J. Ambidexterity and Survival in Corporate Venture Units.
Journal of Management, v. 40, n. 7, p. 1899–1931, 2014.
HUISINGH, D. et al. Recent Advances in Carbon Emissions Reduction: Policies,
Technologies, Monitoring, Assessment and Modeling. Journal of Cleaner Production.
v. 103, n. 2015, p. 1–12, 2015.
IEA/USP. Plano Inova Empresa. Retrieved from:
<www.iea.usp.br/midiateca/apresentacao/plano-inova-empresa-melo-e.../at.../file>.
Accesso at: August, 23rd. 2017.
IEA. World Energy Investment Outlook 2014. Paris, France: 2014.
IEA. World Energy Outlook 2015. Paris, France: 2015.
IEA. Global EV Outlook 2016: Beyond one million electric cars. Paris, France: 2016.
119
IEA. World Energy Investment 2017. Paris, France: 2017.
IEA. Perspectives for the Clean Energy Transition: The Critical Role of
BuildingJournal of Chemical Information and Modeling. Paris, France: 2019a.
IEA. World Energy Investment 2019. Paris, France: 2019b.
IEA. Global EV Outlook 2019. Paris, France: 2019c.
INSEAD; 500 STARTUPS. How do the World’s Biggest Companies Deal with the
Startup Revolution. Fontainebleau, France: INSEAD. 2016.
IPCC. Climate Change 2014: Mitigation of Climate Change. Contribution of
Working Group III to the Fifth Assessment Report of the Intergovernmental Panel
on Climate Change. Cambridge, UK: 2014.
JACOBIDES, M. G.; CENNAMO, C.; GAWER, A. Towards a Theory of Ecosystems.
Strategic Management Journal, v. 39, n. 8, p. 2255–2276, 2018.
JARAITE, J.; KARIMU, A.; KAZUKAUSKAS, A. Policy-Induced Expansion of Solar
and Wind Power Capacity: Economic Growth and Employment in EU Countries. The
Energy Journal, v. 38, n. 5, p. 197–222, 2017.
KIM, J.-H.; WAGMAN, L. Portfolio Size and Information Disclosure: An Analysis of
Startup Accelerators. Journal of Corporate Finance, v. 28, n. 12, p. 520–534, 2014.
KOHLER, T. Corporate Accelerators: Building Bridges between Corporations and
Startups. Business Horizons, v. 59, n. 3, p. 347–357, 2016.
KÖHN, A. The Determinants of Startup Valuation in the Venture Capital Context: A
Systematic Review and Avenues for Future Research. Management Review Quarterly,
v. 68, n. 1, p. 1–34, 2017.
KOLLMANN, T.; KUCKERTZ, A. Evaluation Uncertainty of Venture Capitalists’
Investment Criteria. Journal of Business Research, v. 63, n. 7, p. 741–747, 2010.
KPMG. On the Road to Corporate-Startup Collaboration. Amstelveen, Holland:
2015.
KPMG. Global Automotive Executive Survey 2016. Amstelveen, Holland: 2016.
KPMG. Global Executive Automotive Survey 2018. Amstelveen, Holland: 2018.
LAHR, H.; MINA, A. Venture Capital Investments and the Technological Performance
of Portfolio Firms. Research Policy, v. 45, n. 1, p. 303–318, 2016.
LEE, S. U.; KANG, J. Technological Diversification Through Corporate Venture Capital
Investments: Creating Various Options to Strengthen Dynamic Capabilities. Industry
and Innovation, v. 22, n. 5, p. 349–374, 2015.
LEMBER, V.; KATTEL, R.; KALVET, T. Quo Vadis Public Procurement of Innovation?
Innovation: The European Journal of Social Science Research, v. 28, n. 3, p. 403–
120
421, 2015.
LIEDTKE, C. et al. User-Integrated Innovation in Sustainable LivingLabs: An
Experimental Infrastructure for Researching and Developing Sustainable Product Service
Systems. Journal of Cleaner Production, v. 97, p. 106–116, 2015.
LIN, S. J.; LEE, J. R. Configuring a Corporate Venturing Portfolio to Create Growth
Value: Within-Portfolio Diversity and Strategic Linkage. Journal of Business
Venturing, v. 26, n. 4, p. 489–503, 2011.
LIVIERATOS, A. D.; LEPENIOTIS, P. Corporate Venture Capital Programs of
European Electric Utilities: Motives, Trends, Strategies And Challenges. Electricity
Journal, v. 30, n. 2, p. 30–40, 2017.
MA, S. The Life Cycle of Corporate Venture Capital. p. 123, Ph.D. Department of
Business Administration, Duke University, 2016.
MACEDO-SOARES, T. D. VAN A. DE; PAULA, F. DE O.; MENDONÇA, H. L.
Leveraging Firm Innovation Performance Through Alliance Portfolios in Emerging
Economies: the Role of Absorptive Capacity. Journal of Technology Management &
Innovation, v. 12, n. 4, p. 10–21, 2017.
MAKHOBA, X.; POURIS, A. Scientometric Assessment of Selected R&D Priority Areas
in South Africa: A Comparison with Other BRICS Countries. African Journal of
Science, Technology, Innovation and Development, v. 8, n. 2, p. 187–196, 2016.
MARCUS, A.; MALEN, J.; ELLIS, S. The Promise and Pitfalls of Venture Capital as an
Asset Class for Clean Energy Investment. Organization & Environment, v. 26, n. 1, p.
31–60, 2013.
MAULA, M. V. J. Corporate Venture Capital as a Strategic Tool for Corporations. In:
Handbook of Research on Venture Capital. Cheltenham, UK: Edward Elgar
Publishing. 2007.
MAZZUCATO, M. The Entrepreneurial State: Debunking Public vs. Private Sector
Myths. London, UK: Anthem Press, 2013.
MAZZUCATO, M. From Market Fixing to Market-Creating: A New Framework for
Innovation Policy. Industry & Innovation, v. 23, n. 2, p. 140–156, 2016.
MAZZUCATO, M.; PENNA, C. C. R. Mission-Oriented Finance for Innovation: New
Ideas for Investiment-Led Growth. London, UK: Rowman & Littlefield International,
2015.
MAZZUCATO, M.; PENNA, C. C. R. The Brazilian Innovation System: A Mission-
Oriented Policy Proposal. Brasília, DF: CGEE, 2016.
MENDONÇA, H. L. O Impacto das Startups no Setor de Energia. Boletim de
Conjuntura Energética FGV, v. 5, n. 9, p. 7–11, 2017.
MENDONÇA, H. L.; FERREIRA, J.; VINICIUS, M. Energy Startups : Identifying
Winning Standards During the Energy Transition. In: Congresso de Administração
121
Sociedade e Inovação 2018. Anais... Rio de Janeiro, RJ: 2018
MENDONÇA, H. L.; FONSECA, M. V. DE A.; FRENKEL, J. B. Biorefinarias de Cana-
de-Açúcar : Mapas Conceituais como Método de Análise Estratégica para sua Difusão.
In: VIII Simpósio Internacional de Gestão de Projetos, Inovação e Sustentabilidade.
Anais... São Paulo, SP: 2017.
MENDONÇA, H. L.; VAN ADUARD DE MACEDO-SOARES, T. D. L.; FONSECA,
M. V. DE A. Working Towards a Framework Based on Mission-Oriented Practices for
Assessing Renewable Energy Innovation Policies. Journal of Cleaner Production, v.
193, p. 709–719, 2018.
MEYER, T.; MATHONET, P. Y. Beyond the J-Curve: Managing a Portfolio of
Venture Capital and Private Equity Funds. Chichester, UK: John Wiley & Sons Ltd,
2005.
MILANEZ, A. Y. et al. De Promessa a Realidade : Como o Etanol Celulósico Pode
Revolucionar a Indústria da Cana-de-Açúcar Uma Avaliação do Potencial Competitivo
e Sugestões de Política Pública. Biocombustíveis BNDES setorial, v. 41, n. 1, p. 237–
294, 2015.
MOCKER, V.; BIELLI, S.; HALEY, C. Winning Together: A Guide to Successful
Corporate-Startup Collaborations. London, UK: NESTA. 2015.
MOORE, B.; WUSTENHAGEN, R. Innovative and Sustainable Energy Technologies:
The Role of Venture Capital. Business Strategy and the Environment, v. 13, n. 4, p.
235–245, 2004.
MORONI, I.; ARRUDA, A.; ARAUJO, K. The Design and Technological Innovation:
How to Understand the Growth of Startups Companies in Competitive Business
Environment. Procedia Manufacturing, v. 3, n. 1, p. 2199–2204, 2015.
MOWERY, D. C. Defense-Related R&D as a Model for “Grand Challenges” Technology
Policies. Research Policy, v. 41, n. 10, p. 1703–1715, 2012.
NARAYANAN, V. K.; YANG, Y.; ZAHRA, S. A. Corporate Venturing and Value
Creation: A Review and Proposed Framework. Research Policy, v. 38, n. 1, p. 58–76,
2009.
NASA. NASA’s Journey to Mars. Retrieved from:
<https://www.nasa.gov/content/nasas-journey-to-mars/>. Access at: December, 18th.
2016.
NASDAQ. Sugar Price: Latest Price / Chart for Sugar - NASDAQ.com. Retrieved
from: <http://www.nasdaq.com/markets/sugar.aspx?timeframe=5y>. Access at em:
December, 23th. 2016.
NYKO, D. et al. Planos de Fomento Estruturado Podem Ser Mecanismos Mais Eficientes
de Política Industrial? Uma Discussão à Luz sa Experiência do PAISS e seus Resultados.
BNDES Setorial, v. 38, n. 1, p. 55–78, 2013.
OLMOS, L.; RUESTER, S.; LIONG, S. J. On the Selection of Financing Instruments to
122
Push the Development of New Technologies: Application to Clean Energy Technologies.
Energy Policy, v. 43, n. 1, p. 252–266, 2012.
PARENTE, P. Petrobras, Mercado de Combustíveis e Mudança Climática. UNICA
Fórum 2016. Anais... São Paulo, SP: UNICA, 2016
PARHANKANGAS, A.; ARENIUS, P. From a Corporate Venture to an Independent
Company: A Base for a Taxonomy for Corporate Spin-Off Firms. Research Policy, v.
32, n. 3, p. 463–481, 2003.
PARKER, G. G.; VAN ALSTYNE, M. W.; CHOUDARY, S. P. Platform Revolution –
How Networked Markets Are Transforming the Economy–and How to Make Them
Work for You. New York, NY: Norton & Company, 2016.
POLZIN, F. et al. Public Policy Influence on Renewable Energy Investments: A Panel
Data Study Across OECD Countries. Energy Policy, v. 80, n. 1, p. 98–111, 2015.
PWC. Global Top 100 Companies by Market Capitalisation. London, UK: 2019.
RANDHAWA, K.; WILDEN, R.; HOHBERGER, J. A Bibliometric Review of Open
Innovation: Setting a Research Agenda. Journal of Product Innovation Management,
v. 33, n. 6, p. 750–772, 2016.
RAO, S.; KEPPO, I.; RIAHI, K. Importance of Technological Change and Spillovers in
Long Term Climate Policy. The Energy Journal, v. 27 n. SI, p. 123–139, 2006.
REN21. RENEWABLES 2016 - Global Status Report. Paris, France: 2016.
RIES, E. The Lean Startup: How Today’s Entrepreneurs Use Continuous
Innovation to Create Radically Successful Businesses. New York, NY: Crown
Publishing, 2011.
RIES, E. The Startup Way: How Modern Companies Use Entrepreneurial
Management to Transform Culture and Drive Long-Term Growth. New York, NY:
Random House, 2017.
RÖHM, P.; MERZ, M.; KUCKERTZ, A. Identifying Corporate Venture Capital Investors
– A Data-Cleaning Procedure. Finance Research Letters. Article In Press, 2019.
RUMPF, G. Setting Priorities for Innovation Policy and Evaluating their Performance:
Evidence from Europe and Lessons for Ukraine. Foresight and STI Governance, v. 6,
n. 3, p. 28–39, 2012.
SANTOS, M. S. D.; IANDA, T. F.; PADULA, A. D. Bioenergy as a Means to Social And
Economic Development in Guinea-Bissau: A Proposal for a Biodiesel Production and
Use Program. International Journal of Sustainable Development and World Ecology,
v. 21, n. 6, p. 495–502, 2014.
SCHOEMAKER, P. J. H.; HEATON, S.; TEECE, D. Innovation, Dynamic Capabilities,
and Leadership. California Management Review, v. 61, n. 1, p. 15–42, 2018.
SCOPUS. Scopus Database. Retrieved from: <https://www.scopus.com/>. Access at:
123
May, 18th. 2019.
SMIL, V. Energy Transitions: History, Requirements, Prospects. Santa Barbara, US:
Greenwood Publishing Group, 2010.
SPENDER, J. C. et al. Startups and Open Innovation: A Review of the Literature.
European Journal of Innovation Management, v. 20, n. 1, p. 4–30, 2017.
TEECE, D. J.; PISANO, G.; SHUEN, A. Dynamic Capabilities and Strategic
Management. Strategic Management Journal, v. 18, n. 7, p. 509–533, 1997.
TEPPO, T.; WÜSTENHAGEN, R. Why Corporate Venture Capital Funds Fail: Evidence
from the European Energy Industry. World Review of Entrepreneurship, Management
and Sustainable Development, v. 5, n. 4, p. 353–375, 2009.
THE NEW YORK TIMES. What to Expect as U.S. Leaves Paris Climate Accord.
Retrieved from: <https://www.nytimes.com/2017/06/01/climate/us-paris-accord-what-
happens-next.html?mcubz=0>. Access at: September, 9th. 2017.
TIDD, J.; BESSANT, J.; PAVITT, K. Managing Innovation: Integrating
Technological, Market and Organizational Change. Chichester, UK: John Wiley &
Sons, 2005.
UFPE; CEPEL; CHESF. Atlas Solarimétrico do Brasil: Banco de Dados Terrestres
Recife, PE: 2000.
UNEP; BLOOMBERG; FRANKFURT SCHOOL. Global Trends in Renewable
Energy Investment. Frankfurt, Germany: 2016.
UNFCC. The Paris Agreement - Main Page. Retrieved from:
<http://unfccc.int/paris_agreement/items/9485.php>. Access at: November, 26th. 2017.
UNFCCC. Adoption of the Paris Agreement - Proposal by the President. Paris,
France: United Nations (UN), 2016.
VEUGELERS, R. Which Policy Instruments to Induce Clean Innovating? Research
Policy, v. 41, n. 10, p. 1770–1778, 2012.
VOLANS. Investing in Breakthrough Corporate Venture Capital. London, UK:
2014.
WADHWA, A.; PHELPS, C.; KOTHA, S. Corporate Venture Capital Portfolios and Firm
Innovation. Journal of Business Venturing, v. 31, n. 1, p. 95–112, 2016.
WEIBLEN, T.; CHESBROUGH, H. W. Engaging with Startups to Enhance Corporate
Innovation. California Management Review, v. 57, n. 2, p. 66-90, 2015.
WERWATH, M. Lean Startup and the Challenges with “Hard Tech” Startups. IEEE
Engineering Management Review, v. 47, n. 1, p. 22, 2019.
WEST, J. Too Little, too Early: California’s Transient Advantage in the Photovoltaic
Solar Industry. Journal of Technology Transfer, v. 39, n. 3, p. 487–501, 2014.
124
WORLD BANK. Projects : Renewable Energy Scale-up Program (CRESP) | The
World Bank. Retrieved from: <http://projects.worldbank.org/P067828/renewable-
energy-scale-up-program-cresp?lang=en>. Access at: November, 15th. 2016.
WORLD ECONOMIC FORUM. Renewable Infrastructure Investment Handbook: A
Guide for Institutional Investors. Gevene, Switzerland: WEF, 2016.
WORLD ENERGY COUNCIL. World Energy Council: Issues Monitor 2019. London,
UK: 2019.
WWF; ECOFYS; OMA. The Energy Report: 100% Renewable Energy by 2050.
Gland, Switzerland: 2011.
ZELENBABIC, D. Fostering Innovation through Innovation Friendly Procurement
Practices: A Case Study of Danish Local Government Procurement. Innovation, v. 28,
n. 3, p. 261–281, 2015.


![See Hudson Run, Run Hudson, Run [SELF 2010]](https://img.pdfslide.us/doc/110x75/55834740d8b42afc7d8b5130/see-hudson-run-run-hudson-run-self-2010.jpg)