Embed Size (px)
Citation preview

Important)disclosures)appear)on)the)last)page)of)this)report.)
The$Henry$Fund$
$Henry&B.&Tippie&School&of&Management&Christina&Erbe&(christina<[email protected])&& & &Hewlett/Packard$Company$(HPQ)$ April&22,&2015&Information$Technology$$–$Diversified$Computer$Systems$ Stock$Rating$ Buy$
Investment$Thesis$ Target$Price$ $41/$45.00$&We& recommend& No& Action& for& Hewlett<Packard.& We& forecast& a&potential& for& nearly& 25%& upside& from& the& current& stock& price.& We&believe&the&stock&is¤tly&undervalued&based&on&our&analysis&of&our&DCF& and& relative& multiple& models.& & However,& due& to& short<term&revenue&declines& and& inadequate& information& regarding& the& financial&position&and&organizational&structure&of&the&future&HP&companies,&we&would&like&to&wait&for&the&FY15&Q2&earnings&announcement.&&Drivers$of$Thesis$• Company$split$will$allow$growth$in$new$enterprise$company.&Each&
company&will& be& able& to&more&quickly& react& to& its& specific&market&conditions.&&
• Strong$Balance$ sheet.$Hewlett<Packard&has&decreased& its&debt&by&nearly&38%&since&2011&and&increasing&its&cash&reserves&to&12.9B&in&2014&including&$8.1B&in&free&cash&flows.&
• Emphasis$ on$ returning$ value$ to$ stockholders.$ Management’s&commitment& to& returning& 50%& of& free& cash& flow& to& investors& has&led&to÷nds&doubling&since&2010.&&
• Currently$ trading$near$52$week$ low.&The&stock&price&dropped&7%&after&HP& lowered& its&FY15&guidance&due&to¤cy&headwinds.&A&great&price&to&buy&in.&&
Risks$to$Thesis$• Long/term$strength$of$US$dollar.$HP&has&forecasted&a&6%&headwind&
from& foreign& currency,& up& from& 2%& at& FY14& Q4,& lowering& EPS&forecast&by&$.30&for&FY15.&&
• Companies$ do$ not$ perform$well$ after$ split.$HP& has& not& released&much& information& about& the& financial& positions& or& organizational&structures&of&the&new&companies.&&
&
Henry&Fund&DCF& $42.46&Henry&Fund&DDM& $10.05&Relative&Multiple& $45.32&Price$Data$ &Current&Price& $33.21&52wk&Range& $31.00<41.10&Consensus&1yr&Target& $40.40&Key$Statistics$ $Market&Cap&& $58.3B&Shares&Outstanding& 1.82B&Institutional&Ownership& 79.50%&Beta&(Bloomberg)& 1.5&Dividend&Yield& 2.03%&Est.&5yr&Growth& 2.76%&Price/Earnings&(TTM)& 12.3&Price/Earnings&(FY1)& 8.64&Price/Sales&(TTM)& .52&Price/Book&(Mkt)& 2.17&Profitability$ $Operating&Margin& 8.04%&Profit&Margin& 4.5%&Return&on&Equity&(TTM)& 18.00%&Data:)Yahoo)Finance) &
&
Earnings$Estimate$Year$ 2012$ 2013$ 2014$ 2015E$ 2016E$ 2017E$EPS$ <$6.41& $2.64& $2.66& $3.17& $3.67& $4.14&Growth$ 9289%$ 141%) .76%) 19.26%) 15.74%) 12.72%)
12$Month$Performance$ Company$Description$
&
Hewlett<Packard& Company& provides&computer& software,& hardware,& services& and&solutions& to& individual& consumers,& small& to&mid<sized& businesses& and& large& enterprises,&including& the& U.S.& national& government.& HP¤tly&operates&seven&business&segments:&Personal& Systems,& Printing,& Enterprise&Group,& Enterprise& Services,& Corporate&Investments,& Software,& and& HP& Financial&Services.& Hewlett<Packard& will& be& split& into&two& new& companies,& HP.& Inc.& and& Hewlett<Packard&Enterprises,&by&the&end&of&FY15.&&
12.3&
18.0&
4.5&
16.3&18.4&
4.5&
23.4&
16.5&12.8&
0.00&
5.00&
10.00&
15.00&
20.00&
25.00&
P/E& ROE& Profit&Margin&
HPQ& Industry& Sector&
<5%&
0%&
5%&
10%&
15%&
20%&
25%&
A& M& J& J& A& S& O& N& D& J& F& M&
HPQ& S&P&500&
Data:)MergentOnline)

& &&
&! Page!2! !! !
EXECUTIVE$SUMMARY$
Hewlett<Packard&is&a&major&player&in&the&global&diversified&computer&systems&market.&Over&the&last&three&years,&HP’s&management&has&worked&to&turn&around&a&company&that&was& losing& revenue&and&market& share&quarterly.&While& it&has& not& been& an& overnight& success& story,&we& believe&HP&has&turned&the&corner&and&is&beginning&to&benefit&from&a&more&disciplined&and&strategic&plan.&&
The&separation&of&the&company&into&two&new&companies&will&unlock&value&in&each&entity’s&ability&to&respond&more&quickly& to&market&demands&as&well&as&allow&each&one& to&invest&in&growth&opportunities&in&a&way&that&makes&more&sense& for& the& industry& it& competes& in.& We& theorize& the&Enterprise& Group&will& have& the& ability& to& invest&more& in&strategic& acquisition& while& the& legacy& computer/printer&company& will& focus& on& organic& growth.& Because&shareholders&will&receive&shares&of&both&companies&at&the&split,&we&think&we&will&be&getting&an&even&greater&discount&on&both&companies.&&
We&also&believe& there& is& a& lot& of& value& in&HP’s&new&cash&flow& return& policy.&With& $3.9B& returned& to& shareholders&last& year,& we& expect& to& see& an& even& more& aggressive÷nd& announcement& and& share& repurchase& program,&specifically&from&HP&Inc.,&after&the&company&split.&&
While& there& is& not& much& public& information& about& the&structure& of& the& two& separate& companies,& we& have&forecasted& the& HP& Enterprise& group& to& be& more& high<growth& because& of& its& focus& on& the& enterprise& cloud&market.& Through& acquisitions& and& partnerships,& we& see&HP& carving& a& niche& for& itself& in& the& hybrid& cloud& space,&away&from&the&large&SaaS&competitors&IBM&and&Oracle.&
COMPANY$DESCRIPTION$
Hewlett<Packard& Corporation& is& a& global& provider& of&computer&hardware&and&software&products,&technologies&solutions&and&service&for&individual&consumers,&small&and&mid<sized& businesses,& as& well& as& large& enterprises&including& the&government,&health&and&education§ors.&HP& currently& operates& in& seven& business& segments:&Printing,& Personal& Systems,& Financial& Services,& Enterprise&Group,& Enterprise& Services,& Software,& and& Corporate&Investments.&&The&FY14&revenue&mix&is&shown&below.1&The&Corporate&Investments&segment&is&comprised&of&HP’s&R&D&operation,& HP& Labs,& and& therefore& does& not& directly&contribute&to&the&top&line.&&
&Source:)Hewlett9Packard)FY)2014)109k)
Segment$ Q1$Revenue$ Q1$Opp.$Profit$ Profit$Margin$Printing$ $5.5&Billion& $1.07&Billion& 19.2%&Personal$Systems$ $8.5&Billion& $313&Million& 3.7%&Enterprise$Group$ $7&Billion& $1.1&Billion& 15.6%&Enterprise$Services$ $5&Billion& $148&Million& 3.0%&Software$ $871&Million& $157&Million& 18.0%&Financial$Services$ $803&Million& $90&Million& 11.2%&Source:)Hewlett9Packard)FY15)Q1)109Q) &)
In&October& 2014,&management& announced& the& company&would& be& separated& into& two& new& publicly& traded&companies,& Hewlett& Packard& Enterprises& and&HP,& Inc.& by&the& end& of& FY15,& October& 31,& 2015.& Hewlett& Packard&Enterprises& will& consist& of& the& Enterprise& Group,&Enterprise& Services,& Software& and& HP& Financial& Services&segments.&HP,&Inc.&will&become&focused&on&the&consumer&PC& and& printer& markets,& merging& the& Printing& and&Personal&Systems&segments&(PPS).6&
$Source:)The)Wall)Street)Journal)
Enterprise&Group&24%&
Enterprise&Services&20%&
Soiware&3%&
Financial&Services&
3%&
Personal&Systems&30%&
Prinjng&20%&
2014$Revenues$by$Segment$

& &&
&! Page!3! !! !
Until&management& releases&more& information& about& the&capital&allocation&for&each&company&at&the&split,&we&have&been& analyzing& both& companies& based& sole& on& their&growth&and&cash&producing&potential.&&&
As&it¤tly&stands&in&FY15&Q1,&HP&Enterprise&Group&has&slightly& lower& revenues,& $13.6B,& with& slightly& higher&operating& profit& margin,& 10.9%.& HP& Inc.& had& $14B& in&revenues&with&a&9.4%&operating&profit&margin.&We&know&that& in& general,& margins& tend& to& be& better& in& the&Enterprise& IT& industry& vs.& computers& and&printers,&which&are& constantly& subject& to& pricing& pressure& and&depreciation.& The& Enterprise& software,& services,& and&infrastructure& industry& also& has& more& growth&opportunities,& with& revenues& expected& to& grow& 5%& this&year,& and& increase& from&$66.4B& in& 2014& to& over& $80B& in&2019.16& The& computer& and& printer& industries& are&forecasted&to&decline&of&the&next&two&years,&which&we&will&discuss&in&more&detail&in&another§ion.&Because&HP&Inc.&will& be& a& market& leader& and& able& to& benefit& from&consolidation&and&economies&of&scale,& it&will&still&bring& in&significant& cash& flows& but& we& believe& the& deep& value&belongs&with&HP&Enterprise&Group.$
Hewlett$Packard$Enterprises$$
Hewlett<Packard& Enterprises’& strategy& will& be& to& deliver&better& business& outcomes& for& enterprise& customers& by&leveraging& its& unique& combination& of& infrastructure,&services,& proprietary& software& and& cloud& options.&Management& has& announced& that& its& capital& structure&and&allocation&principles&will& focus&on& increasing&organic&growth&combined&with&targeted&M&A.&The&distribution&of&capital& to& shareholders& will& mainly& be& through& share&repurchases& so& the& company&will& have& flexibility&when& it&comes&to&its&investment&needs.6&
&Source:)Hewlett9Packard)2014)Analyst)Meeting)presentation)
Enterprise$Group& –& This& segment& includes&a&broad&array&of&enterprise&technology& infrastructure& including&servers,&
storage& platforms,& networking& options& including&switchers,& routers&and&WLAN&as&well&as& support& services&and&technology&consulting&focused&on&cloud,&mobility&and&big&data.&The&HP&Helion&cloud,&a&“hybrid”&cloud&offering,&will&be&the&backbone&of&the&infrastructure&platforms.&&
This&is&where&we&see&the&potential&for&the&most&growth&in&FY&15.& First,& profit&margins& in& this& segment&are& currently&around&15.6%&and&should&remain&there&or&even&decrease&slightly& after& the& company& restructuring& is& completed.&Secondly,&servers,&storage&and&wireless/&mobile&spending&is&expected&to&grow&by&4.5%&in&2015.15&&&HP&is&the&market&leader& in&global&server&sales,&with&28%&market&share&and&is&in&the&best&position&to&capture&the&growth&in&sales.&&
HP’s& acquisition& of& Aruba&Networks&will& also& be& a&major&catalyst& for& growth& in& this& space.& Once& completed,& HP’s&market&share& in&global&WLAN&sales&will& jump&from&4%&to&16%,&with&the&potential&for&adding&$37.4M&in&sales&to&the&category.&
HP& just& announced& partnerships& with& 3& cybersecurity&companies& <& FireEye,& Securonix,& and& Adallom& –& to& offer&more&robust&security& that& it&says&emphasizes&“protecting&interactions&between&users,&applications&and&data& rather&than& the& old& school& practice& of& securing& the& perimeter.”&Security& has& been& one& of& the& biggest& issues& in& terms& of&conversion&rates&to&the&cloud&so&this&should&add&value&to&HP’s&portfolio&of&business&solutions.&
Enterprise$ Services& –& The& Enterprise& services& segment&provides& consulting& and& outsourcing& across&infrastructure,& business& processes& and& application& fields.&It& also& includes& sales& opportunities& for& hardware& and&software&to&integrate&all&of&HP’s&products&and&services.&&
We& are& not& forecasting& any& growth& for& the& Enterprise&Services& segment.& This& segment’s& profit& margin& is& the&lowest& in& the& company& at& 3.0%.& HP&management& keeps&discussing& a& turn<around& for& this& segment& but& their&revenues& are& down& for& the& ninth& quarter& in& a& row.&Hewlett<Packard& was& late& to& the& consulting& game& and&now& is& trying& to& play& catch& up&with& heavy&weights& IBM,&Accenture& and& Oracle.& We& do& not& see& them& gaining&market& share& without& a& major& shake<up& in& the& market&outside&of&their&control.&
Software$ /$ Software& is& not& a& large& segment& of& HP’s¤t&revenue&stream&but&as&the&company&separates,&it&is& expected& to&become&a& larger& driver.& The& focus&will& be&on&developing&software&that&helps&provide&crucial&insights&for& enterprise& customers& through& Big& Data,& market&

& &&
&! Page!4! !! !
optimization,& enterprise& security,& and& operations&management.&
We& see& software& sales& remaining& flat&with& very&minimal&growth&in&2016&and&2017.&HP&has&been&losing&license&and&support& revenue&for& the&past& three&years&because&of& the&market& shift& to& SaaS& solutions.& We& do& not& see& HP&recovering& its& market& share& from& the& large& SaaS&providers,& IBM,& Oracle& && Salesforce.com.& However,&believe&their&efforts&to&expand&their&niche&security&and&big&data& product& offerings& will& result& in& 1<1.5%& growth& in&revenue& in&the&coming&years,&which&combined&with&their&high& 18%&profit&margin& should&make& a& difference& to& the&bottom&line.&
HP$ Financial$ Services& –& This& is& the& customer<financing&arm& of& the& company.& It& provides& flexible& investment&solutions& that& include& leasing,& financing& and& asset&management&solutions&so&that&customer&scan&develop&the&complete& IT& solution& that& they& need.& HPFS& provides&services&to&the&largest&enterprises&down&to&the&small&and&mid<sized&businesses&(SMBs)&and&education&entities.&
This& year,& we& have& forecasted& a& decline& in& revenues&because& of& negative& impacts& from& the& strong& dollar& and&the& decline& in& portfolio& assets& because& of& low& interest&rates.&HP&has&seen&a&decline&in&portfolio&assets&every&year&since&interest&rates&have&been&at&historic&lows.&We&expect&interest& rates& to& remain& low& through& the& fall& so& we&assume&their&portfolio&assets&will& continue& in& that& trend.&However,&we&see&this&segment&as&an&added&value&for&HP&because&it&provides&a&solid&profit&margin&of&11%&and&very&few&other&large&firms&provide&financial&solutions&for&their&clients&and&when&interest&rates&do&start&to&climb,&they&will&be& in& a& better& position& to& compete& with& banks& that& are¤tly&capturing&their&customers&business.&
HP$Inc.$
HP&Inc.&will&be&structured&to&leverage&the&strengths&of&the&Personal& Systems& segment& and& the& Printing& segment& by&creating&a&unified&business&that&will&be&customer&focused&and&allow&the&company&to&capitalize&on&rapidly&changing&industry&trends.&Management&expects&this&company&be&a&cash& king,& focusing& on& consistent& and& regular& returns& to&shareholders& through& share& purchasing& and& increasing÷nd& payments.& They& expect& investments& to& largely&be&organic&to&maintain&the&cash&flows&and&drive&growth&in&new&technology.6&
$Source:)Hewlett9Packard)2014)Analyst)Meeting)presentation)
Personal$ Systems& <& The& Personal& Systems& segment&consists&of&workstations&and&PCs&for&the&commercial&and&consumer& markets.& These& products& include& commercial&desktops,¬ebooks,& tablets& and&workstations,&point<of<sale& stations,& calculators& as& well& as& consumer& desktops,¬ebooks,&and&tablets.&&
HP& is& second& in& the& slowing& global&market& for& notebook&and&PC&sales.&We&forecast&overall&unit&growth&of&5%&with&flat& revenues& for& 2015&because&of& the& shrinking&margins&due& to&pricing&pressure&and& foreign&exchange& rates&with&these&products.&This&is&again&obvious&in&the&segment’s&low&operating&profit&margin,&3.7%.&
Printing& <& The& printing& segment& provides& consumer& and&commercial& printers,& software& and& supplies& as& well& as&large<scale& enterprise& printing& capabilities& within& its&Graphics&Solutions&division.& It& is&also& the&most&profitable&segment&of&the&company&with&a&19.2%&margin.&
We& have& forecast& the& Printing& segment’s& revenue& to&decline&y/y& in&2015&because&of& the& reports&of&aggressive&pricing& from& the& Japanese& competitors& because& of& the¤cy& movement.& & We& see& sales& picking& up& in& 2016&because& of& increased& emphasis& on& placing& commercial&printers,&which&in&turn&increases&supplier&sales.&HP&is&also&set& to& release& their&Multi& Jet& Fusion& 3D& printer& in& 2016.&The&printer& is& designed& for& industrial& uses& and&will& likely¬&be&in&the&consumer&market&for&a&few&more&years.&&
Global$Presence$
Hewlett<Packard& is& one& of& the& leading& global& diversified&computer& companies& and& earns& almost& two<thirds& of& its&revenues&outside&the&United&States.& It&has&high&exposure&to& foreign¤cy& risk&as&well& as& volatility& in& the&global&economy.&&&

& &&
&! Page!5! !! !
$HP&has&seen&decreases&in&revenue&from&all&its&geographic&segments&over&the&past&quarter&but&has&seen&the&biggest&drop&in&the&Asia&Pacific&Japan&(APJ)&area.&We&believe&these&declines& are& due& to& the& strengthening& of& the& dollar,&especially& against& the& Yen& and& the& slowing& of& the&economies& in& the& area.& Foreign& competitors& are& able& to&undercut&HP’s&prices&because&of&the&strong&dollar&and&low&price&of&parts&in&that&part&of&the&world&right&now.&
Hewlett<Packard&Company&has&made&significant&strides&in&turning&around&a&company&that&had&a&weak&balance&sheet&and& little& financial& security& over& the& past& three& years.&&However,& revenues& y/y& are& still& flat& and& company&guidance& and& market& consensus& is& that& revenues& in& all&divisions&will&remain&down&for&FY&2015.&&
RECENT$DEVELOPMENTS$
“The$Machine”$
Hewlett<Packard& unveiled& a& new& type& of& computer&architecture&that&could&shrink&a&data¢er&to&the&size&of&a& refrigerator& in& June.10& The& new& supercomputer& would&contain& a& new& type& of& memory& that& stores& both&temporary&and&long<term&data&called&memristors&and&will&transfer& information& on& optical& fiber& instead& of& copper&wiring&using&silicon&photonics.3&&
The& Machine& could& be& about& six& times& more& powerful&than& today’s& computer’s& while& running& on& 1.25%& of& the&power.&This&type&of&product&could&be&especially&appealing&to&companies&like&Google&that&rely&on&a&ton&of&computing&power.& They& have& said& they& will& bring& the& machine& to&market& in& the& next& few& years& or& fall& flat& on& their& face&trying.& & HP& is& expected& to& launch& the& first& prototype& in&2016.&
Along& with& the& new& hardware& developments,& HP& must&also&develop&a&new&operating&system&because&“operating&systems& have& not& been& taught& what& to& do& with& all& the&memory.”3& If&HP& is& successful&at&developing& this&product,&
it& could& be& a& market<changer& and& disrupt& the& current&data<center&designs.&
HP& has& been& working& on& certain& aspects& of& this&development& for& years.& Although& the& current& CTO& is&extremely& positive& about& their& success,& upon& further&reading&we&discovered&that&a& large&part&of& the&success& is&dependent&on&a& separate& chip<making& company&creating&a& reliable&memristor& chip.& SK& Hynix,& the& company& HP& is&working& with,& will& not& comment& on& its& timeline& or&progress.&We& tend& to& think& this&project&will¬& come& to&fruition& as& announced.& HP& does& not& have& a& history& of&developing& innovative,& disruptive& technology& and& while&this& “Machine”& would& be& a& game& changer,& we& are& not&building&it&into&our&models.&&
Announcement$of$Company$Split$
On& October& 6,& 2014,& Hewlett<Packard& Company&announced& it& would& be& separating& into& two& new& public&companies& by& the& end& of& FY15.2& Hewlett<Packard&Enterprises& will& focus& on& the& business& hardware& and&services& markets& and& include& the& Enterprise& Group,&Enterprise& Services,& Software& and& Financial& Services.& HP&Inc.& will& consist& of& the& Personal& Systems& and& Printing&segments.&&
The&split&should&be&completed&by&October&31,&2015&and&is&estimated& to& cost& HP& approximately& $1.3& billion& in&FY2015,&with& another& charge& of& $500&million& in& FY2016.&Shareholders& will& own& shares& of& both& new& companies.&The& transaction& has& been& structured& to& be& tax<free& to&HP’s&shareholders&for&federal&income&tax&purposes.&&
Management& believes& the& separation& will& enable& each&company&to&enhance&their&focus&on&distinct&opportunities&for& long<term& growth& and& profitability& and& will& better&position& each& company& to& accelerate& performance& and&generate& long<term& shareholder& value.& They& have& also&said& that& it& provides& investors& with& two& distinct&investment&opportunities&with&clarity&on&capital&allocation&principles.6&&
FY15$Q1$Results/Dividend$Boost$
Hewlett<Packard& announced& their& FY15& Q1& results& on&February&26.&Earnings&came&in&beating&consensus&by&$.01,&$.92&to&$.91,&but&the&stock&dropped&nearly&7%&because&of&a&miss&on&net&revenue,&$26.8B&vs.&expectations&of&$27.2B,&and& softer& than& expected& guidance& due& to& headwinds&from& the& strong& dollar.& Management& forecasted& foreign&exchange&rates&will&drag&down&Q2&EPS&by&$.09&and&FY15&
Americas&44%&
EMEA&37%&
APJ&19%&
Revenue$Breakdown$By$Geography$
Source:)HewleQ9Packard)2014)109k)
US:&35%&Canada/LA:&9%&

& &&
&! Page!6! !! !
EPS&by&$.30&to&$3.53<$3.73.4&&We&have&modeled&FY15&EPS&to&be&at&$3.09.&&
&Source:)HP)FY15)Q1)Earnings)call)presentation)
HP& returned& $1.9& billion& to& shareholders& through& share&repurchases&and÷nd&payments& in&Q1,& keeping&with&their&policy&of&returning&50%&of&free&cash&flow&back&to&the&investors.& & That& resulted& in& a& reduction& of& 41& million&shares&repurchased,&or&2.2%&of&outstanding&shares.&&
The&guidance&on& free&cash& flow& for&FY2015&was& reduced&from& $6.5<7& billion& to& $3.5<4& billion& due& to& charges&attributed&to&the&company&separation&that&had¬&been&taken&into&account&in&earlier&guidance&and&a&more&severe&impact& by& the& strengthen& dollar.& We& had& already& taken&into& account& in& our& model& the& $1.3B& charge& in& 2015& to&separate&the&companies.&&
HP& also& announced& a& 10%& increase& to& its’& quarterly÷nd&payout.11& & The&company&will&now&pay&$.176&per&share&up&from&$.16.&This&will& take&effect&when&the&board&of&directors&declares&the&next÷nd&in&May.&&
Aruba$Networks$Acquisition$
HP&announced&the&acquisition&of&Aruba&Networks&for&$2.7&billion& cash,& net& of& cash& and& debt,& on& March& 2.& Aruba&provides& corporations& like& hospitals,& universities& and&malls,& services& that& manage& wireless& networks& and&“trigger&security&actions”&on&mobile&devices.&Its’&products&help& IT& departments& handle& issues& that& come& up& on&smartphones,& tablets,& and& notebooks& automatically& so&that&companies&don’t&need&to&have&a&dedicated&IT&person&handling& mobile& products.& Aruba& currently& has& an&estimated&10<13%&of&the&enterprise&WLAN&market,&which&will& allow&HP& to&quickly&grow& its&4<5%&share& in&a&market&that&is&forecasted&to&grow&almost&40%&through&2019&to&an&estimated&$13&billion.12&&
&Source:)Statista)
&
Aruba&Networks& brought& in& $729&million& in& revenue& last&year& and& is& expected& to& quickly& start& contributing& to&Hewlett<Packard& Enterprise& within& a& year.& Along& with&Aruba’s& current& revenue& streams& from& clients& like&California& State& University& and& Dalian& Wanda& Group,&China’s& biggest& property& developer,& this& acquisition& will&help& HP& compete& for& E<Rate& dollars,& the& largest& US&educational& technology& subsidy& program.& E<Rate’s&funding& was& just& raised& by& the& FCC& from& $1.5& billion& to&$3.9&billion&in&December.12&&
Autonomy$Lawsuit$
HP& is& taking& legal& action&against& the& founder&and& former&CFO& of& Autonomy,& seeking& damages& of& $5.1& billion,& or&$2.80/share.&HP,&while&under&former&CEO&Leo&Apotheker,&acquired& Autonomy& for& $11& billion& in& 2011& and&subsequently& wrote& down& its& value& by& $5.5& billion& in&2012,& accusing& the& Autonomy& management& team& of&“fraudulently&inflating&the&company’s&value.”8&
Autonomy&founder&Michael&Lynch&has&announced&he&will&counter<sue& for& loss& and& damages& caused& by& false& and&negligent& statements.& He& is& seeking& over& 100& million£s,&or&approximately&$150&million.&&
Cisco&49%&
Aruba&11%&
HP&4%&
Motorola&Solujons&
3%&
Ruckus&6%&
Other&27%&
Global$WLAN$Market$Share$FY2014$Q3$
Cisco&49%&
HP/Aruba&16%&
Motorola&Solujons&
2%&
Ruckus&6%&
Other&27%&
WLAN$Market$Share$Aber$Acquisicon$

& &&
&! Page!7! !! !
Consensus&seems&to&be&that&HP&had&to&file&because&of&an&impending& statute& of& limitation& deadline.& We& do& not&believe&they&will&win&a&judgment&of&anywhere&close&to&$5&billion,& however& the& findings& should& provide& the&market&with&a&better&idea&of&how&the&deal&was&structured&and&any&missteps&taken&by&HP’s&senior&management&in&the&deal.&&
The& UK& Serious& Fraud& Office& has& already& dismissed& its&investigation& because& of& insufficient& evidence& for& a&realistic& prospect& of& conviction.& The& SEC& continues& its&investigation&with&no&hint&of&what&they&may&decide.&
INDUSTRY$TRENDS$
Hewlett<Packard&offers&a&very&broad&portfolio&of&products&and& services& and& competes& in& several& different&technology& industries.& Its& main& industry,& computer&hardware,& storage& and& peripherals,& is& a&mature& industry&that& is& seeing& intense& competition& as& pricing& pressure&increases& and& spending& decrease& worldwide.& & The&Business& Software& and& Services& industry,& on& the& other&hand,& is& expected& to& see& continued& growth&with& rapidly&evolving& enterprise& technology& and& continued& growth& in&cloud&services&and&infrastructure.&&&
Decline$in$worldwide$IT$and$PC$spending$$
Market& research& firm& Gartner& has& forecasted& that&worldwide& IT&spending&will&decrease& in&2015&by&1.3%,&or&$3.66&trillion,&because&of&the&rise&of&the&U.S.&dollar&against&most&other¤cies.9&It&was&initially&forecasted&to&grow&by&2.4%&for&the&year.&&
This&decline&in&spending&is&already&being&felt&in&the&global&PC&market.&Worldwide& PC& shipments& fell& 5%& in&Q1& from&Q1&2014.7&HP&and&Lenovo&were&the&only&major&vendors&to&increase& their& PC& shipments& year& over& year.& HP’s& total&unit& sales& were& up& 9%& y/y& while& pricing& pressures& and¤cy& headwinds& left& earnings& flat.4& Gartner& and& IDT&both& place& HP& in& second<place& with& between& 17.5<19%&share&of&the&global&PC&market.7&
Pricing$Pressure$and$Consolidation$
Computers&and&peripheral&equipment&have&been&subject&to& declining& prices& since& their& invention.& The& Bureau& of&Labor&Statistics&uses&an&index&to&track&the&changes&in&price&with& a& baseline& of& December& 2006.& In& Jan& 2015,& the&estimated& index& value& was& 63.2& and& is& forecasted& to&decrease&to&49.4&by&2020&with&a&CAGR&of&<4.2%.5&
&Source:)IBISworld)
Hewlett<Packard& has& already& restructured& their& Print& &&Personal& Systems& (PPS)& segments& to& leverage& the& cost<efficiencies& between& the& Personal& Systems& and& Printing&segments.& As& HP& Inc.& sets& out& on& its& own,& it& will& be&important& to&monitor&how&the&companies&move& forward&with& their& supply& chain&because&of& the& change& in& size&of&the&companies&and&their&negotiating&power.&&
Competition$in$Enterprise$&$Cloud$Services$
Spending& on& cloud<computing& infrastructure<as<a<service&(IaaS)& and& platforms<as<a<service& (PaaS)& are& expected& to&grow& at& a& 30%& CAGR& through& 2018& compared& with& an&overall& enterprise& IT& growth& rate& of& 5%,& according& the&Goldman&Sachs&study&published&in&January&2015.13&
&Source:)EnterpriseTech)Cloud)Market)Study.)Nov.)2014)
Hewlett<Packard& Enterprises& will& be& well& positioned& to&take& advantage& of& the& growth& in& the& IaaS& and& PaaS&markets& with& their& portfolio& of& integrated& solutions& and&HP’s&continued&focus&on&strengthening&its&position&in&the&enterprise&solutions&market.&&
MARKETS$AND$COMPETITION$
Hewlett<Packard& competes& in& highly& concentrated&markets& with& major& players.& We& believe& they& are& in& a&
20&
40&
60&
80&
100&
2006&
2007&
2008&
2009&
2010&
2011&
2012&
2013&
2014&
2015&
2016E&
2017E&
2018E&
2019E&
2020E&
2021E&
Price$of$Computers$and$Peripherals$
0&
50&
100&
150&
2014& 2018&
39.8&82.7&8.7&
24.6&
8.1&
20.3&
Spen
ding$In
$Billions$
Worldwide$IT$Cloud$Services$Spending$Per$Segment$
PaaS&
IaaS&
SaaS&

& &&
&! Page!8! !! !
competitive& position& based& on& their& high& cash& flows,&operational& improvements& and& increased& profitability&over&the&last&three&years.&
Peer$Comparisons$
Hewlett<Packard& has& the& lowest& P/E& out& of& all& its&competitors.& However,& it& also& has& the& lowest& operating&and& profit& margins& and& the& second& highest& Debt/Equity&ratio.&We&believe&the&market&is&pricing&in&these&factors.&&
Source:)Yahoo!)Finance)
Hewlett<Packard&does&have&a&strong&free&cash&flow,&which&is& a& positive& in& an& industry& that& can& require& significant&investment&in&organic&and&non<organic&growth.&&However,&HP&has¬&given&any&guidance&on&how&that&cash&will&be&split& up& during& the& company& separation.&While& an& equal&split&may&work&well&for&HP&Inc.,&we&believe&that&Hewlett<Packard& Enterprises& will& need& a& more& cash& intensive&capital& structure& for& acquisitions& to& allow& it& to& compete&against&companies&like&Oracle&and&IBM&for&a&piece&of&the&market&share.&&
Computer$Hardware$and$Peripherals$Market$
Hewlett<Packard& is& the& second& largest& personal& PC& seller&in&the&world.&FY15&Q1&numbers&show&that&HP&and&Lenovo&&
were& the& only& two& major& vendors& that& increased& their&sales&units&y/y.&We&see&this&growth&to&continue&for&HP&in&the&market.&&
ECONOMIC$OUTLOOK$
Almost& two<thirds& of& Hewlett<Packard’s& revenues& come&from&outside&of& the&United&States&so& the&strength&of& the&U.S.&dollar&and&the&overall&global&economy&are&critical& to&its&success.&&
We& forecast& the& US& dollar& to& maintain& its& recent& gains&against&the&Euro&and&the&Yen&for&the&next&two&years.&We&estimate& that& the& Dollar/Euro& will& remain& around& $1.12&and&the&Yen/US$&to&remain&around&117.&&Although&HP&has&provided& guidance& regarding& substantial& headwinds& for&FY15& of& six& basis& points& due& to& foreign& currency& rates4,&with& no& dramatic& changes& in& the& next& two& years,& HP&should& be& able& to& hedge& against& any& minor& changes&moving&forward.&&
We& see& slow& growth& in& the& US& GDP& over& the& next& two&years,& which& should& move& the& domestic& part& of& HP’s&revenues& into& the& positive& but& we& are& more& uncertain&about& the& global& macroeconomic& factors.& Russia,& Japan&and&the&Euro&Zone&are&all&an&integral&part&of&HP’s&market&and& because& we& see& little& to& no& growth& in& these& areas,&that& will& affect& the& consumers& and& businesses& that& are&willing&to&spend&money&with&HP.&&
Corporate& profits& are& forecasted& to& grow& from& $2.17&trillion& to& $2.47& trillion& by& 202017.& Growing& corporate&profits& results& in& company& investment& in& technology&and&software.&Private&company& investment& in&computers&and&software&is&also&expected&to&grow&at&4.5%&CAGR&through&2020&from&$652.2B&in&2015&to&$812.1B&in&202018.&&
&
INVESTMENT$POSITIVES$
•& Separating&the&company& into&two&smaller&companies&
will& allow& for&each& to&be&more& flexible&and&adjust& to&
3.1%& 3.4%&
5.2%&
5.1%&
8.3%&
3.9%&
2.7%& 2.6%&
0.0%&
2.0%&
4.0%&
6.0%&
8.0%&
10.0%&
2013& 2014&2015*&2016*&2017*&2018*&2019*&2020*&
%$Change$in$Corporate$IT$Investment$
Stock Price P/E (TTM)
D/E (mrq)
Op. Marg.
LFCF (ttm)
Profit Marg.
EMC!Corp! $25.83& 19.64& 23.4& 18.2%& 4.9B& 11.1%&Cisco! $28.04& 16.75& 35.6& 24.1%& 9.2B& 18.0%&Accenture! $94.69& 20.09& .42& 14.5%& 3.8B& 9.84%&
IBM! $162.86& 13.68& 339.6& 21.4%& 12.9B& 12.9%&Oracle! $43.51& 18.17& 66.47& 39.0%& 11.4B& 27.8%&
Apple! $127.10& 17.21& 29.52& 29.7%& 41.9B& 22.3%&Microsoft! $41.72& 16.83& 31.28& 30.6%& 23.0B& 22.1%&
HP! $32.11$ 12.32$ 70.85$ 8.4%$ 8.0B$ 4.5%$Average! $68.48$ 16.73$ 41.87$ 23.2%$ 14.3B$ 16.1%$
Lenovo&19%&
HP&19%&
Dell&13%&
Acer&8%&
Asus&8%&
Apple&6%&
Others&27%&
Global$Consumer$PC$Market$Share$FY14$Q4$
Source:)StaXsta)

& &&
&! Page!9! !! !
the&rapid&rate&of&innovation&and&change&happening&in&
these&industries.&&
• Hewlett<Packard& currently& has& the& strongest& balance&sheet&they&have&had& in&years.&Management& laid&out&a&plan&to&turn&the&flailing&company&around&in&2012&and,&while&we& recognize& it& is& still& a&work& in& progress,& they&have&made&some&major&strides&
• HP&has& stated& its& priority& to& return& 50%&of& its& annual&free&cash&flow&to& investors&through&stock&repurchases&and& dividends.& So& far,& management& has& followed&through.&We& expect& for& them& to&maintain& this& policy&for&the&next&4<5&years.&&
• The& Enterprise& platform& and& infrastructure& market& is&expecting&high&growth&rates&for&the&next&three&to&four&years.& Hewlett<Packard& Enterprises& will& be& well&positioned& with& HP& Helion& to& capture& some& of& that&rising&market.&
• The&recent&acquisition&of&Aruba&Networks&opens&up&a&large&new&market& space& for&HP& as& the& second& largest&market& share& holder& to& grab& Aruba’s& previous& $700&million&in&revenues&as&well&as&the&potential&for&a&large&portion&of&the&E<Rate&subsidies&to&help&expand&internet&services&in&rural&and&underserved&neighborhoods.&
INVESTMENT$NEGATIVES$
• There&is&a&lot&of&uncertainty&about&the&foreign¤cy&markets& and& how& it& will& affect& HP& going& forward& this&year&as&well&as&how&it&could&affect&the&performance&of&the& new& companies& in& 2016& because& of& the& large&percentage&of&foreign¤cy&sales.&
• We&still&know&very&little&about&the&company&separation&and& how& each& company’s& operations& will& be& run& or&finances&will&be&structured.&We&do¬&know&what&dis<synergies& may& occur& after& the& break& and& how& that&could&affect&the&supply&chain,&their&negotiation&power&and&the¤t&R&D.&&
• The& recent& revision& to& the& 2015& IT& spending& forecast&shows& a& $3.3T& decrease& in& overall& IT& spending& this&year,&which& could& have& an& enormous& impact& on& HP’s&bottom& line& in& conjunction& with& the& strength& of& the&dollar.&&
VALUATION$
We& dissected& Hewlett<Packard’s& revenues& into& the& two&separate&companies&that&will&be&formed&at&the&end&of&the&year& to& get& a& better& understand& of& the& structure& and&financial&picture&of&each&company.&We&forecasted&out&for&
each& segment& within& the& separate& companies& and& then&combined&our&final&numbers&to&arrive&at&a&DCF&stock&price&for&the¤t&Hewlett<Packard&Company.&&
We&have&forecasted&a&1.6%&decline&in&overall&revenue&for&Hewlett<Packard& in& 2015,& a& modest& gain& of& 1%& in& 2016&with& a& 2<2.5%& growth& rate& out& into& the& CV.& We& are&factoring& in& the& strong& headwinds& from& the& foreign&exchange&rate&and&the&slowing&growth&rate& in&the& legacy&hardware&and&peripherals&industry.&&
We& have& a& more& aggressive& growth& rate& for& Hewlett<Packard&Enterprises&due&to&the&high&growth&expectations&in&the&enterprise&business&market,&specifically& in&the&IaaS&and&PaaS&solutions.&We&see&those&rates&at&1.19%&in&2015,&2.76%& in& 2016& and& 3.34%& in& 2017.& In& addition,& we&factored&in&an&increasing&operating&margin&of&3.5%&in&the&short& term& and& 7.5%& in& the& long<term& because& of&efficiencies&and&economies&of&scale&as&the&separation&and&restructuring&of&the&new&company&is&complete.&&
We& forecast& HP& Inc.’s& growth& in& line& with& company&guidance&with&<1.77%&in&2015&and&then&becoming&positive&and&staying&between&1.4%<2.1%&out&into&the&CV.&
We&forecasted&the&CV&NOPLAT&growth&rate&to&be&1.75%,&approximately&in&line&with&our&views&on&GDP&growth&over&the& next& two& years& as&well& as& the& average& between& the&two&companies&growth&rates.&&
Our&WACC&was&8.45%.&Hewlett<Packard&has&paid&down&a&significant&amount&of&debt&over& the& last& three&years&and&strengthened&its&credit&rating.&&We&used&a&risk<free&rate&of&2.59%,&which&was& the& 30<year& treasury& yield& on& April& 6,&2015.&As&a&group&we&are&using&a&market&risk&premium&of&4.85%,& which& is& the& average& between& the& historical&average&and&the¤t&Damodaran&market&risk&premium&as&of&April&6,&2015.&&
Our& valuation& of& $42.46& is& slightly& higher& than& the&consensus&estimate&of&$40.40.&&
KEYS$TO$MONITOR$
We&will& be&monitoring& the& Q2& earnings& announcements&to& see& how&much&more& the& foreign& currency& headwinds&have& affected& HP’s& top& and& bottom& line.& We& are& also&interested& in& receiving& more& information& regard& the&financial&positions&of&each&of&the&companies&after&the&split&and&more&about&their&growth&strategies&and&management&structures&going&forward.&&

& &&
&! Page!10! !! !
It&will& also&be& imperative& to&monitor& the& strength&of& the&US& dollar& against& the& Euro& and& the& Yen& specifically.& HP&could&start&to&lose&market&share&and&pricing&power&if&the&dollar& remains& strong& for& too& long.&We&will& also&want& to&monitor&the&continuing&strength&of&the&global&economies&because&they&are&such&a&large&segment&of&the&revnue.&&
REFERENCES$
1. Hewlett<Packard&Company,&FY2014&Annual&Report&2. HP& press& release& –& October& 6,& 2014& “HP& to& Separate&
Into&Two&New&Industry<Leading&Public&Companies”&3. Bloomberg& –& June& 12,& 2014& “With& ‘The&Machine,’& HP&
May&Have&Invented&a&New&Type&of&Computer”&4. Hewlett<Packard,& FY15& Q1& Earnings& call& and&
presentation&5. IBISWorld& –& Price& of& Computers& and& Peripheral&
Equipment&6. Hewlett& Packard& Business& Update& Call& Transcript& and&
presentation&–&October&6,&2014&7. Investor’s& Business& Daily& –& Lenovo,& HP& Leaving& Other&
Vendors&in&the&Dust&8. The& Guardian& –& Hewlett<Packard& sues& Autonomy&
founder&for&damages&9. Gartner& Press& Release& –& Worldwide& IT& Spending& to&
Decline&in&2015&10. Business&Insider&–&HP&unveil&The&Machine&11. Hewlett<Packard&Press&Release&–&March&19,&2015&12. Rueters&–&HP&acquisition&of&Aruba&Networks&13. Forbes&–&Goldman&Sachs&cloud&market&study&14. Enterprise&Tech&<&HP&Maintains&Server&Lead&15. IDC&&<&2015:&Accelerating&Innovation&16. IBISWorld& –& Business& analytics& and& enterprise&software&
IMPORTANT$DISCLAIMER$
Henry&Fund&reports&are&created&by&student&enrolled&in&the&Applied&Securities&Management&(Henry&Fund)&program&at&the& University& of& Iowa’s& Tippie& School& of& Management.&These& reports& are& intended& to& provide& potential&employers&and&other&interested&parties&an&example&of&the&analytical& skills,& investment& knowledge,& and&communication& abilities& of& Henry& Fund& students.& Henry&Fund& analysts& are& not& registered& investment& advisors,&brokers& or& officially& licensed& financial& professionals.& The&investment& opinion& contained& in& this& report& does& not&represent&an&offer&or&solicitation&to&buy&or&sell&any&of&the&aforementioned&securities.&Unless&otherwise¬ed,&facts&and& figures& included& in& this& report& are& from& publicly&available& sources.& This& report& is& not& a& complete&compilation& of& data,& and& its& accuracy& is& not& guaranteed.&
From& time& to& time,& the& University& of& Iowa,& its& faculty,&staff,& students,& or& the& Henry& Fund& may& hold& a& financial&interest&in&the&companies&mentioned&in&this&report.&

Hewlett&Packard
Revenue&Decomposition
Fiscal&Years&Ending&Oct.&31 2012 2013 2014 2015E 2016E 2017E 2018E
Hewlett&Packard-Total-Revenue 120,357----- 112,298----- 114,925----- --------112,990- --------113,658- --------115,420- --------117,253-
%,Change,Y4to4Y 45.41% 46.70% 2.34% 41.68% 0.59% 1.55% 1.59%
Hewlett-Packard-EnterpriseEnterprise-Group
,,,Industry,Standard,Servers ,,,,,,,,,,12,582, ,,,,,,,,,,12,102, ,,,,,,,,,,12,474, ,,,,,,,,,,12,848, ,,,,,,,,,,13,362, ,,,,,,,,,,13,897, ,,,,,,,,,,14,383,
,,,Technology,Services ,,,,,,,,,,,,,9,152, ,,,,,,,,,,,,,8,788, ,,,,,,,,,,,,,8,466, ,,,,,,,,,,,,,8,297, ,,,,,,,,,,,,,8,421, ,,,,,,,,,,,,,8,547, ,,,,,,,,,,,,,8,676,
,,,Storage ,,,,,,,,,,,,,3,815, ,,,,,,,,,,,,,3,475, ,,,,,,,,,,,,,3,316, ,,,,,,,,,,,,,3,283, ,,,,,,,,,,,,,3,316, ,,,,,,,,,,,,,3,349, ,,,,,,,,,,,,,3,449,
,,,Networking ,,,,,,,,,,,,,2,482, ,,,,,,,,,,,,,2,526, ,,,,,,,,,,,,,2,629, ,,,,,,,,,,,,,2,576, ,,,,,,,,,,,,,2,679, ,,,,,,,,,,,,,2,787, ,,,,,,,,,,,,,2,870,
,,,Business,Critical,Systems ,,,,,,,,,,,,,1,612, ,,,,,,,,,,,,,1,190, ,,,,,,,,,,,,,,,,929, ,,,,,,,,,,,,,,,,892, ,,,,,,,,,,,,,,,,910, ,,,,,,,,,,,,,,,,928, ,,,,,,,,,,,,,,,,946,
------Enterprise-Group-Total-Revenue ----------29,643- ----------28,081- ----------27,814- ----------27,896- ----------28,688- ----------29,507- ----------30,325-
,,,,,,%,Change,Y4to4Y 410.50% 45.27% 40.95% 0.29% 2.84% 2.86% 2.77%
,,,,,,%,of,total,revenue 24.63% 25.01% 24.20% 24.69% 25.24% 25.57% 25.86%
Enterprise-Services
,,,Infrastructure,Tech.,Outsourcing ,,,,,,,,,,16,176, ,,,,,,,,,,15,223, ,,,,,,,,,,14,038, ,,,,,,,,,,13,417, ,,,,,,,,,,13,149, ,,,,,,,,,,13,280, ,,,,,,,,,,13,480,
,,,Application,and,Business,Services ,,,,,,,,,,,,,9,817, ,,,,,,,,,,,,,8,838, ,,,,,,,,,,,,,8,360, ,,,,,,,,,,,,,8,085, ,,,,,,,,,,,,,7,923, ,,,,,,,,,,,,,8,002, ,,,,,,,,,,,,,8,122,
------Enterprise-Services-Total-Revenue ----------25,993- ----------24,061- ----------22,398- ----------21,502- ----------21,072- ----------21,283- ----------21,602-
,,,,,,%,change,Y4to_Y 3.66% 47.43% 46.91% 44.00% 42.00% 1.00% 1.50%
,,,,,,%,of,total,revenue 21.60% 21.43% 19.49% 19.03% 18.54% 18.44% 18.42%
Software -------------4,171- -------------4,021- -------------3,933- -------------3,894- -------------3,952- -------------4,011- -------------4,072-
,,,%,change,Y4to_Y 29.65% 43.60% 42.19% 41.00% 1.50% 1.50% 1.50%
,,,%,of,total,revenue 3.47% 3.58% 3.42%
Financial-Services -------------3,819- -------------3,629- -------------3,498- -------------3,428- -------------3,462- -------------3,514- -------------3,567-
,,,%,change,Y4to_Y 6.20% 44.98% 43.61% 42.00% 1.00% 1.50% 1.50%
,,,%,of,total,revenue 3.17% 3.23% 3.04% 3.03% 3.05% 3.04% 3.04%
Hewlett&Packard-Enterprises-Total-Revenue --------63,626- --------59,792- --------57,643- ----------56,720- ----------57,175- ----------58,316- ----------59,565-
%,change,Y4to_Y 42.13% 46.03% 43.59% 41.60% 0.80% 2.00% 2.14%
%,of,total,revenue 52.86% 53.24% 50.16% 50.20% 50.30% 50.52% 50.80%
HP-Inc.-(PPS-Group)Personal-Systems
,,,Notebook,PCs 18,830,,,,,,,,,, 16,029,,,,,,,,,, 17,540,,,,,,,,,, 18,768,,,,,,,,,, 19,143,,,,,,,,,, 19,526,,,,,,,,,, 19,917,,,,,,,,,,
,,,Desktop,PCs 13,888,,,,,,,,,, 12,844,,,,,,,,,, 13,197,,,,,,,,,, 12,141,,,,,,,,,, 11,656,,,,,,,,,, 11,422,,,,,,,,,, 11,194,,,,,,,,,,
,,,Workstations 2,148,,,,,,,,,,,, 2,147,,,,,,,,,,,, 2,218,,,,,,,,,,,, 2,174,,,,,,,,,,,, 2,217,,,,,,,,,,,, 2,261,,,,,,,,,,,, 2,284,,,,,,,,,,,,
,,,Other 977,,,,,,,,,,,,,,, 1,159,,,,,,,,,,,, 1,348,,,,,,,,,,,, 1,321,,,,,,,,,,,, 1,347,,,,,,,,,,,, 1,374,,,,,,,,,,,, 1,402,,,,,,,,,,,,
------Personal-Systems-Total-Revenue 35,843---------- 32,179---------- 34,303---------- 34,404---------- 34,363---------- 34,584---------- 34,797----------
,,,,,,%,change,Y4to_Y 49.43% 410.22% 6.60% 0.29% 40.12% 0.64% 0.61%
,,,,,,%,of,total,revenue 29.78% 28.66% 29.85% 30.45% 30.23% 29.96% 29.68%
Printing
,,,Supplies 16,151,,,,,,,,,, 15,716,,,,,,,,,, 14,917,,,,,,,,,, 14,171.15,,,, 14,312.86,,,, 14,599.12,,,, 14,891.10,,,,
,,,Consumer,Hardware 5,946,,,,,,,,,,,, 5,744,,,,,,,,,,,, 5,717,,,,,,,,,,,, 5,373.98,,,,,, 5,427.72,,,,,, 5,482.00,,,,,, 5,536.82,,,,,,
,,,Commercial,Hardware 2,441,,,,,,,,,,,, 2,436,,,,,,,,,,,, 2,345,,,,,,,,,,,, 2,321.55,,,,,, 2,379.59,,,,,, 2,439.08,,,,,, 2,463.47,,,,,,
------Printing-Total-Revenue 24,538---------- 23,896---------- 22,979---------- 21,867---------- 22,120---------- 22,520---------- 22,891----------
,,,,,,%,change,Y4to_Y 2.19% 42.62% 43.84% 44.84% 1.16% 1.81% 1.65%
,,,,,,%,of,total,revenue 20.39% 21.28% 19.99% 19.35% 19.46% 19.51% 19.52%
HP-Inc.-(PPS-Group)Total-Revenue 60,381------- 56,075------- 57,282------- 56,270---------- 56,483---------- 57,105---------- 57,688----------
%,change,Y4to_Y 45.04% 47.13% 2.15% 41.77% 0.38% 1.10% 1.02%
%,of,total,revenue 50.17% 49.93% 49.84% 49.80% 49.70% 49.48% 49.20%
GeographyUS 42,140,,,,,,,,,, 40,284,,,,,,,,,, 38,805,,,,,,,,,, 38533.2188 39148.5812 40153.1594 41198.6407
,,,,%,of,total,revenue 35.01% 35.87% 33.77% 34.10% 34.44% 34.79% 35.14%
,,,,%,change,Y4to_Y 44.47% 44.40% 43.67% 40.70% 1.60% 2.57% 2.60%
Other,Countries 78,217,,,,,,,,,, 72,014,,,,,,,,,, 72,649,,,,,,,,,, 74456.9712 74509.4437 75267.201 76054.4277
,,,,%,of,total,revenue 64.99% 64.13% 63.21% 65.90% 65.56% 65.21% 64.86%
,,,,%,change,Y4to_Y 45.91% 47.93% 0.88% 2.49% 0.07% 1.02% 1.05%

Hewlett&PackardIncome'Statement
Fiscal'Years'Ending'Oct.'31 2012 2013 2014 2015E 2016E 2017E 2018ERevenue1(in1millions)1111111Total1revenue 120,35711111 112,29811111 114,92511111 112,99011111 113,65811111 115,42011111 117,25311111
Costs1and1expenses Cost of Sales 92,385 86,380 84,839 86,381,,,,,,, 86,892,,,,,,, 88,239,,,,,,, 89,640,,,,,,, Research and development 3,399 3,135 3,447 3,672,,,,,,,,,, 3,694,,,,,,,,,, 3,751,,,,,,,,,, 3,811,,,,,,,,,, SG&A 13,500 13,267 13,353 12,429,,,,,,, 12,502,,,,,,, 12,696,,,,,,, 12,898,,,,,,, Amortization of purchased intangibles assets 1,784 1,373 1,000 872 653 244 147 Impairment of goodwill&purchased intangibles 18,035 - - Restructuring charges 2,266 990 1,619 1,300 500 100 100 Acquisition-related charges 45 22 11 10 10 10 101111111Total1operating1expenses 131,41411111 105,16711111 104,26911111 104,664,,,,, 104,251,,,,, 105,040,,,,, 106,606,,,,,
Earnings1(loss)1from1operations (11,057)111111 7,1311111111111 7,1851111111111 8,3261111111111 9,4071111111111 10,3801111111 10,6481111111
Interest and other income (loss), net (876) (621) (628) (621),,,,,,,,,,,, (625),,,,,,,,,,,, (635),,,,,,,,,,,, (645),,,,,,,,,,,, Earnings (loss) before taxes (11,933) 6,510 6,557 7,705,,,,,,,,,, 8,782,,,,,,,,,, 9,745,,,,,,,,,, 10,003,,,,,,,, Provision for taxes (717) (1,397) (1,544) (1,811),,,,,,,, (2,064),,,,,,,, (2,290),,,,,,,, (2,351),,,,,,,,111111Net1Earnings1(loss) (12,650)111111 5,1131111111111 5,0131111111111 5,894,,,,,,,,,, 6,718,,,,,,,,,, 7,455,,,,,,,,,, 7,652,,,,,,,,,,
Basic1earnings1(loss)1per1share: (6.41) 2.64 2.66 3.09,,,,,,,,,,,, 3.48,,,,,,,,,,,, 3.82,,,,,,,,,,,, 3.88,,,,,,,,,,,,Number1of1Share1Outstanding 1,974 1,934 1,882 1,905,,,,,,,,,, 1,928,,,,,,,,,, 1,951,,,,,,,,,, 1,974,,,,,,,,,,Annual1Dividends1per1Share 0.50$ 0.55$ 0.61$ 0.72$,,,,,,,,,, 0.83$,,,,,,,,,, 0.92$,,,,,,,,,, 0.95$,,,,,,,,,,Payout1ratio -7.80% 20.83% 22.93% 23.27% 23.72% 24.12% 24.62%

Hewlett&PackardBalance'Sheet
Fiscal'Years'Ending'Oct.'31 2012 2013 2014 2015E 2016E 2017E 2018ECurrent0Assets0(in0millions) 120,35700000 112,29800000 111,45400000 Cash and equivalents 11,301 12,163 15,133 ++++++++++17,902+ ++++++++++21,108+ ++++++++++27,642+ ++++++++++35,659+ Accounts receivable 16,407 15,875 13,832 ++++++++++14,621+ ++++++++++14,707+ ++++++++++14,935+ ++++++++++15,173+ Financing receivables 3,252 3,144 2,946 +++++++++++++2,893+ +++++++++++++2,910+ +++++++++++++2,955+ +++++++++++++3,002+ Inventory 6,317 6,046 6,415 +++++++++++++6,169+ +++++++++++++6,206+ +++++++++++++6,302+ +++++++++++++6,402+ Other current assets 13,360 13,135 11,819 ++++++++++11,638+ ++++++++++11,707+ ++++++++++11,888+ ++++++++++12,077+0000000Total0current0assets 50,6370000000 50,3640000000 50,1450000000 53,2230000000000 56,6370000000000 63,7220000000000 72,3120000000000
Property, Plant & Equipment, net 11,954 11,463 11,340 10,466++++++++++ 10,547++++++++++ 11,222++++++++++ 12,227++++++++++ Long term financing receivables/other assets 10,593 9,556 8,454 8,285++++++++++++ 8,119++++++++++++ 7,957++++++++++++ 7,798++++++++++++ Goodwill 31,069 31,124 31,139 31,139 31,139 31,139 31,139 Intangible assets 4,515 3,169 2,128 1,256++++++++++++ 603+++++++++++++++ 359+++++++++++++++ 212+++++++++++++++Total0assets 108,76800000 105,67600000 103,20600000 104,3680000000 107,0450000000 114,3990000000 123,6880000000
Current0liabilities Notes payable 6,647 5,979 3,486 3,290++++++++++++ 3,937++++++++++++ 2,790++++++++++++ 1,540++++++++++++ Accounts payable 13,350 14,019 15,903 16,045++++++++++ 16,139++++++++++ 16,390++++++++++ 16,650++++++++++ Employee compensation and benefits 4,058 4,436 4,209 3,989++++++++++++ 4,012++++++++++++ 4,074++++++++++++ 4,139++++++++++++ Taxes on earnings 846 1,203 1,017 1,267++++++++++++ 1,444++++++++++++ 1,603++++++++++++ 1,645++++++++++++ Deferred revenue 7,494 6,477 6,143 6,418++++++++++++ 6,456++++++++++++ 6,556++++++++++++ 6,660++++++++++++ Accrued restructuring 771 901 898 895+++++++++++++++ 892+++++++++++++++ 889+++++++++++++++ 886+++++++++++++++ Other accrued liabilities 13,500 12,506 12,079 11,977++++++++++ 12,048++++++++++ 12,235++++++++++ 12,429++++++++++0000000Total0current0liabilities 46,6660000000 45,5210000000 43,7350000000 43,8800000000000 44,9290000000000 44,5360000000000 43,9490000000000
Long-term debt 21,789 16,608 16,039 15,851++++++++++ 15,481++++++++++ 15,655++++++++++ 16,057++++++++++ Other liabilities 17,480 15,891 16,305 16,440++++++++++ 16,537++++++++++ 16,794++++++++++ 17,060++++++++++Total0Liabilities 85,9350000000 78,0200000000 76,0790000000 76,1720000000000 76,9470000000000 76,9850000000000 77,0660000000000
Stockholders0equity Preferred stock Common stock/Add't paid-in capital 6,474 5,484 3,448 4,518++++++++++++ 5,588++++++++++++ 6,658++++++++++++ 7,728++++++++++++ Retained earnings 21,521 25,563 29,164 26,882++++++++++ 27,714++++++++++ 33,959++++++++++ 42,097++++++++++ Accum. other comp. earnings (loss) (5,559) (3,778) (5,881) (3,600) (3,600) (3,600) (3,600) 000000Total0HP0stockholder's0equity 22,4360000000 27,2690000000 36,7310000000 27,8010000000 29,7020000000 37,0170000000 46,2250000000Non-controlling interests 397 387 396 396 396 396 396
Total0stockholders0equity 22,8330000000 27,6560000000 27,1270000000 28,1970000000 30,0980000000 37,4130000000 46,6210000000
Total0liabilities0and0stockholders'0equity 108,76800000 105,67600000 103,20600000 000000104,3680 000000107,0450 000000114,3990 000000123,6880
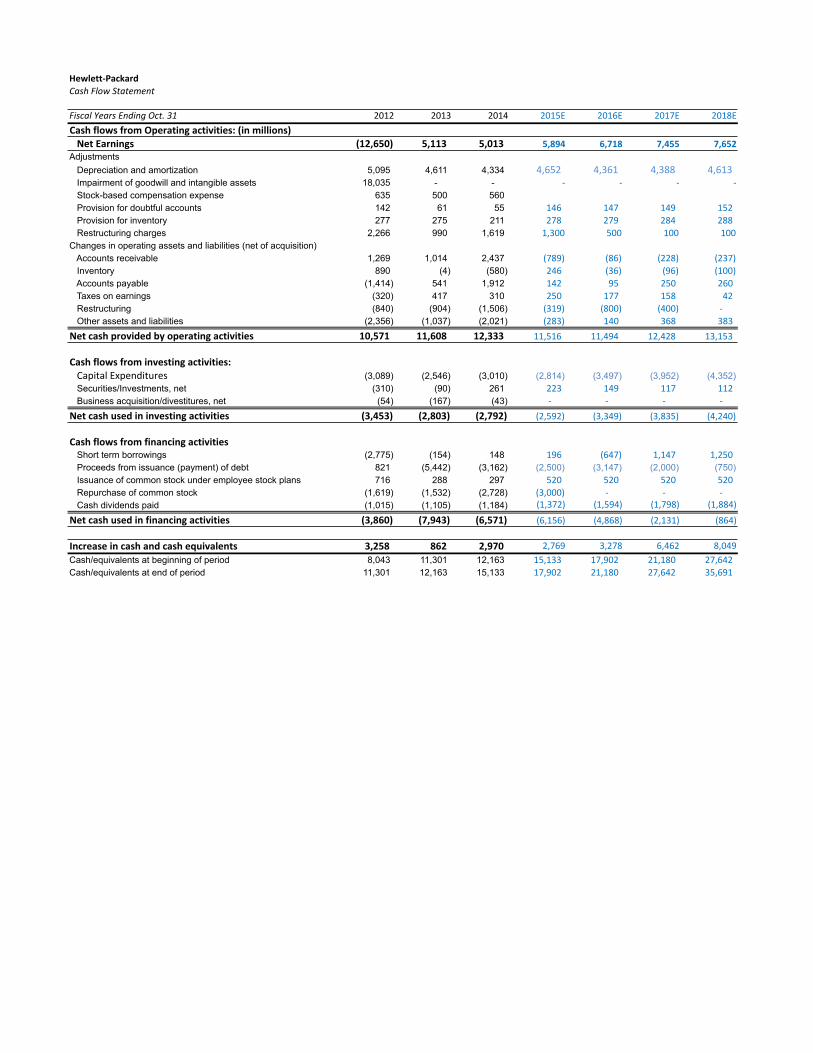
Hewlett&PackardCash%Flow%Statement
Fiscal%Years%Ending%Oct.%31 2012 2013 2014 2015E 2016E 2017E 2018ECash0flows0from0Operating0activities:0(in0millions)000Net0Earnings (12,650)000000 5,1130000000000 5,0130000000000 00000000000005,8940 00000000000006,7180 00000000000007,4550 00000000000007,6520Adjustments Depreciation and amortization 5,095 4,611 4,334 4,652,,,,,,,,,, 4,361,,,,,,,,,, 4,388,,,,,,,,,, 4,613,,,,,,,,,, Impairment of goodwill and intangible assets 18,035 - - ,,,,,,,,,,,,,,,,,,,-,,, ,,,,,,,,,,,,,,,,,,,-,,, ,,,,,,,,,,,,,,,,,,,-,,, ,,,,,,,,,,,,,,,,,,,-,,, Stock-based compensation expense 635 500 560 Provision for doubtful accounts 142 61 55 146,,,,,,,,,,,,,,, 147,,,,,,,,,,,,,,, 149,,,,,,,,,,,,,,, 152,,,,,,,,,,,,,,, Provision for inventory 277 275 211 278,,,,,,,,,,,,,,, 279,,,,,,,,,,,,,,, 284,,,,,,,,,,,,,,, 288,,,,,,,,,,,,,,, Restructuring charges 2,266 990 1,619 1,300 500 100 100Changes in operating assets and liabilities (net of acquisition) Accounts receivable 1,269 1,014 2,437 (789),,,,,,,,,,,,,, (86),,,,,,,,,,,,,,,, (228),,,,,,,,,,,,,, (237),,,,,,,,,,,,,, Inventory 890 (4) (580) 246,,,,,,,,,,,,,,, (36),,,,,,,,,,,,,,,, (96),,,,,,,,,,,,,,,, (100),,,,,,,,,,,,,, Accounts payable (1,414) 541 1,912 142,,,,,,,,,,,,,,, 95,,,,,,,,,,,,,,,,, 250,,,,,,,,,,,,,,, 260,,,,,,,,,,,,,,, Taxes on earnings (320) 417 310 250,,,,,,,,,,,,,,, 177,,,,,,,,,,,,,,, 158,,,,,,,,,,,,,,, 42,,,,,,,,,,,,,,,,, Restructuring (840) (904) (1,506) (319),,,,,,,,,,,,,, (800),,,,,,,,,,,,,, (400),,,,,,,,,,,,,, -,,,,,,,,,,,,,,,, Other assets and liabilities (2,356) (1,037) (2,021) (283),,,,,,,,,,,,,, 140,,,,,,,,,,,,,,, 368,,,,,,,,,,,,,,, 383,,,,,,,,,,,,,,,Net0cash0provided0by0operating0activities 10,5710000000 11,6080000000 12,3330000000 11,516,,,,,,,,,, 11,494,,,,,,,,,, 12,428,,,,,,,,,, 13,153,,,,,,,,,,
Cash0flows0from0investing0activities:,,,Capital,Expenditures (3,089) (2,546) (3,010) (2,814) (3,497) (3,952) (4,352) Securities/Investments, net (310) (90) 261 223,,,,,,,,,,,,,,, 149,,,,,,,,,,,,,,, 117,,,,,,,,,,,,,,, 112,,,,,,,,,,,,,,, Business acquisition/divestitures, net (54) (167) (43) -,,,,,,,,,,,,,,,, -,,,,,,,,,,,,,,,, -,,,,,,,,,,,,,,,, -,,,,,,,,,,,,,,,,Net0cash0used0in0investing0activities (3,453)00000000 (2,803)00000000 (2,792)00000000 (2,592),,,,,,,,,, (3,349),,,,,,,,,, (3,835),,,,,,,,,, (4,240),,,,,,,,,,
Cash0flows0from0financing0activities Short term borrowings (2,775) (154) 148 196,,,,,,,,,,,,,,, (647),,,,,,,,,,,,,, 1,147,,,,,,,,,,,, 1,250,,,,,,,,,,,, Proceeds from issuance (payment) of debt 821 (5,442) (3,162) (2,500) (3,147) (2,000) (750) Issuance of common stock under employee stock plans 716 288 297 520,,,,,,,,,,,,,,, 520,,,,,,,,,,,,,,, 520,,,,,,,,,,,,,,, 520,,,,,,,,,,,,,,, Repurchase of common stock (1,619) (1,532) (2,728) (3,000),,,,,,,,,, -,,,,,,,,,,,,,,,, -,,,,,,,,,,,,,,,, -,,,,,,,,,,,,,,,, Cash dividends paid (1,015) (1,105) (1,184) ,,,,,,,,,,,(1,372) ,,,,,,,,,,,(1,594) ,,,,,,,,,,,(1,798) ,,,,,,,,,,,(1,884)Net0cash0used0in0financing0activities (3,860)00000000 (7,943)00000000 (6,571)00000000 ,,,,,,,,,,,(6,156) ,,,,,,,,,,,(4,868) ,,,,,,,,,,,(2,131) ,,,,,,,,,,,,,,(864)
Increase0in0cash0and0cash0equivalents 3,2580000000000 8620000000000000 2,9700000000000 ,,,,,,,,,,,,,2,769, ,,,,,,,,,,,,,3,278, ,,,,,,,,,,,,,6,462, ,,,,,,,,,,,,,8,049,Cash/equivalents at beginning of period 8,043 11,301 12,163 15,133,,,,,,,,,, 17,902,,,,,,,,,, 21,180,,,,,,,,,, 27,642,,,,,,,,,,Cash/equivalents at end of period 11,301 12,163 15,133 17,902,,,,,,,,,, 21,180,,,,,,,,,, 27,642,,,,,,,,,, 35,691,,,,,,,,,,
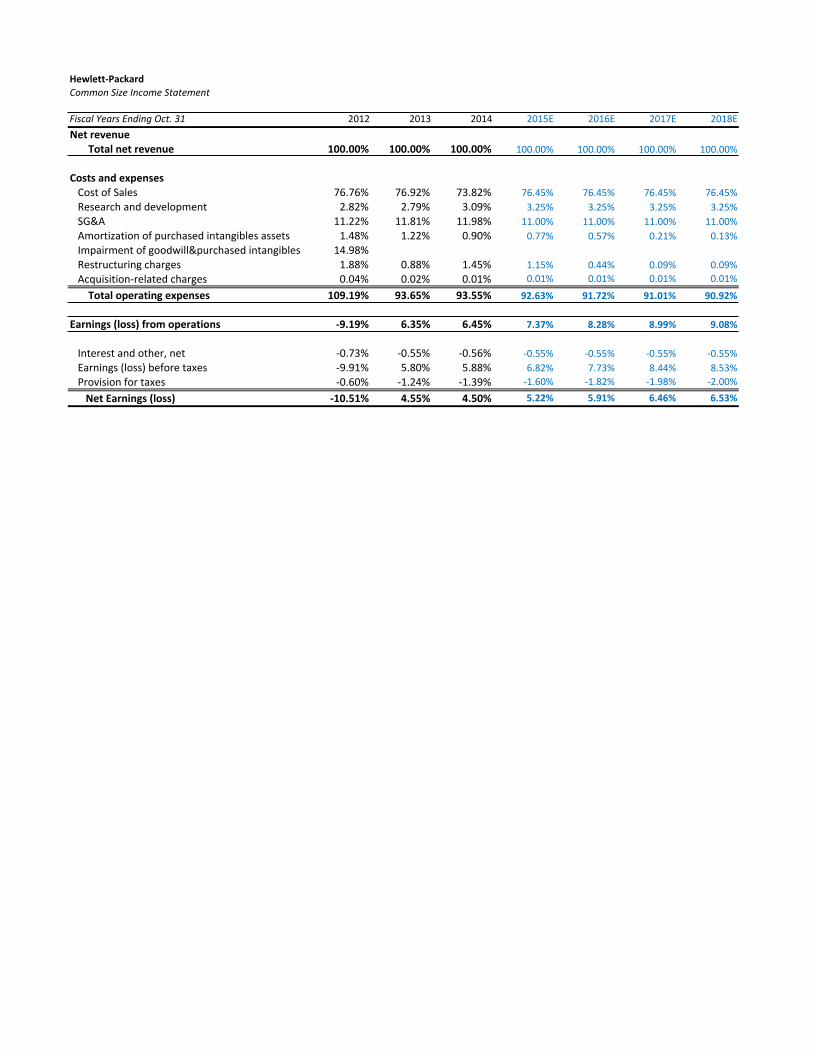
Hewlett&PackardCommon%Size%Income%Statement
Fiscal%Years%Ending%Oct.%31 2012 2013 2014 2015E 2016E 2017E 2018ENet.revenue.......Total.net.revenue 100.00% 100.00% 100.00% 100.00% 100.00% 100.00% 100.00%
Costs.and.expenses---Cost-of-Sales 76.76% 76.92% 73.82% 76.45% 76.45% 76.45% 76.45%---Research-and-development 2.82% 2.79% 3.09% 3.25% 3.25% 3.25% 3.25%---SG&A 11.22% 11.81% 11.98% 11.00% 11.00% 11.00% 11.00%---Amortization-of-purchased-intangibles-assets 1.48% 1.22% 0.90% 0.77% 0.57% 0.21% 0.13%---Impairment-of-goodwill&purchased-intangibles 14.98%---Restructuring-charges 1.88% 0.88% 1.45% 1.15% 0.44% 0.09% 0.09%---AcquisitionLrelated-charges 0.04% 0.02% 0.01% 0.01% 0.01% 0.01% 0.01%.......Total.operating.expenses 109.19% 93.65% 93.55% 92.63% 91.72% 91.01% 90.92%
Earnings.(loss).from.operations &9.19% 6.35% 6.45% 7.37% 8.28% 8.99% 9.08%
---Interest-and-other,-net L0.73% L0.55% L0.56% L0.55% L0.55% L0.55% L0.55%---Earnings-(loss)-before-taxes L9.91% 5.80% 5.88% 6.82% 7.73% 8.44% 8.53%---Provision-for-taxes L0.60% L1.24% L1.39% L1.60% L1.82% L1.98% L2.00%......Net.Earnings.(loss) &10.51% 4.55% 4.50% 5.22% 5.91% 6.46% 6.53%

Hewlett&PackardCommon%Size%Balance%Sheet
Fiscal%Years%Ending%Oct.%31 2012 2013 2014 2015E 2016E 2017E 2018E
Current0Assets+++Cash+and+equivalents 9.39% 10.83% 13.58% 15.84% 18.57% 23.95% 30.41%
+++Accounts+receivable 13.63% 14.14% 12.41% 12.94% 12.94% 12.94% 12.94%
+++Financing+receivables 2.70% 2.80% 2.64% 2.56% 2.56% 2.56% 2.56%
+++Inventory 5.25% 5.38% 5.76% 5.46% 5.46% 5.46% 5.46%
+++Other+current+assets+ 11.10% 11.70% 10.60% 10.30% 10.30% 10.30% 10.30%
0000000Total0current0assets 42.07% 44.85% 44.99% 47.10% 49.83% 55.21% 61.67%
+++Property,+Plant+&+Equipment 9.93% 10.21% 10.17% 9.26% 9.28% 9.72% 10.43%
+++Long+term+financing+receivables/other+assets 8.80% 8.51% 7.59% 7.33% 7.14% 6.89% 6.65%
+++Goodwill 25.81% 27.72% 27.94% 27.56% 27.40% 26.98% 26.56%
+++Intangible+assets 3.75% 2.82% 1.91% 1.11% 0.53% 0.31% 0.18%
Total0assets 90.37% 94.10% 92.60% 92.37% 94.18% 99.12% 105.49%
Current0liabilities+++Notes+payable 5.52% 5.32% 3.13% 2.91% 3.46% 2.42% 1.31%
+++Accounts+payable 11.09% 12.48% 14.27% 14.20% 14.20% 14.20% 14.20%
+++Employee+compensation+and+benefits 3.37% 3.95% 3.78% 3.53% 3.53% 3.53% 3.53%
+++Taxes+on+earnings 0.70% 1.07% 0.91% 1.12% 1.27% 1.39% 1.40%
+++Deferred+revenue 6.23% 5.77% 5.51% 5.68% 5.68% 5.68% 5.68%
+++Accrued+restructuring 0.64% 0.80% 0.81% 0.79% 0.78% 0.77% 0.76%
+++Other+accrued+liabilities 11.22% 11.14% 10.84% 10.60% 10.60% 10.60% 10.60%
0000000Total0current0liabilities 38.77% 40.54% 39.24% 38.84% 39.53% 38.59% 37.48%
+++LongTterm+debt 18.10% 14.79% 14.39% 14.03% 13.62% 13.56% 13.69%
+++Other+liabilities 14.52% 14.15% 14.63% 14.55% 14.55% 14.55% 14.55%
Total0Liabilities 71.40% 69.48% 68.26% 67.41% 67.70% 66.70% 65.73%
Stockholders0equity+++Preferred+stock
+++Common+stock/add't+paidTin+capital 5.38% 4.88% 3.09% 4.00% 4.92% 5.77% 6.59%
+++Retained+earnings 17.88% 22.76% 26.17% 23.79% 24.38% 29.42% 35.90%
+++Accum.+other+comp.+earnings+(loss) T4.62% T3.36% T5.28% T3.19% T3.17% T3.12% T3.07%
000000Total0HP0stockholder's0equity 18.64% 24.28% 32.96% 24.60% 26.13% 32.07% 39.42%
NonTcontrolling+interests 0.33% 0.34% 0.36% 0.35% 0.35% 0.34% 0.34%
Total0stockholders0equity 18.97% 24.63% 24.34% 24.95% 26.48% 32.41% 39.76%
Total0liabilities0and0stockholders'0equity 90.37% 94.10% 92.60% 92.37% 94.18% 99.11% 105.49%

Hewlett&PackardValue&Driver&Estimation
Fiscal&Years&Ending&Oct.&31 2012 2013 2014 2015E 2016E 2017E 2018ECalculation*of*NOPLATEBITA
Revenue 120,35744444 112,29844444 114,92544444 44444444112,9904 44444444113,6584 44444444115,4204 44444444117,2534010Cost0of0Goods0Sold 000000000092,3850 000000000086,3800 000000000084,8390 000000000086,3810 000000000086,8920 000000000088,2390 000000000089,6400010SG&A 000000000013,5000 000000000013,2670 000000000013,3530 000000000012,4290 000000000012,5020 000000000012,6960 000000000012,8980010Research0and0development 00000000000003,3990 00000000000003,1350 00000000000003,4470 00000000000003,6720 00000000000003,6940 00000000000003,7510 00000000000003,8110010Amortization0of0purchased0intangible0assets 1,784 1,373 1,000 00000000000000008720 00000000000000006530 00000000000000002440 000000000000000014700+0Implied0Interest0on0Op.0Leases 390000000000000000 413000000000000000 380000000000000000 346000000000000000 319000000000000000 322000000000000000 342000000000000000EBITA 9,679444444444444 8,556444444444444 12,6664444444444 9,982444444444444 10,2364444444444 10,8124444444444 11,1004444444444
Marginal4Tax4Rate &6.0% 21.5% 23.5% 23.5% 23.5% 23.5% 23.5%
Less:&Adjusted&Taxes
Income0Tax0Provision 717 1,397 1,544 1,811000000000000 2,064000000000000 2,290000000000000 2,3510000000000000+0Tax0shield0on0Interest0Expense 307000000000000000 217000000000000000 220000000000000000 218000000000000000 219000000000000000 222000000000000000 2260000000000000000+0Tax0shield0on0restructuring0charges 793000000000000000 347000000000000000 567000000000000000 455000000000000000 175000000000000000 3500000000000000000 35000000000000000000+0Tax0shield0on0Acquisition1related0charges 1600000000000000000 800000000000000000000 400000000000000000000 400000000000000000000 400000000000000000000 400000000000000000000 4000000000000000000000+0Tax0shield0on0Op0Lease0Interest 136000000000000000 144000000000000000 133000000000000000 121000000000000000 112000000000000000 113000000000000000 120000000000000000Total4Adjusted4Taxes 1,969444444444444 2,113444444444444 2,467444444444444 2,608444444444444 2,573444444444444 2,663444444444444 2,735444444444444
Plus:&Change&in&Deferred&Taxes
Deferred0Tax0Liabilities 2,948000000000000 9,230000000000000 9,721000000000000 4,508000000000000 5,139000000000000 5,702000000000000 5,853000000000000Deferred0Tax0Assets 5,364000000000000 11,4260000000000 11,8070000000000 5,848000000000000 6,666000000000000 7,397000000000000 7,593000000000000Net0Deferred0Taxes (2,416)0000000000 (2,196)0000000000 (2,086)0000000000 (1,340)0000000000 (1,527)0000000000 (1,695)0000000000 (1,739)0000000000Change4in4Deferred4Taxes (922)44444444444444 220444444444444444 110444444444444444 746444444444444444 (187)44444444444444 (168)44444444444444 (45)4444444444444444
NOPLAT 6,788444444444444 6,663444444444444 10,3084444444444 8,120444444444444 7,476444444444444 7,981444444444444 8,120444444444444
Calculation*of*Invested*CapitalOperating&Current&Assets
Normal0Cash 24,0710000000000 22,4600000000000 15,1330000000000 17,9020000000000 21,1080000000000 27,6420000000000 35,6590000000000Accounts0Receivable 16,407 15,875 13,832 14,6210000000000 14,7070000000000 14,9350000000000 15,1730000000000Inventory 6,317 6,046 6,415 6,169000000000000 6,206000000000000 6,302000000000000 6,402000000000000Other0current0assests0(less0s.t.0deferred0taxes) 9,577 9,242 9,065 6,568000000000000 5,928000000000000 5,476000000000000 5,495000000000000Current4Operating4Assests 56,3724444444444 53,6234444444444 44,4454444444444 45,2614444444444 47,9494444444444 54,3554444444444 62,7294444444444NonHInterest&Bearing&Current&Liabilities
Accounts0payable 13,350 14,019 15,903 16,0450000000000 16,1390000000000 16,3900000000000 16,6500000000000Taxes0on0Earnings 846 1,203 1,017 00000000000001,2670 00000000000001,4440 00000000000001,6030 00000000000001,6450Deferred0Revenue 7,494 6,477 6,143 00000000000006,4180 00000000000006,4560 00000000000006,5560 00000000000006,6600Other0Accrued0liabilities 13,500 12,506 12,079 000000000011,9770 000000000012,0480 000000000012,2350 000000000012,4290Current4Operating4Liabilities 444444444435,1904 444444444434,2054 444444444435,1424 444444444435,7074 444444444436,0874 444444444436,7834 444444444437,3844
Net4Operating4Working4Capital 21,1824444444444 19,4184444444444 9,303444444444444 9,554444444444444 11,8624444444444 17,5724444444444 25,3454444444444
Plus:4Net4Property,4Plant,4&4Equipment 11,954 11,463 11,340 10,4664444444444 10,5474444444444 11,2224444444444 12,2274444444444
Intangible0Assets,0Net 4,515 3,169 2,128 1,256000000000000 603000000000000000 359000000000000000 212000000000000000Captilaized0PV0of0Operating0Leases 7,530000000000000 6,928000000000000 6,309000000000000 5,823000000000000 5,868000000000000 6,243000000000000 6,803000000000000Other0Operating0Assets 4,720000000000000 4,332000000000000 4,101000000000000 3,728000000000000 3,654000000000000 3,581000000000000 3,509000000000000Plus:4Other4Operating4Assets,4net4depreciation 16,7654444444444 14,4294444444444 12,5384444444444 10,8074444444444 10,1244444444444 10,1834444444444 10,5244444444444
LT0deferred0revenue 3,371000000000000 3,907000000000000 3,931000000000000 3,378000000000000 3,398000000000000 3,451000000000000 3,506000000000000Other0long1term0liabilities 3,381000000000000 2,005000000000000 2,010000000000000 2,034000000000000 2,046000000000000 2,078000000000000 2,111000000000000LT0Income0Tax0Liability 2,213000000000000 2,861000000000000 2,877000000000000 2,894000000000000 2,939000000000000 2,986000000000000Less:4Other4Operating4Liabilties 6,752444444444444 8,125444444444444 8,802444444444444 8,289444444444444 8,338444444444444 8,468444444444444 8,602444444444444
Invested4Capital 43,1504444444444 37,1854444444444 24,3794444444444 22,5374444444444 24,1954444444444 30,5094444444444 39,4944444444444
Value*DriversNOPLAT 6,788000000000000 6,663000000000000 10,3080000000000 8,120000000000000 7,476000000000000 7,981000000000000 8,120000000000000Beginning0Invested0Capital 50,9990000000000 43,1500000000000 37,1850000000000 24,3790000000000 22,5370000000000 24,1950000000000 30,5090000000000Return4on4Invested4Capital4(ROIC) 13.31% 15.44% 27.72% 33.31% 33.17% 32.99% 26.62%
NOPLAT 6,788000000000000 6,663000000000000 10,3080000000000 8,120000000000000 7,476000000000000 7,981000000000000 8,120000000000000IC0Current0Year 43,1500000000000 37,1850000000000 24,3790000000000 22,5370000000000 24,1950000000000 30,5090000000000 39,4940000000000IC0Previous0Year 50,9990000000000 43,1500000000000 37,1850000000000 24,3790000000000 22,5370000000000 24,1950000000000 30,5090000000000Free4Cash4Flow4(FCF) 14,6374444444444 12,6274444444444 23,1144444444444 9,962444444444444 5,819444444444444 1,666444444444444 (864)44444444444444
NOPLAT 6,788000000000000 6,663000000000000 10,3080000000000 8,120000000000000 7,476000000000000 7,981000000000000 8,120000000000000Beginning0Invested0Capital 50,9990000000000 43,1500000000000 37,1850000000000 24,3790000000000 22,5370000000000 24,1950000000000 30,5090000000000WACC 8.48% 8.48% 8.48% 8.48% 8.48% 8.48% 8.48%Economic4Proft 2,465444444444444 3,006444444444444 7,157444444444444 6,054444444444444 5,566444444444444 5,930444444444444 5,535444444444444

Hewlett&PackardDiscounted+Cash+Flow+(DCF)+and+Economic+Profit+(EP)+Valuation+Models
Key$Inputs:$$$$$CV$Growth 1.75%$$$$$CV$ROIC 26.62%$$$$$WACC 8.48%$$$$$Cost$of$Equity 10.34%
Fiscal+Years+Ending+Oct.+31 2015E 2016E 2017E 2018E
DCF0ModelFree$Cash$Flow $$$$$$$$$$$$$9,962$ $$$$$$$$$$$$$5,819$ $$$$$$$$$$$$$1,666$ $$$$$$$$$$$$$$(864)Periods$to$Discount $$$$$$$$$$$$$$$$$$$$1$ $$$$$$$$$$$$$$$$$$$$2$ $$$$$$$$$$$$$$$$$$$$3$ $$$$$$$$$$$$$$$$$$$$3$CV$of$FCF $$$$$$$$112,785$Discounted$DCF $$$$$$$$$$$$$9,184$ $$$$$$$$$$$$$4,945$ $$$$$$$$$$$$$1,305$ $$$$$$$$$$88,360$
Value$of$Operations 103,794$$$$$$$$$$$$$$Plus:$Excess$Cash R$$$$$$$$$$$$$$$$$$$$$$$Plus:$ShortRterm$financing 2,946$$$$$$$$$$$$$$$$$$$Plus:$LongRterm$financing 4,353$$$$$$$$$$$$$$$$$$$Less:$PV$of$Op$Leases 6,309$$$$$$$$$$$$$$$$$$$Less:$ESOP 1,070$$$$$$$$$$$$$$$$$$$Less:$Debt 19,525$$$$$$$$$$$$$$$$Less:$Underfunded$pension$Liab. 1,777$$$$$$$$$$$$$$$$$$$Less:$Contingent$Litigation 178$$$$$$$$$$$$$$$$$$$$$$Less:$Minority$Interest$Liab. 396$$$$$$$$$$$$$$$$$$$$$$Value$of$Equity 81,838$$$$$$$$$$$$$$$$Shares$Outstanding 1,882$$$$$$$$$$$$$$$$$$$
Share$price$FY14 43.48$$$$$$$$$$$$$$$$$Share$price$today 45.36$$$$$$$$$$$$$$$$$
EP0ModelInvested$Capital 24,379$$$$$$$$$$$$$$$$Economic$Profit 6,054$$$$$$$$$$$$ 5,566$$$$$$$$$$$$ 5,930$$$$$$$$$$$$ 5,535$$$$$$$$$$$$Periods$to$Discount 1$$$$$$$$$$$$$$$$$$$$ 2$$$$$$$$$$$$$$$$$$$$ 3$$$$$$$$$$$$$$$$$$$$ 3$$$$$$$$$$$$$$$$$$$$CV$of$EP 82,275$$$$$$$$$$Discounted$EP 5,581$$$$$$$$$$$$ 4,730$$$$$$$$$$$$ 4,646$$$$$$$$$$$$ 64,458$$$$$$$$$$
Sum$of$Eps 79,415$$$$$$$$$$$$$$$$Value$of$Operations 103,794$$$$$$$$$$$$$$Plus:$Excess$Cash R$$$$$$$$$$$$$$$$$$$$$$$Plus:$ShortRterm$financing 2,946$$$$$$$$$$$$$$$$$$$Plus:$LongRterm$financing 4,353$$$$$$$$$$$$$$$$$$$Less:$PV$of$Op$Leases 6,309$$$$$$$$$$$$$$$$$$$Less:$ESOP 1,070$$$$$$$$$$$$$$$$$$$Less:$Debt 19,525$$$$$$$$$$$$$$$$Less:$Underfunded$Pension$Liab. 1,777$$$$$$$$$$$$$$$$$$$Less:$Contingent$Litigation 178$$$$$$$$$$$$$$$$$$$$$$Less:$Minority$Interest$Liab. 396$$$$$$$$$$$$$$$$$$$$$$Value$of$Equity 81,838$$$$$$$$$$$$$$$$Shares$Outstanding 1,882$$$$$$$$$$$$$$$$$$$
Share$price$FY14 43.48$$$$$$$$$$$$$$$$$Share$price$today 45.36$$$$$$$$$$$$$$$$$

Hewlett&PackardWeighted(Average(Cost(of(Capital((WACC)(Estimation
WACC$=$Re(E/V)$+$Rd(10t)(D/V)$+$Rpdf(PDF/V)
Cost0of0EquityRisk0free$rate 2.58%
Market$Premium 4.85%
Equity$Beta$of$Firm 1.6
Cost$of$Equity$(Re) 10.34%
Cost0of0Debt0Cost$of$Debt$(Rd) 5.48%
Cost0of0Preferred0Stock No$Preferred$Stock$Issued
Weight0of0EquityMV$of$Common$Stock 33.21$$$$$$$$$$$$$$$$$$$$$$$$$$$
Shares$Outstanding 1,833,000,000$$$$$$$$$$$$
MV$of$Equity 60,873,930,000$$$$$$$$$
Weight$of$Equity 69.67%
Weight0of0DebtPV$of$Operating$Leases 6,598,000,000$$$$$$$$$$$$
MV$of$debt,$short$&$long$term 19,900,000,000$$$$$$$$$$
MV$of$TOTAL$Debt 26,498,000,000$$$$$$$$$
Weight$of$Debt 30.33%
MV0of0Total0Capital 87,371,930,000$$$$$$$$$$
WACC 8.48%

Hewlett&PackardDividend'Discount'Model'(DDM)'or'Fundamental'P/E'Valuation'Model
Fiscal'Years'Ending'Oct.'31 2015E 2016E 2017E 2018E
EPS 3.09$//////// 3.48$//////// 3.82$//////// 3.88$////////
Key$Assumptions///CV/growth 1.44%///CV/ROE 16.41%///Cost/of/Equity 10.34%
Future$Cash$Flows/////P/E/Multiple/(CV/Year) 10.25/////EPS/(CV/Year) 3.88$/////////////CV/of/Future/Cash/Flow 10.25$///////////Dividends/Per/Share 0.72$//////// 0.83$//////// 0.92$//////// 0.95$/////////////Discounted/FCF 0.65$//////// 0.68$//////// 0.69$//////// 7.63$////////
Intrinsic/Value/FY14 9.65$////////Intrinsic/value/today 10.05$//////
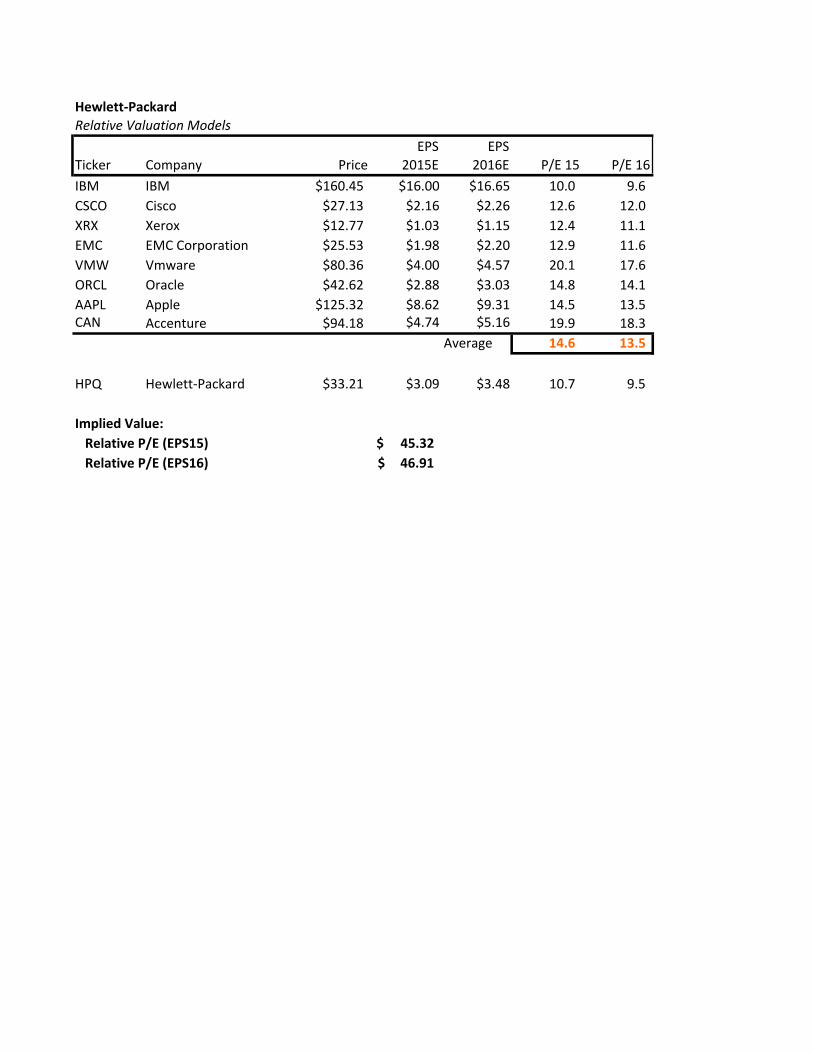
Hewlett&PackardRelative(Valuation(Models
EPS EPSTicker Company Price 2015E 2016E P/E715 P/E716
IBM IBM $160.45 $16.007 $16.657 10.07777777777 9.6777777777777CSCO Cisco $27.13 $2.167 $2.267 12.67777777777 12.07777777777XRX Xerox $12.77 $1.037 $1.157 12.47777777777 11.17777777777EMC EMC7Corporation $25.53 $1.987 $2.207 12.97777777777 11.67777777777VMW Vmware $80.36 $4.007 $4.577 20.17777777777 17.67777777777ORCL Oracle $42.62 $2.887 $3.037 14.87777777777 14.17777777777AAPL Apple $125.32 $8.627 $9.317 14.57777777777 13.57777777777CAN Accenture $94.18 $4.747 $5.167 19.97777777777 18.37777777777
Average 14.61111111111 13.51111111111
HPQ HewlettTPackard $33.21 $3.097 $3.487 10.77777777777 9.5777777777777
Implied1Value:111Relative1P/E1(EPS15) 1$1111145.321111Relative1P/E1(EPS16) 46.91$11111

Hewlett&PackardKey$Management$Ratios
Fiscal$Years$Ending$Oct.$31 2012 2013 2014 2015E 2016E 2017E 2018E
Liquidity(RatiosCurrent1Ratio1(Current1assets/current1liabilities) 1.091111111111 1.111111111111 1.15111111111111111 1.211111111111 1.261111111111 1.431111111111 1.651111111111Quick1Ratio1((Current1Assets1B1Inventory)/Current1Liabilities) 0.951111111111 0.971111111111 1.00111111111111111 1.071111111111 1.121111111111 1.291111111111 1.501111111111Operating1Cash1Flow1ratio1(Op1CF/current1liabilities) 0.231111111111 0.261111111111 0.28111111111111111 0.321111111111 0.361111111111 0.411111111111 0.521111111111
Activity(or(Asset2Management(RatiosInventory1Turnover1(COGS/avg1inventory) 13.3811111111 13.9711111111 13.621111111111111 13.7311111111 14.0411111111 14.1111111111 14.1111111111Receivable1Turnover1(Sales/Account1receivables) 7.341111111111 7.071111111111 8.31111111111111111 7.731111111111 7.731111111111 7.731111111111 7.731111111111Total1Asset1Turnover1(Sales/Total1Assets) 1.111111111111 1.061111111111 1.11111111111111111 1.081111111111 1.061111111111 1.011111111111 0.951111111111
Financial(Leverage(RatiosDebt/Equity1(Total1liabilities/Total1shareholders'1equity) 3.761111111111 2.821111111111 2.80111111111111111 2.701111111111 2.561111111111 2.061111111111 1.651111111111Debt1Ratio1(total1liabiilities/total1assets) 0.791111111111 0.741111111111 0.74111111111111111 0.731111111111 0.721111111111 0.671111111111 0.621111111111Equity1Ratio1(Shareholders'1equity/Total1assets) 0.211111111111 0.261111111111 0.26111111111111111 0.271111111111 0.281111111111 0.331111111111 0.381111111111
Profitability(RatiosGross1Margin1((RevenueBCOGS)/Revenue) 23.24% 23.08% 26.18% 23.55% 23.55% 23.55% 23.55%Net1Profit1Margin1(Net1Income/Net1Sales) B10.51% 4.55% 4.36% 5.22% 5.91% 6.46% 6.53%Return1on1Assets1(Net1Income/Total1assets) B11.63% 4.84% 4.86% 5.65% 6.28% 6.52% 6.19%Return1on1Equity1(Net1Income/Total1shareholders'1equity) B55.40% 18.49% 18.48% 20.90% 22.32% 19.93% 16.41%
Payout(Policy(RatiosDividend1Payout1Ratio1(div.1per1share/EPS) (0.08)111111111 0.211111111111 0.23111111111111111 0.231111111111 0.241111111111 0.241111111111 0.251111111111Total1payout1ratio1(Div1paid1+1repurchases/Net1income) 0.511111111111 0.78111111111111111


![royce-walton@uiowa.edu] Inc. (SWK) November 16, 2015tippie.biz.uiowa.edu/henry/reports15/SWK_fa15.pdf · 2015-11-16 · Stanley Black & Decker, Inc. (SWK) November 16, 2015 Industrials](https://img.pdfslide.us/doc/110x75/5f580e5028d3836de53cb67b/royce-waltonuiowaedu-inc-swk-november-16-2015-11-16-stanley-black-.jpg)