Embed Size (px)
Citation preview

Important disclosures appear on the last page of this report.
The Henry Fund
Henry B. Tippie School of Management Amit Shah [amitashok-‐[email protected]] Chevron Corporation (CVX) November 19, 2015
Energy – Integrated Oil & Gas Stock Rating Hold
Investment Thesis Target Price $92-‐96 With the price of US oil at $40/barrel, the going is getting tough for the oil and gas industry. Despite the significant decline in profitability of companies in the industry, there is great uncertainty over the timing of recovery of oil prices. We believe that in such uncertain environment integrated oil and gas companies like CVX are well placed to weather out the storm. We believe that CVX is one of the highest-‐quality integrated petroleum entities in the world. On the one hand CVX’s profitability in the upstream business is multi year low, the downstream business is helping it generate the much-‐needed cash flow to sustain business. We don’t see significant upside in the stock price of CVX. However, we believe that the company will outperform its peers in the industry. We recommend HOLD on CVX with target price of $95. Drivers of Thesis • Historically, upstream business has been the major profit contributor to
the company. The current low oil price environment will continue to impact the upstream business negatively.
• Downstream business is doing well in low oil price environment due to increase in refining margins. However, the improved performance of downstream business is not sufficient to offset the loss of profitability in upstream business.
• Though we believe that the current low oil prices are not sustainable and would rise to $70 by 2017, we think it is unlikely to reach historical highs of 110+ over next 5-‐6 years thereby limiting the profitability
Risks to Thesis • A significant reduction in the oil prices from current level would have
adverse impact on CVX’s business • Production rates generally decline as reserves are depleted. A failure to
replace produced natural resources could lead to a reduction in cash flow and operating results.
DCF $94.61 DDM $110.00 Relative Multiple $101.13 Price Data Current Price $92.20 52wk Range $69.58 – 118.91 Key Statistics Market Cap (B) $173.54 Shares Outstanding (B) 1.87 Institutional Ownership 62.6% Five Year Beta 1.2 Dividend Yield 4.3% Est. 5yr Growth 6.75% Price/Earnings (TTM) 20.02 Price/Earnings (FY1) 19.50 Price/Sales (TTM) 1.26 Price/Book 1.11 Profitability Operating Margin 10.3% Profit Margin 10.0% Return on Capital (TTM) 6.7% Return on Equity (TTM) 12.4%
Source: Yahoo finance; www.spdrs.com
Earnings Estimates Year 2012 2013 2014 2015E 2016E 2017E EPS $12.20 $11.22 $10.24 $3.17 $4.58 $6.52
Growth -‐8.13% -‐8.06% -‐8.74% -‐69.09% 44.70% 42.45% 12 Month Performance Company Description
Source: Yahoo Finance
CVX is one of the largest integrated oil and gas company in the world. It has business interest in more than 30 countries in the world. Its business is divided primarily into two segments, upstream operations and downstream operations. CVX has exploration and production activities in most of the world's major hydrocarbon basins. The company was formerly known as ChevronTexaco Corporation and changed its name to Chevron Corporation in 2005. CVX was founded in 1879 and is headquartered in San Ramon, California.
20.0
12.4
4.3
13.9
1.2
17.9
1.2 3.2
0
5
10
15
20
25
P/E ROE Div Yield
CVX Industry Sector
-‐70%
-‐50%
-‐30%
-‐10%
10%
30%
N D J F M A M J J A S O
CVX S&P 500

Page 2
EXECUTIVE SUMMARY
The global oil industry turmoil is unlikely to get over very soon in our opinion. Many sub industries in this sector are reeling under precarious conditions. We believe that large integrated oil and gas companies like CVX are better placed to sustain this downturn in the oil industry. Though the performance of CVX has been impacted adversely over last 3 quarters as the profitability of its upstream business has come down sharply, CVX has been benefiting from the surge in profits in its downstream business. CVX’s downstream business is a natural hedge against the drop in oil prices. However, we note that the quantum of profit increase is downstream business is not sufficient to offset the negative impact on upstream business profitability.
We expect a gradual recovery in oil prices to $70 by the end of 2017. In this industry environment, we prefer to hold on to large integrated players like CVX due to its ability to generate enough cash flows through downstream operations. We don’t see any significant upside in the CVX stock price due to depressed profitability of its upstream business. We recommend Hold with target price of $95.
COMPANY DESCRIPTION
CVX is one of the world’s largest integrated oil and gas companies having presence across the world. CVX operates an upstream Exploration &Production (E&P) business as well as a downstream Refining & Marketing (R&M) and chemicals business. The company also has midstream logistics assets and several other smaller business interests.
Revenue by Key Business Segments
Source: Company filings -‐ 10Q
Upstream Business Segment
Upstream operations consist primarily of exploring for, developing and producing crude oil and natural gas; processing, liquefaction, transportation and regasification associated with liquefied natural gas (LNG); transporting crude oil by major international oil export pipelines; transporting, storage and marketing of natural gas; and a gas-‐to-‐liquids plant. In the upstream business segment CVX competes with fully integrated, major global petroleum companies, as well as independent and national petroleum companies.
The company sells crude oil and natural gas from its producing operations under a variety of contractual obligations. The company has net proved reserves of 11.1B barrels of oil equivalent at year-‐ end 2014. The reserve replacement ratio in 2014 was 89%.
Net Proved Reserve Balance
Source: Company filings -‐ 10K
The US contributes the highest share of CVX production. Upstream activities in the US are primarily located in California, the Gulf of Mexico, Colorado, Louisiana, Michigan, New Mexico, Ohio, Oklahoma, Pennsylvania, Texas, West Virginia and Wyoming. Average net oil-‐equivalent production in the US in 2014 was 664,000 barrels per day.
We believe that CVX will report the moderate E&P volume growth over next 3 years. CVX’s interests in the Gorgon (47%) and Wheatstone (64%) projects on Australia's North West Shelf would drive the volume growth for this segment. Gorgon was sanctioned in 2009, and first LNG is scheduled for 1Q16. It is one of the World's largest LNG projects, with planned capacity of 15.6mtpa, or over 200kboed net to CVX. Wheatstone is an 8.9mty project, scheduled for first LNG in 2016 and Chevron expects around 180kbd of net output from its stake.
US#Upstream#3%#
Interna/onal#Upstream#
12%#
US#Downstream#41%#
Interna/onal#Downstream#
44%#
2014 2013 2012Liquids Millions of barrels Consolidated Companies 4,285 4,303 4,353 Affiliated Companies 1,964 2,042 2,128Total Liquids 6,249 6,345 6,481Natural Gas Billions of cubic feet Consolidated Companies 25,707 25,670 25,654 Affiliated Companies 3,409 3,476 3,541Total Natural Gas 29,116 29,146 29,195Oil-Equivalent Millions of barrels Consolidated Companies 8,570 8,582 8,629 Affiliated Companies 2,532 2,621 2,718Total Oil-Equivalent 11,102 11,203 11,347

Page 3
Geographical Distribution of Oil Production
Source: Company filings -‐ 10K
Downstream Business Segment
Downstream operations consist primarily of refining crude oil into petroleum products; marketing of crude oil and refined products; transporting crude oil and refined products by pipeline, marine vessel, motor equipment and rail car; and manufacturing and marketing of commodity petrochemicals, plastics for industrial uses and fuel and lubricant additives. In this business segment CVX competes with fully integrated, major petroleum companies and other independent refining, marketing, transportation and chemicals entities and national petroleum companies.
At the end of 2014, the company had a refining network capable of processing nearly 2 million barrels of crude oil per day. Average crude oil distillation capacity utilization during 2014 was 87%, compared with 84% in 2013. At the US refineries, crude oil distillation capacity utilization averaged 91% in 2014, compared with 81% in 2013. CVX processes both imported and domestic crude oil in its U.S. refining operations. Imported crude oil accounted for ~73% of CVX’s US refinery inputs in 2014. As it can be seen in the table below, CVX has almost half of its refining capacity located in US.
Total Refining Capacity and Input for 2014
Source: Company filings -‐ 10K
The company markets petroleum products under the principal brands of “Chevron,” “Texaco” and “Caltex” throughout many parts of the world. The US is the largest market for the company’s refined products. In the US, at year-‐end 2014, the company supplied gasoline to approximately 7,930 motor vehicle service stations, primarily in the southern and western states. Outside the US, CVX supplied to approximately 8,450 branded service stations. CVX markets commercial aviation fuel at approximately 113 airports worldwide. The company also markets an extensive line of lubricant and coolant products.
Total Marketing Volumes of Refined Products for CVX
Source: Company filings -‐ 10K
Company Analysis
Upstream business – Going Gets Tough
Earnings of CVX depend mostly on the profitability of its upstream business segment. The biggest factor affecting the results of operations for the upstream segment is the price of crude oil. The price of crude oil has fallen significantly over past 1year, reflecting a strong supply worldwide led by expanding unconventional production in the US, weakening growth in emerging markets, and the decision by OPEC in to maintain its current production ceiling. The downturn in the price of crude oil has impacted the upstream business significantly over last 3 quarters. If the oil prices continue to remain at the current low level, the company’s performance will be impacted significantly.
We believe that the oil prices will go up gradually over next 3 years reaching $70 by the end of 2017. Also, we don’t expect oil prices to cross $100 over next 5-‐6 years. Hence, it is unlikely that the profitability of the company’s upstream business will reach its historical highs.
USA$26%$
La*n$America/Canada$6%$
Africa$17%$
Asia$29%$
Australia$4%$
Europe$3%$ Affiliates$
15%$
Number Capacity 2014 inputPascagoula Mississippi 1 330 329El Segundo California 1 269 221Richmond California 1 257 229Kapolei Hawaii 1 54 47Salt Lake City Utah 1 50 45
5 960 871Map Ta Phut 1 Thailand 1 165 141Cape Town 2 South Africa 1 110 72Burnaby, B.C. Canada 1 55 49
3 330 262Affiliates 1,3 Various Locations 5 610 557
8 940 81913 1,900 1,690
Total Consolidated Companies United States
Locations
Total Including Affiliates WorldwideTotal Including Affiliates International
Total Consolidated Companies International
Thousands of barrels per day 2014 2013 2012United States Gasoline 615 613 624 Jet Fuel 222 215 212 Gas Oil and Kerosene 217 195 213 Residual Fuel Oil 63 69 68 Other Petroleum Products 93 90 94Total United States 1,210 1,182 1,211International Gasoline 403 398 412 Jet Fuel 249 245 243 Gas Oil and Kerosene 498 510 496 Residual Fuel Oil 162 179 210 Other Petroleum Products 189 197 193Total International 1,501 1,529 1,554Total Worldwide 2,711 2,711 2,765

Page 4
Further, the key growth driver for upstream business, Gorgon and WheatStone LNG projects in Australia faces risk of delay and lower pricing. While Gorgon is expected to start production in early 2016, Wheatstone is only 65% complete and may not be able to start production in late 2016 as expected earlier.
Upstream business is very important for CVX as it has been the major profit contributor to the company over last 15 years. Since 2000, upstream business has accounted for ~85% of overall company’s net income. In the early 2000s, CVX’s capital employed was split roughly equally between upstream and downstream. However, strong upstream growth and downstream asset divestments have resulted in upstream capital employed exceeding downstream by over 6 times.
Upstream Segment Earning
Source: Company filings – 10K, 10Q
We expect the upstream business to report revenue growth of ~15% over next 3 years through 2018 led by 4% growth in volumes on the back of new projects such as Gorgon LNG, Wheatstone LNG & the Lower Tertiary fields in the deepwater GoM come online.
Upstream Segment Revenue Forecast
Source: HF Estimates Company filings – 10K, HF estimates
Downstream Business – Running the show
We are positive on the downstream business of CVX over next 3 years given good market conditions for the business and growth strategies of the management. Earnings for the downstream segment are closely tied to margins on the refining, manufacturing and marketing of products that include gasoline, diesel, jet fuel, lubricants, fuel oil, fuel and lubricant additives, and petrochemicals. Currently, CVX is benefiting from the high refining margins owning to the over production of crude oil in US and excess supply in the market. The company has more than 50% of its downstream assets located in US, which offers it a good upside in such scenarios.
CVX is focused on shifting its portfolio from the low-‐return fuel and refining business to the higher-‐margin chemicals and lubricants business. Access to advantaged feedstocks (i.e. ethane) in North America and the Middle East is expected to be a key value driver. CVX also continues to divest its non-‐strategic midstream assets.
CVX is focused on increasing its refineries’ crude handling capabilities as it looks to increase usage of heavier crudes to enhance margins in its domestic refineries. At the same time, the company is working on increasing the yield of high-‐value products and lowering feedstock costs in its international refineries.
Upstream Segment Earning
Source: Company filings – 10K, 10Q
High Financial Flexibility…
CVX has one of the best financial track records among its peers as it has probably the highest cash flow/bbl in the peer group, giving it much greater flexibility to go through the current high capex phase and the strongest balance sheet, with debt to capitalization ratio at ~15%.
We believe that CVX’s capital requirements will slow down compared to last 3 years. Also, the capex done over
10932&
17677&
24786& 23788&
20809&
16893&
+600&
+5000&
0&
5000&
10000&
15000&
20000&
25000&
30000&
2009& 2010& 2011& 2012& 2013& 2014& 9M2015&
31.3$ 21.0$ 24.1$ 26.0$ 26.7$ 28.9$ 30.0$
2571$ 2644$ 2722$ 2814$ 2910$ 3011$ 3097$
0$
500$
1000$
1500$
2000$
2500$
3000$
3500$
0.0$
5.0$
10.0$
15.0$
20.0$
25.0$
30.0$
35.0$
2014$ 2015E$ 2016E$ 2017E$ 2018E$ 2019E$ 2020E$
Revenue$($B)$ Volume$(MBOE)$
473$
2478$
3591$
4299$
2237$
4336$
5990$
0$
1000$
2000$
3000$
4000$
5000$
6000$
7000$
2009$ 2010$ 2011$ 2012$ 2013$ 2014$ 9M2015$

Page 5
last 3 years will start yielding incremental cash flow. Further CVX’s asset sale program would yield another $8-‐10B over next 1.5 years. All these factors would lead to sharp improvement in its free cash flow profile.
… However, High capital expenditure to depress RoIC
CVX spent significant capex over past 2 years on LNG projects, particularly in Australia. This capex has increased its asset base by ~80% in past 3 years. Due to sudden drop in oil prices, we believe that these projects are unlikely to generate expected RoI at least in next 3-‐5 years thereby impacting the overall RoIC of the company.
Low leverage despite huge capex
Source: Company filings – 10K, 10Q
Depressed RoIC despite strong free cashflow
Source: Company filings – 10K, 10Q, HF estimates
RECENT DEVELOPMENTS
Lowers 2016-‐2017 Capex Guidance; Expands Asset Sale Program
CVX provided a 2016-‐17 capex guidance range of $25-‐$28B (including affiliates) and $20-‐$24B. This is much below 2015 spending of ~$35B. The significant reduction is a capex is a result of many major projects under construction coming on stream, conscious reduction in
the pace of projects that have not yet reached Final Investment Decision and lower base business spending.
On the production front, CVX maintained its 2015 production growth target of 0-‐3% (2.57-‐2.65 MBOE), a yoy growth after 5 years of yoy decline. CVX expects 2017 volume growth of 13-‐15% per annum (or ~2.90-‐3.0 MBOE by 2017, excluding asset sales), slightly below its prior target of ~3.1 MBOE. Lower 2017 volume target is primarily a result of lower base business spending. Relative to its 2014 production base of 2.57 MBOE, CVX's 2017 guidance continues to call for strong incremental volume growth from its global LNG projects, offshore growth projects and shale/tight resource developments. Management also expects positive growth momentum into 2018 and maintained its expectation that upstream production growth will slow to ~1% per annum post 2018. In 2018, production growth should benefit from Gorgon and Wheatstone running at a higher capacity utilization.
CVX also expanded its asset sale program to $16-‐$21B from 2014-‐ 17, up from prior guidance of ~$15B. The company has already completed ~$11.0B of asset sales to date under its program this program. The company has undertaken the program to divest non-‐productive assets and bridge the gap between capex and free cash flow generation.
3QCY15 result was above consensus est.
CVX reported better results than consensus estimates although there was a decline on YoY basis in both revenue and earnings. The company reported EPS of $1.09, above consensus estimates of $0.76. The revenue declined 36.7% YoY to $32.77B. The net profit declined by 63.6% primarily due to significant decline in the profit of upstream business by 99% to $59M. However the profit of downstream business grew by 59.4%.
3QCY15 Result At a Glance
Source: Company SEC Filings – 10Q
11476% 10152% 12192% 20431% 27818%
6.3%
4.7%5.7%
8.5%
13.2%
0.0%
2.0%
4.0%
6.0%
8.0%
10.0%
12.0%
14.0%
0%
5000%
10000%
15000%
20000%
25000%
30000%
2010% 2011% 2012% 2013% 2014%
Gross%Debt%($M)% Debt/Mcap%(%)%
23797%21509%
19290%
5914%
8751%
12554%
12.9%11.9%
6.7%
0.4%
1.9%
3.7%
0.0%
2.0%
4.0%
6.0%
8.0%
10.0%
12.0%
14.0%
0%
5000%
10000%
15000%
20000%
25000%
2012% 2013% 2014% 2015E% 2016E% 2017E%
Net%Income%($M)% RoIC%(%)%
(Figures in US$M) 3QCY15 3QCY14 YoY Change (%)
Revenue 32676 51822 -36.9PAT 2037 5593 -63.6EPS 1.09 2.97 -63.3
UpstreamRevenue 4808 7316 -34.3PAT 59 4649 -98.7
DownstreamRevenue 27913 44436 -37.2PAT 2211 1387 59.4

Page 6
INDUSTRY TRENDS
E&P revenue growth slowing down
The Global oil and gas E&P industry is expected to generate revenue of $3.7T in 2015, up from $3.0T in 2010, yielding an annualized growth rate of 4.6% over the five years to 2015. However, revenue is expected to fall 8.7% in 2015, as oil and gas prices remain weak. This represents a slowdown from extremely large gains in 2011 and 2012, when energy prices surged. Short-‐ term spikes in the price of oil and gas have largely driven the industry's expansion over the period. However, the industry experienced significant pitfalls during the global recession, when revenue dropped drastically in 2009. Revenue growth was also slightly dampened in 2013 and 2014, as oil and gas prices fell following several years of robust production.
The Integrated Oils sector faces several key challenges, including muted production growth and limited access to the most prospective international regions. Since 2001, the production of big 5 players has declined 9% (excluding acquisitions) because of the scarcity of suitable upstream re-‐investment opportunities. In addition, upstream per-‐unit costs have risen at ~10% per annum over 2008-‐13.
Over the past decade, emerging economies, particularly of the BRIC nations (Brazil, Russia, India and China), have driven demand for energy. In the five years to 2015, the BRIC nations experienced combined GDP growth of 7.1% per year on average, which stimulated demand for energy products and helped the industry recover from the global recession. Due to recovering demand and increasing petroleum prices, profit margins are anticipated to increase over the five-‐year period.
The Global E&P industry's performance is projected to be less volatile over the next five years, although there will be some variation in price as the supply-‐demand balance occasionally shifts. In the five years to 2020, industry revenue is forecast to grow at an annualized rate of 4.4% to $4.6T. Although biofuels (primarily ethanol, but also biodiesel) will grow in importance over the period, output is still relatively low, meaning these alternative fuels will fail to displace oil production to any discernible extent. Ethanol is viewed primarily as a biofuel that offers environmental benefits and plays a small role in reducing dependence on imported crude oil, mainly in developed countries with limited oil resources
Global E&P Industry Revenue
Source: IBISWorld
Increase in Natural Gas Production
Currently, oil E&P is higher than the natural gas with oil contributing to ~68% of the E&P activities.
Natural gas is estimated to account for 31.9% of industry revenue. In terms of volume, the share of natural gas in industry production has been increasing for many years. To a large extent, this shift in volume toward gas reflects the greater availability of gas, increased usage of gas in stationary applications such as power generation, and greater investment in gas infrastructure such as pipelines and LNG facilities. Rising gas production has caused this segment's contribution to revenue to rise, though low gas prices in North America slightly hampered revenue growth during the past three years.
In future, compared with oil, the expansion in global, natural-‐gas production will be relatively strong in response to continued economic growth, ongoing interest in using gas as a replacement fuel for oil and coal, further growth in supply infrastructure and a relatively subdued price climate. The environmental advantages of natural gas are also expected to drive its growth. In addition, gas-‐fired generation has much lower capital costs, which gives it a financial advantage in the uncertain environment surrounding electricity deregulation. Large increases in the global supply of natural gas are expected to push prices down, although considerable year-‐to-‐year volatility will likely persist. Further advances in hydraulic fracturing techniques will provide a means to expand output.
Rising production and accelerating economic growth will drive global demand for natural gas and oil. Over the five years to 2020, IBISWorld forecasts that global trade of oil
Page 7
and gas will increase at an average annual rate of 5.2% to total $2.2T
R&M revenue growth will be slow and steady
The Petroleum Refining industry will become more refined over the next five years. Crude oil prices and refined petroleum production are expected to increase, thereby increasing the revenue. However, tough environmental regulations will limit new refinery development. Operators are anticipated to respond by upgrading the capacity of existing facilities to handle higher production volumes. Furthermore, the push for fuel-‐efficient vehicles will likely limit revenue growth as consumers increasingly opt for cars that save on fuel costs. Despite various regulatory concerns, economic recovery and consumption growth will benefit this industry. According to Energy Information Administration (EIA), petroleum product consumption will increase at an annualized rate of 0.4% in the five years to 2020, which will drive revenue growth for petroleum
Crude oil prices are anticipated to increase during the next five years, as demand supply mismatch goes down. Demand for crude oil, especially from emerging economies, is expected to pick up as the global economy recovers. However, the price of WTI crude oil is projected to increase from recent lows over the next five years, narrowing the price differential between WTI and Brent crude oil. However, petroleum prices are anticipated to remain subdued in the near future, when compared with 2011 and 2012, thereby limiting revenue growth. IBISWorld forecasts that in the five years to 2020, industry revenue will increase an annualized 3.1% to $616.5B.
MARKETS AND COMPETITION
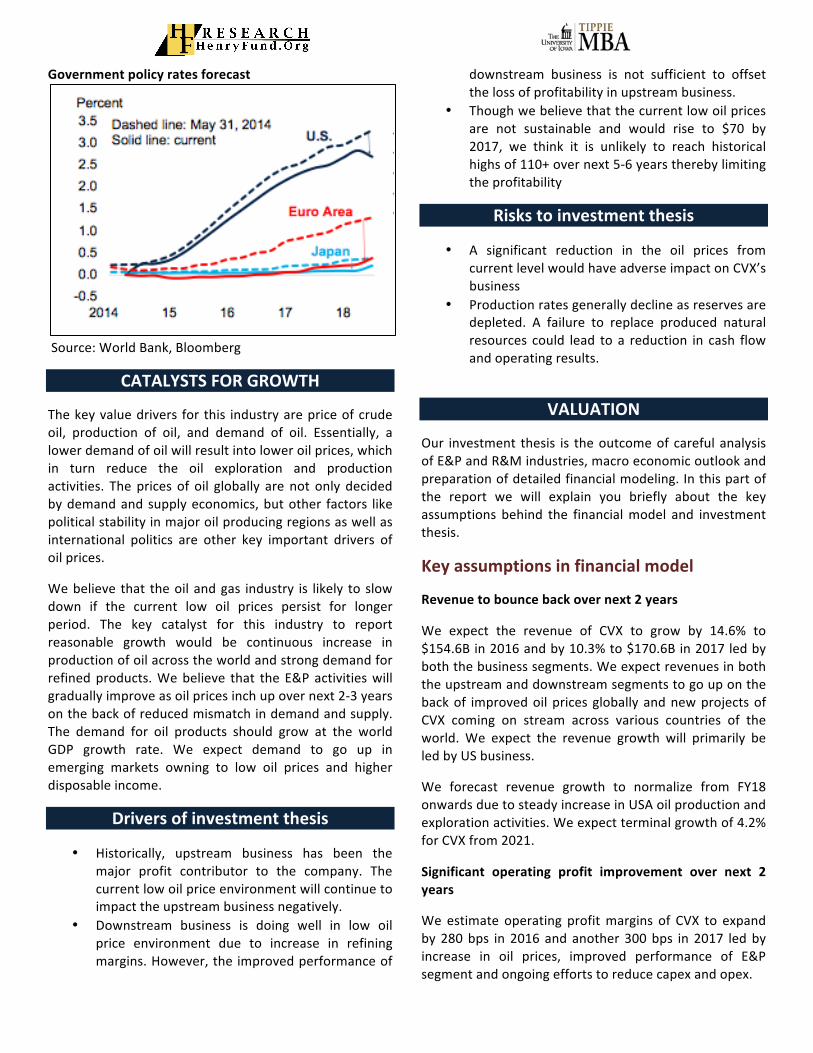
Industry is in mature stage of its lifecycle
The Global oil and gas E&P and R&M industries are in a mature stage of its life cycle. In E&P industry, the pace of technological change is only moderate for the oil segment but strong within the natural gas segment. Changes tend to involve matters of scale and scope rather than fundamental shifts in production, which is indicative of a mature industry. For example, offshore oil platforms are larger and able to be sited in deeper water than in the past, but operations have remained essentially unchanged. Also, shale fracturing for natural gas has recently unleashed significant potential for previously
unreachable reserves. Improvements in liquefied natural gas production facilities and in the ships used to transport the product are playing a role in promoting the growth of the fuel.
E&P Industry Life Cycle Stage
Source: IBISWorld
In case of R&M industry, the Industry value added (IVA), which measures this industry’s contribution to the economy, is projected to decline on average 0.7% per year in the 10 years to 2020. Although the industry’s contribution to the overall economy is declining, the industry is not in the declining stage because the depressed IVA growth is due mostly to the sharp decline in crude oil prices, not falling demand. Industry products have an established place in the market. While demand for petroleum products partly depends on continued improvements in fuel efficiency, overall economic growth is the primary driver of demand. As a result, downstream demand mostly matches overall GDP growth. Although production methods sometimes change in response to environmental requirements, the basic process is well established. Most technological advances in petroleum refining are focused on input variety.
Market concentration is low to medium
The Global oil and gas E&P industry has a low level of market share concentration. In 2015, the top-‐four companies are expected to account for less than 40.0% of total industry revenue. The industry is large and geographically diverse, making it difficult for even major oil companies to control more than a small proportion of

Page 8
global output each. Concentration has increased over the past five years.
The Petroleum R&M industry has a moderate level of market share concentration, with the four largest companies accounting for 49.5% of industry revenue in 2015. Due to the high capital costs required to maintain refining facilities, large companies dominate the industry. In the past five years, operators divested assets to pad profit margins, causing market share concentration to fall during the period. This downward trend continued as Brent crude oil prices soared, limiting the profitability of coastal refineries and encouraging some to exit the industry. Refineries located inland have access to the cheaper WTI crude variety. Cheaper input costs allowed these refiners to expand their profit margins, and therefore their facilities. Additionally, major player BP has steadily divested its US assets since the Deepwater Horizon oil spill. The company’s refineries were sold to industry operators Tesoro and Marathon Petroleum, which resulted in lower overall market share concentration.
Highly cyclical nature of the industry
In the five years to 2015, the E&P industry has exhibited a high level of revenue volatility. Typically, the revenue performance of the Exploration industry is very volatile and sensitive to shifts in both crude oil prices and natural gas prices, which vary markedly in response to global supply and demand trends. Oil and gas prices tend to increase sharply during periods of excess demand and fall markedly if excess supply emerges.
The Petroleum refining industry exhibited high revenue volatility over the past five years. While output levels vary from year to year, the main factor behind revenue volatility is large swings in crude oil prices, which feed into petroleum product price movements. Oil price movements reflect changes in the global supply and demand balance, which may stem from a number of sources. In addition, larger refineries are often integrated with petrochemical complexes to supply feedstock and energy to produce chemicals. Changes in the technology used by petroleum refineries are driven by cost imperatives or changes in government regulation.
While the overall economy has continually expanded over the past five years, oil prices peaked in 2012, and have fallen drastically over last 1 year.
Volatility vs Growth – Exploration Industry
Source: www.IBISWORLD.com
Volatility vs Growth – Refining Industry
Source: www.IBISWORLD.com
Competition is High in Both E&P and R&M Industries
The Global Oil and Gas E&P industry is subject to a high level of competition. Global oil and gas companies compete on the basis of price, although other factors, such as crude oil grades, impurity levels and the costs of extraction also play a role. In the case of oil, the main end-‐market is that for transport fuels, while for gas, the major markets are electricity generation and gas supply. In addition, a cartel comprising major oil producers known as the Organization of the Petroleum Exporting Countries (OPEC), aims to have a leveling effect on competition levels.
OPEC's goal is to coordinate and unify petroleum policies among member countries. Prior to the rise of OPEC, large oil companies that possessed the necessary technology and skills for exploration and production dominated the oil sector. At least in part, OPEC was formed to reduce

Page 9
the influence of oil multinationals that had a monopoly on technology. OPEC does not set oil prices, but because the OPEC countries produce about 40% of the world's oil supply and their exports account for about 60% of the total export in oil, their decisions influence price movements. The purpose of OPEC is to agree on the quantity and price of the oil that member countries export, which lowers competition.
Competition in the Petroleum R&M industry is also very high, as industry operators compete with each other on product price and quality. In addition, domestic refiners must compete against imported petroleum products. price is the main basis of competition in this industry. Industry operators compete to obtain cheap crude oil, as it is the primary input for all refined petroleum products. Companies that have access to cheap crude oil, such as WTI, can charge lower prices, leading to more sales and revenue. At the same time, these companies can realize higher profit margins due to lowered input costs.
Product quality is also a basis of competition. Companies that can produce high quality products from a variety of crude oil have a competitive advantage. For example, Valero Energy Corporation is anticipated to experience a smaller drop in revenue over 2015, compared with many other producers, as crude oil prices drop. This is because Valero is capable of processing 86 different crude oils, allowing it to produce high quality fuels from cheaper crude oil varieties. This allowed the company to maintain production capacity even though falling product prices cut into profit margins.
High barriers to entry
High barriers to entry protect the Global oil & gas E&P industry. Specific deterrents for newcomers include the high levels of competition, regulation and capital intensity. These barriers are projected to remain high through the coming five years. Because the global scale of production creates the opportunity for many small companies to dilute the market, industry concentration is low. In turn, this low concentration indicates a high degree of competition, with many companies vying for a limited supply of natural resources globally. Also, the existing relationships (internationally and domestically) incumbent companies have with customers, particularly governments, poses a significant barriers for newcomers to attract customers. The high degree of competition, especially from established companies that have been operating for more than 50 years, limits the ability of
potential entrants to compete effectively except in the narrowest of markets.
Further, this industry exhibits high capital costs. Prospective entrants incur high start-‐up costs associated with the acquisition of production machinery and equipment. At the same time, oil and gas exploration and production are high-‐risk activities. Substantial time, expertise and expenditure are typically required to delineate possible oil and gas fields, and even after a suitable prospect is identified and property purchased (typically via lease arrangements), oil and gas flows may not meet projections due to unforeseen geological difficulties. Risk also takes the form of military and civil unrest in many areas, especially the Middle East. As such, the initial capital required to assemble a drilling well may be lost to the risks inherent with production.
Also, oil and gas companies are typically required to acquire exploration and production permits or licenses. Companies may also be required to meet local content rules in terms of industry partners, employment and downstream processing. A company's ability to operate within regulatory guidelines as set by government agencies poses a barrier to entry.
Prospective entrants to the Petroleum R&M industry face high barriers to entry. Refinery infrastructure is very capital-‐ intensive, and new entrants must be able to secure adequate funding to enter this industry. Capital is also required to secure crude oil supply contracts and storage and transportation facilities. Over the past five years, financing became more difficult to obtain due to the recession, resulting in higher barriers to entry.
Additionally, environmental regulations also present a barrier to entry. The Environmental Protection Agency (EPA) and various federal regulations ban the use of chemical additives such as butane. The Energy Independence and Security Act mandates that refineries must mix renewable fuels into gasoline and diesel. Prospective entrants must be able to produce environmentally friendly petroleum products and secure renewable fuels.
Environmental and community concerns meant that no new refineries with significant operating capacity have been constructed since the mid-‐1970s. For instance, one refinery was built in Wyoming in 2008. However, this refinery only increased production capacity by 0.9%. Additionally, many small refineries have closed over the past five years. Entry is confined to companies with

Page 10
sufficient resources to purchase existing refineries, significantly limiting the number of entrants over the period.
Globalized Industry
E&P industry exhibits a high degree of globalization. International trade is extremely important to the industry, with about 50% of oil output and about 30% of gas output traded internationally. The major oil-‐producing countries all have global players with extensive interests in other major producing countries (apart from those such as Mexico, where the government limits participation). Industry companies focus on the most potentially lucrative areas for exploration and development and pursue promising oil and gas finds wherever political conditions permit. The highly risky nature of exploration, the huge costs involved in both exploration and production, and the need to undertake often sensitive negotiations regarding development with governments tend to limit participation in the industry to large corporations with a global perspective. The gas segment is less globalized than the oil segment, reflecting the more limited transport options available.
R&M industry has a moderate level of globalization. Foreign operators, such as BP and Royal Dutch Shell, are important players in the domestic market, while US companies like ExxonMobil and Chevron have extensive operations overseas. Some refineries are even owned by companies in countries that have volatile relations with the United States. For example, Citgo is a Venezuelan company. Additionally, many industry leaders are large multinational energy companies that control crude oil reserves and operating facilities across the word.
Highly Regulated Industry
The Oil Drilling and Gas Extraction industry is highly regulated around the world. In US, the federal and state governments are involved in all stages of production. State governments determine which areas are open to oil exploration and extraction, issue exploration and production leases, and they enforce environmental legislation.
The federal government also maintains the Strategic Petroleum Reserve (SPR), which was established by the Energy Policy and Conservation Act of 1975 (EPCA) in response to the oil crises in the early 1970s, and its development began in 1977. The purpose of the reserve is to provide a stock of oil that can be drawn down in the event of a major shock in the market. Only the President
has the authority to order the strategic reserves be used. If reserves are distributed, they are sold to bidders in the US market. Furthermore, the SPR measures the amount stored in terms of the number of days of imports it could replace.
The US also maintains several laws that govern the export of crude oil products. The Mineral Leasing Act of 1920 (MLA) and the EPCA both restrict the sale of crude oil abroad. The MLA also grants the US government with the ability to manage the mineral rights of public lands, which are leased to industry operators. The EPCA grants the President the right to restrict the export of energy related materials to protect domestic supply.
The Energy Policy Act 2005, which was signed into law in August 2005, contains a range of measures aimed at increasing US energy self-‐sufficiency. The act offers a range of benefits, or potential benefits, to oil and gas producers.
The Petroleum Refining industry faces extensive environmental regulations. The Clean Air Act of 1970 and the Clean Air Act Amendments of 1990 set basic requirements for fuel standards. The EPA also sets regulations regarding emissions. In addition, state agencies may make rulings concerning fuel quality and emissions.
Highly Capital Intensive Industry
The Oil Drilling and Gas Extraction industry is highly capital intensive. In 2015, for every dollar spent on wages, the average industry company will invest an estimated $4.62 in capital equipment. This ratio ranks this industry among the most capital intensive of all industries. Companies rely on large-‐scale capital equipment, rather than labor, for output. However, oil field workers also must be highly skilled and trained, which is reflected in the industry’s very high average wage. In addition, the substantial capital cost of production facilities reflects the need for a high degree of reliability. Facilities operate constantly and must be resistant to corrosion. Additionally, the negative impact of a well failure can be catastrophic, so operators must ensure the equipment they use is properly maintained on a regular basis.
Petroleum R&M is a highly capital-‐ intensive process, as the initial refinery construction requires significant capital investment. Nearly all aspects of the refining process requires capital equipment such as storage tanks, distillation columns, boilers, catalytic crackers, reformers

Page 11
and alkylation units. However, typically, the bulk of capital expenditures take place when the refinery is constructed. As a result, yearly depreciation costs are significantly lower than overall capital investments. This industry is also reliant on skilled labor such as petroleum and chemical engineers, supply chain managers and refinery workers, resulting in high average wages.
A brief profile of key players
BP PLC
BP PLC is a large, multinational oil company headquartered in London. It merged with the US oil company Amoco at the end of 1998. For a time after the merger, the company was known as BP Amoco, but after its acquisition of US-‐based Atlantic Richfield Company it reverted to the simpler name of BP.
The bulk of BP’s hydrocarbon reserves of oil are in the US. The company’s US production comes from the Gulf of Mexico (58% of US production), Alaska (27%) and onshore operations in the lower 48 states (15%). The Gulf of Mexico has grown in importance, while the output of the other two regions has declined. This shift reflects the rundown of oil reserves in Alaska and the lower 48 states.
Exxon Mobile Corp (XOM)
ExxonMobil and its affiliated companies operate in many countries across the world. Headquartered in Irving, Texas, XOM was formed in 1999 following the merger of Mobil and Exxon. The company is a integrated oil and gas company. Additionally, XOM has an array of internal research programs aimed at developing new technology and owns about 11,000 active patents.
XOM participates in the Petroleum refining industry through its downstream business segment. The company controls 30 refineries across the world, processing 5.3M barrels of crude oil per day. XOM’s US facilities account for 37.2% of its total refinery throughput, with a combined production capacity of almost 2.0M barrels per day.
ConocoPhillips
Based in Houston, ConocoPhillips was formed in September 2002 from the merger of Conoco and the Phillips Petroleum Company. ConocoPhillips has extensive operations overseas and in the US. In April 2012, ConocoPhillips completed its separation from its refining operations, becoming solely an exploration and
production company. The company’s downstream and midstream businesses were spun off into an independent, publicly traded company called Phillips 66. By separating from its downstream businesses, ConocoPhillips bolstered its operating margins at the expense of market share. As with many other major players, ConocoPhillips is increasingly engaging in the growing market for shale gas and oil sands extraction.
Royal Dutch Shell PLC (RDS)
RDS, headquartered in The Hague, Netherlands, is a global group of energy and petrochemical companies. In 1907, the Shell Transport and Trading Company and Royal Dutch Petroleum Company merged to form the RDS Group. The group operated under two separate holding companies, with Royal Dutch taking 60% of earnings and Shell Transport taking 40%. In 2005, the two groups were fully merged into one company. RDS operates in more than 70 countries across the world, with more than 94,000 employees operating 43,000 service stations, refineries and chemical plants. RDS’s business is separated into three divisions: upstream, downstream and project & technology.
RDS operates in the US Petroleum refining industry through its downstream business division. The company directly controls two refineries, located in Martinez, CA and Puget Sound, WA. These two refineries have a combined production capacity of 281,000 barrels of refined petroleum per day. In addition, RDS indirectly operates four refineries through Motiva Enterprises, a joint venture between Shell and Saudi Aramco. Motiva owns four oil refineries in the gulf coast of the US, with combined production capacity of 1.3 million barrels per day. Over the past five years, the company has downsized refining capacity to focus on large, integrated refineries and optimize performance.
Peer Comparisons
We believe that all the large integrated oil players have been impacted due to continued pricing pressure in oil and gas. As most of these companies derive most of its earnings from upstream business, low pricing environment hurts all of them. However the degree is different depending on the exposure to oil and gas and then particular geography. We compared CVX with other integrated super majors in the industry based on certain financial, operational and valuation parameters. We note that the financial and valuation parameters are not strictly comparable due to complex portfolio of business

Page 12
each of these players have and different weightage of each business in their portfolio.
Relative Valuation
Source: Bloomberg, Yahoo Finance
Our analysis suggests that CVX is one of the better managed companies among the 4 large integrated oil companies. Also it has one of the best balance sheets with very low leverage.
Key Financial Highlights
Source: Bloomberg, Yahoo Finance
Hydrocarbon Reserves Analysis
We can see from the tables below that CVX has lowest reserves of hydrocarbon among its listed peers at 11.1BBOE. Further if you analyze, the company has far less reserves of Natural Gas compared to other payers.
However, we note that CVX’s reserve replacement rations is one of the best in industry for 2014 through the average reserve life is lower than some other companies like BP and XOM.
Source: Bloomberg, Company filings
Source: Bloomberg, Company filings
Upstream Production Analysis
We note that CVX’s production from crude oil is much higher than from production of natural gas. Among peers, it has the lowest total production of oil equivalent.
Source: Bloomberg, Company filings
Cost of Production Analysis
All the major players have different cost of finding and developing (F&D) the reserves. CVX has very high F&D cost compared to BP and XOM. Further CVX’s capex over last 2 years was one of the highest in the industry.
Source: Bloomberg, Company filings
Dependence on Crude Oil
As it can be seen in the table below CVX crude oil contributes 66.5% to CVX’s production. This ratio is very high compared to some other companies like XOM and RDS.
BV EPSTicker Company Price 2015E 2015E P/B815 P/E815CVX Chevron8Corp $88.70 $82.988 $3.178 1.18888888 28.08888XOM Exxon8Mobil8Corp $80.74 $41.458 $3.928 1.98888888 20.68888BP BP8p.l.c. $35.10 $16.288 $1.058 2.28888888 33.38888RDS Royal8Dutch8Shell $50.56 $53.638 $3.808 0.98888888 13.38888
Mcap ($B) Revenue ($B) Net Income ($B) RoE (%) D/E (%)CVX 173.4 192.3 19.3 12.7 9.4BP 106.9 140.4 12.1 3.1 19.9RDS 160.7 421.1 22.6 8.5 13.9XOM 335.8 364.8 32.3 18.7 13.5
Crude Oil Reserves (BBBLS) 2014 2013 2012 2011CVX 6.2 6.3 6.5 6.5BP 9.8 10.1 10.1 10.6RDS 6.1 6.6 6.2 6.0XOM 13.7 13.2 12.8 12.2
Natural Gas Reserves (TCB) 2014 2013 2012 2011CVX 29.1 29.1 29.2 28.7BP 44.7 46.0 40.3 41.7RDS 40.3 42.5 42.8 47.7XOM 69.3 71.9 74.1 76.2
Total Reserves (BBBOE) 2014 2013 2012 2011CVX 11.1 11.2 11.3 11.2BP 17.5 18.0 17.0 17.7RDS 13.1 13.9 13.3 14.0XOM 25.3 25.2 25.2 24.9
Avg Rserve Life (Years) 2014 2013 2012 2011CVX 12.0 12.0 12.0 12.0BP 15.0 15.0 14.0 14.0RDS 12.0 12.0 11.0 12.0XOM 17.0 17.0 16.0 15.0
Rserve Replacement Ratio (%) 2014 2013 2012 2011CVX 89.2 84.8 111.7 170.7BP 59.7 182.4 40.0 74.8RDS 47.6 148.2 45.3 99.1XOM 103.6 103.3 114.6 107.2
Crude Oil Production (MBPD) 2014 2013 2012 2011CVX 1709 1731 1764 1849BP 1927 2013 1160 2157RDS 1484 1541 1633 1666XOM 1852 1943 2185 2312
Natural Gas Production (BCFPD) 2014 2013 2012 2011CVX 5.2 5.2 5.1 4.9BP 7.1 7.1 7.4 7.5RDS 9.3 9.6 9.4 9.0XOM 11.1 11.8 12.3 13.2
Total Production (MBOED) 2014 2013 2012 2011CVX 2571 2597 2610 2673BP 3151 3230 3331 3454RDS 3080 3199 3262 3215XOM 3969 4175 4239 4506
Avg. Organic F&D Costs - ($/BBL) 2014 2013 2012 2011CVX 31.2 21.4 20.9 17.9BP 19.4 14.9 13.4 9.7RDS 38.4 25.8 22.0 8.7XOM 19.2 14.9 13.4 9.7
Total E&P Spending ($ B) 2014 2013 2012 2011CVX 33.7 33.5 25.3 27.4BP 22.9 24.6 21.9 22.4RDS 37.6 39.2 37.3 25.1XOM 31.8 36.0 32.6 32.0
Production Mix - Crude oil % 2014 2013 2012 2011CVX 66.5 66.7 67.6 69.2BP 61.2 62.3 63.0 62.4RDS 48.2 48.2 50.1 51.8XOM 46.7 46.5 51.5 51.3

Page 13
Source: Bloomberg, Company filings
ECONOMIC OUTLOOK
We believe that the key economic indicators for oil E&P and R&M industries are the global demand and supply of oil, the global prices of oil, GDP growth of developed and emerging nations, industrial production index of OECD countries and growth in clean energy industry. If the prices of oils drop globally, it results into decreased profits for E&P companies.
World oil production and consumption balance
Source: EIA Energy short-‐term outlook November 2015
Give the low growth in fuel consumption growth over next 2 years and continuous production growth in Latin America and OPEC countries will keep the world oil prices low for next few years. Also the world oil demand and supply are expected to go hand in hand and unlikely to cause a scarcity of oil. This indicates that oil prices are unlikely to go up in hurry. We forecast WTI prices to be $60/70/80 per barrel for 2016/2017/2018 respectively. Due to relatively low oil prices over next few years compared to the levels seen in 2013 and 2014, E&P industry is unlikely to reach historical level of profits seen in 2012-‐2014.
Further, there is ample spare capacity available with OPEC countries to ramp up the production in the event of demand exceeding supply. This will keep the oil price in check.
OPEC Surplus Crude Oil Production Capacity
Source: EIA Energy short-‐term outlook November, 2015
Further, if the global GDP growth rate is higher, it augurs well for the demand of oil. However, World Bank report projects only incremental growth in world GDP and it is unlikely to result in significant demand for oil in medium term.
GDP Growth forecast for world
Source: World Bank, January 2015 Global economic prospects
Further interest rates are the key economic driver for this industry, as due to its high capital intensity, the higher interest rates will increase the cost of capital for the companies in this industry.
World Bank expects the policy rates in the developed world to start going up from 2015 onwards. The interest rates in USA are expected to show steep rise in year 2016 compared to other developed countries. We expect 40bps increase in 10-‐year US treasury yield by the end of 2015. High capital-‐intensive industries including Oil Production and Exploration will probably find it difficult to undertake new projects limiting the production growth.
Realized Oil Price ($/BBL) 2014 2013 2012 2011CVX 89.4 99.1 101.6 101.6BP 88.0 99.2 102.1 101.3RDS 89.6 99.6 106.0 105.1XOM 93.2 104.0 106.9 100.8
Page 14
Government policy rates forecast
Source: World Bank, Bloomberg
CATALYSTS FOR GROWTH
The key value drivers for this industry are price of crude oil, production of oil, and demand of oil. Essentially, a lower demand of oil will result into lower oil prices, which in turn reduce the oil exploration and production activities. The prices of oil globally are not only decided by demand and supply economics, but other factors like political stability in major oil producing regions as well as international politics are other key important drivers of oil prices.
We believe that the oil and gas industry is likely to slow down if the current low oil prices persist for longer period. The key catalyst for this industry to report reasonable growth would be continuous increase in production of oil across the world and strong demand for refined products. We believe that the E&P activities will gradually improve as oil prices inch up over next 2-‐3 years on the back of reduced mismatch in demand and supply. The demand for oil products should grow at the world GDP growth rate. We expect demand to go up in emerging markets owning to low oil prices and higher disposable income.
Drivers of investment thesis
• Historically, upstream business has been the major profit contributor to the company. The current low oil price environment will continue to impact the upstream business negatively.
• Downstream business is doing well in low oil price environment due to increase in refining margins. However, the improved performance of
downstream business is not sufficient to offset the loss of profitability in upstream business.
• Though we believe that the current low oil prices are not sustainable and would rise to $70 by 2017, we think it is unlikely to reach historical highs of 110+ over next 5-‐6 years thereby limiting the profitability
Risks to investment thesis
• A significant reduction in the oil prices from current level would have adverse impact on CVX’s business
• Production rates generally decline as reserves are depleted. A failure to replace produced natural resources could lead to a reduction in cash flow and operating results.
VALUATION
Our investment thesis is the outcome of careful analysis of E&P and R&M industries, macro economic outlook and preparation of detailed financial modeling. In this part of the report we will explain you briefly about the key assumptions behind the financial model and investment thesis.
Key assumptions in financial model
Revenue to bounce back over next 2 years
We expect the revenue of CVX to grow by 14.6% to $154.6B in 2016 and by 10.3% to $170.6B in 2017 led by both the business segments. We expect revenues in both the upstream and downstream segments to go up on the back of improved oil prices globally and new projects of CVX coming on stream across various countries of the world. We expect the revenue growth will primarily be led by US business.
We forecast revenue growth to normalize from FY18 onwards due to steady increase in USA oil production and exploration activities. We expect terminal growth of 4.2% for CVX from 2021.
Significant operating profit improvement over next 2 years
We estimate operating profit margins of CVX to expand by 280 bps in 2016 and another 300 bps in 2017 led by increase in oil prices, improved performance of E&P segment and ongoing efforts to reduce capex and opex.

Page 15
Return to start improving; unlikely to reach historical levels soon
We expect that CVX’s RoIC will start improving from 2016 onwards on the back of increased profits and reduced capital expenditure. However, we suspect the ability of the company to generate the historically high returns of more than 15% given very large capex undertaken over last 3 years and low oil prices.
Discounted Cash Flow/Economic Profit (DCF/EP)
The DCF/EP model generates a target price of $95/share. This model is based on a 4.2% CV growth rate discounted at a weighted average cost of capital (WACC) of 6.9%. This represents a 7% price premium to the closing price on 11/12/15. The recent sell off in the energy sector was driven by a ~50% decline in WTI and Brent crude oil prices due to street sentiment regarding ongoing headwinds facing the global economy combined with record levels of crude oil production and supply. We believe that in this volatile environment, CVX offers downside protection due to its integrated business model.
Dividend Discount Model (DDM)
The DDM returned a current target price of $110, a 24% premium to the current market price and 16% higher than the DCF/EP model. CVX has maintained consistent low dividend distribution over the years despite volatile profitability. It has utilized the excess free cash flow to keep strong balance sheet and grow inorganically. We like this approach as the size of CVX has helped it become more profitable and gain market share from competitors. We estimate the per share dividend to fall in 2015 from $4.21 in 2014 to $3.5 in 2015. However, we estimate the dividend to increase consistently from 2016 onwards as business dynamics improves.
Relative valuation
We have compared CVX with other large, integrated oil and gas players such as BP, XOM, and RDS. All these companies have presence in many international markets. We understand that these companies are not strictly comparable with each other given their relative difference in size and business model. We have compared the valuation of these companies based on price/earnings, and price/book method.
The relative P/E model and P/B model returned a target price of $75 and $127 respectively. Taking the average of the two valuations, we arrive at the target prices of $101/share.
Overall, we reference the DCF/EP valuation model in deriving our target price range as that valuation most accurately captures CVX’s current operating profile and the underlying revenue growth components. The Relative valuation models and DDM model provide supporting evidence and may help substantiate assumptions used in our DCF analysis.
KEYS TO MONITOR
There is couple of key things to monitor for investors in this industry.
Global oil prices:
Oil price is the significant determinant of the performance of this industry in the medium term basis. Currently, the oil prices are multi year low. The movement of oil prices over next 2 quarters will be a key thing to monitor
Global GDP growth rate and demand for oil:
The performance of oil & gas industry is directly related to the level of global economic activities. As the economic activities increase worldwide, there is more demand for oil and gas products, which in turn augurs well for both E&P and R&M sectors and vice versa.
REFERENCES
1) “Short-‐term Energy Outlook”, U.S. Energy Information Administration, November, 2015 http://www.eia.gov/forecasts/steo/
2) “Effect of declining crude oil prices on U.S. production” http://www.eia.gov/todayinenergy/detail.cfm?id=19171
3) IBISWorld – U.S. Industry Reports – Oil Drilling & Gas Extraction
4) IBISWorld – U.S. Industry Reports – Petroleum Refining
5) IBISWorld – Global Industry Reports – Oil and Gas Exploration and Production

Page 16
6) Bloomberg – Historical Volatility, Beta, Relative Valuation
7) Factset 8) Company fillings of CVX, XOM, RDS, BP 9) Baker Hughes 10) www.finance.yahoo.com 11) CVX 3QFY15 Earnings Transcript
IMPORTANT DISCLAIMER
Henry Fund reports are created by student enrolled in the Applied Securities Management (Henry Fund) program at the University of Iowa’s Tippie School of Management. These reports are intended to provide potential employers and other interested parties an example of the analytical skills, investment knowledge, and communication abilities of Henry Fund students. Henry Fund analysts are not registered investment advisors, brokers or officially licensed financial professionals. The
investment opinion contained in this report does not represent an offer or solicitation to buy or sell any of the aforementioned securities. Unless otherwise noted, facts and figures included in this report are from publicly available sources. This report is not a complete compilation of data, and its accuracy is not guaranteed. From time to time, the University of Iowa, its faculty, staff, students, or the Henry Fund may hold a financial interest in the companies mentioned in this report.

Page 17
Chevron(CorporationKey$Assumptions$of$Valuation$Model
Ticker'Symbol CVXCurrent'Share'Price $88.70Current'Model'Date 19/11/15Fiscal'Year'End Dec.(31
PreGTax'Cost'of'Debt 2.80%Post'tax'cost'of'Debt 1.82%Beta 1.2RiskGFree'Rate 2.34%Equity'Risk'Premium 4.85%CV'Growth 4.2%Current'Dividend'Yield 3.95%Marginal'Tax'Rate 35%Cost'of'equity 8.2%WACC 6.84%CV'ROE 9.0%
Stock'Price'DCFGEP'Method 94.61Stock'Price'DDM'Method 110.00Stock'Price'relative'valuation'Method 101.13Target'Price'using'DCF_EP'Method 94.6

Page 18
Chevron(CorporationRevenue&DecompositionFiscal'Years'Ending'Dec.'31 2012 2013 2014 2015E 2016E 2017E 2018E 2019E 2020E 2021E
Revenue ModelUpstream Revenue % of Total Sales % changeUnited States % of Upstream % changeInternational % of Upstream % change
Downstream Revenue % of Total Sales % changeUnited States % of Downstream % changeInternational % of Downstream % change
Others % of Total Sales
25,875.0 25,659.0 31,263.0 20,950.7 24,111.5 26,034.6 26,725.6 28,922.0 30,028.3 31,774.011.6% 12.1% 16.3% 15.5% 15.6% 15.3% 14.6% 14.9% 14.9% 15.1%
-12.9% -0.8% 21.8% -33.0% 15.1% 8.0% 2.7% 8.2% 3.8% 5.8%6,416.0 8,052.0 7,455.0 4,318.9 5,493.6 6,793.7 8,152.5 8,929.7 9,560.1 9,837.324.8% 31.4% 23.8% 20.6% 22.8% 26.1% 30.5% 30.9% 31.8% 31.0%
-33.3% 25.5% -7.4% -42.1% 27.2% 23.7% 20.0% 9.5% 7.1% 2.9%19,459.0 17,607.0 23,808.0 16,631.8 18,617.9 19,240.9 18,573.1 19,992.2 20,468.3 21,936.8
75.2% 68.6% 76.2% 79.4% 77.2% 73.9% 69.5% 69.1% 68.2% 69.0%-3.1% -9.5% 35.2% -30.1% 11.9% 3.3% -3.5% 7.6% 2.4% 7.2%
1,96,322.0 1,85,645.0 1,60,790.0 1,13,743.9 1,30,261.3 1,44,330.2 1,56,321.5 1,64,570.8 1,71,908.6 1,78,696.688.2% 87.7% 83.6% 84.3% 84.2% 84.6% 85.3% 84.9% 85.0% 84.8%-4.7% -5.4% -13.4% -29.3% 14.5% 10.8% 8.3% 5.3% 4.5% 3.9%
83,043.0 80,272.0 73,942.0 54,070.9 61,690.8 67,624.2 71,664.1 75,491.3 79,265.9 80,803.742.3% 43.2% 46.0% 47.5% 47.4% 46.9% 45.8% 45.9% 46.1% 45.2%-4.3% -3.3% -7.9% -26.9% 14.1% 9.6% 6.0% 5.3% 5.0% 1.9%
1,13,279.0 1,05,373.0 86,848.0 59,672.9 68,570.5 76,706.0 84,657.4 89,079.5 92,642.7 97,892.957.7% 56.8% 54.0% 52.5% 52.6% 53.1% 54.2% 54.1% 53.9% 54.8%-5.0% -7.0% -17.6% -31.3% 14.9% 11.9% 10.4% 5.2% 4.0% 5.7%
382.0 361.0 255.0 255.0 255.0 255.0 255.0 255.0 255.0 255.00.2% 0.2% 0.1% 0.2% 0.2% 0.1% 0.1% 0.1% 0.1% 0.1%
Total Revenues % change
222579 211665 192308 134950 154628 170620 183302 193748 202192 210726-5.8% -4.9% -9.1% -29.8% 14.6% 10.3% 7.4% 5.7% 4.4% 4.2%
Upstream(:(Production((MBOE)USA
Latin'America/Canada
Africa
Asia
Australia
Europe
Affiliates
Total(production
655 657 664 717.1 760.1 805.8 846.0 888.3 923.9 960.8-3.4% 0.3% 1.1% 8.0% 6.0% 6.0% 5.0% 5.0% 4.0% 4.0%162 161 165 171.6 176.7 182.1 187.5 193.1 197.0 200.9
-19.8% -0.6% 2.5% 4.0% 3.0% 3.0% 3.0% 3.0% 2.0% 2.0%451 431 434 442.7 447.1 451.6 456.1 460.7 465.3 469.9
-1.7% -4.4% 0.7% 2.0% 1.0% 1.0% 1.0% 1.0% 1.0% 1.0%775 766 749 749.0 771.5 802.3 842.4 884.6 920.0 956.7
5.7% -1.2% -2.2% 0.0% 3.0% 4.0% 5.0% 5.0% 4.0% 4.0%99 96 97 98.0 98.9 99.9 100.9 101.9 103.0 104.0
-2.0% -3.0% 1.0% 1.0% 1.0% 1.0% 1.0% 1.0% 1.0% 1.0%114 94 80 72.0 66.2 62.9 59.8 56.8 54.0 51.3
-18.0% -17.5% -14.9% -10.0% -8.0% -5.0% -5.0% -5.0% -5.0% -5.0%354 392 382 393.5 401.3 409.4 417.5 425.9 434.4 443.1
-1.9% 10.7% -2.6% 3.0% 2.0% 2.0% 2.0% 2.0% 2.0% 2.0%2610 2597 2571 2644 2722 2814 2910 3011 3097 3187
-2.4% -0.5% -1.0% 2.8% 3.0% 3.4% 3.4% 3.5% 2.9% 2.9%
Downstream'H'Marketing'volumes'(Thousands'of'barrels/day)
USA
International
Total
Downstream'H'Marketing'volumes'(Thousands'of'barrels/day)
2185 2081 2202 2,279.1 2,347.4 2,406.1 2,454.3 2,503.3 2,553.4 2,604.573.8% -4.8% 5.8% 3.5% 3.0% 2.5% 2.0% 2.0% 2.0% 2.0%2487 2455 2378 2,378.0 2,449.3 2,547.3 2,649.2 2,755.2 2,865.4 2,980.0
47.0% -1.3% -3.1% 0.0% 3.0% 4.0% 4.0% 4.0% 4.0% 4.0%4672 4536 4580 4657 4797 4953 5103 5259 5419 5584
58.4% -2.9% 1.0% 1.7% 3.0% 3.3% 3.0% 3.0% 3.0% 3.1%

Page 19
Chevron(CorporationIncome'Statement
Fiscal'Years'Ending'Dec.'31 2012 2013 2014 2015E 2016E 2017E 2018E 2019E 2020E 2021E
Total Revenue - Costs of Goods and Services - Depreciation and AmortizationGross Profit - SG&A expenses - R&D expenses - Other operating expensesOperating Income - Interest Expense - Interest Income - Losses (Gains) from affiliates - Net Non-Operating Losses (Gains)Pretax Income - Income Tax Expense - Deffered Income Tax ExpenseIncome Before XO Items - Extraordinary Loss Net of Tax - Minority InterestsNet Income - Other Adjustments
2,22,580.0 2,11,664.0 1,92,308.0 1,34,949.61,67,678.0 1,63,817.0 1,49,310.0 1,05,260.7
13,413.0 14,186.0 16,793.0 20,619.241,489.0 33,661.0 26,205.0 9,069.7
4,076.0 3,760.0 3,787.0 4,723.2648.0 750.0 707.0 539.8
4,128.0 1,861.0 1,985.0 2,833.932,637.0 27,290.0 19,726.0 972.7
0.0 0.0 0.0 0.0166.0 136.0 145.0 0.0
-6,889.0 -7,527.0 -7,098.0 -5,010.3-4,258.0 -1,038.0 -4,282.0 -3,750.0
43,950.0 35,991.0 31,251.0 9,733.017,981.0 12,431.0 10,319.0 3,211.9
2,015.0 1,877.0 1,573.0 486.723,954.0 21,683.0 19,359.0 6,034.5
0.0 0.0 0.0 0.0157.0 174.0 69.0 120.0
23,797.0 21,509.0 19,290.0 5,914.50.0 0.0 0.0 0.0
1,54,627.81,19,836.5
21,137.313,653.9
4,948.1618.5
2,628.75,458.6
0.00.0
-5,866.4-3,000.0
14,325.04,727.2
716.28,881.5
0.0130.0
8,751.50.0
1,70,619.81,30,524.2
21,220.518,875.2
4,777.4682.5
2,388.711,026.7
0.00.0
-6,448.1-3,000.0
20,474.76,756.71,023.7
12,694.30.0
140.012,554.3
0.0
1,83,302.11,38,393.1
21,575.923,333.1
4,032.6733.2
2,199.616,367.6
0.00.0
-7,033.8-3,000.0
26,401.48,712.51,320.1
16,368.90.0
150.016,218.9
0.0
1,93,747.81,45,310.8
22,116.326,320.6
3,875.0775.0
1,937.519,733.2
0.00.0
-7,623.5-3,000.0
30,356.710,017.7
1,517.818,821.1
0.0150.0
18,671.10.0
2,02,191.91,50,633.0
23,441.328,117.63,639.5
808.81,617.5
22,051.90.00.0
-7,650.5-3,000.0
32,702.310,791.8
1,635.120,275.4
0.0150.0
20,125.40.0
2,10,725.61,55,937.0
24,766.330,022.3
3,793.1842.9
1,685.823,700.6
0.00.0
-7,677.5-3,000.0
34,378.011,344.71,718.9
21,314.40.0
150.021,164.4
0.0Adjusted Net Income
Abnormal Losses (Gains) Tax Effect on Abnormal ItemsReported Net Income
23,797.0 21,509.0 19,290.0 5,914.5
-2,382.0 86.0 49.0 0.00.0 0.0 0.0 0.0
26,179.0 21,423.0 19,241.0 6,034.5
8,751.5
0.00.0
8,881.5
12,554.3
0.00.0
12,694.3
16,218.9
0.00.0
16,368.9
18,671.1
0.00.0
18,821.1
20,125.4
0.00.0
20,275.4
21,164.4
0.00.0
21,314.4
Basic Adjusted EPS 12.20 11.22 10.24 3.171.4470
4.581.4245
6.52 8.37 9.57 10.24 10.70No(of(Shares(outstandingDividend(Per(ShareDividend(Payment
Cost0of0good0sold/RevenueDepreciation/Opening0PPE0balanceSG&A0Expenses/RevenueR&D0Expenses/RevenueOther0operating0Expenses/RevenueOperating(Profit(marginInterest0expense/opening0debt0balanceIncome0from0Affiliates/Investment
Income0Tax/Pretax0IncomeDeffered0Tax/Pretax0Income
1,950.0 1,917.0 1,884.0 1,868.63.51 3.90 4.21 3.50
M6844.0 M7474.0 M7928.0 M6540
75.3% 77.4% 77.6% 78.0%5.7% 5.4% 5.7% 6.3%1.8% 1.8% 2.0% 3.5%0.3% 0.4% 0.4% 0.4%1.9% 0.9% 1.0% 2.1%
14.7% 12.9% 10.3% 0.7%0.0% 0.0% 0.0% 0.0%
29.9% 30.3% 27.0% 18.0%
40.9% 34.5% 33.0% 33.0%4.6% 5.2% 5.0% 5.0%
1,910.84.00
M7643
77.5%6.0%3.2%0.4%1.7%3.5%0.0%
21.0%
33.0%5.0%
1,924.24.40
M8467
76.5%5.7%2.8%0.4%1.4%6.5%0.0%
23.0%
33.0%5.0%
1,937.65.00
M9688
75.5%5.5%2.2%0.4%1.2%8.9%0.0%
25.0%
33.0%5.0%
1,951.15.50
M10731
75.0%5.3%2.0%0.4%1.0%
10.2%0.0%
27.0%
33.0%5.0%
1,964.56.00
M11787
74.5%5.3%1.8%0.4%0.8%
10.9%0.0%
27.0%
33.0%5.0%
1,977.96.60
M13054
74.0%5.3%1.8%0.4%0.8%
11.2%0.0%
27.0%
33.0%5.0%

Page 20
Chevron(CorporationBalance'Sheet
Fiscal'Years'Ending'Dec.'31
Assets Cash & Near Cash Items Short-Term Investments Accounts & Notes Receivable Inventories Other Current AssetsTotal Current Assets LT Investments & LT Receivables Net Fixed Assets Gross Fixed Assets (-) Accumulated Depreciation Other Long-Term Assets - Goodwill - Other intangible assets - Derivative and Hedging assets - Investment in unconsolidted entities - Others, netTotal Long-Term AssetsTotal Assets
Liabilities & Shareholders' Equity Accounts Payable Short-Term Borrowings Other Short-Term LiabilitiesTotal Current Liabilities Long-Term Borrowings Other Long-Term LiabilitiesTotal Long-Term LiabilitiesTotal Liabilities Share Capital & APIC Treasury Stock Retained earnings Other Equity Minority InterestTotal EquityTotal Liabilities & Equity
ASSETSAccounts(receivable/RevenueInventory/RevenueOther(current(assets/RevenueCapex
2012 2013 2014 2015E 2016E 2017E 2018E 2019E 2020E 2021E
20,939.0 16,245.0 12,785.0 9,560.4 7,808.7 9,668.3 8,595.2 8,024.1 17,920.1 26,614.2266.0 263.0 422.0 422.0 422.0 422.0 422.0 422.0 422.0 422.0
20,997.0 21,622.0 16,736.0 14,169.7 15,926.7 17,062.0 17,597.0 18,018.5 18,197.3 18,965.36,144.0 6,380.0 6,505.0 6,747.5 7,267.5 7,336.7 7,332.1 6,974.9 6,470.1 6,743.27,374.0 5,740.0 5,784.0 5,398.0 5,721.2 5,801.1 5,682.4 5,424.9 5,661.4 5,900.3
55,720.0 50,250.0 42,232.0 36,297.6 37,146.0 40,290.0 39,628.7 38,864.5 48,670.8 58,645.0650.0 624.0 577.0 577.0 577.0 577.0 577.0 577.0 577.0 577.0
1,41,348.0 1,64,829.0 1,83,173.0 1,87,553.8 1,86,416.5 1,85,196.0 1,88,620.1 1,91,503.8 1,93,062.5 1,93,296.12,63,481.0 2,96,433.0 3,27,289.0 3,52,289.0 3,72,289.0 3,92,289.0 4,17,289.0 4,42,289.0 4,67,289.0 4,92,289.01,22,133.0 1,31,604.0 1,44,116.0 1,64,735.2 1,85,872.5 2,07,093.0 2,28,668.9 2,50,785.2 2,74,226.5 2,98,992.9
35,264.0 38,050.0 40,044.0 41,844.0 42,244.0 42,644.0 43,044.0 43,444.0 43,844.0 44,244.04,640.0 4,639.0 4,593.0 4,593.0 4,593.0 4,593.0 4,593.0 4,593.0 4,593.0 4,593.0
0.0 0.0 0.0 0.0 0.0 0.0 0.0 0.0 0.0 0.029.0 6.0 12.0 12.0 12.0 12.0 12.0 12.0 12.0 12.0
23,068.0 24,878.0 26,335.0 27,835.0 27,935.0 28,035.0 28,135.0 28,235.0 28,335.0 28,435.07,527.0 8,527.0 9,104.0 9,404.0 9,704.0 10,004.0 10,304.0 10,604.0 10,904.0 11,204.0
1,76,612.0 2,02,879.0 2,23,217.0 2,29,397.8 2,28,660.5 2,27,840.0 2,31,664.1 2,34,947.8 2,36,906.5 2,37,540.12,32,982.0 2,53,753.0 2,66,026.0 2,66,272.4 2,66,383.5 2,68,707.0 2,71,869.8 2,74,389.3 2,86,154.3 2,96,762.2
32,743.0 31,244.0 26,846.0 16,868.7 19,328.5 21,839.3 24,379.2 27,124.7 29,317.8 30,555.2127.0 374.0 3,790.0 4,090.0 3,590.0 3,090.0 2,590.0 2,090.0 1,590.0 1,090.0
1,342.0 1,400.0 1,290.0 944.6 773.1 853.1 916.5 968.7 1,011.0 1,053.634,212.0 33,018.0 31,926.0 21,903.3 23,691.6 25,782.4 27,885.7 30,183.4 31,918.8 32,698.812,065.0 20,057.0 24,028.0 36,028.0 34,028.0 29,028.0 24,028.0 14,028.0 14,028.0 14,028.048,873.0 50,251.0 53,881.0 52,630.3 52,573.4 54,598.3 54,990.6 58,124.3 60,657.6 63,217.760,938.0 70,308.0 77,909.0 88,658.3 86,601.4 83,626.3 79,018.6 72,152.3 74,685.6 77,245.795,150.0 1,03,326.0 1,09,835.0 1,10,561.7 1,10,293.0 1,09,408.8 1,06,904.3 1,02,335.8 1,06,604.4 1,09,944.517,329.0 17,545.0 17,873.0 17,873.0 17,873.0 17,873.0 17,873.0 17,873.0 17,873.0 17,873.033,884.0 38,290.0 42,733.0 42,733.0 42,733.0 42,733.0 42,733.0 42,733.0 42,733.0 42,733.0
1,59,730.0 1,73,677.0 1,84,987.0 1,84,361.4 1,85,469.6 1,89,557.3 1,96,087.9 2,04,028.3 2,12,366.9 2,20,477.3-6,651.0 -3,819.0 -5,099.0 -5,599.0 -5,999.0 -6,299.0 -6,599.0 -6,899.0 -7,199.0 -7,499.01,308.0 1,314.0 1,163.0 1,163.0 1,163.0 1,163.0 1,163.0 1,163.0 1,163.0 1,163.0
1,37,832.0 1,50,427.0 1,56,191.0 1,55,065.4 1,55,773.6 1,59,561.3 1,65,791.9 1,73,432.3 1,81,470.9 1,89,281.32,32,982.0 2,53,753.0 2,66,026.0 2,65,627.1 2,66,066.6 2,68,970.1 2,72,696.3 2,75,768.0 2,88,075.3 2,99,225.8
9.4% 10.2% 8.7% 10.5% 10.3% 10.0% 9.6% 9.3% 9.0% 9.0%2.8% 3.0% 3.4% 5.0% 4.7% 4.3% 4.0% 3.6% 3.2% 3.2%3.3% 2.7% 3.0% 4.0% 3.7% 3.4% 3.1% 2.8% 2.8% 2.8%
$30,049.00 $32,952.00 $30,856.00 $25,000.00 $20,000.00 $20,000.00 $25,000.00 $25,000.00 $25,000.00 $25,000.00
LIABILITIESAccounts(payable/RevenueOther(current(liabilities/RevenueOther(long(term(liabilities/Revenue
14.7% 14.8% 14.0% 12.5% 12.5% 12.8% 13.3% 14.0% 14.5% 14.5%0.6% 0.7% 0.7% 0.7% 0.5% 0.5% 0.5% 0.5% 0.5% 0.5%
22.0% 23.7% 28.0% 39.0% 34.0% 32.0% 30.0% 30.0% 30.0% 30.0%

Page 21
Chevron(CorporationCash%Flow%Statement
Fiscal%Years%Ending%Dec.%31
Cash From Operating Activities + Net Income + Depreciation & Amortization + Other Non-Cash Adjustments + Changes in Non-Cash Capital Short Term investmets Accounts & Notes Receivable Inventories Other Current Assets Accounts Payable Other Short-Term Liabilities + Income from discontinued operationsCash From Operations
Cash From Investing Activities + Disposal of Fixed Assets + Capital Expenditures + Increase in LT Inv + Net cash from discontinued operations + Other Investing ActivitiesCash From Investing Activities
Cash from Financing Activities + Dividends Paid + Change in Short-Term Borrowings + Increase in Long-Term Borrowings Effect of Foreign Exchange Rates + Increase in Capital Stocks +Other changes in retained earnings + Other Financing ActivitiesCash from Financing ActivitiesNet Changes in Cash
Beginning(Cash(BalanceEnding(Cash(Balance
2012 2013 2014 2015E 2016E 2017E 2018E 2019E 2020E 2021E
26,179.0 21,423.0 19,241.0 5,914.5 8,751.5 12,554.3 16,218.9 18,671.1 20,125.4 21,164.413,413.0 14,186.0 16,793.0 20,619.2 21,137.3 21,220.5 21,575.9 22,116.3 23,441.3 24,766.3-1,143.0 724.0 -4,019.0
363.0 -1,331.0 -540.0 -6,967.5 -640.5 726.5 1,628.1 2,438.6 1,782.8 -542.70.0 0.0 0.0 0.0 0.0 0.0 0.0
2,566.3 -1,757.0 -1,135.3 -535.0 -421.5 -178.7 -768.0-242.5 -520.0 -69.1 4.6 357.2 504.8 -273.1386.0 -323.2 -79.8 118.7 257.4 -236.4 -238.9
-9,977.3 2,459.8 2,510.9 2,539.8 2,745.5 2,193.1 1,237.4300.0 -500.0 -500.0 -500.0 -500.0 -500.0 -500.0
0 0 038,812.0 35,002.0 31,475.0 19,566.2 29,248.4 34,501.4 39,422.9 43,226.0 45,349.5 45,388.0
-28,161.0 -36,842.0 -29,678.0 -25,000.0 -20,000.0 -20,000.0 -25,000.0 -25,000.0 -25,000.0 -25,000.00.0 0.0 0.0 -1,500.0 -100.0 -100.0 -100.0 -100.0 -100.0 -100.00.0 0.0 0.0 0.0 0.0 0.0 0.0 0.0 0.0 0.0
3,365.0 1,233.0 -215.0 -300.0 -300.0 -300.0 -300.0 -300.0 -300.0 -300.0-24,796.0 -35,609.0 -29,893.0 -26,800.0 -20,400.0 -20,400.0 -25,400.0 -25,400.0 -25,400.0 -25,400.0
-6,844.0 -7,474.0 -7,928.0 -6,540.1 -7,643.3 -8,466.6 -9,688.2 -10,730.8 -11,786.8 -13,054.0264.0 2,378.0 3,431.0 300.0 -500.0 -500.0 -500.0 -500.0 -500.0 -500.0
1,783.0 5,868.0 3,957.0 12,000.0 -2,000.0 -5,000.0 -5,000.0 -10,000.0 0.0 0.039.0 -266.0 -43.0 0.0 0.0 0.0 0.0 0.0 0.0 0.0
-4,142.0 -4,494.0 -4,412.0 -500.0 -400.0 -300.0 -300.0 -300.0 -300.0 -300.00.0 0.0 0.0 0.0 0.0 0.0 0.0 0.0 0.0 0.0
-41.0 -99.0 -47.0 -1,250.7 -56.9 2,024.9 392.3 3,133.7 2,533.2 2,560.1-8,941.0 -4,087.0 -5,042.0 4,009.2 -10,600.2 -12,241.7 -15,095.9 -18,397.1 -10,053.6 -11,293.95,075.0 -4,694.0 -3,460.0 -3,224.6 -1,751.8 1,859.6 -1,073.1 -571.1 9,895.9 8,694.1
15,864.0 20,939.0 16,245.0 12,785.0 9,560.4 7,808.7 9,668.3 8,595.2 8,024.1 17,920.120,939.0 16,245.0 12,785.0 9,560.4 7,808.7 9,668.3 8,595.2 8,024.1 17,920.1 26,614.2

Page 22
Chevron(CorporationValue&Driver&Estimation
Fiscal&Years&Ending&Dec.&31
Operating*RevenueLess*COGS*(excl*depr*&*amort)Less*depreciation*&*amortizationLess*SG&A*and*other*costsPlus*implied*interest*on*operating*leasesEBITA
Less*Adjusted*Taxes:Marginal*Tax*Rate*Provision*for*income*taxesPlus*tax*shield*on*unusual*itemsPlus*tax*shield*on*implied*lease*interest*expPlus*tax*shield*on*interest*expense
2012 2013 2014 2015E 2016E 2017E 2018E 2019E 2020E 2021E
222580 211664 192308 134950 154628 170620 183302 193748 202192 210726167678 163817 149310 105261 119837 130524 138393 145311 150633 15593713413 14186 16793 20619 21137 21220 21576 22116 23441 247668852 6371 6479 8097 8195 7849 6965 6587 6066 632289 91 94 89 96 102 107 114 121 128
32726 27381 19820 1062 5555 11128 16475 19847 22173 23828
35% 35% 35% 35% 35% 35% 35% 35% 35% 35%19996 14308 11892 3699 5443 7780 10033 11536 12427 13064P2411 P2634 P2484 P1754 P2053 P2257 P2462 P2668 P2678 P2687
31 32 33 31 34 36 37 40 42 450 0 0 0 0 0 0 0 0 0
Less*tax*shield*on*nonoperating*incomeTotal*Adjusted*Taxes
Deferred*Tax*LiabilityDeferred*Tax*AssetPlus:*Change*in*Deferred*TaxesNOPLAT
Invested(CapitalOperating*Current*Assets
Cash*(make*sure*not*excess)Trade*&*other*receivables,*netInventoryOther*current*assets
Total*operating*current*assetsOperating*Liabilities
Accounts*payableIncome*tax*payableAccrued*PayrollMiscellaneous*Current*Liabilities
Total*operating*current*liabilities
Net(Operating(Working(CapitalPlus:*Net*PPEPlus:*PV*of*operating*leasesPlus:*Net*intangible*assets,*excluding*g/wLess:*Other*operating*liabilitiesInvested(Capital((IC)
Value(DriversReturn(on(Invested(Capital((ROIC)CY*NOPLATPY*Invested*CapitalROIC
Free(Cash(Flow((FCF)CY*NOPLATCY*Invested*CapitalPY*Invested*CapitalFCF
Economic(Profit((EP)PY*Invested*CapitalROICWACCEP
1490 363 1499 1313 1050 1050 1050 1050 1050 105016126 11342 7942 664 2374 4509 6558 7857 8741 9371
17,672.0 21,301.0 21,920.0 22407 23123 24147 25467 26985 28620 303390.0 0.0 0.0 0.0 0.0 0.0 0.0 0.0 0.0 0.0
2128 3629 619 487 716 1024 1320 1518 1635 171918728 19668 12497 885 3897 7643 11237 13508 15066 16176
20939 16245 12785 9560 7809 9668 8595 8024 17920 2661420997 21622 16736 14170 15927 17062 17597 18019 18197 189656144 6380 6505 6747 7268 7337 7332 6975 6470 67437374 5740 5784 5398 5721 5801 5682 5425 5661 590055454 49987 41810 35876 36724 39868 39207 38443 48249 58223
32743 31244 26846 16869 19328 21839 24379 27125 29318 30555
1342 1400 1290 945 773 853 917 969 1011 105434085 32644 28136 17813 20102 22692 25296 28093 30329 31609
21369 17343 13674 18062 16622 17176 13911 10349 17920 26614141348 164829 183173 187554 186416 185196 188620 191504 193062 1932963239 3374 3191 3435 3630 3825 4068 4312 4556 4800
0 0 0 0 0 0 0 0 0 0
165956 185546 200038 209051 206669 206196 206600 206165 215538 224710
18728 19668 12497 885 3897 7643 11237 13508 15066 16176145517 165956 185546 200038 209051 206669 206196 206600 206165 21553812.9% 11.9% 6.7% 0.4% 1.9% 3.7% 5.4% 6.5% 7.3% 7.5%
18728 19668 12497 885 3897 7643 11237 13508 15066 16176165956 185546 200038 209051 206669 206196 206600 206165 215538 224710145517 165956 185546 200038 209051 206669 206196 206600 206165 215538
((((((((((1,711) (((((((((((((((78( ((((((((((1,995) ((((((((((8,128) (((((((((((6,279( (((((((((((8,115( (((((((((10,833( (((((((((13,942( (((((((((((5,693( (((((((((((7,004(
145517 165956 185546 200038 209051 206669 206196 206600 206165 21553812.9% 11.9% 6.7% 0.4% 1.9% 3.7% 5.4% 6.5% 7.3% 7.5%6.8% 6.8% 6.8% 6.8% 6.8% 6.8% 6.8% 6.8% 6.8% 6.8%
(((((((((((8,774( (((((((((((8,315( (((((((((((((195) ((((((((12,799) ((((((((10,403) ((((((((((6,495) ((((((((((2,869) (((((((((((((625) ((((((((((((((963( (((((((((((1,431(

Page 23
Chevron(CorporationCommon%Size%Income%Statement
Fiscal%Years%Ending%Dec.%31
Total Revenue - Purchase and related costs - Depreciation and AmortizationGross Profit - SG&A Expenses - R&D Expenses - Other operating ExpensesOperating Income - Interest Expense - Foreign Exchange Losses (Gains) - Net Non-Operating Losses (Gains)Pretax Income - Income Tax Expense - Deffered Income Tax ExpenseIncome Before XO Items - Extraordinary Loss Net of Tax - Minority InterestsNet Income - Other adjustmentsNet Inc Avail to Common Shareholders
2012 2013 2014 2015E 2016E 2017E 2018E 2019E 2020E 2021E
100.00% 100.00% 100.00% 100.00% 100.00% 100.00% 100.00% 100.00% 100.00% 100.00%75.33% 77.39% 77.64% 78.00% 77.50% 76.50% 75.50% 75.00% 74.50% 74.00%
6.03% 6.70% 8.73% 15.28% 13.67% 12.44% 11.77% 11.42% 11.59% 11.75%18.64% 15.90% 13.63% 6.72% 8.83% 11.06% 12.73% 13.58% 13.91% 14.25%1.83% 1.78% 1.97% 3.50% 3.20% 2.80% 2.20% 2.00% 1.80% 1.80%0.29% 0.35% 0.37% 0.40% 0.40% 0.40%1.85% 0.88% 1.03% 2.10% 1.70% 1.40%
14.66% 12.89% 10.26% 0.72% 3.53% 6.46% 8.93% 10.18% 10.91% 11.25%0.00% 0.00% 0.00% 0.00% 0.00% 0.00% 0.00% 0.00% 0.00% 0.00%
-3.10% -3.56% -3.69% -3.71% -3.79% -3.78% -3.84% -3.93% -3.78% -3.64%-1.91% -0.49% -2.23% -2.78% -1.94% -1.76% -1.64% -1.55% -1.48% -1.42%19.75% 17.00% 16.25% 7.21% 9.26% 12.00% 14.40% 15.67% 16.17% 16.31%8.08% 5.87% 5.37% 2.38% 3.06% 3.96% 4.75% 5.17% 5.34% 5.38%0.91% 0.89% 0.82% 0.36% 0.46% 0.60% 0.72% 0.78% 0.81% 0.82%
10.76% 10.24% 10.07% 4.47% 5.74% 7.44% 8.93% 9.71% 10.03% 10.11%0.00% 0.00% 0.00% 0.00% 0.00% 0.00% 0.00% 0.00% 0.00% 0.00%0.07% 0.08% 0.04% 0.09% 0.08% 0.08% 0.08% 0.08% 0.07% 0.07%
10.69% 10.16% 10.03% 4.38% 5.66% 7.36% 8.85% 9.64% 9.95% 10.04%0.00% 0.00% 0.00% 0.00% 0.00% 0.00% 0.00% 0.00% 0.00% 0.00%
10.69% 10.16% 10.03% 4.38% 5.66% 7.36% 8.85% 9.64% 9.95% 10.04%
Chevron(CorporationCommon%Size%Balance%Sheet
Fiscal%Years%Ending%Dec.%31
Assets Cash & Near Cash Items Short-Term Investments Accounts & Notes Receivable Inventories Other Current AssetsTotal Current Assets LT Investments & LT Receivables Net Fixed Assets Gross Fixed Assets (-) Accumulated Depreciation Other Long-Term Assets
2012 2013 2014 2015E 2016E 2017E 2018E 2019E 2020E 2021E
8.99% 6.40% 4.81% 3.59% 2.93% 3.60% 3.16% 2.92% 6.26% 8.97%0.11% 0.10% 0.16% 0.16% 0.16% 0.16% 0.16% 0.15% 0.15% 0.14%9.01% 8.52% 6.29% 5.32% 5.98% 6.35% 6.47% 6.57% 6.36% 6.39%2.64% 2.51% 2.45% 2.53% 2.73% 2.73% 2.70% 2.54% 2.26% 2.27%3.17% 2.26% 2.17% 2.03% 2.15% 2.16% 2.09% 1.98% 1.98% 1.99%
23.92% 19.80% 15.88% 13.63% 13.94% 14.99% 14.58% 14.16% 17.01% 19.76%0.28% 0.25% 0.22% 0.22% 0.22% 0.21% 0.21% 0.21% 0.20% 0.19%
60.67% 64.96% 68.86% 70.44% 69.98% 68.92% 69.38% 69.79% 67.47% 65.14%113.09% 116.82% 123.03% 132.30% 139.76% 145.99% 153.49% 161.19% 163.30% 165.89%52.42% 51.86% 54.17% 61.87% 69.78% 77.07% 84.11% 91.40% 95.83% 100.75%15.14% 14.99% 15.05% 15.71% 15.86% 15.87% 15.83% 15.83% 15.32% 14.91%
Total Long-Term AssetsTotal Assets
Liabilities & Shareholders' Equity Accounts Payable Short-Term Borrowings Other Short-Term LiabilitiesTotal Current Liabilities Long-Term Borrowings Other Long-Term LiabilitiesTotal Long-Term LiabilitiesTotal Liabilities Total Preferred Equity Minority Interest Share Capital & APIC Retained Earnings & Other EquityTotal EquityTotal Liabilities & Equity
75.80% 79.95% 83.91% 86.15% 85.84% 84.79% 85.21% 85.63% 82.79% 80.04%100.00% 100.00% 100.00% 100.00% 100.00% 100.00% 100.00% 100.00% 100.00% 100.00%
14.05% 12.31% 10.09% 6.34% 7.26% 8.13% 8.97% 9.89% 10.25% 10.30%0.05% 0.15% 1.42% 1.54% 1.35% 1.15% 0.95% 0.76% 0.56% 0.37%0.58% 0.55% 0.48% 0.35% 0.29% 0.32% 0.34% 0.35% 0.35% 0.36%
14.68% 13.01% 12.00% 8.23% 8.89% 9.60% 10.26% 11.00% 11.15% 11.02%5.18% 7.90% 9.03% 13.53% 12.77% 10.80% 8.84% 5.11% 4.90% 4.73%
20.98% 19.80% 20.25% 19.77% 19.74% 20.32% 20.23% 21.18% 21.20% 21.30%26.16% 27.71% 29.29% 33.30% 32.51% 31.12% 29.06% 26.30% 26.10% 26.03%40.84% 40.72% 41.29% 41.52% 41.40% 40.72% 39.32% 37.30% 37.25% 37.05%7.44% 6.91% 6.72% 6.71% 6.71% 6.65% 6.57% 6.51% 6.25% 6.02%
14.54% 15.09% 16.06% 16.05% 16.04% 15.90% 15.72% 15.57% 14.93% 14.40%68.56% 68.44% 69.54% 69.24% 69.63% 70.54% 72.13% 74.36% 74.21% 74.29%-2.85% -1.51% -1.92% -2.10% -2.25% -2.34% -2.43% -2.51% -2.52% -2.53%59.16% 59.28% 58.71% 58.24% 58.48% 59.38% 60.98% 63.21% 63.42% 63.78%
100.00% 100.00% 100.00% 99.76% 99.88% 100.10% 100.30% 100.50% 100.67% 100.83%

Page 24
Chevron(CorporationWeighted(Average(Cost(of(Capital((WACC)(Estimation
Equity DebtShares'outstanding'(Mn) 1,869''''''' Book'value'of'debt'(ST'&'LT) 40,118'''''Price'per'share 88.70''''''' Increase'in'FV'of'debt
Operating'leases 3,435'''''''Market'value'equity 1,65,745' Total'debt 43,553'''''
Weight'of'equity 0.79''''''''' Weight'of'debt 0.21'''''''''
Beta'(3'year) 1.20''''''''' Cost'of'debt,'preRtax 2.80%Risk'free'rate'(30Ryr'US'TRBond)'as'of'11/06/15 2.34%Market'risk'premium'(1928R2013'TRBond) 4.85% Marginal'Tax'rate 35.00%Cost(of(Equity(by(CAPM(Model 8.16% After(tax(cost(of(debt 1.82%
WACC 6.84%
Present'Value'of'Operating'Lease'Obligations'(2014) Present'Value'of'Operating'Lease'Obligations'(2013)
Operating OperatingFiscal.Years.Ending.Dec..31 Leases Fiscal.Years.Ending.Dec..31 Leases2015 793 2014 7982016 644 2015 7332017 585 2016 5942018 461 2017 4722019 326 2018 306Thereafter 689 Thereafter 806Total.Minimum.Payments 3498 Total.Minimum.Payments 3709Less:.Interest 307 Less:.Interest 335PV.of.Minimum.Payments 3191 PV.of.Minimum.Payments 3374
Capitalization'of'Operating'Leases Capitalization'of'Operating'Leases
PreKTax.Cost.of.Debt 2.80% PreKTax.Cost.of.Debt 2.80%Number.Years.Implied.by.Year.6.Payment 2.1 Number.Years.Implied.by.Year.6.Payment 2.6
Lease PV.Lease Lease PV.LeaseYear Commitment Payment Year Commitment Payment1 793 771.4 1 798 776.32 644 609.4 2 733 693.63 585 538.5 3 594 546.84 461 412.8 4 472 422.65 326 284.0 5 306 266.56.&.beyond 326 575.0 6.&.beyond 306 667.8PV.of.Minimum.Payments 3191.0 PV.of.Minimum.Payments 3373.6

Page 25
Chevron(CorporationDiscounted+Cash+Flow+(DCF)+and+Economic+Profit+(EP)+Valuation+Models
Key$Inputs:$$$$$CV$Growth 4.22%$$$$$CV$ROIC 7%$$$$$WACC 6.84%$$$$$Cost$of$Equity 8.16%
Fiscal+Years+Ending+Dec.+31 2016E 2017E 2018E 2019E 2020E 2021E
DCF(ModelNOPLAT 3897 7643 11237 13508 15066 16176Change$in$Invested$Capital P2382 P472 403 P434 9373 9172FCF 6279 8115 10833 13942 5693 7004Continuing$value 260814Periods$to$discount 1 2 3 4 5 5PV$of$FCF$discounted$by$WACC 5,877$$$$$$$$$$ 7109 8883 10700 4089 187347Value(of(operating(assets 2,24,006(((((Plus$Investment$in$unconsolidated$entities 27835Less$debt 40118Less$Other$non$operating$liabilities 30224Less$Minority$Interest 1163Less$PV$of$operating$leases 3435Value$of$equity 176901Shares$outstanding 1869Intrinsic(value((per(share)(as(of(12/31/15 94.61
EP(ModelEconomic$profit$to$discount P10403 P6495 P2869 P625 963 1431Continuing$value 45275Periods$to$discount 1 2 2 4 4 5PV$of$FCF$discounted$by$WACC (9,737)$$$$$$$$$ P5690 P2513 P480 739 32522PV$(Economic$Profit) 14,841$$$$$$$$Plus$beginning$invested$capital 209051Value(of(operating(assets 223892Plus$Investment$in$unconsolidated$entities 27835Less$debt 40118Less$Other$non$operating$liabilities 30224Less$Minority$Interest 1163Less$PV$of$operating$leases 3435Value$of$equity 176788Shares$outstanding 1869Intrinsic(value((per(share)(as(of(12/31/15 94.61

Page 26
Chevron(CorporationDividend'Discount'Model'(DDM)'or'Fundamental'P/E'Valuation'Model
Fiscal'Years'Ending'Dec.'31 2016E 2017E 2018E 2019E 2020E 2021E 2022E
EPS 4.58$/////// 6.52$/////// 8.37$/////// 9.57$/////// 10.24$///// 10.70$///// 10.70$/////
Key$Assumptions///CV/growth 4%///CV/ROE 9.0%///Cost/of/Equity 8.2%
Future$Cash$Flows/////P/E/Multiple/(CV/Year) 13.5/////EPS/(CV/Year) 10.70/////Future/Stock/Price 144.2/////Dividends/Per/Share 4.00 4.40 5.00 5.50 6.00 6.60/////Future/Cash/Flows 4.00 4.40 5.00 5.50 6.00 6.60 144.25$///
1 2 3 4 5 6 6/////Discounted/Cash/Flows 3.70 3.76 3.95 4.02 4.05 4.12 90.10
Intrinsic(Value(as(of(12/31/15 110.00$((
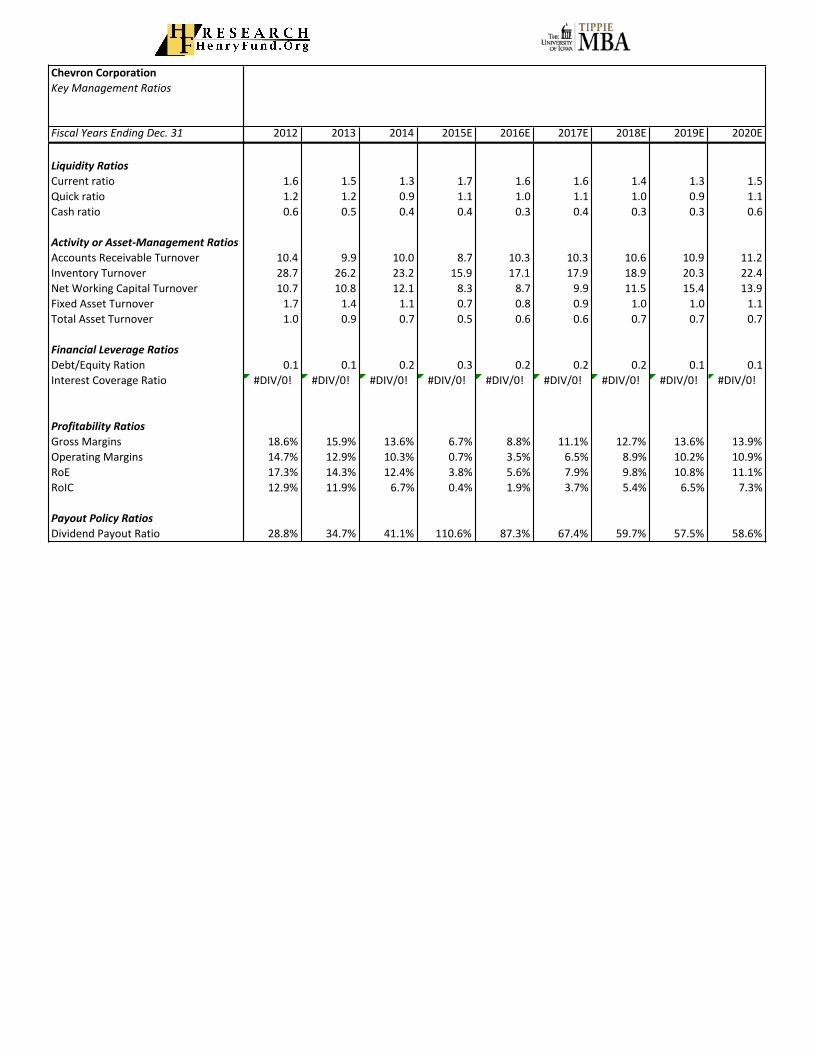
Page 27
Chevron(CorporationKey$Management$Ratios
Fiscal$Years$Ending$Dec.$31
Liquidity(RatiosCurrent'ratioQuick'ratioCash'ratio
Activity(or(Asset2Management(RatiosAccounts'Receivable'TurnoverInventory'TurnoverNet'Working'Capital'TurnoverFixed'Asset'TurnoverTotal'Asset'Turnover
Financial(Leverage(RatiosDebt/Equity'RationInterest'Coverage'Ratio
Profitability(RatiosGross'MarginsOperating'MarginsRoERoIC
Payout(Policy(RatiosDividend'Payout'Ratio
2012 2013 2014 2015E 2016E 2017E 2018E 2019E 2020E
1.6 1.5 1.3 1.7 1.6 1.6 1.4 1.3 1.51.2 1.2 0.9 1.1 1.0 1.1 1.0 0.9 1.10.6 0.5 0.4 0.4 0.3 0.4 0.3 0.3 0.6
10.4 9.9 10.0 8.7 10.3 10.3 10.6 10.9 11.228.7 26.2 23.2 15.9 17.1 17.9 18.9 20.3 22.410.7 10.8 12.1 8.3 8.7 9.9 11.5 15.4 13.91.7 1.4 1.1 0.7 0.8 0.9 1.0 1.0 1.11.0 0.9 0.7 0.5 0.6 0.6 0.7 0.7 0.7
0.1 0.1 0.2 0.3 0.2 0.2 0.2 0.1 0.1#DIV/0! #DIV/0! #DIV/0! #DIV/0! #DIV/0! #DIV/0! #DIV/0! #DIV/0! #DIV/0!
18.6% 15.9% 13.6% 6.7% 8.8% 11.1% 12.7% 13.6% 13.9%14.7% 12.9% 10.3% 0.7% 3.5% 6.5% 8.9% 10.2% 10.9%17.3% 14.3% 12.4% 3.8% 5.6% 7.9% 9.8% 10.8% 11.1%12.9% 11.9% 6.7% 0.4% 1.9% 3.7% 5.4% 6.5% 7.3%
28.8% 34.7% 41.1% 110.6% 87.3% 67.4% 59.7% 57.5% 58.6%