Embed Size (px)
Citation preview

Importantdisclosuresappearonthelastpageofthisreport.
TheHenryFund
HenryB.TippieSchoolofManagementJonKerr[[email protected]] LinearTechnology(LLTC) November17,2015
InformationTechnology–Semiconductors StockRating NoActionInvestmentThesis TargetPrice $45-49
Linear Technology targets the high performance segment of the analogintegrated circuit market with application-specific products that are notsubject to commodity pricing like digital and standard analog integratedcircuits. The cyclicality of the semiconductor industry will keep revenuesdown incalendaryear2015butthecompany ispositionedwell inboththeindustrial and automotive segments and should see substantial revenuegrowth in 2016 due to the increasing data connectivity of these markets.However,thestockpricerose11%inthemonthofOctober,whichlimitstheupside on this stock. Therefore, we recommend a no action on LinearTechnology.DriversofThesis• LinearTechnologyhashistoricallyhadstrongcashflowgenerationwitha
long history of returning value to shareholders through both dividendpayments and stock repurchases. They have averaged a 55% dividendpayoutratioanda69%totalpayoutratiosince2009.
• The company has no debt on their balance sheet and they have a highlevelofliquiditybasedontheircurrentratioof8.4in2015.
• LinearTechnologyisaleanandwell-runcompanydominatingtheirpeers
ingrossmargins,operatingmargins,ROE,andROIC.RiskstoThesis• If the current downturn in the industry does not end in Q4 2015 as
expected,companyrevenuescouldbehitevenharderthanpredicted.• Larger companies have broader product lines with greater technical
service and support capabilities which could make major automobilepartssuppliesshyawayfromLinearTechnologyproducts.
HenryFundDCF $46.92HenryFundDDM $47.83RelativeP/EMultiple $41.03PriceData CurrentPrice $44.3152wkRange $36.41–49.57Consensus1yrTarget $42.61KeyStatistics MarketCap(M) $10,996SharesOutstanding(M) 244.5InstitutionalOwnership 97.0%FiveYearBeta 1.17DividendYield 2.70%Est.5yrGrowth 10.9%Price/Earnings(TTM) 21.40Price/Sales(TTM) 7.54Debt/Equity 0.0%Profitability OperatingMargin 46.28%NetProfitMargin 35.32%ReturnonAssets(TTM) 29.44%ReturnonEquity(TTM) 35.81%
EarningsEstimatesYear 2013 2014 2015 2016E 2017E 2018EEPS $1.75 $1.91 $2.13 $1.97 $2.17 $2.27
Growth 0.62% 11.25% 11.45% -7.68% 10.26% 3.71%12MonthPerformance CompanyDescription
Linear Technology Corporation designs,manufacturers,andmarketsadiverselineofanalog integrated circuits for companiesworldwide. They target high performanceapplication-specific products in the analogsemiconductor market. The company’sproductsbridgethegapbetweentheanalogworld and digital electronics incommunications, networking, industrial,automotive, computer, medical,instrumentation,consumer,andmilitaryandaerospacesystems.
21.4
35.8 35.3
21.8
15.4 17.320.5
17.113.2
0
10
20
30
40
P/E ROE ProfitMargin
LLTC Industry Sector
-15%
-10%
-5%
0%
5%
10%
15%
N D J F M A M J J A S O
LLTC S&P500
Source:YahooFinance
Source:YahooFinance

Page2
EXECUTIVESUMMARY
Linear Technology is a leading supplier of high-performanceanalogintegratedcircuits.
The company operates in the cyclical semiconductorindustry,which isexpected tohavea slightdownturn inthe remaining calendar year of 2015 before reboundingincalendaryear2016. LinearTechnology isexpectedtohaveadeclineintheirFY2016revenuesbeforeincreasinginFY2017duetotheindustrycyclicality.
Linear Technology competes in the analog sector of thesemiconductorindustry,whichischaracterizedbylongerdesign cycles, longer product lives, and lower capitalexpenditures than the digital sector. Therefore,companiesintheanalogsectortendtohavehigherprofitmargins thancompanies competing in thedigital sector.Linear Technology has consistently had industry leadingmargins. We have modeled gross profit margins tomaintain historical levels of around 75%with operatingprofit margin decreasing slightly from 46.3% in 2015 to45.5%into2020.
We expect revenue growth for the company to comefromthe industrialandautomotivesegmentsduetothegrowingnumberofdevicesconnectingtotheInternetofThings and from the increased demand for hybrid andelectric vehicles as well as the increasing amount ofelectronicsbeingaddedtovehicles.
The company has a long track record of high dividendpaymentsandconsistentdividendgrowth.Thecompanyhas historically had a dividend payout ratio of around55% and a total payout ratio of around 65% with thatnumberincreasingto75%thelastfouryears.Weexpectthetotalpayoutratiotoaverage80%into2020becauseof the company’s large amount of cash and short-termmarketable securities on its balance sheet, $4.92 pershare.
EvenwiththeexpectedgrowthafterFY2016andthehighvalue returned to shareholders each year, werecommend“noaction”onLinearTechnology.Thestockprice has risen approximately 11% since the timecoveragewasinitiatedonthecompanyandwefeelthereislimitedupsideleftinthepriceofthestock.
COMPANYDESCRIPTION
Linear Technology Corporation was founded in 1981 inMilpitas, California. The company targets the highperformance segment of the $47.5 billion analog
integrated circuit market. (1) The company designs andmanufactures a vast portfolio of different integratedcircuits(IC)forthousandsofdifferentcustomersglobally,withnosinglecustomeraccountingformorethan10%ofcompany revenue. The products Linear Technologyproduces link theanalogworld to thedigitalworld. Forexample, their products may measure light, sound,pressure,orpowerandoutputadigitalrepresentationofthat input. Linear Technology is a highly profitablycompanywith116 consecutivequartersofpositive cashflow.In2010,Forbesmagazinecalledthecompany“oneofthetechindustry’smostprofitablecompanies.”(2)
RevenueTypes
Source:LinearTechnologyYearEnd2015EarningsCall
LinearTechnologyhassixoperatingsegments:Industrial,Automotive, Communications, Computer,Military/HarshEnvironment, and Consumer. The company targets theIndustrial and Automotive segments, as these are thefasting growing markets in the analog industry. Thesetwo markets are also characterized by longer designcycles and longer product lives and customers in thesemarkets are more likely to pay a premium for LinearTechnology’sproductsandservices.
Linear Technology’s main revenue segment is theIndustrial segment. This segment has consistentlyaccounted forover40%of thecompany’s revenuesince2011. The industrial segment serves a very diversecustomer base with applications ranging from DNA andblood analyzers to solar power to factory automation.Demand for this segment is determined by global
43.0%
20.0%
19.0%
9.0%
6.0%
3.0%
FY2015%RevenueperSegment
Industrial
Automomve
Communicamons
Computer
Military/HarshEnvironment
Consumer

Page3
macroeconomic factors and is highly correlated to theGlobal GDP. We expect Industrial segment revenues todecline 3% in 2016. However, we believe segmentrevenues will rebound in 2017 and into 2020 withrevenuesgrowingata5.1%five-yearCAGR.
In 2015, the Automotive segment surpassed theCommunications segment to become the company’ssecond largest segment generating 20% of companyrevenue. This segment isexperiencing themostgrowthfor the company. Since 2010, the Automotive segmenthas grown at an 18% CAGR. The growth is due to theincreasing amount of electronics in cars. In the future,theincreaseinhybridandelectriccarsaswellasInternetequippedautomobileswilldrivegrowth in this segment.In2016,weexpectanincreaseof5%insegmentrevenuebefore a 13% increase in 2017. We expect segmentrevenuestogrowatan8.7%CAGRinto2020.
The company’s third largest segment is theCommunicationssegment,accountingfor19%ofrevenuein 2015. This segment includes ICs for mobile phones,Ethernet and networking products, and wireless radios.Historically,salesinthissegmenthavebeenverycyclical.In 2011, Communications segment revenues were $341millionbeforedeclining21%to$269millionin2013.Weexpectrevenuestoonceagaindeclineforthissegmentin2016, decreasing 4%. However, we do expect futuregrowthforthesegmentduetoincreasingpenetrationofsmartphoneswith overall revenues increasing at a 2.3%five-yearCAGR.
The next largest segment is the Computer segment. In2015, this segment accounted for 9% of companyrevenue.Productsinthissegmentareusedinnotebooks,desktops, tabletPCs, servers, andprinters. Revenues inthis segment had been steadily declining from 2011 to2014. However, in2015revenuesgrewby6%. In2016,we expect revenues to decline by 6%. The increasedadoption of the tablet PCwill generate slight growth inthe future. We have modeled revenue growth for theComputersegmenttoincreaseata1.0%CAGRinto2020.
The Military/Aerospace/Harsh Environment segmentaccountedfor6%oftotalcompanyrevenuein2015.Weexpect sales in this segment to decrease 6% in 2016mainly due to a decrease in government spending.Overallweexpect the segment togrowat a1.1%CAGRinto2020.
The Consumer segment accounted for 3% of totalcompanyrevenuein2015.Managementhasstatedthat
this is amarket the company “does not actively chase.”Because of this, we have modeled the Consumersegment’srevenuetogrowata1.0%CAGRinto2020butto slightly decrease as a percent of overall revenue to2.5%.
GeographicDiversification
Linear Technology segments their revenue into fourdifferent regions. Domestic revenues consistentlyaccountforaround28%oftotalrevenue.
Source:LinearTechnology201510-K(3)
More than 85%of Linear Technology’smanufacturing isperformedat twoU.S. locations. The company’s exportsales are billed and payable in US dollars. Thus exportsales are not directly subject to fluctuating currencyexchange rates. The strengthening of the U.S. dollarresults in Linear Technology’s products being moreexpensiveforsomeinternationalcustomers.Theadverseeffect to revenue may be partially offset in operatingexpenses since the company generally incurs its foreignoperatingexpensesinthecorrespondinglocalcurrency.
RECENTDEVELOPMENTS
Q12016Earnings
OnOctober13,2015,LinearTechnologyannouncedtheirfirst quarter of FY2016 results. Quarterly revenuedecreased 7.9% year-over-year to $341.9 million. Thecompany’snetincomeof$112.0milliondecreased13.4%from the first quarter of FY2015. These numbers areweakwhencomparedtolastyear. However,theresultswereexpectedandmatchedconsensusanalystestimatesof$0.46pershare.Managementhasstatedtheybelieve
19.8%
15.5%
37.0%
27.7%
FY2015RegionalSales
Europe
Japan
RestofWorld(ROW)
NorthAmerica
Page4
this decrease in revenues is an expected correction andwill be relatively short lived. It is management’s viewthatthisdowncyclewillnotbeprolongedandcustomerinventorieswillberebalancedbyQ3.Thecompanygavepositive revenue guidance for Q2 with revenuesincreasing0-3%fromQ1.Analystswereexpectinga1-2%decline fromQ1so the streetviewed thisguidanceverypositively as the stock price increased 6.2% the dayfollowingtheearningsrelease.
2015DividendIncrease
On January 13, 2015, Linear Technology announced an11% increase in its quarterly dividend payment from$0.27 to $0.30. 2015marked the 23rd consecutive yearthatLinearTechnologyhasincreaseditsdividend.
Source:Nasdaq(4)
Since 2009, the company has averaged a 55% dividendpayout ratio. In the last four years that number hasincreased to 57% with the dividend payment per sharegrowingata5.2%CAGR.
INDUSTRYTRENDS
LinearTechnologyandotheranalogICmanufacturersarein a unique position as the world becomes more andmore connected. The digitization and connectivity ofdeviceswilldriveanalogsales.
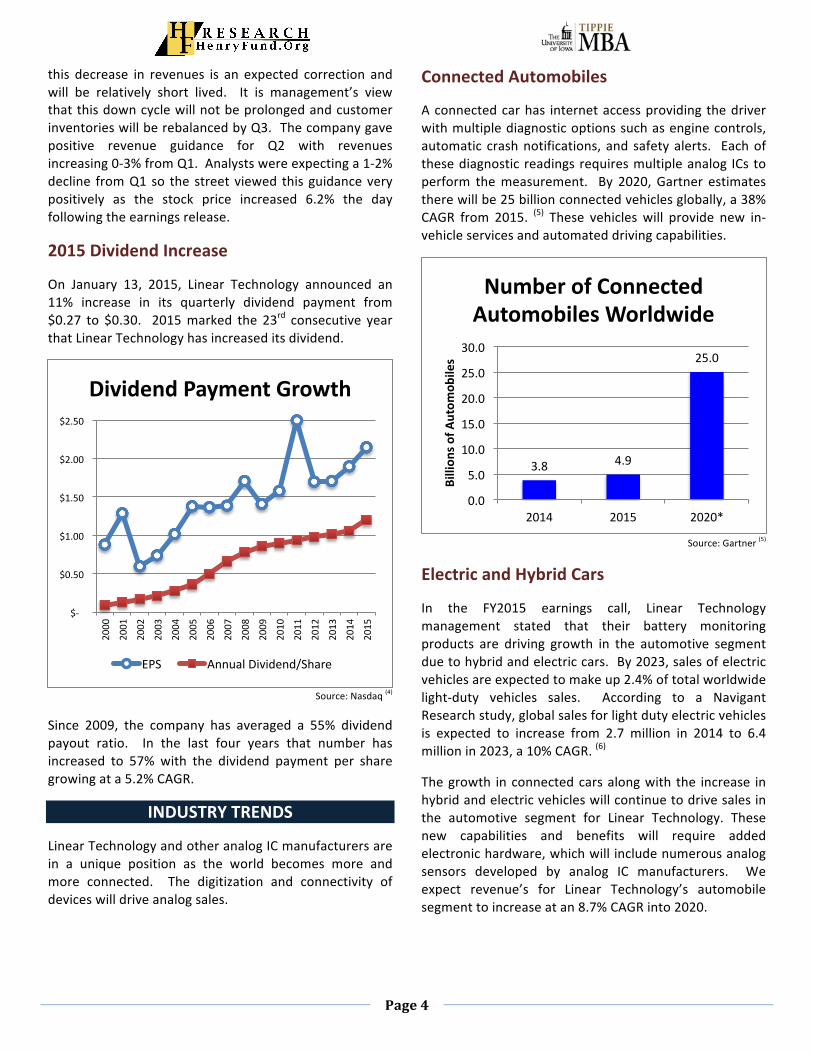
ConnectedAutomobiles
Aconnectedcarhas internetaccessproviding thedriverwithmultiplediagnosticoptionssuchasenginecontrols,automatic crashnotifications, and safetyalerts. Eachofthesediagnostic readingsrequiresmultipleanalog ICs toperform themeasurement. By 2020, Gartner estimatestherewillbe25billionconnectedvehiclesglobally,a38%CAGR from 2015. (5) These vehicles will provide new in-vehicleservicesandautomateddrivingcapabilities.
Source:Gartner(5)
ElectricandHybridCars
In the FY2015 earnings call, Linear Technologymanagement stated that their battery monitoringproducts are driving growth in the automotive segmentduetohybridandelectriccars.By2023,salesofelectricvehiclesareexpectedtomakeup2.4%oftotalworldwidelight-duty vehicles sales. According to a NavigantResearchstudy,globalsalesforlightdutyelectricvehiclesis expected to increase from 2.7 million in 2014 to 6.4millionin2023,a10%CAGR.(6)
Thegrowth inconnectedcarsalongwith the increase inhybridandelectricvehicleswillcontinuetodrivesalesinthe automotive segment for Linear Technology. Thesenew capabilities and benefits will require addedelectronichardware,whichwillincludenumerousanalogsensors developed by analog IC manufacturers. Weexpect revenue’s for Linear Technology’s automobilesegmenttoincreaseatan8.7%CAGRinto2020.
$-
$0.50
$1.00
$1.50
$2.00
$2.50
2000
2001
2002
2003
2004
2005
2006
2007
2008
2009
2010
2011
2012
2013
2014
2015
DividendPaymentGrowth
EPS AnnualDividend/Share
3.8 4.9
25.0
0.0
5.0
10.0
15.0
20.0
25.0
30.0
2014 2015 2020*
Billion
sofAutom
obiles
NumberofConnectedAutomobilesWorldwide
Page5
InternetofThings
The Internetof Things (IoT) is anetworkofdevices thatcommunicate with one another sharing diagnostic dataand other measurements creating smart homes andeventually smart cities. The number of IoT connecteddevicesisexpectedtoincrease23.5%CAGRfrom2015to2020.Thenumberofdevicesisexpectedtoincreasefrom13.4 billion to 38.5 billion during those years. (7) Theindustrial sector, which includes agriculture, smartbuildings, and smart grid applications, will drive themajority of the growth. For example, John Deere isconnectingfarmmachineryandirrigationsystemstosoilnutrient sources with information on weather, cropprices, and commodity futures to optimize overall farmperformance. Aswell,Michelin isplacing sensors insidetiresthatcancoachtruckfleetdriverstodriveinamorefuel-efficientmanner.
Theincreaseinconnecteddeviceswillrequirenumerousanalogsensorstomeasuretheanalogworldandconvertit todigitaldata that caneasilybe transmittedbetweendevices. The Industrial segment is currently the largestsegment for LinearTechnology. With thegrowthof theIoT connecteddevicesweexpect the Industrial segmentto continue to be Linear Technology’s largest segmentandgrowata5.1%CAGRinto2020.
SmartphoneGrowth
WorldwideMobilePhoneShipments
Source:S&PNetAdvantage(9)
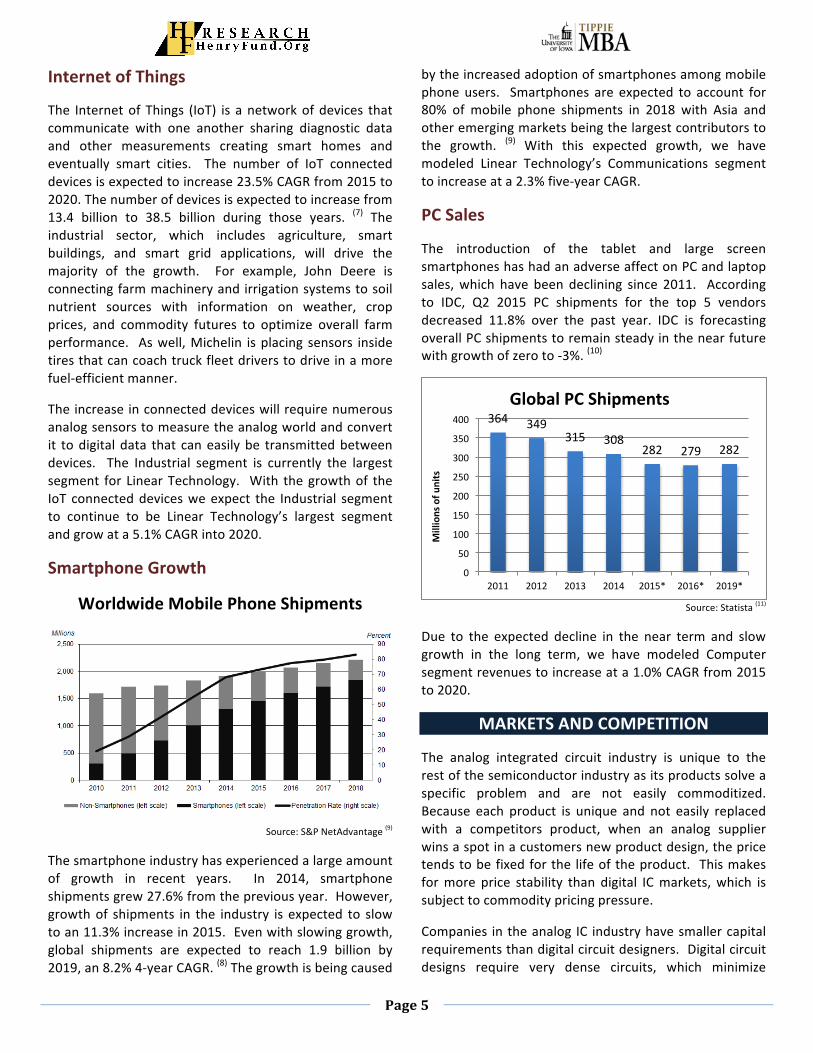
Thesmartphoneindustryhasexperiencedalargeamountof growth in recent years. In 2014, smartphoneshipmentsgrew27.6%fromthepreviousyear.However,growthof shipments in the industry is expected to slowtoan11.3%increasein2015.Evenwithslowinggrowth,global shipments are expected to reach 1.9 billion by2019,an8.2%4-yearCAGR.(8)Thegrowthisbeingcaused
bytheincreasedadoptionofsmartphonesamongmobilephoneusers. Smartphones are expected to account for80% of mobile phone shipments in 2018 with Asia andotheremergingmarketsbeingthelargestcontributorstothe growth. (9) With this expected growth, we havemodeled Linear Technology’s Communications segmenttoincreaseata2.3%five-yearCAGR.
PCSales
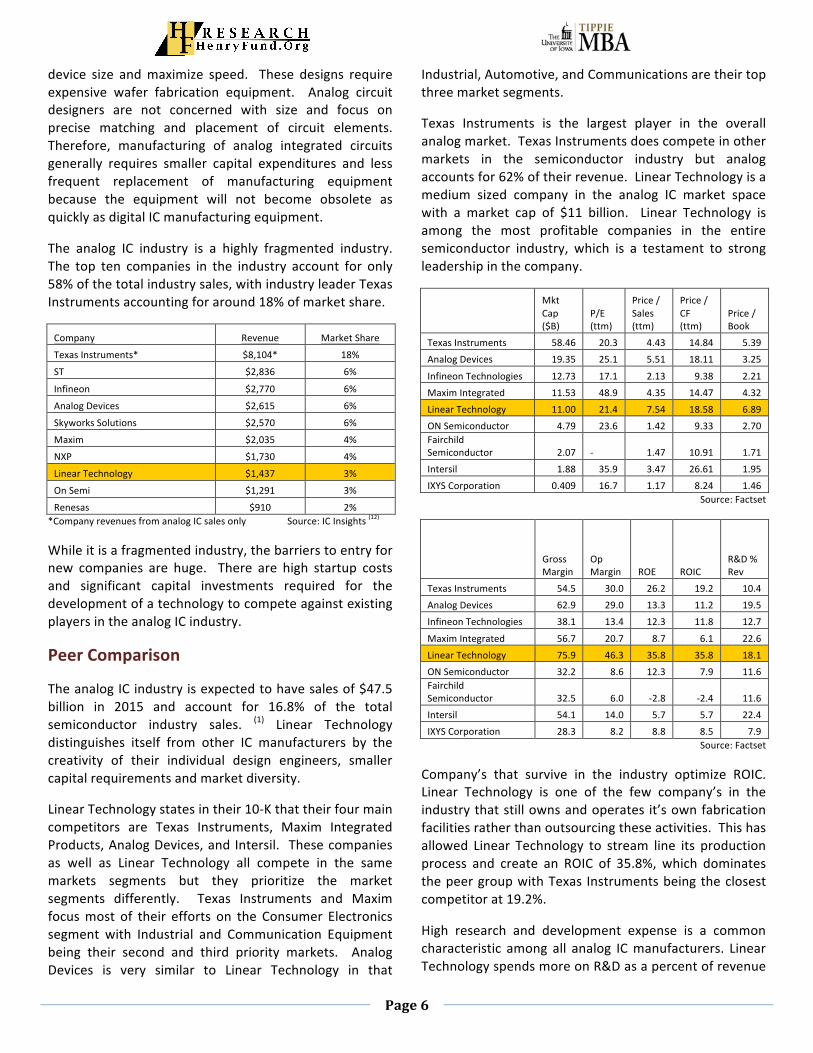
The introduction of the tablet and large screensmartphoneshashadanadverseaffectonPCandlaptopsales,which have been declining since 2011. Accordingto IDC, Q2 2015 PC shipments for the top 5 vendorsdecreased 11.8% over the past year. IDC is forecastingoverallPCshipmentstoremainsteadyinthenearfuturewithgrowthofzeroto-3%.(10)
Source:Statista(11)
Due to the expected decline in the near term and slowgrowth in the long term, we have modeled Computersegmentrevenuestoincreaseata1.0%CAGRfrom2015to2020.
MARKETSANDCOMPETITION
The analog integrated circuit industry is unique to therestofthesemiconductorindustryasitsproductssolveaspecific problem and are not easily commoditized.Because each product is unique and not easily replacedwith a competitors product, when an analog supplierwinsaspotinacustomersnewproductdesign,thepricetendstobefixedforthe lifeoftheproduct. Thismakesformore price stability than digital ICmarkets,which issubjecttocommoditypricingpressure.
Companies intheanalog IC industryhavesmallercapitalrequirementsthandigitalcircuitdesigners.Digitalcircuitdesigns require very dense circuits, which minimize
364 349315 308
282 279 282
0
50
100
150
200
250
300
350
400
2011 2012 2013 2014 2015* 2016* 2019*
Millionsofu
nits
GlobalPCShipments
Page6
device size andmaximize speed. These designs requireexpensive wafer fabrication equipment. Analog circuitdesigners are not concerned with size and focus onprecise matching and placement of circuit elements.Therefore, manufacturing of analog integrated circuitsgenerally requires smaller capital expenditures and lessfrequent replacement of manufacturing equipmentbecause the equipment will not become obsolete asquicklyasdigitalICmanufacturingequipment.
The analog IC industry is a highly fragmented industry.The top ten companies in the industry account for only58%ofthetotalindustrysales,withindustryleaderTexasInstrumentsaccountingforaround18%ofmarketshare.
Company Revenue MarketShare
TexasInstruments* $8,104* 18%
ST $2,836 6%
Infineon $2,770 6%
AnalogDevices $2,615 6%
SkyworksSolutions $2,570 6%
Maxim $2,035 4%
NXP $1,730 4%
LinearTechnology $1,437 3%
OnSemi $1,291 3%
Renesas $910 2%*CompanyrevenuesfromanalogICsalesonly Source:ICInsights(12)
Whileitisafragmentedindustry,thebarrierstoentryfornew companies are huge. There are high startup costsand significant capital investments required for thedevelopmentofatechnologytocompeteagainstexistingplayersintheanalogICindustry.
PeerComparison
TheanalogICindustryisexpectedtohavesalesof$47.5billion in 2015 and account for 16.8% of the totalsemiconductor industry sales. (1) Linear Technologydistinguishes itself from other IC manufacturers by thecreativity of their individual design engineers, smallercapitalrequirementsandmarketdiversity.
LinearTechnologystatesintheir10-Kthattheirfourmaincompetitors are Texas Instruments, Maxim IntegratedProducts,AnalogDevices,andIntersil. Thesecompaniesas well as Linear Technology all compete in the samemarkets segments but they prioritize the marketsegments differently. Texas Instruments and Maximfocusmost of their efforts on the Consumer Electronicssegment with Industrial and Communication Equipmentbeing their second and third priority markets. AnalogDevices is very similar to Linear Technology in that
Industrial,Automotive,andCommunicationsaretheirtopthreemarketsegments.
Texas Instruments is the largest player in the overallanalogmarket.TexasInstrumentsdoescompeteinothermarkets in the semiconductor industry but analogaccountsfor62%oftheirrevenue.LinearTechnologyisamedium sized company in the analog IC market spacewith a market cap of $11 billion. Linear Technology isamong the most profitable companies in the entiresemiconductor industry, which is a testament to strongleadershipinthecompany.
MktCap($B)
P/E(ttm)
Price/Sales(ttm)
Price/CF(ttm)
Price/Book
TexasInstruments 58.46 20.3 4.43 14.84 5.39
AnalogDevices 19.35 25.1 5.51 18.11 3.25
InfineonTechnologies 12.73 17.1 2.13 9.38 2.21
MaximIntegrated 11.53 48.9 4.35 14.47 4.32
LinearTechnology 11.00 21.4 7.54 18.58 6.89
ONSemiconductor 4.79 23.6 1.42 9.33 2.70FairchildSemiconductor 2.07 - 1.47 10.91 1.71
Intersil 1.88 35.9 3.47 26.61 1.95
IXYSCorporation 0.409 16.7 1.17 8.24 1.46Source:Factset
GrossMargin
OpMargin ROE ROIC
R&D%Rev
TexasInstruments 54.5 30.0 26.2 19.2 10.4
AnalogDevices 62.9 29.0 13.3 11.2 19.5
InfineonTechnologies 38.1 13.4 12.3 11.8 12.7
MaximIntegrated 56.7 20.7 8.7 6.1 22.6
LinearTechnology 75.9 46.3 35.8 35.8 18.1
ONSemiconductor 32.2 8.6 12.3 7.9 11.6FairchildSemiconductor 32.5 6.0 -2.8 -2.4 11.6
Intersil 54.1 14.0 5.7 5.7 22.4
IXYSCorporation 28.3 8.2 8.8 8.5 7.9Source:Factset
Company’s that survive in the industry optimize ROIC.Linear Technology is one of the few company’s in theindustrythatstillownsandoperates it’sownfabricationfacilitiesratherthanoutsourcingtheseactivities.Thishasallowed Linear Technology to stream line its productionprocess and create an ROIC of 35.8%, which dominatesthepeergroupwithTexas Instrumentsbeingtheclosestcompetitorat19.2%.
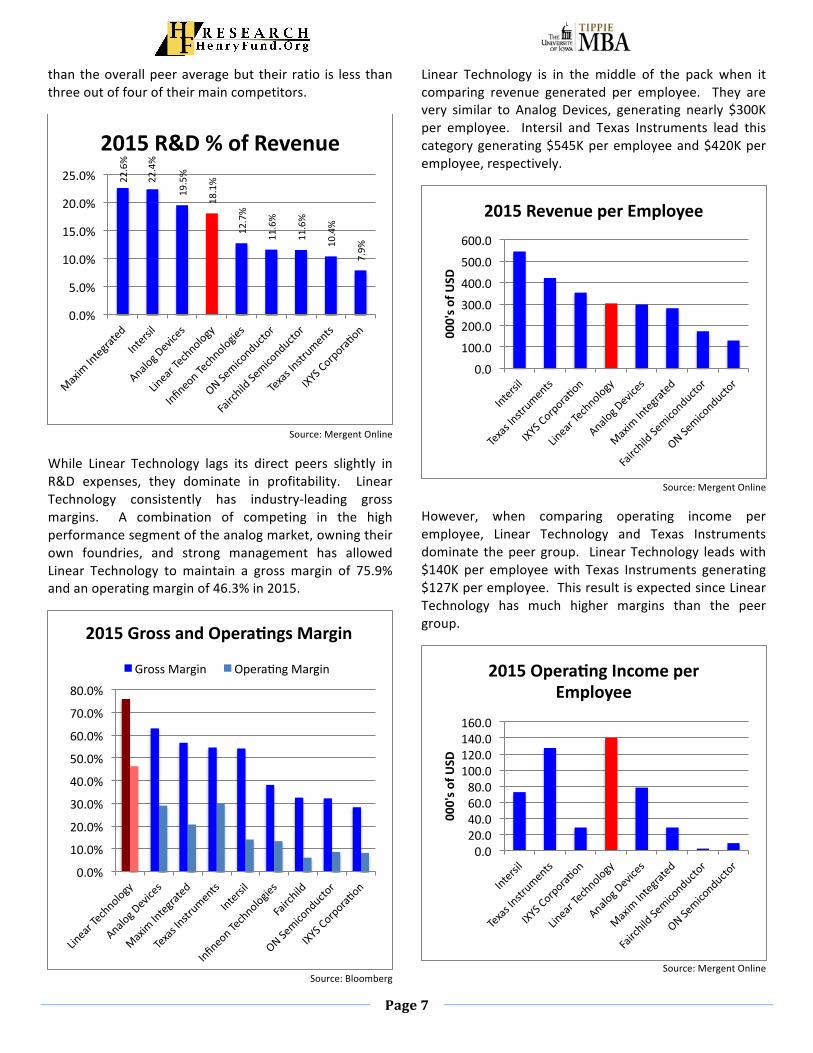
High research and development expense is a commoncharacteristic among all analog ICmanufacturers. LinearTechnologyspendsmoreonR&Dasapercentofrevenue
Page7
than theoverallpeeraveragebut their ratio is less thanthreeoutoffouroftheirmaincompetitors.
Source:MergentOnline
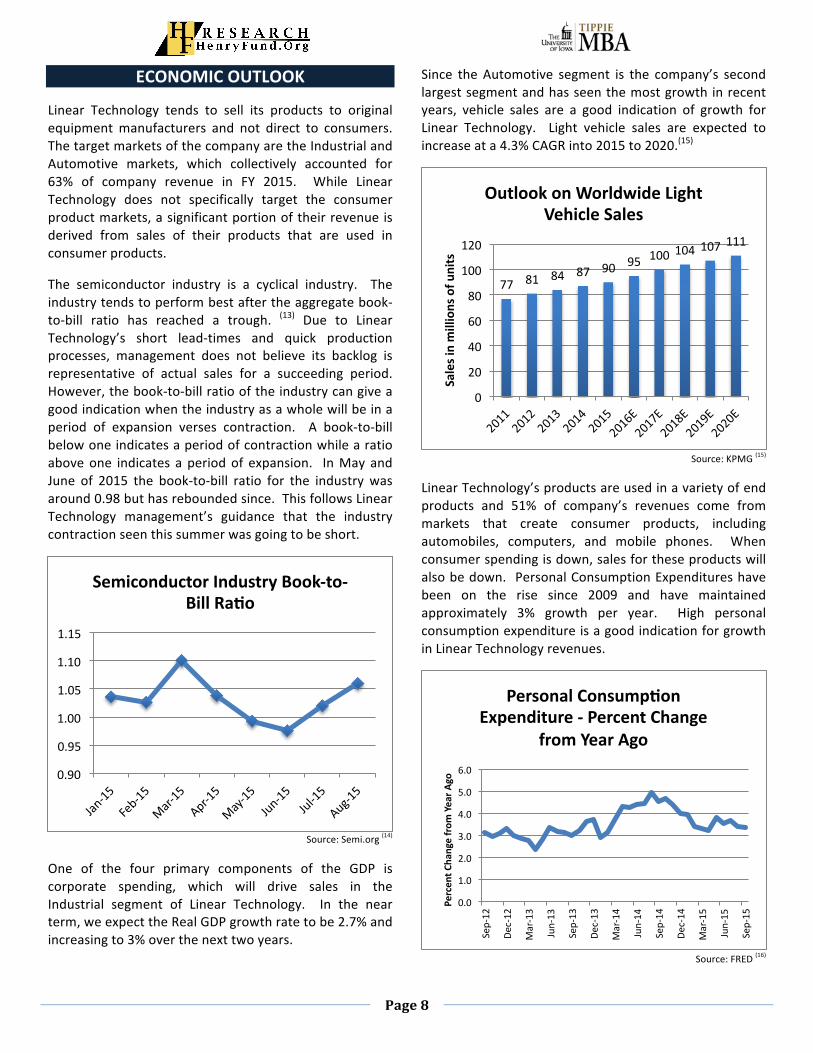
While Linear Technology lags its direct peers slightly inR&D expenses, they dominate in profitability. LinearTechnology consistently has industry-leading grossmargins. A combination of competing in the highperformancesegmentoftheanalogmarket,owningtheirown foundries, and strong management has allowedLinear Technology to maintain a gross margin of 75.9%andanoperatingmarginof46.3%in2015.
Source:Bloomberg
Linear Technology is in the middle of the pack when itcomparing revenue generated per employee. They arevery similar to Analog Devices, generating nearly $300Kper employee. Intersil and Texas Instruments lead thiscategorygenerating$545Kperemployeeand$420Kperemployee,respectively.
Source:MergentOnline
However, when comparing operating income peremployee, Linear Technology and Texas Instrumentsdominate thepeergroup. LinearTechnology leadswith$140K per employeewith Texas Instruments generating$127Kperemployee.ThisresultisexpectedsinceLinearTechnology has much higher margins than the peergroup.
Source:MergentOnline
22.6%
22.4%
19.5%
18.1%
12.7%
11.6%
11.6%
10.4%
7.9%
0.0%
5.0%
10.0%
15.0%
20.0%
25.0%
2015R&D%ofRevenue
0.0%
10.0%
20.0%
30.0%
40.0%
50.0%
60.0%
70.0%
80.0%
2015GrossandOperabngsMargin
GrossMargin OperamngMargin
0.0
100.0
200.0
300.0
400.0
500.0
600.0
000'sofUSD
2015RevenueperEmployee
0.020.040.060.080.0100.0120.0140.0160.0
000'sofUSD
2015OperabngIncomeperEmployee
Page8
ECONOMICOUTLOOK
Linear Technology tends to sell its products to originalequipmentmanufacturers and not direct to consumers.ThetargetmarketsofthecompanyaretheIndustrialandAutomotive markets, which collectively accounted for63% of company revenue in FY 2015. While LinearTechnology does not specifically target the consumerproductmarkets,asignificantportionoftheirrevenueisderived from sales of their products that are used inconsumerproducts.
The semiconductor industry is a cyclical industry. Theindustrytendstoperformbestaftertheaggregatebook-to-bill ratio has reached a trough. (13) Due to LinearTechnology’s short lead-times and quick productionprocesses, management does not believe its backlog isrepresentative of actual sales for a succeeding period.However,thebook-to-billratiooftheindustrycangiveagoodindicationwhentheindustryasawholewillbeinaperiod of expansion verses contraction. A book-to-billbelowoneindicatesaperiodofcontractionwhilearatioaboveone indicates a periodof expansion. InMayandJune of 2015 the book-to-bill ratio for the industry wasaround0.98buthasreboundedsince.ThisfollowsLinearTechnology management’s guidance that the industrycontractionseenthissummerwasgoingtobeshort.
Source:Semi.org(14)
One of the four primary components of the GDP iscorporate spending, which will drive sales in theIndustrial segment of Linear Technology. In the nearterm,weexpecttheRealGDPgrowthratetobe2.7%andincreasingto3%overthenexttwoyears.
Since the Automotive segment is the company’s secondlargestsegmentandhasseenthemostgrowthinrecentyears, vehicle sales are a good indication of growth forLinear Technology. Light vehicle sales are expected toincreaseata4.3%CAGRinto2015to2020.(15)
Source:KPMG(15)
LinearTechnology’sproductsareusedinavarietyofendproducts and 51% of company’s revenues come frommarkets that create consumer products, includingautomobiles, computers, and mobile phones. Whenconsumerspendingisdown,salesfortheseproductswillalsobedown. PersonalConsumptionExpenditureshavebeen on the rise since 2009 and have maintainedapproximately 3% growth per year. High personalconsumptionexpenditureisagoodindicationforgrowthinLinearTechnologyrevenues.
Source:FRED(16)
0.90
0.95
1.00
1.05
1.10
1.15
SemiconductorIndustryBook-to-BillRabo
77 81 84 87 90 95 100104 107
111
0
20
40
60
80
100
120
Salesinm
illionsofu
nits
OutlookonWorldwideLightVehicleSales
0.0
1.0
2.0
3.0
4.0
5.0
6.0
Sep-12
Dec-12
Mar-13
Jun-13
Sep-13
Dec-13
Mar-14
Jun-14
Sep-14
Dec-14
Mar-15
Jun-15
Sep-15Pe
rcen
tCha
ngefrom
YearAgo
PersonalConsumpbonExpenditure-PercentChange
fromYearAgo

Page9
CATALYSTSFORGROWTH
IncreasingPresenceinAutomotiveMarket
Thepredictedgrowthintheautomotivemarketpresentsa significant growth opportunity for Linear Technology.The company currently has a strong presence in theautomotive market but with the expected surge in carelectronicsandupturnindemandforhybridandelectricvehicles,LinearTechnologycouldgainsignificantrevenuegrowth by increasing its presence in the automotivemarket.
RetainingKeyEmployees
Intheir2015annualreport,LinearTechnologystatesthatone characteristic that distinguishes them fromcompetitors is the creativity of individual designengineers. They require engineers skilled in the art andscience of analog circuit design. Engineers requirenumerous years of experience to become proficient atanalog design. In FY2015, the company had 1,289employees involved in research, development, andengineering related functions. Nearly 30% of theiremployeepopulation is involved in newproduct design.In order to continue to grow their product portfolio,Linear Technology must retain key design engineers aswell as recruit and develop new talent within theorganization.
INVESTMENTPOSITIVES
• LinearTechnologyhashistoricallyhadstrongcashflowgenerationwitha longhistoryofreturningvaluetoshareholders throughbothdividendpaymentsandstockrepurchases.
• Linear Technology has no debt on their balancesheet and has a high level of liquidity based on theirextremelyhighcurrentratioof8.4in2015.
• Linear Technology is a lean and well runcompany. They have industry leading gross margins,operatingmargins,andROE.
INVESTMENTNEGATIVES
• 85% of Linear Technology’s manufacturing islocated inCaliforniaandWashington. California is in itsfourth year of drought. The fabrication processconsumes a significant amount ofwater. The companycould see rate increases or mandatory reductions in
water usage, which could affect production output orincreasecostofgoodssold. An increase inCOGSwouldimpact operating margin if they were not able to passalongapriceincreasetocustomers.
• Thestockpricehasincreasedapproximately11%sincewebegancoverageonLinearTechnology.Becauseof the significant increase inprice, the stockhas limitedupside.
VALUATION
We used a Discounted Cash Flow (DCF), DividendDiscount Model (DDM), and Relative Price to Earnings(P/E) analysis to value Linear Technology. Through thevaluation process we calculated a stock price range of$45to$49forthecompany.
Linear Technology generates revenue through sixdifferent segments. The Computer segment is decliningdue to increased adoptionof large screen smartphones.TheMilitary/HarshEnvironmentsegment isgoing toseelimited growth due to decreased government spending.Theconsumersegmentisnotamarketthatthecompanyattempts to generate growth in. The main revenuegenerators for the company are the Industrial,Automotive, and Communications segment. Togetherthesethreesegmentshaveaccountedformorethan75%of company revenue since 2011 and 82% of companyrevenue in 2015 so we have focused our valuation onthesesegments.
WeexpectsignificantgrowthintheAutomotivesegmentdue to an increase in the amount of electronics in carsfrom growing popularity in Hybrid and Electric vehiclesand the increasing connectivity of cars. We expectrevenues for the Automotive segment to increase at an8.7% five-year CAGR and account for 24% of companyrevenuein2020.DuetothenumberofInternetofThingsconnected devices we expect the Industrial segment togrow at a 5.1% CAGR into 2020 and still be the largestrevenue generating segment at 44%of overall companyrevenue. We expect the Communications segment toincrease at a 2.3% five-year CAGR due to the increaseadoptionof smartphones. Withslowergrowth than theIndustrial and Automotive segments, we expect theCommunications segmentpercentageofoverall revenueto shrink from19% in2015 to17% in2020. Weexpectthese three segments to increase from82%of companyrevenuein2015to85%ofrevenuein2020.Overall,wehavemodeled total company revenues to increase at a4.7%CAGRfrom2015to2020.

Page10
Thegrossprofitmarginforthecompanyhasconsistentlybeen above 74% since 2003. In 2015, gross profit was75.9%ofrevenue.Wehavemodeledgrossprofitmarginstodropslightlyin2016to75.0%andthenmaintain75.5%into2020.
R&D expenses for Linear Technology have averagedaround18.2%ofrevenuethelastthreeyears.Weexpectthis trend to continueandhavemodeledR&Dexpensesof18.3%ofrevenuethrough2020. SG&Aexpensesasapercent of revenue averaged 11.6% from 2013 through2015.WebelievethislevelofexpensewillcontinueandhavemodeledSG&Aexpensesof11.7%ofrevenuefrom2016to2020.
The company has consistently had net profit marginsabove30%since themid-1990s. In2015, thenetprofitmargin was 35.3%. We have modeled the net profitmargin to decrease to 33.0% in 2016 with net profitmarginsmaintainingapproximately33.3%into2020.
Source:LinearTechnology201510-K
We have estimated earnings per share to be $1.97 in2016 and $2.17 in 2017 before increasing to $2.64 in2020. The 2016 and 2017 EPS estimates are aboveconsensus analyst estimates of $1.93 and $2.14,respectfully.OurEPSestimatesaremoreoptimisticthanconsensus analyst because we believe analysts areforecasting the current industrydownturn to last longerthan expected. We have followed management’sguidance in our assumption and feel sales will begin topickbackuptheremainderofFY2016.
Source:FactSet
In years of slow growth, Linear Technology hashistorically limited capital expenditures. We areexpectingrevenuestodecline2.1%in2016andthereforewearepredictingcapitalexpenditurestoincreasebyonly$28.8million, 2.8% growth, in 2016. In 2017, we havemodeled revenues to increase by 8.2% from 2016 andthereforehavemodeledcapitalexpendituresto increaseby 6.4%, which is in line with historic growth rates.Overall,wehavemodeledcapitalexpenditurestogrowata5.7%CAGRinto2020.
Aspreviously stated,wevalued LinearTechnologyusingDCF, DDM, and relative P/E analysis using the aboveassumptions. The DCF model computed a price of$46.92, the DDM model computed a stock price of$47.83,andtherelativeP/Eanalysiscomputedapriceof$41.03.
We did not agreewith the relative P/E analysis. LinearTechnology has a similar P/E ratio as nearly all of itspeers. However, LinearTechnologyhas industry leadingmarginsandshould tradeatapremiumcompared to itspeers. We do not believe themarket accurately valuestheprofitabilityofLinearTechnology.
TheDDMmodelcomputedapriceof$47.83andverifiesour DCF model price. Linear Technology has a longhistory of dividend payments and fairly consistentdividend growth and consistent dividend payout ratio.The company maintains approximately a 55% dividendpayoutratioeachyear.Wemodeledanaveragedividendpayoutratioofaround59%forthenextfiveyears.
0.00%10.00%20.00%30.00%40.00%50.00%60.00%70.00%80.00%90.00%
2009
2010
2011
2012
2013
2014
2015
2016E
2017E
2018E
2019E
2020E
ProfitMargins
GrossProfitMargin NetProfitMargin
$1.50$1.60$1.70$1.80$1.90$2.00$2.10$2.20$2.30$2.40$2.50
2012 2013 2014 2015 2016E 2017E 2018E
LinearTechnologyEPSEsbmate
AnalystHighEst. AnalystLowEst. HenryFundEst.
Page11
Source:MergentOnline
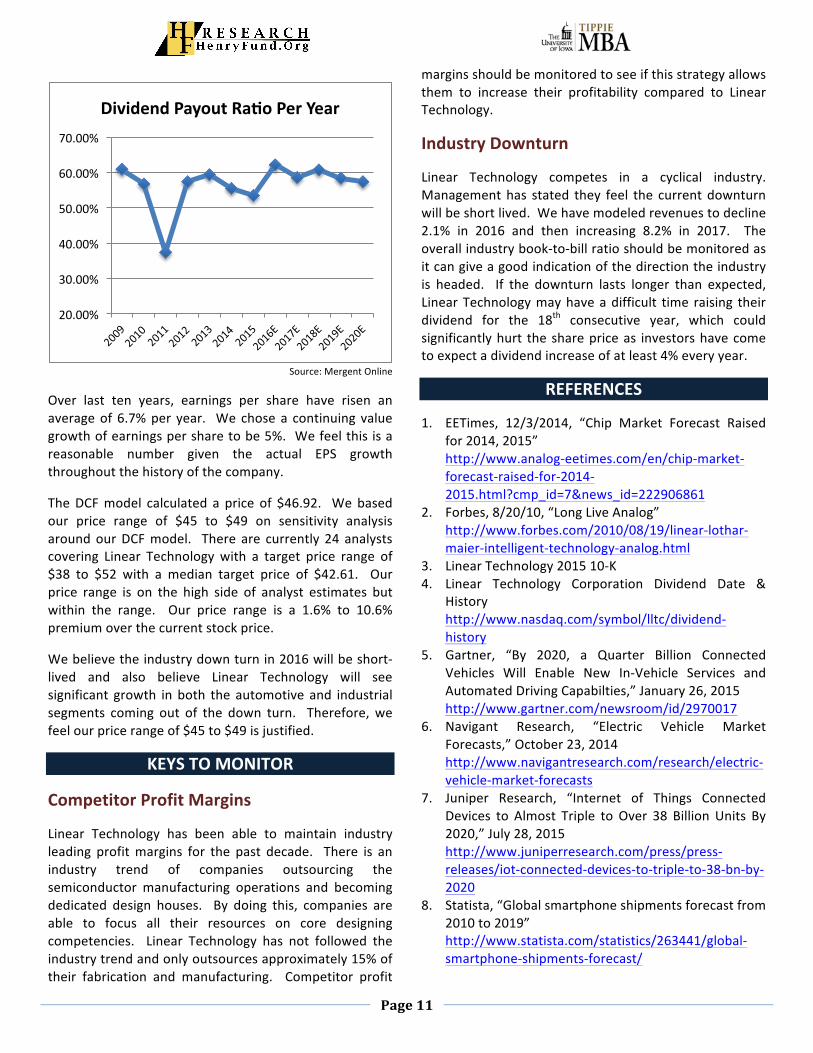
Over last ten years, earnings per share have risen anaverageof6.7%per year. Wechosea continuing valuegrowthofearningspersharetobe5%.Wefeelthisisareasonable number given the actual EPS growththroughoutthehistoryofthecompany.
TheDCFmodel calculated a price of $46.92. Webasedour price range of $45 to $49 on sensitivity analysisaroundourDCFmodel. There are currently 24 analystscovering Linear Technologywith a target price range of$38 to $52 with a median target price of $42.61. Ourprice range is on the high side of analyst estimates butwithin the range. Our price range is a 1.6% to 10.6%premiumoverthecurrentstockprice.
Webelievetheindustrydownturnin2016willbeshort-lived and also believe Linear Technology will seesignificant growth inboth the automotive and industrialsegments coming out of the down turn. Therefore,wefeelourpricerangeof$45to$49isjustified.
KEYSTOMONITOR
CompetitorProfitMargins
Linear Technology has been able to maintain industryleading profitmargins for the past decade. There is anindustry trend of companies outsourcing thesemiconductor manufacturing operations and becomingdedicated design houses. By doing this, companies areable to focus all their resources on core designingcompetencies. Linear Technology has not followed theindustrytrendandonlyoutsourcesapproximately15%oftheir fabrication and manufacturing. Competitor profit
marginsshouldbemonitoredtoseeifthisstrategyallowsthem to increase their profitability compared to LinearTechnology.
IndustryDownturn
Linear Technology competes in a cyclical industry.Managementhas stated they feel the currentdownturnwillbeshortlived.Wehavemodeledrevenuestodecline2.1% in 2016 and then increasing 8.2% in 2017. Theoverallindustrybook-to-billratioshouldbemonitoredasitcangiveagoodindicationofthedirectiontheindustryis headed. If the downturn lasts longer than expected,LinearTechnologymayhaveadifficult time raising theirdividend for the 18th consecutive year, which couldsignificantlyhurt thesharepriceas investorshavecometoexpectadividendincreaseofatleast4%everyyear.
REFERENCES
1. EETimes, 12/3/2014, “Chip Market Forecast Raisedfor2014,2015”http://www.analog-eetimes.com/en/chip-market-forecast-raised-for-2014-2015.html?cmp_id=7&news_id=222906861
2. Forbes,8/20/10,“LongLiveAnalog”http://www.forbes.com/2010/08/19/linear-lothar-maier-intelligent-technology-analog.html
3. LinearTechnology201510-K4. Linear Technology Corporation Dividend Date &
Historyhttp://www.nasdaq.com/symbol/lltc/dividend-history
5. Gartner, “By 2020, a Quarter Billion ConnectedVehicles Will Enable New In-Vehicle Services andAutomatedDrivingCapabilties,”January26,2015http://www.gartner.com/newsroom/id/2970017
6. Navigant Research, “Electric Vehicle MarketForecasts,”October23,2014http://www.navigantresearch.com/research/electric-vehicle-market-forecasts
7. Juniper Research, “Internet of Things ConnectedDevices to Almost Triple to Over 38 Billion Units By2020,”July28,2015http://www.juniperresearch.com/press/press-releases/iot-connected-devices-to-triple-to-38-bn-by-2020
8. Statista,“Globalsmartphoneshipmentsforecastfrom2010to2019”http://www.statista.com/statistics/263441/global-smartphone-shipments-forecast/
20.00%
30.00%
40.00%
50.00%
60.00%
70.00%
DividendPayoutRaboPerYear

LinearTechnologyIncorporatedRevenueDecomposition
FiscalYearsEnding30-Jun 2013 2014 2015 2016E 2017E 2018E 2019E 2020E
Industrial 538,539 597,006 634,310 615280 664503 684438 773415 812086Automotive 217,980 263,793 295,028 309779 350050 367553 430037 447239Communications 269,270 277,677 280,276 269065 287900 290779 302410 314506Computer 141,046 124,955 132,763 124797 128541 131111 135045 139096Military/HarshEnvironment 76,934 83,303 88,508 83198 87358 88231 90878 93605Consumer 38,467 41,652 44,254 41599 43263 43696 45006 46357TotalRevenue 1,282,236 1,388,386 1,475,139 1,443,719 1,561,615 1,605,808 1,776,791 1,852,888
Industrial 42.00% 43.00% 43.00% 42.62% 42.55% 42.62% 43.53% 43.83%Automotive 17.00% 19.00% 20.00% 21.46% 22.42% 22.89% 24.20% 24.14%Communications 21.00% 20.00% 19.00% 18.64% 18.44% 18.11% 17.02% 16.97%Computer 11.00% 9.00% 9.00% 8.64% 8.23% 8.16% 7.60% 7.51%Military/HarshEnvironment 6.00% 6.00% 6.00% 5.76% 5.59% 5.49% 5.11% 5.05%Consumer 3.00% 3.00% 3.00% 2.88% 2.77% 2.72% 2.53% 2.50%%TotalRevenue 100.00% 100.00% 100.00% 100.00% 100.00% 100.00% 100.00% 100.00%
Industrial 3.70% 10.86% 6.25% -3.00% 8.00% 3.00% 13.00% 5.00%Automotive 7.56% 21.02% 11.84% 5.00% 13.00% 5.00% 17.00% 4.00%Communications -3.37% 3.12% 0.94% -4.00% 7.00% 1.00% 4.00% 4.00%Computer -7.20% -11.41% 6.25% -6.00% 3.00% 2.00% 3.00% 3.00%Military/HarshEnvironment 1.23% 8.28% 6.25% -6.00% 5.00% 1.00% 3.00% 3.00%Consumer 1.23% 8.28% 6.25% -6.00% 4.00% 1.00% 3.00% 3.00%TotalRevenueGrowthRate 1.23% 8.28% 6.25% -2.13% 8.17% 2.83% 10.65% 4.28%
TotalGrossProfit 959,720 1,049,806 1,119,412 1,082,789 1,179,019 1,212,385 1,341,478 1,398,930TotalGrossProfitMargin 74.85% 75.61% 75.89% 75.00% 75.50% 75.50% 75.50% 75.50%
DomesticRevenue% 28.8% 27.2% 27.7% 27.9% 27.9% 27.9% 27.9% 27.9%InternationalRevenue% 71.2% 72.8% 72.3% 72.1% 72.1% 72.1% 72.1% 72.1%
LinearTechnologyIncorporatedIncomeStatement
FiscalYearsEnding30-Jun 2013 2014 2015 2016E 2017E 2018E 2019E 2020ERevenues 1,282,236 1,388,386 1,475,139 1,443,719 1,561,615 1,605,808 1,776,791 1,852,888Cost of sales 267,150 287,325 301,629 312,258 333,095 341,334 381,083 395,640Depreciation & Amortization 55,366 51,255 54,098 48,672 49,500 52,089 54,231 58,318Gross profit (loss) 959,720 1,049,806 1,119,412 1,082,789 1,179,019 1,212,385 1,341,478 1,398,930
Research & development expenses 235,184 250,434 266,761 263,479 284,995 293,060 324,264 338,152Selling, general & administrative expenses 151,382 159,642 169,952 169,637 183,490 188,682 208,773 217,714Restructuring charges 0 0 0 0 0 0 0 0Total operating expenses 386,566 410,076 436,713 433,116 468,484 481,742 533,037 555,866
Operating income (loss) 573,154 639,730 682,699 649,673 710,535 730,643 808,440 843,064
Interest income 4,070 2,706 2,690 3,608 4,038 4,269 4,592 4,819Interest expense -48,343 -41,168 0 0 0 0 0 0Acquisition related costs 0 0 0 0 0 0 0 0(Loss) gain on early retirement of convertible senior notes 0 0 0 0 0 0 0 0Total other income (expense), net -44,273 -38,462 2,690 3,608 4,038 4,269 4,592 4,819
Income (loss) before income taxes 528,881 601,268 685,389 653,282 714,573 734,912 813,032 847,883Provision (benefit) for income taxes 121,956 141,307 164,426 177,336 193,974 199,495 220,701 230,162
Net income (loss) 406,925 459,961 520,963 475,945 520,599 535,416 592,331 617,721
Year end shares outstanding 233,025 239,096 242,751 240,975 238,901 236,992 234,799 232,781Weighted average shares outstanding-basic 236,703 240,498 244,408 241,863 239,938 237,946 235,895 233,790Net earnings (loss) per share-basic 1.72 1.91 2.13 1.97 2.17 2.25 2.51 2.64
Cash dividends per share 1.02 1.06 1.14 1.22 1.30 1.38 1.46 1.54
LinearTechnologyIncorporatedBalanceSheet
FiscalYearsEnding30-Jun 2013 2014 2015 2016E 2017E 2018E 2019E 2020EASSETSCash & cash equivalents 126,650 157,323 195,679 308,809 349,442 414,123 433,981 460,866Marketable securitites 1,398,091 855,464 1,007,043 1,037,254 1,073,558 1,116,501 1,172,326 1,236,803
Accounts receivable, gross 147,165 174,993 180,915 176,278 196,763 202,332 223,876 233,464Allowance for doubtful accounts 1,891 1,653 1,651 1,763 1,968 2,023 2,239 2,335Accounts receivable, net 145,274 173,340 179,264 174,515 194,796 200,309 221,637 231,129
Total inventories 87,229 91,310 99,861 96,729 104,628 107,589 119,045 124,143
Prepaid expenses & other current assets 36,646 40,982 54,412 53,418 57,780 59,415 65,741 68,557
Total current assets 1,793,890 1,318,419 1,536,259 1,670,725 1,780,204 1,897,936 2,012,729 2,121,499
Gross property, plant & equipment 921,273 953,745 1,010,260 1,039,134 1,106,284 1,152,852 1,241,692 1,334,336Accumulated depreciation 632,807 676,665 722,518 768,990 816,790 867,679 920,710 977,828Net property, plant & equipment 288,466 277,080 287,742 270,144 289,494 285,173 320,981 356,508
Goodwill 2,200 2,200 2,200 2,200 2,200 2,200 2,200 2,200Identified intangible assets, net 13,785 11,585 9,385 7,185 5,485 4,285 3,085 1,885Other non current assets 0 0 0 0 0 0 0 0
Total assets 2,098,341 1,609,284 1,835,586 1,950,255 2,077,383 2,189,594 2,338,996 2,482,092
LIABILITIES AND STOCKHOLDERS' EQUITYLiabilities:Accounts payable 10,258 28,221 17,608 17,769 19,220 19,764 21,868 22,805Accrued payroll & related benefits 77,659 88,326 98,498 94,318 102,020 104,907 116,078 121,049Deferred income on shipments to distributors 44,088 45,619 46,860 47,643 51,533 52,992 58,634 61,145Income taxes payable 12,834 41,731 5,822 17,734 19,397 19,950 22,070 23,016Other accrued liabilities 18,933 11,218 14,130 14,437 15,616 16,058 17,768 18,529Convertible senior notes - current portion 826,629 0 0 0 0 0 0 0
Total current liabilities 990,401 215,115 182,918 191,901 207,787 213,671 236,418 246,544
Total Deferred Taxes (Liabilities - Assets) 83,505 21,705 37,119 53,201 58,192 59,849 66,210 69,049
Convertible senior notes 0 0 0 0 0 0 0 0Other long-term liabilities 42,527 41,095 37,622 36,493 35,399 34,337 33,306 32,307
Total Liabilities 1,116,433 277,915 257,659 281,595 301,378 307,856 335,935 347,900
Stockholders' Equity:Common stock and Additional Paid in Capital 1,736,729 1,948,006 2,052,490 2,063,434 2,063,449 2,063,449 2,063,449 2,063,449Accumulated other comprehensive income (loss), net of tax -266 355 561 561 561 561 561 561Retained earnings (accumulated deficit) -754,555 -616,992 -475,124 -395,335 -288,005 -182,271 -60,949 70,182
Total stockholders' equity (deficit) 981,908 1,331,369 1,577,927 1,668,660 1,776,005 1,881,739 2,003,061 2,134,192
TotalLiabilitesandStockholders'Equity 2,098,341 1,609,284 1,835,586 1,950,255 2,077,383 2,189,594 2,338,996 2,482,092
LinearTechnologyIncorporatedCashFlowStatement
FiscalYearsEnding30-Jun 2011 2012 2013 2014 2015Cash flows from operating activities:Net income (loss) 580,782 398,111 406,925 459,961 520,963Depreciation & amortization 50,137 55,934 55,366 51,255 54,098Stock-based compensation 69,221 61,225 63,865 65,128 72,131Amortization of convertible senior notes discount 21,675 19,868 21,029 18,458 0Excess tax benefit from stock-based compensation 5,110 -2,575 -521 -11,038 -15,190Loss (gain) on early retirement of convertible senior notes 0 0 0 0 0Accounts receivable 7,237 17,290 7,816 -28,066 -5,924Inventories -18,151 -5,965 -7,565 -4,081 -8,551Prepaid expenses, other current assets & deferred tax assets -6,344 12,001 -2,159 1,464 -3,816Long-term assets 11,819 4,581 1,426 0 0Accounts payable, accrued payroll & other accrued liabilities -52,210 -22,330 -4,206 21,038 -1,496Deferred income on shipments to distributors 13,887 -6,254 2,755 1,531 1,241Income taxes payable -12,228 33,333 19,203 20,777 -14,537Long-term liabilities 0 0 0 0 0Net cash flows from operating activities 670,935 565,219 563,934 596,427 598,919
Cash flows from investing activities:Purchase of marketable securities -805,146 -1,046,120 -1,181,592 -1,496,652 -886,222Proceeds from sales & maturities of available-for-sale securities 813,568 707,791 772,968 2,039,216 734,961Acquisition of Dust Networks, net of cash assumed 0 -23,365 0 0 0Purchase of property, plant & equipment -120,415 -35,731 -17,640 -37,669 -62,560Net cash flows from investing activities -111,993 -397,425 -426,264 504,895 -213,821
Cash flows from financing activities:Retirement of convertible senior notes -395,830 0 0 -845,087 0Excess tax benefit from stock-based compensation 0 0 0 11,038 15,190Issuance of common stock under employee stock plans 66,932 79,650 102,590 100,491 40,712Purchase of common stock -38,173 -76,066 -85,699 -81,786 -124,240Payment of cash dividends -217,202 -228,483 -241,329 -255,305 -278,404Net cash flows from financing activities -584,273 -224,899 -224,438 -1,070,649 -346,742
Increase (decrease) in cash & cash equivalents -25,331 -57,105 -86,768 30,673 38,356
Cash & cash equivalents, beginning of year 295,854 270,523 213,418 126,650 157,323Cash & cash equivalents, end of year 270,523 213,418 126,650 157,323 195,679Cash paid for income taxes 189,575 91,315 99,720 119,797 186,920Cash paid for interest expense 32,334 25,831 25,485 21,127 0
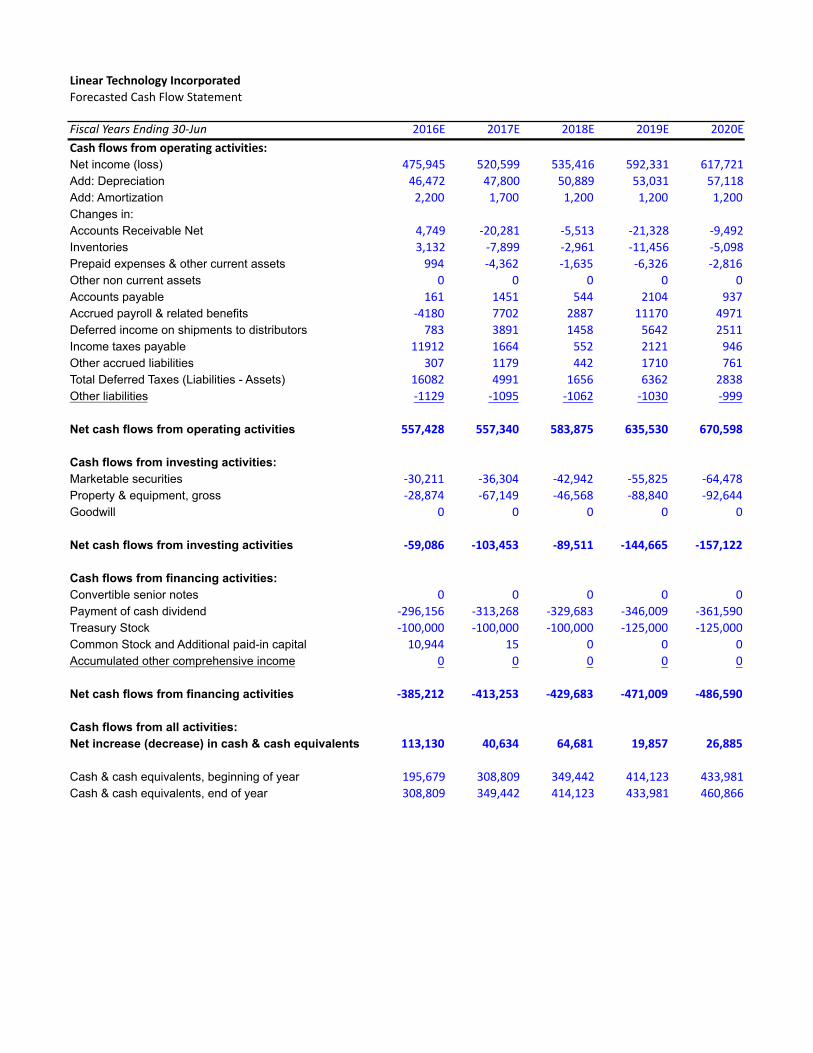
LinearTechnologyIncorporatedForecastedCashFlowStatement
FiscalYearsEnding30-Jun 2016E 2017E 2018E 2019E 2020E
Cashflowsfromoperatingactivities:Net income (loss) 475,945 520,599 535,416 592,331 617,721Add: Depreciation 46,472 47,800 50,889 53,031 57,118Add: Amortization 2,200 1,700 1,200 1,200 1,200Changes in:Accounts Receivable Net 4,749 -20,281 -5,513 -21,328 -9,492Inventories 3,132 -7,899 -2,961 -11,456 -5,098Prepaid expenses & other current assets 994 -4,362 -1,635 -6,326 -2,816Other non current assets 0 0 0 0 0Accounts payable 161 1451 544 2104 937Accrued payroll & related benefits -4180 7702 2887 11170 4971Deferred income on shipments to distributors 783 3891 1458 5642 2511Income taxes payable 11912 1664 552 2121 946Other accrued liabilities 307 1179 442 1710 761Total Deferred Taxes (Liabilities - Assets) 16082 4991 1656 6362 2838Other liabilities -1129 -1095 -1062 -1030 -999
Net cash flows from operating activities 557,428 557,340 583,875 635,530 670,598
Cash flows from investing activities:Marketable securities -30,211 -36,304 -42,942 -55,825 -64,478Property & equipment, gross -28,874 -67,149 -46,568 -88,840 -92,644Goodwill 0 0 0 0 0
Net cash flows from investing activities -59,086 -103,453 -89,511 -144,665 -157,122
Cash flows from financing activities:Convertible senior notes 0 0 0 0 0Payment of cash dividend -296,156 -313,268 -329,683 -346,009 -361,590Treasury Stock -100,000 -100,000 -100,000 -125,000 -125,000Common Stock and Additional paid-in capital 10,944 15 0 0 0Accumulated other comprehensive income 0 0 0 0 0
Net cash flows from financing activities -385,212 -413,253 -429,683 -471,009 -486,590
Cash flows from all activities:Net increase (decrease) in cash & cash equivalents 113,130 40,634 64,681 19,857 26,885
Cash & cash equivalents, beginning of year 195,679 308,809 349,442 414,123 433,981Cash & cash equivalents, end of year 308,809 349,442 414,123 433,981 460,866

LinearTechnologyIncorporatedCommonSizeIncomeStatement
FiscalYearsEnding30-Jun 2013 2014 2015 2016E 2017E 2018E 2019E 2020E
Revenues 100.00% 100.00% 100.00% 100.00% 100.00% 100.00% 100.00% 100.00%Cost of sales 20.83% 20.69% 20.45% 21.63% 21.33% 21.26% 21.45% 21.35%Depreciation & Amortization 4.32% 3.69% 3.67% 3.37% 3.17% 3.24% 3.05% 3.15%Gross profit (loss) 74.85% 75.61% 75.89% 75.00% 75.50% 75.50% 75.50% 75.50%
Research & development expenses 18.34% 18.04% 18.08% 18.25% 18.25% 18.25% 18.25% 18.25%Selling, general & administrative expenses 11.81% 11.50% 11.52% 11.75% 11.75% 11.75% 11.75% 11.75%Restructuring charges 0.00% 0.00% 0.00% 0.00% 0.00% 0.00% 0.00% 0.00%Total operating expenses 30.15% 29.54% 29.60% 30.00% 30.00% 30.00% 30.00% 30.00%
Operating income (loss) 44.70% 46.08% 46.28% 45.00% 45.50% 45.50% 45.50% 45.50%
Interest income 0.32% 0.19% 0.18% 0.25% 0.26% 0.27% 0.26% 0.26%Interest expense -3.77% -2.97% 0.00% 0.00% 0.00% 0.00% 0.00% 0.00%Acquisition related costs 0.00% 0.00% 0.00% 0.00% 0.00% 0.00% 0.00% 0.00%(Loss) gain on early retirement of convertible senior notes 0.00% 0.00% 0.00% 0.00% 0.00% 0.00% 0.00% 0.00%Total other income (expense), net -3.45% -2.77% 0.18% 0.25% 0.26% 0.27% 0.26% 0.26%
Provision (benefit) for income taxes 9.51% 10.18% 11.15% 12.28% 12.42% 12.42% 12.42% 12.42%
Net income (loss) 31.74% 33.13% 35.32% 32.97% 33.34% 33.34% 33.34% 33.34%
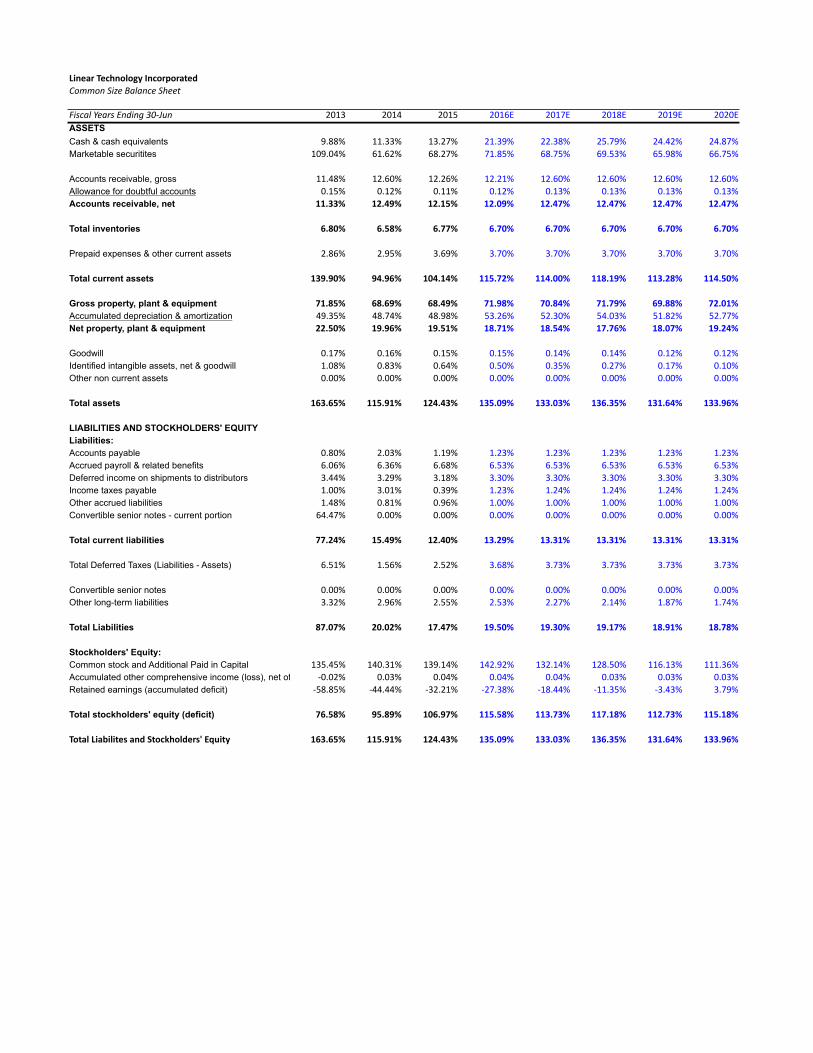
LinearTechnologyIncorporatedCommonSizeBalanceSheet
FiscalYearsEnding30-Jun 2013 2014 2015 2016E 2017E 2018E 2019E 2020EASSETSCash & cash equivalents 9.88% 11.33% 13.27% 21.39% 22.38% 25.79% 24.42% 24.87%Marketable securitites 109.04% 61.62% 68.27% 71.85% 68.75% 69.53% 65.98% 66.75%
Accounts receivable, gross 11.48% 12.60% 12.26% 12.21% 12.60% 12.60% 12.60% 12.60%Allowance for doubtful accounts 0.15% 0.12% 0.11% 0.12% 0.13% 0.13% 0.13% 0.13%Accounts receivable, net 11.33% 12.49% 12.15% 12.09% 12.47% 12.47% 12.47% 12.47%
Total inventories 6.80% 6.58% 6.77% 6.70% 6.70% 6.70% 6.70% 6.70%
Prepaid expenses & other current assets 2.86% 2.95% 3.69% 3.70% 3.70% 3.70% 3.70% 3.70%
Total current assets 139.90% 94.96% 104.14% 115.72% 114.00% 118.19% 113.28% 114.50%
Gross property, plant & equipment 71.85% 68.69% 68.49% 71.98% 70.84% 71.79% 69.88% 72.01%Accumulated depreciation & amortization 49.35% 48.74% 48.98% 53.26% 52.30% 54.03% 51.82% 52.77%Net property, plant & equipment 22.50% 19.96% 19.51% 18.71% 18.54% 17.76% 18.07% 19.24%
Goodwill 0.17% 0.16% 0.15% 0.15% 0.14% 0.14% 0.12% 0.12%Identified intangible assets, net & goodwill 1.08% 0.83% 0.64% 0.50% 0.35% 0.27% 0.17% 0.10%Other non current assets 0.00% 0.00% 0.00% 0.00% 0.00% 0.00% 0.00% 0.00%
Total assets 163.65% 115.91% 124.43% 135.09% 133.03% 136.35% 131.64% 133.96%
LIABILITIES AND STOCKHOLDERS' EQUITYLiabilities:Accounts payable 0.80% 2.03% 1.19% 1.23% 1.23% 1.23% 1.23% 1.23%Accrued payroll & related benefits 6.06% 6.36% 6.68% 6.53% 6.53% 6.53% 6.53% 6.53%Deferred income on shipments to distributors 3.44% 3.29% 3.18% 3.30% 3.30% 3.30% 3.30% 3.30%Income taxes payable 1.00% 3.01% 0.39% 1.23% 1.24% 1.24% 1.24% 1.24%Other accrued liabilities 1.48% 0.81% 0.96% 1.00% 1.00% 1.00% 1.00% 1.00%Convertible senior notes - current portion 64.47% 0.00% 0.00% 0.00% 0.00% 0.00% 0.00% 0.00%
Total current liabilities 77.24% 15.49% 12.40% 13.29% 13.31% 13.31% 13.31% 13.31%
Total Deferred Taxes (Liabilities - Assets) 6.51% 1.56% 2.52% 3.68% 3.73% 3.73% 3.73% 3.73%
Convertible senior notes 0.00% 0.00% 0.00% 0.00% 0.00% 0.00% 0.00% 0.00%Other long-term liabilities 3.32% 2.96% 2.55% 2.53% 2.27% 2.14% 1.87% 1.74%
Total Liabilities 87.07% 20.02% 17.47% 19.50% 19.30% 19.17% 18.91% 18.78%
Stockholders' Equity:Common stock and Additional Paid in Capital 135.45% 140.31% 139.14% 142.92% 132.14% 128.50% 116.13% 111.36%Accumulated other comprehensive income (loss), net of tax -0.02% 0.03% 0.04% 0.04% 0.04% 0.03% 0.03% 0.03%Retained earnings (accumulated deficit) -58.85% -44.44% -32.21% -27.38% -18.44% -11.35% -3.43% 3.79%
Total stockholders' equity (deficit) 76.58% 95.89% 106.97% 115.58% 113.73% 117.18% 112.73% 115.18%
TotalLiabilitesandStockholders'Equity 163.65% 115.91% 124.43% 135.09% 133.03% 136.35% 131.64% 133.96%

LinearTechnologyIncorporatedValueDriverEstimation
FiscalYearsEnding30-Jun 2013 2014 2015 2016E 2017E 2018E 2019E 2020E
MarginalTaxRateFederalstatutorytaxrate 35.00% 35.00% 35.00% 35.00% 35.00% 35.00% 35.00% 35.00%Stateincometaxes,netoffederalbenefit 0.27% -0.50% 0.17% 0.17% 0.17% 0.17% 0.17% 0.17%Foreignratedifferential -7.66% -8.17% -8.02% -8.02% -8.02% -8.02% -8.02% -8.02%MarginalTaxRate 27.61% 26.33% 27.15% 27.15% 27.15% 27.15% 27.15% 27.15%
EBITA:Net sales 1,282,236 1,388,386 1,475,139 1,443,719 1,561,615 1,605,808 1,776,791 1,852,888- Cost of sales -267,150 -287,325 -301,629 -312,258 -333,095 -341,334 -381,083 -395,640- Depreciation & Amortization -55,366 -51,255 -54,098 -48,672 -49,500 -52,089 -54,231 -58,318- Research & development expense -235,184 -250,434 -266,761 -263,479 -284,995 -293,060 -324,264 -338,152- Selling, general & administrative expense -151,382 -159,642 -169,952 -169,637 -183,490 -188,682 -208,773 -217,714- Restructuring Charge 0 0 0 0 0 0 0 0+ImpliedInterestonOperatingLeases 242 241 261 294 276 295 291 328EBITA 573,396 639,971 682,960 649,967 710,810 730,938 808,731 843,392
Less:AdjustedTaxes:Income tax provision (benefit) 121,956 141,307 164,426 177,336 193,974 199,495 220,701 230,162- Tax Shield on Interest income -1,124 -712 -730 -979 -1,096 -1,159 -1,246 -1,308+ Tax Benefit on Interest expense 13,346 10,839 0 0 0 0 0 0+ Tax Shield Acqusisition related Costs 0 0 0 0 0 0 0 0+ Tax Shield Early Retirement of Convertible Notes 0 0 0 0 0 0 0 0+TaxShieldonImpliedLeaseInterest 67 63 71 80 75 80 79 89AdjustedTaxes 134,245 151,497 163,767 176,437 192,953 198,417 219,534 228,943
Plus:ChangeinDeferredTax:Deferred income tax provision (benefit) 22,533 -61,800 15,414 16,082 4,991 1,656 6,362 2,838NetChangeinDTLiabilities 22,533 -61,800 15,414 16,082 4,991 1,656 6,362 2,838
NOPLATNOPLAT:EBITA-AdjustedTaxes+ChangeinDT 461,684 426,674 534,607 489,612 522,849 534,178 595,559 617,287
OperatingCurrentAssets:"Normal"Cash% 2% 2% 2% 2% 2% 2% 2% 2%xRevenue 1,282,236 1,388,386 1,475,139 1,443,719 1,561,615 1,605,808 1,776,791 1,852,888"Normal"Cash(RevenuexAvg%) 25,645 27,768 29,503 28,874 31,232 32,116 35,536 37,058Cashandcashequivalents 126,650 157,323 195,679 308,809 349,442 414,123 433,981 460,866
Lowerof"Normal"CashorActualCash 25,645 27,768 29,503 28,874 31,232 32,116 35,536 37,058Accounts receivable, net 145,274 173,340 179,264 174,515 194,796 200,309 221,637 231,129Inventories 87,229 91,310 99,861 96,729 104,628 107,589 119,045 124,143Prepaid expenses & other current assets 36,646 40,982 54,412 53,418 57,780 59,415 65,741 68,557OperatingCurrentAssets 294,794 333,400 363,040 353,536 388,436 399,429 441,959 460,887
OperatingCurrentLiabilities:Accounts payable 10,258 28,221 17,608 17,769 19,220 19,764 21,868 22,805Accrued payroll & related benefits 77,659 88,326 98,498 94,318 102,020 104,907 116,078 121,049Deferred income on shipments to distributors 44,088 45,619 46,860 47,643 51,533 52,992 58,634 61,145Income taxes payable 12,834 41,731 5,822 17,734 19,397 19,950 22,070 23,016Other accrued liabilities 18,933 11,218 14,130 14,437 15,616 16,058 17,768 18,529OperatingCurrentLiabilities 163,772 215,115 182,918 191,901 207,787 213,671 236,418 246,544
NetPPE:Property & equipment, net 288,466 277,080 287,742 270,144 289,494 285,173 320,981 356,508
PVofOperatingLeases:PVofOperatingLeases 7,147 7,739 8,713 8,180 8,766 8,635 9,719 10,795
OtherOperatingAssets:Identified intangible assets, net 13,785 11,585 9,385 7,185 5,485 4,285 3,085 1,885Other non current assets 0 0 0 0 0 0 0 0TotalOtherLong-TermOperatingAssets 13,785 11,585 9,385 7,185 5,485 4,285 3,085 1,885
OtherOperatingLiabilities:Other liabilities 42,527 41,095 37,622 36,493 35,399 34,337 33,306 32,307TotalOtherLong-TermOperatingLiabilities 42,527 41,095 37,622 36,493 35,399 34,337 33,306 32,307
InvestedCapital:InvestedCapital 397,893 373,594 448,340 410,652 448,995 449,515 506,020 551,224
ValueDrivers:NOPLAT 461,684 426,674 534,607 489,612 522,849 534,178 595,559 617,287
/BeginningIC 430,346 397,893 373,594 448,340 410,652 448,995 449,515 506,020ROIC: 107.28% 107.23% 143.10% 109.21% 127.32% 118.97% 132.49% 121.99%
BeginningIC 430,346 397,893 373,594 448,340 410,652 448,995 449,515 506,020x(ROIC-WACC) 98.54% 98.49% 134.36% 100.46% 118.58% 110.23% 123.75% 113.25%
EP 424,065 391,892 501,949 450,420 486,951 494,928 556,264 573,053
NOPLAT 461,684 426,674 534,607 489,612 522,849 534,178 595,559 617,287-CapEx -32,453 -24,299 74,746 -37,688 38,343 520 56,505 45,204
FCF 494,137 450,973 459,861 527,300 484,506 533,658 539,054 572,083

LinearTechnologyIncorporatedWeightedAverageCostofCapital(WACC)Estimation
WACC=Re*(E/V)+Rd*(1-t)*(D/V)+Rpfd*(PFD/V)
CostofEquityRe=Rf+B*(E[Rm]-Rf)Rf 2.820%E[Rm]-Rf 4.85%Beta 1.222Re 8.75% TexasInstrumentsBond,maturity5/1/23 2.68%
-(10-yrBond(YahooFinance)) 2.13%Costofdebt +(30-yearTreasuryYield(YahooFinance)) 2.82%Rd 3.37% ----------> =CostofDebt 3.37%
CostofPreferredStockRpfd 0.00%
MarketValueofEquitySharesoutstanding 242751xSharesPrice $44.31E $10,756,297
MarketValueofDebtLong-term debt 0+ Operating Leases $8,713D $8,713
MarketValueofPreferredSharesoutstanding 0PFD 0
MarketValueofFirmV=E+D+PFD $10,765,010
weightofequity 99.92%weightofdebt 0.08%weightofpreferred 0.00%MarginalTaxRate 27.15%
WACC 8.74%
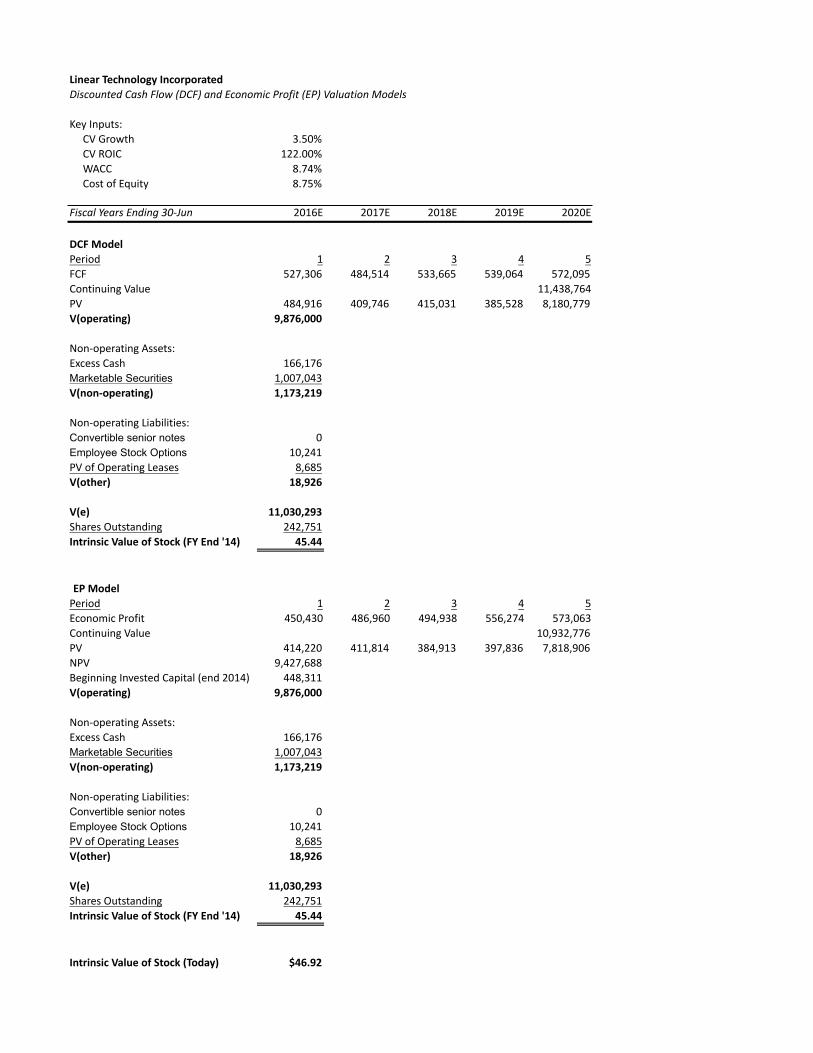
LinearTechnologyIncorporatedDiscountedCashFlow(DCF)andEconomicProfit(EP)ValuationModels
KeyInputs:
CVGrowth 3.50%
CVROIC 122.00%
WACC 8.74%
CostofEquity 8.75%
FiscalYearsEnding30-Jun 2016E 2017E 2018E 2019E 2020E
DCFModelPeriod 1 2 3 4 5
FCF 527,306 484,514 533,665 539,064 572,095
ContinuingValue 11,438,764
PV 484,916 409,746 415,031 385,528 8,180,779
V(operating) 9,876,000
Non-operatingAssets:
ExcessCash 166,176
Marketable Securities 1,007,043
V(non-operating) 1,173,219
Non-operatingLiabilities:
Convertible senior notes 0
Employee Stock Options 10,241
PVofOperatingLeases 8,685
V(other) 18,926
V(e) 11,030,293SharesOutstanding 242,751
IntrinsicValueofStock(FYEnd'14) 45.44
EPModelPeriod 1 2 3 4 5
EconomicProfit 450,430 486,960 494,938 556,274 573,063
ContinuingValue 10,932,776
PV 414,220 411,814 384,913 397,836 7,818,906
NPV 9,427,688
BeginningInvestedCapital(end2014) 448,311
V(operating) 9,876,000
Non-operatingAssets:
ExcessCash 166,176
Marketable Securities 1,007,043
V(non-operating) 1,173,219
Non-operatingLiabilities:
Convertible senior notes 0
Employee Stock Options 10,241
PVofOperatingLeases 8,685
V(other) 18,926
V(e) 11,030,293SharesOutstanding 242,751
IntrinsicValueofStock(FYEnd'14) 45.44
IntrinsicValueofStock(Today) $46.92
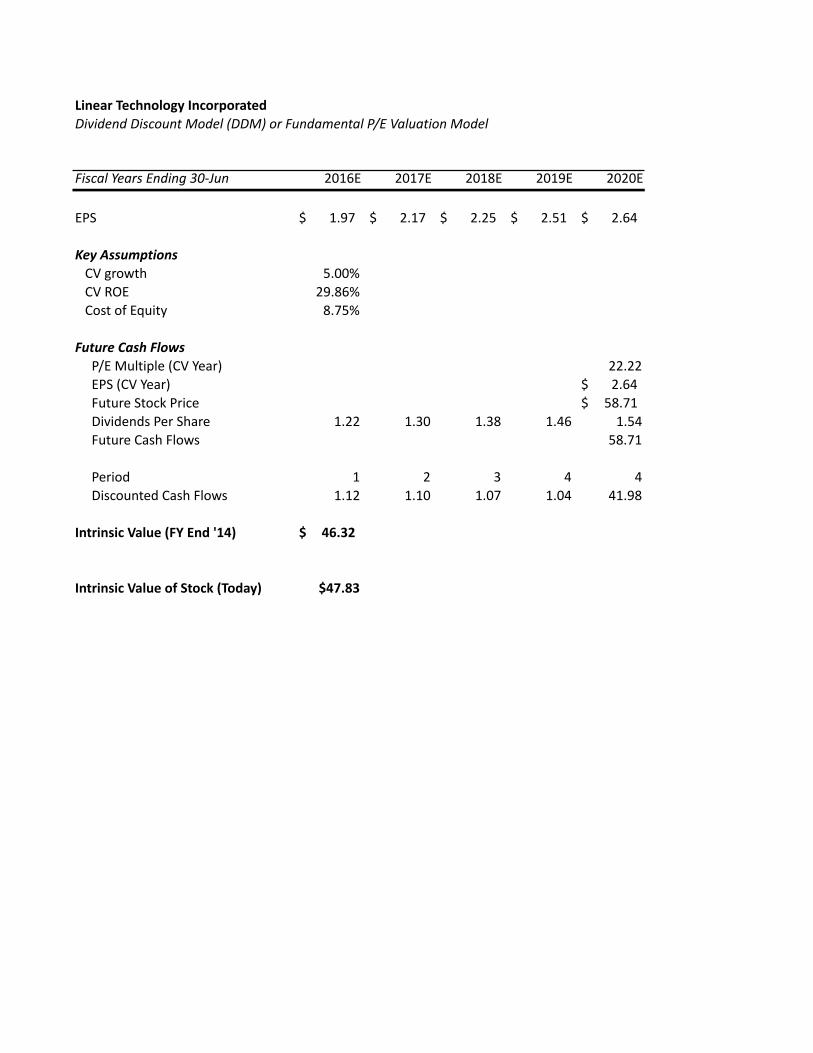
LinearTechnologyIncorporatedDividendDiscountModel(DDM)orFundamentalP/EValuationModel
FiscalYearsEnding30-Jun 2016E 2017E 2018E 2019E 2020E
EPS 1.97$ 2.17$ 2.25$ 2.51$ 2.64$
KeyAssumptionsCVgrowth 5.00%CVROE 29.86%CostofEquity 8.75%
FutureCashFlowsP/EMultiple(CVYear) 22.22EPS(CVYear) 2.64$FutureStockPrice 58.71$DividendsPerShare 1.22 1.30 1.38 1.46 1.54FutureCashFlows 58.71
Period 1 2 3 4 4DiscountedCashFlows 1.12 1.10 1.07 1.04 41.98
IntrinsicValue(FYEnd'14) 46.32$
IntrinsicValueofStock(Today) $47.83

LinearTechnologyIncorporatedRelativeValuationModelsPeerComparison
EPS EPSTicker Company Price 2015E 2016E P/E15 P/E16
MXIM MaximIntegratedProducts $40.56 $1.72 $2.10 23.6 19.3ON ONSemiconductorCorp $11.60 $0.83 $0.93 14.0 12.5FCS FairchildSemiconductor $18.26 $0.57 $0.88 32.0 20.8IXYS IXYSCorporation $13.00 $0.71 $1.22 18.3 10.7IFX-DE InfineonTechnologiesAG €11.28 €0.57 €0.70 19.8 16.1MELE-BE MelexisNV €47.69 €2.45 €2.59 19.5 18.4ADI AnalogDevices,Inc $61.70 $3.03 $3.40 20.4 18.1ISIL IntersilCorporation $14.19 $0.61 $0.65 23.3 21.8TXN TexasInstrumentsInc $57.63 $2.72 $2.97 21.2 19.4
Average 20.9 17.7
LLTC LinearTechnologyCorp $44.31 $1.97 $2.17 22.5 20.4
ImpliedValue:RelativeP/E(EPS15) $41.03RelativeP/E(EPS16) 38.40$
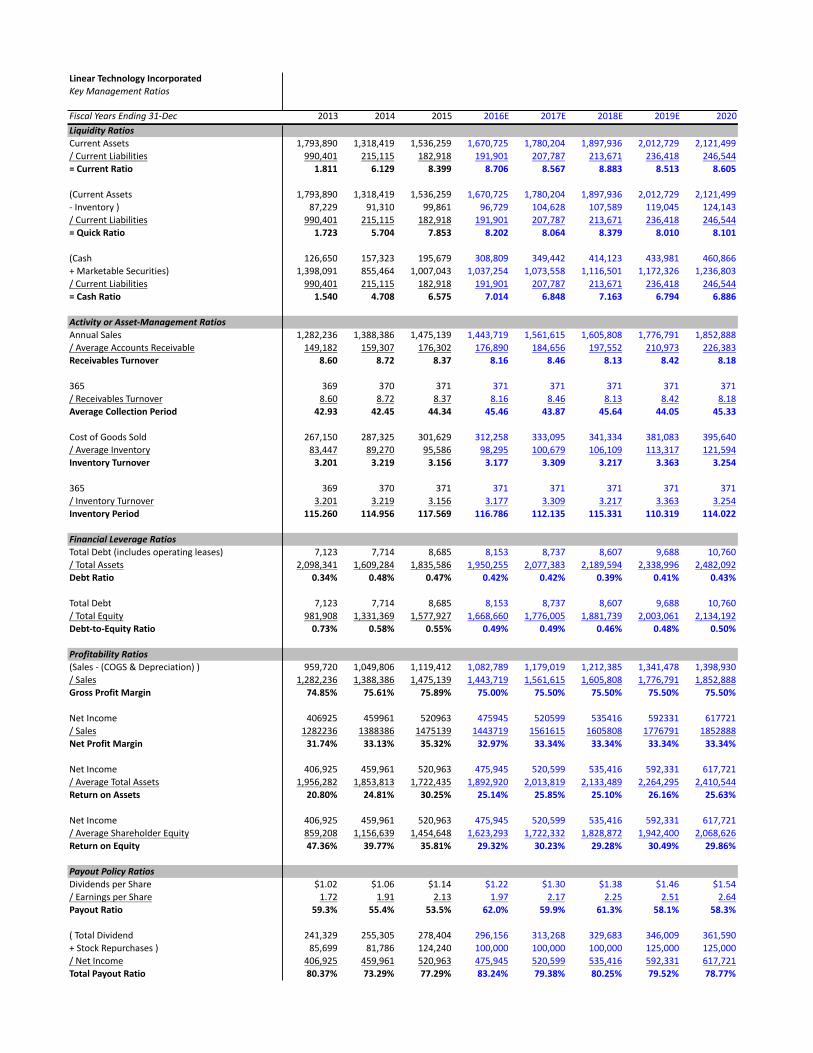
LinearTechnologyIncorporatedKeyManagementRatios
FiscalYearsEnding31-Dec 2013 2014 2015 2016E 2017E 2018E 2019E 2020
LiquidityRatiosCurrentAssets 1,793,890 1,318,419 1,536,259 1,670,725 1,780,204 1,897,936 2,012,729 2,121,499/CurrentLiabilities 990,401 215,115 182,918 191,901 207,787 213,671 236,418 246,544=CurrentRatio 1.811 6.129 8.399 8.706 8.567 8.883 8.513 8.605
(CurrentAssets 1,793,890 1,318,419 1,536,259 1,670,725 1,780,204 1,897,936 2,012,729 2,121,499-Inventory) 87,229 91,310 99,861 96,729 104,628 107,589 119,045 124,143/CurrentLiabilities 990,401 215,115 182,918 191,901 207,787 213,671 236,418 246,544=QuickRatio 1.723 5.704 7.853 8.202 8.064 8.379 8.010 8.101
(Cash 126,650 157,323 195,679 308,809 349,442 414,123 433,981 460,866+MarketableSecurities) 1,398,091 855,464 1,007,043 1,037,254 1,073,558 1,116,501 1,172,326 1,236,803/CurrentLiabilities 990,401 215,115 182,918 191,901 207,787 213,671 236,418 246,544=CashRatio 1.540 4.708 6.575 7.014 6.848 7.163 6.794 6.886
ActivityorAsset-ManagementRatiosAnnualSales 1,282,236 1,388,386 1,475,139 1,443,719 1,561,615 1,605,808 1,776,791 1,852,888/AverageAccountsReceivable 149,182 159,307 176,302 176,890 184,656 197,552 210,973 226,383ReceivablesTurnover 8.60 8.72 8.37 8.16 8.46 8.13 8.42 8.18
365 369 370 371 371 371 371 371 371/ReceivablesTurnover 8.60 8.72 8.37 8.16 8.46 8.13 8.42 8.18AverageCollectionPeriod 42.93 42.45 44.34 45.46 43.87 45.64 44.05 45.33
CostofGoodsSold 267,150 287,325 301,629 312,258 333,095 341,334 381,083 395,640/AverageInventory 83,447 89,270 95,586 98,295 100,679 106,109 113,317 121,594InventoryTurnover 3.201 3.219 3.156 3.177 3.309 3.217 3.363 3.254
365 369 370 371 371 371 371 371 371/InventoryTurnover 3.201 3.219 3.156 3.177 3.309 3.217 3.363 3.254InventoryPeriod 115.260 114.956 117.569 116.786 112.135 115.331 110.319 114.022
FinancialLeverageRatiosTotalDebt(includesoperatingleases) 7,123 7,714 8,685 8,153 8,737 8,607 9,688 10,760/TotalAssets 2,098,341 1,609,284 1,835,586 1,950,255 2,077,383 2,189,594 2,338,996 2,482,092DebtRatio 0.34% 0.48% 0.47% 0.42% 0.42% 0.39% 0.41% 0.43%
TotalDebt 7,123 7,714 8,685 8,153 8,737 8,607 9,688 10,760/TotalEquity 981,908 1,331,369 1,577,927 1,668,660 1,776,005 1,881,739 2,003,061 2,134,192Debt-to-EquityRatio 0.73% 0.58% 0.55% 0.49% 0.49% 0.46% 0.48% 0.50%
ProfitabilityRatios(Sales-(COGS&Depreciation)) 959,720 1,049,806 1,119,412 1,082,789 1,179,019 1,212,385 1,341,478 1,398,930/Sales 1,282,236 1,388,386 1,475,139 1,443,719 1,561,615 1,605,808 1,776,791 1,852,888GrossProfitMargin 74.85% 75.61% 75.89% 75.00% 75.50% 75.50% 75.50% 75.50%
NetIncome 406925 459961 520963 475945 520599 535416 592331 617721/Sales 1282236 1388386 1475139 1443719 1561615 1605808 1776791 1852888NetProfitMargin 31.74% 33.13% 35.32% 32.97% 33.34% 33.34% 33.34% 33.34%
NetIncome 406,925 459,961 520,963 475,945 520,599 535,416 592,331 617,721/AverageTotalAssets 1,956,282 1,853,813 1,722,435 1,892,920 2,013,819 2,133,489 2,264,295 2,410,544ReturnonAssets 20.80% 24.81% 30.25% 25.14% 25.85% 25.10% 26.16% 25.63%
NetIncome 406,925 459,961 520,963 475,945 520,599 535,416 592,331 617,721/AverageShareholderEquity 859,208 1,156,639 1,454,648 1,623,293 1,722,332 1,828,872 1,942,400 2,068,626ReturnonEquity 47.36% 39.77% 35.81% 29.32% 30.23% 29.28% 30.49% 29.86%
PayoutPolicyRatiosDividendsperShare $1.02 $1.06 $1.14 $1.22 $1.30 $1.38 $1.46 $1.54/EarningsperShare 1.72 1.91 2.13 1.97 2.17 2.25 2.51 2.64PayoutRatio 59.3% 55.4% 53.5% 62.0% 59.9% 61.3% 58.1% 58.3%
(TotalDividend 241,329 255,305 278,404 296,156 313,268 329,683 346,009 361,590+StockRepurchases) 85,699 81,786 124,240 100,000 100,000 100,000 125,000 125,000/NetIncome 406,925 459,961 520,963 475,945 520,599 535,416 592,331 617,721TotalPayoutRatio 80.37% 73.29% 77.29% 83.24% 79.38% 80.25% 79.52% 78.77%

PresentValueofOperatingLeaseObligations(2015) PresentValueofOperatingLeaseObligations(2014)
Operating Operating
FiscalYearsEnding30-Jun Leases FiscalYearsEnding30-Jun Leases
2016 3154 2015 2762
2017 2062 2016 2235
2018 1312 2017 1154
2019 972 2018 764
2020 1078 2019 535
Thereafter 951 Thereafter 1000
TotalMinimumPayments 9529 TotalMinimumPayments 8450
Less:Interest 844 Less:Interest 736
PVofMinimumPayments 8685 PVofMinimumPayments 7714
CapitalizationofOperatingLeases CapitalizationofOperatingLeases
Pre-TaxCostofDebt 3.50% Pre-TaxCostofDebt 3.50%
NumberYearsImpliedbyYear6Payment 1.0 NumberYearsImpliedbyYear6Payment 1.9
Lease PVLease Lease PVLease
Year Commitment Payment Year Commitment Payment
1 3154 3047.4 1 2762 2668.7
2 2062 1925.0 2 2235 2086.5
3 1312 1183.5 3 1154 1040.9
4 972 847.1 4 764 665.9
5 1078 907.8 5 535 450.5
6&beyond 951 773.8 6&beyond 535 801.7
PVofMinimumPayments 8684.6 PVofMinimumPayments 7714.2
PresentValueofOperatingLeaseObligations(2013) PresentValueofOperatingLeaseObligations(2012)
Operating Operating
FiscalYearsEnding30-Jun Leases FiscalYearsEnding30-Jun Leases
2014 2634 2013 2785
2015 1816 2014 1918
2016 1026 2015 1010
2017 690 2016 567
2018 480 2017 484
Thereafter 1200 Thereafter 1100
TotalMinimumPayments 7846 TotalMinimumPayments 7864
Less:Interest 723 Less:Interest 694
PVofMinimumPayments 7123 PVofMinimumPayments 7170
CapitalizationofOperatingLeases CapitalizationofOperatingLeases
Pre-TaxCostofDebt 3.50% Pre-TaxCostofDebt 3.50%
NumberYearsImpliedbyYear6Payment 2.5 NumberYearsImpliedbyYear6Payment 2.3
Lease PVLease Lease PVLease
Year Commitment Payment Year Commitment Payment
1 2634 2545.0 1 2785 2690.9
2 1816 1695.4 2 1918 1790.6
3 1026 925.5 3 1010 911.0
4 690 601.4 4 567 494.2
5 480 404.2 5 484 407.6
6&beyond 480 951.8 6&beyond 484 875.8
PVofMinimumPayments 7123.2 PVofMinimumPayments 7170.1
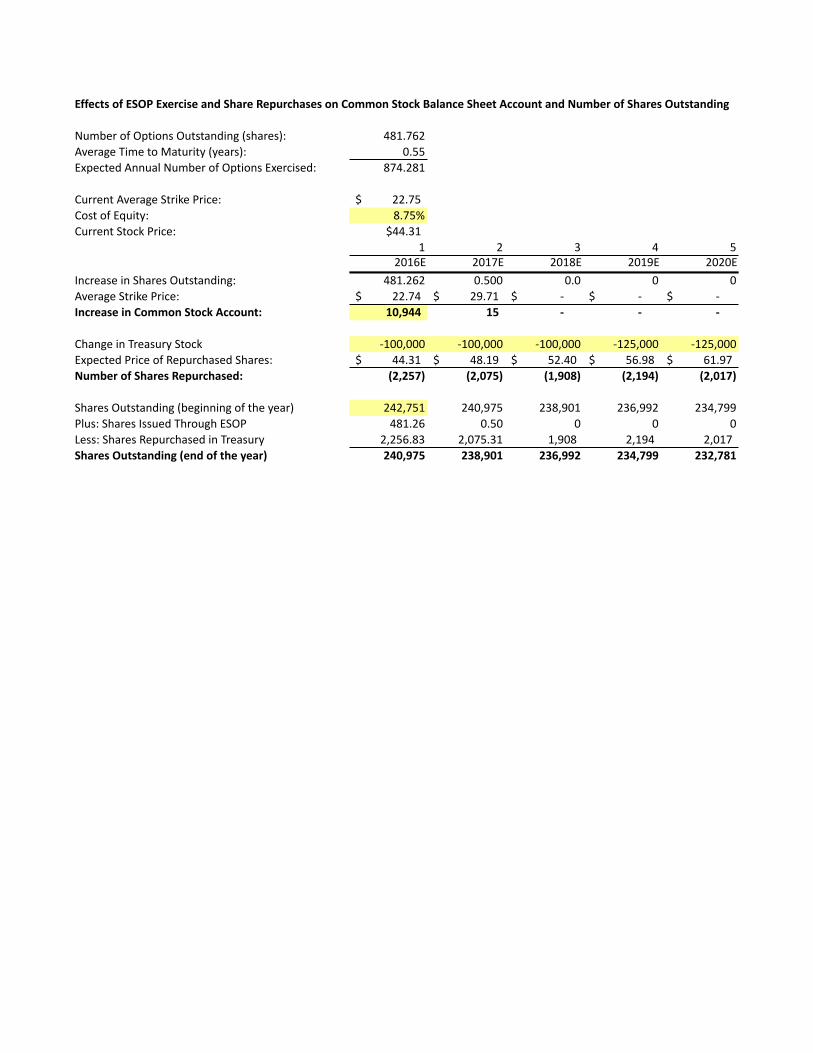
EffectsofESOPExerciseandShareRepurchasesonCommonStockBalanceSheetAccountandNumberofSharesOutstanding
NumberofOptionsOutstanding(shares): 481.762AverageTimetoMaturity(years): 0.55ExpectedAnnualNumberofOptionsExercised: 874.281
CurrentAverageStrikePrice: 22.75$CostofEquity: 8.75%CurrentStockPrice: $44.31
1 2 3 4 52016E 2017E 2018E 2019E 2020E
IncreaseinSharesOutstanding: 481.262 0.500 0.0 0 0AverageStrikePrice: 22.74$ 29.71$ -$ -$ -$IncreaseinCommonStockAccount: 10,944 15 - - -
ChangeinTreasuryStock -100,000 -100,000 -100,000 -125,000 -125,000ExpectedPriceofRepurchasedShares: 44.31$ 48.19$ 52.40$ 56.98$ 61.97$NumberofSharesRepurchased: (2,257) (2,075) (1,908) (2,194) (2,017)
SharesOutstanding(beginningoftheyear) 242,751 240,975 238,901 236,992 234,799Plus:SharesIssuedThroughESOP 481.26 0.50 0 0 0Less:SharesRepurchasedinTreasury 2,256.83 2,075.31 1,908 2,194 2,017SharesOutstanding(endoftheyear) 240,975 238,901 236,992 234,799 232,781
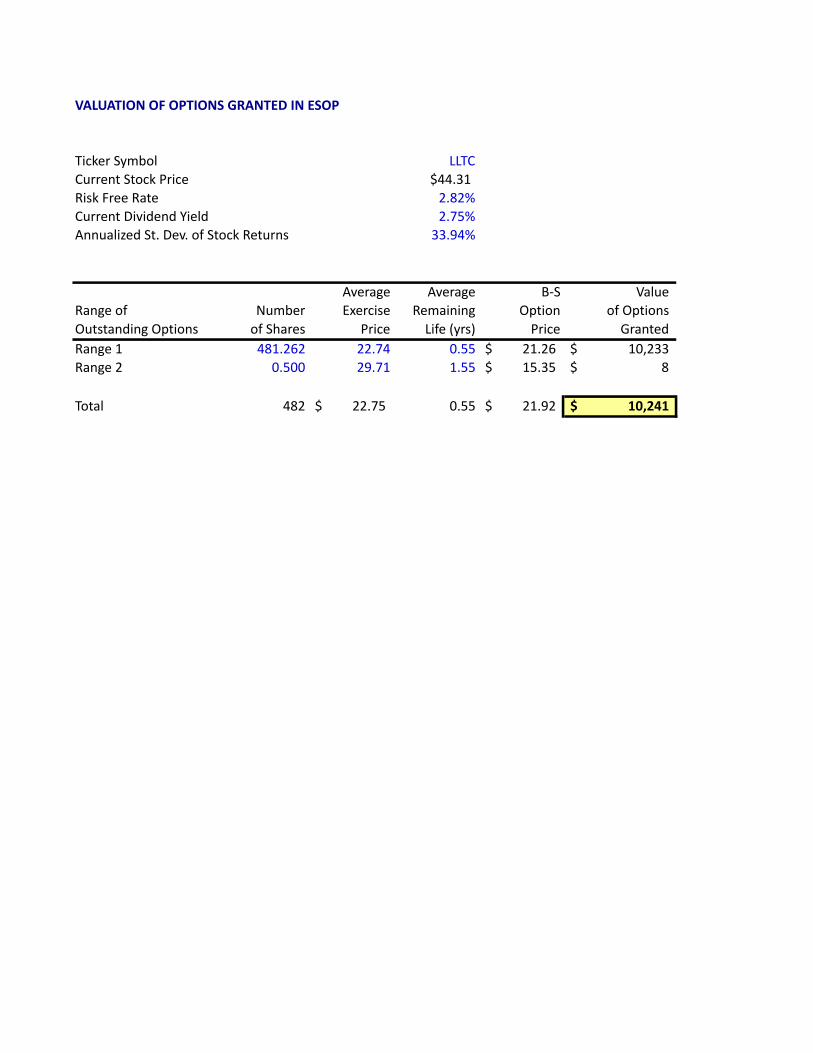
VALUATIONOFOPTIONSGRANTEDINESOP
TickerSymbol LLTCCurrentStockPrice $44.31RiskFreeRate 2.82%CurrentDividendYield 2.75%AnnualizedSt.Dev.ofStockReturns 33.94%
Average Average B-S ValueRangeof Number Exercise Remaining Option ofOptionsOutstandingOptions ofShares Price Life(yrs) Price GrantedRange1 481.262 22.74 0.55 21.26$ 10,233$Range2 0.500 29.71 1.55 15.35$ 8$
Total 482 22.75$ 0.55 21.92$ 10,241$
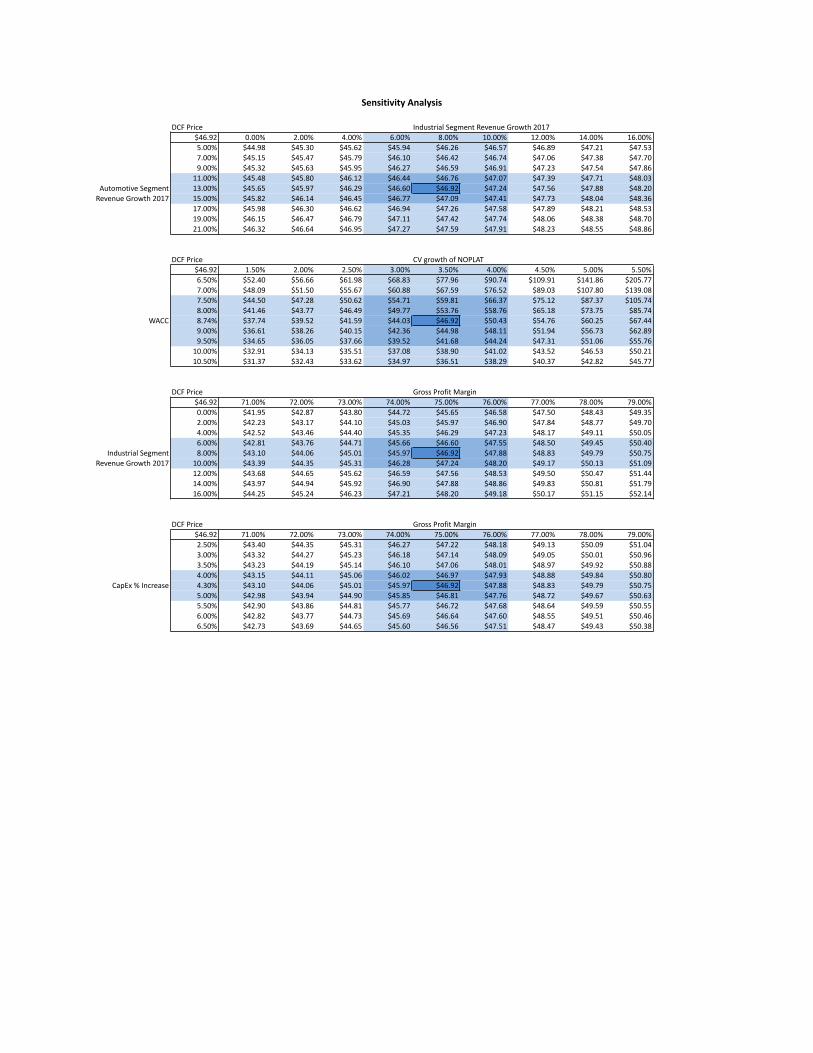
DCFPrice IndustrialSegmentRevenueGrowth2017$46.92 0.00% 2.00% 4.00% 6.00% 8.00% 10.00% 12.00% 14.00% 16.00%5.00% $44.98 $45.30 $45.62 $45.94 $46.26 $46.57 $46.89 $47.21 $47.537.00% $45.15 $45.47 $45.79 $46.10 $46.42 $46.74 $47.06 $47.38 $47.709.00% $45.32 $45.63 $45.95 $46.27 $46.59 $46.91 $47.23 $47.54 $47.8611.00% $45.48 $45.80 $46.12 $46.44 $46.76 $47.07 $47.39 $47.71 $48.03
AutomotiveSegment 13.00% $45.65 $45.97 $46.29 $46.60 $46.92 $47.24 $47.56 $47.88 $48.20RevenueGrowth2017 15.00% $45.82 $46.14 $46.45 $46.77 $47.09 $47.41 $47.73 $48.04 $48.36
17.00% $45.98 $46.30 $46.62 $46.94 $47.26 $47.58 $47.89 $48.21 $48.5319.00% $46.15 $46.47 $46.79 $47.11 $47.42 $47.74 $48.06 $48.38 $48.7021.00% $46.32 $46.64 $46.95 $47.27 $47.59 $47.91 $48.23 $48.55 $48.86
DCFPrice CVgrowthofNOPLAT$46.92 1.50% 2.00% 2.50% 3.00% 3.50% 4.00% 4.50% 5.00% 5.50%6.50% $52.40 $56.66 $61.98 $68.83 $77.96 $90.74 $109.91 $141.86 $205.777.00% $48.09 $51.50 $55.67 $60.88 $67.59 $76.52 $89.03 $107.80 $139.087.50% $44.50 $47.28 $50.62 $54.71 $59.81 $66.37 $75.12 $87.37 $105.748.00% $41.46 $43.77 $46.49 $49.77 $53.76 $58.76 $65.18 $73.75 $85.74
WACC 8.74% $37.74 $39.52 $41.59 $44.03 $46.92 $50.43 $54.76 $60.25 $67.449.00% $36.61 $38.26 $40.15 $42.36 $44.98 $48.11 $51.94 $56.73 $62.899.50% $34.65 $36.05 $37.66 $39.52 $41.68 $44.24 $47.31 $51.06 $55.7610.00% $32.91 $34.13 $35.51 $37.08 $38.90 $41.02 $43.52 $46.53 $50.2110.50% $31.37 $32.43 $33.62 $34.97 $36.51 $38.29 $40.37 $42.82 $45.77
DCFPrice GrossProfitMargin$46.92 71.00% 72.00% 73.00% 74.00% 75.00% 76.00% 77.00% 78.00% 79.00%0.00% $41.95 $42.87 $43.80 $44.72 $45.65 $46.58 $47.50 $48.43 $49.352.00% $42.23 $43.17 $44.10 $45.03 $45.97 $46.90 $47.84 $48.77 $49.704.00% $42.52 $43.46 $44.40 $45.35 $46.29 $47.23 $48.17 $49.11 $50.056.00% $42.81 $43.76 $44.71 $45.66 $46.60 $47.55 $48.50 $49.45 $50.40
IndustrialSegment 8.00% $43.10 $44.06 $45.01 $45.97 $46.92 $47.88 $48.83 $49.79 $50.75RevenueGrowth2017 10.00% $43.39 $44.35 $45.31 $46.28 $47.24 $48.20 $49.17 $50.13 $51.09
12.00% $43.68 $44.65 $45.62 $46.59 $47.56 $48.53 $49.50 $50.47 $51.4414.00% $43.97 $44.94 $45.92 $46.90 $47.88 $48.86 $49.83 $50.81 $51.7916.00% $44.25 $45.24 $46.23 $47.21 $48.20 $49.18 $50.17 $51.15 $52.14
DCFPrice GrossProfitMargin$46.92 71.00% 72.00% 73.00% 74.00% 75.00% 76.00% 77.00% 78.00% 79.00%2.50% $43.40 $44.35 $45.31 $46.27 $47.22 $48.18 $49.13 $50.09 $51.043.00% $43.32 $44.27 $45.23 $46.18 $47.14 $48.09 $49.05 $50.01 $50.963.50% $43.23 $44.19 $45.14 $46.10 $47.06 $48.01 $48.97 $49.92 $50.884.00% $43.15 $44.11 $45.06 $46.02 $46.97 $47.93 $48.88 $49.84 $50.80
CapEx%Increase 4.30% $43.10 $44.06 $45.01 $45.97 $46.92 $47.88 $48.83 $49.79 $50.755.00% $42.98 $43.94 $44.90 $45.85 $46.81 $47.76 $48.72 $49.67 $50.635.50% $42.90 $43.86 $44.81 $45.77 $46.72 $47.68 $48.64 $49.59 $50.556.00% $42.82 $43.77 $44.73 $45.69 $46.64 $47.60 $48.55 $49.51 $50.466.50% $42.73 $43.69 $44.65 $45.60 $46.56 $47.51 $48.47 $49.43 $50.38
SensitivityAnalysis
Page12
9. S&P Capital IQ – Technology Hardware, Storage &Peripherals,April2015http://www.netadvantage.standardandpoors.com.proxy.lib.uiowa.edu/NASApp/NetAdvantage/simpleSearchRun.do?ControlName=IndustriesSurveySearch
10. BusinessInsider, 07/10/2015, “PC Sales areImploding”http://www.businessinsider.com/pc-sales-plummet-in-q2-2015-gartner-idc-say-2015-7?r=UK&IR=T
11. Statista,“GlobalPCShipments(desktopandportable)from2009to2019”http://www.statista.com.proxy.lib.uiowa.edu/statistics/269049/global-pc-shipment-forecast-since-2009/
12. IC Insights, “TI Strengthens Analog Marketshare;SkyworksGainsfromApple’sFavor,”May11,2015http://www.icinsights.com/news/bulletins/TI-Strengthens-Analog-Marketshare-Skyworks-Gains-From-Apples-Favor/
13. FisherInvestmentsonTechnology,pgs46-4714. Semi.org,HistoricalBook-to-BillPressReleaseData
http://www.semi.org/en/MarketInfo/Book-to-Bill15. KPMGGlobalAutomotiveExecutiveSurvey2015,
pg12https://www.kpmg.com/Global/en/IssuesAndInsights/ArticlesPublications/global-automotive-executive-survey/Documents/2015-report-v1.pdf
16. FederalReserveBankofSt.Louis,07/2015,“PersonalConsumptionExpenditures”https://research.stlouisfed.org/fred2/series/PCE#
IMPORTANTDISCLAIMER
HenryFundreportsarecreatedbystudentenrolledintheAppliedSecuritiesManagement(HenryFund)programatthe University of Iowa’s Tippie School of Management.These reports are intended to provide potentialemployersandotherinterestedpartiesanexampleoftheanalytical skills, investment knowledge, andcommunication abilities of Henry Fund students. HenryFund analysts are not registered investment advisors,brokers or officially licensed financial professionals. Theinvestment opinion contained in this report does notrepresentanofferorsolicitationtobuyorsellanyoftheaforementionedsecurities.Unlessotherwisenoted,factsand figures included in this report are from publiclyavailable sources. This report is not a completecompilation of data, and its accuracy is not guaranteed.From time to time, the University of Iowa, its faculty,staff, students, or the Henry Fund may hold a financialinterestinthecompaniesmentionedinthisreport.


![royce-walton@uiowa.edu] Inc. (SWK) November 16, 2015tippie.biz.uiowa.edu/henry/reports15/SWK_fa15.pdf · 2015-11-16 · Stanley Black & Decker, Inc. (SWK) November 16, 2015 Industrials](https://img.pdfslide.us/doc/110x75/5f580e5028d3836de53cb67b/royce-waltonuiowaedu-inc-swk-november-16-2015-11-16-stanley-black-.jpg)