Embed Size (px)
Citation preview
How to Measure Company Productivity using Value-added:
A Focus on Pohang Steel (POSCO)
Marvin B. Lieberman UCLA Anderson School of Management
Los Angeles, CA 90095-1481 USA
Email: [email protected]
Jina Kang Technology Management Economics and Policy Program (TEMEP)
Seoul National University Seoul 151-742, South Korea Email: [email protected]
Acknowledgement We thank Mike Peng and an anonymous referee for helpful suggestions
and comments. This study received support from the UCLA Center for International Business
Education and Research, and from the steel project, “Competitiveness in the Global Steel
Industry,” funded by the Alfred P. Sloan Foundation and the American Iron and Steel
Institute.
Marvin Lieberman (PhD, Harvard University) is Professor in the Policy Area at the UCLA
Anderson School of Management. His research interests are in the fields of competitive
strategy, industrial economics, and operations management. He has published articles on
topics relating to industrial productivity, learning-by-doing, market entry and exit, first-mover
advantages, vertical integration and imitative behavior. In recent studies he compares the
performance of U.S. and Asian manufacturing firms in the automotive and steel industries.
Jina Kang (PhD, UCLA) is Assistant Professor at Seoul National University. Her current
research focuses on business strategy, knowledge spillover, creative industries, and
technology management. She has written articles on knowledge characteristics and social
networks, firm performance during privatization phases, and productivity measures.
2
How to Measure Company Productivity using Value-added:
A Focus on Pohang Steel (POSCO)
ABSTRACT
How should the performance of a manufacturing company be assessed, relative to firms
making similar products, at home and abroad? This paper shows how company-level
productivity measures can be developed from public financial data to provide a more
comprehensive gauge of firm performance than profit rates alone. As a specific example, we
focus on the Korean steelmaker, POSCO. Founded four decades ago, POSCO is commonly
regarded as the world’s most efficient and profitable integrated steel producer, and our
analysis documents POSCO’s superior record of profitability and labor productivity. We
find, however, that a broader assessment of POSCO’s performance is tempered by the firm’s
high capital intensity relative to producers in Japan and the United States.
Keywords: productivity, performance assessment, steel industry, POSCO, value-added
3
As producers in emerging economies strive to catch up to established rivals abroad,
much attention has been paid to determinants of their success (Mathews, 2006; Tybout, 2000).
How should the performance of these companies be compared and assessed? What metrics
should be used to track the progress of a manufacturing firm and its performance on the world
stage? Conventional comparisons of business performance are based on measures of
accounting profits, or if companies are publicly-traded, stock prices. Such measures denote
returns to investors but are unlikely to reflect the full value created by the enterprise.
Similarly, a vast range of metrics have been proposed for managers to benchmark and
improve elements of organizational performance (Kaplan & Norton, 1992; Neeley, Gregory &
Platts, 1995). To assess a firm’s overall economic contribution, however, more
comprehensive measures are required.
What are some of the more comprehensive measures of performance? We argue that
one such comprehensive indicator is productivity. While various productivity measures are
in use, all gauge the efficiency with which inputs are converted to useful outputs. This paper
advances a framework in which productivity corresponds to the total economic value created
by the capital and labor employed within the enterprise. If productivity rises over time,
additional value is created and economic wealth grows. The gains flow to various parties,
including the firm’s employees, customers and shareholders. Using appropriate data, the
distribution of economic value among these stakeholders can be identified (Lieberman &
Balasubramanian, 2007). Typically, only a small part of the total value created by the
enterprise flows as profits to the firm’s shareholders.
4
In making international comparisons of firm performance, benchmarks based on
productivity can be more insightful than more standard measures of profitability.
Profitability alone is unlikely to provide an accurate gauge of performance, particularly for
companies that are young or growing rapidly. For example, Japanese companies have
historically been less profitable than their American counterparts, but their remarkable
productivity performance in sectors such as autos and electronics led to rapid growth in global
market share in the 1970s and 1980s.
Despite their usefulness as a performance indicator, comprehensive assessments of
company productivity are rare. One reason is that methods of productivity measurement
have largely been advanced by economists, whose efforts have typically focused on
comparisons at the industry or national level (e.g., Caves, 1992; Jorgenson, 1995). Another
reason is that standard accounting practices emphasize the computation of profits rather than
productivity. Nevertheless, we show that the data in corporate financial statements can often
be adapted to yield estimates of a company’s productivity and its change over time.
Drawing from such data, a growing number of productivity comparisons at the firm level have
begun to emerge (e.g., Brynjolfsson & Hitt, 2003; Lieberman & Dhawan, 2005; Oum & Yu,
1998; Schefczyk, 1993).
We demonstrate a method for performing firm-level productivity analysis, applied to
the specific example of the Pohang Iron and Steel Corporation (now officially known as
POSCO), a Korean company founded in 1968. POSCO’s outstanding record of productivity
growth has made it arguably the world’s most efficient steelmaker. High productivity has
also led to robust profitability. Among the world’s major steel producers, POSCO has
regularly ranked number one in total profits and return on sales. Goldman Sachs in its
5
October 2003 report concluded that POSCO remains “one of the best steel companies in the
world in terms of margins and returns.” For a brief period POSCO also served as the
world’s largest steelmaker, but a worldwide trend of consolidation has left POSCO bereft of
this claim.1
How does POSCO’s performance stack up?
To put POSCO’s performance in international perspective, we compare POSCO’s
historical productivity record with that of counterparts in Japan and the United States. Our
calculations focus on the steel industry and POSCO most specifically, but our methods are
general and can be applied to firms in other manufacturing industries.
Table 1 provides an overview of POSCO’s historical sales, profitability and
productivity relative to major international competitors. It compares POSCO with Nippon
Steel and USX, the largest steel producers in Japan and the United States, respectively. The
comparisons in Table 1 span decade intervals from 1973, when POSCO began operations,
through 2003, just prior to a dramatic rise in global steel prices that led to robust profitability
throughout the steelmaking sector.
[Insert Table 1 about here]
The first panel of the table, which gives total sales in terms of tons shipped,
documents the rapid growth of POSCO. POSCO’s output grew by more than 14% per year,
as compared with net declines in output shown for both Nippon Steel and USX. By 2003,
POSCO’s output was virtually identical to that of Nippon Steel.
1 Usinor of France, Arbed of Luzembourg, and Aceralia of Spain merged to form Arcelor, and in 2006 Arcelor was acquired by Mittal Steel, becoming the largest steelmaker in the world as Arcelor-Mittal. Two major Japanese producers, Kawasaki Steel and NKK Corporation, merged in 2003 to become JFE Steel. As of December 2006, POSCO is ranked as the third largest steelmaker after Arcelor-Mittal and Nippon Steel.
6
The second panel shows that POSCO has been consistently more profitable than its
rivals. For the years shown in Table 1, POSCO’s return on sales ranged from 15% to 21%,
whereas the profit rates of Nippon steel and USX were substantially lower. Indeed, USX
had financial losses in 1993 and 2003, and Nippon Steel’s return on sales was only one-
fourth the rate earned by POSCO in those years. (Table 1 is based on operating profits, but
comparisons of net profits are similar.) Clearly, POSCO has maintained high profit rates
compared to competitors.
The third panel describes POSCO’s remarkable growth in labor productivity. From
1973 to 2003, POSCO’s labor productivity (measured as value added per worker hour) grew
at an average annual rate of 8.9%, roughly twice the growth rate of Nippon Steel. At USX
over the same period, labor productivity was stagnant. By 1983, POSCO’s labor
productivity exceeded that of Nippon Steel, and POSCO’s advantage expanded further over
subsequent decades. By 2003, POSCO’s labor productivity was roughly four times that of
USX, and 26% higher than Nippon Steel.
Thus, the upper panels in Table 1 support the conventional view of POSCO as a
dramatic success story in terms of productivity and profitability (Duvall, 2002; Bremner,
Ihlwan & Roberts, 2004). Our analysis shows, however, that this positive view must be
tempered by the fact that POSCO utilizes more capital input than its competitors. The fourth
and fifth panels of Table 1 document POSCO’s high capital intensity. By our estimates,
POSCO’s fixed capital per employee, initially just below the capital-labor ratio of Nippon
Steel, grew quickly to reach more than twice Nippon’s level. Measured on the basis of
investment per ton shipped, POSCO’s fixed capital has been roughly twice Nippon’s level
since the 1970s.
7
These calculations show that POSCO has been extremely capital-intensive relative to
competitors. High capital intensity is likely to account for at least part of POSCO’s
extraordinary labor productivity and profitability. Firms with greater capital intensity must
earn a higher return on sales, other things equal, to provide normal financial returns to
investors. Therefore, part of POSCO’s high return on sales must be attributed to the firm’s
capital intensity.
The observations in Table 1 suggest that to produce each unit of output, POSCO
utilizes more capital than competitors, but much less labor. As we show later in this paper,
capital and labor inputs can be combined to yield a single multi-factor index of productivity.
The bottom panel in Table 1 compares POSCO’s performance in this way, relative to a
benchmark level of 100 corresponding to the multi-factor productivity of Nippon Steel in
1980. By this standard, POSCO shows faster productivity growth than Nippon Steel and
USX. However, POSCO’s multi-factor productivity remains consistently below that of
Nippon Steel. Thus, over the entire period from 1973 to 2003, POSCO’s labor productivity
advantage was more than offset by Nippon’s superior efficiency in utilization of capital.
The comparisons in Table 1 suggest that simple performance ratios can be
misleading. While POSCO has grown and improved dramatically, Nippon Steel is arguably
the superior performer when capital and labor inputs are jointly considered. Below, we
elaborate on these points and provide details of the productivity calculations.
Brief history of POSCO
As South Korea (hereafter Korea) began to industrialize in the 1960s, the country
lacked a viable steel industry. Some small and inefficient facilities were in operation, but
8
most were obsolete. In 1967, Korean President Chung-Hee Park sought to build Korea’s
first large-scale steel mill. To head the company, he tapped Tae-Joon Park, a former army
general.
Efforts to obtain foreign support for the venture were discouraging. The World Bank
performed a study and concluded that Korea’s plan for an integrated steel mill was “a
premature proposition without economic feasibility.”2 Ultimately, Park was able to obtain
technology and funding from Japan as part of Korea’s claim for compensation following the
Japanese occupation of Korea (1910-1945). The Korean government also provided major
investment subsidies, as part of the Korean economy’s heavy and chemical industry drive of
the 1970s (Auty, 1991; Stern et al., 1995).3 Construction of the Pohang plant began on April
1, 1970, and the first stage of the plant began operation five years later. In 1985 a second
plant in Kwangyang began construction.
Riding on the increasing world demand for crude steel, POSCO steadily increased its
production to over 20 million tons with the completion of Kwangyang in 1992, rising to 30
million tons, or about 60% of Korea’s total steel output, by 2004. High rates of plant
utilization, combined with rapid and efficient start-up of new facilities, contributed to
POSCO’s profitability and successful productivity record. Moreover, the company
maintained a distinctive culture, shaped by Tae-Joon Park, who served as chairman for more
than twenty years (Amsden, 1989; Hayes & Cho, 1992).
2 World Bank report, quoted in Amsden (1989: 291). 3 POSCO was a major project in the Heavy and Chemical Industry (HCI) Plan, launched in 1972 as a part of five-step national economic planning. The HCI Plan focused on the “strategic industries” of iron and steel, machinery, non-ferrous metals, electronics, shipbuilding, and petrochemicals. The objective of this policy was to help overcome Korea’s limits of being a small domestic market, and emphasize construction of large-sized facilities to achieve economies of scale (Rhee, 1994.)
9
By the time it was privatized in 2000, POSCO had established its reputation as one of
the largest, most profitable, and productive steelmakers in the world. It was listed on the
Korea, New York, and London Stock Exchanges. It had re-established a strategic alliance
with its original partner, Nippon Steel. POSCO not only dominated the steel industry in
Korea, where the shipbuilding and automobile industries were main national exports, but by
2002, overseas sales represented 30.6% of POSCO’s production. Indeed, the rise of POSCO
was widely viewed as one of the great success stories of the Korean economy.
To assess POSCO’s historical performance, we now consider the basic methodology
of productivity measurement.
Measuring company productivity
Productivity measures
“Productivity” represents the efficiency with which physical inputs are converted to
useful outputs. Various productivity measures can be computed, depending on the treatment
of inputs and outputs. Single-factor productivity ratios, such as labor productivity or capital
productivity, give output per unit of a single input type. Multi-factor or total-factor
productivity ratios take into account the fact that multiple inputs are jointly used.4
In this study we emphasize productivity measures that are based on the concept of
value-added, which corresponds to the difference between the firm’s sales and its purchases
of raw materials and outside services. In computing the productivity measures, all inputs
and outputs must be taken as real rather than nominal quantities. Accordingly, all
4 Additional details on productivity measurement are provided in various sources including Coelli, Rao and Battese (1998), Lieberman, Lau and Williams (1990), Mammone (1980), and publications of the American Productivity Center.
10
accounting values of output and capital input must be adjusted for inflation, and the firm’s
capital stock must be depreciated in an economically-meaningful way.
Labor productivity is the most common productivity measure, partly because it is the
easiest to compute. Labor productivity corresponds to output per unit of labor input (or
value-added per worker-hour, as computed in this study). Labor productivity at the level of
the economy as a whole provides an indicator of a nation’s real income per capita, or average
economic welfare. Growth in labor productivity for an individual company helps to raise the
national average and hence contributes to the welfare of the nation as a whole.
Capital productivity is output per unit of capital input. Capital productivity is more
difficult to compute and more arbitrarily measured than labor productivity, since it requires
procedures for evaluating the magnitude of capital input. Unlike labor productivity, capital
productivity is not directly interpretable as an indicator of economic welfare, but it does
provide an indicator of the efficiency of resource use.
Measures of materials and energy productivity can also be computed. However,
most companies provide little public information on their raw materials and energy usage.
Moreover, these inputs are by definition excluded when output is measured in terms of value-
added. Therefore, we are forced to ignore materials and energy productivity in our analysis,
even though POSCO’s financial performance may depend, in part, on the efficiency with
which raw materials and energy are procured, transported and utilized in POSCO’s plants.
Labor and capital productivity are only partial indexes and can thus give misleading
indications. For example, labor productivity can often be augmented by simply raising the
level of capital input—i.e., at the expense of capital productivity. Indeed, companies that
make excessive investments in automation will see their overall efficiency fall, despite a gain
11
in labor productivity. Multi-factor productivity, which attempts to measure the change in
output net of the changes in all inputs, is commonly regarded as a more suitable measure of
overall efficiency. As computed in this study, multi-factor productivity is a weighted
average of labor and capital productivity.
Productivity statistics are conventionally developed and reported for national
industries. Numerous international comparative studies of productivity have been performed
at the industry level (e.g., Baily & Gersbach, 1995; Jorgenson, 1995; Van Ark & Pilat, 1993),
and statistical analysis has often been applied at this level to better understand the nature of
economic growth in emerging economies (e.g., Chen, 1997; Felipe, 1999; Norworthy &
Malmquist, 1983; Sato, 2005; Truett & Truett, 1997; Yuhn & Kwon, 2000). Identical
concepts apply for productivity comparisons at the level of individual companies, although
the data sources are different.
Data requirements
Our productivity measures for POSCO are derived from information in POSCO’s
annual financial reports from 1973 to 2003, supplemented by government data on the prices
of steel and capital goods. 5 (A file available from the authors gives details on the
productivity computations for POSCO and the methods for making international
comparisons.) The productivity estimates for representative US and Japanese steel
producers, which are compared with POSCO, are described in Lieberman and Johnson
(1999).
5 The data on value-added, capital investment, and total number of employees are from POSCO annual reports. Data on working hours are from POSCO’s internal reports and authors’ estimates. For most companies, working hours are not reported, although estimates can be developed from government data.
12
In this study, we emphasize the measurement of productivity based on the amount of
“value-added” by a company during its fiscal year. “Value-added” is simply the difference
between the firm’s total sales and its purchases of raw materials and contracted services.
Through the efforts of employees and the application of capital, the firm “adds value” to its
purchases of raw materials. In the steel industry the latter consist primarily of iron ore,
scrap, limestone, coal, and other energy inputs. POSCO’s nominal value-added was
calculated as the sum of all employee compensation, depreciation, operating income, and
(non-income) taxes.6 These data were gathered from POSCO’s annual financial reports
from 1973 to 2003. Nominal value-added was divided by a steel price deflator7 to give real
value-added, measured in constant 1995 won.
To compare values across international producers and over time, all monetary values
must be converted to a real common currency (in this study, constant 1980 yen). A
“purchasing power parity” approach was used for this purpose, based on relative steel prices
in the three countries. Output data for POSCO were first adjusted for inflation, using annual
steel prices identified by dividing the firm’s annual revenue by its output tonnage. The
resulting values in 1995 won were converted to 1995 yen, based on the 1995 ratio of steel
prices in Korea and Japan, and finally to 1980 yen, based on the change in Japanese steel
prices between 1980 and 1995. These calculations make use of the fact that steel is a
relatively homogeneous product that can serve as the basis for a purchasing power parity
exchange rate. In other industries (and for capital goods inputs in general) similar
6 Equivalently, value added can be computed by subtracting the costs of purchased materials, services and utilities from the firm’s total revenue. However, complete information on these items is seldom provided in company financial reports, so the summation approach is preferable. 7 This price deflator was calculated by dividing POSCO’s sales by its tons shipped, using data from annual reports data. Alternatively, a more general price deflator for the steel industry could be used. Such price deflators are commonly published by government sources and thus are available for most industries. For firms that are significantly diversified, a weighted average of industry price deflators is required.
13
calculations can be supported by government price indexes and purchasing power parity
exchange rates available in the literature.
Labor productivity
The standard measure of productivity reported in the steel industry is tons of steel
produced per worker-hour (or conversely, man-hours per ton). This measure requires a
physical measure of output (tons) and has some serious shortcomings (see Lieberman &
Johnson, 1999). Our measure of labor productivity, “value-added” per worker-hour, is more
general and can be computed for a range of industries. The two measures of labor productivity
in the steel industry are very highly correlated.
Capital productivity
We measure capital productivity as value-added per unit of capital stock. One
estimate of a firm’s capital stock is the value of its net property, plant, and equipment, as
reported in standard financial statements. Although readily available, such figures may be
subject to accounting biases. Given differences in accounting practices, the biases can vary
among firms and countries, particularly when inflation is a factor. To minimize these biases,
we use the “perpetual inventory method,” to estimate the real capital stock.8 This series can
be computed for a given firm, starting from the initial year of data, using the equation:
Real Capital Stock = Kt = (1-d) Kt-1 + It
8 For a more detailed explanation of this method, see Hulten and Wykoff (1981) and Lieberman, Lau and Williams (1990).
14
where Kt is the real capital stock in year t, d is the annual rate of economic depreciation, and It
is the firm’s gross investment in year t adjusted for inflation. We assume that d, the real
depreciation rate, was equal to 10%.9
Capital productivity is defined as:
Capital Productivity = Value-Added / Real Capital Stock,
where value-added and capital stock are measured in constant currency for the same base
year. A file available from the authors gives details of this calculation.
Multi-factor productivity
Taken alone, neither labor productivity nor capital productivity gives an overall
picture of a firm’s efficiency. Multi-factor productivity (MFP), which attempts to measure
the change in output net of the changes in all inputs, is commonly regarded as a more
appropriate measure. As computed in this study, multi-factor productivity is a weighted
average of labor and capital productivity, where the weights are determined by the relative
amounts of labor and capital employed by the firm.10
9 We considered 10% reasonable given the composition of the gross capital stock and the rates of economic depreciation estimated by Hulten and Wykoff (1981).
10 We used the following standard formula to compute multi-factor productivity:
Change in MFP from year t to year t+1 = [ln Qt+1 - ln Qt] - (1-st) [ln Kt+1 - ln Kt] - st [ln Lt+1 - ln Lt]
where Qt is the firm’s value-added in year t, Kt is the capital stock, Lt is labor input, st is the fraction of value added which is paid to employees, (1- st) is the fraction which goes implicitly as a payment to capital, and “ln” refers to logarithms. We set MFP for each year relative to a base index of 100 for POSCO in 1975. Ideally, materials and energy inputs should also be included in the MFP calculations, but sufficient information is not normally available in company annual financial reports. To perform inter-firm comparisons, we established each firm’s MFP relative to Nippon Steel in the year 1980 by substituting the comparison firm values for the t-subscripted variables, and values for Nippon Steel for the t-1 subscripted variables. Labor’s share, st , was taken as the average of the shares for Nippon and the comparison firm in 1980.
15
Productivity comparison among steel producers
We now draw comparisons between POSCO and integrated steelmakers in Japan and
the United States. A natural benchmark for comparison is Nippon Steel, historically the
largest Japanese steel company, which provided early technical assistance to POSCO and
serves as an alliance partner today. In addition, we selected NKK and Kawasaki Steel
(which merged in 2003 to form JFE) as representative Japanese steelmakers, and USX
(formerly United States Steel), as the representative producer in the United States. The data
for these companies were collected and analyzed in the same manner as that described for
POSCO.11
Figure 1 plots historical data on labor productivity, measured as real value added per
worker hour. Of the five companies, POSCO exhibits the highest rate of labor productivity
growth, and USX by far the lowest. In the late 1950s and early 1960s, USX’s value added
per worker hour was several times above the level of the three Japanese producers, but by the
turn of the millennium USX’s labor productivity was only about half that of its Japanese
rivals. The labor productivity level of POSCO, initially below that of the Japanese, reached
parity with the Japanese in the 1980s and exceeded the average Japanese level by the 1990s.
Although the patterns in Figure 1 are based on value added per worker hour, similar findings
hold when labor productivity is measured in terms of “tons per man-hour,” the metric more
commonly used in the steel industry.
[Insert Figure 1 about here]
11 The data and computations are described in Lieberman and Johnson (1996).
16
Labor productivity can be a misleading indicator for a number of reasons. In a
capital intensive industry such as steel making, labor costs today represent only a small
proportion of total costs, and hence efficient labor utilization can easily be offset by
inefficiencies in capital or materials use. Even if capital and labor are both utilized
efficiently, substitution between these inputs must be considered; other things equal, a more
capital intensive firm will show higher labor productivity. Moreover, by outsourcing
unskilled, low-wage service jobs such as cleaning and security, a firm can reduce headcount
without much change in value-added; hence, differences in outsourcing choices can affect the
measured labor productivity.
To shed light on potential substitution between capital and labor input, Figure 2 plots
the level of fixed investment per employee for the five producers. Annual measures of
capital stock were obtained using the perpetual inventory method described above. Based on
the assumption of a 10% annual depreciation rate for each of the five firms, this method helps
to standardize the capital stock measure and minimize the impact of inter-firm differences in
accounting.
[Insert Figure 2 about here]
As shown in Figure 2, POSCO’s fixed investment per employee exceeded that of the
Japanese producers almost from the opening of the Pohang Works. By 2003, POSCO’s
investment per worker had risen to about twice the level of Nippon Steel, and five times the
level of USX. NKK and Kawasaki maintained higher rates of investment than Nippon Steel
in recent decades, and their capital per employee becomes intermediate between Nippon and
POSCO. As shown previously in Table 1, POSCO’s high capital intensity stands out to a
similar extent when capital stock is measured relative to company output (tons shipped) rather
17
than employment. Such comparisons suggest that POSCO’s rapid growth in labor
productivity, evident in Figure 1, was derived at least in part from the firm’s high rate of
investment in plant and equipment.
It is perhaps surprising that despite Korea’s comparatively low wages and scarcity of
capital following the Korean War, POSCO has emerged as the World’s most capital-intensive
steel producer. Part of the explanation may lie in the South Korean government’s decision
to provide large financial subsidies for steel making and other heavy industries in the 1970s.
While the wisdom of this allocation of resources has been questioned (Auty, 1991; Stern et
al., 1995), in POSCO’s case there have been considerable benefits, not only in the firm’s
impressive growth and performance, but also indirectly through the availability of high-
quality steel to serve key downstream industries in Korea, such as auto making and
shipbuilding.
Given POSCO’s disproportionate investment, the firm’s capital productivity, defined
as value-added per unit of capital stock, remains below that of the other steel producers over
the entire period examined. For example, in 1993 POSCO’s capital productivity was 38%
below that of both Nippon and USX, and 17% below NKK. Roughly speaking, capital
productivity tends to be ranked across the companies in the reverse order of labor
productivity. This implies that the steel companies have made very different choices in
terms of degree of automation and capital labor ratio. POSCO, the youngest of the five
firms, has become the most capital intensive producer, whereas USX, the oldest firm, is the
least capital intensive. The fact that capital intensity is inversely correlated with age of firm
in this sample suggests that more recent entrants to the steel industry may have tended to
substitute more sophisticated capital equipment for labor in the production process. To some
18
extent, the evolution of integrated steelmaking technology has made this shift desirable from
the standpoint of product quality. However, differences in the cost of capital available to
steel producers may also be an explanation. In POSCO’s case, the Korean government
channeled investment funds at low interest rates to establish and grow a strong domestic
steelmaking firm. Although explicit capital subsidies were lacking in Japan, some analysts
have suggested that Japanese steel producers enjoyed a low cost of capital that American
companies could not match in the 1970s and 1980s (Lieberman & Johnson, 1999).
Differences in capital/labor intensity are motivated by technological substitution
possibilities available when a plant is built, and perhaps more importantly, by international
differences in factor prices. Economic theory predicts high capital intensity in countries
where wages are high relative to capital costs. In the case of steel, however, we find the
most capital-intensive producer, POSCO, in the country with the lowest historical labor costs;
whereas the least capital-intensive producer, USX, is in the country with the highest historical
labor costs. One possibility is that the capital subsidies in Korea were sufficient to offset the
early differential in labor costs. As wages have risen in Korea and Japan, one would expect
to find growth in the use of capital relative to labor, and indeed that is consistent with the
evidence. Yet, in recent years we have seen convergence in wage rates across the three
countries, but the differences across the five producers in the use of capital relative to labor
have been persistent. In general, there is little evidence to support the idea that inter-firm
differences in capital intensity should be positively correlated with differences in labor costs.
One possibility is that POSCO and the more capital intensive Japanese producers may have
over-invested in equipment and technology, despite the labor productivity and quality
benefits.
19
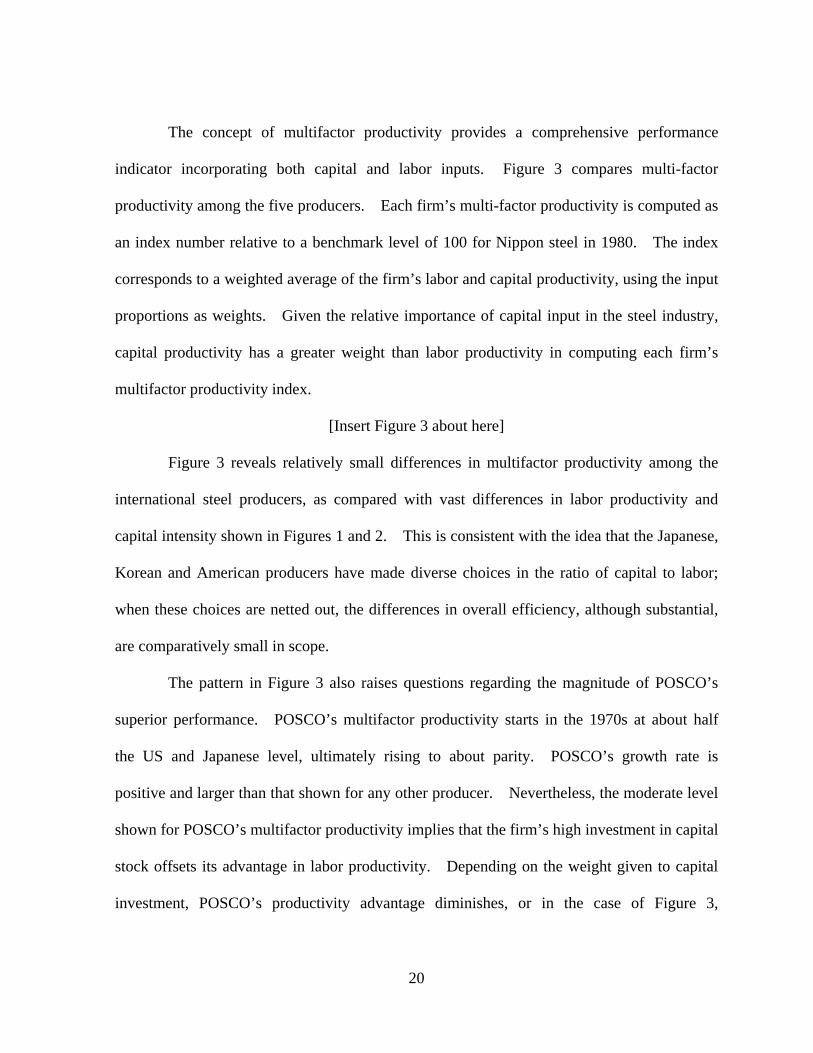
The concept of multifactor productivity provides a comprehensive performance
indicator incorporating both capital and labor inputs. Figure 3 compares multi-factor
productivity among the five producers. Each firm’s multi-factor productivity is computed as
an index number relative to a benchmark level of 100 for Nippon steel in 1980. The index
corresponds to a weighted average of the firm’s labor and capital productivity, using the input
proportions as weights. Given the relative importance of capital input in the steel industry,
capital productivity has a greater weight than labor productivity in computing each firm’s
multifactor productivity index.
[Insert Figure 3 about here]
Figure 3 reveals relatively small differences in multifactor productivity among the
international steel producers, as compared with vast differences in labor productivity and
capital intensity shown in Figures 1 and 2. This is consistent with the idea that the Japanese,
Korean and American producers have made diverse choices in the ratio of capital to labor;
when these choices are netted out, the differences in overall efficiency, although substantial,
are comparatively small in scope.
The pattern in Figure 3 also raises questions regarding the magnitude of POSCO’s
superior performance. POSCO’s multifactor productivity starts in the 1970s at about half
the US and Japanese level, ultimately rising to about parity. POSCO’s growth rate is
positive and larger than that shown for any other producer. Nevertheless, the moderate level
shown for POSCO’s multifactor productivity implies that the firm’s high investment in capital
stock offsets its advantage in labor productivity. Depending on the weight given to capital
investment, POSCO’s productivity advantage diminishes, or in the case of Figure 3,
20
disappears.12 Indeed, our calculations suggest that the overall productivity leader in recent
decades has been Nippon Steel, which began to moderate its plant and equipment investment
relative to NKK, Kawasaki and POSCO starting in the 1980s.
To summarize, POSCO’s labor productivity grew rapidly from the start of operations
and was the highest among the five major steel makers by the 1980s. Yet POSCO has been
more capital intensive than the other companies, which gives POSCO a comparatively modest
level of multi-factor productivity. In general, integrated steelmakers in each country have
made very different choices about the proportion of capital versus labor used in their factories.
The net result is that the five firms use vastly different amounts of capital investment per
worker, but have similar levels of multi-factor productivity. This raises questions about
POSCO’s superior performance. POSCO’s profitability and labor productivity advantage
can be attributed, in part, to the firm’s high capital intensity.
Conclusion
In this paper we have described methods for estimating the productivity of
manufacturing companies, using public data provided in many corporate financial statements.
We have shown how meaningful comparisons of labor and multi-factor productivity can be
drawn across companies operating in different countries. Such productivity comparisons
provide a supplement to more conventional, profit-based measures of firm performance.
12 These calculations are sensitive to the weights assigned to capital and labor input in the MFP formula, which are conventionally based on income shares. In the calculations underlying Figure 9, POSCO’s weights for labor input are lower than corresponding values for the US and Japanese producers, given that POSCO’s wages have been lower. POSCO’s proportion of value-added paid to labor ranged from 10% to 27% over the sample period, while the implicit proportion paid for capital services ranged from 73% to 90%. If the US or Japanese weights are used for POSCO, the firm’s MFP appears higher.
21
Our findings demonstrate the potential for using productivity metrics to assess the
performance of fast-rising companies in the world’s emerging economies.
Specifically, we have applied productivity methods to assess the historical
performance record of POSCO, a steel company that is commonly regarded as one of the
great success stories of the Korean economy. Although most assessments of POSCO have
been positive, there has been much disagreement about the company’s degree of success
(Amsden, 1989; Auty, 1991; D’Costa, 1994; Stern et al., 1995; Sato, 2005). Prior studies
have typically considered performance indicators such as labor productivity or profits relative
to revenue. As our analysis suggests, such indicators may be biased or misleading, given
POSCO’s high investment-intensity compared to rivals in Japan and the United States.
We have shown that POSCO’s capital investment, relative to sales, has been more
than twice the level of Nippon Steel and USX. Hence, relative to the threshold return on
sales necessary for these firms to earn their basic cost of capital, POSCO requires a return of
at least twice that level (assuming that firms have the same capital costs). Thus, part of the
superior return on sales achieved by POSCO is an artifact of POSCO’s higher capital intensity.
(A detailed assessment of POSCO’s financial performance is beyond the scope of this paper.)
Another view of these findings is that POSCO’s rise has been closely tied to the
process of capital accumulation. Analysts have praised POSCO’s rapid achievement of
efficient scale and the firm’s management and utilization of investment. By all accounts,
POSCO built its plants quickly and efficiently, and the firm has maintained high rates of
utilization over decades (Auty, 1991; Stern et al., 1995; Sato, 2005). Thus, there is little
evidence to suggest that POSCO has done a poor job of building or running its facilities.
One can argue, however, that POSCO may have invested more than the optimal amount of
22
capital as compared with foreign rivals. Such behavior may have been encouraged by the
investment subsidies initially provided by the Korean government.
Overall, this study highlights the advantage of considering multiple measures of firm
performance. Productivity and profitability are different metrics; successful performance in
one dimension does not necessarily imply success in the other. An inefficient firm can
achieve high profitability merely because it has access to low-cost labor, capital or materials.
Alternatively, a firm with high productivity will suffer financial losses if its input costs greatly
exceed those of competitors. Moreover, as we have shown, a firm may excel at one measure
of productivity at the expense of another, as in the case where greater investment augments
labor productivity at the expense of capital productivity. By considering a range of
performance indicators, the biases inherent in any single measure can be avoided.
Our example of POSCO demonstrates insights that can be drawn from productivity
analysis of a large-scale steel company. An American or European firm could have served
the same purpose, but given the quality of data and growing interest in POSCO as a global
company, POSCO provides a useful platform. Comparison of POSCO with major Japanese
and American competitors shows the value of using Asian companies to illustrate context-free
knowledge (Tsui, 2004) and test general theories (Meyer, 2006, 2007). Beyond the context
of the steel industry, the rapid rise of manufacturing companies throughout the Asia Pacific
region in recent decades provides a rich laboratory for additional productivity-oriented studies
on the determinants of success among challenger firms (Matthews, 2006).
23
References
Amsden, A. H. 1989. Asia’s next giant: South Korea and late industrialization. New York: Oxford University Press. Auty, R. M. 1991. Creating competitive advantage: South Korean steel and petrochemicals. Tijdschrift voor Econ. en Soc. Geografie, 82: 15-29 Baily, M. N. & Gersbach H. 1995. Efficiency in manufacturing and the need for global competition. Brookings Papers on Economic Activity (Microeconomics): 307-358. Bremner, B., Ihlwan, M. & Roberts, D. 2004. Posco: one sharp steelmaker. Business Week, August 30. Brynjolfsson, E. & Hitt, L. M. 2003. Computing productivity: firm-level evidence. Review of Economics and Statistics, 85: 793-808. Caves, R. E. 1992. Industrial efficiency in six nations. Cambridge, MA: MIT Press.,
Chen, E. K. Y. 1997. The total factor productivity debate: determinants of economic growth in East Asia. Asian-Pacific Economic Literature, 11: 18-38. Coelli, T. J., Rao, D. S. P. & Battese, G. E. 1998. An introduction to efficiency and productivity analysis. Boston: Kluwer. D’Costa, A. P. 1994. State, steel and strength: structural competitiveness and development in South Korea. The Journal of Development Studies, 31: 44-81. Duvall, M. 2002. POSCO: the next big steel. Baseline Magazine, 1(7): June.
Felipe, J. 1999. Total factor productivity growth in East Asia: a critical survey. The Journal of Development Studies, 34: 1-41. Hayes, R. H., & Cho, D-S. 1992. Pohang iron and steel company (POSCO). Harvard Business School Case #9-693-041. Hulten, C. R., & Wykoff, F. C. 1981. The measurement of economic depreciation. In C. R. Hulten (Ed.), Depreciation, inflation, and the taxation of income from capital, Washington, D.C.: The Urban Institute Press. Jorgenson, D.W. 1995. Productivity, vol. 2: international comparisons of economic growth. Cambridge, MA: MIT Press. Jorgenson, D. W. & Kuroda, M. 1992. Productivity and international competitiveness in Japan and the United States, 1960-1985. Economic Studies Quarterly, 43: 313-325.
24
Kaplan, R. S. & Norton, D. P. 1992. The balanced scorecard--measures that drive performance. Harvard Business Review, 70: 71-79. Lieberman, M. B., & Balsubramanian, N. 2007. Measuring value creation and its distribution among stakeholders of the firm. Working paper, UCLA Anderson School of Management. Lieberman, M. B., & Dhawan, R. 2005. Assessing the resource base of Japanese and U.S. auto producers: a stochastic frontier production function approach. Management Science, 51(7): 1060-1075. Lieberman, M. B., & Johnson, D. 1999. Comparative productivity of Japanese and US steel producers, 1958-1993. Japan and the World Economy, 11: 1-27. Lieberman, M. B., Lau, L. J., & Williams, M. D. 1990. Firm-level productivity and management influence: A comparison of U.S. and Japanese automobile producers. Management Science, 36: 1193-1215. Mammone, J. L. 1980. Productivity measurement: A conceptual overview. Management Accounting: 36-42. Mathews, J. A. 2006. Dragon multinationals: New players in 21st century globalization. Asia Pacific Journal of Management, 23: 5–27 Meyer, K. E. 2006. Asian Management research needs more self-confidence. Asia Pacific Journal of Management, 23:, 119-137. Meyer, K. E. 2007. Asian contexts and the search for general theory in management research: A rejoinder. Asia Pacific Journal of Management, 24: 527–534. Neely, A., Gregory, M., & Platts, K. 1995. Performance measurement system design: A literature review and research agenda. International Journal of Operations & Production Management, 15: 80-116. Norworthy, J.R., & Malmquist D.H. 1983. Input measurement and productivity growth in Japanese and US manufacturing. American Economic Review, 73: 947-967. Oum, T. H. & Yu, C. 1998. Winning airlines: Productivity and cost competitiveness of the world's major airlines. Boston: Kluwer. POSCO Annual Reports, 1968-2006. POSCO. 2003. Goldman Sachs. Rhee, J-C. 1994. The state and industry in South Korea: The limits of the authoritarian state. New York: Routledge.
25
Sato, H. 2005. ‘Total factor productivity versus realism’ revisited: the case of the South Korean steel industry. Cambridge Journal of Economics, 29: 635-655. Schefczyk, M. 1993. Operational performance of airlines: An extension of traditional measurement paradigms. Strategic Management Journal, 14: 301-317. Stern, J. J., Kim, J., Perkins, D. H. & Yoo, J. 1995. Industrialization and the state: the Korean heavy and chemical industry drive. Harvard Institute for International Development. Tsui, A.S. 2004. Contributing to global management knowledge: A case for high quality indigenous research. Asia Pacific Journal of Management, 21(4):, 491-513. Truett, L. J. and Truett, D. B. 1997. The Korean metals industry and economic development. Journal of Asian Economics, 8: 333-347. Tybout, J. R. 2000. Manufacturing firms in developing countries: how well do they do, and why? Journal of Economic Literature, 38: 11-44. Van Ark, B., & Pilat, D. 1993. Productivity levels in Germany, Japan, and the United States: Differences and causes. Brookings Papers on Economic Activity (Microeconomics): 1-69 Yuhn, K.-H. & Kwon, J.-K. 2000. Economic growth and productivity: a case study of South Korea. Applied Economics, 32: 13-23.
26
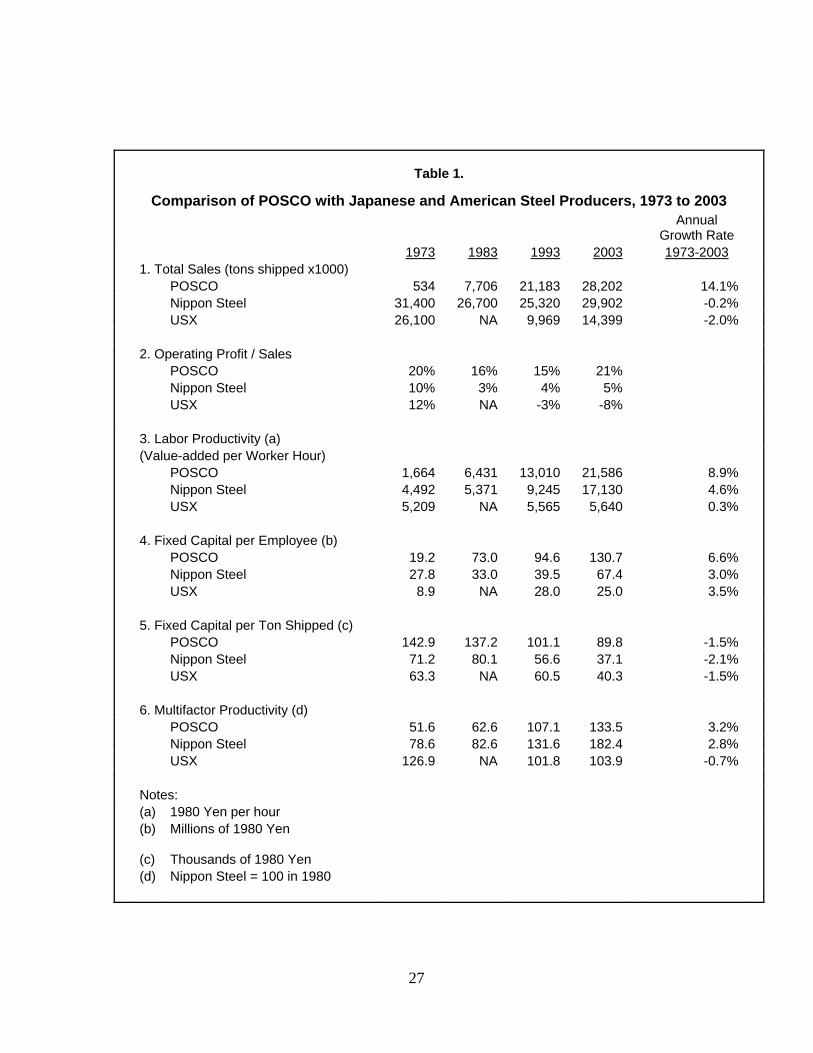
Table 1.
Comparison of POSCO with Japanese and American Steel Producers, 1973 to 2003
Annual
Growth Rate 1973 1983 1993 2003 1973-2003 1. Total Sales (tons shipped x1000) POSCO 534 7,706 21,183 28,202 14.1% Nippon Steel 31,400 26,700 25,320 29,902 -0.2% USX 26,100 NA 9,969 14,399 -2.0% 2. Operating Profit / Sales POSCO 20% 16% 15% 21% Nippon Steel 10% 3% 4% 5% USX 12% NA -3% -8% 3. Labor Productivity (a) (Value-added per Worker Hour) POSCO 1,664 6,431 13,010 21,586 8.9% Nippon Steel 4,492 5,371 9,245 17,130 4.6% USX 5,209 NA 5,565 5,640 0.3% 4. Fixed Capital per Employee (b) POSCO 19.2 73.0 94.6 130.7 6.6% Nippon Steel 27.8 33.0 39.5 67.4 3.0% USX 8.9 NA 28.0 25.0 3.5% 5. Fixed Capital per Ton Shipped (c) POSCO 142.9 137.2 101.1 89.8 -1.5% Nippon Steel 71.2 80.1 56.6 37.1 -2.1% USX 63.3 NA 60.5 40.3 -1.5% 6. Multifactor Productivity (d) POSCO 51.6 62.6 107.1 133.5 3.2% Nippon Steel 78.6 82.6 131.6 182.4 2.8% USX 126.9 NA 101.8 103.9 -0.7% Notes: (a) 1980 Yen per hour (b) Millions of 1980 Yen
(c) Thousands of 1980 Yen
(d) Nippon Steel = 100 in 1980
27
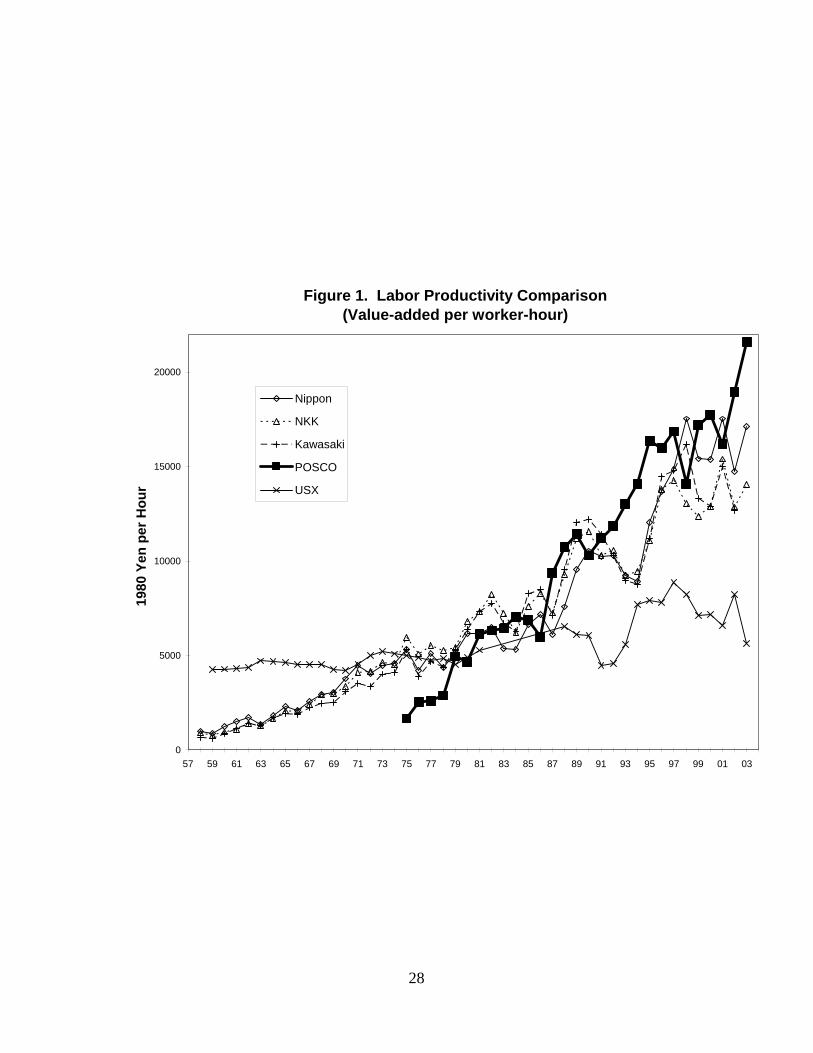
Figure 1. Labor Productivity Comparison(Value-added per worker-hour)
10000
15000
20000
1980
Yen
per
Hou
r
0
5000
57 59 61 63 65 67 69 71 73 75 77 79 81 83 85 87 89 91 93 95 97 99 01 03
Nippon
NKK
Kawasaki
POSCO
USX
28
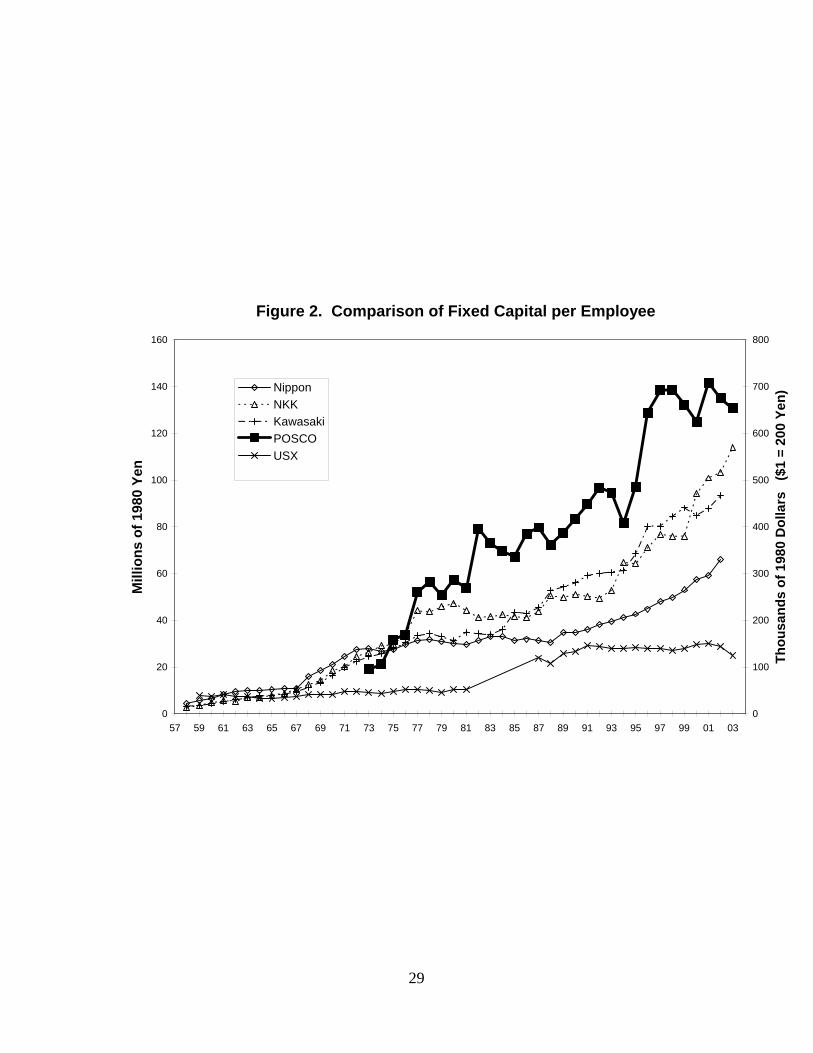
Figure 2. Comparison of Fixed Capital per Employee
80
100
120
140
160
ions
of 1
980
Yen
400
500
600
700
800
980
Dol
lars
($
1 =
200
Yen)
0
20
40
60
57 59 61 63 65 67 69 71 73 75 77 79 81 83 85 87 89 91 93 95 97 99 01 03
Mill
0
100
200
300
Thou
sand
s of
1
NipponNKKKawasakiPOSCOUSX
29
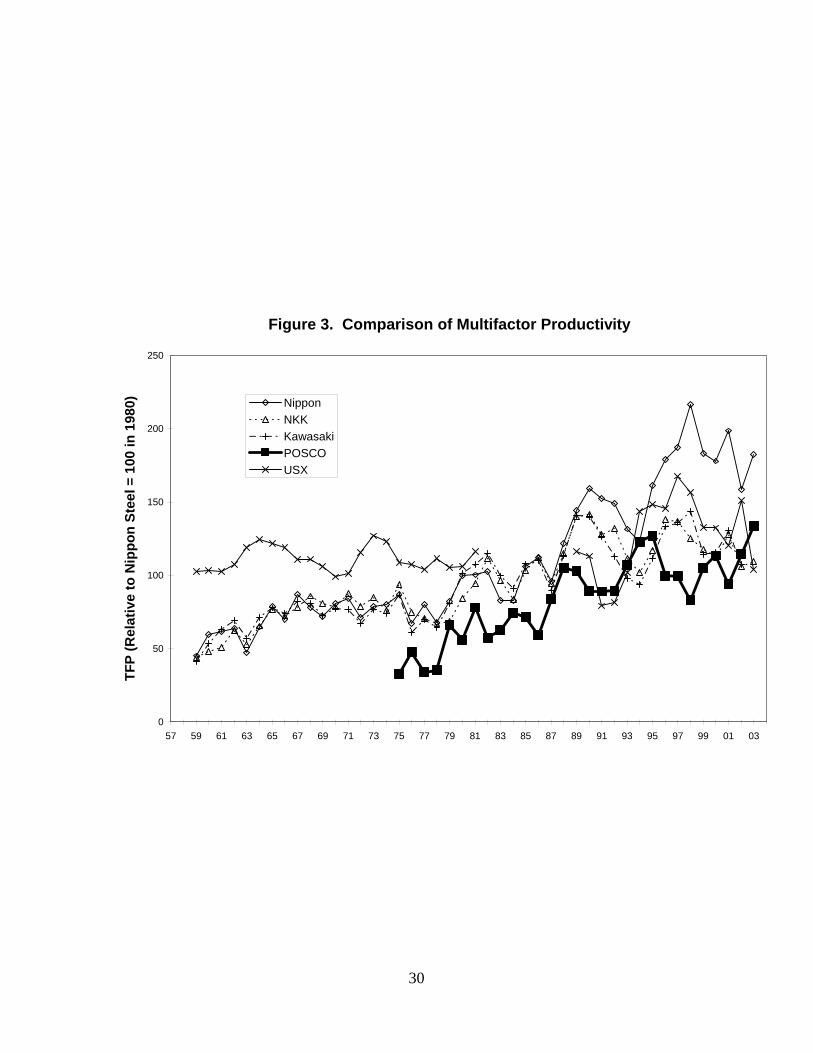
Figure 3. Comparison of Multifactor Productivity
150
200
250
on S
teel
= 1
00 in
198
0)
0
50
100
57 59 61 63 65 67 69 71 73 75 77 79 81 83 85 87 89 91 93 95 97 99 01 03
TFP
(Rel
ativ
e to
Nip
p
NipponNKKKawasakiPOSCOUSX
30