Embed Size (px)
Citation preview

Industry & State Level Value Added and ProductivityDecompositions
Shipei Zeng1, Stephanie Parsons1,3, W. Erwin Diewert1,2, and Kevin J.Fox1
1School of Economics, UNSW Sydney2Vancouver School of Economics, University of British Columbia
3Reserve Bank of Australia
November 29, 2018
Shipei Zeng & Stephanie Parsons Value added decomposition November 29, 2018 1 / 33
Identifying changes in value added
Value added decomposition
I Parametric and non-parametric estimation of production frontiers
I A recent decomposition proposed by Diewert and Fox (2017)• Free Disposal Hull (FDH) and index number theory• Rule out technical regress• A non-parametric approach involving only observable data
Shipei Zeng & Stephanie Parsons Value added decomposition November 29, 2018 2 / 33

Identifying changes in value added
Value added decomposition
I Value added decomposition for Australian market sector industries• 12 selected industries and 16 market sector industries• Decomposition at an aggregate level and an industry level• Sectoral explanations for Australian TFP change
I Simple enough to be implemented by national statistical offices• Data cubes from Australian Bureau of Statistics• R package: dfvad
Shipei Zeng & Stephanie Parsons Value added decomposition November 29, 2018 3 / 33
Methodology
Defining the optimal output value
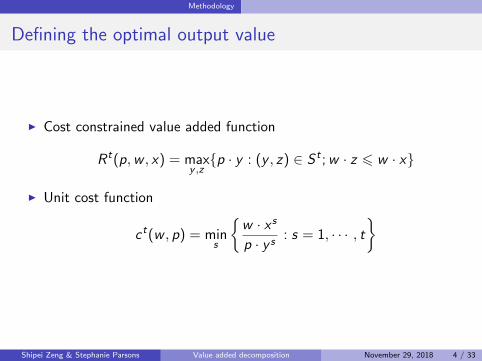
I Cost constrained value added function
Rt(p,w , x) = maxy ,z{p · y : (y , z) ∈ S t ;w · z 6 w · x}
I Unit cost function
ct(w , p) = mins
{w · x s
p · y s: s = 1, · · · , t
}
Shipei Zeng & Stephanie Parsons Value added decomposition November 29, 2018 4 / 33

Methodology
Defining the optimal output value
I Rewrite the cost constrained value added function
Rt(p,w , x) = maxs
{p · y s w · x
w · x s: s = 1, · · · , t
}=
w · xct(w , p)
I A sequential approach which rules out technical regress
Shipei Zeng & Stephanie Parsons Value added decomposition November 29, 2018 5 / 33
Methodology
Explanatory factors
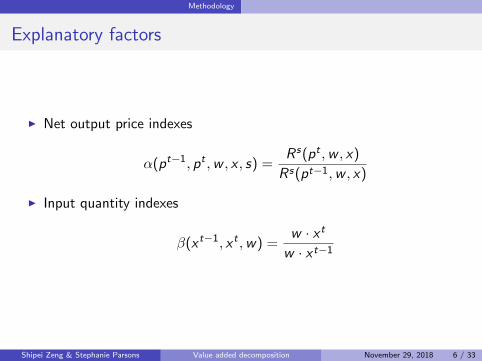
I Net output price indexes
α(pt−1, pt ,w , x , s) =Rs(pt ,w , x)
Rs(pt−1,w , x)
I Input quantity indexes
β(x t−1, x t ,w) =w · x t
w · x t−1
Shipei Zeng & Stephanie Parsons Value added decomposition November 29, 2018 6 / 33

Methodology
Explanatory factors
I Input mix indexes
γ(w t−1,w t , p, x , s) =Rs(p,w t , x)
Rs(p,w t−1, x)
I Returns to scale
δ(x t−1, x t , p,w , s) =Rs(p,w , x t)/Rs(p,w , x t−1)
w · x t/w · x t−1
= 1
Shipei Zeng & Stephanie Parsons Value added decomposition November 29, 2018 7 / 33
Methodology
Explanatory factors
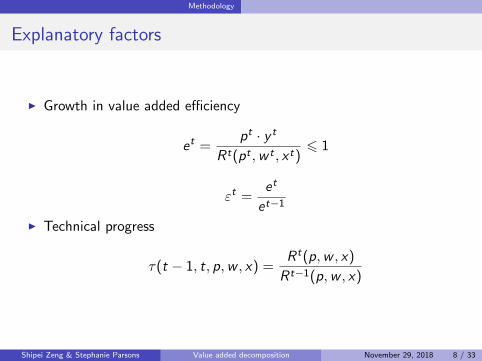
I Growth in value added efficiency
et =pt · y t
Rt(pt ,w t , x t)6 1
εt =et
et−1
I Technical progress
τ(t − 1, t, p,w , x) =Rt(p,w , x)
Rt−1(p,w , x)
Shipei Zeng & Stephanie Parsons Value added decomposition November 29, 2018 8 / 33

Methodology
Straightforward decomposition
I Value added growth decomposition
pt · y t
pt−1 · y t−1= αt · βt · γt · εt · τ t
I TFP growth decomposition
TFPG t =pt · y t/pt−1 · y t−1
αt · βt
= γt · εt · τ t
Shipei Zeng & Stephanie Parsons Value added decomposition November 29, 2018 9 / 33

Methodology
A weighted average industry approach
I Tornqvist explanatory factors: λ ∈ {α, β, γ, ε, τ}
lnλt• =K∑
k=1
1
2(skt + sk,t−1) lnλkt
I Approximation of value relatives
ln
(v t
v t−1
)≈
K∑k=1
1
2
(skt + sk,t−1
)ln
(vkt
vk,t−1
)
=K∑
k=1
1
2
(skt + sk,t−1
)ln(αktβktγktεktτkt
)= lnαt• + lnβt• + ln γt• + ln εt• + ln τ t•
Shipei Zeng & Stephanie Parsons Value added decomposition November 29, 2018 10 / 33

Methodology
Establishing a benchmark
I t = 1A1 = 1,B1 = 1,C 1 = 1,E 1 = 1,T 1 = 1
I t > 1
At = αtAt−1,Bt = βtBt−1,C t = γtC t−1
E t = εtE t−1,T t = τ tT t−1
I Level value of productivity
TFPt =pt · y t
p1 · y1 · At · Bt
= C tE tT t
Shipei Zeng & Stephanie Parsons Value added decomposition November 29, 2018 11 / 33

Data
Australian market sector
I 16 industries with productivity data available 1994/95-2016/17(July-June years)
I 12 industries with productivity data available 1989/90-2016/17(July-June years)
I Concerns about measurement problems and research periods
Shipei Zeng & Stephanie Parsons Value added decomposition November 29, 2018 12 / 33

Data
Australian market sector
Table 1: Industry classification of the market sector in Australia
Division Industry
A Agriculture, Forestry and FishingB MiningC ManufacturingD Electricity, Gas, Water and Waste ServicesE ConstructionF Wholesale TradeG Retail TradeH Accommodation and Food ServicesI Transport, Postal and WarehousingJ Information, Media and TelecommunicationsK Financial and Insurance ServicesL Rental, Hiring and Real Estate ServicesM Professional, Scientific and Technical ServicesN Administrative and Support ServicesR Arts and Recreation ServicesS Other Services
Shipei Zeng & Stephanie Parsons Value added decomposition November 29, 2018 13 / 33

Industry-level decomposition
Productivity of 12 selected industries
0.00
0.05
0.10
0.15
0.20
0.25
1990 1992 1994 1996 1998 2000 2002 2004 2006 2008 2010 2012 2014 2016
Lo
g I
nd
ex
ABS (12)
DF Method with ABS Aggregates
Weighted Industry Aggregation Method
Shipei Zeng & Stephanie Parsons Value added decomposition November 29, 2018 14 / 33

Industry-level decomposition
DF Method with ABS aggregates
-0.15
-0.10
-0.05
0.00
0.05
0.10
0.15
0.20
0.25
0.30
0.35
1990 1992 1994 1996 1998 2000 2002 2004 2006 2008 2010 2012 2014 2016
Lo
g I
nd
ex
lnT
lnE
lnC
lnTFP
Shipei Zeng & Stephanie Parsons Value added decomposition November 29, 2018 15 / 33

Industry-level decomposition
Weighted industry aggregation method
-0.15
-0.10
-0.05
0.00
0.05
0.10
0.15
0.20
0.25
0.30
0.35
1990 1992 1994 1996 1998 2000 2002 2004 2006 2008 2010 2012 2014 2016
Lo
g I
nd
ex
lnT
lnE
lnC
lnTFP
Shipei Zeng & Stephanie Parsons Value added decomposition November 29, 2018 16 / 33
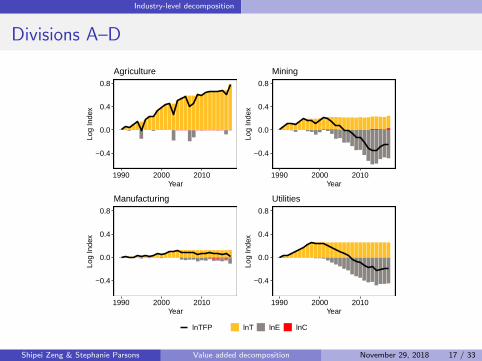
Industry-level decomposition
Divisions A–D
−0.4
0.0
0.4
0.8
1990 2000 2010Year
Log
Inde
x
Agriculture
−0.4
0.0
0.4
0.8
1990 2000 2010Year
Log
Inde
x
Mining
−0.4
0.0
0.4
0.8
1990 2000 2010Year
Log
Inde
x
Manufacturing
−0.4
0.0
0.4
0.8
1990 2000 2010Year
Log
Inde
x
Utilities
lnTFP lnT lnE lnC
Shipei Zeng & Stephanie Parsons Value added decomposition November 29, 2018 17 / 33

Industry-level decomposition
Divisions E–H
−0.4
0.0
0.4
0.8
1990 2000 2010Year
Log
Inde
x
Construction
−0.4
0.0
0.4
0.8
1990 2000 2010Year
Log
Inde
x
Wholesale
−0.4
0.0
0.4
0.8
1990 2000 2010Year
Log
Inde
x
Retail
−0.4
0.0
0.4
0.8
1990 2000 2010Year
Log
Inde
x
Accommodation
lnTFP lnT lnE lnC
Shipei Zeng & Stephanie Parsons Value added decomposition November 29, 2018 18 / 33
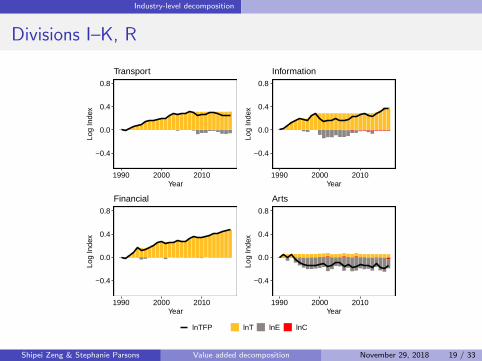
Industry-level decomposition
Divisions I–K, R
−0.4
0.0
0.4
0.8
1990 2000 2010Year
Log
Inde
x
Transport
−0.4
0.0
0.4
0.8
1990 2000 2010Year
Log
Inde
x
Information
−0.4
0.0
0.4
0.8
1990 2000 2010Year
Log
Inde
x
Financial
−0.4
0.0
0.4
0.8
1990 2000 2010Year
Log
Inde
x
Arts
lnTFP lnT lnE lnC
Shipei Zeng & Stephanie Parsons Value added decomposition November 29, 2018 19 / 33

Industry-level decomposition
Thoughts on the industry results
I Only 4 industries showed considerable technical progress beyond 2004• Agriculture, forestry and fishing• Retail trade• Wholesale trade• Financial and insurance services
I Some industries showed little technical progress even earlier than the2004 peak
• Mining (1996)• Electricity, gas, water and waste services (1998)• Information, media and telecommunications (1999)• Arts and recreation services (1991)
Shipei Zeng & Stephanie Parsons Value added decomposition November 29, 2018 20 / 33

Industry-level decomposition
Thoughts on the industry results
I The amount of inefficiency for some industries was huge• Manufacturing• Mining• Electricity, gas, water and waste services• Accommodation and food services• Arts and recreation services
I Some of this inefficiency is probably real and some of it probablyindicates mismeasurement of inputs and outputs
Shipei Zeng & Stephanie Parsons Value added decomposition November 29, 2018 21 / 33

Industry-level decomposition
Industry contribution: value added shares
0.00
0.25
0.50
0.75
1.00
1990 1992 1994 1996 1998 2000 2002 2004 2006 2008 2010 2012 2014 2016Year
Sha
re
AgricultureMiningManufacturingUtilitiesConstructionWholesaleRetailAccommodationTransportInformationFinancialArts
Shipei Zeng & Stephanie Parsons Value added decomposition November 29, 2018 22 / 33
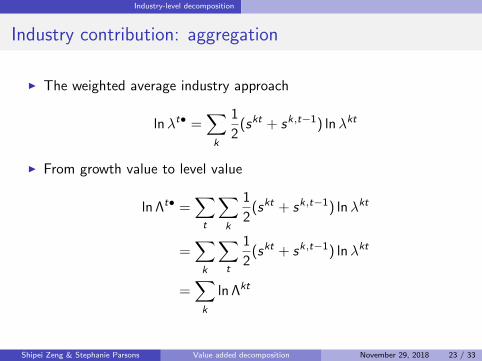
Industry-level decomposition
Industry contribution: aggregation
I The weighted average industry approach
lnλt• =∑k
1
2(skt + sk,t−1) lnλkt
I From growth value to level value
ln Λt• =∑t
∑k
1
2(skt + sk,t−1) lnλkt
=∑k
∑t
1
2(skt + sk,t−1) lnλkt
=∑k
ln Λkt
Shipei Zeng & Stephanie Parsons Value added decomposition November 29, 2018 23 / 33

Industry-level decomposition
Industry contribution: productivity
−0.05
0.00
0.05
0.10
0.15
0.20
0.25
1991 1993 1995 1997 1999 2001 2003 2005 2007 2009 2011 2013 2015 2017Year
Log
Inde
x
lnTFP_WI
Contributions from:AgricultureMiningManufacturingUtilitiesConstructionWholesaleRetailAccommodationTransportInformationFinancialArts
Shipei Zeng & Stephanie Parsons Value added decomposition November 29, 2018 24 / 33

Industry-level decomposition
Industry contribution: efficiency
−0.12
−0.10
−0.08
−0.06
−0.04
−0.02
0.00
1991 1993 1995 1997 1999 2001 2003 2005 2007 2009 2011 2013 2015 2017Year
Log
Inde
x
lnE
Contributions from:AgricultureMiningManufacturingUtilitiesConstructionWholesaleRetailAccommodationTransportInformationFinancialArts
Shipei Zeng & Stephanie Parsons Value added decomposition November 29, 2018 25 / 33
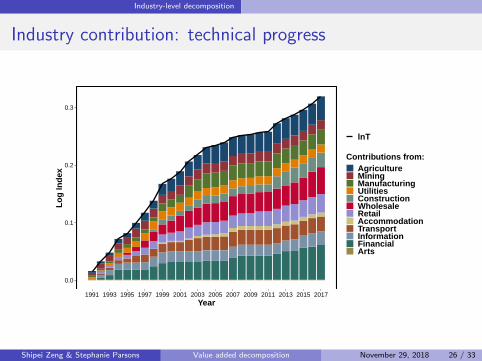
Industry-level decomposition
Industry contribution: technical progress
0.0
0.1
0.2
0.3
1991 1993 1995 1997 1999 2001 2003 2005 2007 2009 2011 2013 2015 2017Year
Log
Inde
x
lnT
Contributions from:AgricultureMiningManufacturingUtilitiesConstructionWholesaleRetailAccommodationTransportInformationFinancialArts
Shipei Zeng & Stephanie Parsons Value added decomposition November 29, 2018 26 / 33

Industry-level decomposition
Thoughts on the industry results
I Industry performance contributes to the aggregate level according tovalue added shares
I Efficiency• Unweighted: electricity, gas, water and waste services• Weighted: mining
I Technical progress• Unweighted: agriculture, forestry and fishing• Weighted: financial and insurance services
Shipei Zeng & Stephanie Parsons Value added decomposition November 29, 2018 27 / 33
State-level decomposition
State-level data
I ABS published the first (experimental) estimates of state TFP inJanuary 2018 for 1994/95 to 2016/17
I Data cover 12 selected industries (aggregate only)
I Less-populated states more prone to measurement error and volatility
Shipei Zeng & Stephanie Parsons Value added decomposition November 29, 2018 28 / 33
State-level decomposition
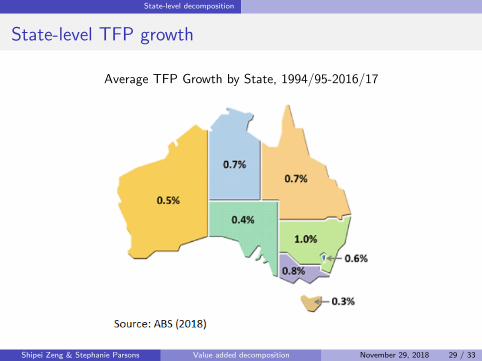
State-level TFP growth
Average TFP Growth by State, 1994/95-2016/17
Shipei Zeng & Stephanie Parsons Value added decomposition November 29, 2018 29 / 33

State-level decomposition
Non-mining states
−0.1
0.0
0.1
0.2
1995 2005 2015Year
Log
Inde
x
NSW
−0.1
0.0
0.1
0.2
1995 2005 2015Year
Log
Inde
x
VIC
−0.1
0.0
0.1
0.2
1995 2005 2015Year
Log
Inde
x
TAS
−0.1
0.0
0.1
0.2
1995 2005 2015Year
Log
Inde
x
ACT
lnTFP lnT lnE lnC
Shipei Zeng & Stephanie Parsons Value added decomposition November 29, 2018 30 / 33
State-level decomposition
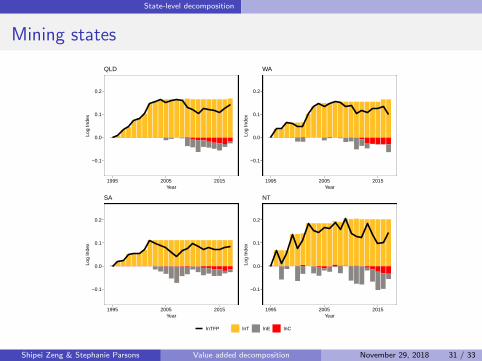
Mining states
−0.1
0.0
0.1
0.2
1995 2005 2015Year
Log
Inde
x
QLD
−0.1
0.0
0.1
0.2
1995 2005 2015Year
Log
Inde
x
WA
−0.1
0.0
0.1
0.2
1995 2005 2015Year
Log
Inde
x
SA
−0.1
0.0
0.1
0.2
1995 2005 2015Year
Log
Inde
x
NT
lnTFP lnT lnE lnC
Shipei Zeng & Stephanie Parsons Value added decomposition November 29, 2018 31 / 33

State-level decomposition
State-level decomposition
−0.1
0.0
0.1
0.2
1995 2005 2015Year
Log
Inde
x
NSW
−0.1
0.0
0.1
0.2
1995 2005 2015Year
Log
Inde
x
VIC
−0.1
0.0
0.1
0.2
1995 2005 2015Year
Log
Inde
x
QLD
−0.1
0.0
0.1
0.2
1995 2005 2015Year
Log
Inde
x
SA
−0.1
0.0
0.1
0.2
1995 2005 2015Year
Log
Inde
x
WA
−0.1
0.0
0.1
0.2
1995 2005 2015Year
Log
Inde
x
TAS
−0.1
0.0
0.1
0.2
1995 2005 2015Year
Log
Inde
x
NT
−0.1
0.0
0.1
0.2
1995 2005 2015Year
Log
Inde
x
ACT
lnTFP lnT lnE lnC
Shipei Zeng & Stephanie Parsons Value added decomposition November 29, 2018 32 / 33

Conclusions
Conclusions
I We have used a new decomposition of industry value added growth,applied to official, publicly available data from the ABS
I The role of inefficiency proved to be very large for many industriesand states
• We think that this result is more reasonable than simply interpretingnegative TFP growth as technological regress
• Industries and states with huge amounts of inefficiency should beinvestigated for possible mismeasurement of the underlying inputs andoutputs
I Our method is easily implementable by national statistical offices andprovides policy-relevant information on growth and productivity
Shipei Zeng & Stephanie Parsons Value added decomposition November 29, 2018 33 / 33

Agriculture, Forestry and Fishing
0.00
0.25
0.50
0.75
1990 1993 1996 1999 2002 2005 2008 2011 2014 2017Year
Log
Inde
x
lnTFP lnT lnE lnC
Shipei Zeng & Stephanie Parsons Value added decomposition November 29, 2018 1 / 20

Mining
−0.6
−0.4
−0.2
0.0
0.2
1990 1993 1996 1999 2002 2005 2008 2011 2014 2017Year
Log
Inde
x
lnTFP lnT lnE lnC
Shipei Zeng & Stephanie Parsons Value added decomposition November 29, 2018 2 / 20

Manufacturing
−0.10
−0.05
0.00
0.05
0.10
1990 1993 1996 1999 2002 2005 2008 2011 2014 2017Year
Log
Inde
x
lnTFP lnT lnE lnC
Shipei Zeng & Stephanie Parsons Value added decomposition November 29, 2018 3 / 20
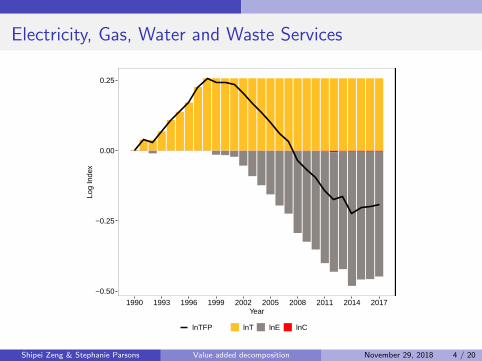
Electricity, Gas, Water and Waste Services
−0.50
−0.25
0.00
0.25
1990 1993 1996 1999 2002 2005 2008 2011 2014 2017Year
Log
Inde
x
lnTFP lnT lnE lnC
Shipei Zeng & Stephanie Parsons Value added decomposition November 29, 2018 4 / 20

Construction
−0.1
0.0
0.1
0.2
1990 1993 1996 1999 2002 2005 2008 2011 2014 2017Year
Log
Inde
x
lnTFP lnT lnE lnC
Shipei Zeng & Stephanie Parsons Value added decomposition November 29, 2018 5 / 20

Wholesale Trade
0.0
0.2
0.4
0.6
1990 1993 1996 1999 2002 2005 2008 2011 2014 2017Year
Log
Inde
x
lnTFP lnT lnE lnC
Shipei Zeng & Stephanie Parsons Value added decomposition November 29, 2018 6 / 20

Retail Trade
0.0
0.1
0.2
0.3
0.4
1990 1993 1996 1999 2002 2005 2008 2011 2014 2017Year
Log
Inde
x
lnTFP lnT lnE lnC
Shipei Zeng & Stephanie Parsons Value added decomposition November 29, 2018 7 / 20

Accommodation and Food Services
−0.10
−0.05
0.00
0.05
0.10
0.15
1990 1993 1996 1999 2002 2005 2008 2011 2014 2017Year
Log
Inde
x
lnTFP lnT lnE lnC
Shipei Zeng & Stephanie Parsons Value added decomposition November 29, 2018 8 / 20

Transport, Postal and Warehousing
0.0
0.1
0.2
0.3
1990 1993 1996 1999 2002 2005 2008 2011 2014 2017Year
Log
Inde
x
lnTFP lnT lnE lnC
Shipei Zeng & Stephanie Parsons Value added decomposition November 29, 2018 9 / 20

Information, Media and Telecommunications
0.0
0.2
0.4
1990 1993 1996 1999 2002 2005 2008 2011 2014 2017Year
Log
Inde
x
lnTFP lnT lnE lnC
Shipei Zeng & Stephanie Parsons Value added decomposition November 29, 2018 10 / 20

Financial and Insurance Services
0.0
0.1
0.2
0.3
0.4
1990 1993 1996 1999 2002 2005 2008 2011 2014 2017Year
Log
Inde
x
lnTFP lnT lnE lnC
Shipei Zeng & Stephanie Parsons Value added decomposition November 29, 2018 11 / 20

Arts and Recreation Services
−0.2
−0.1
0.0
1990 1993 1996 1999 2002 2005 2008 2011 2014 2017Year
Log
Inde
x
lnTFP lnT lnE lnC
Shipei Zeng & Stephanie Parsons Value added decomposition November 29, 2018 12 / 20
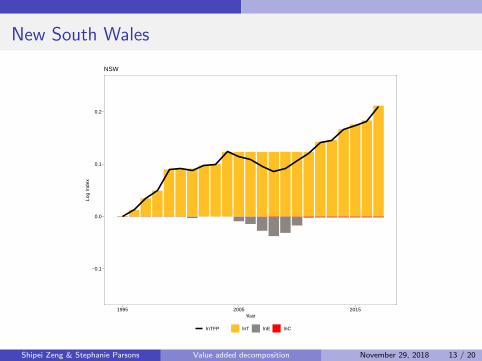
New South Wales
−0.1
0.0
0.1
0.2
1995 2005 2015Year
Log
Inde
x
NSW
lnTFP lnT lnE lnC
Shipei Zeng & Stephanie Parsons Value added decomposition November 29, 2018 13 / 20

Victoria
−0.1
0.0
0.1
0.2
1995 2005 2015Year
Log
Inde
x
VIC
lnTFP lnT lnE lnC
Shipei Zeng & Stephanie Parsons Value added decomposition November 29, 2018 14 / 20

Queensland
−0.1
0.0
0.1
0.2
1995 2005 2015Year
Log
Inde
x
QLD
lnTFP lnT lnE lnC
Shipei Zeng & Stephanie Parsons Value added decomposition November 29, 2018 15 / 20

South Australia
−0.1
0.0
0.1
0.2
1995 2005 2015Year
Log
Inde
x
SA
lnTFP lnT lnE lnC
Shipei Zeng & Stephanie Parsons Value added decomposition November 29, 2018 16 / 20

Western Australia
−0.1
0.0
0.1
0.2
1995 2005 2015Year
Log
Inde
x
WA
lnTFP lnT lnE lnC
Shipei Zeng & Stephanie Parsons Value added decomposition November 29, 2018 17 / 20

Tasmania
−0.1
0.0
0.1
0.2
1995 2005 2015Year
Log
Inde
x
TAS
lnTFP lnT lnE lnC
Shipei Zeng & Stephanie Parsons Value added decomposition November 29, 2018 18 / 20
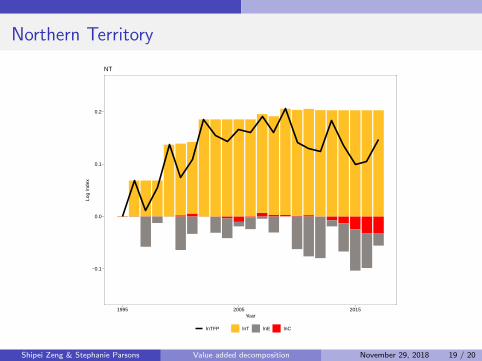
Northern Territory
−0.1
0.0
0.1
0.2
1995 2005 2015Year
Log
Inde
x
NT
lnTFP lnT lnE lnC
Shipei Zeng & Stephanie Parsons Value added decomposition November 29, 2018 19 / 20

Australian Capital Territory
−0.1
0.0
0.1
0.2
1995 2005 2015Year
Log
Inde
x
ACT
lnTFP lnT lnE lnC
Shipei Zeng & Stephanie Parsons Value added decomposition November 29, 2018 20 / 20