Embed Size (px)
Citation preview
1
Majeure Finance 2016
Master Thesis1
Measure of value creation in LBOs
Julia Codron
Abstract
This paper aims at introducing a new approach in the measure of value creation by
providing tools to measure value originated by LBOs. For four of the stakeholders that we
identify, the target company, its employees, its competitors and the Private Equity Fund, we
introduce a utility function assessing the impact of a particular LBO, derived from a set of
measures that we introduce. The function is meant to capture the whole value created for a party
and yields one result by stakeholder. We base our sets of measures on an extensive review of
the academic literature, as well as on our own recommendations. We eventually apply our
framework to the Hilton Hotels case study, and find that the empirical hierarchy of “winners”
and “losers” is actually rather counterintuitive.
1 I would like to address my special thanks to Patrick Legland, who helped me defining the scope of this paper
and provided me with useful advice throughout my research.
2
Table of contents
Introduction .............................................................................................................................. 3
Section I – Literature review on measures of value creation in LBO operations .............. 6
A – Exhaustive list of parties involved in an LBO operation.................................................. 7
B – Classical financial measures of value creation .............................................................. 17
C – Recent research focused on discretionary collateral effects.......................................... 32
Section II – Recommended approach to measure value creation in LBO operations ..... 44
A – Multi-temporal computation of value creation for each stakeholder............................. 45
B – Determination of utility functions .................................................................................. 78
Section III – The Hilton Hotels Case Study ......................................................................... 85
A – “The most successful LBO in history” ........................................................................... 86
B – Application of recommended measures of value creation.............................................. 91
C – Analysis of results ........................................................................................................ 117
Conclusion ............................................................................................................................. 123
Appendices ............................................................................................................................ 125
References ............................................................................................................................. 132
3
Introduction
The Leveraged Buyouts (LBO) industry has been the subject of many controversies over
the past decades, especially regarding its impact on the target company. The main criticism
against LBOs argues that Private Equity (PE) Funds, in order to boost their financial return,
usually launch drastic cost-cutting plans at the expense of the company’s employment,
investment policy, quality of working conditions, Research & Development programs, etc.
Because of such a short-term view, PE Funds extract most of the value created by the LBO and
leave the target company with endangered sustainability. The distribution of value created
through the LBO seems greatly favourable to the PE Fund, while the rest of stakeholders end
up with very little improvement of their situations prior LBO, or even worsening of their
situations.
This popular negative view of LBOs, is however being balanced by strong advocates of
the PE industry, who claim that LBOs are also beneficial to the target company and to some
other stakeholders. Research on these topics has yield different, and sometimes opposite,
results. On the issue of employment, which is often targeted, academic papers have studied
samples of hundreds of LBO transactions within a country and found that LBOs are either job
creative (Amess K. and Wright M., 2007; Boucly Q., Sraer D. and Thesmar D., Job Creating
LBOs, 2009; Olsson M. and Tag J., 2012) or job destructive (Antoni M., Maug E. and
Obernberger S., 2015).
The same level of heterogeneity in observations is to be found when investigating other
related topics, such as the target company’s policies of investment (Servaes H., 1994;
Desbrières P. and Schatt A., 1995) or innovation (Lerner J., Sorensen M. and Strömberg P.,
2008; Amess K., Stiebale J. and Wright M., 2015; Frontier Economics, 2013).
Beyond the results themselves, this strong trend in academic research raises the issue of
value creation within the LBO transaction. While the main indicator of value generated by the
LBO used by practitioners in the PE industry is the financial return, the growing interest in
collateral effects of LBOs implies that the rest of stakeholders have some value involved in the
transaction, which is not captured by the PE Fund’s financial return. The main difference is that
part of this “hidden” value is qualitative. In the case of the target company, for example, LBOs
can have a negative impact regarding its future sustainability; through cost cuttings, cash
extraction or pressure put on the management and employees, the LBO may deteriorate the
health of the company and jeopardize its ability to perform in the future. But how can we
measure this value, when part of it is qualitative?
While more and more academics enlarge the scope of value involved in an LBO
operation to include other stakeholders than the PE Fund, most of them restrain it to the Fund
and the target company only. Value created for the Fund is then captured through the financial
return, and that of the target company, when taken into account, is translated in terms of
4
financial performance (Liu C., 2013; Varaiya N. and Kerin R., 1987; Nikoskelainen E. and
Wright M., 2005). When measuring total value creation in an LBO transaction, very few
research papers, if none, put on the same level both financial value created, i.e. measured by
returns or performance, and value generated through qualitative aspects, like innovative
appetite, improvements in a firm’s reputation or in its ability to provide motivating working
conditions for its employees.
The goal of this paper is not to find whether LBOs have a positive or negative impact
on each stakeholder’s initial situation, but to provide a set of measures and tools for further
studies to investigate such questions. Our contribution consists first in identifying stakeholders
involved, directly or indirectly, in an LBO transaction, which will be mentioned as “parties”.
For four of them, which are the target company itself, its employees, its competitors and the PE
Fund, we define all-encompassing drivers of value and provide quantitative measures
associated to each of them. To each party is attributed an exhaustive set of measures, designed
to assess value creation, as a whole, originated by the LBO. Finally, in order to be able to
compare value generated among parties and to observe empirical “winners” and “losers”, we
build utility functions measuring value creation for each party.
The first section of the paper draws a review of the existing literature regarding
measures of value creation in an LBO transaction. In this section, we explore the different
stakeholders and what type of value they have involved in the LBO. We then list existing
measures provided by academic research to assess that value prior and post LBO, and see that
they usually refer only to financial aspects. In the second part of the paper, we examine all
aspects attached to value for the different parties, quantitative and qualitative, and define a set
of measures to assess total value creation, based on the academic literature as well as on
unrelated fields, like occupational medicine, and on our own recommendations. Consequently,
we build utility functions enabling value creation to be comparable across parties. Finally, in
the third section, we apply our recommended sets of measures to the Hilton Hotels case study,
which went under LBO from 2007 to 2013, and draw an empirical profile of “winners” and
“losers”. This case is particularly interesting to our framework as it takes place during the
financial crisis, which may require to adjust some of the measures introduced.
In this paper, we leave aside the risk component of value. For example, we measure
potential benefits of an LBO transaction for the target company, like financial performance or
improved reputation, but we do not incorporate in it the risk taken in the LBO transaction, such
as the financial leverage. The utility functions provided only assess the improvement or
deterioration of the party’s initial situation, i.e. prior LBO, without assessing both the level of
initial risk of the party and the additional risk willingly taken during the LBO transaction.
However, we incorporate in the utility function of a party the risk taken by a third party,
therefore passively suffered by the party in matter. This risk is then considered a loss in value
for the party in matter. For example, employees suffer the risk taken from financial leverage,
as it jeopardizes the sustainability of the target company, and hence their job position. This risk

5
is not undertaken by employees, and is therefore considered a deterioration of their initial
situation and is incorporated in their utility function.
6
Section I – Literature review on measures of value creation in LBO operations
In this section, we explore the existing literature dealing with measures of value in
LBOs. Some of the academic papers mentioned directly discuss the matter, and make it core to
their research, while others focus on sources of value creation or collateral effects of LBOs. In
the case when measures of value are the main topic, we report the findings and discuss the paper
as a whole. In the case when measures of value are secondary to the main subject, we extract
the measures of value creation used to support the paper’s theory, and focus on the measures in
a standalone approach, i.e. without discussing the rest of the paper.
Part of the papers reviewed below study value creation in frames different than LBOs,
but relatively similar, like M&A transactions. We then extract measures of value creation which
can be applied to LBOs.
All the academic publications mentioned in this paper are not included in this first
section. We also discuss some of them in the second section, when we incorporate non-classical
qualitative elements in value. However, the papers reported in the second section do not deal
with value, nor LBOs; they are useful in the fact that they discuss a qualitative element, in a
different frame like marketing strategies or medicine reports, which can be relevant to value in
LBOs as we present it in that second section.
7
A – Exhaustive list of parties involved in an LBO operation
A leveraged buyout transaction consists in acquiring a target company (OpCo) with a
significant portion of financial debt, and to repay this debt using the target company’s cash-
flows. LBOs can be conducted by corporates, but are mostly initiated by Private Equity Funds;
this paper only considers this last common option. The PE Fund raises funds from Limited
Partners (LPs) and inject it in a holding company (HoldCo), created to that end. On top of this
amount in pure equity, convertible bonds or shareholder loan, HoldCo raises debt from financial
institutions. Debt providers range from traditional banks for more senior tranches, to mezzanine
funds for the subordinate tranches, each tranche presenting different interest rates and
repayment profiles. Debt service is meant to be covered by the target company’s cash-flows,
which are boosted through incentives to management and operating optimization. At exit, the
remaining net debt is deducted from the enterprise value to get the equity value of OpCo post
LBO; the Fund then pockets its share of equity, and measures its return based on the equity
invested at entry.
This brief overview of the workings of an LBO shows primarily that the PE Fund is the
obvious stakeholder in such transactions. It is by far the most covered by existing literature on
LBOs, and more specifically, on value creation in LBOs. Second, it gives us a glance of the
many other stakeholders involved in LBOs, which tend to be less referred to by academic
research. We report in this subpart the various stakeholders involved in LBOs, and give a quick
rationale as to why they have some value at stake. We aim here at giving an exhaustive picture
of an LBO’s environment, and we restrain that scope for the following parts.
8
1) PE Fund
We consider here the PE Fund itself, as a legal entity with a specific business model
generating revenues and costs. It serves as an intermediary between the investors, i.e. the LPs,
and the investment target companies. We do not include in the definition of the PE Fund the
shareholders of the fund (either LPs, GPs or employees from the fund with a carried interest).
However, we put on the same level the PE Firm and the funds raised within, as legal entities.
Hence, the PE Fund is considered as a legal entity with a portfolio of target companies and
holding companies.
The PE Fund initiates the LBO transaction, with the aim of achieving a required
financial return. As the main investor, it is at the head of the operation’s organization, which it
models, as much as possible, to its favour. It usually has some requirements from its investors,
such as a satisfactory return or hurdle rate (i.e. a minimum financial return). As a legal entity,
the Fund survives if it manages to raise funds from investors. Indeed, since it is an intermediary
vehicle, its existence is dependent of the will of LPs to invest capital in it. It is therefore very
sensitive to the way it is perceived by potential investors. The Fund invests mostly equity in the
holding company, and becomes a shareholder. It can also invest in mezzanine debt, so as to
have a more senior source of remuneration.
2) Limited Partners (LPs)
Limited Partners are institutions, corporates or individuals that invest in the PE Fund.
They commit to transfer cash into the Fund, with the expectation of realizing a satisfying return
on investment on it. While their commitment takes place at the time of fund raising, their actual
cash-out is realized along the life of the Fund and its various investments in target companies.
LPs might be asked for additional cash-out during the LBO operation, to cover exceptional
costs.
In providing equity, they bear the highest risk of all the financing providers in the LBO.
As such, they require a hurdle rate from the Fund on their investment. Private Equity represents
for them an alternative category of investment, with a relatively high financial return. At each
fund raising, LPs choose to reinvest or not in the PE Fund. In their Foundation report, Mulcahy
D., Weeks B. and Bradley H. (2012) argue that Private Equity tends to be a not so good
investment for LPs on average. According to the paper, they are not remunerated as well as
they should be regarding the risk they bear; however, they keep investing in Private Equity,
mainly because there are not so much alternatives for them.
9
3) General Partners (GPs) and employees of the Fund
The operating team in a PE Fund is structured around GPs at the top, and then various
ranks of employees depending on work experience. GPs own a share of the Fund, and are
mainly remunerated though carried interests generated by LBO investments. Similarly, the rest
of the team, though usually not a shareholder of the Fund, is asked to invest some equity into
the different LBO investments. It is a way of aligning interests, and ensure to the LPs that the
PE Fund is working its best to achieve good returns.
GPs and team members are often recruited by the Fund after a job experience in
Investment Banking or Consulting (Acharya V., Gottschlag O., Hahn M. and Kehoe C., 2011).
When entering the Fund, they bring financial and operational knowledge, as well as a rich
network of contacts. If they wish to change Funds or accept a similar job position, they will be
partly assessed on the success of the different LBO investments they have worked on during
their employment at the previous Fund. Hence, they are impacted in two ways by a particular
LBO transaction: through the carried interest, and through their reputation.
4) Target company, or OpCo
The target company, OpCo, is at the centre of the LBO. Their operating business is at
the foundation of the whole LBO financial engineering. All the financial returns of the various
investors are based on its ability to generate sufficient cash-flows to pay back the leverage of
the holding company at the top. In order to do so, its operating processes are optimized, and
useless expenses are cut. This has been the object of multiple criticisms, especially regarding
the negative impacts that LBO might have on target companies. Indeed, they are accused of
jeopardizing the target company’s sustainability, by cutting investment, lay-off expensive, and
therefore skilled, staff, or by drying out the company from its cash to distribute it to the Fund.
Target companies can be from different sectors and industries. They traditionally are
non-cyclical and growing companies, with a high cash conversion profile. In the frame of the
LBO, OpCo might acquire build-up companies, to achieve some external growth and synergies,
or reposition itself on a new industry, country or market segment.
As we explain it more precisely in the following parts, we consider OpCo an
independent entity. As such, its mission is to keep existing legally. In order to so, it endeavours
to improve its performance, through growth or increased profitability.
10
5) Employees of OpCo
The party of employees is a subdivision from the party of Opco. They are affected first
by the lay-offs operated as part of the cost-cutting plans. They account for another main
argument against LBOs, stating that employees are the first casualties of the operating
improvements. It is one of the most debated topic of collateral effects on LBOs. As we mention
earlier, academic research has yield heterogeneous results. The employees relate to the target
company in different ways, such as regarding their job position and their remuneration. Target
companies under LBO sometimes develop a particular incentive policy, under the form of a
share in the capital or of an earn-out mechanism, so as to get employees to give their best.
In this paper, when studying the party of employees, we take a different approach from
that used to study OpCo, although employees are part of OpCo. Indeed, we consider OpCo as
a legal entity, with a business model generating revenues and costs. In the point of view of
OpCo, employees represent expenses and tools to generate profits. However, the party of
employees assesses value at the level of the individual employed by OpCo. Therefore,
employees have value involved in the LBO transaction, since they have at stake their job
position, but also some qualitative elements such as ability to find another job and quality of
working conditions.
6) Management of OpCo
The party of the management is similar to that of employees, in the fact that it is a
subdivision of OpCo, with an independent point of view than that of OpCo. The management
represent a key driver of value creation for the Fund; it is at the top of OpCo, and its performance
is its responsibility. For that reason, the management is strongly incentivized by the Fund, in
order to align interests. The managers are asked to invest in the holding company at the top of
OpCo a large part of their personal capital. They are remunerated by a share in OpCo’s capital,
and benefits most of the time from sweet equity mechanisms, whereby the Fund, beyond a
certain threshold, redistribute a part of its return to them.
In parallel to these incentives, the management is also under additional pressure to
achieve a good operating performance. The high financial leverage provides it with a
“disciplining effect” (Jensen M.C., 1986; Liu C., 2013), whereby the impossibility to meet debt
service can lead to bankruptcy, thus costing the management its job position, its invested equity,
its reputation and a large amount of stress. Therefore, the management has a lot of value
involved in the LBO, under various forms.
11
7) Holding company, or HoldCo, and minority shareholders
HoldCo is the name for the holding company at the top of OpCo. It is created especially
for the LBO transaction, and has for purpose to bear the financing debt. The Fund injects the
equity raised from its investors in HoldCo, which then acquires OpCo with additional debt
raised. HoldCo bears the debt service, thanks to the cash generated by OpCo and transferred
through dividends. Fiscal mechanisms specific to the country enable HoldCo and OpCo to share
a fiscal base.
The party of HoldCo considers HoldCo as a legal entity with the aim of surviving until
liquidation. Hence, the goal of HoldCo is to receive sufficient cash to meet debt requirements.
We also discuss the situation of other minority shareholders in the holding company at
the top of OpCo, alongside the Fund, the management and sometimes the employees. They can
consist in other funds, specialized in Private Equity or not, with passive strategies. They might
also be corporates, institutions or individuals. Their situation is similar to that of the main
shareholders, except that they act as third party investors, often with no decisional power. Their
main value at stake is the amount of equity invested in the transaction. We can also mention the
minority shareholders at OpCo’s level, which have equity invested alongside HoldCo, which is
rarer.
8) Debt providers
LBO transactions are characterized by a large financial leverage. Because of this
relatively high risk, debt providers require more or less strong warrantees depending of the
seniority of their tranches. Senior tranches are often provided by financial institutions such as
banks, while junior tranches like mezzanine are provided by more specialized entities.
Conversely to equity providers, debt providers have a fixed financial return, provided that
HoldCo be able to meet debt requirements. In the case where HoldCo or OpCo goes under, debt
providers can end up with the keys of the entity, depending on their ranks, and then choose to
continue the LBO operation or to liquidate OpCo’s assets to get the most out of it.
Therefore, debt providers have value involved in the LBO, in the fact that they depend
on the health of the LBO for the certainty of their returns. In addition, they have their reputation
at stake, for choosing a bad LBO candidate and for having mismanaged the debt restructuring
and liquidation.
12
9) Competitors
The impact of a particular LBO on its competitors has not been much studied in the
academic research (Kovenock and Philipps, 1997; Hsu et al., 2012; Slovin et al., 1991; Grupp
M., Rauch C., Umber M. and Walz U.,2015). Competitors can be impacted in several ways.
By optimizing its business, the target company can be able to lower its price or to
improve the quality of its offer, thus winning some market share over its competitors. In a
different strategic move, the target company might reposition itself, and thus leave a greater
market share to its competitors. However, this could be interpreted as a negative signal, since
the initial positioning may not have been profitable enough. In more extreme cases, when the
target company does not manage to meet debt requirements, it may have to go bankrupt and be
liquidated. The disappearance of the target company from the competitive landscape may then
represent an opportunity for its competitors to recover some of its market share or assets.
In parallel, an LBO operation on a target company within a particular industry sheds
light on that industry. Investors may realize that the sector is attractive enough for PE Funds,
and that they could themselves enter M&A activities on similar companies. Finally, the fear of
a fiercer and better managed competitor could push them towards an efficient reaction involving
margin and process optimization, strategic repositioning, etc. or towards panic and rushed
decisions. Hence, though competitors are not directly involved in the LBO, they are indirectly
impacted in various ways.
10) Suppliers and customers
LBOs often go along with margin optimization and operating improvements. As part of
these, cost saving plans may initiate tighter negotiations with suppliers regarding transactional
prices. The bargaining power of suppliers is then impacted downwards (Brown D.T., Fee C.E.
and Thomas S.E., 2008). In addition, target companies rather have diversified customer and
supplier bases, in order to avoid dependency and increase operating flexibility. As a result,
important supplier may end up with smaller contracts, while others may win some more.
Another consequence of these plans is the repercussion of cost savings on the final
product or service. Customers can then be impacted in case the target company has made a
strategic repositioning, or if it has, so as to reduce expenses, decreased the quality of its offer.
Conversely, a better managed target company may be able to present more satisfying products,
as well as competitors incentivized to imitate its success, thus benefiting to the customers.
13
11) Sellers at entry and buyers at exit
The LBO operation starts with the PE Fund acquiring the target company from its then
current owners, and ends with the PE Fund selling it to its new owners. These sellers and buyers
at the beginning and end of the operation are directly impacted by the LBO, as the price received
or paid can vary according to the nature of the counterpart. Should it have been a strategic
player, the price could have been higher or lower. Indeed, PE Funds theoretically do not pay a
high premium for the synergies; however, their offer partly depends on the level of liquidity of
the PE industry at a given point in time, and at the number of interesting assets available. Hence,
sellers at entry and buyers at exit have some value involved, since a particular LBO can
represent for them an opportunity to make a better or worse deal than that they would have
made in a different context on the same target company.
Within this party, we could also distinguish from the general sellers the founders of the
company, should the LBO be the first change of control in the target company’s history. In
addition, we could study separately majority from minority shareholders in the transaction.
Indeed, as LBOs take place in a private context, minority shareholders can suffer from drag-
along or squeeze-out processes, and can benefit from protections such as tag-along rights.
12) Advisors, Due diligence providers and Restructuring firms
In every M&A transaction, advisors and other related service providers such as due
diligence firms are required. An LBO calls to them at least twice: at entry and at exit. Hence, a
particular LBO transaction impacts them directly, in terms of fees received and reputation
following the success or failure of the LBO. Since counterparts in LBOs, i.e. PE Funds, are
professional in the financial industry, they require from their advisors and other mandated firms
a high level of performance. Fees may then be structured differently than those for a regular
M&A transaction. In addition, should they perform well in the transaction process, the PE Fund
may call to them for a further LBO, and other PE Funds would be more easily keen to mandate
them.
Similarly, restructuring firms are mandated by debtholders or the PE Fund, should the
target company not be able to meet debt service or to maintain covenants. The financial leverage
of HoldCo, typically high in LBOs, is then renegotiated, or even partially written off.
Restructuring firms, specialized in such operations, also have at stake their revenues, i.e. fees,
and their reputation. LBOs are particularly interesting for them, as the level of debt implies
various counterparts with different interests. Like for advisors, PE Funds may call to them for
further restructuring needs, provided they perform well.

14
13) State, Society and politicians
The country where the LBO takes place is directly and indirectly impacted, from both
quantitative and qualitative elements. First, the State collects taxes from companies. One could
study whether LBOs are tax-beneficial or detrimental to the State, as they are often entitled to
favourable tax regimes, such as fiscal integration in France. Target companies under LBO could
represent in that case a loss in revenues for the State, compared to regular companies. In parallel,
the country’s economy can benefit from contracts undertaken by the target company with public
companies, or private companies considered national champions, like building services
providers. For example, the State could incentivize utility companies under LBO in wielding
partnerships with such companies through lighter regulation.
On another level, the Society is impacted by more qualitative elements. LBOs target
cash-generating companies, with a stable positioning. Utilities therefore appear as attractive
industries, in the fact that they are usually monopolistic companies. Infrastructure PE Funds
take over utility projects, which are supervised or monitored by the government. The State
delegates to target companies the responsibility of the project and of the quality of the services.
Hence, infrastructure and utility LBOs could be an opportunity for the State to make some
savings out of it, and to allocate that budget into other projects.
In some cases, it turned out that taking some public services private actually increased
quality of the services, while in others, quality was lowered. LBOs, through their aiming at
optimizing margins and increase financial performance, directly impact the quality of services;
in the case of utilities, retail, or any other industry directed at the final customer, target
companies under LBO have therefore an influence on the level of satisfaction of the general
population and on its well-being, through quality, affordable price, etc. If we assume that the
final goal and interest of the Society is to increase the well-being of the population, LBOs can
represent either a negative or positive driver in that sense. In addition, target companies, as any
other, need to comply by environmental and, more generally, ESG criteria. However, some are
more respectful than others, and we consider their meeting or not of requirements a gain or loss
for the Society.
Finally, politicians may be impacted on a national or local level, depending on the size
of the target company and its activities. For example, a target company under LBO cutting costs
and laying off employees may harm the regional authorities. Politicians may indeed have to
face dissatisfaction from the population and bear the grunt of it in the poll or through strikes.
15
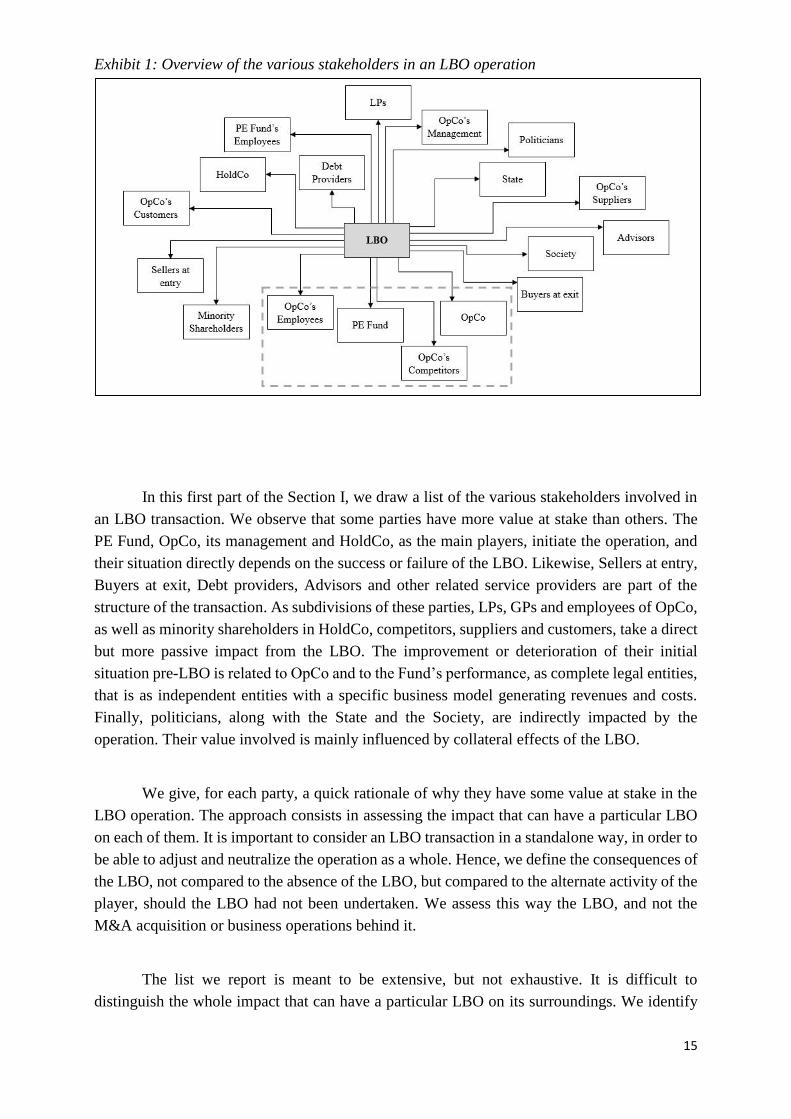
Exhibit 1: Overview of the various stakeholders in an LBO operation
In this first part of the Section I, we draw a list of the various stakeholders involved in
an LBO transaction. We observe that some parties have more value at stake than others. The
PE Fund, OpCo, its management and HoldCo, as the main players, initiate the operation, and
their situation directly depends on the success or failure of the LBO. Likewise, Sellers at entry,
Buyers at exit, Debt providers, Advisors and other related service providers are part of the
structure of the transaction. As subdivisions of these parties, LPs, GPs and employees of OpCo,
as well as minority shareholders in HoldCo, competitors, suppliers and customers, take a direct
but more passive impact from the LBO. The improvement or deterioration of their initial
situation pre-LBO is related to OpCo and to the Fund’s performance, as complete legal entities,
that is as independent entities with a specific business model generating revenues and costs.
Finally, politicians, along with the State and the Society, are indirectly impacted by the
operation. Their value involved is mainly influenced by collateral effects of the LBO.
We give, for each party, a quick rationale of why they have some value at stake in the
LBO operation. The approach consists in assessing the impact that can have a particular LBO
on each of them. It is important to consider an LBO transaction in a standalone way, in order to
be able to adjust and neutralize the operation as a whole. Hence, we define the consequences of
the LBO, not compared to the absence of the LBO, but compared to the alternate activity of the
player, should the LBO had not been undertaken. We assess this way the LBO, and not the
M&A acquisition or business operations behind it.
The list we report is meant to be extensive, but not exhaustive. It is difficult to
distinguish the whole impact that can have a particular LBO on its surroundings. We identify
16
above the most obvious stakeholders, as well as some impacted indirectly through the collateral
effects of the LBO or through OpCo’ or the PE Fund’s decisions. We surely leave some players
aside impacted on a negligible level. For example, we could mention the activity of the financial
and general press, which may be more intense when covering LBO transactions compared to
regular activities. We enter however here blurrier definitions of value, and we do not cover such
parties.
For the rest of the paper, we choose to focus on four different parties: the PE Fund,
OpCo, its employees and its competitors. For some aspects, we consider OpCo and HoldCo as
a consolidated entity. For example, the risk derived from financial leverage raised at the level
of HoldCo is processed at OpCo’s level. These four stakeholders appear particularly interesting
for us, as the last two are not much studied by academic research, while the first two are largely
covered, but mostly from a financial approach only. In the following part of the section, we
review the measures traditionally associated with those parties, and we observe that, for most
publications, value creation for these parties is assessed through financial measures.
17
B – Classical financial measures of value creation
In the previous part of Section I, we review the major stakeholders involved in an LBO
operation. As from the part below and up to the Case Study analysis, we focus on four parties:
the target company (OpCo), its employees, its competitors and, finally, the PE Fund. In this
part of Section I, we explore the existing literature on value creation in LBOs and extract the
main measures of value for each of the four parties considered. However, we do not take into
account the measures of collateral effects of LBOs on particular aspects; for example, we do
not study in this part the impact of an LBO on the target company’s innovative activity or
relationships with clients or suppliers. We only isolate measures designed by the academic
literature in the aim of capturing value creation as a whole.
Indeed, the term “value” is used in almost every paper dedicated to LBOs to designate
a party’s change in situations prior and post LBO. If the party’s situation has improved during
the life of the LBO, some value has been created for that party; otherwise, it is a loss in value.
Our approach for this part consists in isolating measures of value creation used in these papers,
whether they are at the centre or not of the paper, provided that they assess value creation as a
whole, i.e. that they measure all the value created or destroyed for a party by an LBO operation.
To that end, we consider, for each party, either one measure or a set of measures, depending on
how entire value is measured in the papers. We discuss these measures, keeping in mind that
they are meant to capture value creation as a whole.
18
1) The target company, or OpCo
As presented above, we consider OpCo as an independent entity, with the following
objectives:
- Surviving, first, which boils down to avoiding being liquidated and going under
- Improving its financial health, through growth and performance
Therefore, measuring value for OpCo consists in assessing its ability to meet these
objectives at different points in time. In case of value creation in an LBO operation, value is
gained or lost when assessing this ability prior and after the LBO; is OpCo more or less able to
meet these objectives, once it has gone through the LBO?
When searching for measures of value creation in the literature, we notice that there are
no consensual clearly defined ways to assess value for a firm. In the financial literature and
press, LBO coverage mostly relates to purchase prices at entry and exit, and to the Fund’s return.
When value is mentioned, it often refers to negative collateral effects of the LBO on
employment and levels of investment. The academic literature is denser on that subject, and
includes various measures of value creation for a firm, whether specifically in an LBO context
or not.
ROCE – WACC
This is one of the most accepted theoretical measures of value creation (Quiry P., Le
Fur Y., Vernimmen). The rationale is that the firm needs to generate more return than that
required by all the capital providers, in order to actually create value. ROCE refers to Return
On Capital Employed, and measures the profitability of the resources invested in fixed assets
and in the working capital. The WACC is the Weighted Average Cost of Capital for the firm,
i.e. dedicated to both debtholders and equity holders. ROCE – WACC is a simple measure,
quick to compute and relatively easy to understand. The ROCE stands at the level of the firm,
versus the level of equity, and takes into account profitability of the business, as well as capital
intensity, since it is based on the NOPAT. In that sense, this measure is rather complete.
However, ROCE – WACC presents several drawbacks in assessing value creation. First,
it eludes the cash generation profile of the company, since it relies on an accounting aggregate.
The ability of a firm to generate satisfying cash-flows is yet strongly correlated with its ability
to achieve a good financial performance. We can imagine a target company producing
acceptable accounting returns, but which is being dried out of its cash, either due to poor
19
management or a strategic move from the Fund. The ability of the target to further perform is
then severely put in question. Hence, we need to factor in cash generation in the firm’s value,
which is not included in ROCE - WACC.
Finally, this measure takes into account expectations from investors through the WACC.
Hence, it incorporates the risk taken by investors when providing capital, and the return they
expect in exchange. The risk here is that of the firm itself, since it is derived from its business
risk and financial leverage. For some academics, leverage, and therefore risk taken in the LBO,
is a main source of value creation in an LBO operation (Damodaran A., 2008). However, as
explained above, this paper does not consider the risk of the party itself; it focuses on the effects
rather than the means to achieve value creation.
Economic Value Added
Economic Value Added (EVA) is defined as the difference between the NOPAT and
the WACC multiplied by the capital employed. It is sometimes used instead of the previous
measure to assess value creation. We can notice that EVA is in fact ROCE – WACC multiplied
by capital employed. Hence, we consider similar advantages and drawbacks for EVA as for
ROCE – WACC in the previous part. This measure is mostly used as a marketing tool by
companies themselves, to present value creation.
Market capitalizations, Multiples and Premiums
In the financial literature, the value of a company is often associated with its enterprise
or equity value, obtained thanks to valuation methods or directly by looking at its market
capitalization when the company is listed (Varaiya N. and Kerin R., 1987; Nikoskelainen E.
and Wright M., 2005; Guo S., Hotchkiss E. and Song W., 2011). Hence, value creation is
sometimes computed based on the difference of enterprise values prior and after the LBO. If
the company boasts a higher enterprise value at exit than it did at entry, the company is said to
have gained some value. The main rationale behind such approach is the importance given to
market perception. Indeed, value is here synonymous of market value, determined by the
perception of investors and other market players. Hence, a company is only worth what
investors would be ready to pay for it. We could consider an extreme situation where a solid
and profitable company would be neglected from investors due to an expected change in
regulations making its business model obsolete. This company, as no investor would be ready
to invest in it, would be worth zero. However, we can argue that, since this approach is an
investor-based one, it does not fit our previous frame, whereby a company loses (gains) value
20
when it is less (more) able to survive and further perform. Though meeting these objectives and
being valued by investors are very correlated and interdependent, they are not the same and
may differ. As OpCo is considered an independent entity, its goal is to keep performing, before
wondering whether its shareholders are satisfied. A capital injection is only valuable for the
party of OpCo if it translates into better means to survive and perform.
The main disadvantage of this approach when considering value creation in an LBO
operation is the multitude of parameters included in such valuations. As value is obtained
directly, if the company is listed, or indirectly through peer comparison, it is biased by the
economic and financial environment. When measuring value at exit, the stock market can be
subject to inefficiencies, cycles, liquidity or macroeconomic trends, which would dilute the
impact of the LBO in the changes in value of the target company. Indeed, if we consider an
average time length of five years for an LBO, many events can occur over this time lap, thus
altering market conditions and making comparisons between entry value and exit value
irrelevant. Should the target company not have been subject to an LBO operation, it could have
just as much been affected by these changes, and its value at entry and exit would have been
similar to that under LBO. Even if we compare value at exit and entry adjusted from market
conditions, for example by adjusting it from the changes in the sector multiples and from the
stock exchange’s variations as a whole, the enterprise value would still encompass various bias.
For example, the value of OpCo can be influenced by some strategic choices of the management
independent from the LBO, by different incidents, pushing the value downwards or by
unexpected business opportunities which would still have arose without the LBO.
The use of multiples, i.e. the enterprise value or equity value over an aggregate, is
similar. We can compute multiples on specific aggregate, and compare the company’s multiples
at entry and at exit. However, change in multiples enable not to account for the growth of
financials, but is strongly correlated to the health of the stock market and of the competitors.
Another way to make a comparison is to look at premiums offered over the change of control
of the target company; at entry, the premium is offered by the PE Fund, and at exit it is offered
by the new buyer. The difficulty here is to better understand the nature of the premium, which
can significantly vary according to the buyer’s profile. An industrial will incorporate synergies,
while a PE Fund may be subject to liquidity issues.
DCF, DDM and APV
We address here the different valuation methods based on business plans and forecasts.
The rationale is the same as above, in the sense that we compute the value of the company at
entry and at exit, and we assess the difference. Beyond the specificities of each method, like the
tax shield valuation in APV (Gerretsen M., 2004) which can become less relevant should the
21
buyer at exit not intend to achieve another LBO, the main problematic point is the use of a
discount factor. Whether the WACC, the cost of debt or the cost of equity, it takes into account
the risk embedded in the LBO due to both OpCo’s business and to the leverage. As explained
above, we choose to leave the risk component aside when it comes to the party itself, in order
to better compare among parties.
Operating performance
Measuring operating performance (Kaplan S.N., 1989; Bergström C., Grubb M. and
Jonsson S., 2007; Lichtenberg F. and Siegel D.S., 1990) before and after LBO seems to be the
most relevant to match our definition of value creation in the case of OpCo. With a higher
performance at exit than at entry, the target company is in a better place to achieve its two
objectives. It has then gained value. In that sense, measuring the target’s operating performance
enables to assess value creation directly captured by the party of OpCo (Liu C., 2013). We can
argue that financials reflect the profile of the company as a whole, and that it is difficult to
distinguish the impact of the LBO from the rest of activities, i.e. the actions that would have
been undertaken anyway, without the LBO operation, as well as the actions undertaken prior
the LBO and producing their first effects during the LBO.
Within the indicators of operating performance, the most referred to are the revenues
growth and the profitability indicators, often translated into EBITDA and EBIT margins. The
rationale of this set of measures is that growth and profitability are the two drivers of equity
value for a firm (Varaiya N. and Kerin R., 1987; Nikoskelainen E. and Wright M., 2005). In
order to better perform, the target company needs to improve its financial health by growing in
size and market share, or through optimizing its cost structure and increase its margins.
However, this approach leaves aside the cash generating profile of the company, by avoiding
the cash conversion of its margins.
Another approach is then to measure Free Cash-Flows, in order to capture the cash
generating profile. Free Cash Flows are a good indicator of the sustainability of the company
(Fow I. and Marcus A., 1992). The drawback of this measure is that it is more a measure of
value creation for the recipients of that cash, rather than for the company itself. While recipients
do get that cash at the end of the day, it may be at the expense of the target company’s operating
business. Indeed, it does not discriminate between extreme cases, whereby an unhealthy
company, positioned in a declining business and dried out of its cash through asset sales and
lay-offs, may display similar Cash Flows as a profitable and growing company.
22
2) Employees at OpCo
The party of employees consists in the target company’s employed resources. The
management of OpCo would theoretically be included in it; we choose however to exclude it
from the party, as its interests and treatment from the Fund may differ significantly from those
of the regular employees. Value for this party relates to the relationship of the employee with
its job position within the target company. The employee is not approached as a private
individual in their personal life, but rather as a staff member within the company’s workforce.
Hence, value for the employee is directly correlated with its professional situation; any personal
item outside the work environment cannot impact it.
The academic literature, when considering employees, mostly addresses two aspects:
the change of situations from employed to unemployed, and the variation of financial
remuneration.
Employment growth
Measuring the growth of the target company’s employment level is the most classical
approach (Kaplan S.N., 1989; Muscarella C.J. and Vetsuypens M.R., 1990; Lichtenberg F.R.
and Siegel D., 1990). It consists in comparing the number of employees at entry and at exit, to
see whether the target company has increased or reduced its employment level during the life
of the LBO. This measure is very easy and quick to compute, as it only requires data often
available in annual reports. It serves as a good proxy for assessing the improvement or
deterioration of the employee’s situation.
However, this measure stands at level of the firm rather than that of the employee. It
depends from the company’s employment policy, and does not take into account various
parameters, external to the party of employees. For example, it does not factor in the turnover
of employees; the impact of laying off a particular employee during the LBO and immediately
replacing them with a cheaper one will not be showed in this approach. On top of it, it does not
distinguish a decrease in employment due to lay-offs from one due to a natural attrition in hiring
process, thus not hurting existing employees (Olsson M. and Tag J., 2012). In their 2007 paper,
Amess K. and Wright M. use this measure to assess the effect of LBOs on target companies’
employment at the scale of the UK. They make some improvements to partially adjust from
endogeneity and factor in the degree of monitoring from the Fund over the target. Still,
employment remained considered from the company’s point of view rather than from the party
of employees itself.
23
Unemployment risk
To remedy the main issue when measuring employment growth, that is adopting an
approach at the firm level rather than at the employee level, recent papers have introduced a
measure of unemployment risk (Olsson M. and Tag J., 2012; Antoni M., Maug E. and
Obernberger S., 2015). It consists in assessing the probability for a particular employee to
become unemployed. The rationale is to compute this probability for employees of firms under
LBO compared to that of employees from regular companies. In both papers, the overall
methodology is the following:
- At the scale of one country (here, Sweden for the first one and Germany for the other),
data on employees from national companies are collected via institutional databases. In
the samples, data are sorted between companies under LBO at one point in time during
the time range and the other.
- If a company has been under an LBO operation during the time lap, its employees are
tracked in records to see whether they have been registered unemployed at some point
after the LBO.
- These employees are compared to a control group; the difference-in-difference
approach then gives a gap for unemployment risk.
On the level of Sweden, Olsson M. and Tag J. find that LBOs decrease yearly
unemployment risk by 1.1 percentage points or 12.7% on average for four years after the LBO.
In Germany, Antoni M., Maug E. and Obernberger S. find on the contrary that LBOs reduce
employment by 1.0% to 1.5% over a one to three-year period after the LBO. Both papers are
comparable in terms of methodology and rationale; they aim at measuring employment under
LBO at the employee level. The German paper goes further and adds some features, like
different categories of employees and career paths. Employees are classified according to
whether they have firm-specific skills or adaptable skills, which would make them flexible in
case of a restructuring of the business. The career path variable indicates whether employees
change industries or firms after exiting OpCo. However, these details are incorporated into a
two-fold measure: employees become unemployed, and then this change can be explained, for
example by a voluntary leave. There is no probability directly encompassing these various
reasons for become unemployed. Hence, the computed probability measures changes from
employed to unemployed status, independent of whether the employee has been laid off or has
voluntarily left the company.
We must note that this measure captures value embedded for existing employees only.
The party of employees starts from employed individuals at the beginning of the LBO, and does
not include the opportunity for potential new employees to be hired by OpCo during the LBO.
24
The main issue with measuring unemployment risk as per this methodology, is whether
this measure can be applied to a single LBO operation. In the papers, the probability of
becoming unemployed is computed based on a sample of companies under LBO compared to
a control group. Hence, it is tricky to apply it to a particular LBO operation, in order to find out
whether this LBO has increased or decreased value for the employees by decreasing or
increasing their risk of becoming unemployed. This measuring has been designed for large
scales, such as a country scale, and needs to be adjusted for assessing unemployment risk in the
frame of a single LBO.
Recent academic literature has also proposed a measure of employment duration to
assess unemployment risk (Agrawal A.K. and Tambe P., 2013 and 2014). The rationale is
similar to the papers above, to the exception that instead of collecting changes from employed
to unemployed status, the paper collects job duration for employees under LBO. Data collection
is achieved through the use of online platforms, and is therefore biased by heterogeneous levels
of use for such platforms from employees (Antoni M., Maug E. and Obernberger S., 2015).
Indeed, employees who have not registered themselves on online professional platforms or who
hardly update their curriculum can lead to misinterpretations.
Financial remuneration
Another component of an employee’s value at stake is the level of remuneration it gets,
independent of whether is job position is at risk. Hence, rationally, we can say that if the
employee’s unemployment risk has slightly increased during the LBO, a higher salary may
compensate for their value loss. The classical approach for measuring employee remuneration
is to look at OpCo’s financials and collect the costs allocated to workforce (Amess K. and
Wright M., 2007). To have it on an average salary per employee, costs allocated to workforce
can be divided by the number of employees (Lichtenberg F.R. and Siegel D., 1990; Davis S.J.,
Haltiwanger J.C., Jarmin R.S., Lerner J. and Miranda J., 2011). These measures are easy to
implement and give good proxies of changes in remuneration for employees. However, they
are at the firm level, not at the employee level, and do not discriminate between variation of
daily wages and variation of workforce supply (Antoni M., Maug E. and Obernberger S., 2015).
Again, Olsson M. and Tag J., as well as Antoni M., Maug E. and Obernberger S.,
propose measures of remuneration at the employee level. In the same way as before, they collect
data relative to wages and labour income for a large sample of companies, either under LBO at
some point or not. They compare samples and, this time, find similar results; in the first paper,
yearly labour income has increased by SEK 3,734 or 1.4% over the period, while the second
paper finds that wages have increased by 1.0% to 1.3%. Antoni M., Maug E. and Obernberger
S. introduce detailed variables such as employee types and career paths, in order to better

25
explain the results. However, the main difference in these two papers consists in adopting either
a yearly frame for the first one, or a daily frame for the second one. Indeed, Olsson M. and Tag
J. take into account yearly labour income, as an absolute amount, while Antoni M., Maug E.
and Obernberger S. divide the yearly amount by the number of employed days in the year.
Hence, the daily basis approach enables to adjust the variation of wages from unemployment
during the year. On the contrary, the yearly basis approach encompasses both aspect, and does
not enable to distinguish a decrease in salary from a sudden unemployment period.
As for the computation of unemployment risk, this measure puts on the same level
employees remaining in OpCo and those who left the company and found jobs immediately
afterwards. Hence, it introduces a notion of asset, valuable in the professional world, whereby
employees under LBO have acquired skills, experience or reputation which made them easily
employable. Though they may be laid off, this asset allowing them to quickly find another job
is considered a gain in value independently of whether they are laid off.
We note that, in these measures, only wages are taken into account. Incentive plans and
employee share programs are not factored in, as difficult to collect data on. Hence, stability in
wages can in fact be compensated by an increase in stock options, not reflected in these
measures.
26
3) Competitors of OpCo
We address in this part the party of the competitors of OpCo. We aim at listing measures
capturing value gain or loss for competitors, directly due to the LBO operation on OpCo. It
does not matter whether competitors are also under LBO or not; we assess the automatic
variation in value issued by the LBO. Hence, we exclude from that change in value the operating
activities, strategies and all decided actions from the competitors in reaction to the LBO, in
order to only grasp the “suffered” mechanical impact. We not that the party of competitors
solely considers existing competitors, as a whole. New competitors arising in the market, due
to room liberated by OpCo or one of the competitors, is not accounted for. Finally, difference
of treatment within the party of competitors is not considered; the goal is to address the impact
of the LBO on OpCo’s competitive environment.
The academic literature is relatively poor regarding measures of LBOs’ effect on the
target company’s competitors. The measure that is, by far, the most used in studies is the market
share of competitors before and after the LBO. It is declined into several forms, such as growth
in sales or market prices. In parallel to the market share, some papers looked into the operating
performance of competitors, so as to study the impact of the LBO on their profitability.
Market share
The traditional way to compute market share is to observe volume sold or revenues of
competitors. The rationale is to divide the market among the players, where players draw their
revenues from market capacity. The sum of all the competitors’ revenues add up to the whole
market. Hence, if a market player manages to increase its revenues in a closed market, it gains
in market share. Grupp M., Rauch C., Umber M. and Walz U. (2015) collect the difference in
revenues of the target company’s competitors, prior and after the LBO, and infer the market
share of each of them. Should a competitor have higher revenues at exit, it is said to have gained
market share. This approach serves as a proxy of volumes, since it is difficult to get information
on prices and to isolate volumes consequently. In the paper, the measure is based on a strong
system dedicated to identify matching peers, though it takes leverage as a control variable,
which can be put in question. It also corrects for endogeneity through a Heckman model.
However, this measure is subject to several issues, as growth in revenues is influenced
by a variety of factors, such as the structural growth of the sector, the country growth and the
GDP growth. On top of that, observing the gross growth does not enable to distinguish the effect
of the LBO itself from the effects of strategic and operating actions undertaken in defence
against the LBO. For instance, a competitor can consider a LBO on the target company, i.e. its
competitor, a threat, as the LBO may impose a healthy discipline on OpCo, aiming at optimizing

27
its productivity and profitability. The LBO may also be an opportunity for OpCo to have a
capital increase and expand and reinforce its business. In front of such profile, the competitor
may react and undertake specific actions to be able to compete against OpCo. In this case, and
if the actions appear to be productive, the growth in revenues for the competitor would be due
to the LBO, both directly through the repositioning of OpCo, and indirectly through its own
further reaction. In order to isolate the mechanical impact of the LBO, as stated above, we only
consider direct and “suffered” consequences on competitors.
In addition to considering the change in market shares in a closed market, we need to
take into account elasticity of the demand. The market on which the target position is positioned
may be a growing one, with new competitors underway. Such entrants, as they are not included
in the party of existing competitors, can be significant drivers of decreasing market shares. In
their 1990 paper, Bolton and Scharfstein look at the level of entry deterrence in an industry.
Thanks to a complex and sharp mathematical model, they assess the potential of an industry to
absorb new entrants. It serves as a measure of sustainability of the competitors’ market shares
in the future.
Profitability and power of attraction
An LBO on a target company can affect its competitors in several ways. On top of the
reduced market share due to a more competitive target company, it can hurt the operating
performance of the competitors, as well as their stock prices when listed (Hsu H-C., Reed A.V.
and Rocholl J.,2012). Indeed, Brown D.T., Fee C.E. and Thomas S.E. (2008) study the effect
of LBOs on the bargaining power of suppliers. The target company, thanks to the support of
the Fund, improves its bargaining power over its trade partners and tends to negotiate
downwards the prices. As a result, the target company increases its operating margins and is
able to lower its prices, at the expense of the competitors. At this point, competitors either
sacrifice their margins to keep their market share, or they lose some market share. To measure
this phenomenon, the paper collects stock returns of the suppliers around the LBO
announcement and subsequent changes in margins reported. These elements serve as proxies
for transaction prices of trade partnerships between the target company and its suppliers.
This approach is however subject to some issues. The change in relationships between
OpCo and its suppliers has an indirect consequence on the operating performance of the
competitors. Indeed, competitors suffer from poor margins in two scenarios. In the first one,
revenues are decreasing because the target company has lowered its price and thus attracted
more clients. In this case, the impact is measured through the market share. In the second
scenario, margins are hurt, not because of a volume effect, but because of a price effect. In order
to remain competitive and keep their market share, competitors align their prices on those of
28
OpCo, and decrease their revenues. In this last case, the operating performance is due to a
reaction of competitors against the LBO, and is not a direct and mechanical consequence of the
LBO. Hence, measuring the operating performance of competitors does not enable to isolate
the impact of the LBO.
Finally, competitors can be hurt through their share price, that is in their ability to attract
investors, for those which are listed. As mentioned above, the announcement of a LBO
operation on the target company can be considered a threat to competitors, leading to investors
shying away from the stock price of competitors. Hence, competitors may encounter a sudden
price drop around the date of announcement. In order to be consistent with the other parties, we
need to consider the evolution of the value of one party from entry to exit, and not only at one
point in time during the LBO. The stock price must therefore be assessed at exit, and is likely
to encompass effects of the reaction of the competitors, along with mechanical consequences.
On top of that, the evolution of the stock price is strongly correlated with the market
share, or at least with the expectations of the change in market shares. Observing the stock price
cannot therefore be coupled with a measure of market share, because of significant overlaps.
The stock price also reflects market trends, cycles, and investors’ expectations of the
sustainability of competitors, as well as some misinterpretations of their business and of the
potential consequences of an LBO on competitors.
The measures listed above are those proposed in the academic literature covering the
effect of LBOs on competitors. We present in the next section our various recommendations
regarding the measures of value creation for competitors. We propose some additional measures
relative to market share, and we add other aspects through which LBOs can hurt competitors.
29
4) The PE Fund
The party of the PE Fund is the most covered by both the academic and financial
literature. Value for the Fund is associated with the financial return achieved over the
investment. As the Fund initiates the operation and designs it in its favour, its return on
investment is often put at the core of value creation in the LBO (Liu C., 2013). Though the
importance of measuring the financial return is quite consensual among research papers, the
ways to measure that return are numerous.
Cash On Cash multiple and IRR
Cash On Cash multiples and IRRs are the most famous indicators in the Private Equity
vocabulary. The Cash On Cash multiple is computed by dividing the proceeds for the Fund at
exit, obtained through the sale of OpCo and HoldCo, with the initial investment of the Fund in
equity. It gives the multiplier of the initial investment achieved with the LBO. The main
drawback of this indicator is the length of the LBO operation which is not factored in. Indeed,
achieving a multiple in four or 6 years is not the same; in the second case, the capital invested
is frozen two additional years for the same return multiple. In that sense, it does not take into
account the time value of money. In addition to that, the Cash On Cash multiple excludes
potential additional equity injections by the Fund into the target company or the holding, as
well as any intermediary proceeds.
The Internal Rate of Return (IRR) is the most common indicator in Private Equity
(Nikoskelainen E. and Wright M., 2005). It takes into account the time value of money; for a
fixed Cash On Cash multiple, a shorter LBO yields a higher IRR. It is one of the best tool to
assess value created for the Fund, since it is the indicator the most looked at by PE Funds.
Hence, as PE Funds seek to achieve the highest IRRs possible, they consider having gained
value through satisfying IRRs. In that sense, good IRRs are highly valuable for PE Funds, and
they indeed are a relevant measure for value creation. There are debates over some technical
points of the IRR, such as the implied rate of reinvestment. The IRR implies that, between entry
and exit, the proceeds of each year are reinvested at the IRR, which is not true in practice. On
top of that, the IRR implies that investments are mutually exclusive or financially constrained
(The Vernimmen Letter 77, 2013).
There exists a declination of the IRR, which takes into account investors’ expectations.
The measure computes the difference between the IRR achieved over the LBO and the hurdle
rate, which is the minimum return required by investors. In order to remain consistent across
measures, we do not consider risk taken by the party itself. In this case, the hurdle rate
30
encompasses expectations of investors relative to the risk of the Fund. This measure is the
equivalent of the ROCE – WACC for the Fund.
Return On Equity
Contrary to the previous indicators, the Return On Equity (RoE) is an accounting
measure, where the Cash On Cash multiple and the IRR are financial tools. The RoE is
computed by dividing the Net income of OpCo and HoldCo consolidated with the book equity.
It is mostly an academic tool, sometimes used in corporate finance, but which is neglected by
PE Funds.
We need here to specify the difference between the entity of OpCo and the entity of the
PE Fund. The objectives of OpCo are to survive and to improve its performance. OpCo has an
operating business which theoretically enables it, if healthy, to function independently of new
investors. On the contrary, the PE Fund is only an intermediary between the LPs and the target
company. Its objective is also to survive; however, it cannot survive independently as it does
not have an operating business generating profit on its own. The PE Fund only exists as a mean
for investors to invest in a company. In that sense, its goal is to be able to attract investors in
order to survive. Hence, the PE Fund has for objective to keep raising funds.
The perception of investors is therefore key for the Fund, while accessory, in theory, for
OpCo. The independent entity OpCo only cares for its valuation if it needs capital injection or
if it is close to bankruptcy. Meanwhile, the Fund is dependent of the capital invested by LPs to
the end of investing it in OpCo. It depends on the will of LPs to invest in it. Hence, the Fund
has truly gained value if it has increased its ability to raise funds, i.e. easily or in a greater
amount, than before the LBO. The measure of financial return must then be valuable to the eye
of the Private Equity world. As an accounting and mostly academic tool, the RoE does not fit.
Unlevered Return
We see in the first subpart the IRR, which assesses the return achieved by the Fund. In
their 2011 paper, Acharya V., Gottschlag O., Hahn M. and Kehoe C. introduce a measure of
unlevered return. The return is then measured at the enterprise level, rather than at the equity
level. The deal-level equity return is unlevered based on peer comparison, which enables to
adjust the return from the effect of leverage. This measure aims at extracting the contribution
of the Fund itself, without the leverage effect.
31
As for the previous measure, the unlevered return is an academic tool, which is not
common among Private Equity practitioners. In that sense, the results obtained through this
measure are not as valuable. In addition, it adjusts the return from the risk taken during the LBO
by OpCo and HoldCo consolidated, by neutralizing the leverage. However, the risk of leverage
is not undertaken by the party of the PE Fund itself, and can therefore be factored in without
jeopardizing consistency.
In this second part of Section I, we review the various measures of value creation
introduced by the academic and financial literature for each party. These measures are selected
on the basis of whether they propose a way to assess value creation as a whole. They do not
study one aspect of a LBO in particular on a party, but rather aim at determining value created
or loss in general.
In going over these measures, we remark that they focus on financial value, such as operation
performance, return on investment, remuneration, etc. and that they do not necessarily enable
to isolate the impact of the LBO from other events. They often leave aside some qualitative
elements that, however, can actually be a source of value creation for a party. In order to
exhaustively assess value creation, we need to have a clear vision of the life goal of each party.
Once the objectives are known, we draw a list of all the aspects contributing to achieving these
goals, and we are able to tell whether an LBO is value creative or destructive for a specific
party.
In the next part we present more recent academic pieces of work studying collateral
effects of LBOs on particular aspects, which can lead to additional sources of value for the four
parties considered.
32
C – Recent research focused on discretionary collateral effects
We see in the previous part a review of academic papers presenting ways to assess value
creation as a whole in LBOs. In addition to that, research has produced various studies focused
on more specific aspects of LBOs. In particular, it goes over the impact, often negative, that the
workings of an LBO can have on the innovative activity of the target company, its level of
investment, the working conditions of employees, the reputation of the Fund, etc.
We consider here the papers studying such collateral effects, and especially the tools
introduced to measure them. We proceed again by party, where each of the four party
considered is reviewed. The major difference with the previous part is that the measures
presented here do not aim at assessing value. The collateral effects studied are often not
considered as sources of value destruction for the authors. The negative, or positive, impact of
the LBO on these more qualitative elements are not put on the same level as financial value, as
it is reviewed above. These studied take place in parallel to value creation, and are usually not
encompassed in it.
Yet, their existence proves that they have to be of some importance for the party, i.e.
that they must be valuable to it. We address in Section II whether they are a source of value for
the party, and whether they can therefore be embedded in the measure of value creation.
33
1) OpCo
The target company is subject to various questions studying the negative impact that
LBOs have on some essential aspects, such as industrial processes, innovation and investment
policies. Overall, the idea behind this research is to determine whether an LBO operation is
harmful relative to the target company, while enriching the PE Fund.
Process efficiency
In their optimization quest, LBOs tend to seek a higher productivity and more efficient
processes. It often means reshaping the cost structure of the target company, and upgrading the
level of operating facilities. In that sense, LBOs can actually have a positive impact on the target
company’s efficiency. Miller L. and Hawkes D. (2015) collect a sample of manufacturing
companies in the UK, to try and determine whether companies under LBO operate more
efficiently than their competitors. They find that this general idea is cannot be supported over
their considered period. To measure and compare the level of efficiency of the manufacturing
processes, they use the Data Envelopment Analysis (DEA) technique and build an efficient
frontier against which each observable company can be compared. Efficiency is measured
relatively to the highest observation, not the average; therefore, a company is truly efficient if
it beats the current most efficient in the market.
We can argue that this approach contains a competitor bias. Indeed, the efficiency of
the target company is assessed compared its competitors, selected if not under LBO. However,
it does not account for the reaction of competitors, which may upgrade their standards in
anticipation or in reaction of the announcement of the LBO. As mentioned earlier, competitors
may feel threaten and improve their processes to remain competitive. Hence, the control group
against which the target company under LBO is measured already encompasses the effect of
the LBO. It may explain the findings of this paper; the results show no significant superiority
in efficiency of the target company, while the LBO may have pushed upwards the efficiency of
the all sector.
Finally, we can question the relevance of this impact on OpCo. From the point of view
OpCo, efficiency is valuable only if it translates into performance. The party of the target
company is affected negatively or positively only if the event reduces or increases its ability to
survive and better perform. In that sense, measuring the process efficiency is relevant, since it
enables the target company to remain competitive in the market and therefore to avoid going
under progressively. However, it becomes irrelevant when coupled with the observation of
financials, investment and innovation policies, since its effect is already a part of these
34
elements: efficiency is the product of R&D coupled with investment, and produces financial
benefits.
Innovation policy
The academic literature has recently produced relatively numerous studies focused on
innovation activities of target companies. The aim is to assess whether LBOs, in the goal of
reducing costs, push target companies to cut Research & Development (R&D) expenses. The
subject goes beyond academics to interest the financial industry and the press. Frontier
Economics dedicates its May 2013 publication to the role devoted to innovation in Private
Equity, and the benefits it entails for the economic growth in Europe. The rationale is that firms
which have efficient innovation policies increase their competitiveness and productivity, and
therefore contribute to a dynamic economy.
Academic papers usually measure innovation through four gross measures, which are
the level of R&D expenses, the number of patents registered, the number of citations of those
patents, and the number of new products announcements. Measures are either used as such, or
consist in a combination of some of them.
Observing the level of R&D expenses, either as an amount or proportionally to an
accounting aggregate, is the most classical and direct approach (Lichtenberg F. and Siegel D.S.,
1990; Long W.F. and Ravenscraft D.J., 1993). If the R&D decreases abnormally during the
length of the LBO, the LBO may have a negative impact on the innovative activity of the target
company, by cutting expenses in order to generate more cash. Long W.F. and Ravenscraft D.J.
find that LBOs cause target companies to decrease their expenses by 40%, and that LBOs which
retain an intensive innovative policy outperform both competitors under LBOs and regular
competitors. On top of being a quick measure, R&D expenses give a view on how important it
is for the company to invest. It is an indicator of input, rather than output; it shows what budget
is allocated to innovation, as a strategic decision. However, its main drawback is that it does
not discriminate productive innovation from useless expenses. A decrease in R&D expenses
can also be due to the management reducing useless expenses and retaining the same level of
well-invested R&D that prior the LBO (Amess K., Stiebale J. and Wright M., 2015).
Second, the observation of the number patents is an alternative measure which is easily
implementable (Frontier Economics, 2013; Popov A. and Roosenboom P., 2009). It only
requires access to public databases, and presents a certain level of objectivity, since it is
independent from any self-reported data. It gives an idea of the relevance of the expenses spent
in R&D, since patents are costly. Their registration shows the determination of exploiting the
patent to an economic end. On top of that, studies indicate that patent applications seem to be
35
strongly correlated with other elements of innovative performance (Amess K., Stiebale J. and
Wright M., 2015). However, this measure is subject to various issues. Measuring the number
of patents registered by the target company is not a clear selection of productive innovation
against useless expenses. Some patents are never exploited and present no competitive
advantage for the firm. Patent activity does not reflect the innovative profile of the company
either. Indeed, some firms may have a tendency to patent every finding, while other choose to
keep their discovery secret by fear of imitation or IP protection regulation. Finally, this measure
suffers from endogeneity (Lerner J., Sorensen M. and Strömberg P., 2008), as it is tricky to
interpret change in patenting activity. Does the LBO push the patenting activity upwards, or
has it invested in a target company with a growing innovation activity? As it is an output
indicator, it does not discriminate among innovation cycles of the firm. Hence, some patents
registered during the life of the LBO can be actually due to R&D expenses prior the LBO.
To remedy the lack of discrimination between productive patents and non-valuable
ones, some papers choose to observe the number of citations of the patents (Frontier Economics,
2013; Lerner J., Sorensen M. and Strömberg P., 2008). There exist software means to track
articles mentioning a particular patent. We can thus count the number of times that each patent
of the target company is being cited. A patent with more citations is assumed to be more relevant
on a technological level, and hence is likely to translate into higher economic benefits for the
target company. Taken as such, this measure does not enable to distinguish very different
situations, like a company with many patents cited a few times, or a company with few patents
cited many times. It is detached from the number of patents registered by the company. As an
output indicator, it does not properly reflect the innovative profile of the target company, as
explained above. In their paper, Lerner J., Sorensen M. and Strömberg P. have adjusted this
measure from several bias in the way of counting citations. Still, it remains that the number of
citations can only grow, as it encompasses both existing patents prior the LBO and new ones
registered during the LBO.
The fourth element which is traditionally, though less than the first three, used to
measure innovation is the number of announcements relative to product launchings (Hagedoorn
J. and Cloodt M., 2002), whereby the firm announces, either publicly or privately if data are
collectable, that it launches a new product. As pointed out in the paper, this measure is specific
to some industries, where products are the final step of an extensive R&D chain, and can be
irrelevant in some others. There also exists a bias, since data are based on self-reported
documentation, thus subjective to the target company.
Hagedoorn J. and Cloodt M. (2002) also introduce an exhaustive measure of innovation,
which would be the combination of the four indicators. The aim is to capture the whole
innovative activity, while leaving no elements contributing to innovation aside. The paper
acknowledges that the level of correlation would then be too high to produce an applicable
measure. The measures overlap one another and do not enable to produce relevant results.
36
In their recent paper, Amess K., Stiebale J. and Wright M. (2015) introduce a new
approach, based on the combination of the number of patents registered by the company and
the number of citations of these patents. The goal is to capture the usefulness of the patents
registered, perceived as the sole valuable ones for the target company. They collect patents
registered and weight them with the number of respective forward citations. Hence, “if Private
Equity firms induce an increase (decrease) in patenting for purely strategic reasons, we should
see an increase (decrease) in the number of non-weighted patents but little change in citation-
weighted patents”. Because they take into account only the forward citations, the patents
registered prior the LBO are not factored in, unless they are cited over the life of the LBO. It
enables then to compare innovation activity prior and after the LBO, and to remedy to the
double counting due to taking output indicators. However, with digital communication means
becoming more and more performant, it is difficult to distinguish the increase in citations due
to the decisions of the LBO from that entailed by higher technological visibility and access
(Gonzalez-Uribe J., 2012). Of course, we need also to keep in mind that any measure involving
patenting activity can be irrelevant for some industries, where the business model does not lie
on discoveries.
In parallel to these measures, some papers try to propose original ways to assess
innovation. Gambardella A. (2008) introduces a value computation for the patents. This value
encompasses the totality of the patents owned by a company, and is based on transaction data.
Very little research has been done on that subject, and this approach still lacks additional criteria
to discriminate across useful patents, end-of-life patents, etc.
Finally, Pederzoli C., Thoma G. and Torricelli G. (2011) propose a way to assess the
role of innovation for companies undergoing a high credit risk. They model credit risk and find
that innovation can decrease the probability of default. However, this measure is only applicable
to firms suffering from a strong risk of going in liquidation, and does not consider the other
cases. Hence, it does not enable to assess the impact of LBOs on a healthy company.
Investment policy
As for innovation, investment under LBO is subject to many suspicious critics. Research
on the investment behaviour of target companies aims at determining whether LBOs manage
to impose a short-term view on OpCo, such that investment expenses are cut to increase cash
generation.
The classical measure of investment is the level of capital expenditures of a firm
(Servaes H., 1994; Boucly Q., Sraer D. and Thesmar D., 2009). It is the equivalent of R&D
expenses in the case of innovation, and presents similar drawbacks. The level of capital
37
expenditures does not discriminate productive investment from useless expenses. Hence, a
decrease in capital expenditures under LBO does not necessarily means that essential
investment expenses are cut. That said, it is less obvious that capital expenditures may be
useless, contrary to R&D expenses. Though it is an input indicator, this measure may still be
subject to time overlap. Indeed, the investment realized during the life of the LBO may be the
consequences of decisions taken prior the LBO (Sachs R., 1966). Overall, this measure serves
as a good proxy of the investment profile of a target company. Similarly, observing capital
formation during acquisitions and disposals of new assets, both tangible and intangible, as well
as consumption of fixed assets, due to attrition and obsolescence, is very close to capital
expenditures (Bernstein S., Lerner J., Sorensen M. and Strömberg P., 2015).
The academic literature has produced less pieces of work on alternative ways to measure
investment, contrary to innovation. Though it is a very studied subject, papers usually use the
level of capital expenditures of the company. Some academics have introduced more original
approaches, but which are still not much reused.
Desbrières P. and Schatt A. (2002) have worked on the impact of LBOs on the
investment profile of French companies. They use two main ratios to measure the investment
behaviour. The ratio of Financial Assets divided by Fixed Assets enables to assess the external
growth policy of the target company, as it encompasses Associates and Financial Investments
in the Financial Assets. It gives an idea of the importance that the company attaches to growing
externally, i.e. through build-ups, rather than investing in fixed assets supporting its existing
business. However, it is less relevant in case of acquisitions consolidated with full integration.
The second ratio is Net Fixed Assets divided by Gross Fixed Assets. It aims at measuring the
life of the assets of the company and its renewal policy, by taking into account the attrition pace
of assets through depreciations and amortizations. The main issue with these two ratios consists
in their cumulative characteristic. Indeed, a change in the ratios prior and after the LBO can
produce consequences later after the end of the LBO. The investment policy measured here
takes into account decisions taken during the LBO, but which may have later consequences not
affecting the LBO.
Finally, rather than measuring investment expenses or benefits relative to investment
decisions, Sachs R. (1966) proposes to directly study the investment decisions themselves.
Thanks to a complex model, the paper analysis capital allocation. This approach enables to
adjust investment policy from time bias, whereby consequences of these policies may arise
much later after the end of the LBO. This model is however specific to manufacturing
industries, and is hardly applicable in a non-theoretical environment. Capital allocation-based
approaches enable to assess the policy in itself, independent or previous decisions, contrary to
capital expenditures. Still, they also suffer from a lack of quality discriminating factors,
especially regarding external growth. For example, these measures do not tell whether the target
company acquires many build-ups with little strategic rationale.
38
2) Employees
We see in the previous part about employees measures relative to quantitative elements,
such as unemployment risk and remuneration. There is one qualitative element which is more
and more mentioned, in particular in the press: the working conditions of employees from
companies under LBO (Fox I. and Marcus A., 1992; Bonnand G. and Mermet E., 2008).
Research on that topic is rather scarce. The few papers that mention satisfaction of employees
over their working environment do not research the impact of LBOs. The two measures that we
present below are extracted from papers discussing other matters, but which use measures
applicable to our topic.
When considering satisfaction of employees, the most direct approach is to collect
opinions via surveys. They capture the perception of employees themselves, and are the most
reliable source of information in order to tell whether LBOs have a negative impact on working
conditions. They suffer however from a human bias, whereby satisfied individuals tend to
underreact, while dissatisfied individuals tend to overreact. The constraint with this approach
is that surveys must be conducted regularly. To measure the impact of the LBO, surveys must
have been conducted prior the LBO, to have a base to compare against. Hence, it is not
applicable to all case studies. Boucly Q., Sraer D. and Thesmar D. (2009) mention the use of
the REPONSE survey, run every six years by the French governmental authorities. This survey
collects information on working conditions for employees on a large sample of French
companies. The renewal every six years may prevent a comparison prior and after the LBO, as
the survey needs to be conducted precisely at entry and at exit.
In a 2003 study about the relationship between applications and firms’ reputation,
Turban D. and Cable D. collect several rankings published by financial magazines in the United
States, in which a sample of employees lists the top companies which they deem employee-
friendly. The measure consists in a sum of dummy variables indicating whether the employees
would like to work for the company. This approach captures the direct perception of potential
applicants, but from an external point of view; they only judge the impression they have. There
are some bias embedded, like size, visibility or glamour, whereby such companies tend to attract
more positive views. This measure is a good proxy for employee satisfaction if the target
company studied appears in the study at least once prior the LBO or at exit.
Employees’ satisfaction over working conditions is not much researched in the
academic literature. We try to propose some measures to assess this satisfaction in Section II.

39
3) Competitors
The growth of the Private Equity industry over the past decades has raised some
questions over whether LBOs are beneficial to the economy. In particular, some academic
papers investigate the influence of LBOs at the industry level. They study their impact on
competitors’ behaviours and how they are able to reshape an industry.
Investment policy
We see above research studying how LBOs can influence the target company’s
investment policy. The same question is raised relative to the whole industry, i.e. how LBOs
can have an impact on the investment policy of the target company’s competitors. Kovenock
D. and Phillips G.M. (1997) analyse the effect of the capital structure induced by LBOs on
investment decisions and restructuring programs of the competitors. They use various measures
to assess that impact, from the number of plant exits to capital expenditures operated by
competitors.
However, this topic reflects the reaction of competitors against the LBO. Competitors’
investment policies are strategic decisions, undertaken on a voluntarily basis and actively
realized. They do not refer to a “suffered” consequence from the LBO on the target company,
that they cannot escape. The investment policy remains in the scope of their leeway; it is an
indirect consequence, which is not mechanical. Hence, it cannot be put on the same level as
impacts discussed for other parties, which capture the direct and mechanical effect of LBOs.
Productivity and employment growth
Another potential impact of LBOs on their environment is the performance of the
industry in terms of productivity and employment. Bernstein S., Lerner J., Sorensen M. and
Strömberg P. (2010) show that industries where Private Equity has been active over the period
studied have experienced a growth in productivity and employment. For the latter, they use the
classical headcount approach, as well as labour costs. As for the industry indicators, enabling
to measure industry productivity, they use the STAN database, providing information across
OECD countries. In particular, they refer to the gross production output, the output net of
materials purchased, the consumption of fixed capital and the gross capital formation in net
acquisitions of new assets.

40
The general idea here is to study the influence of LBOs on competitors’ changes in
strategic behaviour. As for the investment policy, it reflects a reaction of competitors, rather
than a mechanical consequence. Most of the literature covering collateral effects of LBOs on
competitors refer to secondary actions like these ones.
41
4) PE Fund
At the heart of the transaction, the PE Fund is usually considered for its financial return.
There has been some recent research over the past few years focusing on the workings of a PE
Fund, and on more qualitative elements, such as the level of importance of the Fund’s
reputation, and its power of attracting skilled employees.
Reputation
As we explain above, the PE Fund is an intermediary vehicle, designed to raise funds
by LPs and to invest them in target companies and their holding companies. As such, LPs have
a major influence on the shape of the Fund, since they are the main capital providers. We can
imagine a case where the PE Fund underperforms on all its deals. It then loses the confidence
of its investors, who do not recover their equity investment. As a result, they shy away from the
following fund raising, and convey a negative signal to potential new investors. The PE Fund
ends up with no LPs willing to commit capital, and is forced to close its business. Hence, the
reputation of the Fund is crucial to be able to raise funds.
Starting from that statement, most measures of reputation for PE Funds are based on
their past or future fund raising. As a past approach, we can observe the various characteristics
of the Fund (Tappeiner F., 2010). The size of the Fund, i.e. the sum of all the amounts invested,
enables to see how much the PE Fund has been able to raise. The lifetime and the number of
deals provide ambiguous information. A PE Fund investing the capital over a large time lap,
and into many small deals, does not necessarily have a better reputation than a PE Fund
investing all its funds into a few large deals at once. These measures need to be looked at more
precisely to give relevant results. Finally, the total value of the deals of a PE Fund (Liu C.,
2013), i.e. the Assets under Management (AuM), gives an idea of the patrimony of the Fund.
We note that we do not distinguish here the PE firm from the several funds raised. We consider
the PE Fund as a whole, with capital raised and invested into different deals, across batches.
All these measures assess the reputation of the Fund at the time of the latest fund raising. Hence,
they are not relevant to measure the impact of one particular LBO on the reputation of the Fund.
Indeed, the influence of the LBO studied can be compensated by the rest of deals of the Fund,
and thus be diluted at the time of the fund raising. The fund raising does not necessarily reflect
the performance of this particular LBO transaction.
Instead of taking a past approach, we can analyse the ability of the PE Fund to raise
funds in the future. The rationale is to disconnect the fundraising from the past performance,
and to back it by the expected performance of the next investment wave. This ability is
measured by the curve of returns over the life of the Fund. While this curve is supposedly in
42
the shape of J, meaning that returns become attractive after investment and early additional
expenses, Mulcahy D., Weeks B. and Bradley H. (2012) find that it actually takes the shape of
a minor N, whereby the Fund fails to achieve satisfying returns on average. This approach,
which needs to be measured ex post, enables to compute the returns of the LBO investment in
particular over its life, and gives a proxy of the ability to raise funds, should the Fund only have
this deal in its portfolio. Hence, when comparing the curve with the rest of the portfolio, it
provides an idea of the influence of this particular LBO on the ability of the Fund as a whole to
raise funds at one point in time.
There are strong correlations between the ability to raise funds, the reputation of the
Fund and the financial returns, which make the combination of an exhaustive set of measures
difficult. We see in Section II our recommendations regarding the measure of the reputation
and the ways to combine the different measures.
Attraction of new talents
It is very important for a Fund to recruit skilled employees, as the PE team is in charge
of choosing the right target companies to invest in. To assess the level of skills of GPs employed
in a PE Fund, Acharya V., Gottschlag O., Hahn M. and Kehoe C. (2011) study their
backgrounds, and the influence that their past careers can have on the performance of the Fund
itself. They discriminate backgrounds against two main categories, whether they come from
Financial Services, or from either a Consulting company or an Industrial firm. This measure
enables to compare the backgrounds of the PE Fund’s employees before and after the LBO. In
case one background proves to be more efficient relative to performance, an increase in GPs
with that background would mean that the Fund is able to attract more skilled employees.
However, we argue that the power of attraction of a Fund is less represented by the
technical background of the GPs than by the level of prestige of their previous employers. The
idea behind the measure of the power of attraction is that it conveys a reassuring signal to LPs.
In that sense, it overlaps with the reputation of the firm. The attraction of talents contains a
reputational part, as well as a technical part enabling to better perform. In parallel, the reputation
allows to raise funds more easily by LPs, as well as to attract new talents.
In our Section II, we see our recommendations regarding the measure of this qualitative
element, and how we explode the concepts of reputation and attraction of talent in order to build
an all-encompassing set of measures to assess the impact of the LBO on the PE Fund. We follow
this methodology for each party, and try to form sets of measures as exhaustive as possible,
with little overlaps.

43
In this Section I, we see how the academic and financial literature considers value
creation in LBOs, and how it studies collateral effects of LBOs for qualitative elements. These
two approaches are often not put at the same level; collateral effects are not said to be value
destructive. The existence of such studies shows however that they must be valuable to the eye
of the party, and that they need to be incorporated in the definition of value creation for each
party. We provide in Section II a framework aiming at reconciling financial measures with
qualitative elements. To do so, we introduce a clear distinction between sources of value
affecting past events of the LBO, and sources affecting future events. Hence, a qualitative
element considered as a collateral effect can actually be a source of value destruction that will
reveal itself after the exit of the LBO.
In the next Section we still review some academic literature, in parallel to our
recommendations. However, these papers act as a support for our recommendations, backing
one measure or one element of the reasoning. These academic references are extracted from
papers treating unrelated subjects.
44
Section II – Recommended approach to measure value creation in LBO operations
In Section I, we draw a list of the various stakeholders involved in an LBO operation.
Some parties are usually abundantly covered by the academic literature, while others are less
obvious. For four of them, we present how research studies the impact of LBOs on them. This
research is structured in a two-fold way. On the one side, we review how it measures value
creation for each of them. The list of measures presented aims at capturing what is actually
mentioned as value creation, i.e. mostly financial value. On the other side, we report the
different papers studying collateral effects of LBOs, i.e. mostly qualitative aspects. These
impacts are often not put on the same level as the financial value, and are not embedded in total
value creation for each party.
In this Section, we align all impacts derived from the LBO on each party considered,
and propose sets of measures capturing all aspects valuable to the eye of the party. Hence, our
measures encompass both financial value and qualitative impacts. Since a party can be harmed
by an LBO on a qualitative level, such as on employees’ satisfaction regarding their working
conditions, this negative influence needs to be accounted for in value destruction. We aim at
measuring value from the party’s point of view. Any aspect which is subjectively valuable to
the eye of the party is therefore embedded in our definition of value creation and in our sets of
measures.
Following this approach, we determine all elements having an influence on the party’s
value, and we propose measures to assess it. We start from our academic review of Section I,
and adapt these measures to a case study format. On specific topics which are not covered by
the literature, we introduce new measures and discuss them. We then gather the various relevant
measures and build an all-encompassing utility function for each party. The goal is to have one
function per party measuring the whole value creation, factoring in both quantitative and
qualitative elements. This framework enables then to compare value created among parties and
to distinguish those which benefit from the LBO from those towards which it is detrimental.
45
A – Multi-temporal computation of value creation for each stakeholder
In this part, we combine the financial part of value, merely quantitative, with the
qualitative part, often studies as a collateral effect in parallel of the financial value. These two
aspects are encompassed in value. Hence, to measure value creation in an LBO operation, we
need to take both elements into account.
To that end, we reuse some of the measures proposed by academics, as presented in
Section I or adapted, as well as our recommendations. The goal is to end up with a set of
measures allowing to assess total value creation for each party. We use only one measure in the
set if it already encompasses all value creation. In the case where the measures leave some
aspects aside, we combine different measures to form a set. We need then to go and precise the
measures as much as possible in order to avoid overlaps among them. We sometimes also
propose proxies, which are easier to implement but less accurate and relevant.
So as to build an applicable set, all aspects of value need to be individually identified
for each party. Everything that appears as valuable to the party is studied, such that we are able
to associate a measure to it. In going over these aspects, we find that some impacts of the LBO
occur over a different time frame than others. Indeed, these effects are produced during the life
of the LBO by the LBO, but affect the party only after exit. They do not have immediate
consequences, and jeopardize value for the party after the life of the LBO. In this case, the LBO
undermines foundations of the party for the future. These particular aspects often are of a more
qualitative nature, and mostly consist in the collateral effects studied in the last section. For
example, as we see above, the LBO may have a negative impact on the innovative policy of
OpCo during its life. However, such a decrease in relevant R&D programmes may lead in
poorer performance in the future and destroys value for OpCo. Hence, the negative
consequences occur after the time of measure. On the contrary, financial value as presented in
the second part of Section I reflects the past performance of the party, or its current one. It
measures the value creation due to effects occurred prior the time of measure. We need therefore
to introduce the notion of temporality in the measures.
46
1) Opco
We see in Section I what impacts LBOs have on the party of the target company,
according to the academic literature. These impacts fall under two categories: the financial
value created and the collateral qualitative effects, which are the efficiency of the processes, the
innovation policy and the level of investment. On top of these, we argue that an LBO influences
OpCo in other qualitative ways, which we develop below.
The financial measures, as we present it in this paper, refer to measures computed on
financial and accounting aggregates. Among them, we develop in Section I the following ones:
ROCE-WACC, multiples, market capitalizations and peer valuation, as well as valuation
methods based on Business Plans and indicators of operating performance. When we study
these measures, we find that we can introduce a distinction between them, regarding their
temporality. While the operating performance is directed at past performance, both valuation
methods, i.e. peer valuation and forecast valuation, are oriented towards the future. Indeed, on
the stock market, investors value companies based on future expected returns. According to the
efficiency theory, they encompass future growth, profitability and other benefits. Similarly,
forecast valuation methods such as the AVP or the DCM are based on Business Plans and
forecasts. As far as ROCE-WACC is concerned, it is sort of a mixed measure. While the ROCE
is computed of past aggregates, the WACC incorporates investors’ expectations of future
benefits.
As we discuss it earlier, ROCE-WACC includes a risk component, and thus does not fit
our framework. However, starting from the statement that some measures assess the past
component, while the others assess the future component, we can ask whether the combination
of some of these measures can encompass all value creation for OpCo. Indeed, measures such
as share prices and multiples are supposed to reflect investors’ beliefs of the future of the
company, and hence already encompass potential negative effects on innovation or investment
that the LBO may have had. We need therefore to go into details about these measures, in order
to determine whether the combination fits.
Past operating performance
The goals of OpCo are to survive and to improve its performance. In that sense,
comparing its operating performance between entry and exit is relevant to our framework. We
present in Section I measures proposed by the academic literature to assess it, and we end up
with two major drivers of performance: the growth of revenues and the profitability, i.e. the
margins. However, this set lacks the cash conversion profile, essential to the health of the
company.
47
Starting from this statement, we need to build a comprehensive set of measures to assess
operating performance. In order to incorporate all aspects in it, including the cash component,
we can combine the revenues growth, the margins, as well as the Cash Flows. There is however
a significant overlap in this combination, as the major part of the Cash Flows are derived from
accounting aggregates. We need to determine the drivers of the cash conversion of margins into
Cash Flows. What contributes to nurturing the gap between accounting margins and Cash
Flows? We identify three factors:
- The Working Capital Requirement (WCR), which introduces a first gap at the level
of the gross margin
- The depreciations and amortizations (D&A), which increase the gap at the level of
the EBIT margin
- The various time lags, at all the levels of the Income Statement, whereby salaries
recorded are distributed after a certain number of days, or because of tax regimes,
etc.
The last item is not accounted for in this paper, as it is often negligible and stable
overtime at a firm’s level. As far as the treatment of D&A and the renewal policy of assets of
the target company are concerned, they are rather gathered with the investment policy, as we
develop it below. Finally, we are left with the WCR. It consists in the cash “frozen” in
inventories, as well as due to inefficient collection of revenues and management of payments
from OpCo. It is usually the first item to be optimized under an LBO, as it is done internally by
the management. Companies seek to reduce their WCR, as this “frozen” cash needs to be
financed, and thus generates costs. Therefore, our recommendation is to combine the three
following elements in the measure of the operating performance: the growth in revenues, the
profitability and the level of the WCR. We note that we choose to deal with the EBITDA
margin, as it enables to group the treatment of D&A with the investment policy.
In order to apply this set of measures to our framework, that is to say to assess the impact
of an LBO on the target company’s operating performance, we need to adapt it. Indeed,
comparing the operating performance at entry and at exit is not satisfying, as it does not isolate
the influence of the LBO from structural changes in the company. A portion of the revenues
growth can be explained, for example, by investments realized prior the LBO, or by a shift in
the business model performed during the LBO, but decided before. Should the target company
not have been under LBO, it would still have implemented this shift and grown at this rate. On
top of this, growth also incorporates to some extent the sector’s growth or the GDP growth. To
be able to distinguish the consequences of the LBO from the rest, our recommendations is to
compare the operating performance at exit, not against that at entry, but against the latest
forecasts available at the announcement date. For instance, assuming the exit takes place five
years after entry, we first collect the most recent forecasts or business plans published, either
by the management or by brokers, before the announcement of the LBO. Then, we compare the
operating performance at exit with that of the five-year forecasts. Hence, the control
48
performance is not polluted, since the LBO was not announced at the time of the forecasts. In
the case when no forecasts are available on the required time lap, we use shorter forecasts,
whose trends we extrapolate.
We eventually end up with a set of measures assessing the impact of the LBO on the
operating of the target company. It actually encompasses the whole past component of value.
Indeed, as per our definition of OpCo’s life goals, an element is valuable to the party of the
target company only if it increases its ability to survive and better perform. As such, measuring
the difference in operating performance due to the LBO already encompasses all past elements
that have created value for OpCo.
However, it only reflects the consequences of the LBO occurred up to the exit date. In
other words, it shows the output of the LBO impact until exit, contrary to the input across this
time lap. Any aspect originated during the life of the LBO by the LBO, with consequences due
to occur later in the future, is not reflected in these measures directed at the past. To be
exhaustive, we need therefore to complete this set with additional measures directed at future
value. Only then, provided that overlaps across measures be negligible, does the set of measures
match our framework. Even if the value destruction does not occur during the life of the LBO,
the LBO is responsible for it.
What kind of measures can be combined with the operating performance to assess the
whole value creation for OpCo due to the LBO? We mention above the valuation methods
based on peer comparison and forecasts of the target company, and explain to what extent they
are directed at the future. Therefore, can we combine either the operating performance with the
peer valuation, or the operation performance with the forecast valuation, in order to measure
value creation as a whole?
The major issue of such combinations is the correlation between the measure of the past
component and that of the future component. Indeed, the forecasts at exit reflect the estimations
of the company’s performance starting from exit. Therefore, they are strongly correlated with
the past performance, and account twice for some drivers of performance. For example, we can
imagine the following combination; the measure of past operating performance is coupled with
the changes of multiples between entry and exit. The rationale is that the change in valuation
multiples incorporate growth prospects and future value estimated by the investors. This change
is highly correlated with the operating performance during the life of the LBO, and thus
prevents the combination to fit our framework. On top of that, the use of peer valuation is
subject to market inefficiencies and biases.
From these remarks, we identify two main takeaways:

49
- The operating performance is the best measure for the past component of value
creation for OpCo. As such, it is the most relevant and main driver of the whole
value creation.
- The remaining aspects of value creation for OpCo are included in the future
component. To avoid overlaps, they must be independent from the past
performance.
At this stage, we need to understand what are the remaining drivers of value creation
for the target company. As the operating performance encompasses all the past drivers, the
remaining ones must be directed at the future. That is to say that they are drivers originated
during the life of the LBO, but with consequences for OpCo occurring after exit. These drivers
are value destructive if they undermine the ability for OpCo to survive and better perform, i.e.
if they jeopardize its sustainability.
One way to assess the worsening of OpCo’s sustainability is to directly compare the
probability of default before and after the LBO; does the LBO increase this probability? In this
case, the LBO is said to be value destructive. There are several ways to compute a company’s
probability of default, and the academic literature presents many versions, such as the historical
probability (Molina C., 2005), the ex-ante probability (Graham J., 2000) or the risk-adjusted
probability (Almeida H. and Philippon T., 2007). This research takes place often in papers
studying a regular company bearing a high risk, and not in the case of LBOs. The issue with
the use of probabilities to measure value creation, is that it yields relevant results only if the
company is already on the verge of bankruptcy. In this case, the LBO may worsen or improve
its situation, and the evolution will be reflected in the two probabilities. Otherwise, this
approach does not distinguish situations where the target company is quasi safe from going
under; whether the LBO slightly improves or worsens sustainability, the probabilities of default
stay at a low level with no significant change. The same goes for measures observing ratings,
spreads on bonds or changes in borrowing rates for OpCo. They yield results only if at one date
at least, either entry or exit, the target company is close to liquidation. On top of that, the major
issue with these approaches is the fact that they encompass risk of the party itself. Indeed,
default, as well as refinancing data, is related to the risk embedded in the company, mostly due
to the financial leverage. Hence, these measures do not fit our framework.
We need therefore to identify elements that have an influence on sustainability. We
mention in the first section the efficiency of processes as subject to the impact of LBOs.
Operating processes greatly contribute to a company’s performance, and improving their
efficiency often goes along with giving the company better and more solid bases to perform
upon. The level of efficiency at exit is beneficial to the performance post LBO. In that sense,
assessing how the LBO increases or reduces the efficiency of the process can be interpreted as
a driver of future value for the company. However, assessing the improvements in terms of
50
efficiency between exit and entry cannot be coupled with the past performance, as the processes
greatly influence the performance. Conversely, the performance enables to invest in efficiency.
Hence, there are too much overlaps within this combination.
Though the measure of efficiency does not fit, we can deconstruct this notion into
several other elements, such as innovation or investment. Indeed, the level of efficiency of the
processes is permitted by the R&D programs, and realized through the right investments. By
doing so, we are able to combine them with the operating performance, provided that we stick
to the EBITDA margin when considering profitability. Otherwise, for example by taking the
EBIT margin, we account for the investment policy twice. Beside innovation and investment,
we identify two other drivers of future value: the reputation and the level of employees’
motivation to work for the company.
Innovation policy
We review in the previous section the various measures of innovation presented in the
academic literature. In our view, the most relevant is that from Amess K., Stiebale J. and Wright
M. (2015), where the number of patents is weighted by the number of forward citations. This
approach enables to account for the quality of patents registered, and to better explain a change
in innovation policy. Hence, a decrease in innovation expenses due to a focus on productive
R&D cannot be interpreted as an arbitrary cut in research programmes, as it can be in more
traditional measures. Our recommendation is to use this measure to assess innovation activity,
keeping in mind several drawbacks.
First, there is a technological bias (Gonzalez-Uribe J., 2012), whereby the evolution of
technological techniques enables an easier and faster access to information. Under this light, an
increase in citations can also be due to the improvement of database access and communication
means. Second, the use of patents mechanically puts aside companies for which patent
registration is negligible, for example for secrecy needs or financial means. Third, this measure
raises the question of the translation of citations into value. Indeed, it implies that a patent,
being cited many times, is more qualitative as more relevant to the industry, and hence more
valuable. However, we can argue that publicity also attracts imitation, and can therefore benefit
to the competitors of the target company. Whether citations are a signal of value to the patent
owner is thus debatable.
Finally, the major difficulty with this measure consists in its application to a case study.
In the original paper, Amess K., Stiebale J. and Wright M. compute it for a sample of companies
both under LBO or not. From the comparison, they infer the impact of LBOs on innovation.
When applied to a single LBO operation, the measure needs to be adapted. We can compute
51
the innovation activity, thanks to this measure, at exit, at entry, or at some point in time in
between. What approach do we use to compare innovation levels? Do we compare the
innovation activity at exit against that at entry? Do we compare it against competitors? To
isolate the impact of the LBO, we need to compare innovation levels according to their exposure
to the LBO. Hence, the most relevant approach is to compare exit and entry. However,
measuring the patents existing at exit and observing their forward citations puts aside the patents
registered during the life of the LBO that have already accumulated citations. This approach
implies that the registration level is constant over the years, so that all the years of the life of
the LBO produce the same innovation activity. What is actually measured in this way is the
difference of innovation levels of two discrete years. To be consistent, our recommendation is
to take the average number patents registered each year over two or three years before the LBO,
weighted by the number of forward citations, and to compare it with the average number of
patents over two or three years around the exit date, weighted by forward citations. The fact
that we do not take the average before exit, i.e. in the last years of the LBO, is explained by the
fact that we assume that the innovation level of the target company, as modelled by the LBO,
is fully achieved by the end of the LBO, and is not changed by the new owner overnight. Instead,
taking the average around the exit date enables to skip the transition years in innovation policies
during the first years of the LBO and during the first years of the new ownership post LBO.
To account for the complexity and time consumption of this measure, we also propose
a proxy measure of innovation. R&D expenses, as used in classical computations (Lichtenberg
F. and Siegel D.S., 1990; Long W.F. and Ravenscraft D.J., 1993), enables to quickly assess
budgets allocated to research by the target company. It is easy to compute and rather complete.
It includes however several biases, as we present them in the previous section.
Investment policy
In Section I, we list the various ways to measure investment for the target company. The
two most relevant approaches are, on the one side, the capital expenditures expenses, and on
the other side, the two ratios (Desbrières P. and Schatt A., 2002). While the first one is an input
indicator, which states the budget allocated to investments and asset renewals, the second one
is an output indicator, showing the results of such policies. Both have advantages and
drawbacks, as we explain above. To determine which of the two is the more relevant, we need
to take into account the big picture. Our framework in this paper aims at measuring the whole
value creation, by assessing the impact of the LBO on all the different elements of value. To be
valid, the set of measures needs to be exhaustive, and contains as few overlaps as possible. The
measures within should be designed as the pieces of a puzzle. Hence, redundancy across
measures is to be avoided.
52
Following this reasoning, the classical approach, i.e. the comparison of capital
expenditures levels, presents an overlap with another element of value that is discussed below:
the motivation of employees. Indeed, within the capital expenditures are gathered both
acquisitions and maintenance investments. Under the latter category, we can find machine
renewals, as well as everyday supplies such as pens, chairs, desks, etc., which directly impact
the working conditions of employees. Therefore, our recommendation is to decompose the
investment level into three categories: the M&A activity, the operating investment impacting
employees’ working conditions, and the other investments less directly linked to employees,
such as the maintenance of buildings and renewal of machines. We note that this latter example
can also influence employees’ working conditions, but to a lower extent that everyday supply.
The second category of investment type, i.e. operating investments related to
employees’ working conditions, overlaps with the element of motivation of employees
presented below, without explaining it entirely. Working conditions are impacted by everyday
supplies, but also by other items which are not embedded in investments. Hence, to match our
framework, we need to measure the investment level for the two remaining categories, unrelated
to employees, while this one is already taken into account in the motivation of employees.
Therefore, the classical approach, whereby capital expenditures are compared at different point
in times, cannot be applied. The two ratios, however, are more relevant. The first ratio, Financial
Assets/ Fixed Assets, measures the external growth policy of the target company, i.e. the M&A
component of the investment policy, while the second one, Net Fixed Assets/ Gross Fixed
Assets, measures the fixed asset renewal policy, i.e. the third type of investment. Our
recommendation is therefore to use these two ratios.
Reputation
Along with the innovation and investment policies, we identify reputation as a third
driver of future sustainability for the target company. The rationale is that a good reputation
conveys a positive image of the company and enables to reassure clients or to appear as more
credible in the eye of professional partners. It consists in the first interaction with the target
company, and may either attract or repulse. As for the first two items, the target company’s
reputation needs to be translated in terms of performance at some point in time. To make sure
that it is driver of future performance, we need to identify the various recipients, over which
reputation has an influence. Ferguson T., Deephouse D. and Ferguson W. (2000) define
reputation of any company as a threefold item. “Different types of reputation have been studied,
such as for being a tough competitor […], for being a good place to work […] and for having
quality products […].” Starting from this statement, we determine the three corresponding
categories:
53
- The business partners
- The employees
- The clients
First, the clients are sensitive to the company’s reputation. They represent the demand,
to which supply is offered. In that sense, they make a choice among OpCo and its competitors,
whereby they generate revenues for the chosen company. Reputation plays a more or less
important role in their decisions, all the more if it is the first time they are in contact with the
company. It is thus essential for the target company in order to attract new clients and keep the
existing ones. We note that reputation is less, but still, relevant in niche markets with high
barriers to entry and low elasticity of the demand.
Second, reputation impacts OpCo’s business partners, such as the suppliers and
subcontractors. As professionals, they choose to enter relationships with the target company,
contractual or informal, provided that they have confidence in it. As such, they are sensitive to
OpCo’s reputation, as it conveys credibility and reliability. Should they have a poor image of
the target company, existing or potential business partners may shy away from it, and OpCo is
then left with low quality partners. Such a situation is therefore likely to translate into bad
performance for the target company.
Finally, employees are also sensitive to OpCo’s reputation. They are attracted by the
promise of good working conditions, as well as a satisfying remuneration and the certainty of
keeping their job positions. With a bad reputation, OpCo loses the good candidates, which
potentially translates into bad performance. Through this definition, we see that there is an
overlap between this component of reputation and the motivation of employees, which is
presented below. Hence, we measure here the first two components of reputation, as the third
one is embedded in employee’s motivation.
There are several approaches to assess the way a firm is perceived. Observing the ratings
attributed by rating agencies (Ferguson T., Deephouse D. and Ferguson W., 2000) gives an idea
of the financial health of the company. It can be used by clients trying to make up their mind
on the company, based on its financials. It is however strongly correlated with the operating
performance already measured. Reputation, defined as an impression conveyed to key
recipients, can also be approximated by looking at the firm’s rankings in several lists, such as
rankings of the most admired companies (Basdeo D., Smith K., Grimm C., Rindova V. and
Derfus P., 2006). They give a rather complete picture of a firm’s reputation, but overlap with
many other items, such as the financials, the innovation policy, the motivation of employees,
etc. Similarly, we could collect the ownerships of companies and assess the quality of
institutional investors in the capital. The rationale is that high quality investors, bring
confidence about the company to potential clients or contractual partners. As for the other
measures, there are many overlaps regarding financials, investment policies, etc. Hence, none
of these approaches fits our framework.
54
The difficulty in finding the right measures is to avoid overlaps with past performance,
especially in the case of suppliers, for whom most of the data are transactional. Our
recommendation is to use a set of two measures to assess the reputation of OpCo directed at
clients and business partners. The first measure of this set consists in surveys of client
satisfaction, whereby customers answer a list of questions designed to better understand the
way they feel about the target company. These surveys give an idea of the products’ quality,
but also of the company’s marketing strategy, the after-sale services, etc. They are at the source
of the reputation directed at clients. Hence, this measure coupled with the operating
performance enables to explain an increase in margins due to a decrease in quality. We note
that there is some correlation with other items such as investments, for example regarding the
quality of the premises. The major issue with this approach is the comparable base; to be
applicable, the survey at exit needs to be compared to another one conducted before the LBO.
The second measure of the recommended set is the collection of articles in the press
covering the target company. It illustrates the perception of the market, and approximates the
impression that business partners have of OpCo. Thanks to several databases, such as
Europresse or Factiva, we are able to track the target company in the press and to determine a
ratio of positive against negative articles. This ratio can then be compared at exit and at entry
to determine whether the LBO has improved or worsened OpCo’s reputation, and hence its
sustainability. This approach includes a bias of size, since large companies tend to be more
covered by the press. On top of that, there are still some correlation with financials or
employees’ motivations. One way to partially remedy to that is to underweight this measure in
the set and to overweight the clients’ surveys.
Motivation of employees
The fourth driver of sustainability that we identify in this part is the level of motivation
of the target company’s employees. By motivation we understand the will of employees to
perform well within the company. The rationale is that employees who are motivated and in
good shape are valuable resources for the company, since they are ready to work their best and
to perform. We consider here both the regular employees and the management. Indeed, to the
eye of the party of OpCo, they are part of the workforce and represent similar resources. This
topic boasts little coverage by the academic literature, even in papers not related to LBOs. To
propose adapted measures, we determine the two pillars of motivation. In our view, motivation
is due to the presence of incentives, and to the absence of deterrents.
Among the incentives, the most traditional ones are related to remuneration, especially
the variable part of remuneration in the form of shares or stock options (Jensen M.C. and
Meckling W.H., 1976). The higher the share of capital, the higher the incentive to perform.
55
Managers have usually a higher share than the rest of employees, and are asked to invest most
of their personal resources, so that they end up with undiversifiable equity. Similarly, changes
of status in favour of the management, whereby managers become co-owners, are a way to
incentivize the management. Hence, we can compare the diluted share of capital, i.e. including
options and treasury shares, at exit and at entry to assess when employees are more likely to be
motivated. This measure presents the advantage of easily isolating the impact of the LBO.
However, it does not discriminate whether incentivized managers are motivated to outperform
and take risk, or whether they are more risk averse, to the point of putting a brake to the firm’s
growth. We assume that, on a general basis, such incentives have productive effects on
motivation to perform. This measure is usually exclusively considered for the management. Our
recommendation is to compute it for both the management and the regular employees.
In an LBO operation, the management is often put under a lot of pressure to achieve a
good performance, notably through the financial leverage. Managers are incentivized thanks to
their stakes in the holding’s equity, and to favourable mechanisms such as sweet equity. Their
aim is usually to give their best during the four or five years of the LBO, and to exit the company
afterwards with the return on their investment. Hence, at the end of the LBO, managers may
experience signs of tiredness and a lack of motivation. We could therefore take into account the
case where the LBO studied is a secondary LBO, meaning that the management may already
be tired from the primary LBO. Similarly, we could look at the age of the managers and infer a
level of tiredness from it. However, these measures are too subjective, and do not enable to
make general claims on such facts.
We see above the incentives; we present here the deterrents, which may hinder
motivation. We identify the core deterrent: poor working conditions. Indeed, employees
evolving in the company and suffering from bad working conditions are likely to show no signs
of motivation. Working conditions are here the results of several elements, like the pressure
imposed by a new pace, the quality of everyday supply, etc. On top of that, these employees
may communicate their perception to potential candidates, directly or indirectly. This is the
third category of reputation, directed towards employees. With a bad reputation, OpCo is likely
to have a poor power of attraction and to end up with low quality employees. Hence, working
conditions have an essential impact on the motivation of existing employees, and on the
attraction of future talents. To assess them, we refer to the measure presented below in the party
of employees, which considers the use of surveys. This measure compares perceptions of
employees regarding their working environment, on various levels. Working conditions are
therefore valuable for both the party of OpCo and the party of employees, but for two different
reasons. For the employees, they are a driver of happiness at work, while for OpCo they are a
source of motivation for its employees, and hence a driver of sustainability.
To measure the motivation of employees, our recommendation is thus to compute three
items: the incentive of the management, through its share in OpCo, the incentive of the
employees, likewise, and the absence of deterrent for the employees and the management,
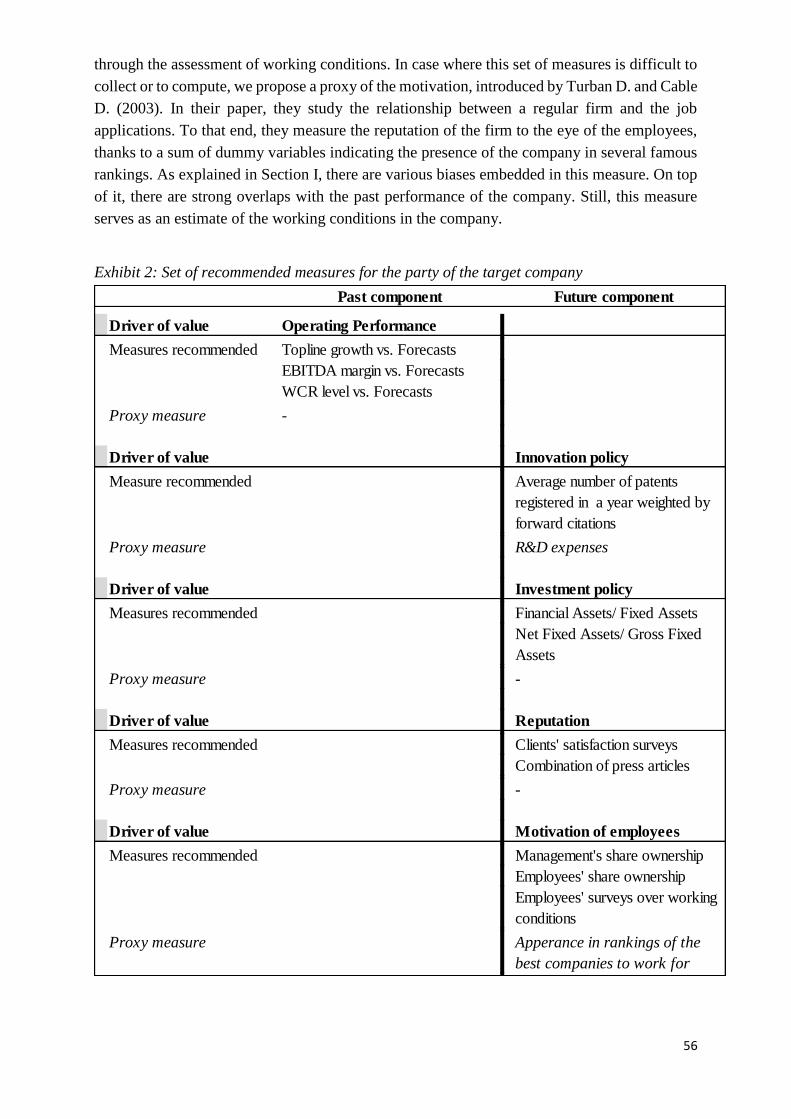
56
through the assessment of working conditions. In case where this set of measures is difficult to
collect or to compute, we propose a proxy of the motivation, introduced by Turban D. and Cable
D. (2003). In their paper, they study the relationship between a regular firm and the job
applications. To that end, they measure the reputation of the firm to the eye of the employees,
thanks to a sum of dummy variables indicating the presence of the company in several famous
rankings. As explained in Section I, there are various biases embedded in this measure. On top
of it, there are strong overlaps with the past performance of the company. Still, this measure
serves as an estimate of the working conditions in the company.
Exhibit 2: Set of recommended measures for the party of the target company
Past component Future component
Driver of value Operating Performance
Measures recommended Topline growth vs. Forecasts
EBITDA margin vs. Forecasts
WCR level vs. Forecasts
Proxy measure -
Driver of value Innovation policy
Measure recommended Average number of patents
registered in a year weighted by
forward citations
Proxy measure R&D expenses
Driver of value Investment policy
Measures recommended Financial Assets/ Fixed Assets
Net Fixed Assets/ Gross Fixed
Assets
Proxy measure -
Driver of value Reputation
Measures recommended Clients' satisfaction surveys
Combination of press articles
Proxy measure -
Driver of value Motivation of employees
Measures recommended Management's share ownership
Employees' share ownership
Employees' surveys over working
conditions
Proxy measure Apperance in rankings of the
best companies to work for
57
2) Employees
In this subpart, we proceed in the same way for the party of employees than we did for
the party of OpCo. Our aim is to identify the sources of value for employees and to propose
associated measures covering the whole value creation. We review in Section I the academic
literature on this topic, and we find that research on the relationship between LBOs and
employees is more and more active. The two main drivers of value that are to be found in
academic papers are the change from employed to unemployed status of the employee, and the
level of their remunerations. To these two drivers, we add a third one under the form of
satisfaction over the working environment.
We define the employee as an individual for which the centre of their lives is directed
towards their job positions. Their life goal is to find happiness within the work scope. We
assume that the employee has no personal life; all the aspects that are valuable to them are
related to their job positions. This definition is of course unrealistic and is rather a theoretical
concept. However, we need to use it in order to measure the value associated with the party of
employees. In our aim of encompassing the whole value creation originated by the LBO, we do
not need to consider the personal life of the individual employed. Indeed, this component is
independent from the LBO. The LBO occurs within the scope of the work environment for the
individual, and all the aspects attached to it are thus part of the professional life. Instead of
considering half of the individual’s valuable aspects, where the other half, i.e. the personal life,
is unrelated to the LBO, we choose to reduce the scope to the employee’s happiness goal to the
professional life only.
As for the other parties, we determine both quantitative and qualitative aspects valuable
to the eye of the employee, directed at the past and at the future. The difference is that this time,
the quantitative components proposed by the academic literature are oriented towards the
future, i.e. the unemployment risk and the level of remuneration, while the qualitative
component that we introduce, i.e. the satisfaction over working conditions, is an impact with
consequences already realized.
We note that this subpart is different from the motivation of employees studied above
in the party of OpCo. We adopt indeed two different points of view. For the employees, the
level of satisfaction over working conditions is part of their life goal in itself, while it is for
OpCo a mean to achieve in the future its own life goal, which is to improve its performance.
58
Unemployment risk
We present in Section I the various ways to measure the risk of being unemployed
introduced by the academic research. For a long time, papers have used the employment growth
to assess the likelihood that the firm lays off some employees in the future. A recent trend in
research introduces a new approach, which consists in measuring that risk at the level of the
employee, rather than at the firm level. Hence, it enables to capture whether the firm lays off
employees or simply stops hiring. In our view, the most relevant measure is the probability of
being unemployed proposed by Antoni M., Maug E. and Obernberger S. (2015). They compute
the likelihood that a given employee in a firm under LBO is laid off, compared to employees
from regular companies. They also introduce career and type indicators, allowing to analyse the
results in details, and explain the probability. These indicators are however computed after the
probability, and are less relevant to our framework.
As we explain it in Section I, the main issue with this measure is whether it can be
applied to a single study. In the paper, two samples are built; one gathering all the employees
working for a target company under LBO at some point in time, and the other grouping
employees from regular company. They get a difference in unemployment risk due to the fact
that the employer is under LBO. In the case of a single case study, we need to collect the career
paths of the employees of the target company, and compare them to a control group. How do
we build our control group?
Our recommendation is to follow employees’ careers for a medium-length time horizon
after exit, like a five or six years. We assume that up to this point, the impact of the LBO has
almost entirely faded away. We compute the ratio of the number of employees laid off during
the LBO and staying unemployed for a certain time period, over the totality of employees. We
compare this ratio with that of the control group to obtain the impact of the LBO on
unemployment risk. To build the control group, we gather the companies in the market and
retain only those which are not under LBO. Contrary to the paper where the control group
includes companies from the whole economy, we select here companies closer to the target
company in terms of business model and industry. Hence, we are able to capture the impact of
the LBO, and not the influence of the business cycles and market trends. This measure presents
the advantage that it incorporates a notion of skill and experience. Indeed, we distinguish
employees laid off and remaining unemployed for a while from those who are hired
immediately afterwards. Hence, it gives an idea of the skills gained by the employee during the
LBO and valuable to the next employer.
This measure requires to collect precise data on employees after the LBO, which can be
difficult as it implies that employees use online platforms and update their information
regularly. On top of being time-consuming, it also requires to have access to a database of
employees in the industry, and their registration in unemployment, in order to build the control
group. Hence, we can use as a proxy measure the employment growth of the target company.

59
We need however to compare it to those of its competitors, in order to adjust for the business
cycles.
Remuneration
The question of remuneration is very close to that of unemployment risk. It usually is
studied along with the employment issue in papers. In our view, the most relevant measure
among those presented in Section I consists in observing the daily wages (Antoni M., Maug E.
and Obernberger S., 2015). The paper collects data on wages declared by employees under LBO
and compare them with a control group of regular companies. It also takes into account wages
earned at further employers, in case when the employee changes companies. Hence, it
incorporates the consistency of salaries across job positions, to make sure that the increase
earned in OpCo is sustainable. In addition, they divide this salary by the number of days of
employment, to get a daily average wage. It enables to avoid factoring in the unemployment
twice: first in the unemployment risk, and again in the remuneration. This approach introduces
a new point of view, since it assesses the remuneration from the point of view of the employee,
rather than at the company.
Our recommendation is to proceed the same way as in the previous part, by following
employees on a medium-length horizon, and by building a control group of regular companies
in the industry. This measure enables to capture the likelihood that employees keep the same
level of remuneration after the exit. As for the unemployment risk, this approach requires to
have access to databases reporting wages of employees and the type of their employer. Should
such access not be granted, our recommendation is to use the average salary in the target
company. We collect the costs allocated to workforce and divide them by the number of
employees. Of course, this approach is less relevant and several biases are embedded within it,
as we present them in Section I.
We note that both the recommended measure and the proxy only consider wages, as do
most of the measures reviewed in the academic literature. To be exhaustive, we can collect data
on incentive plans, under the form of stock-options, shares or perks. The rationale is that LBOs
may be likely to freeze salaries and to boost incentive programmes in order to motivate
employees to perform. In such cases, the level of wages is not relevant anymore. We should
then add the salary and the value of the incentive plan to get the real income of employees. The
major difficulty with this approach consists in collecting the required data, as they are often not
communicated for private companies.
60
Working conditions
We briefly mention in Section I the academic literature studying the impact of LBOs on
working conditions of employees. We find that there is very little research regarding this topic,
even regarding working conditions in a regular company outside the LBO context. Working
conditions are part of the international norms for the sustainable development. As such, we can
turn to measures computed at the target company level, such as ratios and indicators reported
in CSR documentation. They establish valuation tools in order to compare improvements from
one year to another. They are more common by regular companies than surveys. The United
Nations Conference on Trade and Development (2008) draws list of CSR indicators for various
uses. Among those related to employees and working conditions, we find the percentage of
employees covered by collective agreements or the number of work days lost due to
occupational accidents, injuries or illness. We present the exhaustive list in the appendixes. In
particular, our recommendation regarding the accident indicator is to go even further and weight
the number of accidents by the number of days of absence related to the accident. This way, we
are able to better capture the full consequences of the accident. The main problem with these
indicators is that they take place at the firm level rather than at the employee level. In that sense,
there are less relevant. They represent however good proxies for measuring the evolution of
working conditions.
In the field of marketing, the common practice is to use surveys to assess clients’
satisfaction. We can proceed likewise and conduct surveys by employees asking a number of
specific questions regarding their work environment and the way they perceive it. We note that
we approach therefore the working conditions by measuring their effect on employees, rather
than assessing their drivers, such as the level of pressure imposed on employees, the level of
capital expenditures allocated to everyday supply, etc. Both methodologies are compatible with
our framework. This approach enables to capture the direct perception of employees, but
requires that the survey be conducted prior the LBO, which is not always common practice, in
order to compare both at exit and entry and isolate the impact of the LBO. Hence, in case the
survey has not been conducted before the LBO, the use of this measure becomes irrelevant.
There is no exploitable base at entry to compare the results at exit against. This issue is present
in almost all the measures capturing direct perception at the employee level, as it is unusual to
conduct such surveys in regular companies. We mention above the REPONSE survey (Boucly
Q., Sraer D. and Thesmar D., 2009) conducted by the French authorities. It collects data on
several French companies regarding the satisfaction of employees at work. It is renewed every
six years.
In our research of relevant measures at the employee level, we now turn to occupational
medicine, which uses several and various surveys. This field is specialized in the health and
working conditions of employees. Occupational doctors report testimonies from employees,
material conditions, hierarchical issues, etc. They assess the working environment in the
company regarding the level of pressure put on employees, the professional relationships and
61
practices, as well as the quality of furniture. In that sense occupational medicine reports
represent a very dense and rich source of information related to working conditions. They
contain a lot of material to process on the direct perception of employees over their working
environment. On top of it, these reports are written by experts in their fields, and thus avoid the
employee bias, whereby satisfied employees understate their perception while dissatisfied
employees overstate it. We note that some of the measures mentioned previously like the
number of accidents are reported in it. The main issue with this approach is the confidentiality
issue. As they lie within the medical sector, they are bound to remain private. However,
occupational doctors resort to statistical analysis based on surveys, in parallel of their
confidential reports.
In France, as well as in other various countries, the Ministry of Labour orders
investigations led by different public organizations. The INRS (Institut National de Recherche
et de Sécurité), a public body dedicated to health issue at work, the DARES (Direction de
l’Animation de la Recherche, des Etudes et des Statistiques) and the DREES (Direction de la
Recherche, des Etudes, de l’Evaluation et des Statistiques), specialized in statistics, undertake
studies aiming at providing companies with tools to assess their own working conditions.
Though the academic financial literature is scarce on this topic, it is not the case for the
specialized literature of occupational medicine. In the Rapport Gollac (2009), various indicators
are provided, axed around six poles: the work expectations from the employer, the emotional
expectations, the level of autonomy, the relationships among co-workers, the conflicts of values
and the job uncertainty. These indicators capture the direct perception of employees over these
six topics. We note two remarks at this stage. First, the last axe is already factored in the
unemployment risk and needs to be left aside. Second, the axes do not clearly refer to material
conditions, such as everyday supply. We assume however that it indirectly affects employees’
satisfaction and that it is therefore embedded with the perception over the six axes. All the thirty
indicators reported take the form of questions in the surveys, asked to the employees and
assessing their perception. Along with the Rapport Gollac, we find among the key references
the Karasek and Siegrist methodologies, which also use the principle of questions. All the
investigations conducted in the frame of the French Ministry’s request (Sumer, CT, SIP, etc.)
use similar indicators. There are two main families of indicators: that related to the functioning
of the company, and that referring to the employees’ safety and health. The specialized literature
introduces many different lists of questions and ways to process them. The usual methodology
is to allocate points to each question and to add them to get a score.
Our recommendation is to conduct similar surveys, and to choose the most relevant
indicators depending on cases. The survey approach is the most relevant in our view, as it
enables to capture the direct perception of employees, and hence to really measure what is
valuable to their eyes. However, as we explain it above, it requires that a comparable survey
has already been conducted prior the LBO to compare levels of indicators and isolate the impact
of the LBO. If it is not the case, our recommendation is to compare the results computed at exit
against those of a control group constituted of regular companies in the market.
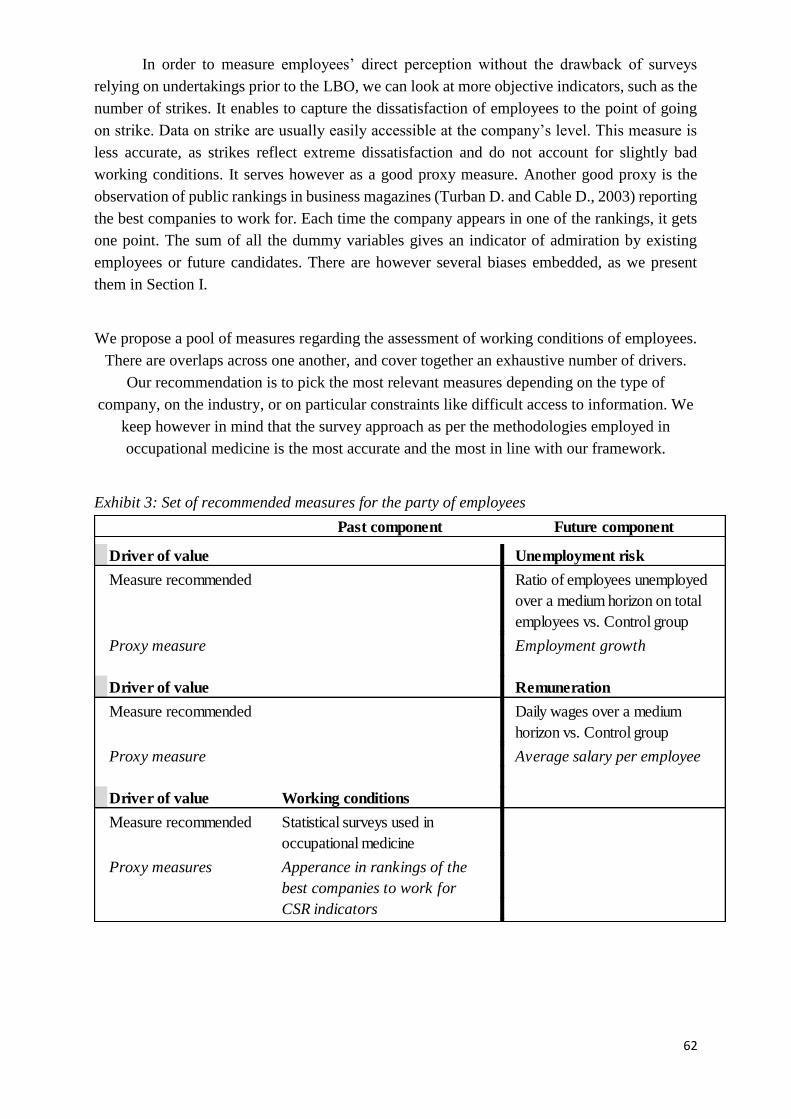
62
In order to measure employees’ direct perception without the drawback of surveys
relying on undertakings prior to the LBO, we can look at more objective indicators, such as the
number of strikes. It enables to capture the dissatisfaction of employees to the point of going
on strike. Data on strike are usually easily accessible at the company’s level. This measure is
less accurate, as strikes reflect extreme dissatisfaction and do not account for slightly bad
working conditions. It serves however as a good proxy measure. Another good proxy is the
observation of public rankings in business magazines (Turban D. and Cable D., 2003) reporting
the best companies to work for. Each time the company appears in one of the rankings, it gets
one point. The sum of all the dummy variables gives an indicator of admiration by existing
employees or future candidates. There are however several biases embedded, as we present
them in Section I.
We propose a pool of measures regarding the assessment of working conditions of employees.
There are overlaps across one another, and cover together an exhaustive number of drivers.
Our recommendation is to pick the most relevant measures depending on the type of
company, on the industry, or on particular constraints like difficult access to information. We
keep however in mind that the survey approach as per the methodologies employed in
occupational medicine is the most accurate and the most in line with our framework.
Exhibit 3: Set of recommended measures for the party of employees
Past component Future component
Driver of value Unemployment risk
Measure recommended Ratio of employees unemployed
over a medium horizon on total
employees vs. Control group
Proxy measure Employment growth
Driver of value Remuneration
Measure recommended Daily wages over a medium
horizon vs. Control group
Proxy measure Average salary per employee
Driver of value Working conditions
Measure recommended Statistical surveys used in
occupational medicine
Proxy measures Apperance in rankings of the
best companies to work for
CSR indicators
63
3) Competitors
We identify in this part the different ways in which an LBO can impact the competitive
environment of the target company, and determine how to measure them. Our framework
consists in assessing the mechanical consequences of the LBO on competitors, without taking
into account indirect effects produced by the competitors themselves. We leave aside all the
secondary impacts originated by the competitors in reaction or in anticipation of the LBO.
Indeed, we aim at measuring value creation for the competitive environment passively suffering
the LBO, without distinction of behaviours within. There is very little coverage on this topic by
the academic literature, especially regarding primary effects, i.e. mechanical effects. Hence, our
recommendations for the party of the competitors is mainly composed of concepts and measures
that we introduce.
The first step in our reasoning is to determine the scope of the party of competitors.
Competitors are here considered as an independent entity, with no distinction within. We only
consider existing competitors at entry; new entrants in the market during the life of the LBO
represent therefore a threat to the party. We see above our recommendations regarding the
measure of value creation for OpCo. Since each competitor is a company similar to OpCo, why
not use the same set of measures for each of them, and assess the sum as the value creation for
the whole competitive landscape? Though both parties seem similar, this approach does not fit
our framework. Indeed, the LBO is actively experienced by OpCo, while it is passively suffered
by the competitors. The target company undertakes several actions regarding investment policy,
employment strategy, etc., which are part of the LBO operation. Conversely, such actions
undertaken by the competitors are not part of the LBO itself; they reflect the reaction of the
competitors, and not the mechanical consequences. Hence, we need to use measures that assess
the passive impact originated by the LBO on the competitors.
To that end, we identify three drivers of this impact. As for the other parties, these
drivers consist in a past component, which is quantitative, and a future component, more
qualitative. This last component is rather abstract, since it is not translated into performance
yet. LBOs can impact competitors mechanically in three ways: through the market share,
through the publicity offered to the industry, and by giving tools to competitors to react and
better perform.
Market share
We report in Section I the papers studying the impact of LBOs on competitors’ market
shares. This element is almost the only one covered by the academic literature regarding the
competitive environment of the target company. The measure which is proposed is the
64
comparison of revenues growth of competitors at exit and at entry. As we mention above, the
major issue with this measure is the fact that it does not isolate the passive impact of the LBO
from the reaction of competitors during the life of the LBO. Indeed, the market share at exit is
driven by the LBO and by strategies implemented by competitors. To improve this approach,
we propose to compare the growth of revenues of competitors against the latest Business Plans
and forecasts available before the LBO announcement, as we proceed for measuring the
operating performance of OpCo. This methodology enables to take the point of view of the
competitors themselves, and to get the total market share of competitors by adding up the
different market shares. Again, it incorporates two main biases. First, to gather the whole
competitive landscape, it requires access to forecasts of all the competitors. It can be difficult
to collect these data for the identified competitors, and even to identify all of them. Second,
when comparing the realized growth with the forecasted one, it does not isolate the mechanical
impact of the LBO. Indeed, it does not distinguish the passive impact from the active reaction
of competitors. To be consistent, it requires to compare growth rates up until the reaction date,
i.e. up until the date at which the competitor undertakes the first reaction strategies. Again, it is
difficult to determine the reaction date, as most of the strategies are planned internally.
Our recommendation is rather to proceed in the opposite way. Instead of measuring the
market share of the competitors, we observe the evolution of the market share of the target
company. Subtracted from the whole market, it gives us the market share of all the competitors
remaining in the market outside OpCo. Hence, we observe a decrease in the market share of
competitors when the LBO enables the target company to increase its own. We note that, as
competitors are considered as a whole, the liquidation of one of them in favour of another one
is not accounted for. This approach does not require to isolate the date of reaction of the other
competitors. Because market share is measured through revenues, i.e. prices multiplied by
volumes, it takes into account repositioning strategies of the target company, whereby prices
can be raised at the expense of volumes. We need to make some additional adjustments to
OpCo’s market share, in order to account for growth factors unrelated to the LBO. We adjust
the market share of the target company from its own forecasts, available before the LBO. Hence,
we only transfer to the competitors the consequences of the LBO on OpCo, and not of some
strategies that would have been implemented without the LBO.
At this stage, we are still left with several drawbacks regarding this approach, some of
which can be remedied. First, this measure does not factor in the case when the target company
owes its growth to entry into new markets. OpCo’s market share is then captured from the
competitors on this new market, and leaves room for the existing competitors. Second, it implies
a non-elasticity of the market, whereby the target company can only grow at the expense of its
competitors. Finally, this approach does not take into account new entrants. These players also
capture some market share from existing competitors, which represent a loss in market share
for the party of competitors. To remedy to this last point, we introduce a ratio of density for the
market, to show the level of intensity of the competition and meant to be coupled with the
previous market share measure. To determine this ratio, we go over the common practices of
marketing research. The main ratio is the concentration ratio, which measures the percentage
65
of market share held by the largest firms in the industry. This approach enables to control the
evolution of the competitive base, so as to better define the scope of the market in matter. If the
ratio is under or above a certain threshold, depending on the industry type, there is a higher or
lower probability of new entrants to come into the market. In order to adapt it to our framework,
our recommendation is compute the ratio of the existing competitors at entry, in addition of
OpCo, over the total players in the market. Hence, at entry, the ratio equals one, and at exit, if
it is lower than one, we assume that new players have entered the market.
In addition to these two measures, the subtraction of OpCo’s adjusted market share from
the market and the concentration ratio, our recommendation is to introduce a third driver of
market share: the potential benefit stemming from the possible liquidation of the target
company. Indeed, if the target company, under the pressure of the financial leverage, goes
under, it leaves room to existing competitors. On top of it, they may even capture some of the
revenues of the target company by purchasing some assets, hiring managers, etc. Therefore, at
exit, we need to consider the probability of default for the target company, as well as the
associated benefits for competitors. The probability of default takes into account the risk that
the target company goes under. Since it is not the risk of the party of the competitors itself, it is
considered a risk “suffered” by competitors, and can be accounted for. We may wonder whether
there is an overlap between this probability of default and the concentration ratio, as the latter
refer to competitive intensity in the market. The difference consists in the temporality, which
avoids correlation between the two: the ratio considers the competitive landscape at one point
in time, for example at exit, while the probability at this point accounts for the future possibility
of structural changes. Our recommendation is thus to multiply OpCo’s probability of default by
the revenues of OpCo at this point, and by the recovery rate that indicates what portion of OpCo
can be captured by competitors through the liquidation process. The recovery rate is to be
defined case by case, according to the industry type and the specificities of the case study. Our
approach still contains some correlation between the target company’s market share and its
probability of default, as both are derived from the past financials of the company. However, it
is negligible, since the market share relies on revenues, while the default likelihood mostly
depends on the financial leverage.
There are several ways to compute the probability of default, as proposed by the
academic literature. Papers studying such probabilities usually do not refer to LBOs; they assess
the effect of leverage on the company. Perhaps the most common methodology consists in
computing the historical probability of default, based on the default of similar rated companies
(Molina C., 2005). The calculation incorporates data on bonds issued by peers and is thus
directed at the past. When comparing this probability after and before the LBO, it also
incorporates the event occurred over the life of the LBO on a macroeconomic level. There is a
bias of structural changes in the market, which prevents the probability from isolating the
impact of the LBO only. Similarly, the ex-ante probability of default (Graham J., 2000) is based
on empirical observations. It is built on Altman E.I.’s Z-score, adapted by Mackie-Mason J.K.
(1989), and consists in combining various operating indicators weighted by coefficients. In that
sense, this approach is subject to a historical bias, whereby structural changes in the industry
66
may make the empirical model irrelevant. It is however a good proxy for the default probability,
and our recommendation is to use it to replace a more time-consuming, yet more accurate,
computation. In their paper, Pederzoli C., Thoma G. and Torricelli C. (2011) model the credit
risk of innovative companies, by using patents to predict the probability of default. Their
approach is mostly relevant for innovative SMEs and is rather complex. In addition, they use
regression variables such as the number of patents or the number of citations, which are
debatable, since they suffer from the same biases that we present in Section I.
As pointed out by Almeida H. and Philippon T. (2007), both the historical and ex-ante
default probabilities include a major drawback. They do not take into account the fact that
distress is more likely to happen in bad times. They introduce in their paper a risk-adjusted
default probability between two given dates, which aims at enhancing the default likelihood in
bad times. Thanks to a complex reverse equation, they derive the probability from the default
risk within the spread, from the recovery rate and from long-term interest rates. This approach
is useful in the sense that, by fixing the two dates within which the probability is measured, it
enables to yield a credible time lap to assess the impact of the LBO. Beyond these dates, we
assume that the default likelihood is no longer related to the LBO. In our view, this calculation
is the most relevant to our framework, though it incorporates some biases, like the constant
recovery rate. Our recommendation is therefore to proceed with this computation, and to use
the ex-ante probability as a less time-consuming proxy.
Spotlight on industry
On top of the impact on the market share, we identify a second effect on competitors
originated by the LBO on OpCo. We call it the spotlight on OpCo’s industry. The rationale is
that, upon the LBO announcement on the target company, potential other PE Funds may show
interest in the industry. If a PE Fund deems a company in this industry a good target for an
LBO, it may be that this industry is profitable and may contain good investment opportunities.
With such reasoning in mind, investors may look further into OpCo’s market, and find
satisfying potential targets. Competitors then benefit from some visibility brought by the LBO.
Should the LBO on OpCo not have happened, they may have been neglected by investors. Since
the LBO brings them publicity, it is a positive impact that may translate into high purchase
offers followed by better performance. Hence, there is value creation for the party of
competitors.
To assess this value creation, we introduce four measures. They are indicators of
whether a market attracts interests from investors. In the frame of a case study, these measures
can be applied at several point in times during the life of the LBO. At announcement of the
LBO, the market may show signs of interest from investors hearing about the PE Fund’s
67
purchase. Up until exit and even some time after exit, investors may be enthusiast on the market
upon learning good performance results of the target company. Still, it is difficult to assess the
reaction of investors on competitors upon learning OpCo’s performance results, compared to
what their behaviour would have been without the LBO on OpCo. The target company may
have good results anyway without the LBO, and the reaction of investors regarding these results
may have been the same. Hence, our recommendation is to focus on visibility brought by the
target company on the industry, which is measured at announcement of LBO. Afterwards,
visibility already exists and further reaction refers to more subjective items.
We determine four indicators of market interest around the announcement date. First,
we observe the changes in share prices or multiples right after the announcement date. In order
to isolate the effect of the LBO, the increase or decrease needs to be quite sudden and close to
the announcement date. As the reflection of market value, share prices and multiples give an
accurate idea of investors’ interests. This approach enables to capture sudden interests due to
visibility. It contains the obvious bias of concerning listed competitors only. In case where many
competitors are public, we may choose to focus on similar competitors, in terms of size and
business, in order to avoid taking into account movements in the market unrelated to the target
company.
Second, we measure the number of takeover bids offered to competitors after the
announcement. We compare this number to a recent average of bids in the industry. We need
to determine a medium-length time horizon after the announcement to account for the M&A
processes. Again, we may choose to focus on similar competitors to avoid unrelated offers. This
approach captures interests of investors credible enough to commit to an offer. It goes one step
further than the share prices, as the interests are realized. However, this approach suffers from
endogeneity. It is difficult to tell whether investors are attracted by the market because the target
company has been approached by a PE Fund, or whether the PE Fund has approached the target
company because the market was already attractive. This measure remains an indicator
applicable to both listed and private competitors.
Third, we measure the premiums offered to competitors in takeover bids. It is related
with the previous measure. In that sense, it also requires to establish a medium-length time
frame to collect data and may require to focus on similar competitors. The main issue with this
approach is to distinguish the effect from the LBO announcement from market trends. Since
the data are reported over a medium frame, it may incorporate changes in the market on a
macroeconomic or industry level unrelated to the LBO.
Finally, we collect data on articles published on the target company’s industry. We
compare the ratio of negative articles against positive articles after the announcement against
that before the announcement. The articles need to be collected shortly after the announcement
in order to avoid incorporating ulterior effects of the LBO and to focus on the visibility brought
to the sector by the announcement.
68
These four indicators enable to assess the light shed by the LBO announcement on the
industry, which may be beneficial or detrimental to competitors. The combination of the four
includes however correlations. For example, a high number of takeover bids leads to higher
premiums offered. Similarly, an increase in share prices mechanically increases the level of
satisfying premiums. In parallel, all these events give matter for the press to write about. Hence,
our recommendation is to choose the best indicators depending on the case study, for example
depending on whether competitors are mostly listed or private. We note however that the
measure of share prices and the combination of articles are the two measures which incorporate
the least biases due to the time frame.
Threat awareness
The last driver of value initiated by the LBO on competitors that we identify is the
motivation of competitors to react against the LBO. By that we mean that, faced with the LBO
announcement, competitors can either react and anticipate, or passively suffer the whole LBO
on the target company. Neither strategy is always the right one, and it depends on cases.
However, we assume that the decision to adopt one or the other strategy is actively taken. For
example, a competitor choosing to remain still and not to change its behaviour does so following
a deep thinking process. Hence, at some point after the announcement, once the competitor
better grasps the situation, it eventually takes a decision. In that sense, we establish that the
LBO provides competitors with the urge to take a decision in order to improve or maintain their
situation. We consider this awareness a source of value for the competitors, as it is bound to
translate into future performance.
To measure this awareness, we need to distinguish the primary effects from the
secondary effects of the LBO. For example, observing elements of a change in behaviours
consists in secondary effects. Among common indicators, we find the change in management
teams, or the increase in percentage of capital owned by employees and managers. These events
occur once the reaction decision is undertaken, and therefore lie in the secondary category.
Hence, we introduce the notion of speed. The rationale is that the faster the reaction decision is
undertaken, the more intense is the motivation to survive against the LBO. We can measure the
time lap between the LBO announcement and the reaction decision of the competitor, and infer
its motivation from it. This approach requires thus to identify the decision date. It is obviously
easier to isolate it if the result of this decision is to react and change behaviours. Otherwise, the
decision date to keep the same behaviour is blurry.
So as to identify the decision date, there are several tools at hand, which are secondary
effects. We can collect data on public information issued by the competitors, like press releases
or investor presentations stating a new strategy. Such information is self-reported, and gives
69
rise to some biases. On top of it, the issue is that for smaller companies, the practice of releasing
information to investors is not common, and some strategies are kept internal. In case there is
a lack of information, we can directly observe the components of the new strategy and the date
at which they are implemented. For example, as we mention above, we report change in
management teams or increases in share ownership from employees and managers. We can also
infer the decision date by analysing the competitors’ financials and compare them with the latest
forecasts available before the announcement. Should the difference in performance be
significant and not be explained by obvious events, we assume it is related to a change in
behaviours due to the potential threat of a stronger target company. On a subtler level, we
measure the working conditions of employees as per the methodology presented in the previous
subpart, and compare perceptions from the date of the announcement up until they significantly
change. The rationale is that, upon the implementation of the new strategy, employees may
undergo more pressure from the management and see their working conditions deteriorated.
Conversely, they can benefit from a rise of productive motivation and from nicer working
conditions. This approach enables to capture as well the decision date in case the decision
results in the will to keep the same behaviour. Indeed, even if the competitor decides to stay
still, employees may perceive the additional stress originated by the threat of the LBO. It is
however difficult to collect data on employees’ working conditions on such a short time lap.
Thanks to these various indicators, we are able to identify the decision date. In our view,
the speed at which this decision is implemented shows the intensity of the awareness underwent
by the competitor. If the decision is taken quickly and in the right timing, the competitor is more
likely to adapt well to the LBO on its competitor. However, we need to consider as well the
cases when the decision is taken to quickly, thus rushing the thinking process and resulting in
a poor strategy. Conversely, if the competitor is too slow to adapt, the outcome of the decision
process may be useless, as the deterioration of its situation is far consumed. How can we
determine whether the decision is taken too soon or too late? There is no scale against which
we can assess the benefits of the speed of the process. Therefore, our recommendation is to look
at several performance indicators after the decision date, in order to tell whether the decision is
productive or not. The afterward performance enables to show the usefulness of the decision
process, in order to tell whether the decision was taken at the right time. Either too late or too
soon, we assume that the wrong timing is due to the fear of the LBO, and therefore that the
poorer resulting performance is a direct impact of the LBO.
Once we know whether the speed translates into a loss or a gain in value for the
competitor, we can process it in the way we communicate the measure. If we wish the measure
to yield a number, we can consider the number of days or the number of months. In case we
wish to get a percentage out of the measure, we can divide the number of days or months by
the life of the LBO, or even by one hundred. We explain in the next part how to smooth this
problem. We have now a relevant measure of speed for a particular competitor. In order to
obtain a measure for the whole party of competitors, our recommendation is to weight speeds
according to the degree of similarity between the competitor and the target company. This
approach enables to only account for decisions taken with the aim of facing the LBO. If the
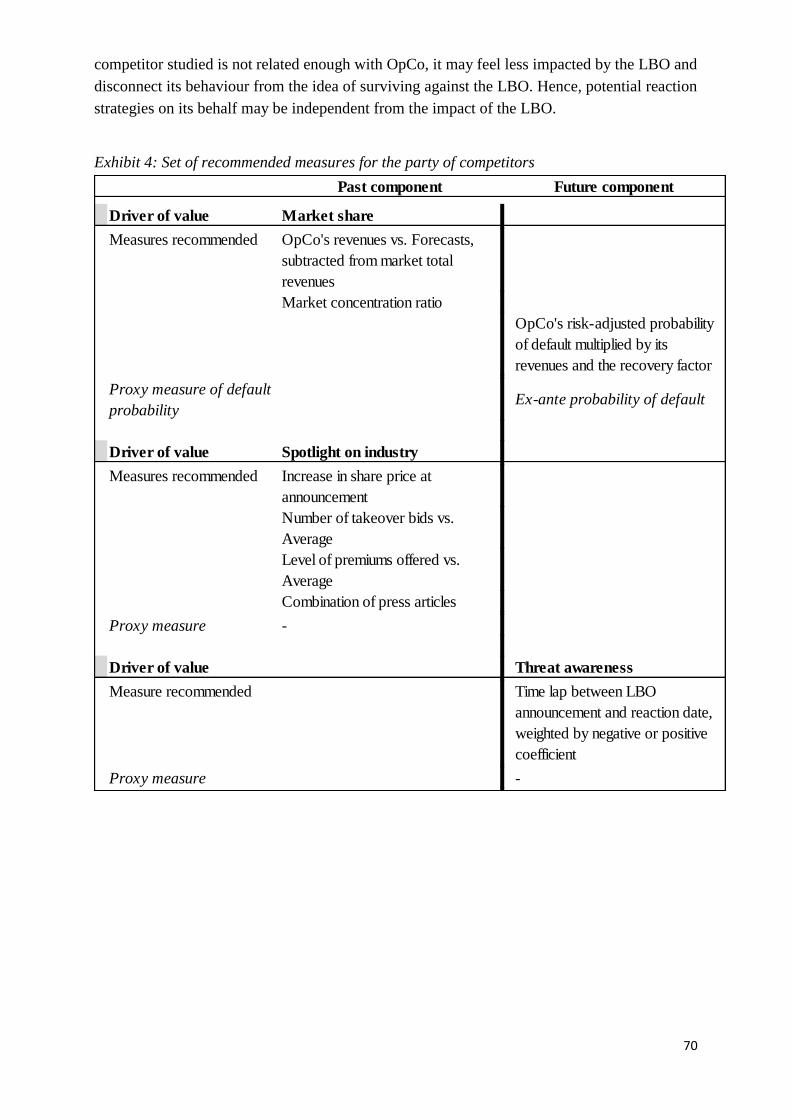
70
competitor studied is not related enough with OpCo, it may feel less impacted by the LBO and
disconnect its behaviour from the idea of surviving against the LBO. Hence, potential reaction
strategies on its behalf may be independent from the impact of the LBO.
Exhibit 4: Set of recommended measures for the party of competitors
Past component Future component
Driver of value Market share
Measures recommended OpCo's revenues vs. Forecasts,
subtracted from market total
revenues
Market concentration ratio
OpCo's risk-adjusted probability
of default multiplied by its
revenues and the recovery factor
Proxy measure of default
probabilityEx-ante probability of default
Driver of value Spotlight on industry
Measures recommended Increase in share price at
announcement
Number of takeover bids vs.
Average
Level of premiums offered vs.
Average
Combination of press articles
Proxy measure -
Driver of value Threat awareness
Measure recommended Time lap between LBO
announcement and reaction date,
weighted by negative or positive
coefficient
Proxy measure -
71
4) PE Fund
As for the three previous parties, we establish in this part the drivers of value for the
party of the PE Fund. In order to identify these drivers, we first determine the goal of the PE
Fund. As an independent and moral entity, the PE Fund’s life goal is to survive the longest
possible. The way to survive for it is to be able to raise funds. Indeed, as an intermediary vehicle
between the target company and investors, its mission is to collect the funds and invest them in
the holding company. As such, the PE Fund only exists if it is able to raise funds and to find
the right opportunities to invest in. We note that the party of the PE Fund includes both the legal
shell of the Fund, as well as the several entities within created to collect a wave of funds. The
PE Fund as defined in this paper generates revenues and costs, like staff costs.
Therefore, an element is value creative for the PE Fund if it improves its ability to raise
funds and to select good investment opportunities. This approach is rather different from the
classical view of value creation. In the financial and academic literature, the LBO is said to
create value for the PE Fund if it enables it to achieve a good financial return. In this paper, as
for the other parties, we go beyond this definition and identify additional drivers directed at
future value. The financial return consists in the quantitative past component value; since it
plays a large role in further fundraising, it is the main source of value. We determine on top of
it two other drivers of future value, increasing the ability to raise funds as well, but directed at
the future: the reputation of the Fund and its power of attraction towards skilled employees.
These three drivers are in our view the pillars of the Fund’s ability to raise funds and to select
the right investment opportunities. There are various overlaps across these three items; to match
our framework, we decompose them when required and establish complementary measures.
Financial return
The financial return of the Fund is the most common indicator of value creation covered
by the academic literature. We present in the previous section the various measures proposed,
and discuss their specificities. In our view, the IRR is the most relevant measure for the financial
return of the PE Fund, especially as it is often used in the Private Equity industry. As we
mention it above, the life goal of the PE Fund is to be able to raise funds by investors and place
them. Since the financial return is the main item driving this ability, i.e. the main source of
value, its measure needs to be the closest possible to the originators of that value, which are
here investors. It is therefore relevant to use the IRR, the most common measure by the Private
Equity industry, to assess the financial return.
72
Our recommendation is thus to compute the IRR of the LBO investment, and to use it
as such for measuring the financial return. Along with it, we identify two additional drivers of
value for the PE Fund.
Reputation
The second impact of the LBO on the PE Fund that we identify is on the Fund’s
reputation. In Section I, we report the studies relating the various measures of reputation, either
in the context of LBOs or not. The main issue with academic measures is that, for most of them,
they do not discriminate across the different LBO operations. The impact on reputation
measured is due to the whole investment wave, and not to one LBO in particular. Our goal is
to determine measures enabling to isolate the impact of the particular LBO studied. To that end,
we go into detail and introduce new ways to measure the impact of one LBO on the Fund’s
reputation.
There is a difficulty when trying to measure that impact, which consists in
differentiating the reputation from the consequences of the performance. The announcement of
good results may for example attracts interest from investors. We do not consider this interest
a sign of good reputation. We can observe for instance the share price of the PE Fund, provided
that it is listed, and compare it at exit and at entry. An increase would be due to the performance
of the Fund, and does not enable to isolate the influence of one LBO in particular. Another
method is to observe the share price of the Fund upon the announcement by the Fund of a
similar LBO operation than that studied. If the share price increases, it may be assumed that
investors trust the Fund in repeating the initial performance. Again, we report in Section I the
use of the return curve. Investors’ returns are computed over the life of the LBO, and they give
a reference pattern for investors to estimate future similar operations. It gives an idea of the
impact of a particular LBO on investor’s will to commit to the next fundraising. Similarly, we
can collect data on LBO transactions operated by the Fund afterwards, and compare the level
of financial leverage. The rationale is that banks are more willing to lend to the Fund if they are
confident about its ability to reimburse the debt. Such measures present major overlaps with the
IRR, and cannot be used in our framework. Reputation encompasses at the same time the
influence of the financial return and some other items more qualitative, that we need to
decompose to build a complementary set of measures.
We need to determine what contributes to the reputation of the Fund, and who are the
recipients. The first item, as we mention above, is the financial return achieved by the Fund. A
good performance conveys a positive message to investors and to the financial industry, such
that the Fund improves its reputation. Since performance is already taken into account in the
IRR, we do not include it in our measure of reputation. Apart from it, we identify four main
73
recipients of the Fund’s reputation: the investors, or LPs, the potential target companies for
future LBOs, the series of advisors and the Fund’s current and potential employees. For each
of them, the reputation is not perceived in the same way, as they do not look for the same signs.
Hence, we introduce measures of this reputation for each.
LPs are very sensitive to the Fund’s reputation, as they need to decide whether to
commit to fundraising or not. They trust the Fund with their capital and can rely on few
indicators. In case they already have participated in one of the Fund’s fundraising, they can
base their decision of their past experience with it. That is the financial return component of the
ability to raise funds, as we present it at the beginning of this subpart. Otherwise, they need to
refer to the Fund’s reputation. As explained by Mulcahy D., Weeks B. and Bradley H. (2012)
in their paper, LPs are often very loyal to PE Funds. They have not many alternatives of
investment with this level of expected return, and are left with few good Funds to invest in.
Once they have found a Fund with which they are satisfied, they stick to it. Hence, we assume
that a Fund where the investor base is constantly changing has supposedly poor relationships
with its LPs, either because of low financial returns, or because the Fund does not show integrity
towards them. A lack of integrity can be illustrated by a high opacity in the cash distribution,
in the need of additional fees to be paid by investors, etc. The first option, where LPs change
Funds because of poor performance, is already factored in in the IRR; we need hence to assess
the reputational part relating to integrity towards LPs. Our recommendation is to observe the
LPs’ turnover between the next fundraising after the LBO and that before the LBO, and to
compare it with the historical average of the Fund. In case when the Fund does not have
previous waves of investment to form a comparable base, we can use a control group of similar
Funds.
Two biases are embedded with this approach. First, this measure does not strictly study
the impact of a particular LBO, since it takes place at the level of fundraisings, that is to say
batches of investments. We assume that a lack of integrity during one LBO by the Fund is
repeated on all the other LBOs operated by the Fund at the same time. Once a Fund adopts an
incorrect behaviour towards its LPs upon one investment, it is bound to keep it on its whole
portfolio. In this case, a particular LBO, as much as the other, intensifies this behaviour; the
lack of integrity is shared among the current LBOs of the Fund. The second bias consists in the
fact that the LPs turnover is also related to some extent to the performance on the investments.
However, this bias is smoothed by the following reasoning. If a Fund achieves a poor
performance over its investments several times in a row, it stops attracting investors. We do not
observe in this case a rotation in LPs, but rather a decrease of the number of LPs willing to
commit to fundraising, until none is ready to invest and the Fund closes. We assume that, if the
LPs turnover is high, that is to say that LPs do not stick to the Fund after having experienced it,
it is not because of the performance, but rather because of unexpected elements, like a lack of
integrity. Hence, the level of LPs turnover gives an indication of the Fund’s behaviour towards
its investors and contributes either positively or negatively to the Fund’s reputation in the eye
of investors.
74
The second recipient that we identify is the potential target company for future LBOs.
After the LBO studied, the Fund spots some new investment opportunities under the form of
companies and submits an offer to them. Though the price offered by the Fund is the main
driver of the company’s acceptance, the company is also influenced by the past experiences of
the Fund with its target companies. At equal prices, the company is more willing to accept the
Fund’s offer, compared to those of the other Funds in competition, if it has confidence in the
Fund’s behaviour towards them. In order to measure this confidence based on the Fund’s
reputation, our recommendation is to calculate the number of bid processes won in the first and
second rounds by the Fund. If the Fund tends to win its processes earlier on average than it used
to before the LBO, it is partly due to its reputation by target companies. On top of the difficulty
to collect data on processes lost by a PE Fund, this measure incorporates the bias of the price,
which is empirically more influential than reputation on target companies’ acceptance. To
remedy to that effect, we can only consider processes where prices offered by the various Funds
were very similar. As such, the decisive element needs to be unrelated to the amount offered.
Finally, as previously, this measure does not clearly distinguish the impact of particular LBO,
since target companies are affected by past experiences of the Fund with all its historical target
companies. To smooth this bias, we can only consider processes where the company to be
purchased is close to the LBO studied, either in terms of size, business model, industry, etc. or
even in terms of relationships between the company to be purchased and OpCo in our case
study. If they have partnerships or regular interactions, the company to be purchased is more
likely to be influenced by OpCo’s experience with the Fund, which enables us to study the
impact of the particular LBO.
The third recipient that we identify is the series of advisors involved in the Fund’s M&A
processes. Advisors are sensitive to the Fund’s reputation, as they want the process to succeed
in order to get their fees and to improve their own reputations. Especially in buy-side processes,
whereby the Fund bids on a company, the financial advisors mandated take the risk of the
Fund’s offer not being accepted by the future target company. They have at stake an important
part of their remuneration, their own reputation, as well as the amount of work and time they
commit to this deal. Famous advisors, in particular, are willing to take that risk if they believe
the Fund is reliable, if it has a good chance to win the process and if they can get along well.
Otherwise, they do not waste time on this deal. Hence, our recommendation is to observe the
rankings of the Fund’s advisors in its future processes, and to compare it with those of the
process of the LBO studied. We can also take into account recent processes prior the LBO, in
order to avoid unusual advisors on the LBO process. If it is able to attract prestigious advisors,
we can therefore assume that the Fund boasts a good reputation by advisors. If the advisors
have low rankings, the power balance is likely to be inversed, meaning that it is the advisors
which then try to be mandated by the Fund. We note that there is a correlation between this
measure and the previous one assessing the likelihood of the Fund to win its processes. If
needed, we can therefore choose to skip one of these two measures. As for the two previous
measures that we introduce, this one does not distinguish per se the impact of the particular
LBO studied. To smooth this bias, our recommendation is to consider processes on target
companies close to OpCo in our case study.
75
Finally, the fourth recipient that we identify is the employee of the Fund, either current
or potential candidate. Employees are sensitive to the Fund’s reputation in the sense that they
seek job certainty, a good remuneration, a more or less high level of prestige of the Fund and
satisfying working conditions. It is vital for the Fund to attract skilled employees, as they are
responsible for the second component of value for the Fund: the ability to invest properly the
funds raised. However, this power of attraction cannot be solely explained by reputation.
Conveying a good image to potential candidates is the first step, but the Fund also needs to get
them to apply for a job position in the Fund, that is to say to make them want to prefer it over
their current job positions, and to keep its employees once hired. As reputation is a component
of this ability to attract talents, we do not discuss it here, but rather in the subpart below.
In parallel to this set of measures directed at the various recipients, we introduce more
general measures of reputation as a whole. They are rather proxies, less accurate but often easier
to collect and compute. The number of trials and the amount of fines occurred during the life
of the LBO gives an estimate of the harm the Fund may have caused to several stakeholders,
thus hurting its reputation. Similarly, the articles in the press give a large picture of the
reputation of the Fund. It is interesting to compare the ratio of negative articles against positive
articles on the Fund at exit of the LBO against that at entry. This approach is however correlated
with the financial return, as press articles are likely to mention it at the same time. The choice
of measures of reputation is to be adapted according to the case studies.
Attraction of talents
The ability of the Fund to attract skilled employees is one of its main sources of value,
as it improves its ability to select the right target companies and hence fulfils one of its life
goals. As we mention it above, there is an overlap between the reputation of the Fund and its
power of attraction of talents (Turban D. and Cable D., 2003). The first step to candidates being
hired is their interest in the Fund initiated by its reputation. To avoid a too high correlation, we
leave aside this component in the measures of reputation and we consider it included in the
power of attraction. We note that there is a small correlation between the financial return and
the power of attraction. Indeed, as part of the reputation, candidates are also influenced by the
past performance of the Fund.
Can we use the same measure to assess the Fund’s power of attraction over employees
than that used for the LPs? In other words, can we measure the loyalty of the Fund’s employees
the same way that we measure LPs’ loyalty? It is actually trickier to use the turnover of
employees to determine whether the Fund is attractive in their eyes. First, such computation is
difficult to achieve, as data on employees’ job positions are hardly collectable through public
means. It requires that employees use online platforms and regularly update their profiles. In
76
their paper, Acharya V., Gottschlag O., Hahn M. and Kehoe C. (2011) mainly obtained data
through granted access to private information from Funds’ internal databases. Second,
employees’ turnover can be explained by various factors, contrary to LPs. Some Funds
traditionally have a high turnover, while other have a very small one. It also depends on trends
in the market, whereby some subsectors of the financial industry become suddenly more
fashionable and growing than others.
For a Fund, a way to attract candidates is to promise them a high remuneration. As such,
increases in salaries can be a way to assess whether the Fund is able to attract candidates.
However, this indicator accounts for the Fund’s strategy of attraction, and not for the attraction
in itself. The strategic increase in salaries may prove to be inefficient, because candidates are
repelled by other factors. We need to measure the realization of the Fund’s power of attraction,
rather than its intention to attract candidates. Only then are we able to tell whether the Fund
improves its ability to invest properly.
Rather than the background of employees (Acharya V., Gottschlag O., Hahn M. and
Kehoe C., 2011), our recommendation is to observe after the LBO the rankings of employees’
previous employers, and to compare them with those at entry. The rationale is that employees
change Funds if they deem the future one to have a better offer than the current one. If
employees coming from prestigious employers are ready to exit their position to go to the PE
Fund in matter, we assume that it is because it benefits either from a better reputation or from
a better salary offer. In both case, it illustrates the Fund’s power of attraction. Observing the
rankings of previous employers is easier than collecting employees career data for measuring
the turnover. Indeed, in the latter case, we need to know dates at which employees change
positions. In the former case, we only need to know the previous employers, which are often
presented on the Fund’s website, especially if they are prestigious. This approach contains a
bias, whereby changes in positions for employees can be the results of personal obligations or
interests, unrelated to the impact of one LBO in particular.
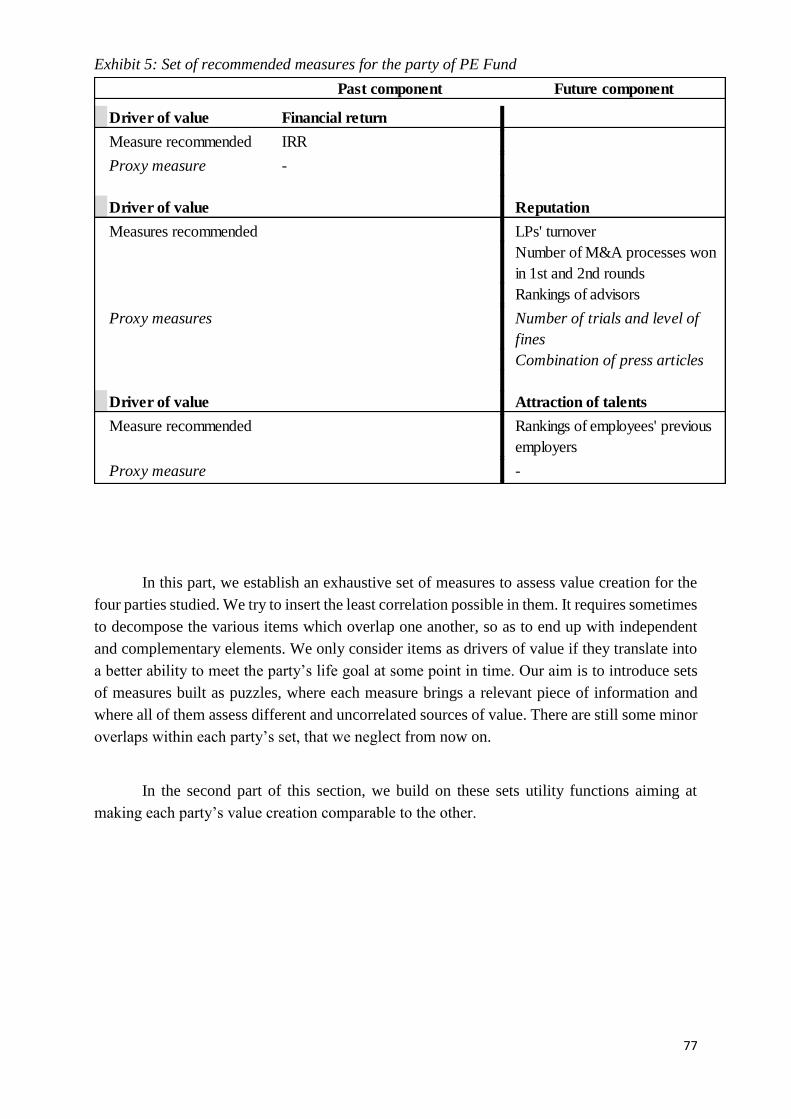
77
Exhibit 5: Set of recommended measures for the party of PE Fund
In this part, we establish an exhaustive set of measures to assess value creation for the
four parties studied. We try to insert the least correlation possible in them. It requires sometimes
to decompose the various items which overlap one another, so as to end up with independent
and complementary elements. We only consider items as drivers of value if they translate into
a better ability to meet the party’s life goal at some point in time. Our aim is to introduce sets
of measures built as puzzles, where each measure brings a relevant piece of information and
where all of them assess different and uncorrelated sources of value. There are still some minor
overlaps within each party’s set, that we neglect from now on.
In the second part of this section, we build on these sets utility functions aiming at
making each party’s value creation comparable to the other.
Past component Future component
Driver of value Financial return
Measure recommended IRR
Proxy measure -
Driver of value Reputation
Measures recommended LPs' turnover
Number of M&A processes won
in 1st and 2nd rounds
Rankings of advisors
Proxy measures Number of trials and level of
fines
Combination of press articles
Driver of value Attraction of talents
Measure recommended Rankings of employees' previous
employers
Proxy measure -
78
B – Determination of utility functions
We establish in the previous subpart sets of measures to assess value creation originated
by the LBO. Each party studied is associated with a set, which is meant to be as exhaustive as
possible. In that sense, all the measures encompassed in one set need to explain the whole value
creation or destruction due to the LBO. In order to build applicable sets, we try to incorporate
the least overlaps possible across measures. We proceed in decomposing drivers of value to get
more accurate entities, down until the various drivers stop overlapping. There is however
sometimes negligible correlation left between two items. Our aim is to end up with a set
designed like a puzzle, where the measures fit like pieces.
The goal of this paper is to eventually provide tools for further studies to investigate the
impact of the LBO. Should a paper wish to assess the impact of a LBO operation on one of the
four parties’ value, the set enables then to measure directly the whole value creation or
destruction. Once the impact is measured, the next step is to compare the value gained or loss
among parties, and determine which parties benefit the most from the LBO. With this idea of
comparison in mind, we design the set so that we end up with only one result for each party.
Instead of associating two or three measures and drivers of value to each party, we wish to
associate only one indicator. In other words, we need to establish one result with the whole set,
rather than analysing the result of each measure within. To that end, we combine the measures
of the set into one indicator; we can then compare parties by looking at the one indicator for
each party.
We review the diverse ways to combine measures. First, we consider a sort of Sharpe
ratio for each party, enabling to compare one another. To do so, the return is divided by the
level of risk taken to achieve it. If, for a same level of risk, the return of one party is higher than
for another, this party gains more value. The issue with this type of indicator is that, by
definition, it incorporates the risk of the party itself. Our framework does not however include
the risk of the party itself. Computing Sharpe ratios for each party could be the subject of further
studies, implying first to determine the level of risk embedded with each party.
Second, we consider the return on investment. It is the numerator of the Sharpe ratio,
and leaves aside the risk component. To compute it, we measure the gain originated by the LBO
and compare it with the initial situation at entry. The various measures that we recommend are
usually built around the comparison of one item at exit against the same item observed at entry.
Based on those, the return on investment requires to disconnect them into the exit component
and the entry component. We then consider the difference between the exit part and the entry
part of all the measures of a party gathered as the gain and the entry part alone as the investment
for each party. By dividing the return by the investment, we get our indicator for each party.
We are then able to compare the return on investment across parties to tell which party has the
highest. We note that, as per our framework, this indicator does not take into account the risk
taken to achieve this return.
79
However, some of the measures that we recommend are not based on the comparison
between the situation at entry and at exit. They are sometimes constituted for example of the
comparison between the situation at exit against a control group of regular companies. In such
cases, we cannot disconnect them as it is required for computing the return on investment.
Hence, the previous approach does not apply for the totality of the sets. Our recommendation
is thus to build utility functions, whereby each measure within a set is associated with a
coefficient. The sum of all the weighted measures yield the utility function of the set. As such,
each party owns its utility function. In order to compare them, we compute the function for each
of them, by computing each measure respectively within the set. Each measure becomes a
variable, weighted by a coefficient. The utility function of the set is hence made of different
variables added to one another. When focusing on a single case study, each variable is realized
in the form of a number, and the utility function yields one result.
Regarding the choice of coefficients, we leave to the user the freedom of determining
the relevant coefficients. They are meant to adapt the function to the industry or business model.
In some industries, the use of patents is for example less common than for others. More
generally, some industries are not dependent of innovation and discoveries. In this case,
measuring the impact of the LBO on the target company’s innovation policy may become
irrelevant. Coefficients enables the utility function of OpCo to account for such specificities.
We apply lower coefficients to less relevant measures.
Coefficients are also a mean to smooth the drawbacks of a measure, and especially the
remaining correlation. In the sets of measures that we recommend, we introduce at several times
a pool of measures for one item, where the group of measures is exhaustive but with some
overlaps. Instead of picking the measures within the pool that fit the most, while leaving some
driver of value uncovered, our recommendation is to insert all the measures of the pool in the
function and to apply lower coefficients where the correlation is the highest. Coefficients enable
thus to reduce overlaps where our decomposition methodology is not sufficient. We note that
coefficients are fixed for one application, but can vary according to case studies. We could
however try to determine universal coefficients, common to all the case studies, in order to have
unique utility functions across industries. We leave this subject to be the focus of further studies.
We compute below the utility functions for each party, where each variable is associated
to a measure. To be consistent across the measures, we express all the variables in percentages,
as most of the measures consist in a comparison of two items. Hence, the variables presented
are in fact changes in situations, already assessing the variation. The resulting utility function
yields therefore a percentage measuring the change in value for the party originated by the LBO.

80
1) Utility Function for the party of OpCo
α ∗ 𝑆𝐴𝐿𝐸𝑆 + β ∗ 𝐸𝐵𝐼𝑇𝐷𝐴 + γ ∗ 𝑊𝐶𝑅 + δ ∗ 𝑃𝐴𝑇𝐸𝑁𝑇𝑆𝐹𝑊 + η ∗FIN.A
FIX.A+ θ ∗
NETFIX.A
GROSSFIX.A +
λ ∗ 𝑆𝑈𝑅𝑉𝐸𝑌𝑆 + μ ∗ 𝑃𝑅𝐸𝑆𝑆 + φ ∗ %𝑀𝐴𝑁𝐴𝐺 + ψ ∗ %𝐸𝑀𝑃𝐿 + ω ∗ 𝑊𝑂𝑅𝐾𝐶𝑂𝑁𝐷,
where SALES = change in revenues between realized revenues at exit and forecasts of revenues
at the same date, as a percentage of the forecasts,
EBITDA = change in EBITDA margins between realized margin at exit and forecast of
EBITDA margin at the same date, as a percentage of the forecasts,
WCR = change in WCR amounts between realized WCR at exit and forecast of WCR at the
same date, as a percentage of the forecasts,
PATENTSFW = change in average number of patents registered in a year weighted by forward
citations between exit and entry, as a percentage of the item at entry,
FIN.A
FIX.A = change in ratios of Financial Assets divided by Fixed Assets between exit and entry, as
a percentage of the item at entry,
NETFIX.A
GROSSFIX.A = change in ratios of Net Fixed Assets divided by Gross Fixed Assets between exit
and entry, as a percentage of the item at entry,
SURVEYS = change in scores obtained from clients’ surveys between exit and entry, as a
percentage of the item at entry,
PRESS = change in ratios of positive articles published against negative articles between exit
and entry, as a percentage of the item at entry,
%MANAG = change in percentages owned by the management in OpCo between exit and
entry, as a percentage of the item at entry,
%EMPL = change in percentages owned by employees of OpCo between exit and entry, as a
percentage of the item at entry,
WORKCOND = change in scores obtained from occupational medicine surveys between exit
and entry, as a percentage of the item at entry,
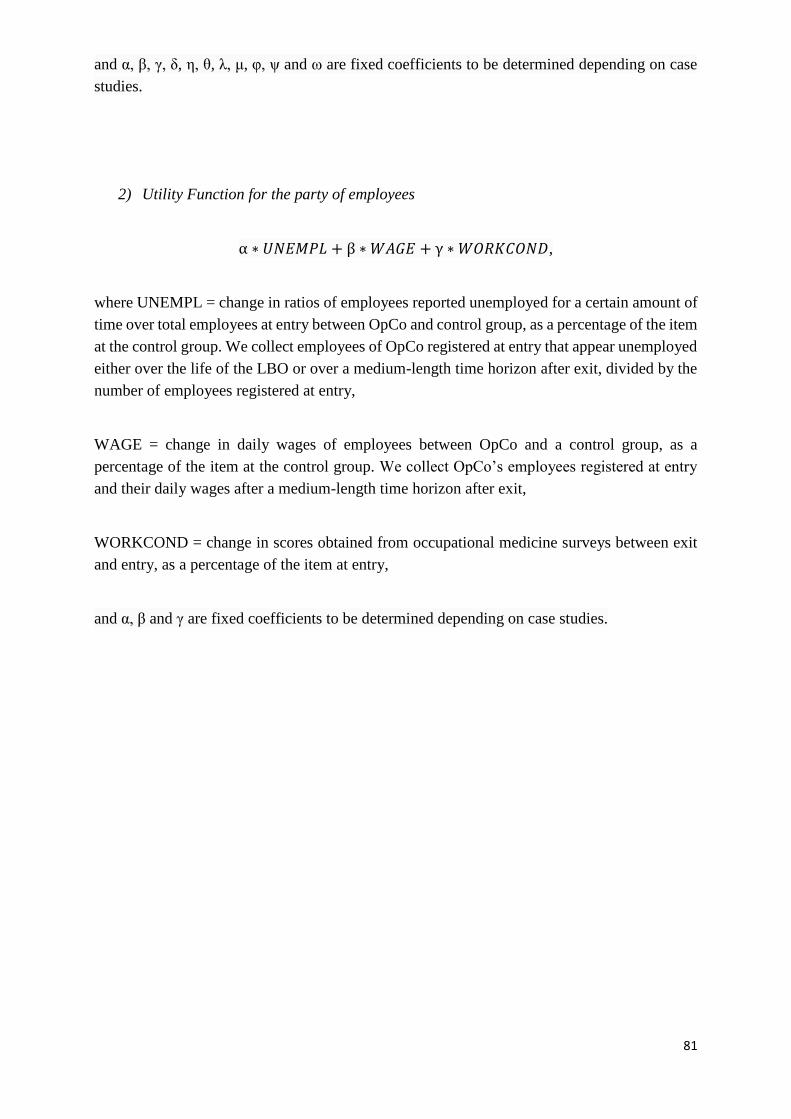
81
and α, β, γ, δ, η, θ, λ, μ, φ, ψ and ω are fixed coefficients to be determined depending on case
studies.
2) Utility Function for the party of employees
α ∗ 𝑈𝑁𝐸𝑀𝑃𝐿 + β ∗ 𝑊𝐴𝐺𝐸 + γ ∗ 𝑊𝑂𝑅𝐾𝐶𝑂𝑁𝐷,
where UNEMPL = change in ratios of employees reported unemployed for a certain amount of
time over total employees at entry between OpCo and control group, as a percentage of the item
at the control group. We collect employees of OpCo registered at entry that appear unemployed
either over the life of the LBO or over a medium-length time horizon after exit, divided by the
number of employees registered at entry,
WAGE = change in daily wages of employees between OpCo and a control group, as a
percentage of the item at the control group. We collect OpCo’s employees registered at entry
and their daily wages after a medium-length time horizon after exit,
WORKCOND = change in scores obtained from occupational medicine surveys between exit
and entry, as a percentage of the item at entry,
and α, β and γ are fixed coefficients to be determined depending on case studies.
82
3) Utility Function for the party of competitors
α ∗ 𝑀𝐴𝑅𝐾𝐸𝑇𝑆𝐻 + α′ ∗ 𝐶𝑂𝑁𝐶𝐸𝑁𝑇𝑅𝐴𝑇𝐼𝑂𝑁 + β ∗ [𝑃𝑅𝑂𝐵𝐷𝐸𝐹 𝑥 𝑆𝐴𝐿𝐸𝑆𝑂𝑃𝐶𝑂] ∗
𝑟𝑒𝑐𝑜𝑣𝑒𝑟𝑦 + γ ∗ 𝑆𝐻𝐴𝑅𝐸𝑃𝑅𝐼𝐶𝐸 + δ ∗ 𝐵𝐼𝐷 + η ∗ 𝑃𝑅𝐸𝑀𝐼𝑈𝑀 + θ ∗ PRESS + λ ∗ 𝑆𝑃𝐸𝐸𝐷 ∗
𝑇𝐼𝑀𝐼𝑁𝐺,
where MARKETSH = change in market shares of competitors between realized market share
at exit and forecasts of market share at the same date, as a percentage of the forecasts. To
compute this change, we take the difference of OpCo’s revenues between realized revenues at
exit and forecasts at the same date. We divide this difference by competitors’ forecasted
revenues at the exit date, which are obtained by subtracting OpCo’s forecasted revenues from
market total revenues forecasted at the exit date,
CONCENTRATION = change in concentration ratios between exit and entry, as a percentage
of the item at entry. The concentration ratio is obtained by dividing existing competitors’
revenues, including the target company, by market total revenues,
PROBDEF x SALESOPCO = change in maximum benefits captured from OpCo’s potential
liquidation between exit and entry, as a percentage of the item at entry. To compute this
combination, we measure the risk-adjusted probability of default of OpCo at exit, derived from
a complex model (Almeida H. and Philippon T., 2007), and we multiply it by OpCo’s realized
revenues at exit,
recovery = rate of recovery, defining the level of revenues that competitors may potentially
capture from OpCo’s liquidation,
SHAREPRICE = change in share prices of competitors around the time of the LBO
announcement, as a percentage of the share price prior the announcement,
BID = change in number of takeover bids in the industry between a medium-length time horizon
after the LBO announcement and the historical average around the announcement, as a
percentage of the average,
PREMIUM = change in premiums offered in the industry between a medium-length time
horizon after the LBO announcement and a recent average, as a percentage of the average,
PRESS = change in ratios of positive articles published against negative articles between a short
period of time after the announcement and entry, as a percentage of the item at entry,
83
SPEED = time lap between the decision date and the LBO announcement, as a percentage of
the life of the LBO,
TIMING = dummy variable taking the value 1 or -1 if the performance after the decision date
has improved or worsened,
and α, β, γ, δ, η, θ and λ are fixed coefficients to be determined depending on case studies. We
note that, λ, the coefficient associated with SPEED, needs to be small in order not to overweight
its importance in the value creation.
4) Utility Function for the party of the PE Fund
α ∗ 𝐼𝑅𝑅 + β ∗ LPTURN + γ ∗ 𝑃𝑅𝑂𝐶𝐸𝑆𝑆1 + δ ∗ 𝑃𝑅𝑂𝐶𝐸𝑆𝑆2 + η ∗ ADVISOR + θ ∗
𝐸𝑀𝑃𝐿𝑂𝑌𝐸𝑅,
where IRR = Internal Rate of Return of the LBO,
LPTURN = change in average LPs turnover between the fundraising following exit and that
preceding entry compared to an historical average, as a percentage of the average. To compute
the turnover, we measure the number of LPs involved in the fundraising prior the LBO that
commit again to the following one. The historical average consists in the same computation
over the previous fundraisings of the Fund. If the Fund’s previous history does not allow to
compute an average, we compare the turnover with a control group of similar Funds,
PROCESS1 = change in numbers of processes won in first rounds between a medium-length
time horizon after exit and average prior entry, as a percentage of average prior entry,
PROCESS2 = change in numbers of processes won in second rounds between a medium-length
time horizon after exit and average prior entry, as a percentage of average prior entry,
ADVISOR = changes in rankings of advisors between a medium-length time horizon after exit
and average prior entry, as a percentage of average prior entry,
EMPLOYER = changes in rankings of the Fund’s employees’ previous employers between a
medium-length time horizon after exit and average prior entry, as a percentage of average prior
entry,
84
and α, β, γ, δ, η and θ are fixed coefficients to be determined depending on case studies.
We note that, for each of the utility function, we can replace the recommended measures
by their proxies if needed.
In this section, we present our recommendations regarding the measure of value creation
for each party. The measures that we come up with are derived from the academic review of
Section I and from various fields unrelated to LBOs, like occupational medicine. We adapt
these measures to our framework, and introduce our own recommendations. Overall, we end
up with four sets of measures, each designed for one of the four parties studied in this paper.
The sets are dedicated to measuring total value creation originated by the LBO. Within the sets,
each measure is meant to assess the impact of LBOs on a particular driver. Our methodology
consists hence in identifying the various drivers of value for each party, and to decompose them
into smaller entities when they overlap with one another. In order to be able to compare value
generated by the LBO on each party, we combine the recommended measures within the set
and build four utility functions. Each function, composed of coefficients and variables, yields
one result for each party.
In section III, we consider the Hilton Hotels case study. We apply our recommended
utility functions to each party and compare the results. To that end, we compute each measure
of the functions independently. This section offers an application of our recommendation to a
famous case study, and introduces a new angle of judgement. Throughout the case, we explain
the difficulties encountered in moving from theory to practice.
85
Section III – The Hilton Hotels Case Study
In this section, we present an application of our framework on the Hilton Hotels case
study. It refers to the purchase of the Hilton Hotels in 2007 by the global PE Fund Blackstone.
This case study is a famous one in the academic literature, and has been studied many times. It
is often dubbed the most successful LBO in history, and accounts for one the biggest profits of
all times realized by a PE Fund. What is striking in this LBO operation is the economic context
that surrounds it, as it was announced short before the break of the 2007 economic crisis, the
hardest since the 1930s. The real estate business was heavily hit during this period, and
Blackstone had to restructure the leveraged debt. Yet, the PE Fund ended up realizing a huge
profit on this deal. How can it be explained, looking at the economic context back then? Did
the Fund succeed at the expense of the target company, or of its employees?
Our aim for this section is to bring a fresh light to a classic case study. By applying our
framework regarding measures of value creation, we introduce a new angle of analysis. We
compare eventually our findings with the consensual view of this LBO transaction, and try to
determine whether the parties that benefit the most from the LBO are in fact counterintuitive.
This case study presents several specificities that make it particularly attractive to our
paper. As a big company, the Hilton Hotels Corporation benefits from an important press
coverage which allows to have access a priori to clear and abundant information. On top of it,
the company was listed prior the acquisition, and exited through an IPO. It implies that many
data of the company are public, both before and after the LBO, as well as analysis and research
on the company. Some of the main competitors are also listed, granting access to public
information about them. Finally, Blackstone is a well-known PE Fund, with a dense background
of investments, and in particular in the lodging business. It represents a useful comparable base
for some measures that rely on the PE Fund’s past wave of investments.
86
A – “The most successful LBO in history”
We begin this case study by giving an overview of the deal. As per our framework in
this paper, we focus on the following four parties: the target company, its employees, its
competitors and the PE Fund. We present each of the party and finally describe the transaction,
its economic context and its outcome.
Throughout the case, we rely significantly on the work of Phalippou L. (2014), who
produces a version of the case study in partnership with the SAID Business School and the
University of Oxford. An important part of the data on the company and the real estate industry
that we use are extracted from it.
1) Overview of the four parties studied
As we explain it in the first section, there are many stakeholders involved in an LBO
operation. The LBO on the Hilton Hotels impacts similarly a series of parties, which are not
restrained to the four considered.
The Hilton Hotels, or the target company
The Hilton Hotels Corporation is, at the beginning of 2007, a successful company in a
booming market. The real estate industry is at its height, especially in the US, with the
transaction volume growing at an average of 32% between 2001 and 2006. The hotel business
alone boasts a growth of 34% on average per year over the same period. It remains that the
company is positioned on a cyclical business, which incorporates a level of risk.
The company is headquartered in the US, and was founded by Conrad Hilton in 1919,
who gradually increased the size of the group. It experienced a very fast growth in the 1990s
and at the beginning of the 2000s. We present below a simplified summary of the company’s
financials. We note that the revenues increase sharply between 2005 and 2006 due to an
acquisition.
At of the end of 2006, the Hilton Hotels Corporation boasts a capacity of more than
500,000 rooms. 2,931 hotels are registered in the group, of which 60 owned and operated by
the group, 203 leased and operated, 53 partially owned and operated, 343 managed with no
ownership and 2,242 franchised. The company is one of those which relies the most on the
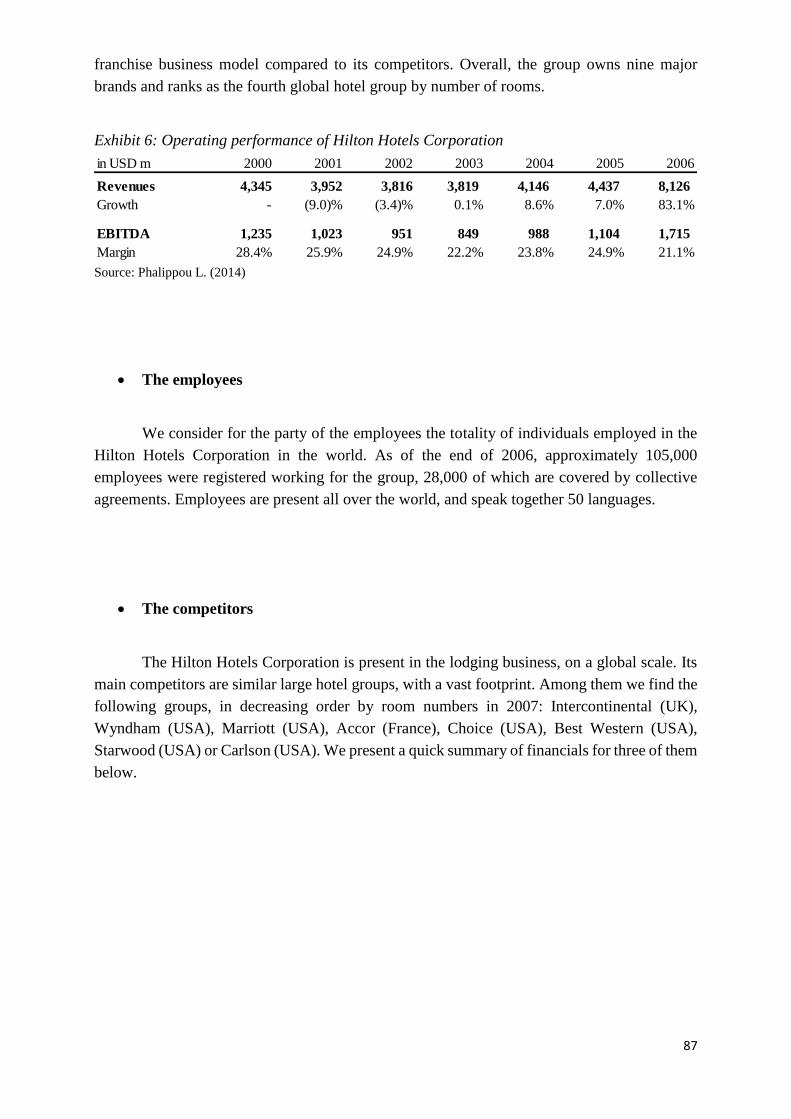
87
franchise business model compared to its competitors. Overall, the group owns nine major
brands and ranks as the fourth global hotel group by number of rooms.
Exhibit 6: Operating performance of Hilton Hotels Corporation
Source: Phalippou L. (2014)
The employees
We consider for the party of the employees the totality of individuals employed in the
Hilton Hotels Corporation in the world. As of the end of 2006, approximately 105,000
employees were registered working for the group, 28,000 of which are covered by collective
agreements. Employees are present all over the world, and speak together 50 languages.
The competitors
The Hilton Hotels Corporation is present in the lodging business, on a global scale. Its
main competitors are similar large hotel groups, with a vast footprint. Among them we find the
following groups, in decreasing order by room numbers in 2007: Intercontinental (UK),
Wyndham (USA), Marriott (USA), Accor (France), Choice (USA), Best Western (USA),
Starwood (USA) or Carlson (USA). We present a quick summary of financials for three of them
below.
in USD m 2000 2001 2002 2003 2004 2005 2006
Revenues 4,345 3,952 3,816 3,819 4,146 4,437 8,126
Growth - (9.0)% (3.4)% 0.1% 8.6% 7.0% 83.1%
EBITDA 1,235 1,023 951 849 988 1,104 1,715
Margin 28.4% 25.9% 24.9% 22.2% 23.8% 24.9% 21.1%
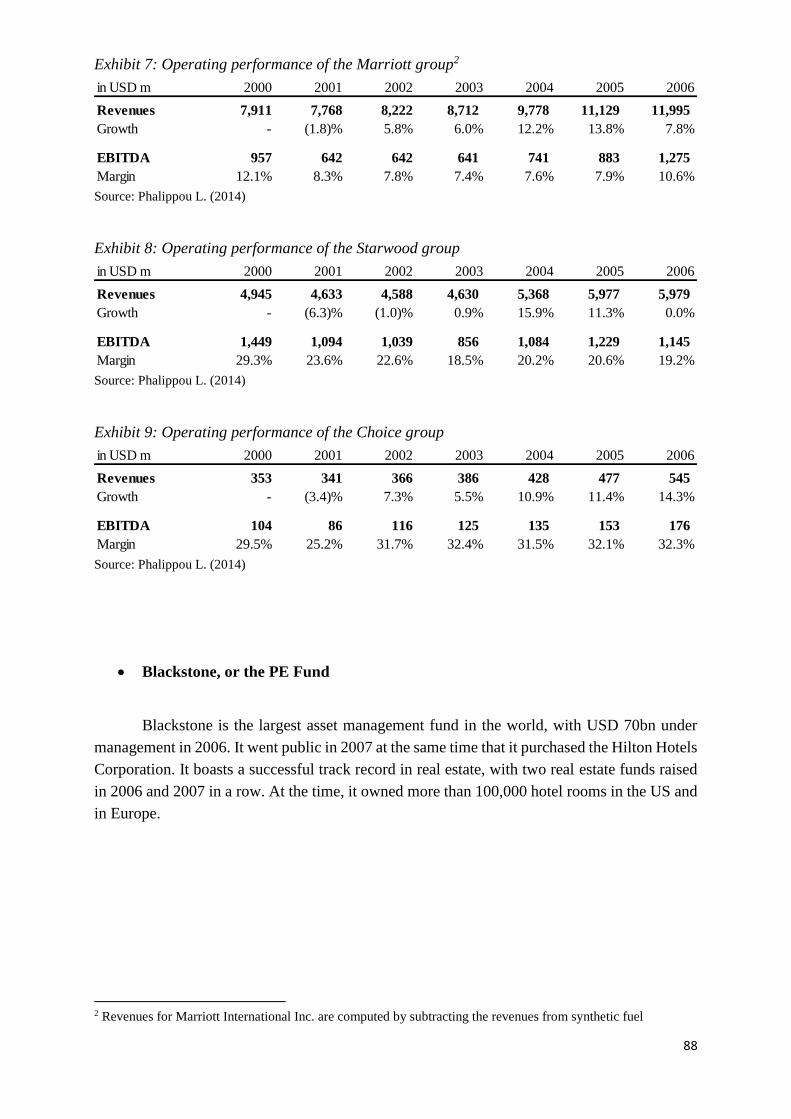
88
Exhibit 7: Operating performance of the Marriott group2
Source: Phalippou L. (2014)
Exhibit 8: Operating performance of the Starwood group
Source: Phalippou L. (2014)
Exhibit 9: Operating performance of the Choice group
Source: Phalippou L. (2014)
Blackstone, or the PE Fund
Blackstone is the largest asset management fund in the world, with USD 70bn under
management in 2006. It went public in 2007 at the same time that it purchased the Hilton Hotels
Corporation. It boasts a successful track record in real estate, with two real estate funds raised
in 2006 and 2007 in a row. At the time, it owned more than 100,000 hotel rooms in the US and
in Europe.
2 Revenues for Marriott International Inc. are computed by subtracting the revenues from synthetic fuel
in USD m 2000 2001 2002 2003 2004 2005 2006
Revenues 7,911 7,768 8,222 8,712 9,778 11,129 11,995
Growth - (1.8)% 5.8% 6.0% 12.2% 13.8% 7.8%
EBITDA 957 642 642 641 741 883 1,275
Margin 12.1% 8.3% 7.8% 7.4% 7.6% 7.9% 10.6%
in USD m 2000 2001 2002 2003 2004 2005 2006
Revenues 4,945 4,633 4,588 4,630 5,368 5,977 5,979
Growth - (6.3)% (1.0)% 0.9% 15.9% 11.3% 0.0%
EBITDA 1,449 1,094 1,039 856 1,084 1,229 1,145
Margin 29.3% 23.6% 22.6% 18.5% 20.2% 20.6% 19.2%
in USD m 2000 2001 2002 2003 2004 2005 2006
Revenues 353 341 366 386 428 477 545
Growth - (3.4)% 7.3% 5.5% 10.9% 11.4% 14.3%
EBITDA 104 86 116 125 135 153 176
Margin 29.5% 25.2% 31.7% 32.4% 31.5% 32.1% 32.3%
89
2) Identity card of the deal
The deal takes place in mid-2007, at the height of both the real estate industry and the
LBO model. Especially in the US, there is a strong privatization trend of the economy. In June
2007, Blackstone offers to purchase the Hilton Hotels Corporation, which is then listed on the
New York Stock Exchange. Blackstone has a strong experience of this type of investment, and
wishes to make of the Hilton group the largest hotel group in the world. The offer stands at
USD 47.50 per share, which represents a premium of 40%, above the average of recent peer
transactions. However, the company traded at a lower multiple than the industry prior the offer.
The transaction is valued at USD 26.2bn. Blackstone finances the purchase with a 78.2%
debt leverage. Though the amount of debt seems very high, it is partly explained by the assets
on Hilton’s balance sheet which serve as collateral.
The main particularity of this transaction consists in the timing. The purchase is
announced during the summer of 2007, at the top of the real estate bubble. A few months later,
the global economy enters the biggest crisis since the 1930s. The hotel industry is heavily hit,
thus jeopardizing the sustainability of the Hilton LBO. Blackstone’s own share price plunged
by almost 90%, along with those of the main hotel groups. While some major banks like Bear
Sterns and Lehman Brothers, acting as debt providers in the transaction, go through a difficult
situation, Blackstone takes the decision of restructuring the debt raised. On top of it, it purchases
back some of it. As the effects of the crisis fade away, the performance of the Hilton group
improves again.
In December 2013, Blackstone exits the LBO by relisting the Hilton Hotels Corporation,
renamed Hilton Worldwide. With a trade at USD 21.5 per share, the company’s market
capitalization approximates USD 20bn, granting the Fund a net gain of approximately USD
9bn. It is one of the highest profits gained by a PE Fund at that time. Following the IPO, the
share price kept increasing, to reach USD 30.95 in April 2015. It then gradually dropped, as
shown below.
In the eye of many financial analysts, the Hilton LBO is one of transactions with the
poorest timing, but one of the most brilliantly executed. Blackstone ends up with an
unprecedented return, while the industry begins to recover from the crisis. How can such an
outcome be explained? Was Blackstone’s profit, as it is the main criticism against LBOs, at the
expense of the target company?

90
Exhibit 10: Stock price of Hilton Worldwide post LBO
Source: Yahoo Finance
In the next part, we apply our sets of measures to the Hilton Hotels Corporation, its
employees, its competitors and Blackstone. We eventually build the four utilities functions and
compare value creation across parties. Throughout the application, we experience a particular
difficulty due to the economic context of this case study. Because of this unexpected shock of
a high magnitude, some of our measures need to be adapted.
USD 0.0
USD 5.0
USD 10.0
USD 15.0
USD 20.0
USD 25.0
USD 30.0
USD 35.0
Dec-13 Apr-14 Aug-14 Dec-14 Apr-15 Aug-15 Dec-15 Apr-16
+3.4%
91
B – Application of recommended measures of value creation
In this part, we compute the measures presented in the previous section to each of the
four party considered. We describe the methodology followed and the collection of data
required to compute the measures. We then proceed to the computation and yield a single result
per measure. We use the variable associated with each recommended measure in Section II to
present our results. For example, when computing the change in ownership in OpCo by the
employees, we use the variable %EMPL. If we find that the percentage of capital owned has
increased by 3%, we present our results in the following way: %EMPL = +3%.
The stake of this case study is to determine whether our recommended measures are
applicable to a real LBO. Throughout the case, we mention and explain why we sometimes use
the proxy measures instead of the recommended ones. When it is the case, we replace the
variable introduced in Section II by its proxy in the utility function. We build the resulting
functions in the last part of this paper. The main problem that we encounter in this application
is the impact of the crisis. Because many measures are based on a comparison at exit and at
entry, the result incorporates macroeconomic changes occurred during the life of the LBO. It
may therefore yield a bias result. We then come up with potential remedies to it, which account
for addendums to our recommended frame of Section II.
92
1) The Hilton Hotels Corporation
The main difficulty that we encounter when applying the set of measures for the party
of the target company is the impact of the crisis. It occurs over the life of the LBO and
introduces a bias in the comparisons, either between exit and entry or between the realized
performance and that forecasted. Indeed, the forecasts for the Hilton Hotels Corporation
published prior the LBO announcement do not anticipate the crisis hitting the lodging business.
The realized performance of the company is then much poorer than that forecasted, as the whole
real estate industry. Hence, following our recommended framework, we end up with a poor
performance attributed to the impact of the LBO and overweigh the negative influence of the
LBO.
Operating performance
The recommended measures that we present in Section II regarding the operating
performance are represented by the three following variables:
- SALES
- EBITDA
- WCR
Each of these variables consists in the change of aggregates between exit and forecasts.
Hence, they incorporate the bias of the impact of the crisis that we mention above. Our
recommendation, so as to remedy to that bias, is to neutralize the impact of the crisis by
adjusting the forecasts of the Hilton Hotels Corporation from those of its competitors. This
approach implies that the whole industry is hit by the economic situation, the target company
as much as its competitors. For example, if all the competitors experienced a decrease of 8% in
their revenues, while they forecasted a +3% growth, we should adjust the target company’s own
forecasts of revenues from 11%. The rationale is that, without the LBO, the target company
would have followed the same path as its competitors. There is an obvious endogeneity bias to
this approach, whereby we cannot determine whether the PE Fund invests in the Hilton Hotels
Corporation for its specific resilience to shocks, or if the LBO helps the company better
adapting to the crisis than its competitors.
To compute our measures, we collect the realized performance at exit for both the Hilton
Hotels Corporation and its competitors, as well as the forecasts of equity analysis over these
companies. The forecasts need to be published before the LBO announcement, and even before
the first credible rumours of the deal. We use the Thomson One database, which presents broker
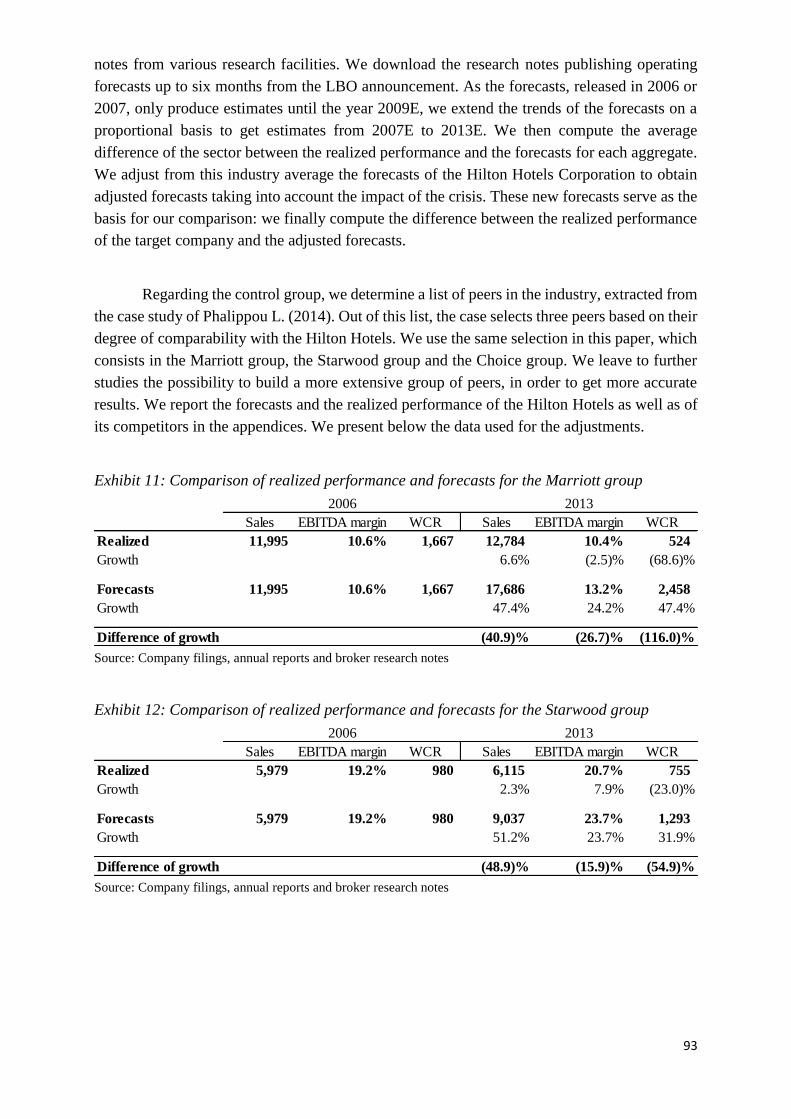
93
notes from various research facilities. We download the research notes publishing operating
forecasts up to six months from the LBO announcement. As the forecasts, released in 2006 or
2007, only produce estimates until the year 2009E, we extend the trends of the forecasts on a
proportional basis to get estimates from 2007E to 2013E. We then compute the average
difference of the sector between the realized performance and the forecasts for each aggregate.
We adjust from this industry average the forecasts of the Hilton Hotels Corporation to obtain
adjusted forecasts taking into account the impact of the crisis. These new forecasts serve as the
basis for our comparison: we finally compute the difference between the realized performance
of the target company and the adjusted forecasts.
Regarding the control group, we determine a list of peers in the industry, extracted from
the case study of Phalippou L. (2014). Out of this list, the case selects three peers based on their
degree of comparability with the Hilton Hotels. We use the same selection in this paper, which
consists in the Marriott group, the Starwood group and the Choice group. We leave to further
studies the possibility to build a more extensive group of peers, in order to get more accurate
results. We report the forecasts and the realized performance of the Hilton Hotels as well as of
its competitors in the appendices. We present below the data used for the adjustments.
Exhibit 11: Comparison of realized performance and forecasts for the Marriott group
Source: Company filings, annual reports and broker research notes
Exhibit 12: Comparison of realized performance and forecasts for the Starwood group
Source: Company filings, annual reports and broker research notes
2006 2013
Sales EBITDA margin WCR Sales EBITDA margin WCR
Realized 11,995 10.6% 1,667 12,784 10.4% 524
Growth 6.6% (2.5)% (68.6)%
Forecasts 11,995 10.6% 1,667 17,686 13.2% 2,458
Growth 47.4% 24.2% 47.4%
Difference of growth (40.9)% (26.7)% (116.0)%
2006 2013
Sales EBITDA margin WCR Sales EBITDA margin WCR
Realized 5,979 19.2% 980 6,115 20.7% 755
Growth 2.3% 7.9% (23.0)%
Forecasts 5,979 19.2% 980 9,037 23.7% 1,293
Growth 51.2% 23.7% 31.9%
Difference of growth (48.9)% (15.9)% (54.9)%
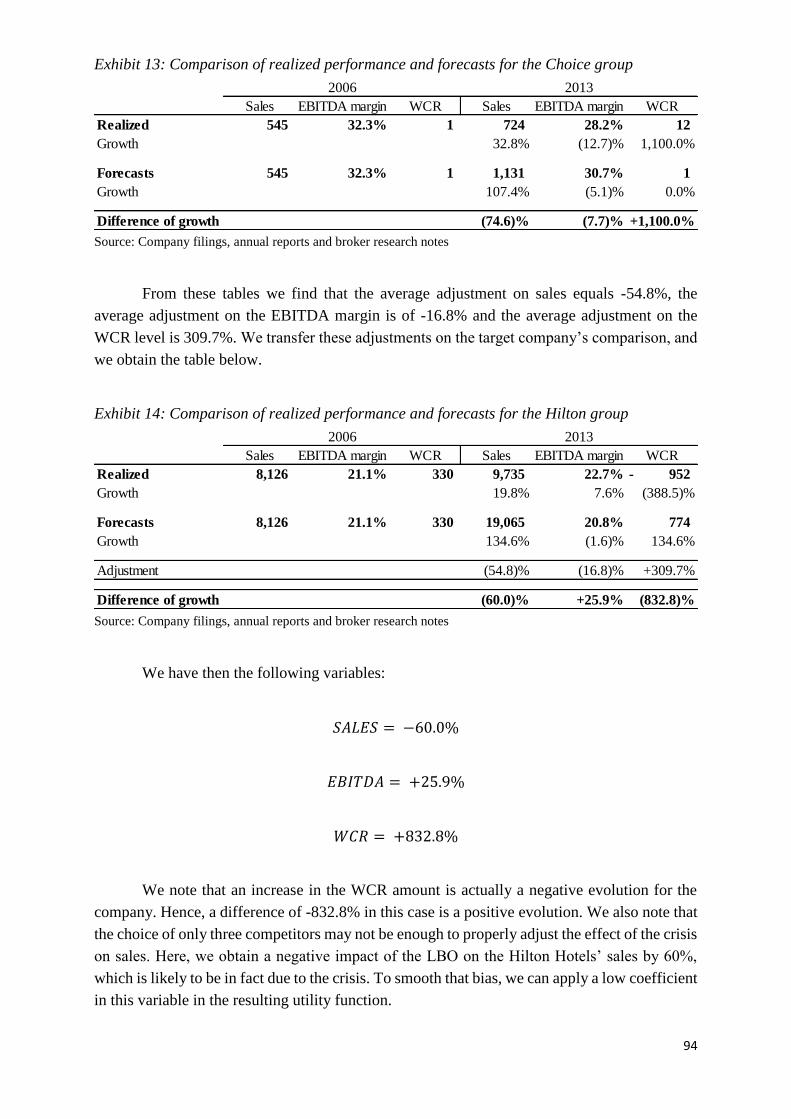
94
Exhibit 13: Comparison of realized performance and forecasts for the Choice group
Source: Company filings, annual reports and broker research notes
From these tables we find that the average adjustment on sales equals -54.8%, the
average adjustment on the EBITDA margin is of -16.8% and the average adjustment on the
WCR level is 309.7%. We transfer these adjustments on the target company’s comparison, and
we obtain the table below.
Exhibit 14: Comparison of realized performance and forecasts for the Hilton group
Source: Company filings, annual reports and broker research notes
We have then the following variables:
𝑆𝐴𝐿𝐸𝑆 = −60.0%
𝐸𝐵𝐼𝑇𝐷𝐴 = +25.9%
𝑊𝐶𝑅 = +832.8%
We note that an increase in the WCR amount is actually a negative evolution for the
company. Hence, a difference of -832.8% in this case is a positive evolution. We also note that
the choice of only three competitors may not be enough to properly adjust the effect of the crisis
on sales. Here, we obtain a negative impact of the LBO on the Hilton Hotels’ sales by 60%,
which is likely to be in fact due to the crisis. To smooth that bias, we can apply a low coefficient
in this variable in the resulting utility function.
2006 2013
Sales EBITDA margin WCR Sales EBITDA margin WCR
Realized 545 32.3% 1 724 28.2% 12
Growth 32.8% (12.7)% 1,100.0%
Forecasts 545 32.3% 1 1,131 30.7% 1
Growth 107.4% (5.1)% 0.0%
Difference of growth (74.6)% (7.7)% +1,100.0%
2006 2013
Sales EBITDA margin WCR Sales EBITDA margin WCR
Realized 8,126 21.1% 330 9,735 22.7% 952-
Growth 19.8% 7.6% (388.5)%
Forecasts 8,126 21.1% 330 19,065 20.8% 774
Growth 134.6% (1.6)% 134.6%
Adjustment (54.8)% (16.8)% +309.7%
Difference of growth (60.0)% +25.9% (832.8)%
95
We apply here the recommended measures, designed for a standard frame. We can as
well use performance indicators specific to the hotel industry, such as revenues per available
room or occupancy rate.
Innovation policy
Our recommended measure for the innovative policy consists in the change in average
number of patents registered in a year weighted by forward citations. It is compared between
exit and entry, as a percentage of the item at entry. We check the various public databases
recording the patents associated with a company. Among them, we find, especially for the US,
the United States Patent and Trademark Office. We crosscheck our results with several other
online databases3. However, none of this database yields the same results, and we are unable to
find an exhaustive list of all the patents registered for the Hilton Hotels Corporation or Hilton
Worldwide.
We then turn to our proxy measure, which consists in comparing the level of R&D
expenses of the target company, at entry and at exit. To that end, we look at the Hilton Hotels
Corporation filings at the end of 2006 and at the end of 2013. However, the company does not
give the detail of such expenses in its financials. We are hence unable to compute the measure.
It remains that this driver of value is less relevant for the lodging industry in general.
The majority of patents registered by such groups are related to the provision of internet services
for the customers’ rooms. Even though we had the data on the number of patents registered,
they would be biased by the pace of technological discoveries in that field. The structural trend
of innovations is accelerating, and we assume that an LBO is unlikely to have a significant
influence on it. Thus, we establish the following:
𝑃𝐴𝑇𝐸𝑁𝑇𝑆𝐹𝑊 = 0%
3 http://www.freepatentsonline.com/search.html; http://patentssearcher.com/;
https://search.rpxcorp.com/advanced_search/search_patents
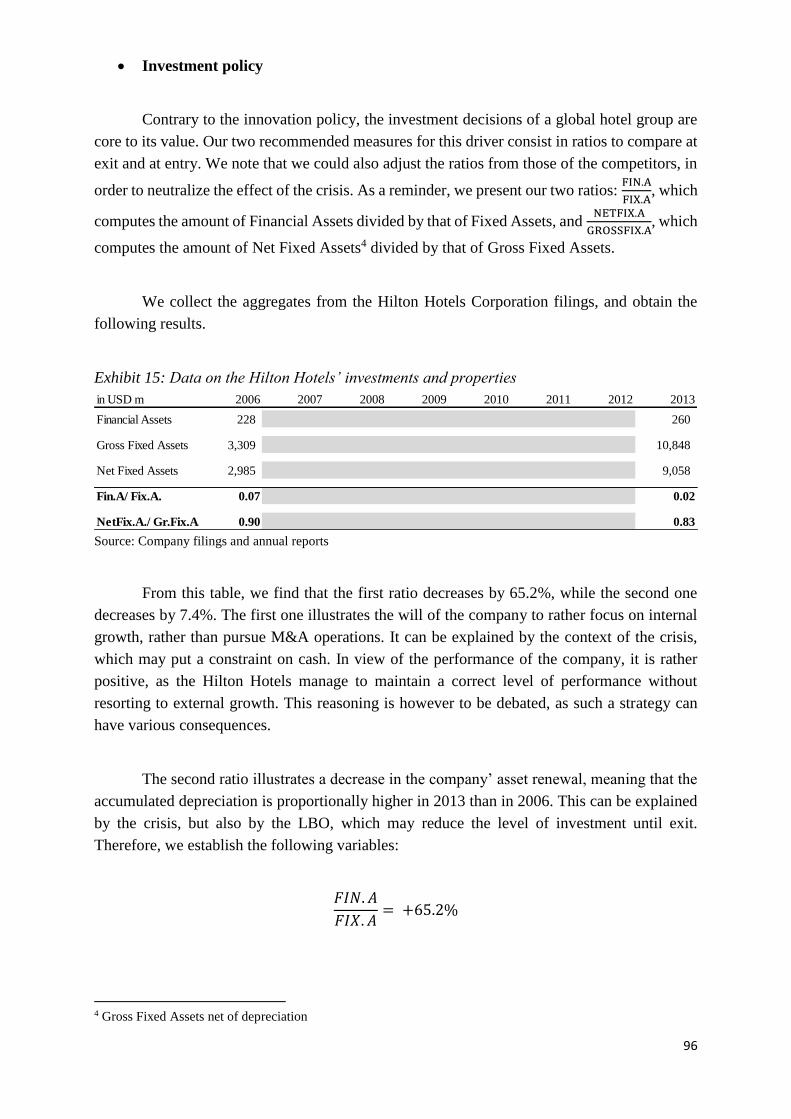
96
Investment policy
Contrary to the innovation policy, the investment decisions of a global hotel group are
core to its value. Our two recommended measures for this driver consist in ratios to compare at
exit and at entry. We note that we could also adjust the ratios from those of the competitors, in
order to neutralize the effect of the crisis. As a reminder, we present our two ratios: FIN.A
FIX.A, which
computes the amount of Financial Assets divided by that of Fixed Assets, and NETFIX.A
GROSSFIX.A, which
computes the amount of Net Fixed Assets4 divided by that of Gross Fixed Assets.
We collect the aggregates from the Hilton Hotels Corporation filings, and obtain the
following results.
Exhibit 15: Data on the Hilton Hotels’ investments and properties
Source: Company filings and annual reports
From this table, we find that the first ratio decreases by 65.2%, while the second one
decreases by 7.4%. The first one illustrates the will of the company to rather focus on internal
growth, rather than pursue M&A operations. It can be explained by the context of the crisis,
which may put a constraint on cash. In view of the performance of the company, it is rather
positive, as the Hilton Hotels manage to maintain a correct level of performance without
resorting to external growth. This reasoning is however to be debated, as such a strategy can
have various consequences.
The second ratio illustrates a decrease in the company’ asset renewal, meaning that the
accumulated depreciation is proportionally higher in 2013 than in 2006. This can be explained
by the crisis, but also by the LBO, which may reduce the level of investment until exit.
Therefore, we establish the following variables:
𝐹𝐼𝑁. 𝐴
𝐹𝐼𝑋. 𝐴= +65.2%
4 Gross Fixed Assets net of depreciation
in USD m 2006 2007 2008 2009 2010 2011 2012 2013
Financial Assets 228 260
Gross Fixed Assets 3,309 10,848
Net Fixed Assets 2,985 9,058
Fin.A/ Fix.A. 0.07 0.02
NetFix.A./ Gr.Fix.A. 0.90 0.83
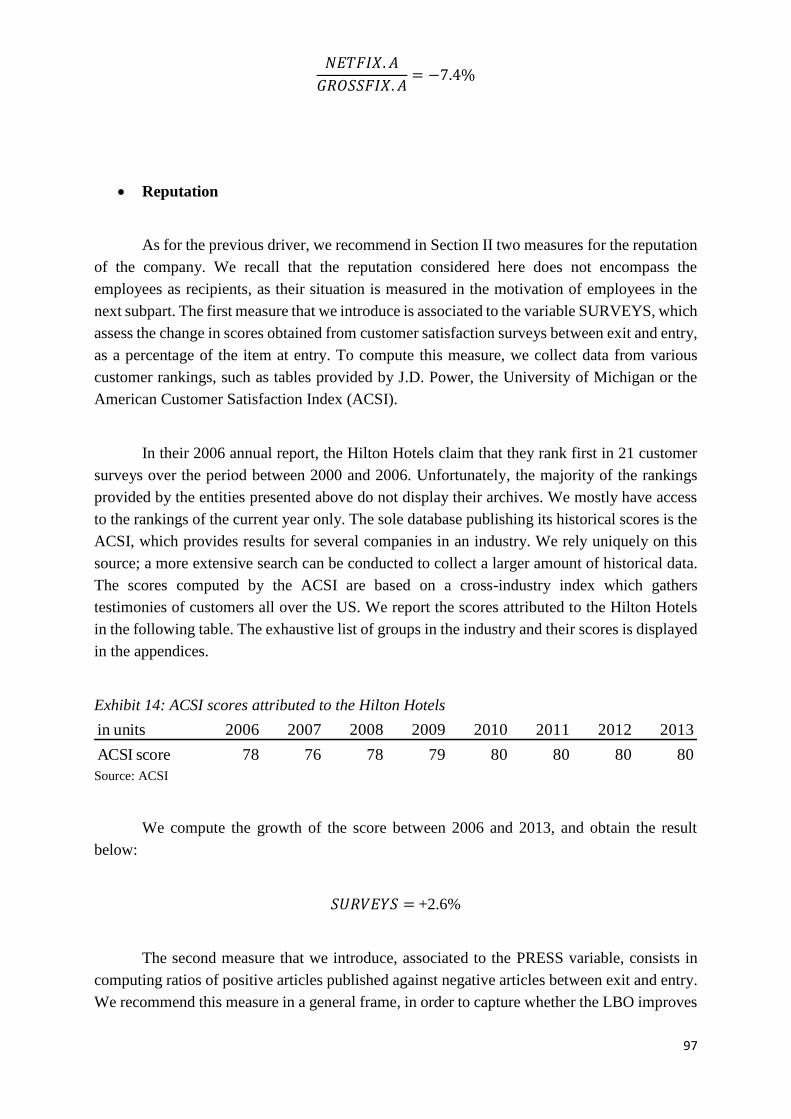
97
𝑁𝐸𝑇𝐹𝐼𝑋. 𝐴
𝐺𝑅𝑂𝑆𝑆𝐹𝐼𝑋. 𝐴= −7.4%
Reputation
As for the previous driver, we recommend in Section II two measures for the reputation
of the company. We recall that the reputation considered here does not encompass the
employees as recipients, as their situation is measured in the motivation of employees in the
next subpart. The first measure that we introduce is associated to the variable SURVEYS, which
assess the change in scores obtained from customer satisfaction surveys between exit and entry,
as a percentage of the item at entry. To compute this measure, we collect data from various
customer rankings, such as tables provided by J.D. Power, the University of Michigan or the
American Customer Satisfaction Index (ACSI).
In their 2006 annual report, the Hilton Hotels claim that they rank first in 21 customer
surveys over the period between 2000 and 2006. Unfortunately, the majority of the rankings
provided by the entities presented above do not display their archives. We mostly have access
to the rankings of the current year only. The sole database publishing its historical scores is the
ACSI, which provides results for several companies in an industry. We rely uniquely on this
source; a more extensive search can be conducted to collect a larger amount of historical data.
The scores computed by the ACSI are based on a cross-industry index which gathers
testimonies of customers all over the US. We report the scores attributed to the Hilton Hotels
in the following table. The exhaustive list of groups in the industry and their scores is displayed
in the appendices.
Exhibit 14: ACSI scores attributed to the Hilton Hotels
Source: ACSI
We compute the growth of the score between 2006 and 2013, and obtain the result
below:
𝑆𝑈𝑅𝑉𝐸𝑌𝑆 = +2.6%
The second measure that we introduce, associated to the PRESS variable, consists in
computing ratios of positive articles published against negative articles between exit and entry.
We recommend this measure in a general frame, in order to capture whether the LBO improves
in units 2006 2007 2008 2009 2010 2011 2012 2013
ACSI score 78 76 78 79 80 80 80 80
98
or worsens the image conveyed by the target company to its business partners. However, the
context is particular in this case study, as the articles collected thanks to the Factiva database
mostly refer to either openings of hotels by the company or trends in the industry. There are
therefore overlaps with the investment policy. On top of it, because of the crisis, the majority
of articles published after the LBO announcement refer to the economic health of the sector. At
exit, faced with the profit of Blackstone on the deal, most articles elaborate on the PE Fund’s
performance, rather than on the company itself. Hence, this measure is not much relevant here,
and we establish:
𝑃𝑅𝐸𝑆𝑆 = 0%
Motivation of employees
The last driver of value for the party of the target company consists in the motivation of
employees to better perform in the future. Our recommended framework is composed of three
variables, each associated with a measure. The first two, %MANAG and %EMPL, consist in
the change in shares of capital in the Hilton Hotels Corporation owned by the management and
by employees, between exit and entry. To compute this measure, we collect the ownership data
of the target company, both before the LBO announcement and after the exit date.
There is no detailed split of shareholders of the Hilton Hotels Corporation available for
the period before the announcement, since the company has been delisted afterwards. To
remedy this lack of information, we rather replace the share of capital owned by the value of
treasury stocks dedicated to incentive plans. Such stocks are granted under the form of options
to the employees and managers, in order to incentivize them in better performing. Back in their
2006 filings, the company mentions several plans granting additional shares to employees and
non-employee directors, either for retirement plans or incentives. These plans are however
described as recent decisions, and may not be comparable against plans decided in 2013. Hence,
this approach does not fit our framework.
Our recommendation is therefore to assess the options, dedicated to employees and
managers, either already granted or soon to be. We collect information on equity compensation
plans, at the end of 2006 and at the end of 2013. Tables extracted from annual reports and filings
at these dates divide options into two categories: the securities to be issued upon exercise and
the number of securities remaining available for future issuance. We consider the sum of the
two category, as it reflects both the options in-the-money and those out-of-money, that is to say
the total incentive policy of the company. We multiply the sum, composed of the 22,971,677
securities to be issued upon exercise of options and the 21,191,775 securities available for future
issuance, by the weighted average exercise price of USD 16.9. We obtain thus a value of options
99
granted for both the managers and the employees together of USD 745m. Out of the market
capitalization at this date, of USD 13.0bn5, it represents a ratio of 5.7%.
We repeat the same methodology for the year end 2013. However, the average exercise
price of options is not available at this date. On top of it, the number of securities to be issued,
of 19,500, is particularly low. This can be explained by the fact that the exit IPO is very close.
We take then the data for the year 2014. We multiply the sum of securities, composed of the
7,304,569 securities to be issued and the 72,686,932 remaining for future issuance, by the
average price of USD 7.6, which yields a value of USD 606m. Out of the market capitalization
at this date, of USD 21.4bn6, it represents a ratio of 2.8%.
Between 2006 and 2013, this ratio has decreased by 50.4%, while the number of
employees has increased. We establish then:
%𝑀𝐴𝑁𝐴𝐺 + %𝐸𝑀𝑃𝐿 = −50.4%
The third complementary measure that we recommend for the motivation of employees
is the satisfaction of employees over their working conditions. This measure is common to both
the party of the target company and that of the employees. We give the details of the
computation in the next sub-part:
𝑊𝑂𝑅𝐾𝐶𝑂𝑁𝐷 = +1.6%
5 388,953,623 shares outstanding as of January 1st, 2007, at a USD 33.5 share price as of June 29th, 2007 6 984,615,364 shares outstanding as of February 12th, 2014, at a USD 21.7 share price as of the same date
100
2) The employees
We now compute the measures associated with the three drivers of value for the party
of employees: the unemployment risk, the remuneration and the satisfaction over working
conditions. The measures recommended relating to employees are typically very time
consuming, and require an extensive access to several databases. We end up having to use the
proxy measures instead.
Unemployment risk
The recommended measure for the unemployment risk, represented by the variable
UNEMPL, consists in the change in ratios of employees reported unemployed for a certain
amount of time over total employees registered at entry. The change is computed between the
ratio of the target company and a control group of similar peers, as a percentage of the ratio of
the control group. This measure requires to have access to the unemployment registration of the
country in matter, and to check it for each employee of the Hilton Hotel Corporation, as well
as for each of the comparable peers, officially employed at the LBO announcement. Once we
have the necessary data available, we can compute the ratios for the target company and for the
control group.
As for this case study, we do not have access to such databases. In view of the high
number of employees of the Hilton Hotels Corporation in 2006 and 2007, we cannot track them
on online platforms one by one and be sure of the self-reported data. Hence, we resort to the
proxy measure for the unemployment risk, which consists in the computation of the
employment growth. However, we need to take into account the impact of the economic crisis.
With the hit on the lodging business, it is likely that employees, with or without the LBO, see
their job positions’ sustainability jeopardized. In order to neutralize the employment growth
from the crisis, we compare the employment level of the Hilton Hotels Corporation at exit and
at entry, while adjusting it from the same comparison for its main competitors. We report below
the data used on employees of the various companies. We keep the same three similar peers
than for the previous part.
We note that this method does not enable to factor in the size of the company; if it enters
M&A activities over the period, the number of employees registered does not discriminate
whether it hires more or incorporates the employees of the purchased company.
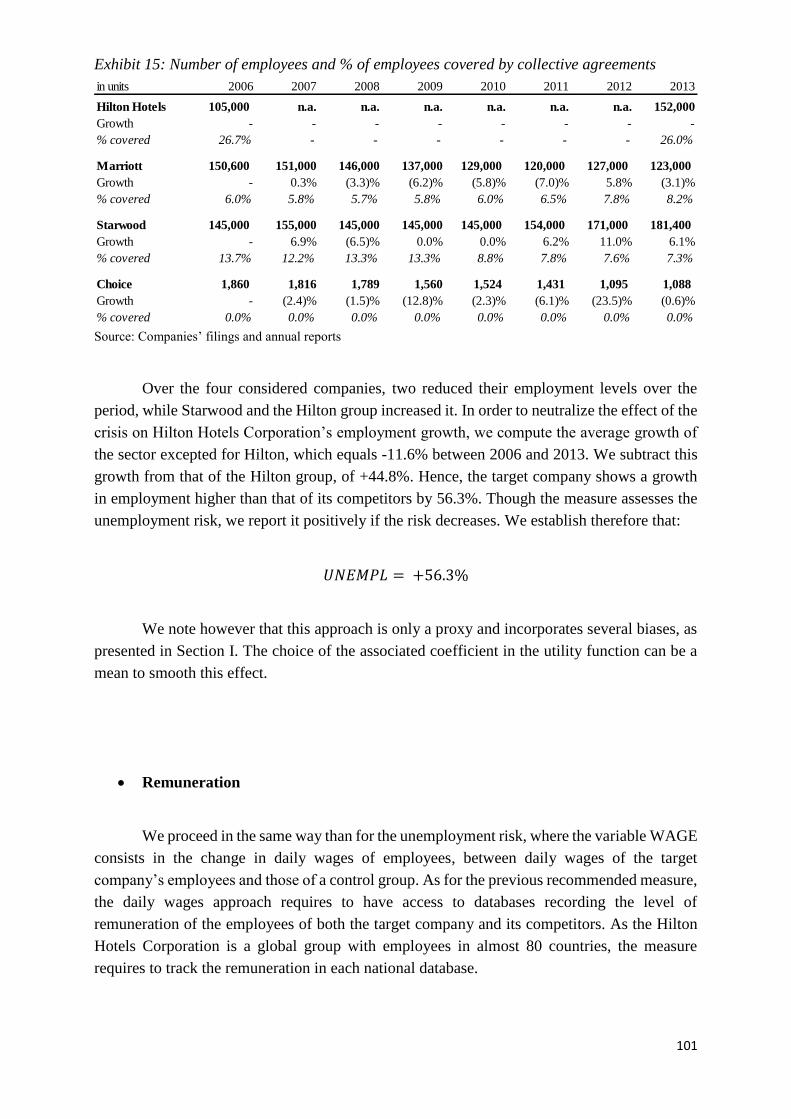
101
Exhibit 15: Number of employees and % of employees covered by collective agreements
Source: Companies’ filings and annual reports
Over the four considered companies, two reduced their employment levels over the
period, while Starwood and the Hilton group increased it. In order to neutralize the effect of the
crisis on Hilton Hotels Corporation’s employment growth, we compute the average growth of
the sector excepted for Hilton, which equals -11.6% between 2006 and 2013. We subtract this
growth from that of the Hilton group, of +44.8%. Hence, the target company shows a growth
in employment higher than that of its competitors by 56.3%. Though the measure assesses the
unemployment risk, we report it positively if the risk decreases. We establish therefore that:
𝑈𝑁𝐸𝑀𝑃𝐿 = +56.3%
We note however that this approach is only a proxy and incorporates several biases, as
presented in Section I. The choice of the associated coefficient in the utility function can be a
mean to smooth this effect.
Remuneration
We proceed in the same way than for the unemployment risk, where the variable WAGE
consists in the change in daily wages of employees, between daily wages of the target
company’s employees and those of a control group. As for the previous recommended measure,
the daily wages approach requires to have access to databases recording the level of
remuneration of the employees of both the target company and its competitors. As the Hilton
Hotels Corporation is a global group with employees in almost 80 countries, the measure
requires to track the remuneration in each national database.
in units 2006 2007 2008 2009 2010 2011 2012 2013
Hilton Hotels 105,000 n.a. n.a. n.a. n.a. n.a. n.a. 152,000
Growth - - - - - - - -
% covered 26.7% - - - - - - 26.0%
Marriott 150,600 151,000 146,000 137,000 129,000 120,000 127,000 123,000
Growth - 0.3% (3.3)% (6.2)% (5.8)% (7.0)% 5.8% (3.1)%
% covered 6.0% 5.8% 5.7% 5.8% 6.0% 6.5% 7.8% 8.2%
Starwood 145,000 155,000 145,000 145,000 145,000 154,000 171,000 181,400
Growth - 6.9% (6.5)% 0.0% 0.0% 6.2% 11.0% 6.1%
% covered 13.7% 12.2% 13.3% 13.3% 8.8% 7.8% 7.6% 7.3%
Choice 1,860 1,816 1,789 1,560 1,524 1,431 1,095 1,088
Growth - (2.4)% (1.5)% (12.8)% (2.3)% (6.1)% (23.5)% (0.6)%
% covered 0.0% 0.0% 0.0% 0.0% 0.0% 0.0% 0.0% 0.0%
102
Faced with such constraints, we resort to the provided proxy measure of remuneration,
which computes the average salary at the company level. To that end, we need to collect the
costs allocated to workforce for each of the four companies and divide them by the average
number of employees over the year. We note that this measure initially depicts the comparison
between the target company and a control group, rather than between exit and entry. Indeed,
we assume that salaries are influenced by external factors such as inflation and market trends.
Meanwhile, salaries of employees from very similar companies are assumed to be close. Hence,
a significant difference between the target company and its peers is allegedly due to the impact
of the LBO.
Data on Hilton Hotels Corporation’s employees are very scarce. Though it is a listed
company, thus publishing annual reports and filings, we are unable to find the satisfying level
of data. The financial statements of the company do not display the detail of costs allocated to
workforce, nor the average salary of their employees. The costs segmentation refers to the status
of the hotels, either owned, leased or franchised. Within these categories costs are presented as
a whole aggregate. The same goes for most of the peers in the industry. We are hence
constrained by the access to information, and cannot proceed further regarding the computation
of employees’ remuneration. Consequently, we assume that the impact of the LBO on
employees’ level of remuneration in the future is negligible, and we establish the following:
𝑊𝐴𝐺𝐸 = 0%
This assumption is in fact credible, as salaries in the lodging industry are very similar.
Especially in the premium segment, on which the Hilton hotels are positioned, the supply
exceeds the demand. Hence, the bargaining power is rather in favour of the employer, and there
is no significant competition on salaries to attract candidates. On top of it, the economic crisis
is likely to have aligned salaries among the various hotel groups, and we assume that the LBO
only has a minor impact on salaries, all the more since a significant portion of employees are
unionized. We leave this topic to further studies having access to a more extensive amount of
information.
Working conditions
The issue of the working conditions is particularly tricky in this case, since the whole
lodging industry has been severely hit by the economic crisis. In such a context, employees of
the Hilton Hotels Corporation are likely to have experienced a significant amount of stress.
Faced with uncertainty over the future of their employer, they may feel less comfortable in their
working environment, thus introducing an unhealthy atmosphere to the company.
103
We find earlier that, during the crisis, the company chose to maintaining its level of
employment, contrary to many of its competitors. Such a strategy may be implemented at the
expense of the satisfaction of employees regarding the amount of pressure perceived. Our
recommended measure, associated to the WORKCOND variable, consists in computing the
change in scores obtained from occupational medicine surveys, between exit and entry. In that
sense, it is well adapted to the crisis, as it directly captures employees’ perception over their
work environment. However, it requires that such surveys have been conducted back in 2006
or 2007, and again in 2013 at exit in order to be able to compare. Unfortunately, we are unable
to collect data on such surveys, and need to use proxy measures.
We recommend in Section II two proxy measures for the working conditions: CSR
indicators and magazine rankings of the best companies to work for. First, we consider the list
of CSR indicators provided in the appendices. Out of the six measures relative to the working
conditions of employees, we are only able to compute that referring to collective agreements.
Thanks to the company’s filings, we compute the percentages of employees represented by
labour unions out of total employees in the year. The results are presented in the exhibit 15
above. We proceed similarly to the computation of employment growth, and we find that the
percentage of employees covered by collective agreements decreases by 2.5% for the Hilton
Hotels, while the average of the industry is of -3.2%. Hence, the measure yields a positive
impact of the LBO on the Hilton Hotels’ percentage by +0.7%. We introduce the CSR sub-
variable, within the WORKCOND variable, accounting for the change in this particular CSR
indicator, and we establish CSR = +0.7%.
Second, we review the various rankings published by business magazines reporting the
best employers in the world or in the US. Among the most famous we find the 100 best
companies to work for by Fortune Magazine, the America’s Best Employers by Forbes, the
Workforce 100 ranking by Workforce and the 100 best companies by the Sunday Times. Hilton
Worldwide appears at several times in some of the rankings. However, the difficulty consists
in collecting the rankings on all the years from 2006 in order to factor in all the years of
appearance of the life of the LBO. Most of the rankings do not display their archives and prevent
from building a comparable base. Out of these four rankings, only that of Fortune Magazine
provides lists from 2006 onwards.
Fortune’s 100 best companies to work for is based on various criteria affecting
employees, such as the split across employee types, genders or races, the proportion of
applicants compared to the number of job openings and the variety of perks attributed to
employees. Hilton Worldwide first enters the rankings in 2016, at the 56th position. We present
the results in the table below. We note that the crisis may deter candidates from the lodging
industry, thus lowering the number of appearances for such groups.
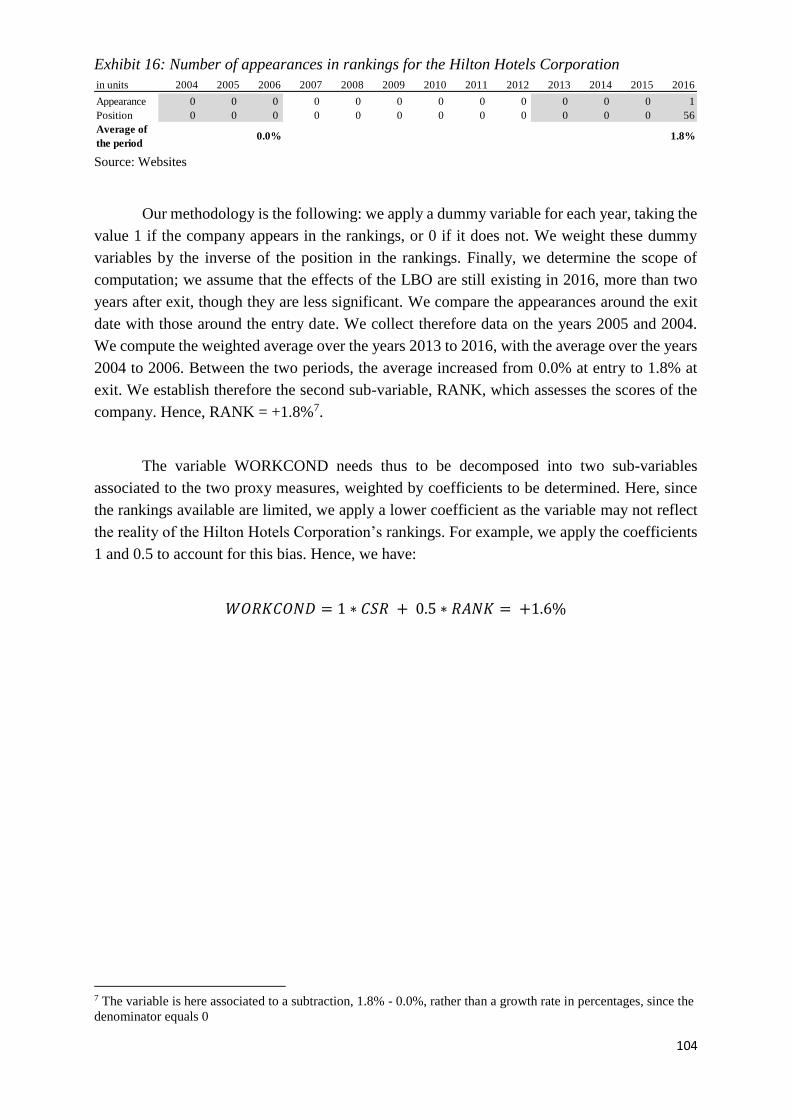
104
Exhibit 16: Number of appearances in rankings for the Hilton Hotels Corporation
Source: Websites
Our methodology is the following: we apply a dummy variable for each year, taking the
value 1 if the company appears in the rankings, or 0 if it does not. We weight these dummy
variables by the inverse of the position in the rankings. Finally, we determine the scope of
computation; we assume that the effects of the LBO are still existing in 2016, more than two
years after exit, though they are less significant. We compare the appearances around the exit
date with those around the entry date. We collect therefore data on the years 2005 and 2004.
We compute the weighted average over the years 2013 to 2016, with the average over the years
2004 to 2006. Between the two periods, the average increased from 0.0% at entry to 1.8% at
exit. We establish therefore the second sub-variable, RANK, which assesses the scores of the
company. Hence, RANK = +1.8%7.
The variable WORKCOND needs thus to be decomposed into two sub-variables
associated to the two proxy measures, weighted by coefficients to be determined. Here, since
the rankings available are limited, we apply a lower coefficient as the variable may not reflect
the reality of the Hilton Hotels Corporation’s rankings. For example, we apply the coefficients
1 and 0.5 to account for this bias. Hence, we have:
𝑊𝑂𝑅𝐾𝐶𝑂𝑁𝐷 = 1 ∗ 𝐶𝑆𝑅 + 0.5 ∗ 𝑅𝐴𝑁𝐾 = +1.6%
7 The variable is here associated to a subtraction, 1.8% - 0.0%, rather than a growth rate in percentages, since the
denominator equals 0
in units 2004 2005 2006 2007 2008 2009 2010 2011 2012 2013 2014 2015 2016
Appearance 0 0 0 0 0 0 0 0 0 0 0 0 1
Position 0 0 0 0 0 0 0 0 0 0 0 0 56
Average of
the period0.0% 1.8%
105
3) The competitors
We apply in this sub-part the measures recommended in Section II regarding the value
creation for the party of competitors. We already mention above some of the competitors of the
Hilton Hotels Corporation back in 2007. After the LBO exit, the company went upwards in the
rankings, moving from the fourth to the first position in the world by number of rooms. Was
this evolution at the expense of the competitors?
The measures that we recommend consider the whole industry in which the target
company is positioned. As far as the hotel industry is concerned, it represents a very large
market, on a global scale, with thousands of players. We are unable to collect and process data
on the totality of these players, especially as many of them are independent and small
companies. We thus reduce the scope of the party of competitors to the top eight players in the
world by number of rooms in 2007. This subdivision makes sense for this case study, as most
of the remaining players are independent structures, which are not in direct competition with
the Hilton Hotels. The target company’s competitive environment is indeed mainly composed
of these seven players.
Market share
The impact of the LBO on the competitors’ market share is assessed by three measures
that we recommend in Section II. The first measure, associated to the variable MARKETSH,
consists in the change in market shares of competitors between the realized market share at exit
and that forecasted. The market share is accounted for by the revenues of the company.
However, in the lodging business, it is more relevant to translate a group’s market share into
the number of rooms supplied. We use this indicator from now on to represent the market share.
To compute the impact of the LBO on the target company’ market share, we take the difference
between the rooms of the Hilton Hotels Corporation at exit and the forecasts at the same date.
In a 2005 investor presentation, the company states an estimated 7% growth in their room
numbers from 2007 onwards. We use this rate to get the forecasted number of rooms at exit.
In the original measure, we divide this difference by the subtracting of the target
company’s forecasted rooms from the market total rooms forecasted at the exit date. However,
since we reduce the scope of the total market to the top eight competitors, including the Hilton
Hotels, we need to have access to each competitor’s forecasts regarding their rooms. This type
of data is hardly public; only the room pipeline over the next two years are usually available.
We are thus unable to collect the required forecasts published before the LBO announcement.
We know however that, in 2007, the hotel world supply had grown by 2.7% by number of
rooms compared to 2006. This was a record for the decade, and analysts believed the year to be
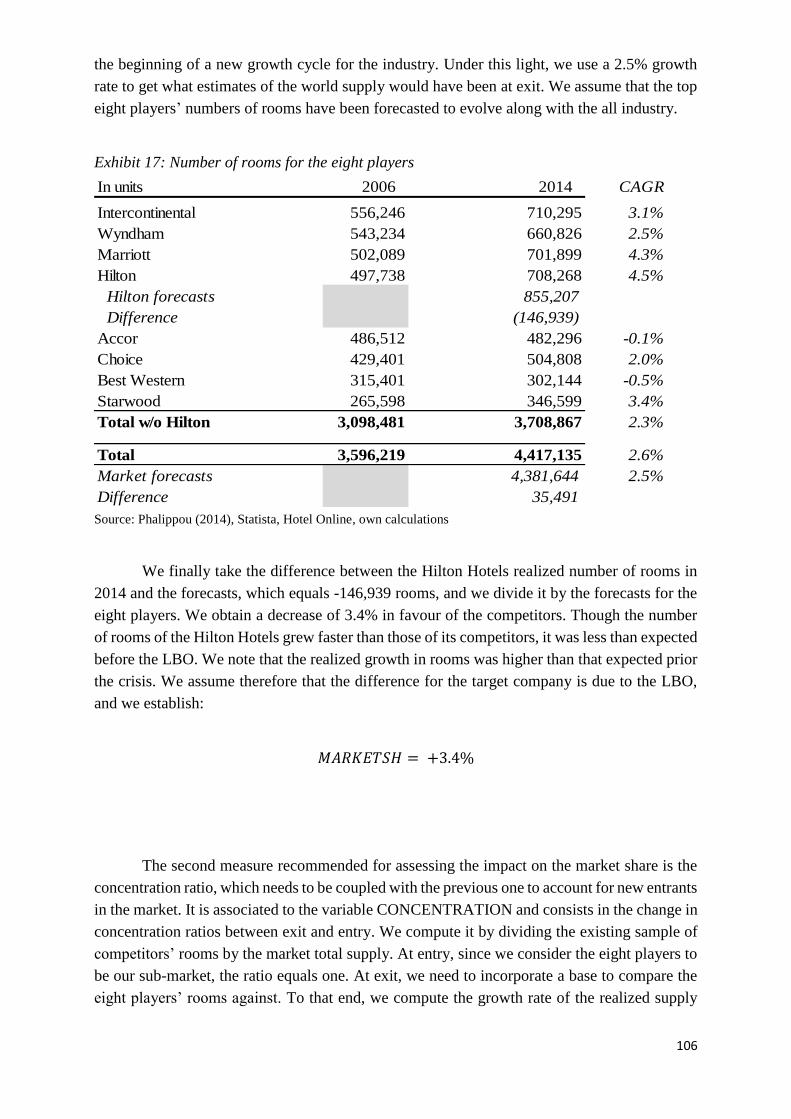
106
the beginning of a new growth cycle for the industry. Under this light, we use a 2.5% growth
rate to get what estimates of the world supply would have been at exit. We assume that the top
eight players’ numbers of rooms have been forecasted to evolve along with the all industry.
Exhibit 17: Number of rooms for the eight players
Source: Phalippou (2014), Statista, Hotel Online, own calculations
We finally take the difference between the Hilton Hotels realized number of rooms in
2014 and the forecasts, which equals -146,939 rooms, and we divide it by the forecasts for the
eight players. We obtain a decrease of 3.4% in favour of the competitors. Though the number
of rooms of the Hilton Hotels grew faster than those of its competitors, it was less than expected
before the LBO. We note that the realized growth in rooms was higher than that expected prior
the crisis. We assume therefore that the difference for the target company is due to the LBO,
and we establish:
𝑀𝐴𝑅𝐾𝐸𝑇𝑆𝐻 = +3.4%
The second measure recommended for assessing the impact on the market share is the
concentration ratio, which needs to be coupled with the previous one to account for new entrants
in the market. It is associated to the variable CONCENTRATION and consists in the change in
concentration ratios between exit and entry. We compute it by dividing the existing sample of
competitors’ rooms by the market total supply. At entry, since we consider the eight players to
be our sub-market, the ratio equals one. At exit, we need to incorporate a base to compare the
eight players’ rooms against. To that end, we compute the growth rate of the realized supply
In units 2006 2014 CAGR
Intercontinental 556,246 710,295 3.1%
Wyndham 543,234 660,826 2.5%
Marriott 502,089 701,899 4.3%
Hilton 497,738 708,268 4.5%
Hilton forecasts 855,207
Difference (146,939)
Accor 486,512 482,296 -0.1%
Choice 429,401 504,808 2.0%
Best Western 315,401 302,144 -0.5%
Starwood 265,598 346,599 3.4%
Total w/o Hilton 3,098,481 3,708,867 2.3%
Total 3,596,219 4,417,135 2.6%
Market forecasts 3,596,219 4,381,644 2.5%
Difference 35,491
107
for the whole hotel supply in the world, which moves from 5.5m in 2006 to 19.5 in 2013. At
this rate, the market of our eight players in 2006 should have reached 13,162,710 rooms in
2014, instead of 4,417,135. The difference is obviously explained by smaller companies
entering the market, growing at a faster pace than large groups. Still, it gives an idea of new
entrants in the market, and what competition the eight players would have faced if we do not
reduce the scope to them only. The concentration ratio is therefore of 1.00x at entry, and of
0.34x at exit, which represents a 66.4% decrease. We establish the following:
𝐶𝑂𝑁𝐶𝐸𝑁𝑇𝑅𝐴𝑇𝐼𝑂𝑁 = −66.4%
We note that this measure is rather theoretical, and that the LBO on the Hilton Hotels is
unlikely to be responsible for new entrants around the world. To smooth that bias, we can apply
a low coefficient to the corresponding variable.
The third measure that we introduce for assessing this driver of value is the maximum
benefits that competitors may capture from a potential liquidation of the Hilton Hotels
Corporation. We associate the measure with the PROBDEF x SALESOPCO variable, which
consist in multiplying the probability of default of the target company with its revenues. Here,
we use the room indicator rather than the revenues. We compute this combination both at exit
and at entry.
The computation of the default probability is achieved through a reverse equation
(Almeida H. and Philippon T., 2007). Faced with the complexity and time consumption of the
model, we resort to the proxy measure for the probability. It consists in the ex-ante probability
of default derive from a Z-score. We apply to selected aggregates the specific weights and a
level of Z-score for each period. The higher the score, the lower the probability of distress. We
present the computation in the following table.
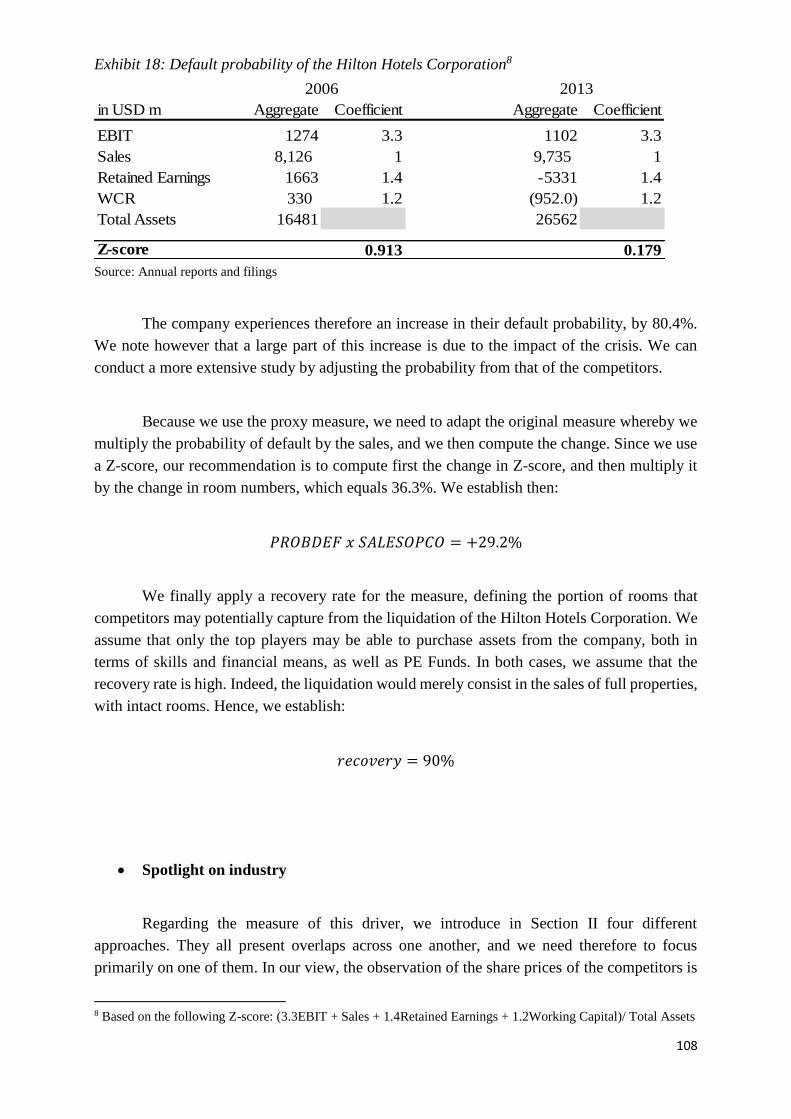
108
Exhibit 18: Default probability of the Hilton Hotels Corporation8
Source: Annual reports and filings
The company experiences therefore an increase in their default probability, by 80.4%.
We note however that a large part of this increase is due to the impact of the crisis. We can
conduct a more extensive study by adjusting the probability from that of the competitors.
Because we use the proxy measure, we need to adapt the original measure whereby we
multiply the probability of default by the sales, and we then compute the change. Since we use
a Z-score, our recommendation is to compute first the change in Z-score, and then multiply it
by the change in room numbers, which equals 36.3%. We establish then:
𝑃𝑅𝑂𝐵𝐷𝐸𝐹 𝑥 𝑆𝐴𝐿𝐸𝑆𝑂𝑃𝐶𝑂 = +29.2%
We finally apply a recovery rate for the measure, defining the portion of rooms that
competitors may potentially capture from the liquidation of the Hilton Hotels Corporation. We
assume that only the top players may be able to purchase assets from the company, both in
terms of skills and financial means, as well as PE Funds. In both cases, we assume that the
recovery rate is high. Indeed, the liquidation would merely consist in the sales of full properties,
with intact rooms. Hence, we establish:
𝑟𝑒𝑐𝑜𝑣𝑒𝑟𝑦 = 90%
Spotlight on industry
Regarding the measure of this driver, we introduce in Section II four different
approaches. They all present overlaps across one another, and we need therefore to focus
primarily on one of them. In our view, the observation of the share prices of the competitors is
8 Based on the following Z-score: (3.3EBIT + Sales + 1.4Retained Earnings + 1.2Working Capital)/ Total Assets
2006 2013
in USD m Aggregate Coefficient Aggregate Coefficient
EBIT 1274 3.3 1102 3.3
Sales 8,126 1 9,735 1
Retained Earnings 1663 1.4 -5331 1.4
WCR 330 1.2 (952.0) 1.2
Total Assets 16481 26562
Z-score 0.913 0.179
109
the most relevant for this case study. In comparison, the observations of the number of bids and
the level of premiums offered presents collecting difficulties. Both of them require to have
access to extensive databases of transactions in the industry, which we do not have. Finally, the
press articles combination can be a fit, but it presents several drawbacks here. Indeed, the hotel
industry is a very popular one, benefiting from a high coverage. Even before the LBO
announcement on the Hilton Hotels, many articles were referring to the industry. The LBO has
not brought significant value regarding visibility, as it was already a sector well-known of
investors. On top of it, as we reduce the scope to the top eight largest groups, we end up with a
sample of companies that are not easily purchasable. Because of their sizes, not so many
potential buyers can make an offer.
Hence, the measure of the share price is the most relevant for this case study. It reflects
the true belief of investors that, though it is a well-known sector, the LBO may still attract
potential buyers in the industry. Or, conversely, it may translate the belief that, now that one of
the most likely buyers, i.e. Blackstone, has made a purchase, there are not so many investors
anymore ready to make an offer on competitors. We establish therefore:
𝐵𝐼𝐷 = 0%
𝑃𝑅𝐸𝑀𝐼𝑈𝑀 = 0%
𝑃𝑅𝐸𝑆𝑆 = 0%
To compute the measure based on share prices, associated to the variable
SHAREPRICE, we collect data on historical share prices of the competitors around the date of
the LBO announcement. Because of the time constraint, we only consider in this paper the three
competitors that we study in the previous subparts. We present the share prices in the
appendices. The announcement date of the LBO is July 3rd, 2007. We compute for each of the
three competitors an average of four trading days before the announcement and after the
announcement. We then compare the average to get the stock price evolution. We obtain +6.7%
for the Marriott group, +7.7% for the Starwood group and +5.1% for the choice group. We take
the average of the three impacts and establish:
𝑆𝐻𝐴𝑅𝐸𝑃𝑅𝐼𝐶𝐸 = +6.5%
110
Threat awareness
Threat awareness is the third driver of value that we introduce for the party of
competitors. The recommended measure associated consists in observing the speed of the
reaction of competitors. Their decisions, faced with the LBO, can be either a reaction per se or
a standstill. We present in Section II several tools to identify the decision date. However, the
economic crisis can be a hurdle to determining the decision date, as it occurs shortly after the
LBO and originates a negative impact on the competitors’ performance. If the decision date
occurs very quickly after the announcement, we may be able to identify it before the effects of
the crisis arise.
To identify the decision date of the three competitors, we observe the press releases
published shortly after the LBO announcement. We assume that beyond November the
consequences of the crisis begin to occur, and that the LBO has no influence anymore. The
press releases of the Choice group do not go back to before 2012, so we are unable to collect
the required data. Starwood Hotels released one piece of news on August 8th, 2007, stating a
new strategic partnership with a marketing firm. Finally, Marriott International does not publish
any relevant press release within this period. The other tools at hand to identify the decision
date do not apply here, since the short length of the time lap does not enable to compare
performances or working conditions. We resort to the press release of the Starwood group,
published 36 days after the announcement. It yields a ratio of 1.5% over the 2,355 days of the
life of the LBO9. We then establish:
𝑆𝑃𝐸𝐸𝐷 = +1.5%
We note that this measure, because of the economic context, is not very relevant to this
case study. We can therefore apply a low coefficient to its variable in the final utility function.
Finally, we consider the TIMING variable, which reflects the timing of the decision date. If the
afterward performance is poorer, it is said to be a wrong timing, and the variable takes the value
-1. Otherwise, it takes the value 1. Here, the crisis does not allow to measure the impact of a
decision date on a standalone basis. We can however look at the rankings of the eight players,
though there is a correlation with the impact of the market share. All three of them either keep
the same rank or move upwards, along with Hilton Hotels. Overall, the submarket of the eight
players grow at a higher rate by rooms than the forecasts, despite the crisis. We assume that this
performance is due to the LBO, if not to the crisis. We have then:
𝑇𝐼𝑀𝐼𝑁𝐺 = +1
9 Computed over July 3rd, 2007 to December 13th, 2013
111
4) Blackstone
We apply here to this case study the recommended set of measure for the party of the
PE Fund. It is composed of six measures, enabling to assess the three identified drivers of value
creation.
Financial return
The first recommended measure is the IRR, which is the most famous indicator by
Private Equity practitioners. To compute it, we need to have the amount of equity invested by
Blackstone at entry and its gain at exit. Both data are extracted from the Phalippou case study
(2014.) In mid-2007, the Fund invests approximately USD 5.7bn in equity for the purchase of
the Hilton Hotels Corporation, which accounts for roughly one fifth of the transaction price. At
the end of 2013, following the IPO of the company, Blackstone records a net gain of USD
8.5bn. We derive from this net gain the gross capital perceived by the Fund, which equals USD
14.2bn. We consider the life of the LBO to be six years and a half10, and we get an Internal Rate
of Return of 15.1%, for a 2.5x Cash On Cash multiple. We establish then the following variable:
𝐼𝑅𝑅 = +15.1%
This level of IRR is higher than the historical average at that time, around 12.2% over
the period between 1987 and 2006 (Phalippou, 2014). We note that this gain is however
unrealized for Blackstone. Indeed, the Fund did not sell the totality of its shares, due to a lock-
up period and its expectations over the price increase. If we deem that the unrealized
characteristic of the gain is equivalent to a discount on it, we can apply a lower coefficient to
the variable in the value creation.
Reputation
The second driver of value that we identify is the reputation of the Fund. As per our
framework, the recipients considered here are the LPs and the trade partners. The employees
and the potential candidates are considered in the third driver of value, the attraction of skilled
team members. We focus first on the investors; the measure associated to this driver is the LPs
10 From mid-2007 to the end of 2013
112
turnover between the fundraising following exit and that preceding entry, compared to an
historical average. The measure is represented by the variable LPTURN.
We note that one of the biases of this measure is the fact that it does not enable to clearly
measure the impact of one LBO in particular, but rather of a batch of investments. The Hilton
case study does not however give rise to such bias, as it is considered one of the most successful
for the Fund. Because of its size, its outcome and the economic context surrounding it, it is the
LBO operation which has been the most visible in the Fund’s investment wave. Hence, we
assume that the turnover of LPs is greatly influenced by this LBO is particular within the fund
raised.
To compute the measure, we collect the number of LPs involved in the fundraising prior
the LBO that commit again to the following one. In parallel, we compute the historical average,
by doing the same computation on two or three previous fundraisings. As Blackstone is a large
Fund with an extensive background in real estate investments, we have various similar
investment waves at hand to compute the historical average. We report below the exhaustive
list of real estate funds raised by the Fund from 1994 to 2016, in the series of The Blackstone
Real Estate Partners funds11. Unfortunately, there are no public list of all the LPs which commit
to one of Blackstone funds. Due to the size of the PE Fund, there many investors, and we are
unable to track them individually.
Our recommendation is therefore to collect the size of the real estate funds raised by
Blackstone, and to compute the average historical growth of the funds up until the Blackstone
Real Estate Partners VI fund, raised in 2007, which contributed to the purchase of the Hilton
Hotels Corporation. In parallel, we compute the growth between this last fund and the one raised
after exit. Hence, we do not consider the Blackstone Real Estate Partners VII fund, as it raised
in 2012, during the LBO. We assume that it is not driven by the performance of the Hilton LBO,
since the LBO was not exited yet. The main driver of the amount of funds raised by Blackstone
in 2012 is rather the impact of the crisis, which daunt potential investors to commit to a real
estate fund. The first fund that the LBO may influence is that raised one year after exit, in the
beginning of 2015.
If the growth of the funds raised after exit is above the historical one over a decade, we
assume that it is due to the success of the Hilton Hotels LBO. Based on the list of Blackstone
Real Estate Partners funds, raised between 1994 and 2015, we obtain a historical average
growth rate of 93.5% across fundraisings up until 2007. The growth is computed across batches,
not taking into account the years between fundraisings. Similarly, we obtain an average growth
of 45.5% between the 2015 fund and the Blackstone Real Estate Partners VI in 2007. We note
that the average growth overweighs the growth of funds between 1994 and 1996, mainly due to
11 The Hilton acquisition was financed both by Blackstone Capital Partners V and Blackstone Real Estate
Partners VI
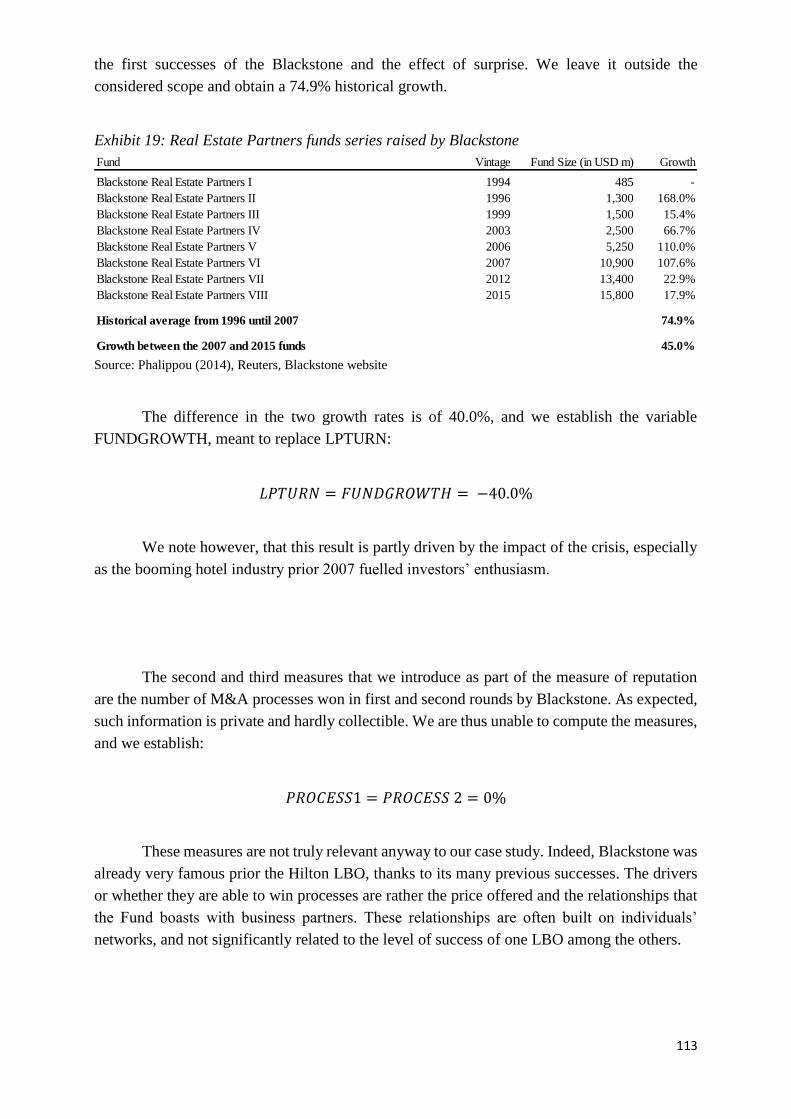
113
the first successes of the Blackstone and the effect of surprise. We leave it outside the
considered scope and obtain a 74.9% historical growth.
Exhibit 19: Real Estate Partners funds series raised by Blackstone
Source: Phalippou (2014), Reuters, Blackstone website
The difference in the two growth rates is of 40.0%, and we establish the variable
FUNDGROWTH, meant to replace LPTURN:
𝐿𝑃𝑇𝑈𝑅𝑁 = 𝐹𝑈𝑁𝐷𝐺𝑅𝑂𝑊𝑇𝐻 = −40.0%
We note however, that this result is partly driven by the impact of the crisis, especially
as the booming hotel industry prior 2007 fuelled investors’ enthusiasm.
The second and third measures that we introduce as part of the measure of reputation
are the number of M&A processes won in first and second rounds by Blackstone. As expected,
such information is private and hardly collectible. We are thus unable to compute the measures,
and we establish:
𝑃𝑅𝑂𝐶𝐸𝑆𝑆1 = 𝑃𝑅𝑂𝐶𝐸𝑆𝑆 2 = 0%
These measures are not truly relevant anyway to our case study. Indeed, Blackstone was
already very famous prior the Hilton LBO, thanks to its many previous successes. The drivers
or whether they are able to win processes are rather the price offered and the relationships that
the Fund boasts with business partners. These relationships are often built on individuals’
networks, and not significantly related to the level of success of one LBO among the others.
Fund Vintage Fund Size (in USD m) Growth
Blackstone Real Estate Partners I 1994 485 -
Blackstone Real Estate Partners II 1996 1,300 168.0%
Blackstone Real Estate Partners III 1999 1,500 15.4%
Blackstone Real Estate Partners IV 2003 2,500 66.7%
Blackstone Real Estate Partners V 2006 5,250 110.0%
Blackstone Real Estate Partners VI 2007 10,900 107.6%
Blackstone Real Estate Partners VII 2012 13,400 22.9%
Blackstone Real Estate Partners VIII 2015 15,800 17.9%
Historical average from 1996 until 2007 74.9%
Growth between the 2007 and 2015 funds 45.0%
114
We thus turn to one of the proxy measures introduced, associated to the variable PRESS:
the observation of publications, which measures the change in ratios of positive articles against
negative articles. To that end, we use the Factiva database, and collect the articles published on
the Fund. Our research sets the language and company parameters on the English language and
the Blackstone Group. We conduct first the research over a period of one month before the LBO
announcement. The search yields a sum of 1,173 results. Faced with this high amount of
publications, we reduce the scope of the period to two weeks. The research then yields 829
results. When going over the articles, we encounter a bias, which consists in the type of articles.
Indeed, most of the articles published are neutral and relate facts on the Fund, such as
acquisitions. We need also to remove the articles published twice in different journals. Finally,
the rest of articles deals mainly with the recent IPO of the Fund, and elaborates on its share
price. It becomes therefore tricky to distinguish positive from negative articles. In order for this
measure to be relevant in this case study, we need to study a larger base of articles and sort
them.
We leave to further studies the possibility to introduce alternatives measures better
adapted to this case study. Our recommendation is to create a new proxy variable, BROKER,
which measures the evolution of brokers recommendations over the stock of Blackstone. Since
the Fund went public shortly before the LBO announcement, we are able to collect brokers
reports. We look at the behaviour recommended in the notes, i.e. either BUY, HOLD or SELL,
rather than the target share prices, so as to avoid accounting for structural price changes between
entry and exit. This measure reflects brokers’ impression of the group, and hence gives a proxy
of the reputation. We assume that the recommendations after exit occur after the announcement
of record profits for the Fund, and hence take into account the rise of the share price. If a broker
recommends to buy the Blackstone stock, though the share price already has increased due to
Hilton’s successful IPO, it is likely that they believe the stock to increase further due to future
successes. It gives therefore an idea of the broker’s belief over Blackstone future processes and
investments, as a proxy of the PROCESS1 and PROCESS2 variables.
The last measure that we recommend in Section II relative to the reputation is directed
towards advisors. We collect the rankings of the Fund’s advisors in its M&A processes, and
compare them between exit and entry. As for the previous measures based on M&A
transactions, we need here to have access to M&A databases, in order to identify all of
Blackstone’s deals and compute an average. We are unfortunately unable to access such
information. Therefore, we track some of Blackstone’s deals in the press and on the internet to
collect mandated advisors. We compare rankings at entry of the respective transactions, rather
than at exit. First, because most of the deals closed after the Hilton LBO exit are not exited
themselves yet. Second, the exit of the Hilton LBO was done through an IPO, which requires
different skills than classic M&A transactions.
To that end, we collect data on Blackstone’s real estate portfolio. Blackstone currently
displays on its website three stakes in the hotel industry: a remaining share of Hilton
115
Worldwide, the Motel 6 chain and the Cosmopolitan complex in Las Vegas. The Motel 6 chain
is similar to the Hilton Hotels in the sense that it is a hotel group with several properties.
However, it is positioned on a lower scale segment than the Hilton Hotels, and was purchased
in May 2012, that is before the exit IPO. We are left with the Cosmopolitan resort. It is a single
hotel, but positioned on the luxury segment. On top of it, Blackstone invested in it in December
2014, one year after the exit IPO.
Now that we have the two comparable transactions, i.e. the purchase of the Hilton Hotels
and that of the Cosmopolitan hotel, we look for Blackstone’s mandated advisors in each
process. Unfortunately, we are unable to collect information on advisors in the process without
access to M&A databases. Therefore, we establish:
𝐴𝐷𝑉𝐼𝑆𝑂𝑅 = 0%
This driver is however negligible for the case study. Both before and after the LBO, the
Blackstone group is perceived as one of the very best in the Private Equity industry. In both
periods the Fund is likely to have mandated advisors belonging the top three or four investment
banks in the world.
Attraction of talents
The last driver of value for the party of the PE Fund that we introduce is the power of
attraction of skilled staff. It is associated to the variable EMPLOYER, which measures the
rankings of the Fund’s employees’ previous employers. We collect to that end data on
Blackstone’s employees in the Real Estate department. There are more than 380 professionals
around the world. Only the more senior members are reported on Blackstone’s website. We
limit the research scope to the approximately twenty senior managers. We divide them into
three categories, according to the date they join Blackstone. We present in the appendices the
list of these employees and their career paths, provided that they were employed in another firm
than Blackstone. We then attribute ranks to these previous employers, based on two rankings.
We use an Investment Banking league table12 and a ranking of Real Estate PE Funds13. The
average rank for the joining period before 2007 is 5.6. It equals 6.8 for the period after 2013
and 4.5 in between.
12 Dealogic, 2016 13 PERE 50, 2013

116
We note that this measure incorporates a chronological bias, since we use the same
rankings for comparing three different time periods. A more extensive study of a larger
employee base with yearly rankings can lead more accurate results.
We assume that senior managers hired for the period between 2007 and 2013 were not
influenced in their decisions by the LBO. Hence, we compare the average rank after 2013 with
the average of the two average rank for the preceding periods. This represents an increase of
34.0%, and we establish:
𝐸𝑀𝑃𝐿𝑂𝑌𝐸𝑅 = -34.0%
117
C – Analysis of results
In the previous part, we apply our recommended framework to each of the four parties
considered. Within the sets, we compute each measure and obtain a single result per variable.
Throughout the case study, we encountered two main difficulties. First, the economic context
was unusual for this LBO operation. The crisis that hit the industry was particularly severe. As
a result, most of the players in the hotel industry experienced difficult times.
Some of our measures were not adapted to unexpected shocks. This is one of the reasons
for which we chose to study the Hilton Hotels LBO. As many measures are built on comparisons
between entry and exit, they incorporate the unanticipated effects of the crisis. The same goes
for measures comparing realized aggregates and forecasts. For example, the economic recession
pulled the Hilton Hotels performance downwards, below the level of their forecasts. Should the
company not have been under LBO, it would still have suffered this impact. Hence, our measure
attributes to the LBO a difference with the forecasts actually originated by the crisis. We
propose, when required, adjustments to these measures to avoid overweighing the impact of the
LBO. In most cases we neutralize the effects of the crisis by adjusting the result from the
average of the industry. This adjustment methodology, compared to the industry, is not
incorporated in our original framework. We can apply it on a general basis for every case study.
However, in regular economic times, there are not specifically required.
The second difficulty that we experience in the case study is the access to information.
Though the Hilton Hotels Corporation was listed before the LBO and relisted afterwards, we
are unable to collect the required pieces of information at several times. We then resort to proxy
measures, which are less accurate but easier to implement. We sometimes even cannot find the
relevant data for computing the proxy measures. In such cases, we either introduce another level
of proxy measures or apply the value zero to the variable. Conversely, it happens that we are
faced with an overwhelming amount of information. Like for the lack of information, we resort
to proxy measures.
Among the measures that we are able to compute, some are based from a small amount
of information. We are indeed able to collect only a portion of the data needed. A more
extensive work, with an access to the various databases, can be conducted in order to get more
accurate results. The goal of this case study is however to show an application of our
framework, rather than obtain exact results.
Now that we have computed each measure individually, we combine them into the
utility functions to be able to compare value creation across parties.
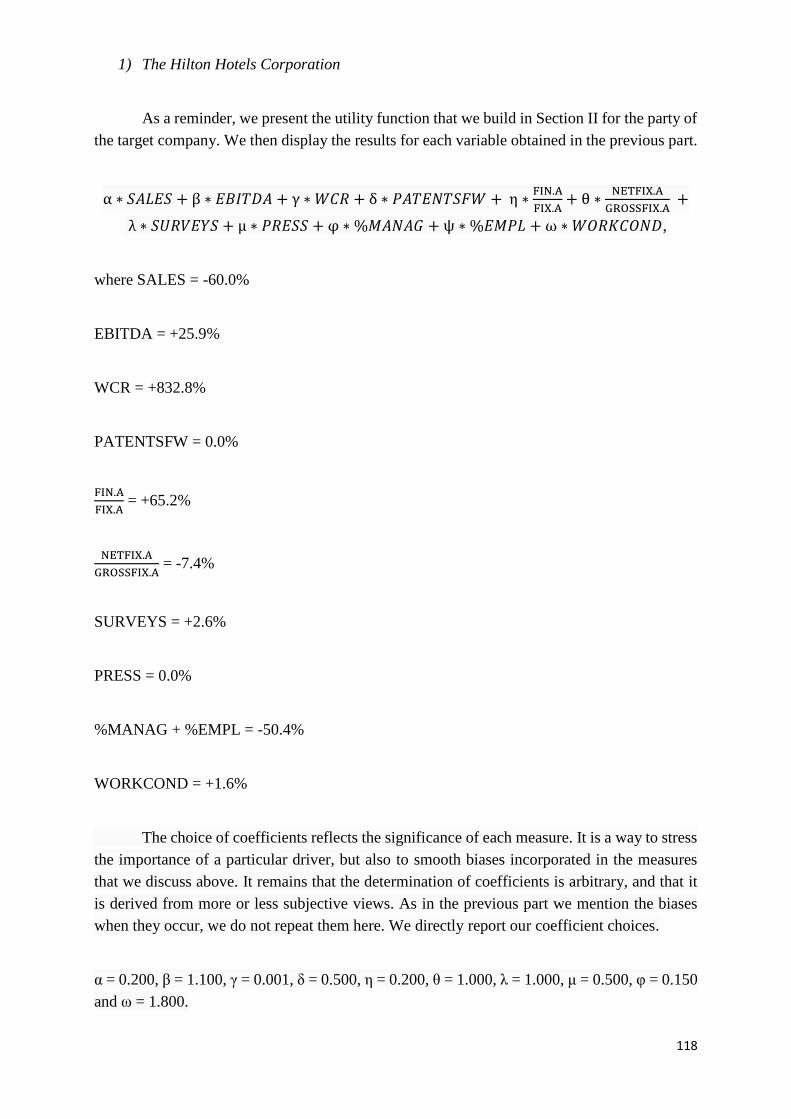
118
1) The Hilton Hotels Corporation
As a reminder, we present the utility function that we build in Section II for the party of
the target company. We then display the results for each variable obtained in the previous part.
α ∗ 𝑆𝐴𝐿𝐸𝑆 + β ∗ 𝐸𝐵𝐼𝑇𝐷𝐴 + γ ∗ 𝑊𝐶𝑅 + δ ∗ 𝑃𝐴𝑇𝐸𝑁𝑇𝑆𝐹𝑊 + η ∗FIN.A
FIX.A+ θ ∗
NETFIX.A
GROSSFIX.A +
λ ∗ 𝑆𝑈𝑅𝑉𝐸𝑌𝑆 + μ ∗ 𝑃𝑅𝐸𝑆𝑆 + φ ∗ %𝑀𝐴𝑁𝐴𝐺 + ψ ∗ %𝐸𝑀𝑃𝐿 + ω ∗ 𝑊𝑂𝑅𝐾𝐶𝑂𝑁𝐷,
where SALES = -60.0%
EBITDA = +25.9%
WCR = +832.8%
PATENTSFW = 0.0%
FIN.A
FIX.A = +65.2%
NETFIX.A
GROSSFIX.A = -7.4%
SURVEYS = +2.6%
PRESS = 0.0%
%MANAG + %EMPL = -50.4%
WORKCOND = +1.6%
The choice of coefficients reflects the significance of each measure. It is a way to stress
the importance of a particular driver, but also to smooth biases incorporated in the measures
that we discuss above. It remains that the determination of coefficients is arbitrary, and that it
is derived from more or less subjective views. As in the previous part we mention the biases
when they occur, we do not repeat them here. We directly report our coefficient choices.
α = 0.200, β = 1.100, γ = 0.001, δ = 0.500, η = 0.200, θ = 1.000, λ = 1.000, μ = 0.500, φ = 0.150
and ω = 1.800.
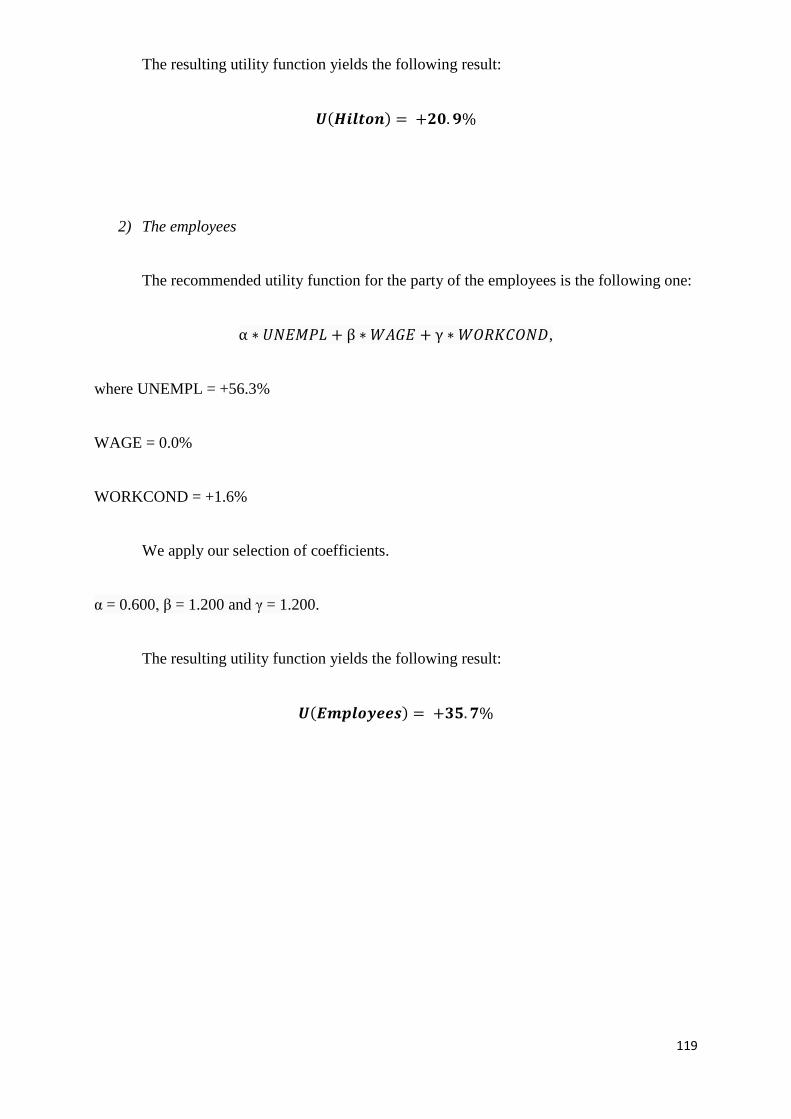
119
The resulting utility function yields the following result:
𝑼(𝑯𝒊𝒍𝒕𝒐𝒏) = +𝟐𝟎. 𝟗%
2) The employees
The recommended utility function for the party of the employees is the following one:
α ∗ 𝑈𝑁𝐸𝑀𝑃𝐿 + β ∗ 𝑊𝐴𝐺𝐸 + γ ∗ 𝑊𝑂𝑅𝐾𝐶𝑂𝑁𝐷,
where UNEMPL = +56.3%
WAGE = 0.0%
WORKCOND = +1.6%
We apply our selection of coefficients.
α = 0.600, β = 1.200 and γ = 1.200.
The resulting utility function yields the following result:
𝑼(𝑬𝒎𝒑𝒍𝒐𝒚𝒆𝒆𝒔) = +𝟑𝟓. 𝟕%

120
3) The competitors
As for the previous two parties, we recall the utility function built in Section II for the
party of the competitors, and we apply afterwards our selection of coefficients:
α ∗ 𝑀𝐴𝑅𝐾𝐸𝑇𝑆𝐻 + α′ ∗ 𝐶𝑂𝑁𝐶𝐸𝑁𝑇𝑅𝐴𝑇𝐼𝑂𝑁 + β ∗ [𝑃𝑅𝑂𝐵𝐷𝐸𝐹 𝑥 𝑆𝐴𝐿𝐸𝑆𝑂𝑃𝐶𝑂] ∗
𝑟𝑒𝑐𝑜𝑣𝑒𝑟𝑦 + γ ∗ 𝑆𝐻𝐴𝑅𝐸𝑃𝑅𝐼𝐶𝐸 + δ ∗ 𝐵𝐼𝐷 + η ∗ 𝑃𝑅𝐸𝑀𝐼𝑈𝑀 + θ ∗ PRESS + λ ∗ 𝑆𝑃𝐸𝐸𝐷 ∗
𝑇𝐼𝑀𝐼𝑁𝐺,
where MARKETSH = +3.4%
CONCENTRATION = -66.4%
PROBDEF x SALESOPCO = +29.2%
recovery = 90.0%
SHAREPRICE = +6.5%
BID = 0.0%
PREMIUM = 0.0%
PRESS = 0.0%
SPEED = +1.5%
TIMING = 1.0
α = 1.500, α’ = 0.005, β = 0.800, γ = 1.100, δ = 1.100, η = 1.000, θ = 0.700 and λ = 1.000.
The resulting utility function yields the following result:
𝑼(𝑪𝒐𝒎𝒑𝒆𝒕𝒊𝒕𝒐𝒓𝒔) = +𝟑𝟒. 𝟒%
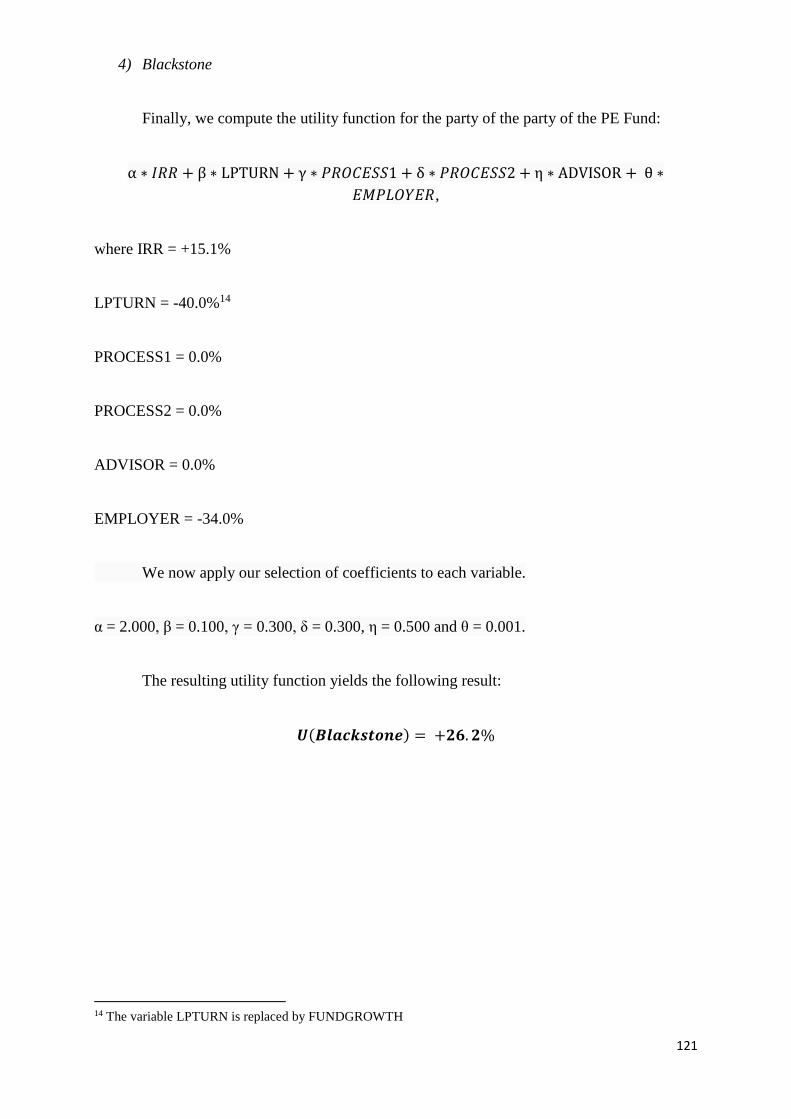
121
4) Blackstone
Finally, we compute the utility function for the party of the party of the PE Fund:
α ∗ 𝐼𝑅𝑅 + β ∗ LPTURN + γ ∗ 𝑃𝑅𝑂𝐶𝐸𝑆𝑆1 + δ ∗ 𝑃𝑅𝑂𝐶𝐸𝑆𝑆2 + η ∗ ADVISOR + θ ∗
𝐸𝑀𝑃𝐿𝑂𝑌𝐸𝑅,
where IRR = +15.1%
LPTURN = -40.0%14
PROCESS1 = 0.0%
PROCESS2 = 0.0%
ADVISOR = 0.0%
EMPLOYER = -34.0%
We now apply our selection of coefficients to each variable.
α = 2.000, β = 0.100, γ = 0.300, δ = 0.300, η = 0.500 and θ = 0.001.
The resulting utility function yields the following result:
𝑼(𝑩𝒍𝒂𝒄𝒌𝒔𝒕𝒐𝒏𝒆) = +𝟐𝟔. 𝟐%
14 The variable LPTURN is replaced by FUNDGROWTH
122
We have computed the utility functions for each party in this case study. The winners,
with +35.7% and +34.4% respectively, are the party of the employees and that of competitors.
Conversely, the party of the PE Fund and that of the target company, though they gain value
through the LBO, gain less than the first two parties. This hierarchy is rather counterintuitive,
especially regarding the PE Fund and the employees, as we would expect roles to be the
opposite.
The situation of the employees is justified by the fact that, overall, they experienced a
decrease in their unemployment risk and an increase in the quality of their working conditions,
while in the context of a crisis. Their situation prior LBO improves far more than that of the
competitors’ employees. Hence, the LBO, contrary to the competitors, helps them surviving the
crisis.
The improvement of the competitors’ situation is mainly due to the increase in the
probability of default of the Hilton Hotel Corporation. This increase represents a potential
benefit for the competitors, all the more since the target company has grown in size. However,
this probability is partly due to the effects of the crisis rather than to the LBO. On top of this,
competitors’ market shares experience an increase due to the LBO because of the forecasts of
the Hilton Hotels which were too optimistic prior the crisis, i.e. of a 7.0% growth in room
numbers compared to 2.5% for the industry forecasts. Hence, the fact that the party of
competitors stands among the winners is less logical than for the party of employees; it mostly
due to the ways measures are built.
We try to use the leverage of coefficients to reduce the various biases and overlaps
present in the sets of measures. However, we need to keep in mind that these results are based
on an arbitrary selection of coefficients. We leave to further study the possibility to develop a
more accurate and adapted system of coefficient determination.
123
Conclusion
This paper aims at introducing a new approach for the study of value creation. It
provides tools for measuring value creation in a particular LBO case study. We go beyond the
classical measures of value, mostly quantitative, and incorporate measures of a more qualitative
nature. Once all the drivers of value are identified, and associated with sets of measures, we
combine the single measures and build exhaustive utility functions to be able to compare the
impact of an LBO on the different stakeholders.
Our contribution consists first in identifying the different stakeholders involved in an
LBO operation. They are numerous, and we focus more precisely on four of them: the target
company, its employees, its competitors and the PE Fund. For each of the four, we determine
their life goal, that is to say their reason of existence. We are able to determine drivers of value
only if we clearly state a party’s goal. The drivers of value are composed of every aspect that
is valuable to the eye of the party. Value is said to be created for a party if, and only if, it appears
as valuable to the eye of the party itself. In other words, only if it improves the party’s ability
to achieve its life goal.
In the first section of this paper, we draw an exhaustive review of the various measures
proposed by the academic literature, regarding value creation in LBOs. We split them into two
categories: those mentioned in papers with the aim of measuring the whole value creation
originated by the LBO, and those extracted from papers that study collateral effects of LBOs.
This latter category is not produced by the research with the aim of measuring value, but rather
of focusing on a particular impact of the LBO. Our review from the Section I is quite extensive,
and gathers many different academic sources. In our documentation search, we did not come
across a piece of work reporting a similar list. In that sense, this paper contributes to creating a
simplified database of measures relative to the impact of LBOs.
The second section of this paper gathers our recommendations regarding the measure
of value creation originated by LBOs. We begin by identifying all the drivers of value for each
party considered, and we associate them with measures. Our methodology requires that
measures be independent and uncorrelated to one another. We reuse some of the measures
presented in the first section, extracted from academic papers, and we complete them with new
measures from other fields, such as occupational medicine. When we are unable to find in the
literature the relevant measures, we introduce our propositions. In parallel, we present the
notion of temporality, which refers to the type of value; a driver of value is said to be directed
at the past if the consequences of the event occur before the date of measure. Conversely, it is
directed at the future if the consequences occur after the date of measure, while the source was
originated during the life of the LBO.
We discuss the loopholes and benefits attributed to each measure, and eventually define
a set of measures for each party. Such a set is designed to include all the drivers of value for a
124
party, and the measures needed to assess them. In that sense, it is meant to be used on a
standalone basis to measure the whole value creation generated by the LBO for a party. In order
to be able to compare value created among the four parties, we combine the measures within
each set and build a utility function, which enables us to get only one result to associate to a
party.
Throughout the paper, we encounter several difficulties. Among them is the need to
stick to the scope of the party itself. For example, drivers of value must be valuable to the eye
of the target company, as an independent entity, rather than of its shareholders. Similarly, we
distinguish the sources of value from its realization. In the case of the target company, we do
not consider for instance the past investments which contribute to the realized performance.
Instead, we measure the performance itself. However, the investments realized over the life of
the LBO with results to occur after exit need to be taken into account, as they translate into
future performance. Another main difficulty is to adapt the measures proposed by the academic
literature to our framework. Typically, the measures built on a comparison between a sample
of companies under LBO and a control group need to be adapted to a single case study. Our
methodology requires to find, for each party, a series of measures that comprehensively covers
value creation, with the least overlaps possible. The difficulty consists in decomposing
measures or drivers of value when there is a too high correlation, to get more atomistic entities,
without losing a part of the exhaustive coverage. Finally, the last issue refers to the Hilton
Hotels case study, whereby a significant part of our measures need to be adapted to the context,
either due to the effects of the economic crisis or the lack of information.
This paper does not aim at being utterly complete. We leave several pending issues for
further studies to investigate, such as the choice of coefficients for the utility functions, the
remaining overlaps within the sets of measures or the endogeneity bias. Similarly, sets of
measures can be completed by other qualitative or quantitative drivers of value not considered
here or by more accurate and relevant measures for the recommended drivers of value. We also
leave aside in this paper the risk component of the party itself, which can give rise to a particular
study. Finally, as we focus on four parties, we let the possibility to follow our methodology and
to apply it on the remaining parties mentioned in Section I.
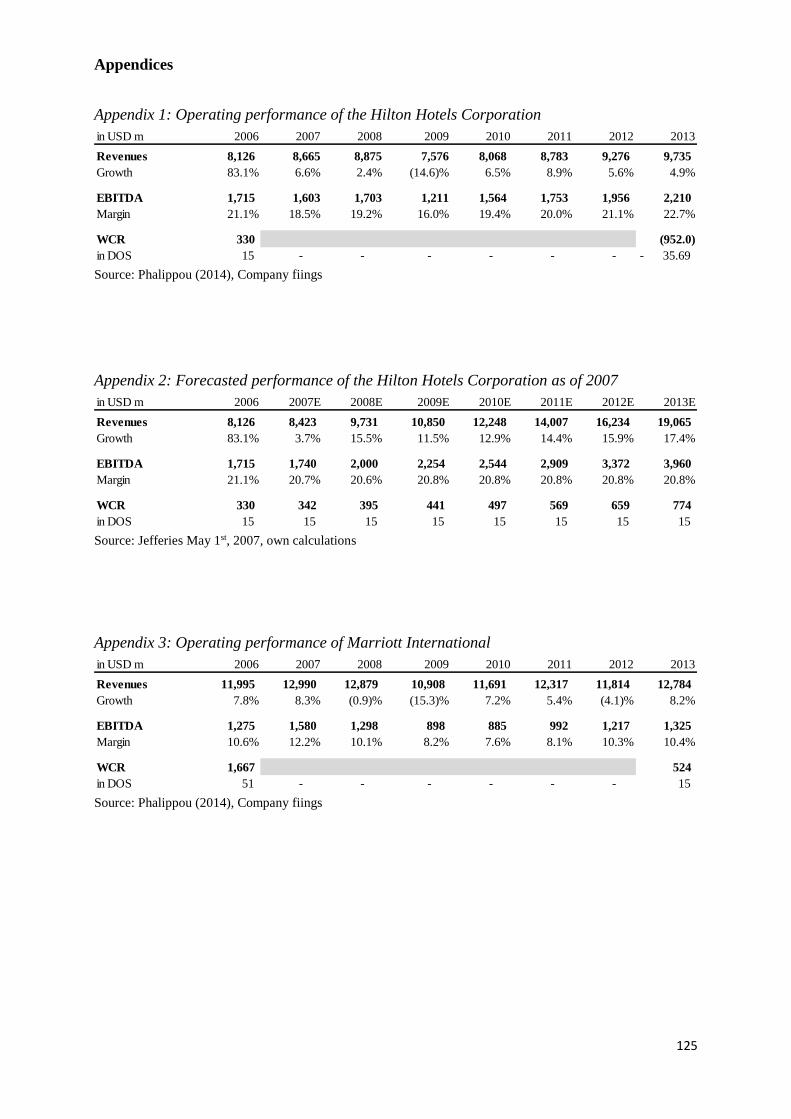
125
Appendices
Appendix 1: Operating performance of the Hilton Hotels Corporation
Source: Phalippou (2014), Company fiings
Appendix 2: Forecasted performance of the Hilton Hotels Corporation as of 2007
Source: Jefferies May 1st, 2007, own calculations
Appendix 3: Operating performance of Marriott International
Source: Phalippou (2014), Company fiings
in USD m 2006 2007 2008 2009 2010 2011 2012 2013
Revenues 8,126 8,665 8,875 7,576 8,068 8,783 9,276 9,735
Growth 83.1% 6.6% 2.4% (14.6)% 6.5% 8.9% 5.6% 4.9%
EBITDA 1,715 1,603 1,703 1,211 1,564 1,753 1,956 2,210
Margin 21.1% 18.5% 19.2% 16.0% 19.4% 20.0% 21.1% 22.7%
WCR 330 (952.0)
in DOS 15 - - - - - - 35.69-
in USD m 2006 2007E 2008E 2009E 2010E 2011E 2012E 2013E
Revenues 8,126 8,423 9,731 10,850 12,248 14,007 16,234 19,065
Growth 83.1% 3.7% 15.5% 11.5% 12.9% 14.4% 15.9% 17.4%
EBITDA 1,715 1,740 2,000 2,254 2,544 2,909 3,372 3,960
Margin 21.1% 20.7% 20.6% 20.8% 20.8% 20.8% 20.8% 20.8%
WCR 330 342 395 441 497 569 659 774
in DOS 15 15 15 15 15 15 15 15
in USD m 2006 2007 2008 2009 2010 2011 2012 2013
Revenues 11,995 12,990 12,879 10,908 11,691 12,317 11,814 12,784
Growth 7.8% 8.3% (0.9)% (15.3)% 7.2% 5.4% (4.1)% 8.2%
EBITDA 1,275 1,580 1,298 898 885 992 1,217 1,325
Margin 10.6% 12.2% 10.1% 8.2% 7.6% 8.1% 10.3% 10.4%
WCR 1,667 524
in DOS 51 - - - - - - 15
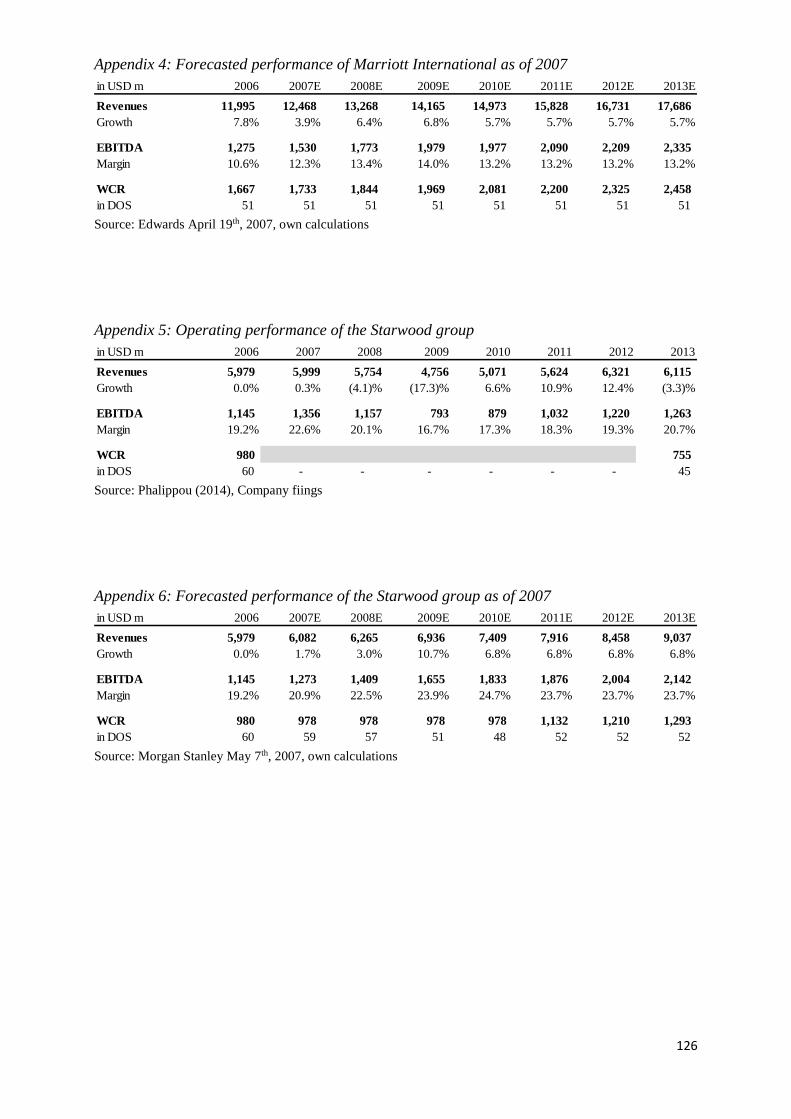
126
Appendix 4: Forecasted performance of Marriott International as of 2007
Source: Edwards April 19th, 2007, own calculations
Appendix 5: Operating performance of the Starwood group
Source: Phalippou (2014), Company fiings
Appendix 6: Forecasted performance of the Starwood group as of 2007
Source: Morgan Stanley May 7th, 2007, own calculations
in USD m 2006 2007E 2008E 2009E 2010E 2011E 2012E 2013E
Revenues 11,995 12,468 13,268 14,165 14,973 15,828 16,731 17,686
Growth 7.8% 3.9% 6.4% 6.8% 5.7% 5.7% 5.7% 5.7%
EBITDA 1,275 1,530 1,773 1,979 1,977 2,090 2,209 2,335
Margin 10.6% 12.3% 13.4% 14.0% 13.2% 13.2% 13.2% 13.2%
WCR 1,667 1,733 1,844 1,969 2,081 2,200 2,325 2,458
in DOS 51 51 51 51 51 51 51 51
in USD m 2006 2007 2008 2009 2010 2011 2012 2013
Revenues 5,979 5,999 5,754 4,756 5,071 5,624 6,321 6,115
Growth 0.0% 0.3% (4.1)% (17.3)% 6.6% 10.9% 12.4% (3.3)%
EBITDA 1,145 1,356 1,157 793 879 1,032 1,220 1,263
Margin 19.2% 22.6% 20.1% 16.7% 17.3% 18.3% 19.3% 20.7%
WCR 980 755
in DOS 60 - - - - - - 45
in USD m 2006 2007E 2008E 2009E 2010E 2011E 2012E 2013E
Revenues 5,979 6,082 6,265 6,936 7,409 7,916 8,458 9,037
Growth 0.0% 1.7% 3.0% 10.7% 6.8% 6.8% 6.8% 6.8%
EBITDA 1,145 1,273 1,409 1,655 1,833 1,876 2,004 2,142
Margin 19.2% 20.9% 22.5% 23.9% 24.7% 23.7% 23.7% 23.7%
WCR 980 978 978 978 978 1,132 1,210 1,293
in DOS 60 59 57 51 48 52 52 52
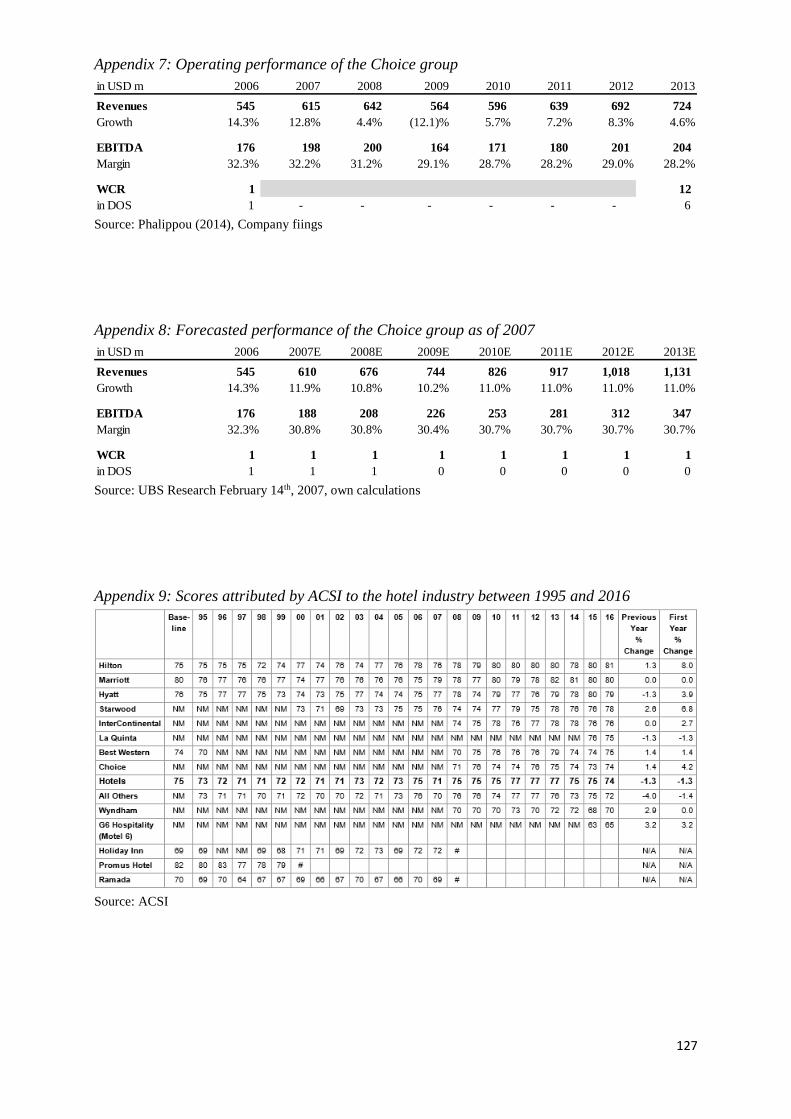
127
Appendix 7: Operating performance of the Choice group
Source: Phalippou (2014), Company fiings
Appendix 8: Forecasted performance of the Choice group as of 2007
Source: UBS Research February 14th, 2007, own calculations
Appendix 9: Scores attributed by ACSI to the hotel industry between 1995 and 2016
Source: ACSI
in USD m 2006 2007 2008 2009 2010 2011 2012 2013
Revenues 545 615 642 564 596 639 692 724
Growth 14.3% 12.8% 4.4% (12.1)% 5.7% 7.2% 8.3% 4.6%
EBITDA 176 198 200 164 171 180 201 204
Margin 32.3% 32.2% 31.2% 29.1% 28.7% 28.2% 29.0% 28.2%
WCR 1 12
in DOS 1 - - - - - - 6
in USD m 2006 2007E 2008E 2009E 2010E 2011E 2012E 2013E
Revenues 545 610 676 744 826 917 1,018 1,131
Growth 14.3% 11.9% 10.8% 10.2% 11.0% 11.0% 11.0% 11.0%
EBITDA 176 188 208 226 253 281 312 347
Margin 32.3% 30.8% 30.8% 30.4% 30.7% 30.7% 30.7% 30.7%
WCR 1 1 1 1 1 1 1 1
in DOS 1 1 1 0 0 0 0 0

128
Appendix 10: CSR indicators
Source: The United Nations Conference on Trade and Development
Group Indicator
Trade, Investment and Linkages 1 Total revenues
2 Value of imports vs. exports
3 Total new investments
4 Local purchasing
Employment Creation and Labour
Practices
5 Total workforce with breakdown by employment type,
employment contract and gender
6 Employee wages and benefits with breakdown by
employment type and gender
7 Total number and rate of employee turnover broken down
by gender
8 Percentage of employees covered by collective agreements
Technology and Human Resource
Development
9 Expenditure on research and development
10 Average hours of training per year per employee broken
down by employee category
11 Expenditure on employee training per year per employee
broken down by employee category
Health and Safety 12 Cost of employee health and safety
13 Work days lost due to occupational accidents, injuries and
illness
Government and Community
Contributions
14 Payments to the government
15 Voluntary contributions to civil society
Corruption 16 Number of convictions for violations of corruption related
laws or regulations and amount of fines paid/ payable
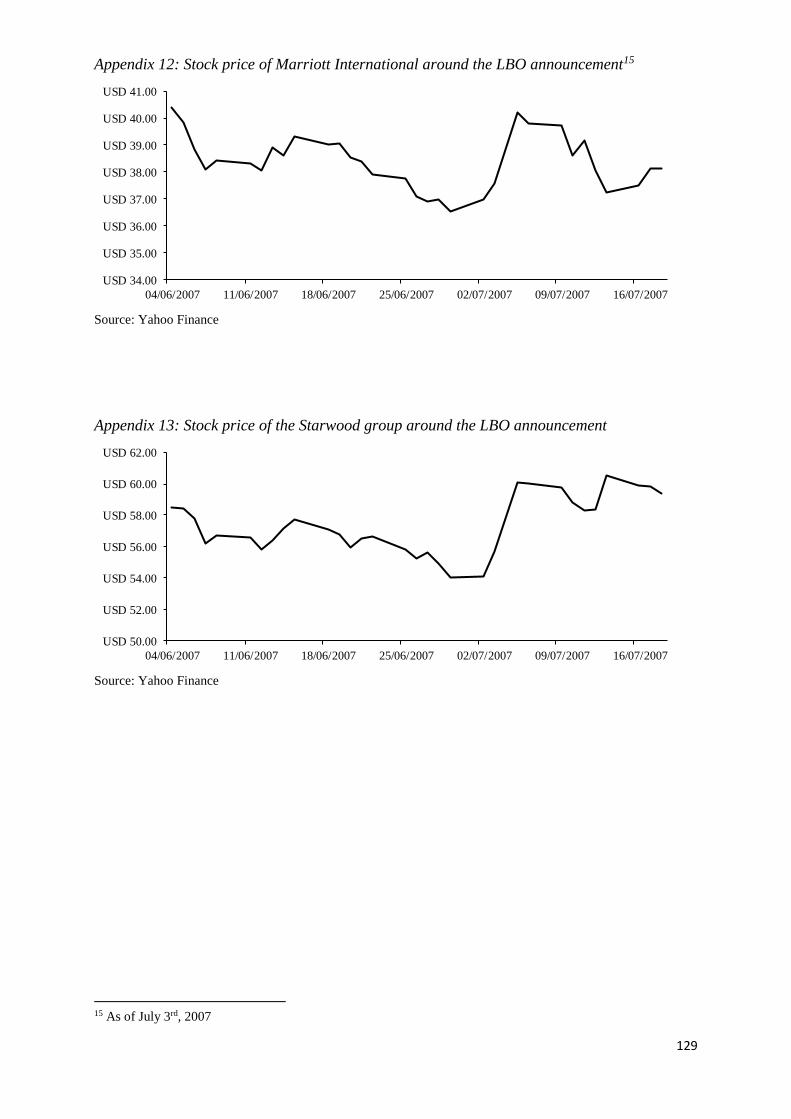
129
Appendix 12: Stock price of Marriott International around the LBO announcement15
Source: Yahoo Finance
Appendix 13: Stock price of the Starwood group around the LBO announcement
Source: Yahoo Finance
15 As of July 3rd, 2007
USD 34.00
USD 35.00
USD 36.00
USD 37.00
USD 38.00
USD 39.00
USD 40.00
USD 41.00
04/06/2007 11/06/2007 18/06/2007 25/06/2007 02/07/2007 09/07/2007 16/07/2007
USD 50.00
USD 52.00
USD 54.00
USD 56.00
USD 58.00
USD 60.00
USD 62.00
04/06/2007 11/06/2007 18/06/2007 25/06/2007 02/07/2007 09/07/2007 16/07/2007
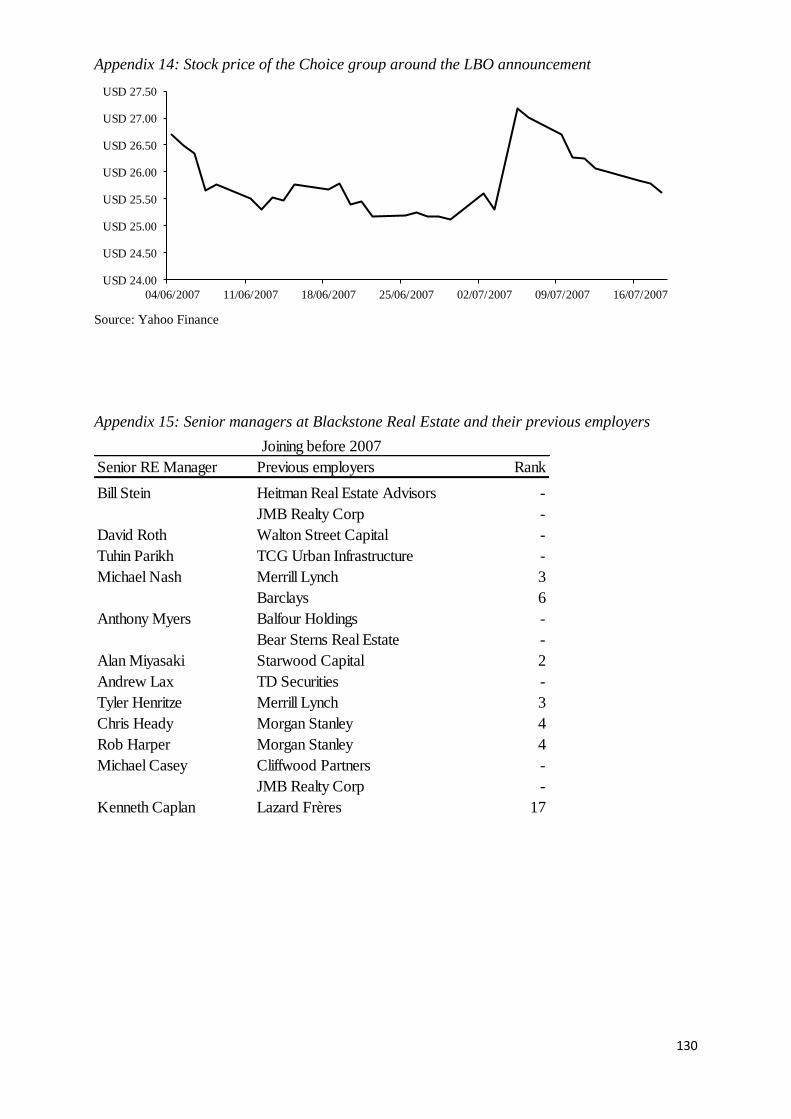
130
Appendix 14: Stock price of the Choice group around the LBO announcement
Source: Yahoo Finance
Appendix 15: Senior managers at Blackstone Real Estate and their previous employers
USD 24.00
USD 24.50
USD 25.00
USD 25.50
USD 26.00
USD 26.50
USD 27.00
USD 27.50
04/06/2007 11/06/2007 18/06/2007 25/06/2007 02/07/2007 09/07/2007 16/07/2007
Joining before 2007 Joining between 2007 and 2013
Senior RE Manager Previous employers Rank
Bill Stein Heitman Real Estate Advisors -
JMB Realty Corp -
David Roth Walton Street Capital -
Tuhin Parikh TCG Urban Infrastructure -
Michael Nash Merrill Lynch 3
Barclays 6
Anthony Myers Balfour Holdings -
Bear Sterns Real Estate -
Alan Miyasaki Starwood Capital 2
Andrew Lax TD Securities -
Tyler Henritze Merrill Lynch 3
Chris Heady Morgan Stanley 4
Rob Harper Morgan Stanley 4
Michael Casey Cliffwood Partners -
JMB Realty Corp -
Kenneth Caplan Lazard Frères 17

131
Source: Blackstone website, Dealogic, PERE 50
Joining between 2007 and 2013 Joining after 2013
Senior RE Manager Previous employers Rank
James Seppala Goldman Sachs 2
Steve Plavin Capital Trust -
Nadeem Meghji Lionstone group -
Kathleen McCarthy Goldman Sachs 2
Joshua Mason UBS 11
Merrill Lynch 3
Tim Johnson Lehman Brothers -
Joining after 2013
Senior RE Manager Previous employers Rank
Jonathan Pollack Deutsche Bank 8
Nomura 14
Giovanni Cutaia Lone Star Funds 3
Goldman Sachs 2
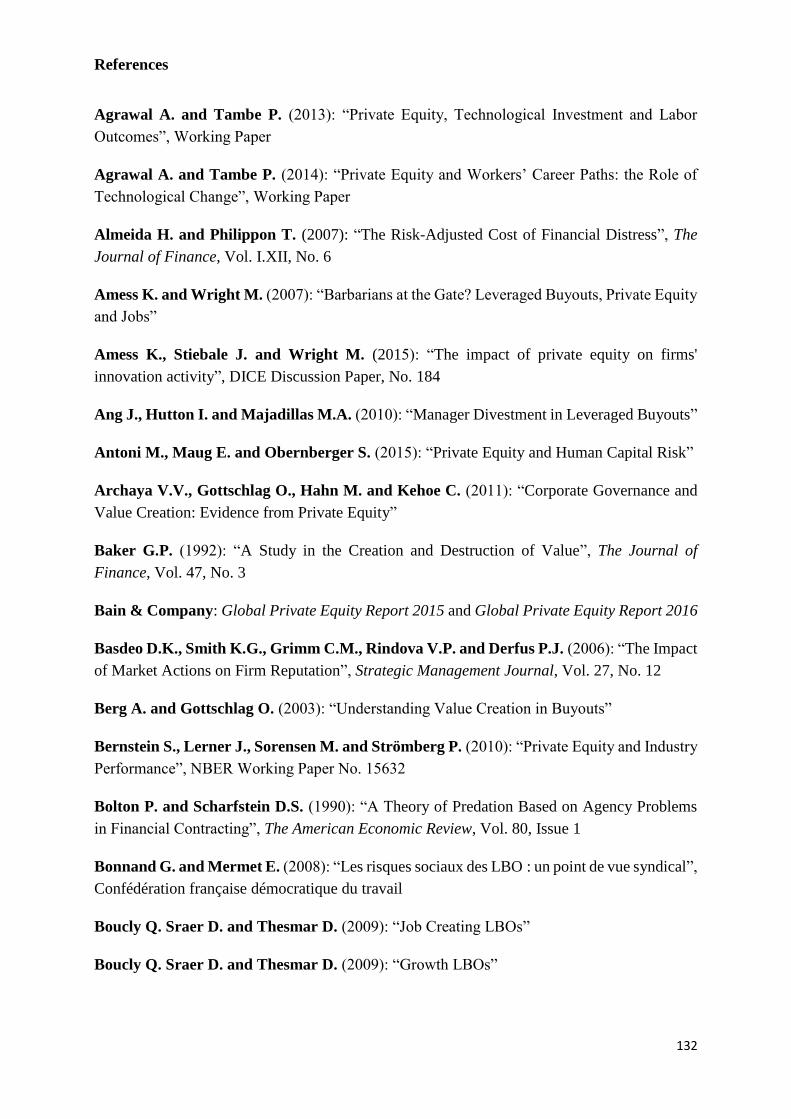
132
References
Agrawal A. and Tambe P. (2013): “Private Equity, Technological Investment and Labor
Outcomes”, Working Paper
Agrawal A. and Tambe P. (2014): “Private Equity and Workers’ Career Paths: the Role of
Technological Change”, Working Paper
Almeida H. and Philippon T. (2007): “The Risk-Adjusted Cost of Financial Distress”, The
Journal of Finance, Vol. I.XII, No. 6
Amess K. and Wright M. (2007): “Barbarians at the Gate? Leveraged Buyouts, Private Equity
and Jobs”
Amess K., Stiebale J. and Wright M. (2015): “The impact of private equity on firms'
innovation activity”, DICE Discussion Paper, No. 184
Ang J., Hutton I. and Majadillas M.A. (2010): “Manager Divestment in Leveraged Buyouts”
Antoni M., Maug E. and Obernberger S. (2015): “Private Equity and Human Capital Risk”
Archaya V.V., Gottschlag O., Hahn M. and Kehoe C. (2011): “Corporate Governance and
Value Creation: Evidence from Private Equity”
Baker G.P. (1992): “A Study in the Creation and Destruction of Value”, The Journal of
Finance, Vol. 47, No. 3
Bain & Company: Global Private Equity Report 2015 and Global Private Equity Report 2016
Basdeo D.K., Smith K.G., Grimm C.M., Rindova V.P. and Derfus P.J. (2006): “The Impact
of Market Actions on Firm Reputation”, Strategic Management Journal, Vol. 27, No. 12
Berg A. and Gottschlag O. (2003): “Understanding Value Creation in Buyouts”
Bernstein S., Lerner J., Sorensen M. and Strömberg P. (2010): “Private Equity and Industry
Performance”, NBER Working Paper No. 15632
Bolton P. and Scharfstein D.S. (1990): “A Theory of Predation Based on Agency Problems
in Financial Contracting”, The American Economic Review, Vol. 80, Issue 1
Bonnand G. and Mermet E. (2008): “Les risques sociaux des LBO : un point de vue syndical”,
Confédération française démocratique du travail
Boucly Q. Sraer D. and Thesmar D. (2009): “Job Creating LBOs”
Boucly Q. Sraer D. and Thesmar D. (2009): “Growth LBOs”
133
Brown D.T., Fee C.E. and Thomas S.E. (2008): “Financial leverage and bargaining power
with suppliers: evidence from leveraged buyouts”, Draft
Bruining H. and Wright M. (2002): “Entrepreneurial Orientation in Management Buy-Outs
and the Contribution of Venture Capital”
Bruining H., Bonnet M. and Wright M. (2002): “Management Control Systems and Strategy
Change in Buyouts”
Bruining H., and Verwaal E. (2005): “Successful management buyouts: Are they really more
entrepreneurial?”
Bureau of the Census (1995): “Do LBO’s Profit After R&D Cuts?”, SB/95-14
Cai H. and Obara I. (2009): “Firm Reputation and Horizontal Integration”, The RAND Journal
of Economics, Vol. 40, No. 2
Cain M. and Davidoff S.M. (2010): “Form Over Substance? The Value of Corporate Process
and Management Buy-outs”
Cao J. and Lerner J. (2006): “The Performance of Reverse Leveraged Buyouts”
Capizzi V., Giovannini R. and Pesic V. (2013): “Risks and Perils in LBO transactions”
Chen K., Kim Y-C. and Marcus R.D. (2009): “Hands in the Cookie Jar?: The Case of
Management Buyouts”
Chu Y. (2014): “A review of studies on luxury hotels over the past two decades”
Chun K.H. (2010): “Whose Interests Should the Managers Serve?: Insights from Recent
Korean Cases on LBO Transactions”
Damodaran A. (2007): “The Anatomy of an LBO: Leverage, Control and Value”, derived from
a presentation made at the AIMR Equity Research and Valuation Techniques conference held
in Los Angeles on 4–5 December 2007
DARES Analyses (2010, 2015 and 2016): “LES RISQUES PSYCHOSOCIAUX AU
TRAVAIL: les indicateurs disponibles”, No. 81, 44 and 004
Davis S.J., Haltiwanger J.C., Jarmin R.S., Lerner J. and Miranda J. (2011): “Private
Equity and Employment”, NBER Working Paper Series, No. 17399
Dealogic (2013): Investment Banking rankings
Desbrières P. and Schatt A. (1995): “The Impact of LBOs on Investment Policies and
Operations of Acquired French Firms”
134
Douillet P., Grandjacques B. and Fournier P-S. (2014): “L’ÉVALUATION DES
DÉMARCHES DE PRÉVENTION DES RISQUES PSYCHOSOCIAUX EN ENTREPRISE :
Repères issus d’expériences d’entreprises de conduite de projets d’auto-évaluation paritaires”,
ANACT and Université Laval
Espen Eckbo B. and Thorburn K.S. (2008): “Corporate Restructuring: Breakups and LBOs”,
Working Paper No. 2008-49
Evers F. (2012): “Value Creation and Drivers of Secondary Buyouts in France”
Ferguson T.D., Deephouse D.L. and Ferguson W.L. (2000): “Do Strategic Groups Differ in
Reputation?”, Strategic Management Journal, Vol. 21, No. 12
Fischer P.E. and Louis H. (2008): “Financial reporting and conflicting managerial incentives:
The case of management buyouts”
Forbes (2015): “America’s Best Employers”
Fortune (from 2006 to 2016): “100 best companies to work for”
Fox I. and Marcus A. (1992): “The Causes and Consequences of Leveraged Management
Buyouts”, The Academy of Management Review, Vol. 17, No. 1
Frontier Economic (2013): “Exploring the impact of private equity on economic growth in
Europe”, EVCA
Gambardella A. (2008): “Of Intellectual Property, Open Source and Innovation: Trends, and
Some Opportunities for Italy”
Gerretsen M. (2004): “Les LBO sont-ils créateurs de valeur ?”, Echanges, No. 211
Gollac M. (2009): “Indicateurs provisoires de facteurs de risques psychosociaux au travail”,
DARES and DREES
Graham J.R. (2000): “How Big Are the Tax Benefits of Debt?”, The Journal of Finance, Vol.
4, No. 5
Grinstein Y. (2005): “The Disciplinary Role of Debt and Equity Contracts: Theory and Tests”,
Johnson School Research Paper Series #26-06
Gonzalez-Uribe J. (2012): “Venture Capital and the Diffusion of Knowledge”
Grupp M., Rauch C. Umber M. and Walz U. (2015): “The influence of leveraged buyouts
on target firms' competitors”, SAFE Working Paper Series, No. 99
Guo S., Hotchkiss E.S. and Song W. (2011): “Do Buyouts (Still) Create Value?”, The Journal
of Finance, Vol. I.XVI, No. 2
135
Hagedoorn J. and Cloodt M. (2002): “Measuring innovative performance: is there an
advantage in using multiple indicators?”, NH Elsevier, Research Policy 32 (2003) 1365–1379
Hege U. and Hennessy C. (2007): “Acquisition Values and Optimal Financial (In)Flexibility”
Herst A.C.C. and Hommelberg R.J.R. (2002): “The Risks and Returns of Management Buy-
Outs”
Hotel Online (2007): “The 2006 World Ranking; 10 Largest Hotel Groups and 20 Largest
Brands”
Hsu H-C., Reed A.V. and Rocholl J. (2011): “Competitive Effects of Private Equity
Investments”
Institut National de Recherche et de Sécurité (2010) : “Dépister les risques psychosociaux :
des indicateurs pour vous guider”
Institut National de Recherche et de Sécurité (2011) : “Les questionnaires dans la démarche
de prévention du stress au travail”
Jensen M.C. and Meckling W.H. (1976): “Theory of the Firm: Managerial Behavior, Agency
Costs and Ownership Structure”, Journal of Financial Economics, Vol. 3 No. 4
Jensen M.C. (1986): “Agency Costs of Free Cash Flow, Corporate Finance, and Takeovers”,
The American Economic Review, Vol. 76 No. 2
Kaplan S.N. and Strömberg P. (2008): “Leveraged Buyouts and Private Equity”, Journal of
Economic Perspectives, Vol. 22, No. 4
Kershaw Rose E. (2011): “The Principal Agent Problem, Asymmetric Information and
Leveraged Buyouts: How Who Does the Buying Affects Who Gets Bought”
Kovenock D. and Phillips G.M. (1997): “Capital Structure and Product Market Behaviour:
An Examination of Plant Exit and Investment Decisions”, The Review of Financial Studies,
Vol. 10, No. 3
Lerner J., Sorensen M. and Strömberg P. (2008): “Private Equity and Long-Run Investment:
The Case of Innovation”
Li X., Qian J. and Zhu J.L. (2013): “Earnings-reducing Activities before Management
Buyouts”
Liu C. (2013): “Debt Structure, Private Equity Reputation, and Performance in Leveraged
Buyouts”
Lloyd M. and Hawkes D. (2015): “Do Public to Private Buyouts Improve Target’s Efficiency?
Löffler A. (2000): “Tax Shields in an LBO”
136
Long W.F. and Ravenscraft D.J. (1993): “LBOs, Debt and R&D Intensity”, CES 92-3
Loos N. (2015): “Value Creation in Leveraged Buyouts”
Lustenberger M. (2007): “Risk Aspects in Private Equity Investments”
MacKie-Mason J.K. (1989): “Do Taxes Affect Corporate Financing Decisions?”, Office of
Tax Policy Research
Malenko A. and Malenko N. (2015): “A Theory of LBO Activity Based on Repeated Debt-
Equity Conflicts”, Journal of Financial Economic
Mao Y. and Renneboog L. (2013): “Do Managers Manipulate Earnings Prior to Management
Buyouts?”, Working Paper N°. 383/2013
Masulis R.W. and Thomas R.S. (2009): “Does Private Equity Create Wealth? The Effects of
Private Equity and Derivatives on Corporate Governance”, The University of Chicago Law
Review, Vol. 76 No. 1
Ministère du Travail, de l’Emploi, de la Formation professionnelle et du Dialogue social
(2011): “L’approche chiffrée des risques psychosociaux : intérêts, limites et mise en oeuvre
pratique”
Mittoo U. and Ng D. (2013): “Financing Conditions, Control Considerations and Going Private
Decisions: Leveraged Buyouts (LBOs) versus Management Buyouts (MBOs)”
Mnejja A. and Sahut J-M. (2012): “The Discount Premium Between Private M&A and LBO
Transactions”
Mulcahy D., Weeks B. and Bradley H.S. (2012): “We Have Met The Enemy… And He is
Us”, Ewing Marion Kauffman Foundation
Nikoskelainen E. and Wright M. (2005): “The Impact of Corporate Governance Mechanisms
on Value Increase in Leveraged Buyouts”, Draft
Officer M.S., Ozbas O. and Sensoy B.A. (2009): “Club deals in leveraged buyouts”
Olsson M. and Tag J. (2012): “Private Equity and Employees”, IFN Working Paper No. 906
Pederzoli C., Thoma G. and Torricelli C. (2011): “Modelling credit risk for innovative firms:
the role of innovation measures”
PERE 50 (2016): Private Equity Funds rankings
Phalippou L. (2014): “Hilton Hotels: Real Estate Private Equity”
Popov A. and Roosenboom P. (2009): “Does Private Equity Investment Spur Innovation?
Evidence From Europe”, Working Paper No. 1063

137
Povalty S. (2006): “Private Equity Exits: An analysis of divestment process management in
relation to leveraged buyouts”
PriceWaterHouseCoopers (2001): “Survey of the Economic and Social Impact of
Management Buyouts & Buyins in Europe”
Renneboog L. and Simons T. (2005): “Public-to-Private Transactions: LBOs, MBOs, MBIs
and IBOs”, ECGI Working Paper Series in Finance, N°94/2005
Renneboog L., Simons T. and Wright M. (2007): “Why do public firms go private in the
UK?”
Rock E.B. (2013): “Adapting to the New Shareholder-Centric Reality”, Research Paper No.
13-19
Rushmore S. (2015): “Trends in the International Hospitality Industry”, HVS, MAI, FRICS
Sachs R.M. (1966): “Manufacturers' Capital Appropriations as a Measure of Investment
Decisions: An Econometric Study of Quarterly Time Series”, The Journal of Finance, Vol. 21,
No. 3
Sannajust A., Arouri M. and Chevalier A. (2013): “Drivers of LBO operating performance:
an empirical investigation in Latin America”, EMERALD
Servaes H. (1994): “Do Takeover Targets Overinvest?”, The Review of Financial Studies, Vol.
7, No. 2
Seth A. (1990): “Sources of Value Creation in Acquisitions: An Empirical Investigation”,
Strategic Management Journal, Vol. 11, No. 6
Shojai S. (1999): “Leveraged management buy-ins: Role of investors, means of exit, and the
predictive powers of the financial markets”
Tappeiner F.T. (2010): “Structure and determinants of financial covenants in leveraged
buyouts”
The United Nations Conference on Trade and Development (2008): Guidance on Corporate
Responsibility Indicators in Annual Reports
The Vernimmen Letter (2013): “Why do investment funds prefer to use the IRR and the initial
investment multiple than the NAV?”, No. 77
Thoma G. (2013): “The Value of Patents and Trademark Pairs”, Patent Statistics for Decision
Makers Conference
Thomas R.S. (2003): “Explaining the International CEO Pay Gap: Board Capture or Market
Driven?”, Working Paper No. 03-05
138
Turban D.B. and Cable D.M. (2003): “Firm Reputation and Applicant Pool Characteristics”,
Journal of Organizational Behavior, Vol. 24, No. 6
Varaiya N., Kerin R.A. and Weeks D. (1987): “The Relationship between Growth,
Profitability, and Firm Value”, Strategic Management Journal, Vol. 8, No. 5
Wang J. (2008): “Leveraged Buyout”
Wirtz P. (2004): “A resource based interpretation of performance enhancing capital structure
changes: The O.M. Scott LBO revisited”, Draft
Workforce 100 (2014): World’s top companies for HR
Xerfi Global (2015): Hotel Groups: World
Zingales L. (2015): “Does Finance Benefit Society?”, AFA Presidential Address
Companies Annual reports and SEC filings
Databases: ACSI, Factiva, Free Patents Online, Patent Researcher, RPX, Thomson One, Yahoo
Finance