Embed Size (px)
Citation preview
Journal of the Eastern Asia Society for Transportation Studies, Vol.13, 2019
2278
How to Establish West Japan-ASEAN RORO Ship Route?: Based on
Network Analysis
Jun KIMATAa, Tatsuo OKAMOTOb, Mikio TAKEBAYASHIc
a,bChuo Fukken Consultants Co., Ltd., Osaka, 533-0033, Japan
aE-mail: [email protected]
bE-mail:[email protected]
cGraduate School of Maritime Sciences, Kobe University, Kobe, 658-0022, Japan;
E-mail: [email protected]
Abstract: This paper aims to studythe possibility of establishing West Japan-ASEANRORO
ship routes by network equilibrium analysis. Although a RORO ship is supposed to have an
advantage against container ships in term of transportation timeits high shipping cost seems to
limit its possibility to launch East Asia routes for Japan. In this paper, we apply network
equilibrium analysis of bi-level type model to cargo transportation from West Japan to Ho Chi
Minh Port as case study of ASEANtransport market. We carry out thesensitivity analysis on
shipper’s time preference parameter and ocean tariff for understanding the potential demand
of RORO services. The results suggest that the cargo volume using RORO services can
increase when the shipper’s time preference increase: however, it is difficult to establish a
weekly service even if the time preference magnification to the current rate is doubling.
Keywords: Japan-ASEAN Transport Market, International RORO Ship, Time Preference,
Sensitivity Analysis, Network Equilibrium Approach
1. INTRODUCTION
Ministry of Land, Infrastructure, Transport and Tourism (MLIT) of JAPAN has aimed to
maintain the main container route of Europe and the United States from Japan since the port
competition among Asian ports has raised. Then, MLIT selected Keihin Port and Hanshin Port
as International Container Strategic Ports for this aim.
On the other hand, the Southeast Asian region i.e. ASEAN countrieshave enjoyed their
remarkable economic growth. Actually, the total GDP of ASEAN countries will be close to
Japan’s within ten years.ASEAN is also closer to Europe than East Asian countries including
Japan: this means the geographical advantage in term of global supply chain. Therefore, the
demand of Japanese companies approaching ASEAN is seemed to increase.This tendency will
lead to makeASEAN a strategic production base area for Japanese industry. In addition, along
with the progress of e-commerce, the importance of exporting Japanese products with high
quality and high added value is expected to increase, and it is assumed that trade with Japan
will also increase. In fact, the export container cargo volume from Japan to Southeast Asia
exceeded that for North America in 2006, has steadily increased in recent years, and the
ASEAN container market has been drawing attention as a growth market for future marine
transportation.
When considering this situation, neighboring countries in Asia will strategically expand
the network to overseas ports: China’s The Belt and Road Initiative policy is a good example.
Japan also wants to establish a highly efficient, speedy and highly reliable route network for
Japanese industry under reciprocal relationship with ASEAN countries.Against this backdrop,
Journal of the Eastern Asia Society for Transportation Studies, Vol.13, 2019
2279
the Japanese government also said in a national port strategy(medium-long-term policy of
ports: PORT 2030), "The shuttle route to the rapidly growing ASEAN is a strategically
important route and will enhance direct service from domestic major ports".
An international ferry/roll-on-roll-off(RORO) ship, which is faster than a full-container
ship, is a transportation mode that is useful for keeping the current complicated global supply
chain because of its faster speed and better punctuality in transport. The policy of PORT 2030
aims to "form an ocean transportation network by various type of services which provide
wider speed band: launching international ferry/RORO ship routes and container shuttle
routes can fit the tight supply chain management". However, international ferry/RORO ship
routes from Japan are currently limited to short sea shipping (South Korea, Taiwan, and some
part of China, see Table 1) and are not in service to ASEAN. Using international ferry/RORO
ship is usually expensive due to high operationalcosts, and this can be one of the reasons of
the limited services of RORO from Japan; but no research has analyzed this phenomenon yet.
Since using RORO service is demanded for providing better supply chain, we need to discuss
the possibility of launching this service in the future.
Table 1. International ferry/RORO ship routes from Japan(2018) Countries Type Route Frequency
China
Ferry: Osaka(J)-Shanghai(C) 6 vessel/month
Ferry: Kobe(J)-Shanghai(C) 2 vessel/month
RORO: Shimonoseki(J)-Taicang(C) 8 vessel/month
Korea/China RORO: Tokyo(J)-Nagoya(J)-Shimonoseki(J)-Busan(K)
-Shidao(C) 4 vessel/month
Korea
Ferry: Osaka(J)-Busan(K) 12 vessel/month
RORO:
Tsuruga(J)-Kanazawa(J)-Busan(K)-Masan(K)
-Tsuruga(J)-Kanazawa(J)-Shimonoseki(J)-Masan(K)
-Busan(K)
8 vessel/month
RORO: Tokyo(J)-Nagoya(J)-Busan(K)-Masan(K)
-Shimonoseki(J)-Masan(K)-Busan(K)-Osaka(J) 4 vessel/month
Ferry: Shimonoseki(J)-Busan(K) 28 vessel/month
Ferry: Hakata(J)-Busan(K) 28 vessel/month
RORO: Kitakyushu(J)-Busan(K) 24 vessel/month
Taiwan RORO: Hakata(J)-Kagoshima(J)-Naha(J)-Miyako(J)
-Kaohsiung(T)-Naha(J)-Kagoshima(J) 4 vessel/month
Russia Ferry: Maizuru(J)-Sakai(J)-Donghae(K)-Vladivostok(R) 4 vessel/month
Source; Ocean Commerce
In this paper, we discuss the possibility of launching RORO ship route between Japan
and ASEAN by applying the network equilibrium model and show the requirement of
launching this service to ASEAN. This paper has five bodies. In the second section, we briefly
review the existing researches. In the third section, we show the structure of the model and the
model setting for the analysis. In the fourth section, we discuss feasibility of establishing
international RORO ship route by the sensitivity analysis on the time preference as well as the
fare. Finally, in the fifth section, we summaryresearch findings and address the direction for
the future research.
2. LITERATURE REVIEW
Generally, the RORO services are classified as family of liner services.The distinguished
Journal of the Eastern Asia Society for Transportation Studies, Vol.13, 2019
2280
point of ROROfrom conventional container cargo services is using horizontally loading
vessels: cargosare towed into the vessel by wheeled vehicles and then using RORO does not
require any special equipment (Christodoulouet al, 2019).The international RORO service
network is popular in Europe, especially in Baltic area. As for Japan, the Korean route from/to
North Kyushu area is known as the most successful RORO services. Shimonoseki Port is one
of the busiest international RORO terminals in Japan. Regarding its hardware profile, its
depth and extension of the terminal are minus 7.5m and 260m, respectively (Shimonoseki
City Port Authority).
In term of the researches on international RORO ship route from Japan, some
researchesdiscuss the possibility of establishing route connecting Shanghai and Northern
Kansai (Oka and Takebayashi,2015)because of its geographical positon. On the other hand, it
is rarely to find the research on Japan-ASEAN route.There are some previous studies on the
RORO route in Europe. Christodoulou et al (2019) discussed the sustainability of the RORO
route in Northern Europe based on interview surveys. However, their interest is not on fast
boat, but on intermodal transport.There is also research on RORO in ASEAN, but as Kim and
Yoon (2019), domestic RORO routes in island countries are targeted.JICA (2013) is
examining the establishment of international RORO route between ASEAN countries, but the
route between Japan and ASEAN is not covered.
Some researches focusing on shipping market behavior and carriers have been studied.
Kuroda et al (2005) proposed an equilibrium model considering both carriers’ and
shippers’behavior simultaneously. Their model is a deterministic user equilibrium model
including congestion. Shibasaki et al (2011) proposed an equilibrium model considering the
behavior of carrier alliances and shippers. Their model was designed for handling large-scale
networks and describing complicated transportation routes in the seaborne markets. These
approaches adopt "supply-demand interaction" approach. We can find the researches adopting
supply-demand interaction approach in the air transportation research filed. Takebayashi
(2011, 2013) proposed a bi-level air transport market model which can deal with airlines’
shaping network, determining air fares, and flight frequenciesover passenger’s optimalroute
choice behavior.They proposed a bi-level model that airlines’ behavior is treated as leader,
while passengers are regarded as follower. Takebayashi’s model is very comprehensive, but
too liberal for dealing with seaborne market because the tariff is not so flexibly changeable.
Since the bi-level model can provide many policy implications, we adopt the bi-level model
but need to modify for handling the seaborne markets, especially short sea transport.
3. THE MODEL
3.1 Simplified Bi-level Model
We apply the simplified bi-level model.Details are already explained by Takebayshi (2011),
and some important points are described in the following part.
1)Carrier
Carriers competewith each other by controlling their transport capacity for maximizing their
profits.Here, we assume that fare and vessel capacity are given for each link, and only the
transport frequency is a control variable.
Assuming that the link operated by carrier n is𝑙𝑛, OD is rs(r: origin, s: destination), the
transport frequency of the link and the vessel capacity are 𝑓𝑙𝑛 and 𝑣𝑙𝑛 , the fare and
operationalcost are 𝑝𝑙𝑛 and 𝐶𝑙𝑛 , the profit maximization problem of carrier n can be
formulated as follows.
Journal of the Eastern Asia Society for Transportation Studies, Vol.13, 2019
2281
max : ( )n n n n
n nl
n rs rsk
kl l l lfrs kl
p x f C = − , (1)
Subject to:
, for n n n
rs rsk n
k l l lrs k
x v f l , (2)
0,for n
n
lf l . (3)
𝑥𝑘𝑟𝑠 is the cargo volume carriedonkth path in the rsOD market.𝛿𝑙𝑛
𝑟𝑠𝑘 is a binary variable
that takes one when the link is used in the kth path in the rsOD market, and
zerootherwise.Equation (1) is the objective function, Constraint (2) is the transport capacity
constraint of each link, and Constraint(3) is the non-negative condition of transport frequency.
2) Shipper
Shippers exist independently for each cargo.Shippers aim to minimize their generalized costs
which consist of transport time, fare and congestion.As shipper’s preferences are assumed to
have varieties, we adopt a stochastic user equilibrium (SUE) state with capacity constraints.
The SUE with capacity constraintscan be described as Takebayashi (2011, 2015). 1
min : (ln 1)rs
rs rsk
rs rs rs rs
k k k kx
rs rsk K k K
x x u x
= − + , (4)
Subject to:
,rs
rs rs
k
k K
x X rs
= , (5)
, ,n n n n
rs rsk n n
kl l l lrs k
x x v f l I n N= , (6)
0, for and rs rs
kx k K rs , (7)
where, 𝜃 is the dispersion parameter (estimated as 1), 𝑢𝑘𝑟𝑠 is the generalization cost of the
kth path in the rsOD market, 𝑋𝑟𝑠 is the OD flow, Ω is the set of OD pairs, 𝐾𝑟𝑠 is the path set,
𝐼𝑛 is the link set, Nis the group of carriers.Equation(4) is the objective function, Constraint(5)
is the OD flow conservation law, Constraint(6) is the transport capacity constraint of each link,
and Constraint(7) is the nonnegative condition of the path flow.If carriers’ capacity constraint
considers shippers to actively select routes for congestion, carriers’ constraints are
automatically satisfied by the shipper's optimal behavior.The utility function of shippers in
this model is given as follows.
1 2 3D MU T T C = + + (8)
𝑇𝐷 is the domestic transport time, 𝑇𝑀 is the maritime transport time, Cis the total
transport cost, 𝛼1,𝛼2and 𝛼3are theparameters.
3) Port
Due to the structure of the analysis, we donot set ports as active players. For ports,we set
onlythe evaluation function.The port charge 𝜌ℎ𝐶 and handling cost 𝜌ℎ
𝑆 at port h are included
to carriers’ operationalcost 𝐶𝑙𝑛 and shippers’ generalization cost 𝑢𝑘𝑟𝑠.
4) Domestic transport route
For each shipper, we set the presence/absence of connection between domestic
production/consumption area of cargo and domestic port, fare and required time.
5) Alternative route
The proposed bi-level model requires the alternative route for each OD flow because
equilibriumflow should be obtained under any condition provided by carriers(Takebayashi,
2011). We follow the former research’s approach and set the alternative route for each OD
flow.
3.2 The Network
Journal of the Eastern Asia Society for Transportation Studies, Vol.13, 2019
2282
In this paper, we deal with Japan-ASEAN seaborne markets. However, obviously, when we
handle this market directly, we need to handle very large scale network: it is difficult to apply
the bi-level model. Then,we need to reduce size of the network – but keep the reality of the
market behavior as possible. In this paper, we analyze the route connecting Ho Chi Minh Port
(hence, HCM Port), which is the largest port of Vietnam closer to Japan than Thailand and
Indonesia in ASEAN, and West Japan.
First, we calibrate the model for reproducingthe current market in Section 3.3:we
dealwith West Japan and HCM Port’s hinterland. The target year is 2013: we use the survey
data of the latest container cargo flow survey by MLIT of this year. In the analysis,we deal
withfour ports (Hanshin Port, Mizushima Port, Hiroshima Port and Northern Kyushu Port) as
West Japan’s representativeport.We consider oversea connecting servicesvia Busan Port and
Kaohsiung Port for describing the transshipment services even in the short sea shipping
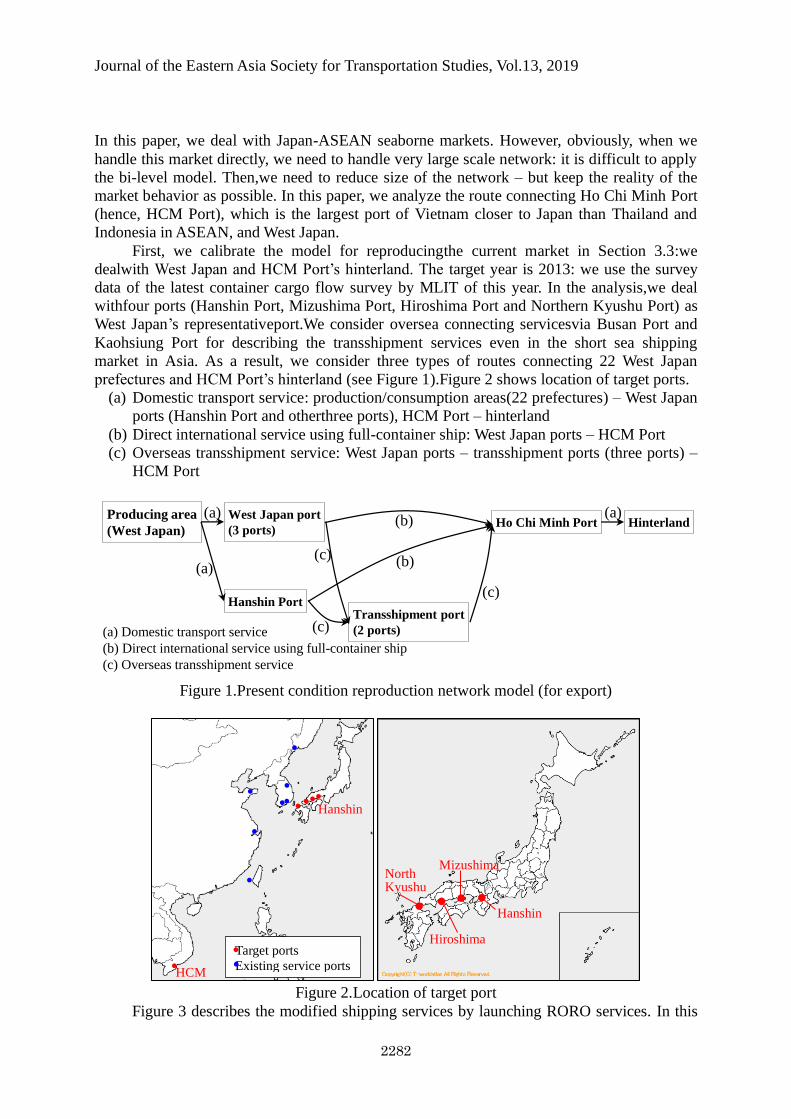
market in Asia. As a result, we consider three types of routes connecting 22 West Japan
prefectures and HCM Port’s hinterland (see Figure 1).Figure 2 shows location of target ports.
(a) Domestic transport service: production/consumption areas(22 prefectures) – West Japan
ports (Hanshin Port and otherthree ports), HCM Port – hinterland
(b) Direct international service using full-container ship: West Japan ports – HCM Port
(c) Overseas transshipment service: West Japan ports – transshipment ports (three ports) –
HCM Port
Figure 1.Present condition reproduction network model (for export)
Figure 2.Location of target port
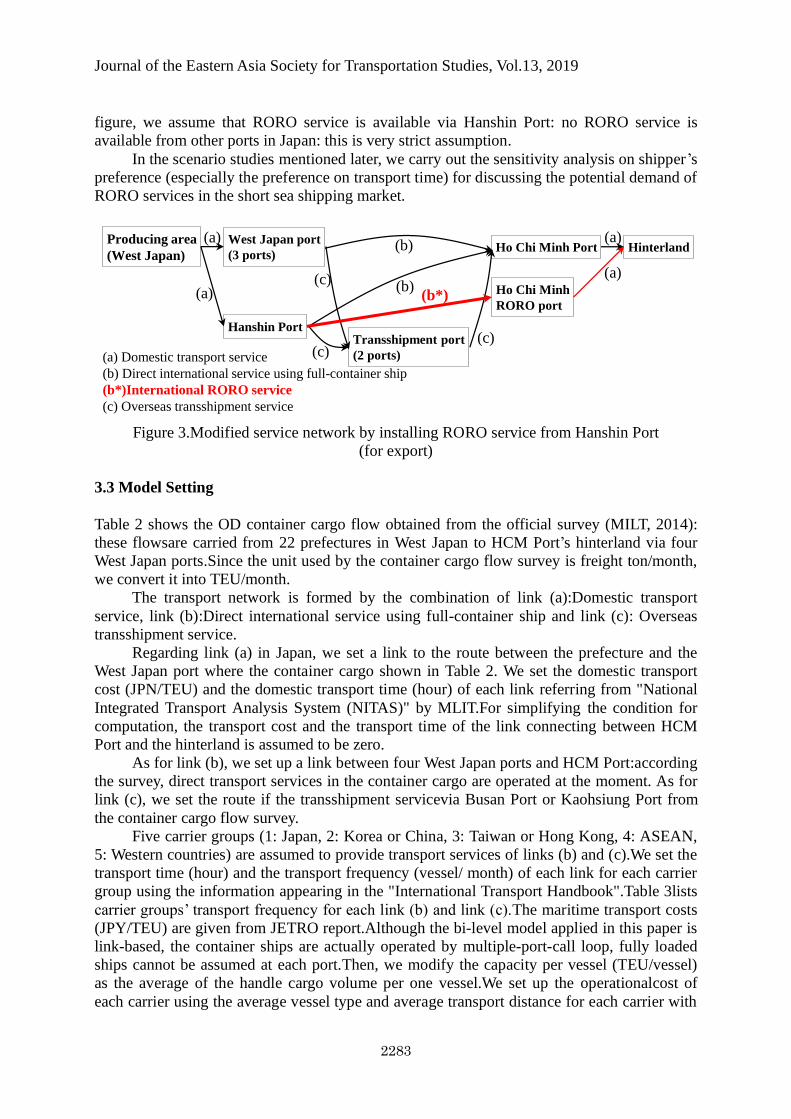
Figure 3 describes the modified shipping services by launching RORO services. In this
Producing area
(West Japan)
Hanshin Port
West Japan port
(3 ports)Ho Chi Minh Port
Transshipment port
(2 ports)
(a)
(a)
(b)
(b)
(c)
(c)
(c)
(a) Domestic transport service
(b) Direct international service using full-container ship
(c) Overseas transshipment service
Hinterland(a)
Hanshin
Mizushima
Hiroshima
North Kyushu
Hanshin
HCM
Target ports
Existing service ports
Journal of the Eastern Asia Society for Transportation Studies, Vol.13, 2019
2283
figure, we assume that RORO service is available via Hanshin Port: no RORO service is
available from other ports in Japan: this is very strict assumption.
In the scenario studies mentioned later, we carry out the sensitivity analysis on shipper’s
preference (especially the preference on transport time) for discussing the potential demand of
RORO services in the short sea shipping market.
Figure 3.Modified service network by installing RORO service from Hanshin Port
(for export)
3.3 Model Setting
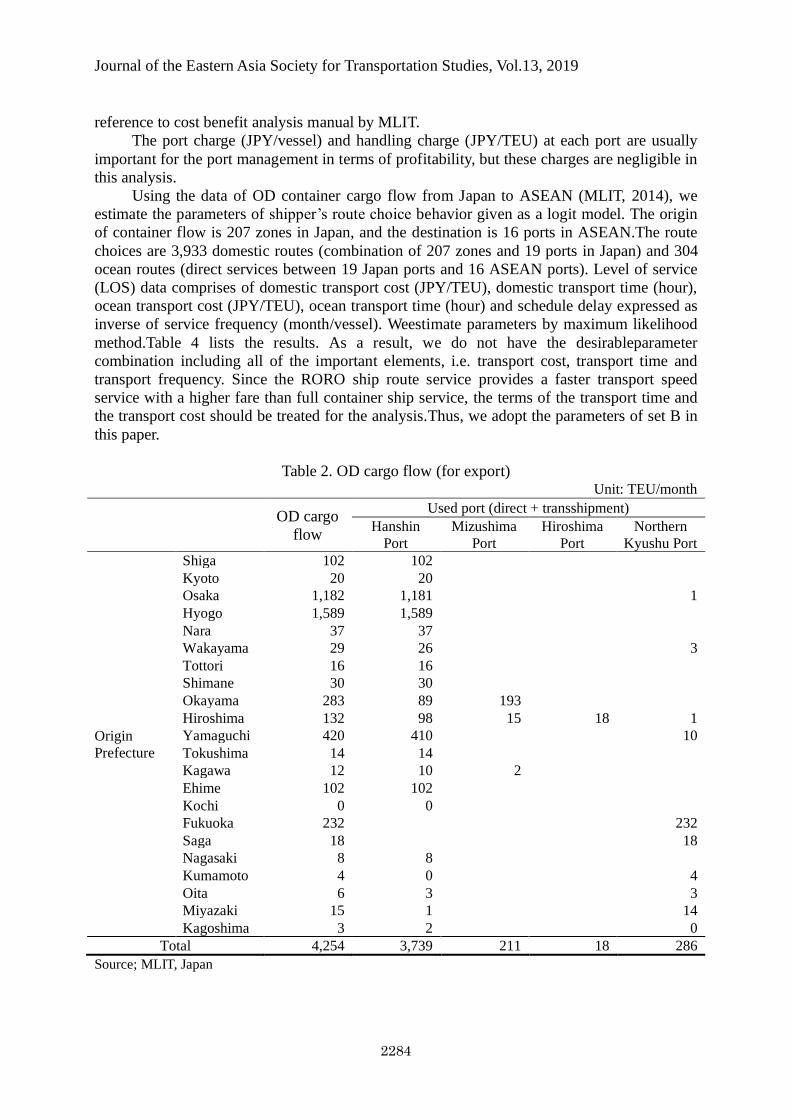
Table 2 shows the OD container cargo flow obtained from the official survey (MILT, 2014):
these flowsare carried from 22 prefectures in West Japan to HCM Port’s hinterland via four
West Japan ports.Since the unit used by the container cargo flow survey is freight ton/month,
we convert it into TEU/month.
The transport network is formed by the combination of link (a):Domestic transport
service, link (b):Direct international service using full-container ship and link (c): Overseas
transshipment service.
Regarding link (a) in Japan, we set a link to the route between the prefecture and the
West Japan port where the container cargo shown in Table 2. We set the domestic transport
cost (JPN/TEU) and the domestic transport time (hour) of each link referring from "National
Integrated Transport Analysis System (NITAS)" by MLIT.For simplifying the condition for
computation, the transport cost and the transport time of the link connecting between HCM
Port and the hinterland is assumed to be zero.
As for link (b), we set up a link between four West Japan ports and HCM Port:according
the survey, direct transport services in the container cargo are operated at the moment. As for
link (c), we set the route if the transshipment servicevia Busan Port or Kaohsiung Port from
the container cargo flow survey.
Five carrier groups (1: Japan, 2: Korea or China, 3: Taiwan or Hong Kong, 4: ASEAN,
5: Western countries) are assumed to provide transport services of links (b) and (c).We set the
transport time (hour) and the transport frequency (vessel/ month) of each link for each carrier
group using the information appearing in the "International Transport Handbook".Table 3lists
carrier groups’ transport frequency for each link (b) and link (c).The maritime transport costs
(JPY/TEU) are given from JETRO report.Although the bi-level model applied in this paper is
link-based, the container ships are actually operated by multiple-port-call loop, fully loaded
ships cannot be assumed at each port.Then, we modify the capacity per vessel (TEU/vessel)
as the average of the handle cargo volume per one vessel.We set up the operationalcost of
each carrier using the average vessel type and average transport distance for each carrier with
Producing area
(West Japan)
Hanshin Port
West Japan port
(3 ports)Ho Chi Minh Port
Transshipment port
(2 ports)
(a)
(a)
(b)
(b)
(c)
(c)
(c)
(a) Domestic transport service
(b) Direct international service using full-container ship
(b*)International RORO service
(c) Overseas transshipment service
Hinterland(a)
Ho Chi Minh
RORO port
(a)
(b*)
Journal of the Eastern Asia Society for Transportation Studies, Vol.13, 2019
2284
reference to cost benefit analysis manual by MLIT.
The port charge (JPY/vessel) and handling charge (JPY/TEU) at each port are usually
important for the port management in terms of profitability, but these charges are negligible in
this analysis.
Using the data of OD container cargo flow from Japan to ASEAN (MLIT, 2014), we
estimate the parameters of shipper’s route choice behavior given as a logit model. The origin
of container flow is 207 zones in Japan, and the destination is 16 ports in ASEAN.The route
choices are 3,933 domestic routes (combination of 207 zones and 19 ports in Japan) and 304
ocean routes (direct services between 19 Japan ports and 16 ASEAN ports). Level of service
(LOS) data comprises of domestic transport cost (JPY/TEU), domestic transport time (hour),
ocean transport cost (JPY/TEU), ocean transport time (hour) and schedule delay expressed as
inverse of service frequency (month/vessel). Weestimate parameters by maximum likelihood
method.Table 4 lists the results. As a result, we do not have the desirableparameter
combination including all of the important elements, i.e. transport cost, transport time and
transport frequency. Since the RORO ship route service provides a faster transport speed
service with a higher fare than full container ship service, the terms of the transport time and
the transport cost should be treated for the analysis.Thus, we adopt the parameters of set B in
this paper.
Table 2. OD cargo flow (for export)
Unit: TEU/month
OD cargo
flow
Used port (direct + transshipment)
Hanshin
Port
Mizushima
Port
Hiroshima
Port
Northern
Kyushu Port
Origin
Prefecture
Shiga 102 102
Kyoto 20 20
Osaka 1,182 1,181 1
Hyogo 1,589 1,589
Nara 37 37
Wakayama 29 26 3
Tottori 16 16
Shimane 30 30
Okayama 283 89 193
Hiroshima 132 98 15 18 1
Yamaguchi 420 410 10
Tokushima 14 14
Kagawa 12 10 2
Ehime 102 102
Kochi 0 0
Fukuoka 232 232
Saga 18 18
Nagasaki 8 8
Kumamoto 4 0 4
Oita 6 3 3
Miyazaki 15 1 14
Kagoshima 3 2 0
Total 4,254 3,739 211 18 286
Source; MLIT, Japan
Journal of the Eastern Asia Society for Transportation Studies, Vol.13, 2019
2285
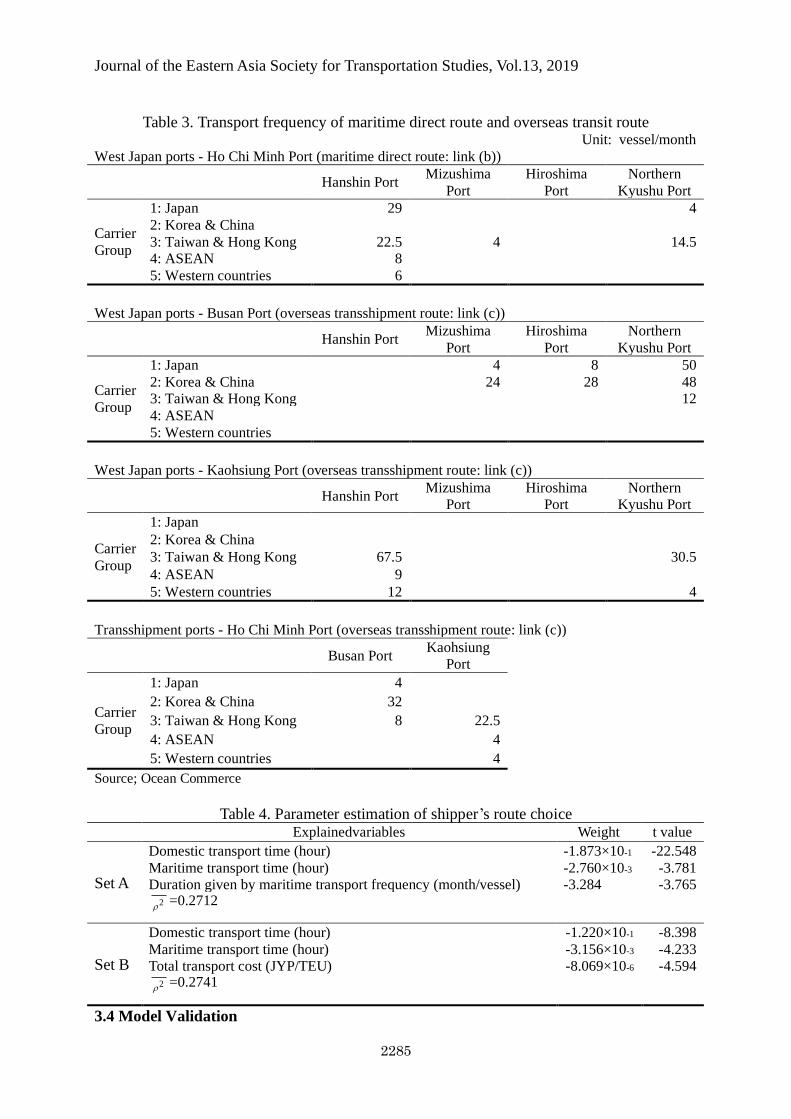
Table 3. Transport frequency of maritime direct route and overseas transit route Unit: vessel/month
West Japan ports - Ho Chi Minh Port (maritime direct route: link (b))
Hanshin Port Mizushima
Port
Hiroshima
Port
Northern
Kyushu Port
Carrier
Group
1: Japan 29 4
2: Korea & China
3: Taiwan & Hong Kong 22.5 4 14.5
4: ASEAN 8
5: Western countries 6
West Japan ports - Busan Port (overseas transshipment route: link (c))
Hanshin Port Mizushima
Port
Hiroshima
Port
Northern
Kyushu Port
Carrier
Group
1: Japan 4 8 50
2: Korea & China 24 28 48
3: Taiwan & Hong Kong 12
4: ASEAN
5: Western countries
West Japan ports - Kaohsiung Port (overseas transshipment route: link (c))
Hanshin Port Mizushima
Port
Hiroshima
Port
Northern
Kyushu Port
Carrier
Group
1: Japan
2: Korea & China
3: Taiwan & Hong Kong 67.5 30.5
4: ASEAN 9
5: Western countries 12 4
Transshipment ports - Ho Chi Minh Port (overseas transshipment route: link (c))
Busan Port Kaohsiung
Port
Carrier
Group
1: Japan 4
2: Korea & China 32
3: Taiwan & Hong Kong 8 22.5
4: ASEAN 4
5: Western countries 4
Source; Ocean Commerce
Table 4. Parameter estimation of shipper’s route choice
Explainedvariables Weight t value
Set A
Domestic transport time (hour) -1.873×10⁻¹ -22.548
Maritime transport time (hour) -2.760×10⁻³ -3.781
Duration given by maritime transport frequency (month/vessel) -3.284 -3.765 2 =0.2712
Set B
Domestic transport time (hour) -1.220×10⁻¹ -8.398
Maritime transport time (hour) -3.156×10⁻³ -4.233
Total transport cost (JYP/TEU) -8.069×10⁻⁶ -4.594 2 =0.2741
3.4 Model Validation
Journal of the Eastern Asia Society for Transportation Studies, Vol.13, 2019
2286
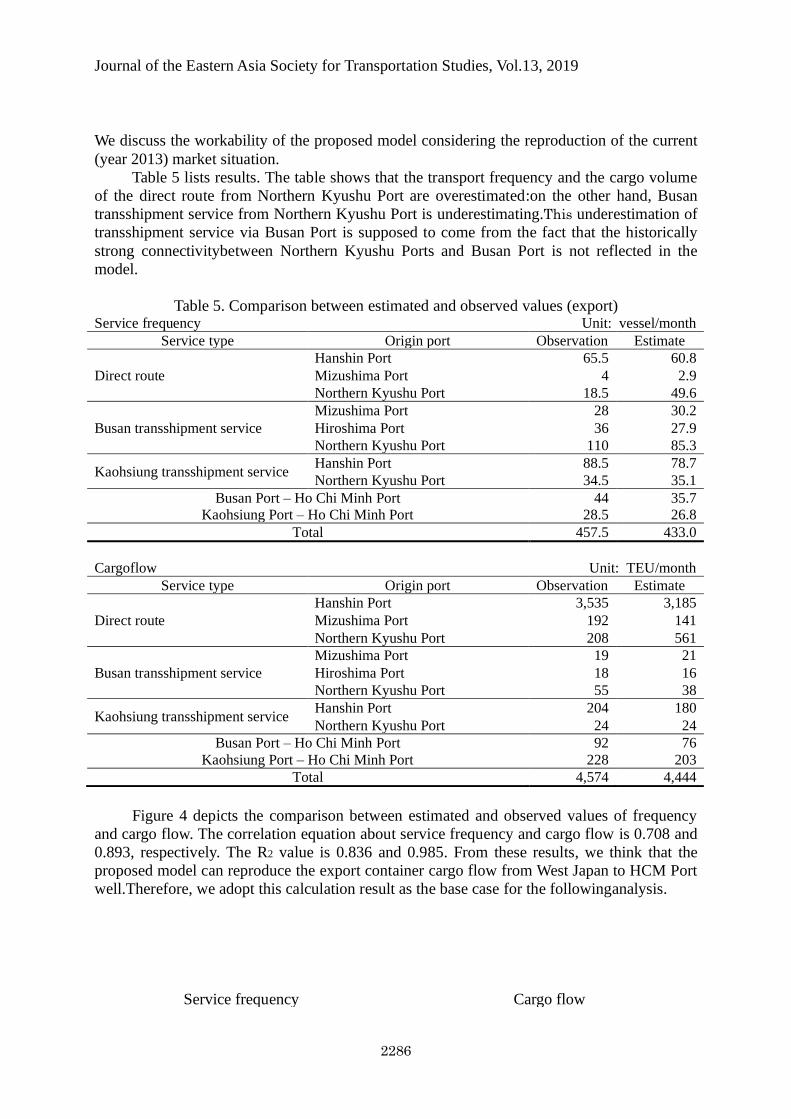
We discuss the workability of the proposed model considering the reproduction of the current
(year 2013) market situation.
Table 5 lists results. The table shows that the transport frequency and the cargo volume
of the direct route from Northern Kyushu Port are overestimated:on the other hand, Busan
transshipment service from Northern Kyushu Port is underestimating.This underestimation of
transshipment service via Busan Port is supposed to come from the fact that the historically
strong connectivitybetween Northern Kyushu Ports and Busan Port is not reflected in the
model.
Table 5. Comparison between estimated and observed values (export) Service frequency Unit: vessel/month
Service type Origin port Observation Estimate
Direct route
Hanshin Port 65.5 60.8
Mizushima Port 4 2.9
Northern Kyushu Port 18.5 49.6
Busan transshipment service
Mizushima Port 28 30.2
Hiroshima Port 36 27.9
Northern Kyushu Port 110 85.3
Kaohsiung transshipment service Hanshin Port 88.5 78.7
Northern Kyushu Port 34.5 35.1
Busan Port – Ho Chi Minh Port 44 35.7
Kaohsiung Port – Ho Chi Minh Port 28.5 26.8
Total 457.5 433.0
Cargoflow Unit: TEU/month
Service type Origin port Observation Estimate
Direct route
Hanshin Port 3,535 3,185
Mizushima Port 192 141
Northern Kyushu Port 208 561
Busan transshipment service
Mizushima Port 19 21
Hiroshima Port 18 16
Northern Kyushu Port 55 38
Kaohsiung transshipment service Hanshin Port 204 180
Northern Kyushu Port 24 24
Busan Port – Ho Chi Minh Port 92 76
Kaohsiung Port – Ho Chi Minh Port 228 203
Total 4,574 4,444
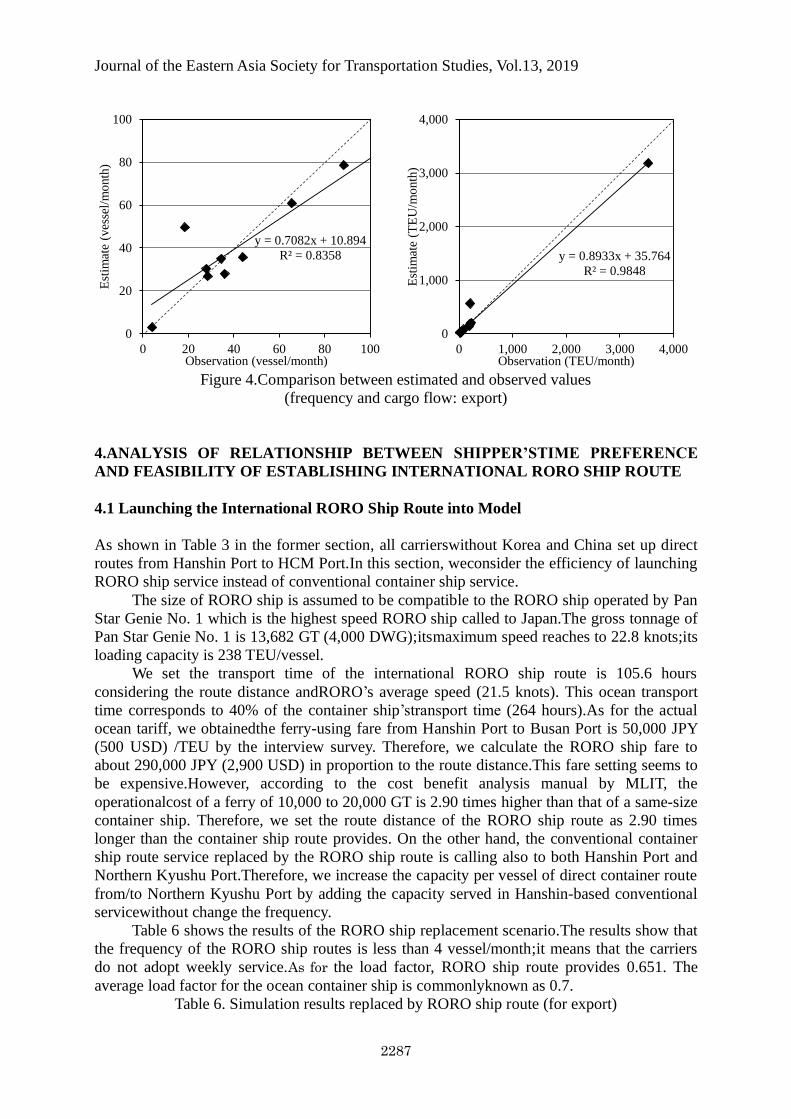
Figure 4 depicts the comparison between estimated and observed values of frequency
and cargo flow. The correlation equation about service frequency and cargo flow is 0.708 and
0.893, respectively. The R2 value is 0.836 and 0.985. From these results, we think that the
proposed model can reproduce the export container cargo flow from West Japan to HCM Port
well.Therefore, we adopt this calculation result as the base case for the followinganalysis.
Service frequency Cargo flow
Journal of the Eastern Asia Society for Transportation Studies, Vol.13, 2019
2287
Figure 4.Comparison between estimated and observed values
(frequency and cargo flow: export)
4.ANALYSIS OF RELATIONSHIP BETWEEN SHIPPER’STIME PREFERENCE
AND FEASIBILITY OF ESTABLISHING INTERNATIONAL RORO SHIP ROUTE
4.1 Launching the International RORO Ship Route into Model
As shown in Table 3 in the former section, all carrierswithout Korea and China set up direct
routes from Hanshin Port to HCM Port.In this section, weconsider the efficiency of launching
RORO ship service instead of conventional container ship service.
The size of RORO ship is assumed to be compatible to the RORO ship operated by Pan
Star Genie No. 1 which is the highest speed RORO ship called to Japan.The gross tonnage of
Pan Star Genie No. 1 is 13,682 GT (4,000 DWG);itsmaximum speed reaches to 22.8 knots;its
loading capacity is 238 TEU/vessel.
We set the transport time of the international RORO ship route is 105.6 hours
considering the route distance andRORO’s average speed (21.5 knots). This ocean transport
time corresponds to 40% of the container ship’stransport time (264 hours).As for the actual
ocean tariff, we obtainedthe ferry-using fare from Hanshin Port to Busan Port is 50,000 JPY
(500 USD) /TEU by the interview survey. Therefore, we calculate the RORO ship fare to
about 290,000 JPY (2,900 USD) in proportion to the route distance.This fare setting seems to
be expensive.However, according to the cost benefit analysis manual by MLIT, the
operationalcost of a ferry of 10,000 to 20,000 GT is 2.90 times higher than that of a same-size
container ship. Therefore, we set the route distance of the RORO ship route as 2.90 times
longer than the container ship route provides. On the other hand, the conventional container
ship route service replaced by the RORO ship route is calling also to both Hanshin Port and
Northern Kyushu Port.Therefore, we increase the capacity per vessel of direct container route
from/to Northern Kyushu Port by adding the capacity served in Hanshin-based conventional
servicewithout change the frequency.
Table 6 shows the results of the RORO ship replacement scenario.The results show that
the frequency of the RORO ship routes is less than 4 vessel/month;it means that the carriers
do not adopt weekly service.As for the load factor, RORO ship route provides 0.651. The
average load factor for the ocean container ship is commonlyknown as 0.7.
Table 6. Simulation results replaced by RORO ship route (for export)
y = 0.7082x + 10.894
R² = 0.8358
0
20
40
60
80
100
0 20 40 60 80 100
Est
imat
e (v
esse
l/m
onth
)
Observation (vessel/month)
y = 0.8933x + 35.764
R² = 0.9848
0
1,000
2,000
3,000
4,000
0 1,000 2,000 3,000 4,000
Est
imat
e (T
EU
/mo
nth
)
Observation (TEU/month)

Journal of the Eastern Asia Society for Transportation Studies, Vol.13, 2019
2288
Service frequency Unit: vessel/month
Service type Origin port Base case Replace by
RORO ship route
RORO ship route Hanshin Port - 2.4
Direct route
Hanshin Port 60.8 47.3
Mizushima Port 2.9 3.0
Northern Kyushu Port 49.6 44.7
Busan transshipment service
Mizushima Port 30.2 31.7
Hiroshima Port 27.9 29.9
Northern Kyushu Port 85.3 98.6
Kaohsiung transshipment service Hanshin Port 78.7 89.2
Northern Kyushu Port 35.1 22.8
Busan Port – Ho Chi Minh Port 35.7 37.9
Kaohsiung Port – Ho Chi Minh Port 26.8 29.1
Total 433.0 434.2
Cargoflow Unit: TEU/month
Service type Origin port Base case Replace by
RORO ship route
RORO ship route Hanshin Port - 369
Direct route
Hanshin Port 3,185 2,560
Mizushima Port 141 142
Northern Kyushu Port 561 771
Busan transshipment service
Mizushima Port 21 22
Hiroshima Port 16 17
Northern Kyushu Port 38 41
Kaohsiung transshipment service Hanshin Port 180 203
Northern Kyushu Port 24 16
Busan Port – Ho Chi Minh Port 76 80
Kaohsiung Port – Ho Chi Minh Port 203 218
Total 4,444 4,070
Looking at Table 6, launching the international RORO ship route decreases the transport
frequency of direct route from Hanshin Port and transshipment route via Kaohsiung Port from
Northern Kyushu Port.Conversely, the frequency of transshipment route via Busan Port from
Northern Kyushu Port and via Kaohsiung Port from Hanshin Port increase.
As for the carried cargo volume, those of direct route from Hanshin Port decrease by
625 TEU/month. On the contrary, the cargo volume of direct route from Northern Kyushu
Port increases by 210 TEU/month and the cargo volume of transshipment route via Kaohsiung
Port from Hanshin Port increase by 23 TEU/month.These results suggestthat launching
RORO service from/to Hanshin Port brings a negative impact to Hanshin Port itself; but some
positive effect on Northern Kyushu Port and Busan Port: this suggests the cannibalization
between services from/to Hanshin Port occurs and it reducesthe efficiency of Hanshin Port.
Table 6 also shows that the total export cargo volume decreases.This decrease suggests
that the level of service in total becomes inconvenient for shippers. Actually, handled cargo
volume at Hanshin Port decrease from 3,364 TEU/month to 3,132 TEU/month.
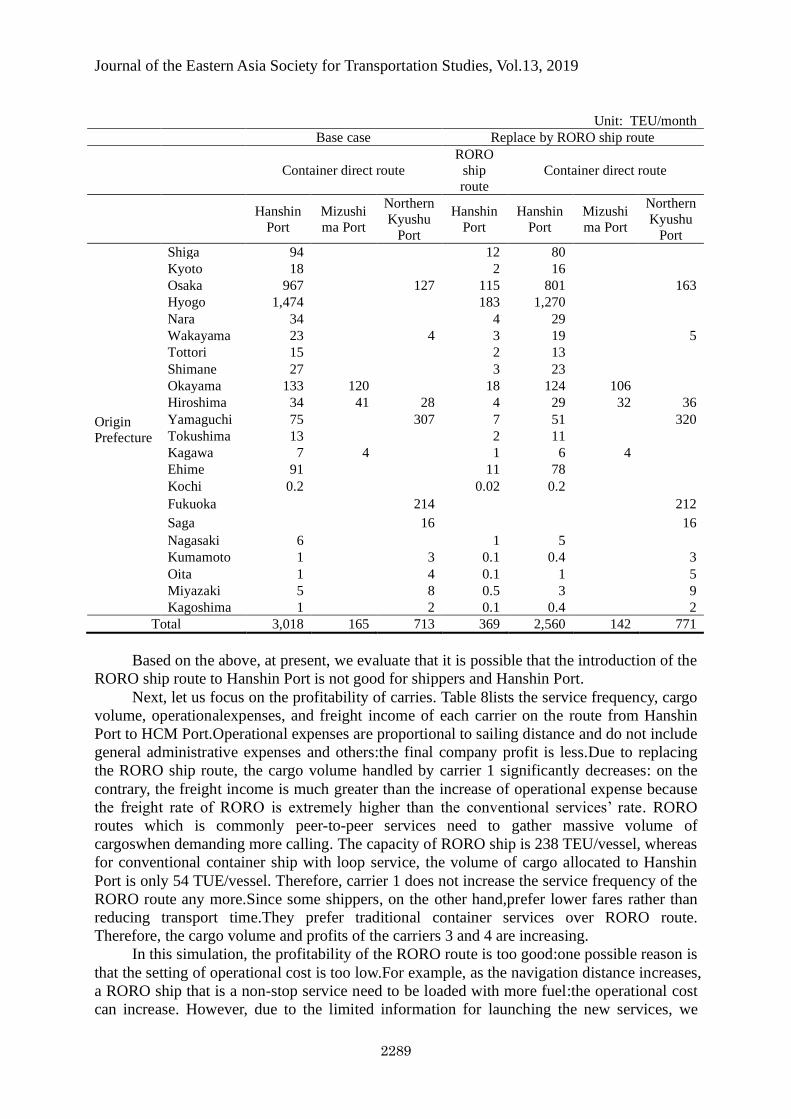
Table 7 lists the estimated cargo volume:the table shows that the cargo on the RORO
ship route at Hanshin Port is mainly shifted from the existing direct route at Hanshin Port,
many of which originate from Hyogo prefecture and Osaka prefecture.
Table 7. Estimated cargo volumeof containerdirect route and RORO ship route (for export)
Journal of the Eastern Asia Society for Transportation Studies, Vol.13, 2019
2289
Unit: TEU/month
Base case Replace by RORO ship route
Container direct route
RORO
ship
route
Container direct route
Hanshin
Port
Mizushi
ma Port
Northern
Kyushu
Port
Hanshin
Port
Hanshin
Port
Mizushi
ma Port
Northern
Kyushu
Port
Origin
Prefecture
Shiga 94 12 80
Kyoto 18 2 16
Osaka 967 127 115 801 163
Hyogo 1,474 183 1,270
Nara 34 4 29
Wakayama 23 4 3 19 5
Tottori 15 2 13
Shimane 27 3 23
Okayama 133 120 18 124 106
Hiroshima 34 41 28 4 29 32 36
Yamaguchi 75 307 7 51 320
Tokushima 13 2 11
Kagawa 7 4 1 6 4
Ehime 91 11 78
Kochi 0.2 0.02 0.2
Fukuoka 214 212
Saga 16 16
Nagasaki 6 1 5
Kumamoto 1 3 0.1 0.4 3
Oita 1 4 0.1 1 5
Miyazaki 5 8 0.5 3 9
Kagoshima 1 2 0.1 0.4 2
Total 3,018 165 713 369 2,560 142 771
Based on the above, at present, we evaluate that it is possible that the introduction of the
RORO ship route to Hanshin Port is not good for shippers and Hanshin Port.
Next, let us focus on the profitability of carries. Table 8lists the service frequency, cargo
volume, operationalexpenses, and freight income of each carrier on the route from Hanshin
Port to HCM Port.Operational expenses are proportional to sailing distance and do not include
general administrative expenses and others:the final company profit is less.Due to replacing
the RORO ship route, the cargo volume handled by carrier 1 significantly decreases: on the
contrary, the freight income is much greater than the increase of operational expense because
the freight rate of RORO is extremely higher than the conventional services’ rate. RORO
routes which is commonly peer-to-peer services need to gather massive volume of
cargoswhen demanding more calling. The capacity of RORO ship is 238 TEU/vessel, whereas
for conventional container ship with loop service, the volume of cargo allocated to Hanshin
Port is only 54 TUE/vessel. Therefore, carrier 1 does not increase the service frequency of the
RORO route any more.Since some shippers, on the other hand,prefer lower fares rather than
reducing transport time.They prefer traditional container services over RORO route.
Therefore, the cargo volume and profits of the carriers 3 and 4 are increasing.
In this simulation, the profitability of the RORO route is too good:one possible reason is
that the setting of operational cost is too low.For example, as the navigation distance increases,
a RORO ship that is a non-stop service need to be loaded with more fuel:the operational cost
can increase. However, due to the limited information for launching the new services, we
Journal of the Eastern Asia Society for Transportation Studies, Vol.13, 2019
2290
cannot estimate the increase ratio of the operational cost for long haul RORO. Carrying out
the sensitivity analysis on the operational cost of long haul RORO services is demanded, but
due to the limitation of the space, we will discuss the results of sensitivity analysis in our
future work.
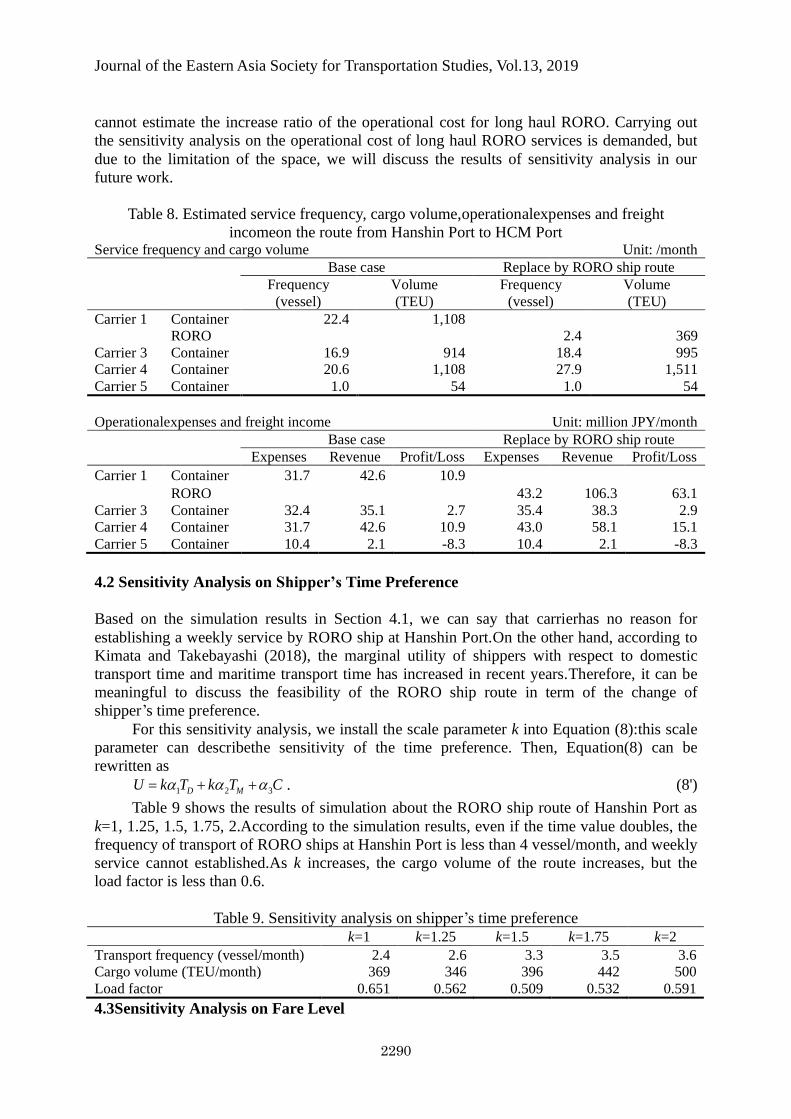
Table 8. Estimated service frequency, cargo volume,operationalexpenses and freight
incomeon the route from Hanshin Port to HCM Port Service frequency and cargo volume Unit: /month
Base case Replace by RORO ship route Frequency Volume Frequency Volume
(vessel) (TEU) (vessel) (TEU)
Carrier 1 Container 22.4 1,108
RORO 2.4 369
Carrier 3 Container 16.9 914 18.4 995
Carrier 4 Container 20.6 1,108 27.9 1,511
Carrier 5 Container 1.0 54 1.0 54
Operationalexpenses and freight income Unit: million JPY/month
Base case Replace by RORO ship route Expenses Revenue Profit/Loss Expenses Revenue Profit/Loss
Carrier 1 Container 31.7 42.6 10.9 RORO 43.2 106.3 63.1
Carrier 3 Container 32.4 35.1 2.7 35.4 38.3 2.9
Carrier 4 Container 31.7 42.6 10.9 43.0 58.1 15.1
Carrier 5 Container 10.4 2.1 -8.3 10.4 2.1 -8.3
4.2 Sensitivity Analysis on Shipper’s Time Preference
Based on the simulation results in Section 4.1, we can say that carrierhas no reason for
establishing a weekly service by RORO ship at Hanshin Port.On the other hand, according to
Kimata and Takebayashi (2018), the marginal utility of shippers with respect to domestic
transport time and maritime transport time has increased in recent years.Therefore, it can be
meaningful to discuss the feasibility of the RORO ship route in term of the change of
shipper’s time preference.
For this sensitivity analysis, we install the scale parameter k into Equation (8):this scale
parameter can describethe sensitivity of the time preference. Then, Equation(8) can be
rewritten as
1 2 3D MU k T k T C = + + . (8')
Table 9 shows the results of simulation about the RORO ship route of Hanshin Port as
k=1, 1.25, 1.5, 1.75, 2.According to the simulation results, even if the time value doubles, the
frequency of transport of RORO ships at Hanshin Port is less than 4 vessel/month, and weekly
service cannot established.As k increases, the cargo volume of the route increases, but the
load factor is less than 0.6.
Table 9. Sensitivity analysis on shipper’s time preference
k=1 k=1.25 k=1.5 k=1.75 k=2
Transport frequency (vessel/month) 2.4 2.6 3.3 3.5 3.6
Cargo volume (TEU/month) 369 346 396 442 500
Load factor 0.651 0.562 0.509 0.532 0.591
4.3Sensitivity Analysis on Fare Level
Journal of the Eastern Asia Society for Transportation Studies, Vol.13, 2019
2291
The finding in Section 4.2 is that even if the shipper's time preference magnification is
increased considerably, the weekly service by the RORO ship at Hanshin Port cannot be
established.Then, we discuss the relation between the fare level and the establishment of the
weekly service as the final scenario study.As shown in Section 4.1, RORO carrier is profitable
and should be able to invest in fare discounts.
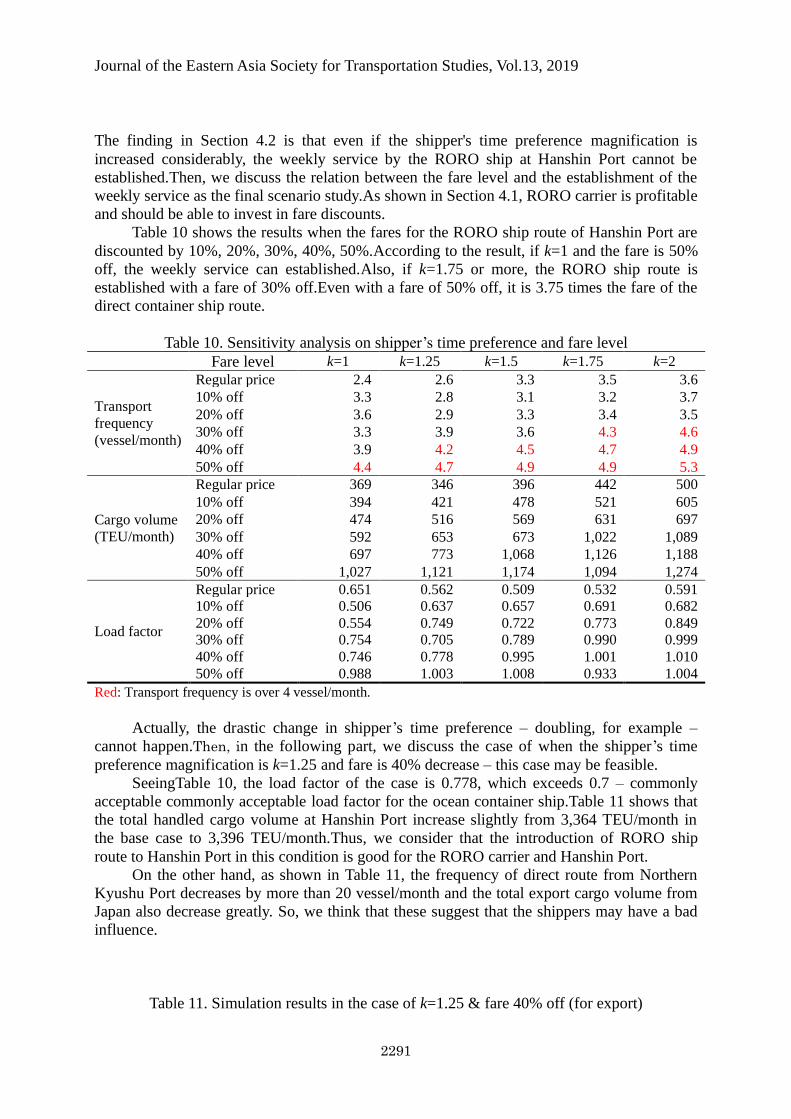
Table 10 shows the results when the fares for the RORO ship route of Hanshin Port are
discounted by 10%, 20%, 30%, 40%, 50%.According to the result, if k=1 and the fare is 50%
off, the weekly service can established.Also, if k=1.75 or more, the RORO ship route is
established with a fare of 30% off.Even with a fare of 50% off, it is 3.75 times the fare of the
direct container ship route.
Table 10. Sensitivity analysis on shipper’s time preference and fare level
Fare level k=1 k=1.25 k=1.5 k=1.75 k=2
Transport
frequency
(vessel/month)
Regular price 2.4 2.6 3.3 3.5 3.6
10% off 3.3 2.8 3.1 3.2 3.7
20% off 3.6 2.9 3.3 3.4 3.5
30% off 3.3 3.9 3.6 4.3 4.6
40% off 3.9 4.2 4.5 4.7 4.9
50% off 4.4 4.7 4.9 4.9 5.3
Cargo volume
(TEU/month)
Regular price 369 346 396 442 500
10% off 394 421 478 521 605
20% off 474 516 569 631 697
30% off 592 653 673 1,022 1,089
40% off 697 773 1,068 1,126 1,188
50% off 1,027 1,121 1,174 1,094 1,274
Load factor
Regular price 0.651 0.562 0.509 0.532 0.591
10% off 0.506 0.637 0.657 0.691 0.682
20% off 0.554 0.749 0.722 0.773 0.849
30% off 0.754 0.705 0.789 0.990 0.999
40% off 0.746 0.778 0.995 1.001 1.010
50% off 0.988 1.003 1.008 0.933 1.004
Red: Transport frequency is over 4 vessel/month.
Actually, the drastic change in shipper’s time preference – doubling, for example –
cannot happen.Then, in the following part, we discuss the case of when the shipper’s time
preference magnification is k=1.25 and fare is 40% decrease – this case may be feasible.
SeeingTable 10, the load factor of the case is 0.778, which exceeds 0.7 – commonly
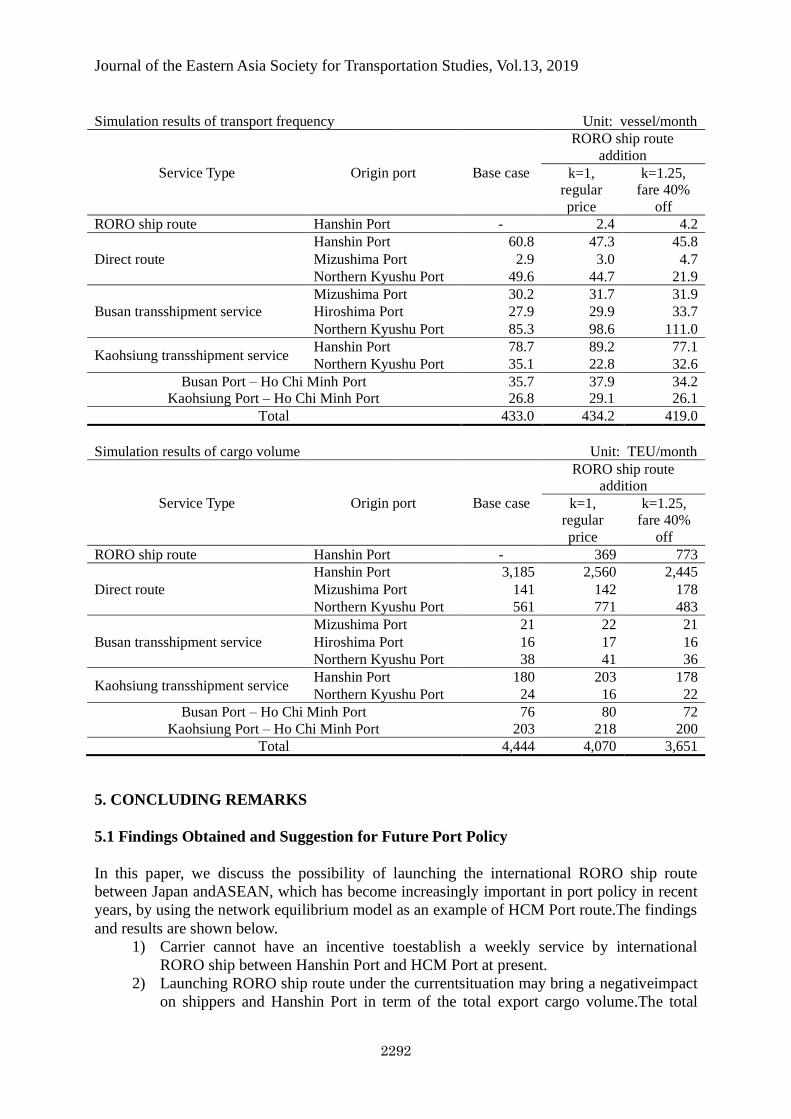
acceptable commonly acceptable load factor for the ocean container ship.Table 11 shows that
the total handled cargo volume at Hanshin Port increase slightly from 3,364 TEU/month in
the base case to 3,396 TEU/month.Thus, we consider that the introduction of RORO ship
route to Hanshin Port in this condition is good for the RORO carrier and Hanshin Port.
On the other hand, as shown in Table 11, the frequency of direct route from Northern
Kyushu Port decreases by more than 20 vessel/month and the total export cargo volume from
Japan also decrease greatly. So, we think that these suggest that the shippers may have a bad
influence.
Table 11. Simulation results in the case of k=1.25 & fare 40% off (for export)
Journal of the Eastern Asia Society for Transportation Studies, Vol.13, 2019
2292
Simulation results of transport frequency Unit: vessel/month
Service Type Origin port Base case
RORO ship route
addition
k=1,
regular
price
k=1.25,
fare 40%
off
RORO ship route Hanshin Port - 2.4 4.2
Direct route
Hanshin Port 60.8 47.3 45.8
Mizushima Port 2.9 3.0 4.7
Northern Kyushu Port 49.6 44.7 21.9
Busan transshipment service
Mizushima Port 30.2 31.7 31.9
Hiroshima Port 27.9 29.9 33.7
Northern Kyushu Port 85.3 98.6 111.0
Kaohsiung transshipment service Hanshin Port 78.7 89.2 77.1
Northern Kyushu Port 35.1 22.8 32.6
Busan Port – Ho Chi Minh Port 35.7 37.9 34.2
Kaohsiung Port – Ho Chi Minh Port 26.8 29.1 26.1
Total 433.0 434.2 419.0
Simulation results of cargo volume Unit: TEU/month
Service Type Origin port Base case
RORO ship route
addition
k=1,
regular
price
k=1.25,
fare 40%
off
RORO ship route Hanshin Port - 369 773
Direct route
Hanshin Port 3,185 2,560 2,445
Mizushima Port 141 142 178
Northern Kyushu Port 561 771 483
Busan transshipment service
Mizushima Port 21 22 21
Hiroshima Port 16 17 16
Northern Kyushu Port 38 41 36
Kaohsiung transshipment service Hanshin Port 180 203 178
Northern Kyushu Port 24 16 22
Busan Port – Ho Chi Minh Port 76 80 72
Kaohsiung Port – Ho Chi Minh Port 203 218 200
Total 4,444 4,070 3,651
5. CONCLUDING REMARKS
5.1 Findings Obtained and Suggestion for Future Port Policy
In this paper, we discuss the possibility of launching the international RORO ship route
between Japan andASEAN, which has become increasingly important in port policy in recent
years, by using the network equilibrium model as an example of HCM Port route.The findings
and results are shown below.
1) Carrier cannot have an incentive toestablish a weekly service by international
RORO ship between Hanshin Port and HCM Port at present.
2) Launching RORO ship route under the currentsituation may bring a negativeimpact
on shippers and Hanshin Port in term of the total export cargo volume.The total
Journal of the Eastern Asia Society for Transportation Studies, Vol.13, 2019
2293
handle cargo volume at Hanshin Port decreases.
3) If the shipper’s time preference increases, the number of cargos using this RORO
service will increase. However, it is difficult to establish a weekly service even if
the time preference magnification to the current rate is doubling.
4) If the fare level of RORO ship route can be lowered drastically, carrier may have a
weekly service.However, it should be noted that the transport frequency of direct
routes at other ports and the total export cargo volume can decrease.
Summary 1) can be a reason why the carriers do not set up the RORO ship route under
the present situation. Summary 2) can be a good suggestion for the policy makers. From this
suggestion, our concern is that there is a possibility that drop of shippers’ convenience and the
port’s competitivenesscan be reduce by introduction of a transport service that does not fit in
the situation.
As the realization of Society 5.0 approaches, the time value is said to increase in the
near future.From this, we think that international RORO ship with high transport speeds need
to be utilized more as important transport systems in the future.As shown in Summary 3) and
4), we consider that not only increase of time value but also reduction of fare is indispensable
in order to establish a RORO ship route.In addition to trying to reduce the operationalcost in a
structural manner, fare discounts due to the introduction of subsidies are also considered in
the short term.However, as noted in the summary, negative impacts such as a drop in
convenience at other ports and potential for export may occur, sowe think that careful
consideration is necessary.
5.2 Future Research
In this paper, we simulated the network between West Japan and HCM Port, but we have
room for verification as to whether or not the RORO ship route is established for other
markets of ASEAN.For extending our understanding about launching the long-haul RORO
services, we need to research other ASEAN routes.
As mentioned in Chapter 3, the reproducibility of the direct route of Northern Kyushu
Port in the simulation model of this paper is not sufficient. Furthermore, as mentioned in
Chapter 4, the simulation in this paper might underestimate the operational cost of the long
haul RORO service. In addition to improving the accuracy of the model and modeling other
routes mentioned above, modeling and analyzing the entire ASEAN main route including
trilateral transportation is also a future subject for us.
In addition, the RORO ship is said to be a transportation system located between the
aircraft and the container ship. In the future, we try to consider establishing a RORO ship
route including a shift from air cargo.
ACKNOWLEDGEMENTS
This research is partially supported by the Research Grant by the Ports & Harbours
Association of Japan (PHAJ). Waterfront Vitalization and Environment Research Foundation
(WAVE) also supports this research.
REFERENCES
Journal of the Eastern Asia Society for Transportation Studies, Vol.13, 2019
2294
1. Christodoulou, A., Raza, Z., Woxenius, J. (2019). The integration of RoRo
shipping in sustainable intermodal transport chains: The case of a north European
RoRo service, Sustainability, 11(8), 2422.
2. Japan External Trade Organization. (2013) 23th Investment Related Cost
Investigation in Asia/Oceania Major Cities/Areas.
3. Japan International Cooperation Agency (2013) The Master Plan and Feasibility
Study on the Establishment of an ASEAN Roll-On/Roll-Off (RO-RO) Shipping
Network and Short Sea Shipping
4. Kimata, J., Takebayashi, M. (2018) Port choice behavior of shippers to ASEAN:
Based on the container shipping survey 2003, 2008 and 2013. Transport Policy
Studies’ Review, J-Stage early publication version, pp. 1-9. (in Japanese)
5. Kim, M. J., Yoon, D. G. (2018) A study on current situation and future
development of RoRo routes in the Philippines, Journal of Korea Port Economic
Association, 34(1), pp. 1-18.
6. Kuroda, K., Takebayashi, M. and Tsuji, T. (2005) International container
transportation network analysis considering Post-Panamax class container ships,
Global Competition in Transportation Markets: Analysis and Policy Making,
edited by Adib Kanafani and Katsuhiko Kuroda, pp. 369-391.
7. MLIT, Japan. National Integrated Transport Analysis System (NITAS).
8. MLIT, Japan. (2014) National Survey of Import/Export Container Cargo Flow
2013.
9. MLIT, Japan. (2015) Harbor Statistics (Annual report) 2013.
10. Ocean Commerce Ltd. (2013, 2018) International Transportation Handbook
2013/2018.
11. Oka, H., Takebayashi, M. (2015) Feasibility analysis of launching RORO vessel
services: Full cost approach. Transport Policy Studies’ Review, Vol. 17, No. 4, pp.
2-8. (in Japanese)
12. Ports and Harbours Bureau, MLIT, Japan. (2017) Cost-Effectiveness Analysis
Manual of Port Development Project. (in Japanese)
13. Ports and Harbours Bureau, MLIT, Japan. (2018) PORT 2030. (in Japanese)
14. Shibasaki, R., Watanabe, T., Ieda, H. (2011) A large-scale simulation of
international maritime container shipping considering optimal behavior of shippers
and oceangoing carriers. Journal of Japan Society of Civil Engineers Series D3,
Vol. 67, No. 4, pp. 455-474. (in Japanese)
15. Takebayashi, M. (2011) Evaluation of Asian airports as gateway: Application of
network equilibrium model. Pacific Economic Review, Vol. 16(1), pp. 64-82.
16. Takebayashi, M. (2013) Network competition and the difference in operating cost:
Model analysis, Transportation Research Part E, Vol. 57, pp. 85-94.
17. Takebayashi, M. (2015) Multiple hub network and high-speed railway:
Connectivity, gateway, and airport leakage. Transportation Research Part A, Vol.
79, pp. 55-64.