Embed Size (px)
Citation preview
How Real-Time Biosurveillance Can Help Clinical Practice
Andrew M. Fine, MD, MPH
Dec 14, 2012 Grand Rounds
Health Sciences Informatics Johns Hopkins University
Baltimore, MD
Disclosures
Andrew Fine, MD, MPH has no financial
relationship with any commercial interest.
Objectives
1. Understand the value of biosurveillance as a predictor of communicable disease
2. Describe the incorporation of biosurveillance into a clinical prediction model for strep throat at the point of care
3. Describe the incorporation of biosurveillance data into a prediction model for strep throat for use by patients prior to a clinical encounter
www.sportsillustrated.com
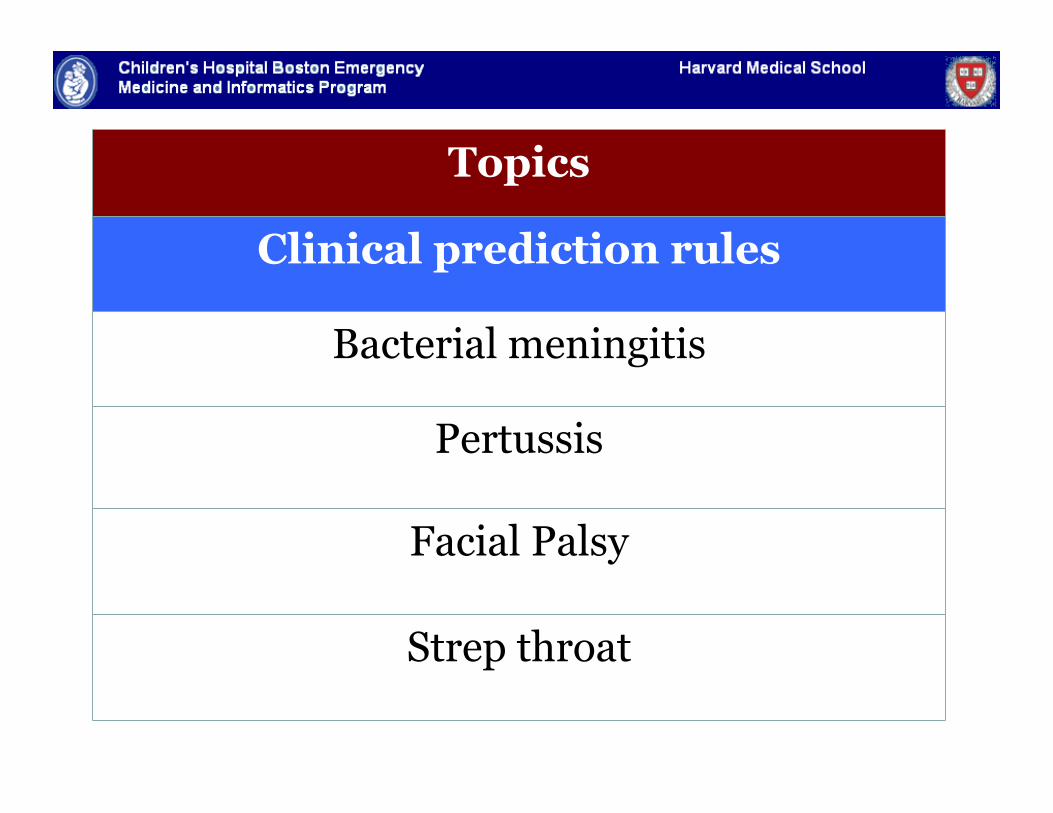
Topics
Clinical prediction rules
Bacterial meningitis
Pertussis
Facial Palsy
Strep throat
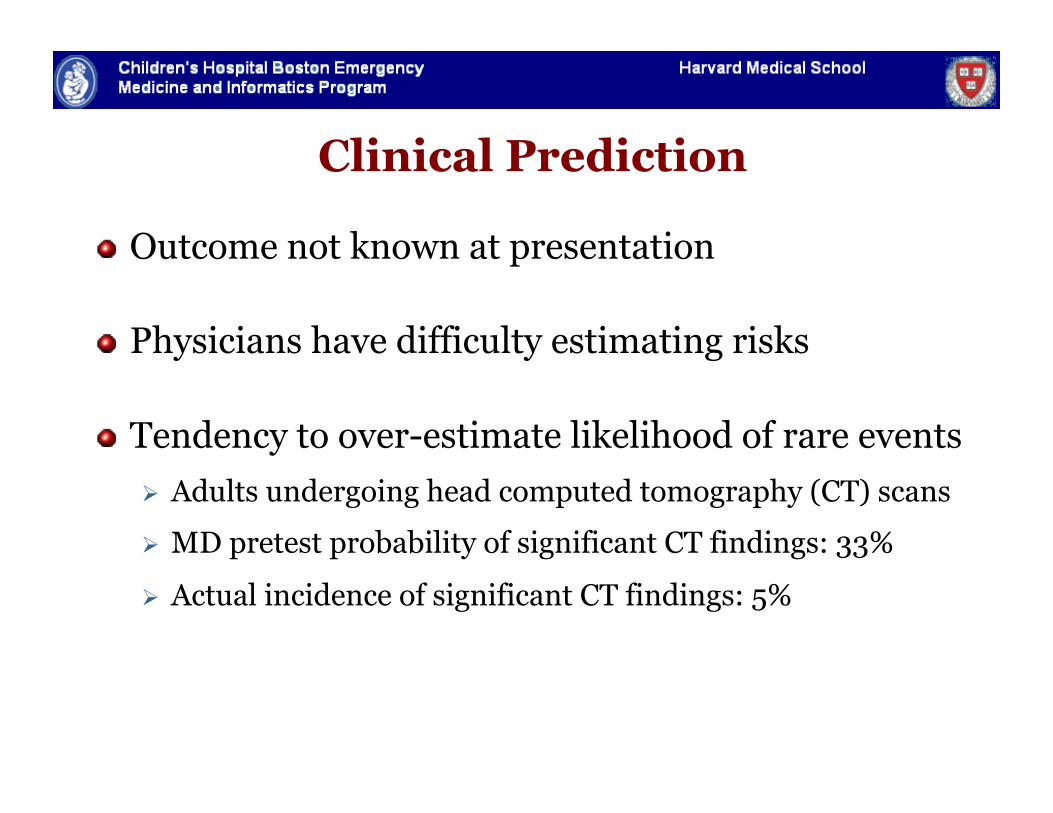
Clinical Prediction
" Outcome not known at presentation
" Physicians have difficulty estimating risks
" Tendency to over-estimate likelihood of rare events Adults undergoing head computed tomography (CT) scans
MD pretest probability of significant CT findings: 33%
Actual incidence of significant CT findings: 5%
Clinical Prediction Rules
" Combine history, physical exam, and laboratory data to estimate probability of an outcome
" Can also suggest next course of management
" Designed to assist NOT replace decision-making
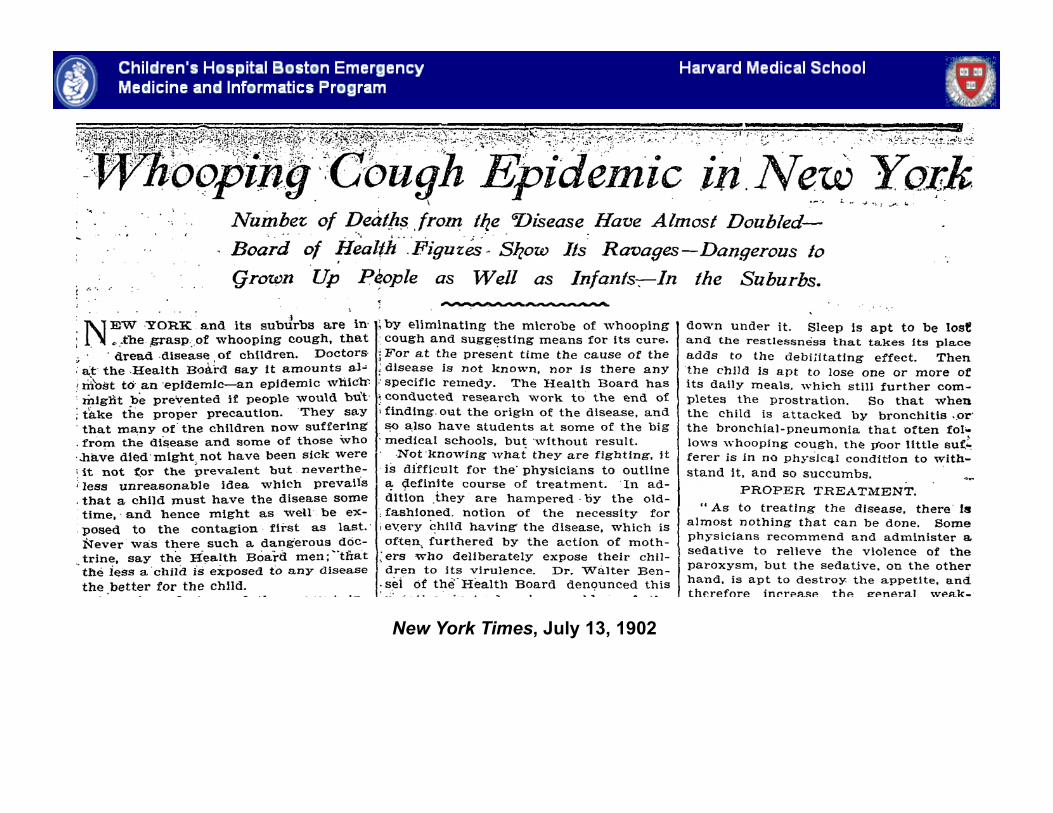
New York Times, July 13, 1902
Approaches to an Infant with a Cough
Case: 7 m.o. presents to the ED with 2 days of cough, low-grade fever.
Approaches to an Infant with a Cough
Case: 7 m.o. presents to the ED with 2 days of cough, low-grade fever.
1) Standard: Diagnosed with upper respiratory infection; dc’d home.
Approaches to an Infant with a Cough
Case: 7 m.o. presents to the ED with 2 days of cough, low-grade fever.
1) Standard: Diagnosed with upper respiratory infection; dc’d home.
2) Bias: The clinician heard about some recent pertussis cases so he enters symptoms into an on-line calculator and estimates the child’s pertussis risk at 4%.
3) Epidemiologic Context: The clinician enters the symptoms into an on-line calculator, which automatically incorporates real-time biosurveillance data quantifying the recent local pertussis incidence; estimates the child’s pertussis risk at 24%.
Epidemiology Adds Important Context
" Risk of disease depends on exposure to others who are infected
" Risk of exposure depends on local disease incidence
" Can the integration of real-time epidemiology improve the accuracy of clinical prediction rules?
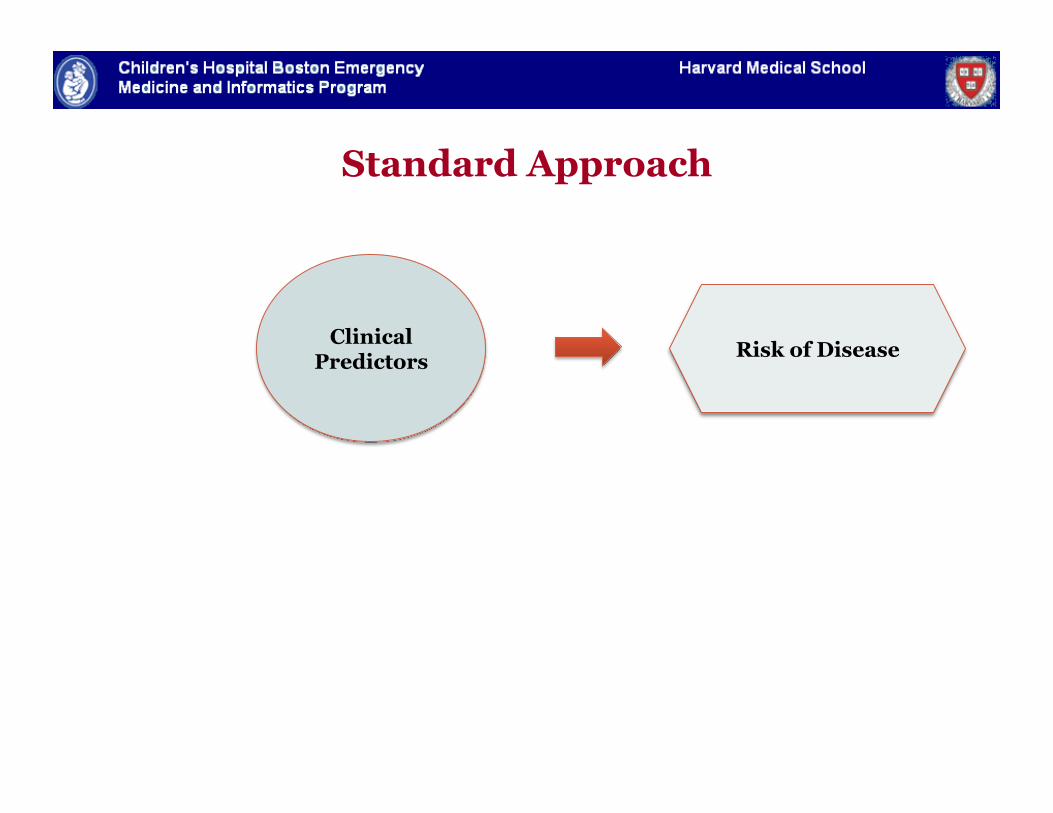
Standard Approach
Clinical Predictors Risk of Disease
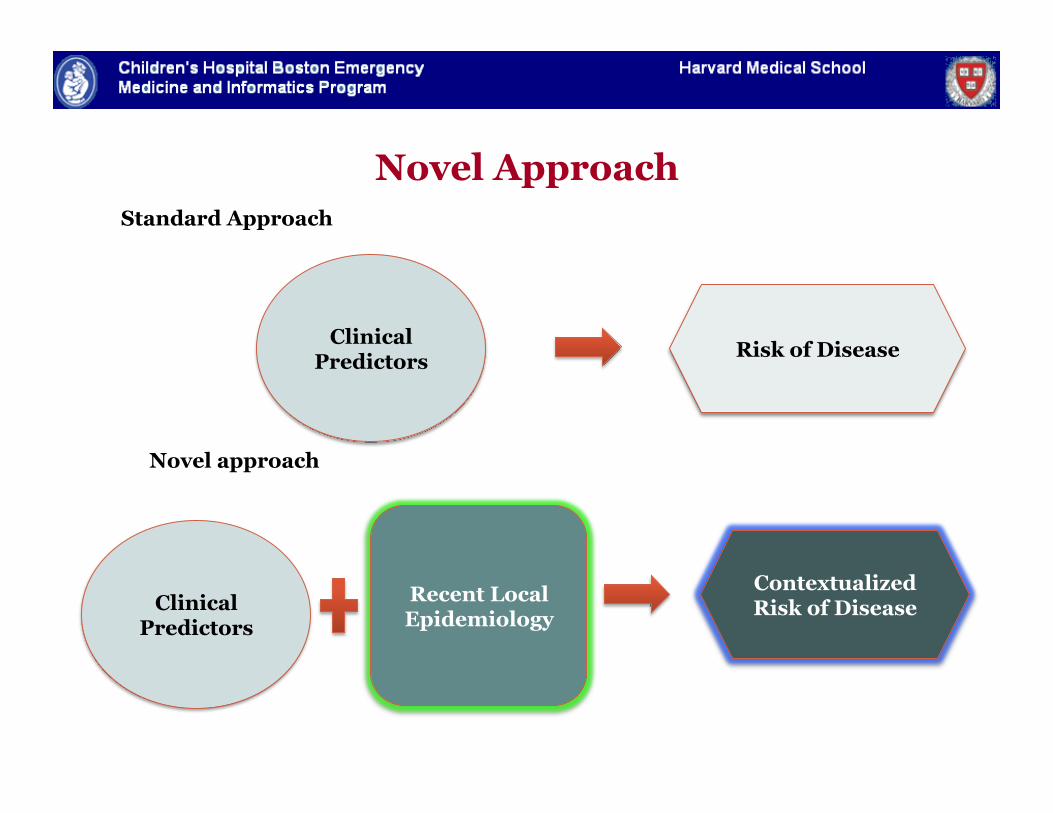
Clinical Predictors
Contextualized Risk of Disease
Recent Local Epidemiology
Clinical Predictors Risk of Disease
Standard Approach
Novel approach
Novel Approach
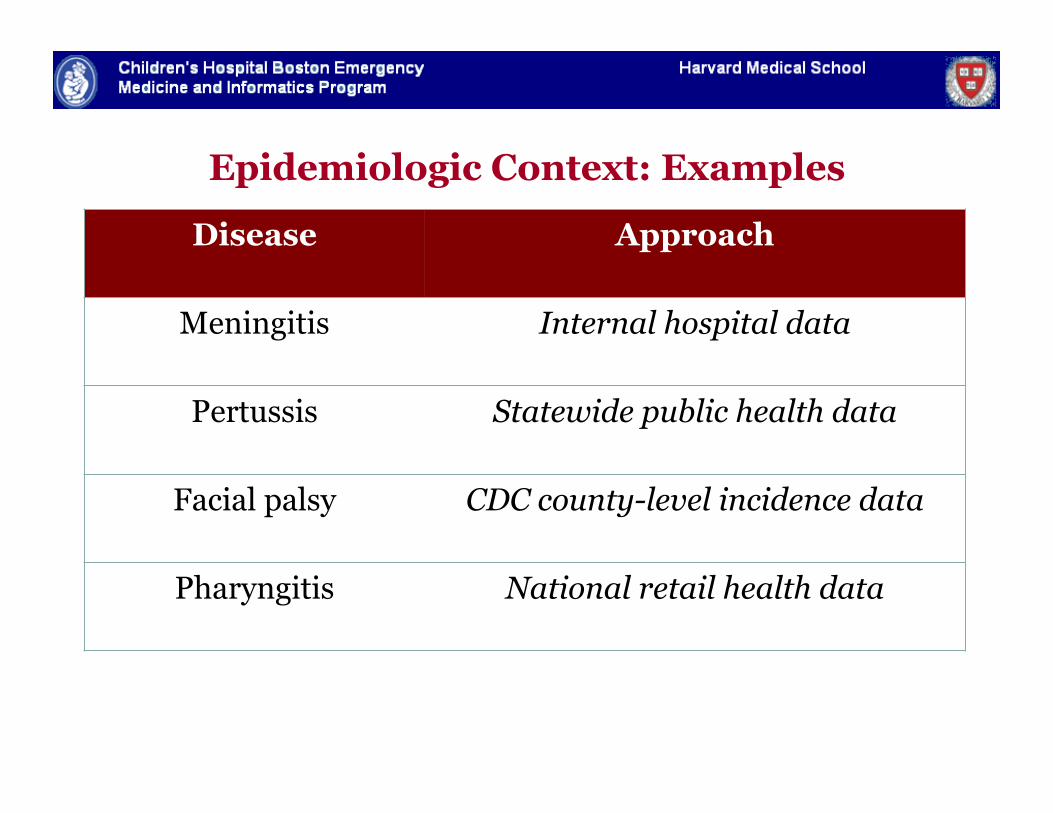
Epidemiologic Context: Examples
Disease Approach
Meningitis Internal hospital data
Pertussis Statewide public health data
Facial palsy CDC county-level incidence data
Pharyngitis National retail health data
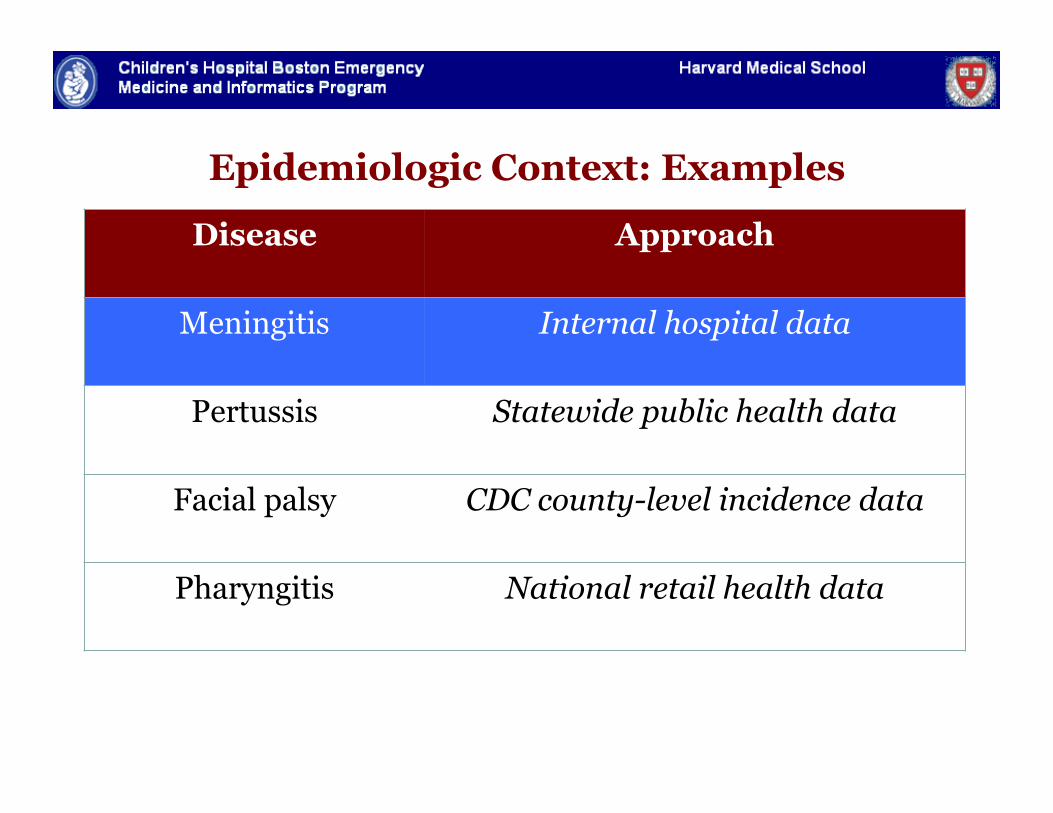
Epidemiologic Context: Examples
Disease Approach
Meningitis Internal hospital data
Pertussis Statewide public health data
Facial palsy CDC county-level incidence data
Pharyngitis National retail health data
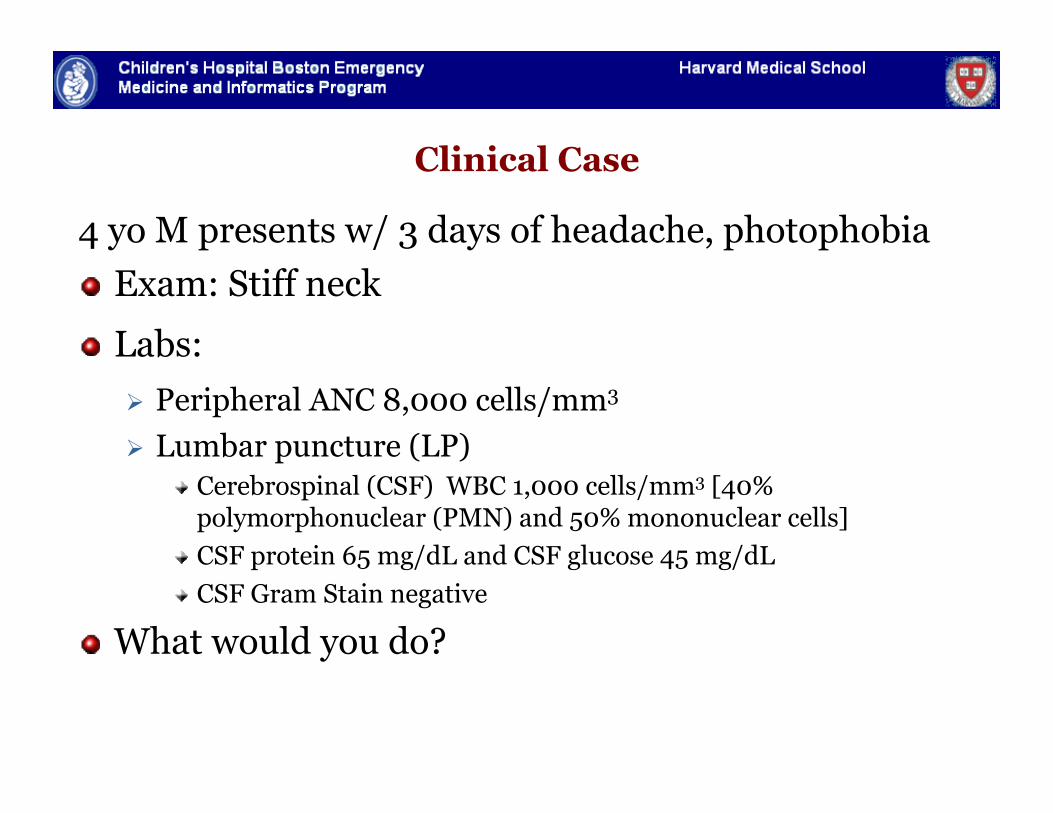
Clinical Case
4 yo M presents w/ 3 days of headache, photophobia " Exam: Stiff neck
" Labs: Peripheral ANC 8,000 cells/mm3 Lumbar puncture (LP)
" Cerebrospinal (CSF) WBC 1,000 cells/mm3 [40% polymorphonuclear (PMN) and 50% mononuclear cells]
" CSF protein 65 mg/dL and CSF glucose 45 mg/dL " CSF Gram Stain negative
" What would you do?
Meningitis
" Most children with CSF pleocytosis have aseptic, not bacterial, meningitis
Bacterial meningitis → parenteral antibiotics
Aseptic meningitis → supportive care
" Challenge to promptly identify those children with bacterial meningitis without over treating those with aseptic meningitis
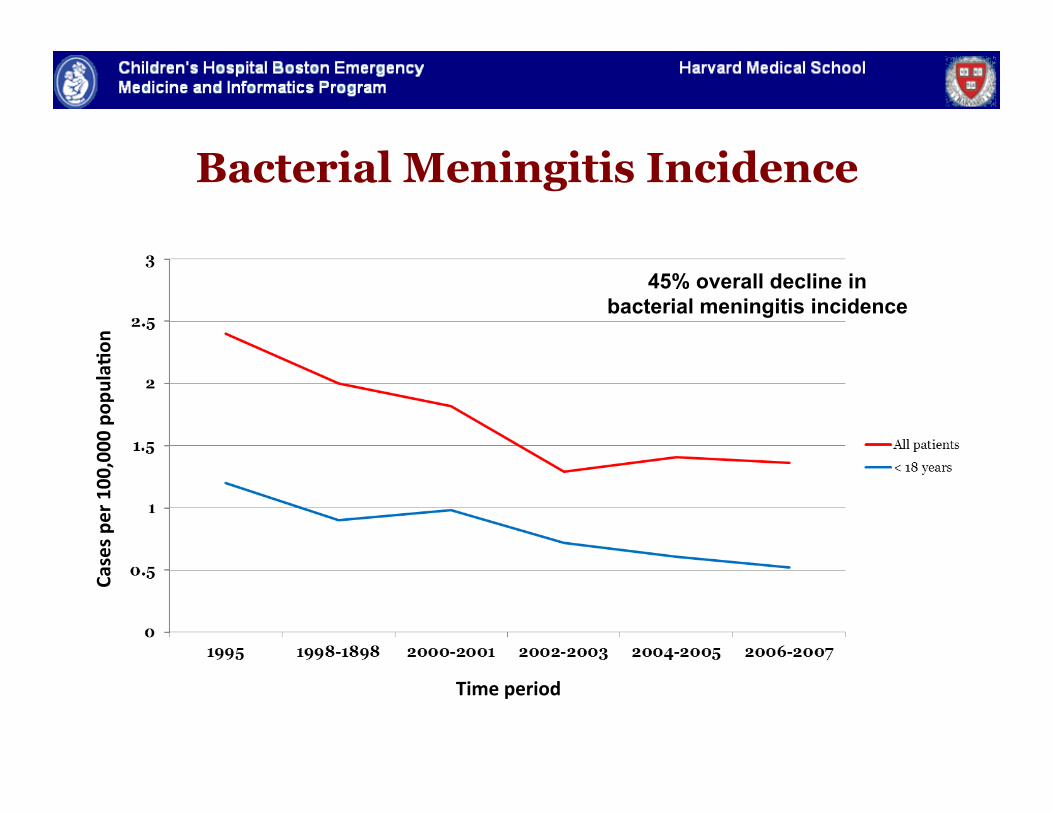
Bacterial Meningitis Incidence
Time period
Cases pe
r 100,000 po
pula2on
45% overall decline in bacterial meningitis incidence
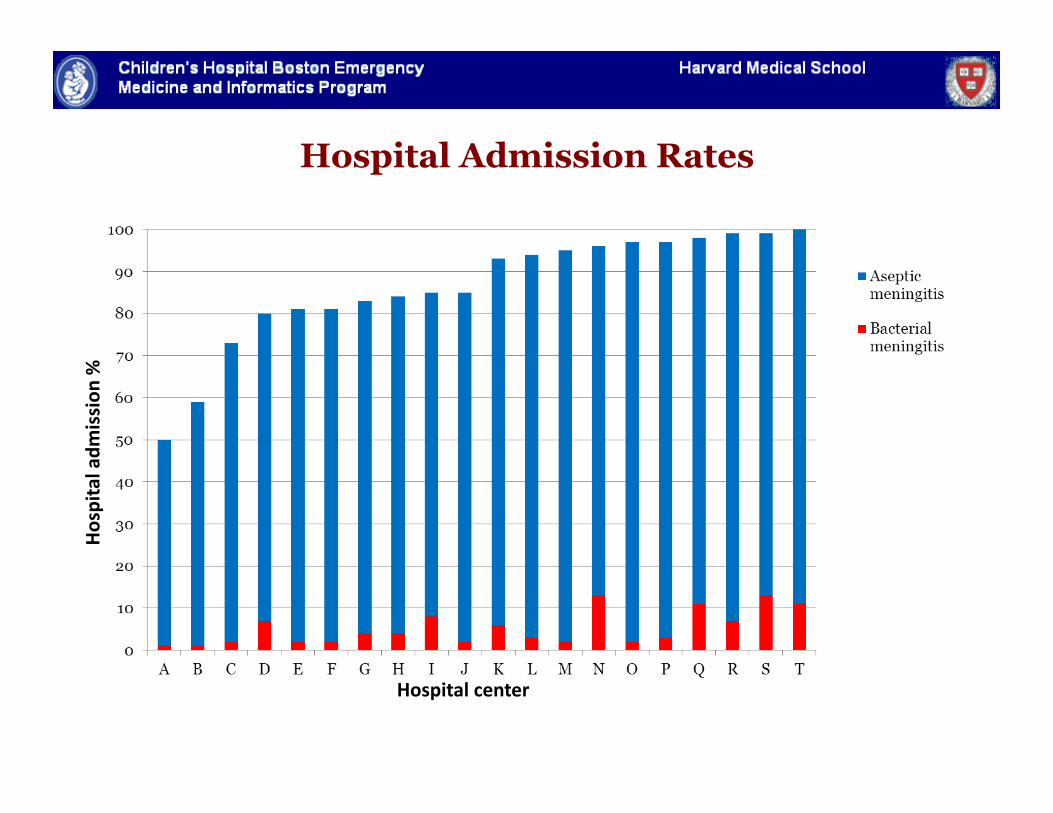
Hospital Admission Rates
Nigrovic et al. JAMA 2007.
Hospital center
Hospital adm
ission
%
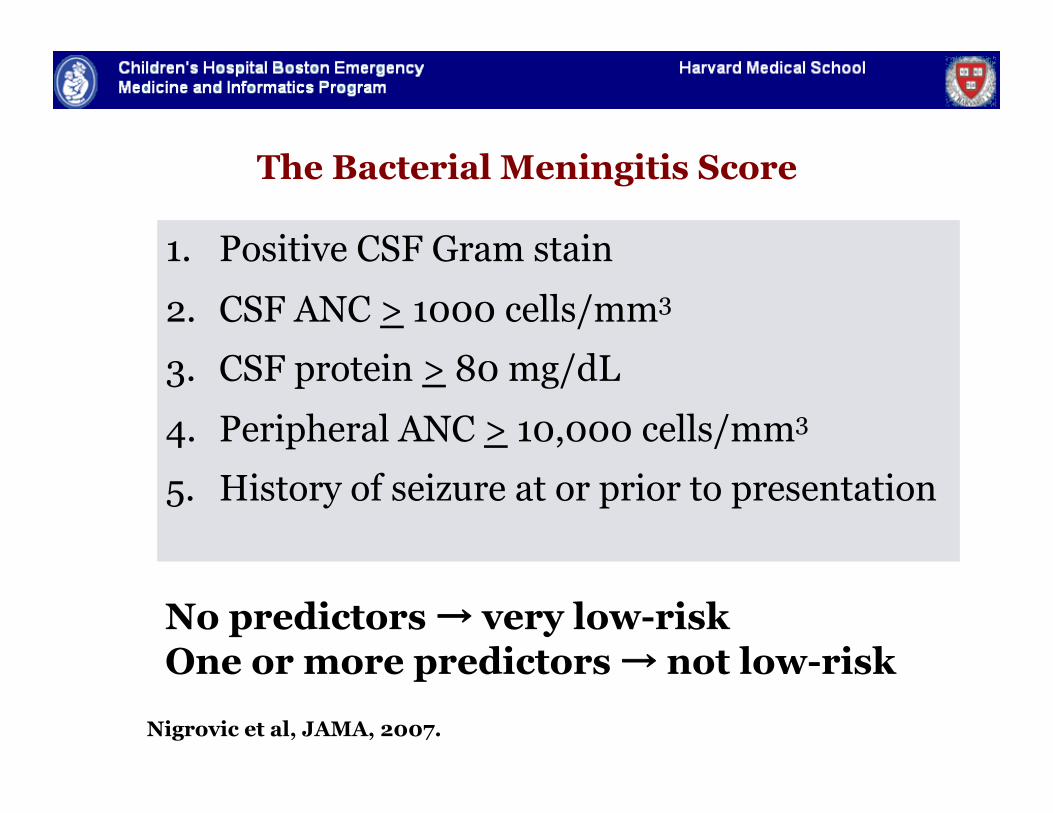
No predictors → very low-risk One or more predictors → not low-risk
The Bacterial Meningitis Score
1. Positive CSF Gram stain
2. CSF ANC > 1000 cells/mm3
3. CSF protein > 80 mg/dL
4. Peripheral ANC > 10,000 cells/mm3
5. History of seizure at or prior to presentation
Nigrovic et al, JAMA, 2007.
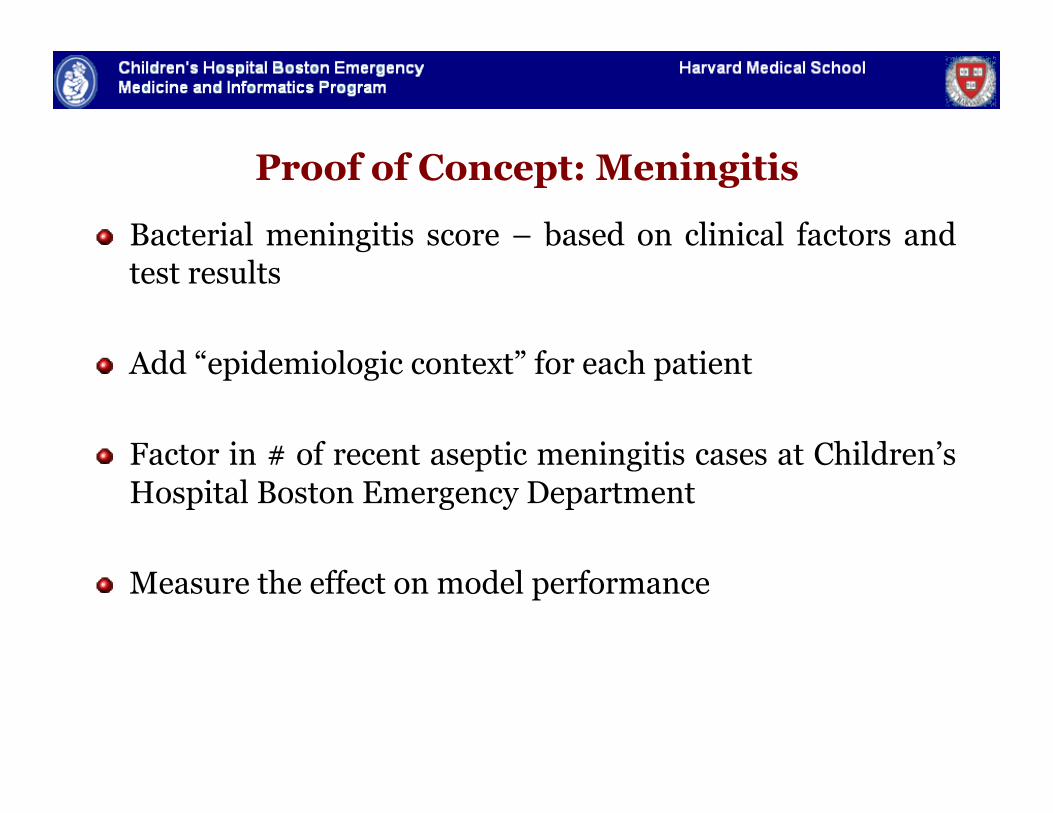
Proof of Concept: Meningitis
" Bacterial meningitis score – based on clinical factors and test results
" Add “epidemiologic context” for each patient
" Factor in # of recent aseptic meningitis cases at Children’s Hospital Boston Emergency Department
" Measure the effect on model performance
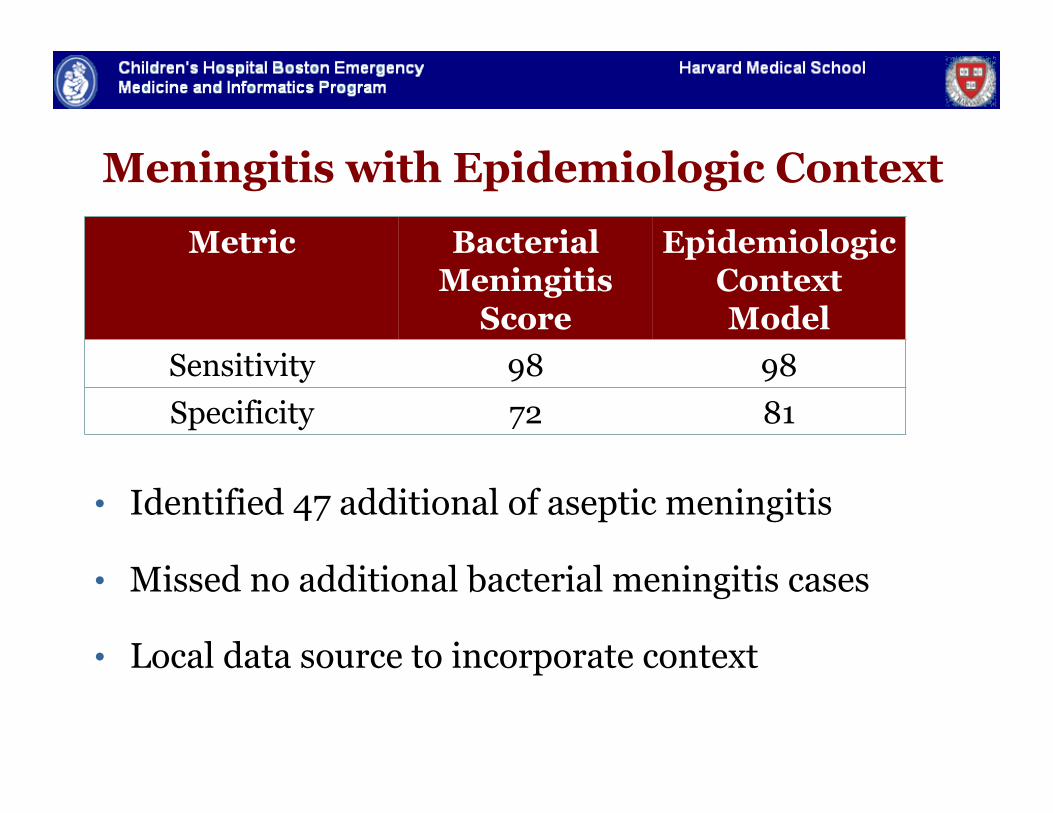
Meningitis with Epidemiologic Context
• Identified 47 additional of aseptic meningitis
• Missed no additional bacterial meningitis cases
• Local data source to incorporate context
Metric Bacterial Meningitis
Score
Epidemiologic Context Model
Sensitivity 98 98 Specificity 72 81
Fine et al. JAMIA 2007
Meningitis Take Home Point
" Proof of concept
" Integrating epidemiology adjusts the rule and improves its performance
" Explore other diseases where context would matter
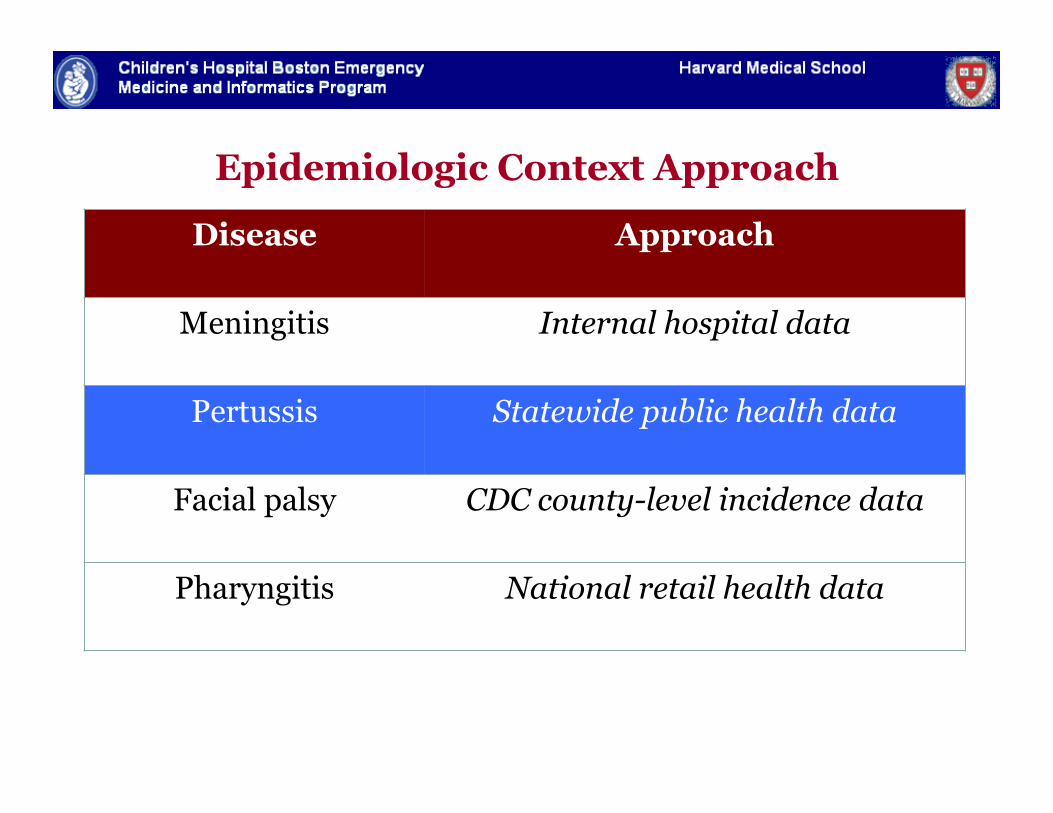
Epidemiologic Context Approach
Disease Approach
Meningitis Internal hospital data
Pertussis Statewide public health data
Facial palsy CDC county-level incidence data
Pharyngitis National retail health data
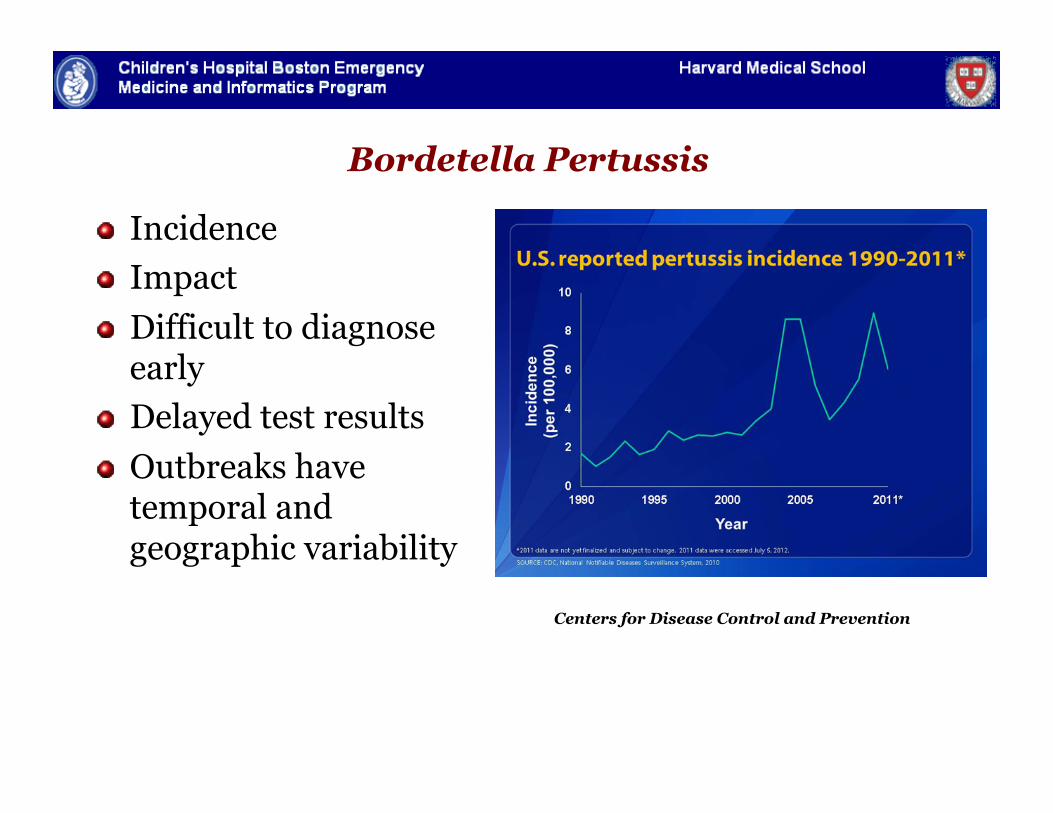
Bordetella Pertussis
" Incidence " Impact " Difficult to diagnose
early " Delayed test results " Outbreaks have
temporal and geographic variability
Centers for Disease Control and Prevention
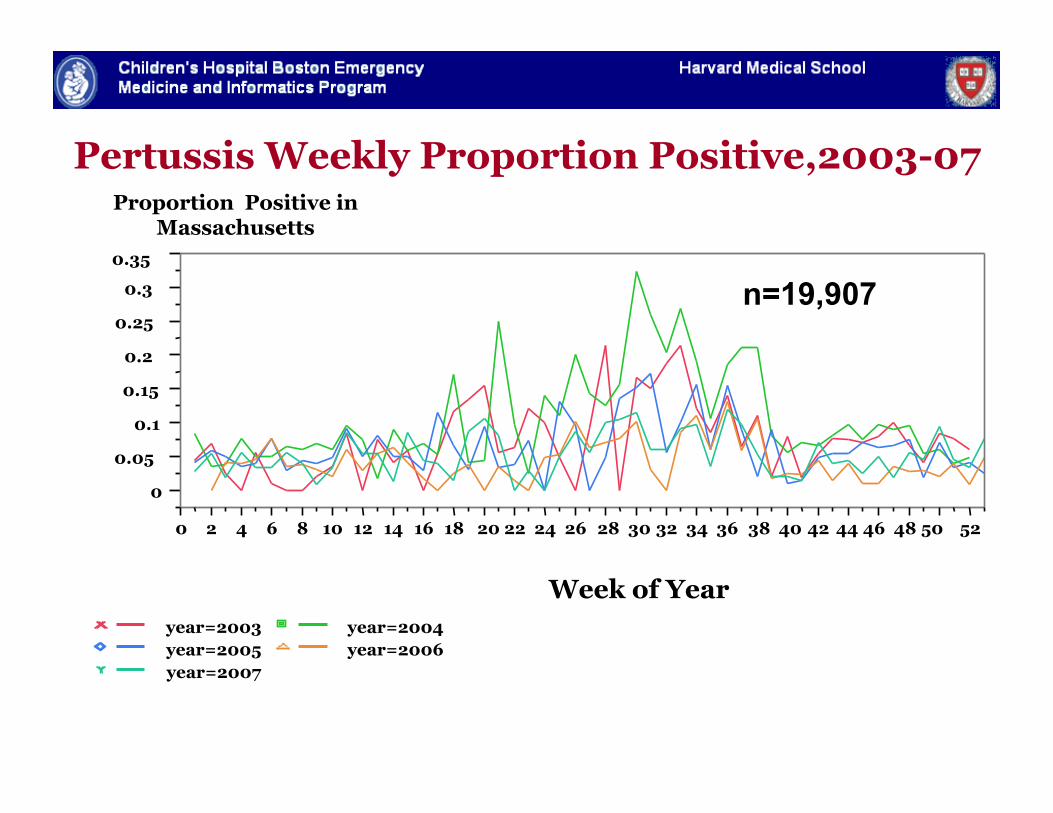
Pertussis Weekly Proportion Positive,2003-07
0
0.05 0.1
0.15 0.2
0.25 0.3
0.35
0 2 4 6 8 10 12 14 16 18 20 22 24 26 28 30 32 34 36 38 40 42 44 46 48 50 52
Week of Year year=2003 year=2004 year=2005 year=2006 year=2007
Proportion Positive in Massachusetts
Fine et al JAMIA 2010
n=19,907

Pertussis Weekly Proportion Positive,2003-07
0
0.05 0.1
0.15 0.2
0.25 0.3
0.35
0 2 4 6 8 10 12 14 16 18 20 22 24 26 28 30 32 34 36 38 40 42 44 46 48 50 52
Week of Year year=2003 year=2004 year=2005 year=2006 year=2007
Proportion Positive in Massachusetts
Fine et al JAMIA 2010
n=19,907
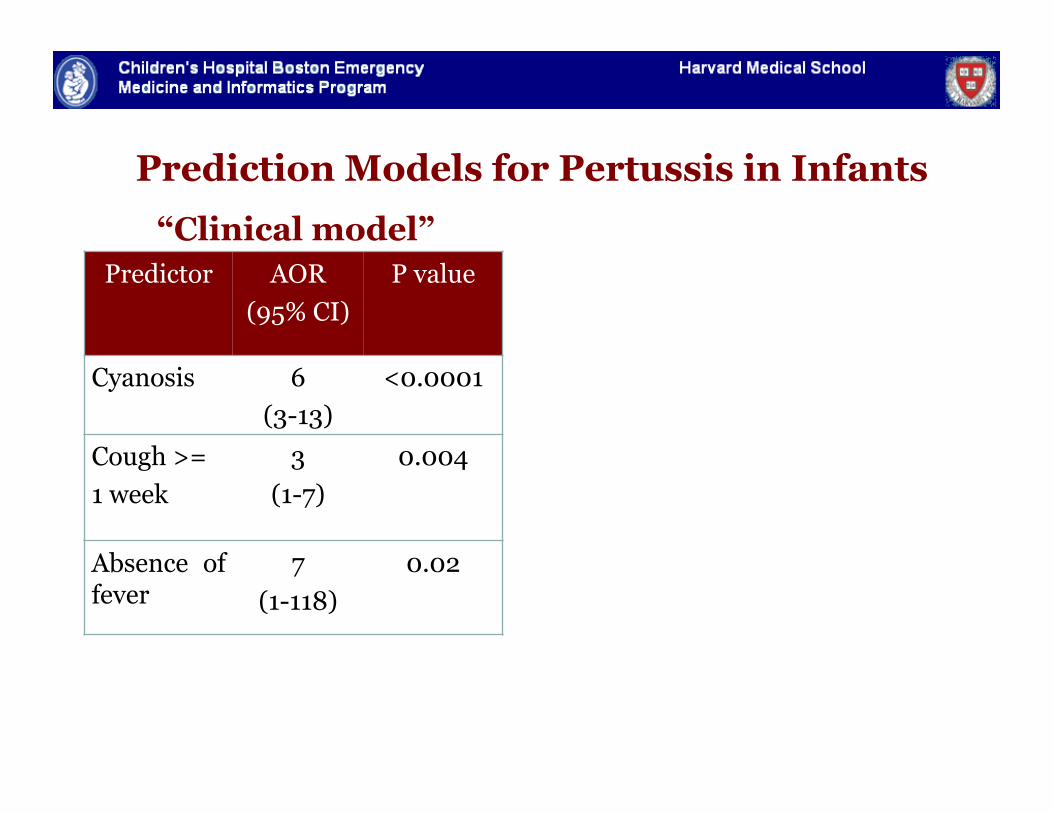
Predictor AOR (95% CI)
P value
Cyanosis 6 (3-13)
<0.0001
Cough >= 1 week
3 (1-7)
0.004
Absence of fever
7 (1-118)
0.02
Prediction Models for Pertussis in Infants
“Clinical model”
Predictor AOR (95% CI)
P value
Cyanosis 6 (3-13)
<0.0001
Cough >= 1 week
3 (1-7)
0.004
Absence of fever
7 (1-118)
0.02
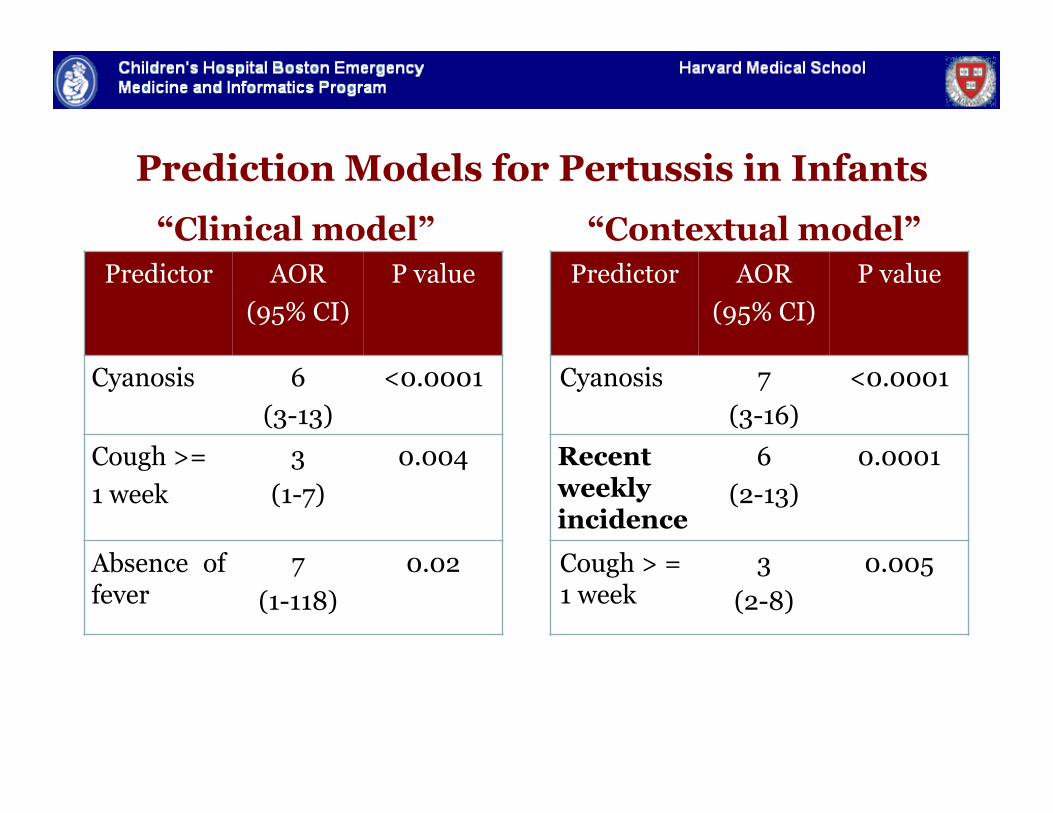
Prediction Models for Pertussis in Infants
“Clinical model” “Contextual model” Predictor AOR
(95% CI) P value
Cyanosis 7 (3-16)
<0.0001
Recent weekly incidence
6 (2-13)
0.0001
Cough > = 1 week
3 (2-8)
0.005
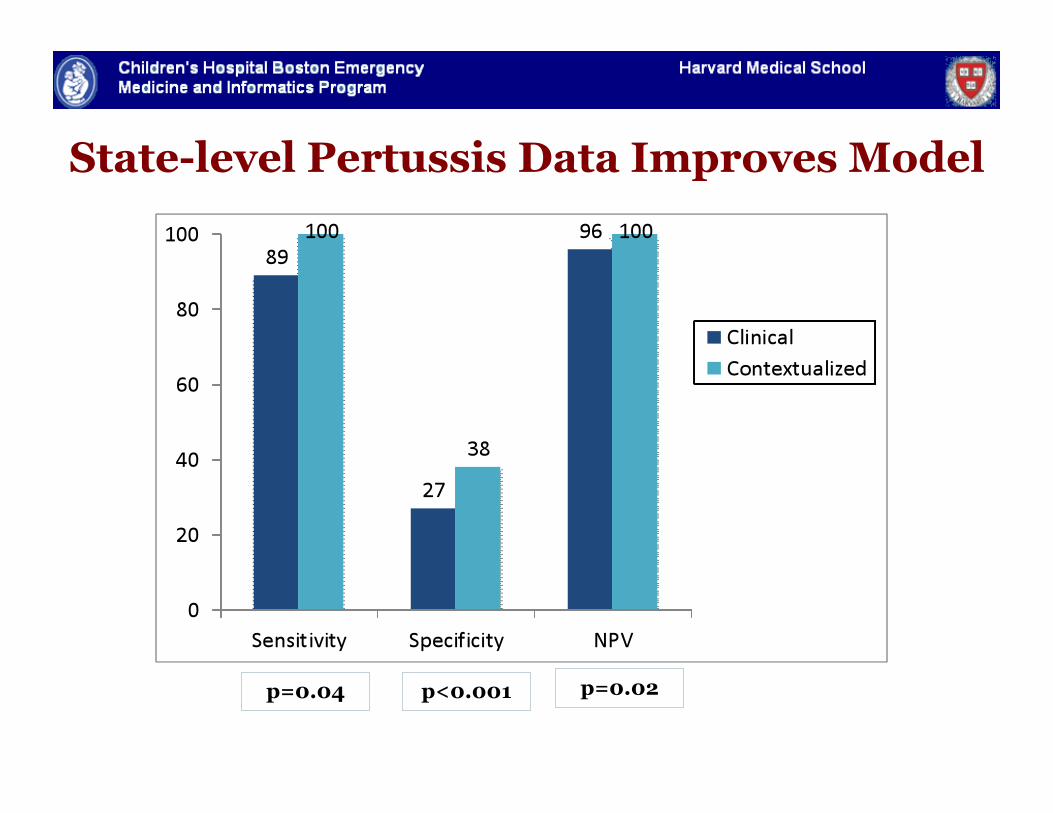
State-level Pertussis Data Improves Model
p=0.04 p<0.001 p=0.02
Pertussis Take Home Points
" Statewide public health data source
" Information about patients of all ages applied to predict pertussis in infants
" Real-time biosurveillance could improve management of a difficult to diagnose vaccine preventable disease
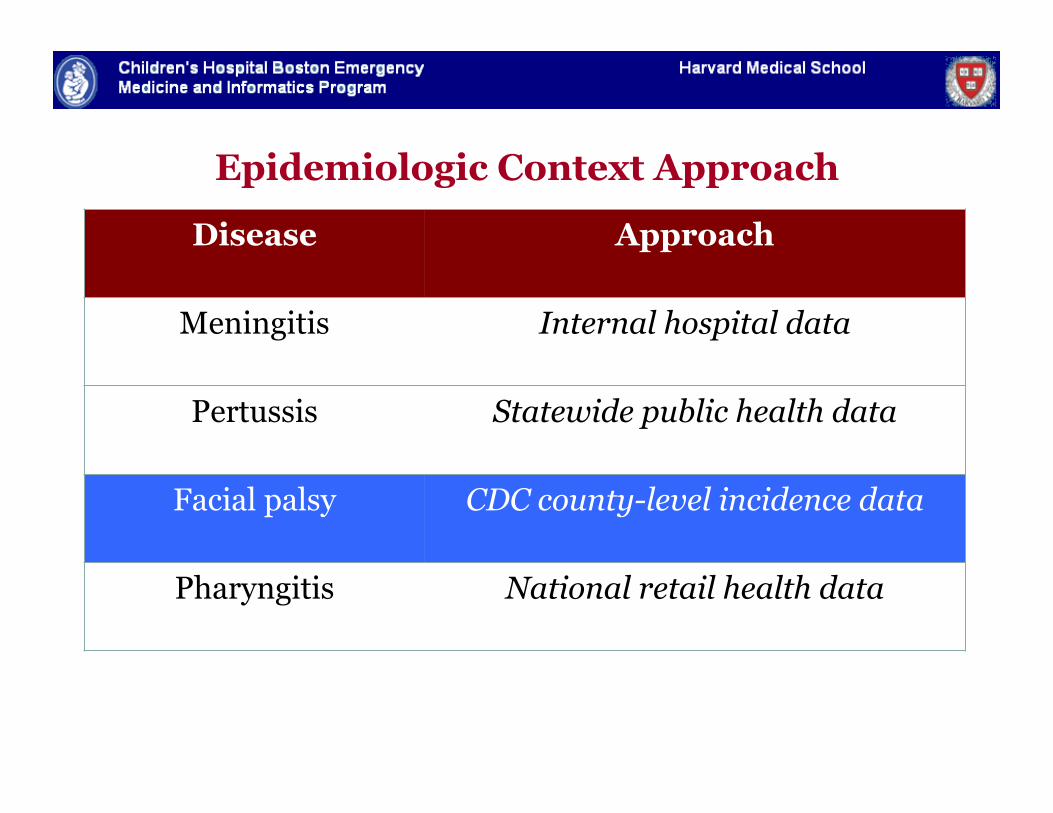
Epidemiologic Context Approach
Disease Approach
Meningitis Internal hospital data
Pertussis Statewide public health data
Facial palsy CDC county-level incidence data
Pharyngitis National retail health data
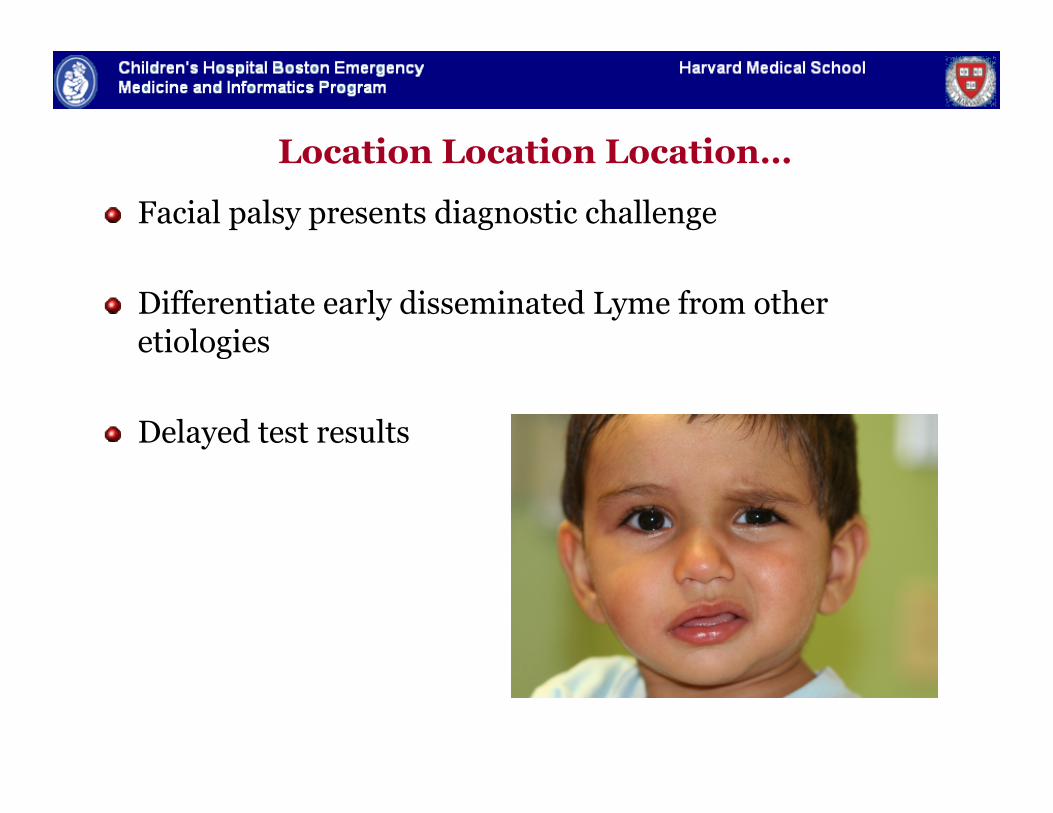
Location Location Location…
" Facial palsy presents diagnostic challenge
" Differentiate early disseminated Lyme from other etiologies
" Delayed test results
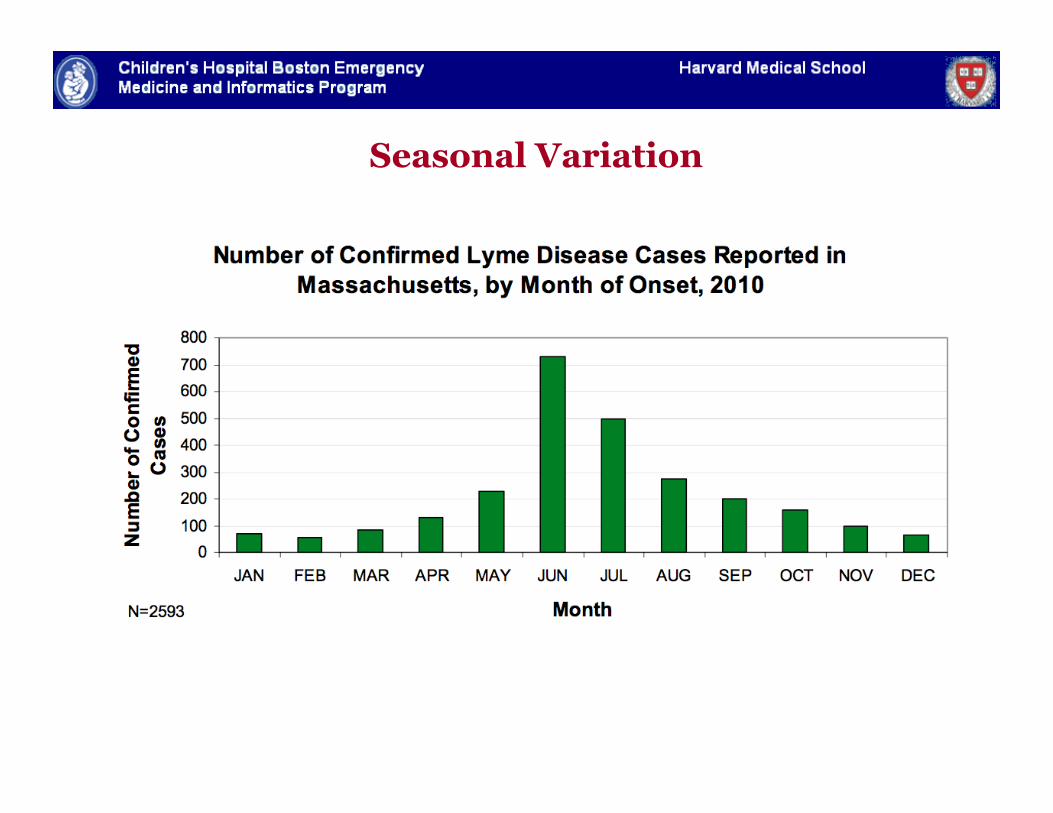
Seasonal Variation
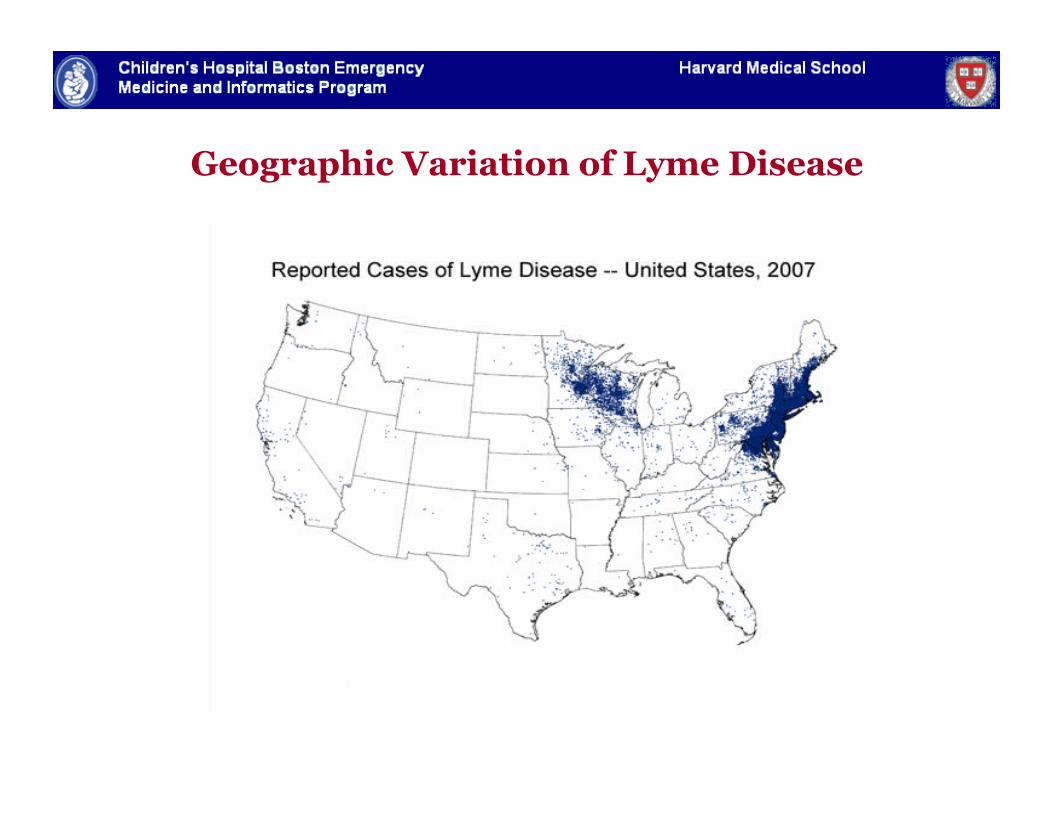
Geographic Variation of Lyme Disease
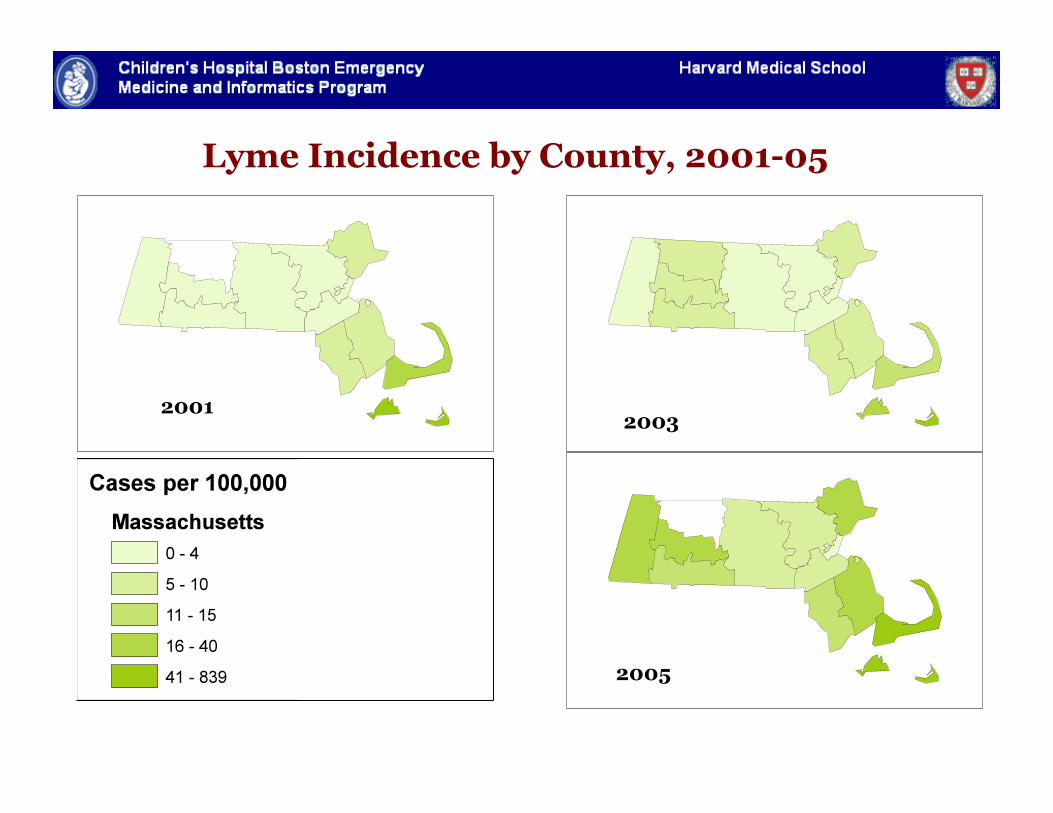
Lyme Incidence by County, 2001-05
2001 2003
2005
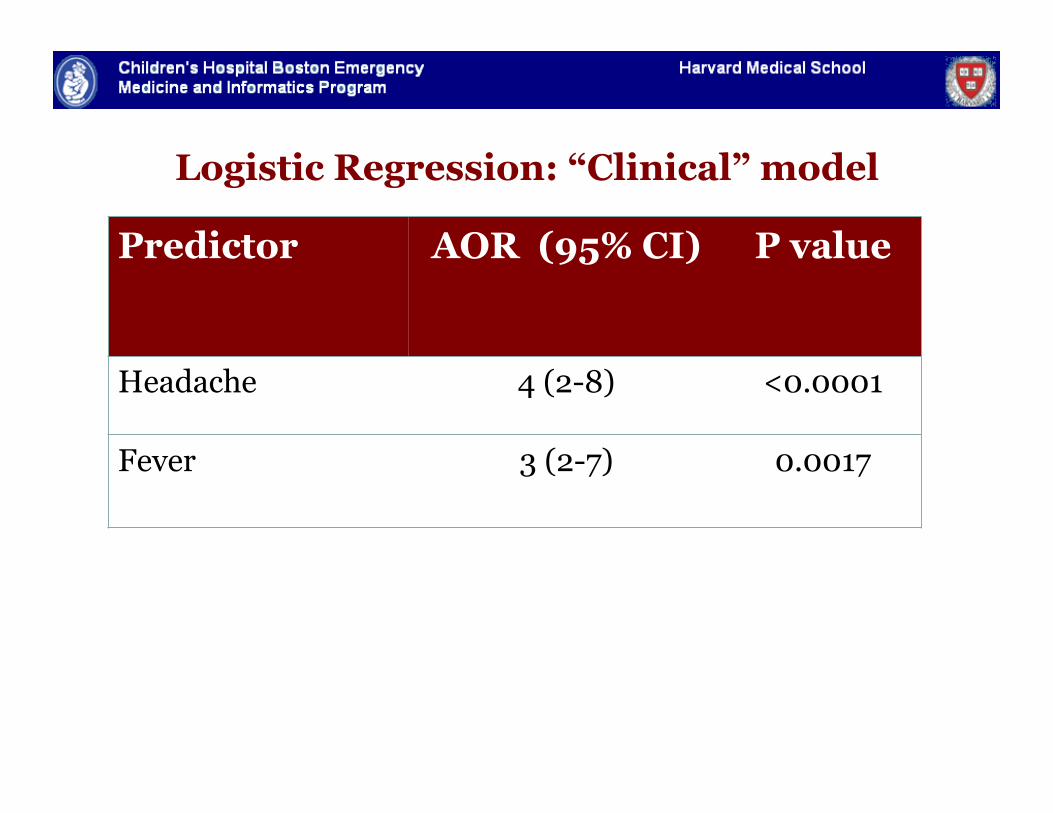
Logistic Regression: “Clinical” model
Predictor AOR (95% CI) P value
Headache 4 (2-8) <0.0001
Fever 3 (2-7) 0.0017
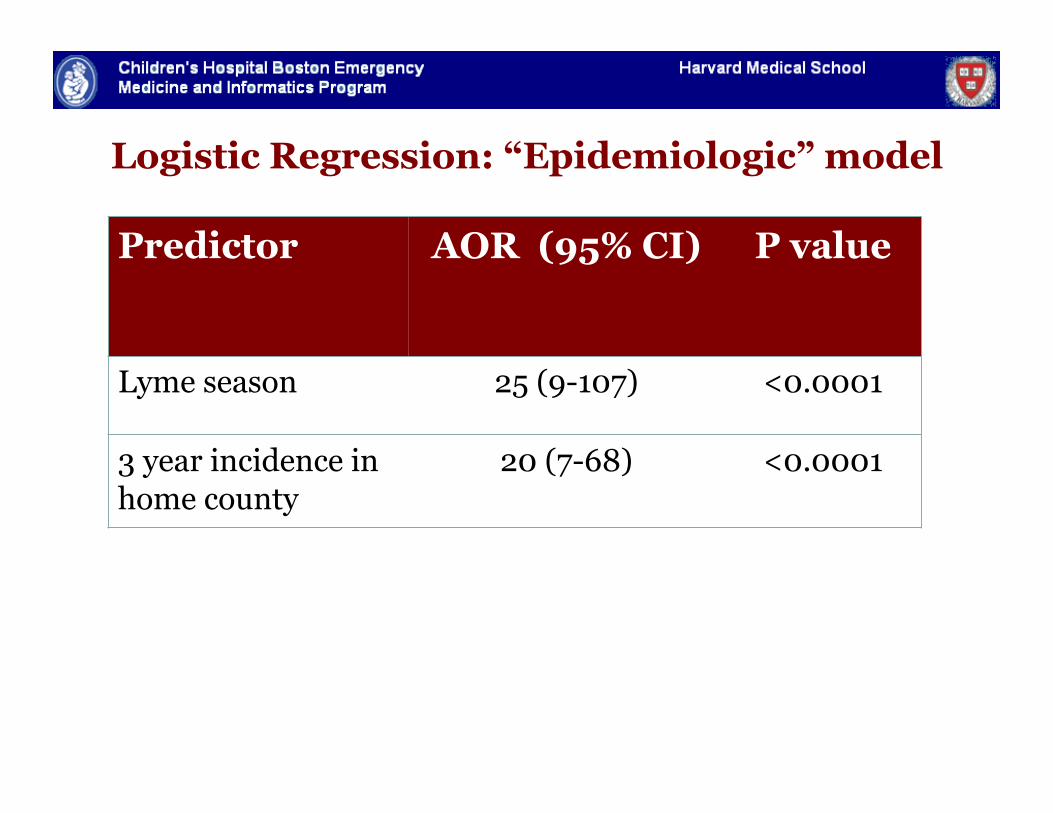
Logistic Regression: “Epidemiologic” model
Predictor AOR (95% CI) P value
Lyme season 25 (9-107) <0.0001
3 year incidence in home county
20 (7-68) <0.0001
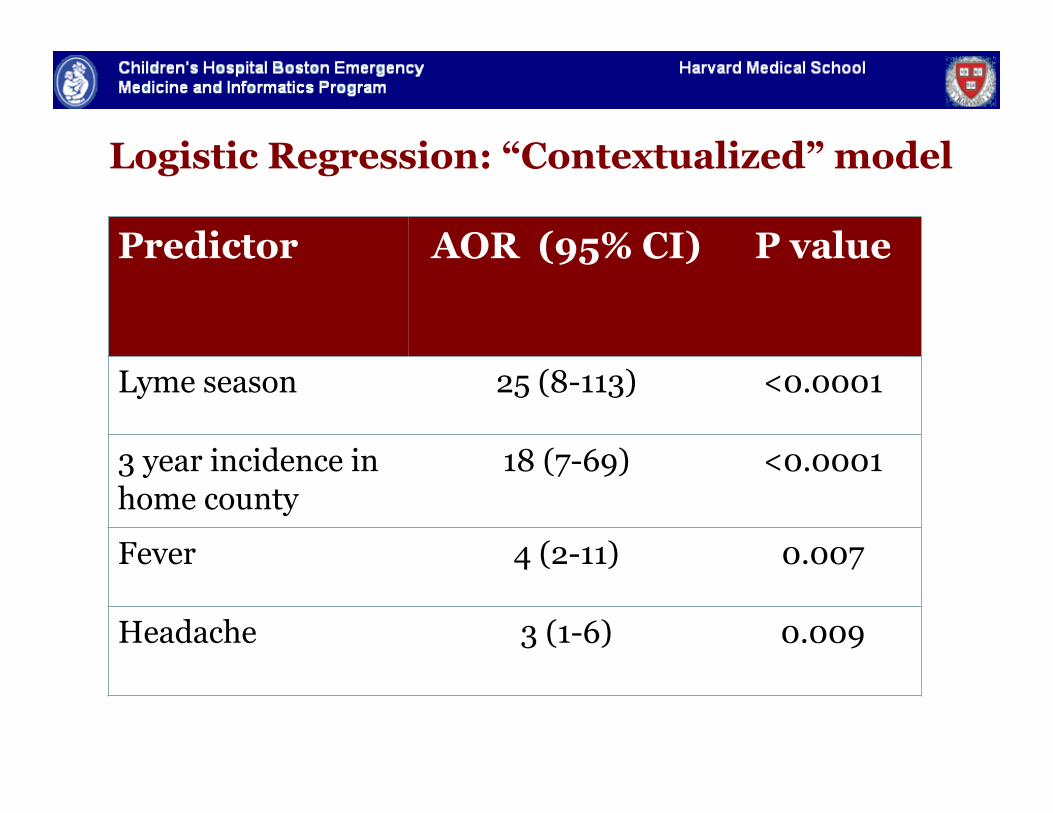
Logistic Regression: “Contextualized” model
Predictor AOR (95% CI) P value
Lyme season 25 (8-113) <0.0001
3 year incidence in home county
18 (7-69) <0.0001
Fever 4 (2-11) 0.007
Headache 3 (1-6) 0.009
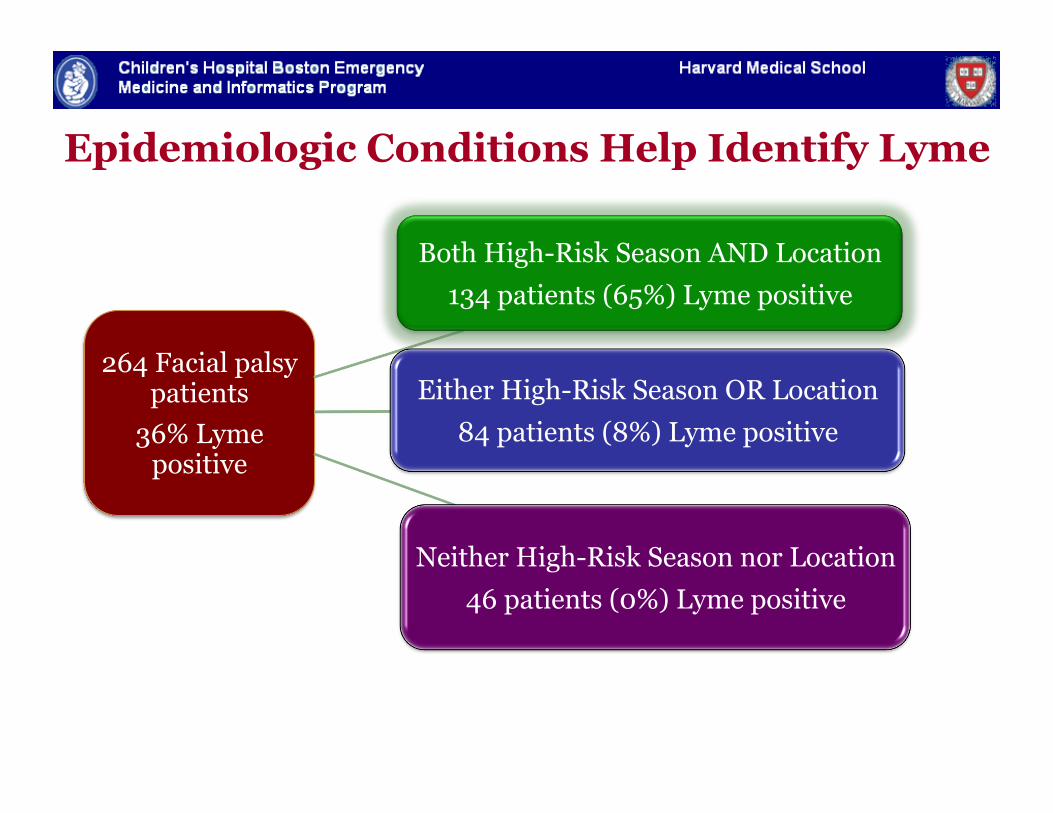
Epidemiologic Conditions Help Identify Lyme
264 Facial palsy patients
36% Lyme positive
Both High-Risk Season AND Location 134 patients (65%) Lyme positive
Either High-Risk Season OR Location 84 patients (8%) Lyme positive
Neither High-Risk Season nor Location 46 patients (0%) Lyme positive
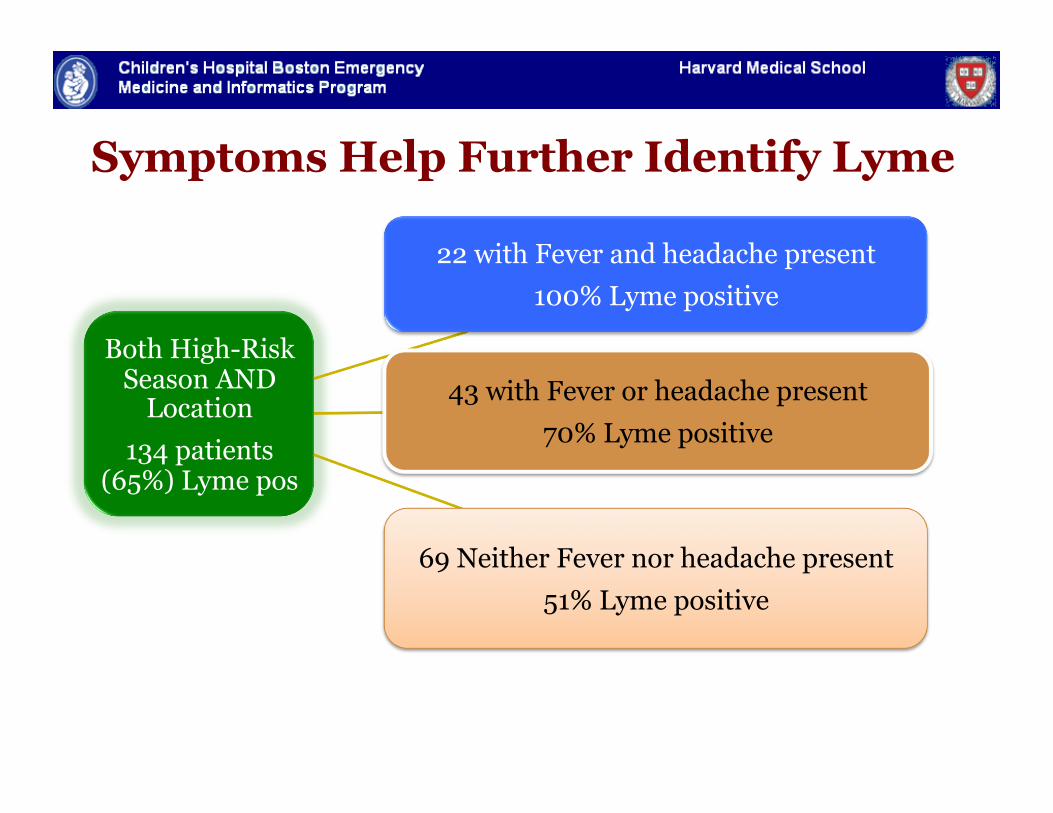
Both High-Risk Season AND
Location 134 patients
(65%) Lyme pos
22 with Fever and headache present 100% Lyme positive
43 with Fever or headache present 70% Lyme positive
69 Neither Fever nor headache present 51% Lyme positive
Symptoms Help Further Identify Lyme
Facial Palsy Take Home Points
" Timing and location are important predictors of etiology of facial palsy
" Especially when combined with clinical predictors
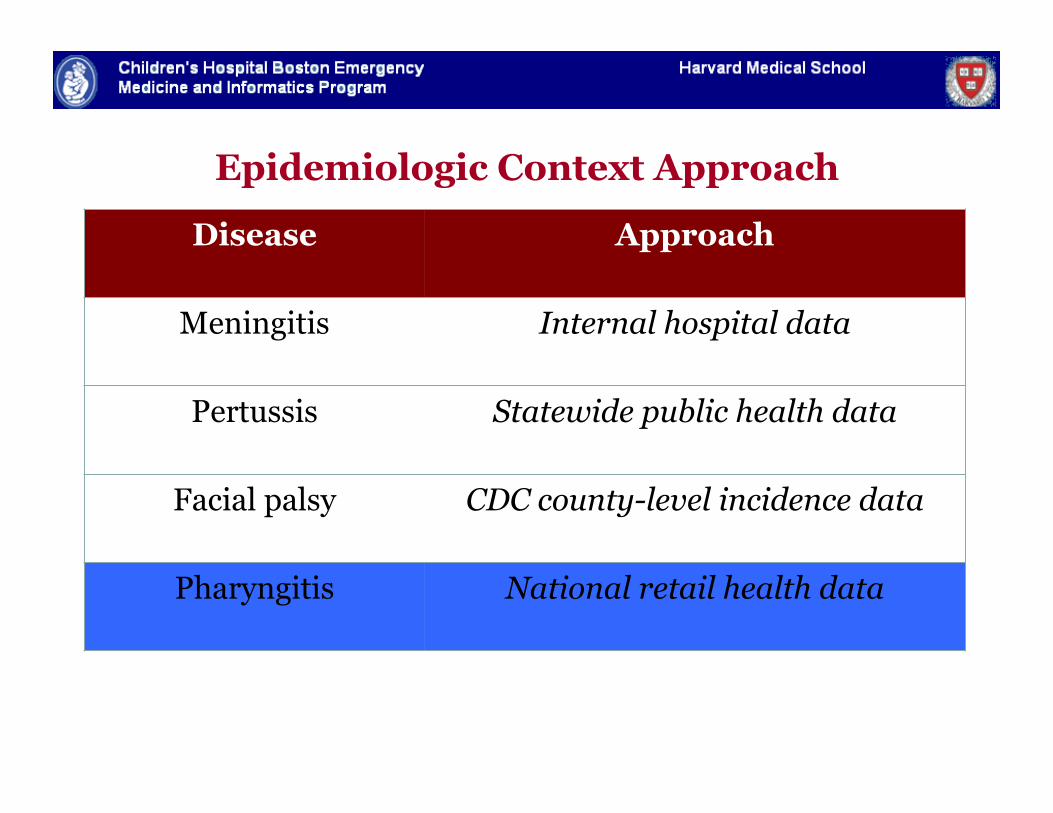
Epidemiologic Context Approach
Disease Approach
Meningitis Internal hospital data
Pertussis Statewide public health data
Facial palsy CDC county-level incidence data
Pharyngitis National retail health data
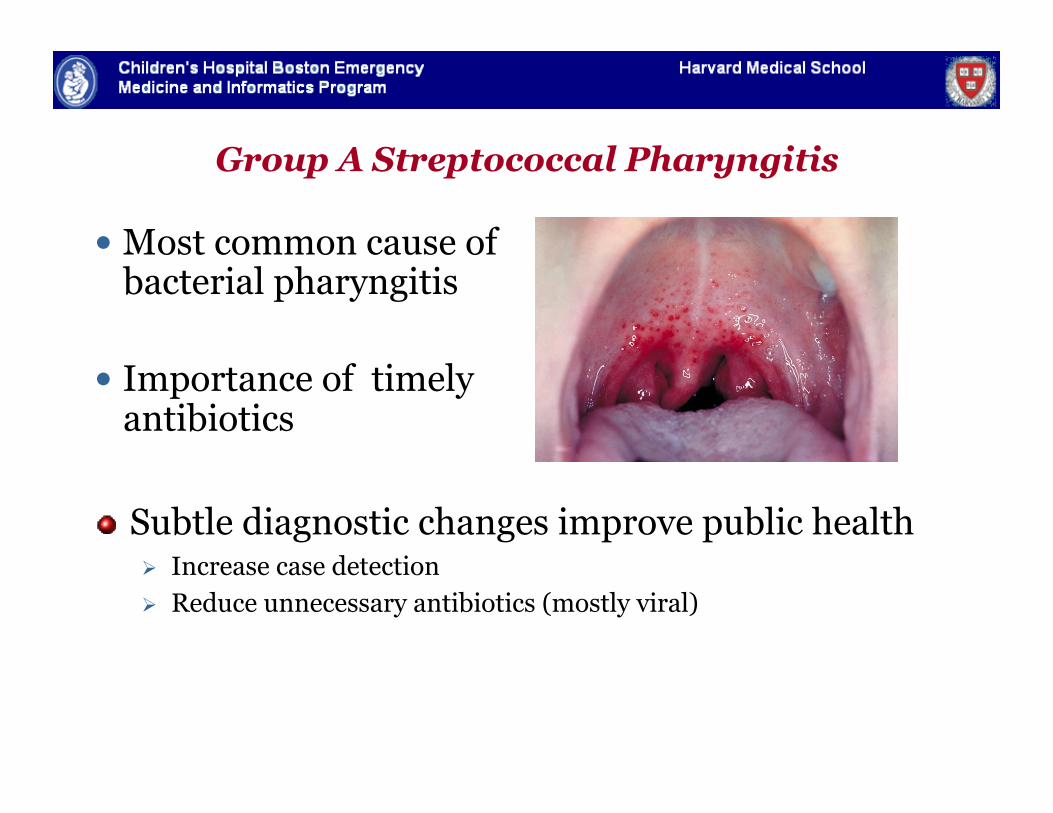
Group A Streptococcal Pharyngitis
Most common cause of bacterial pharyngitis
Importance of timely antibiotics
" Subtle diagnostic changes improve public health Increase case detection Reduce unnecessary antibiotics (mostly viral)
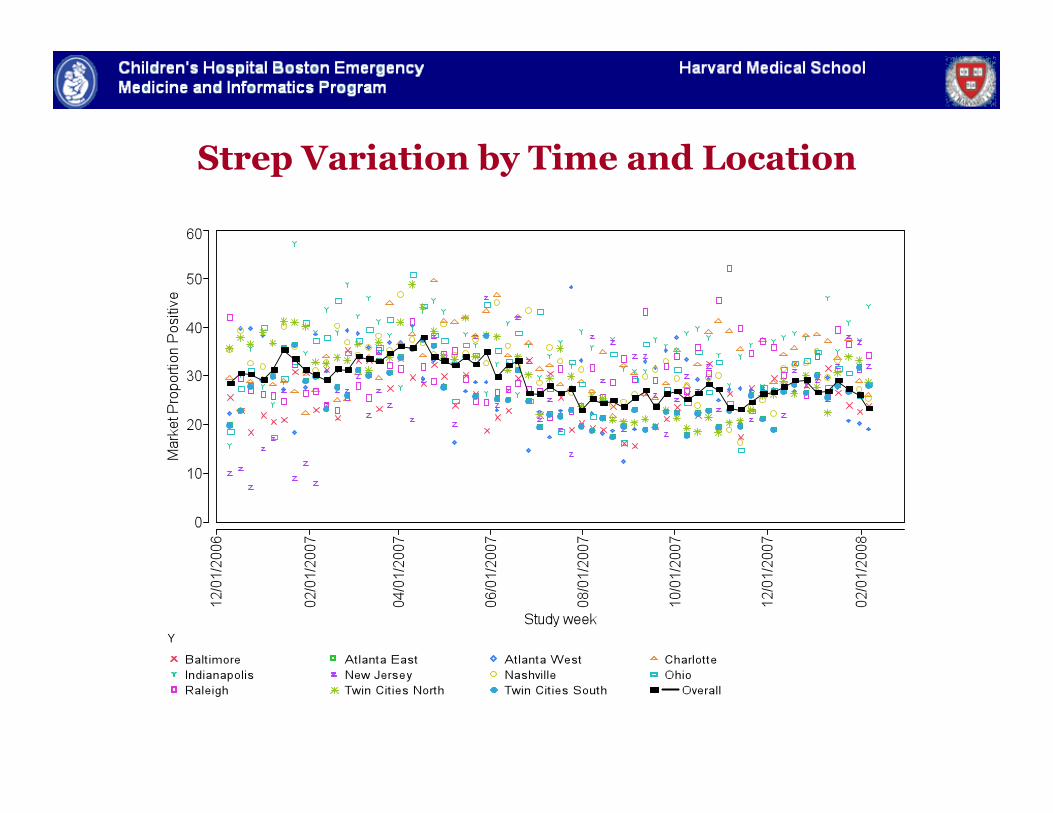
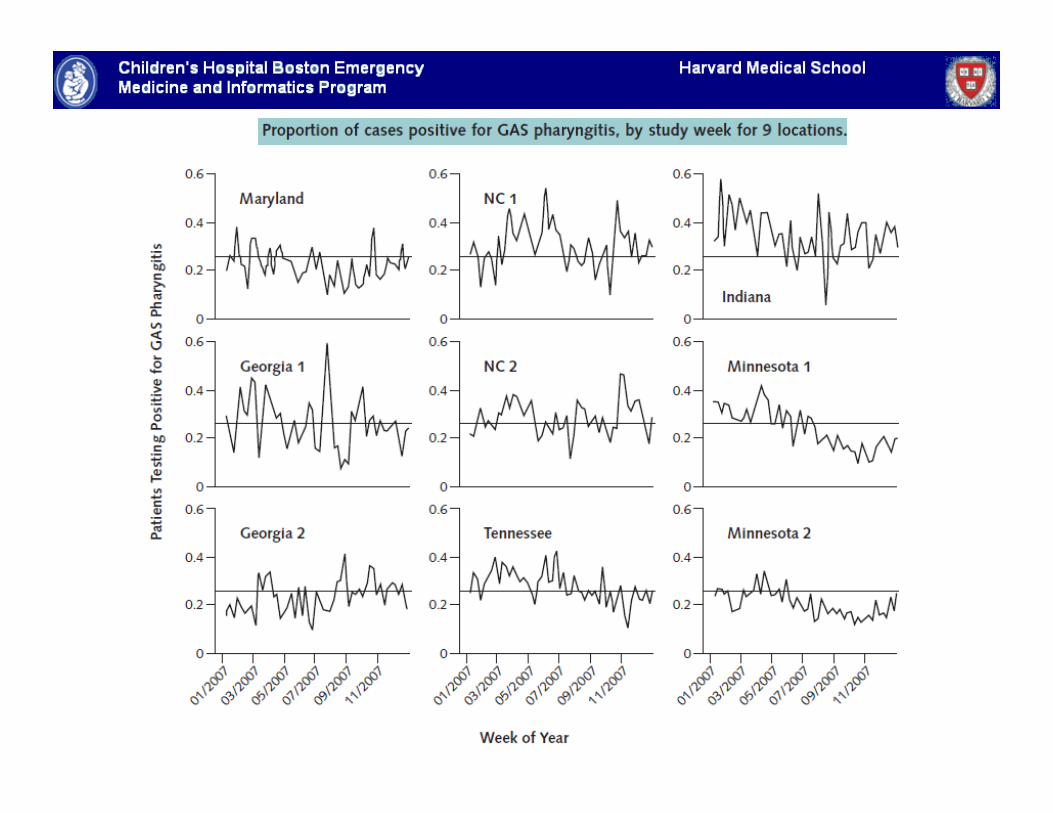
Strep Variation by Time and Location
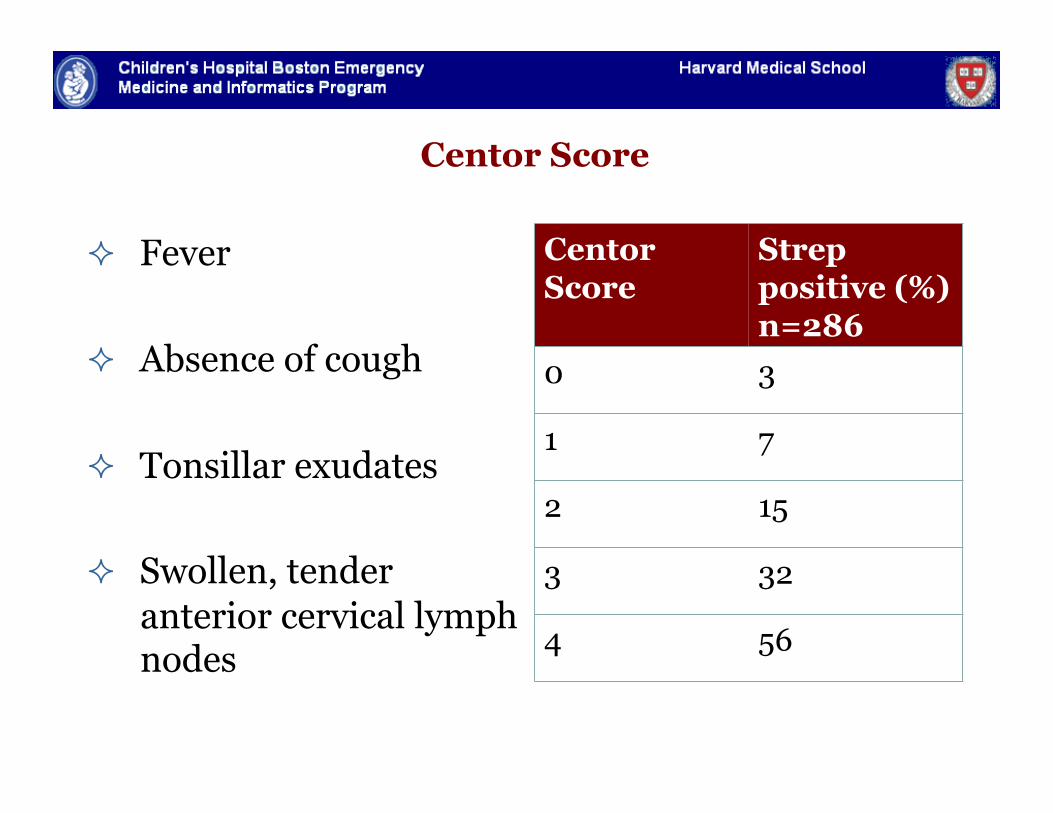
Centor Score
Fever
Absence of cough
Tonsillar exudates
Swollen, tender anterior cervical lymph nodes
Centor Score
Strep positive (%) n=286
0 3
1 7
2 15
3 32
4 56
Centor et al, Medical Decision Making, 1981.
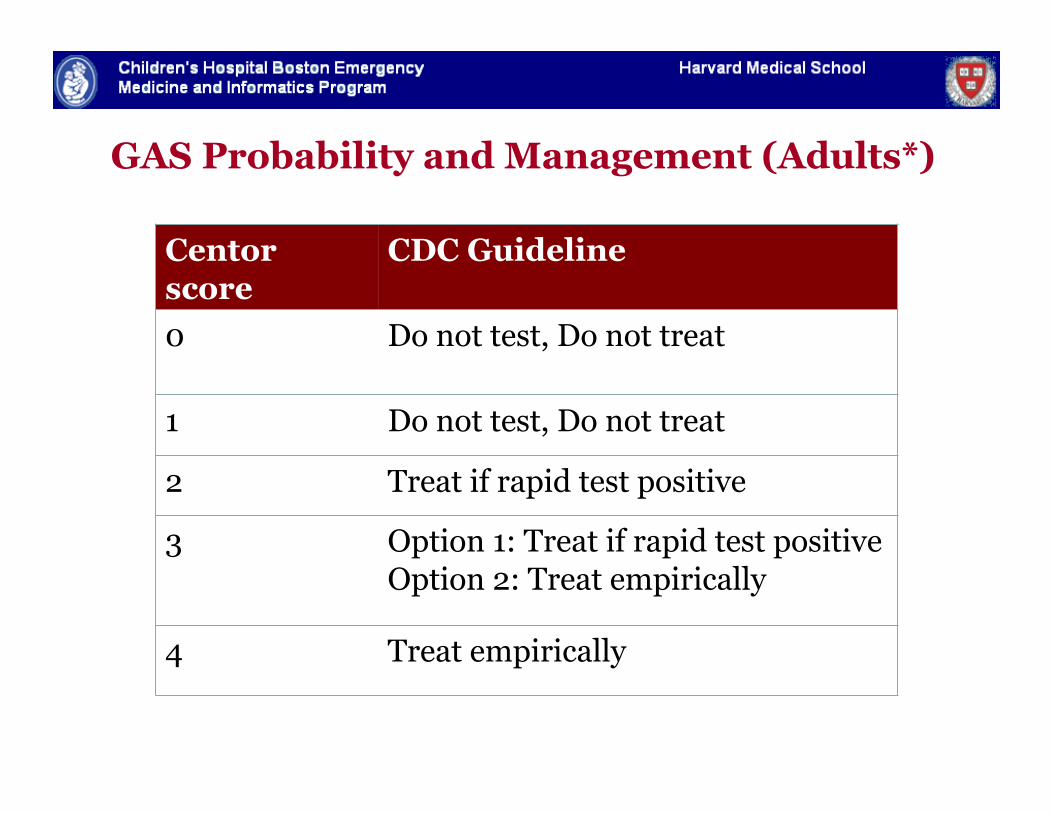
GAS Probability and Management (Adults*)
Centor score
CDC Guideline
0 Do not test, Do not treat
1 Do not test, Do not treat
2 Treat if rapid test positive
3 Option 1: Treat if rapid test positive Option 2: Treat empirically
4 Treat empirically
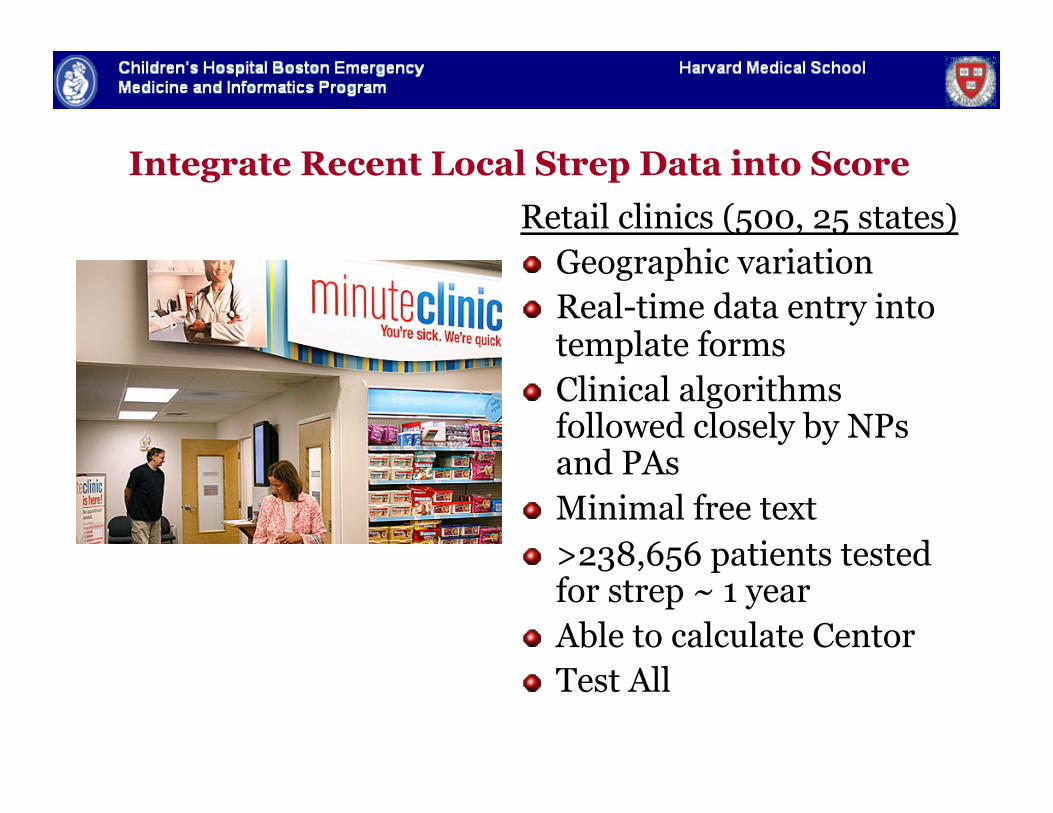
Integrate Recent Local Strep Data into Score Retail clinics (500, 25 states) " Geographic variation " Real-time data entry into
template forms " Clinical algorithms
followed closely by NPs and PAs
" Minimal free text " >238,656 patients tested
for strep ~ 1 year " Able to calculate Centor " Test All
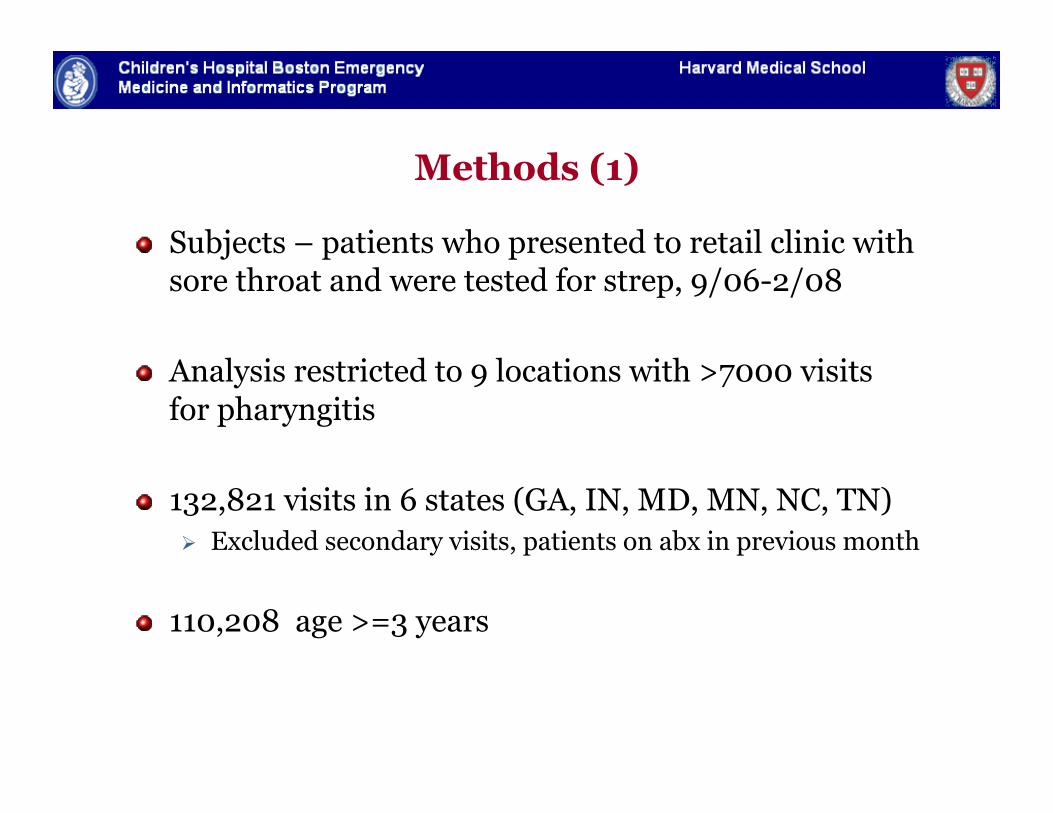
Methods (1)
" Subjects – patients who presented to retail clinic with sore throat and were tested for strep, 9/06-2/08
" Analysis restricted to 9 locations with >7000 visits for pharyngitis
" 132,821 visits in 6 states (GA, IN, MD, MN, NC, TN) Excluded secondary visits, patients on abx in previous month
" 110,208 age >=3 years
Methods (2)
" Derivation/Validation set – 2/3, 1/3 random split
" Data elements Age Visit Date Clinic location Clinical signs and symptoms Pharyngitis test results Composite variable (to reflect local incidence)
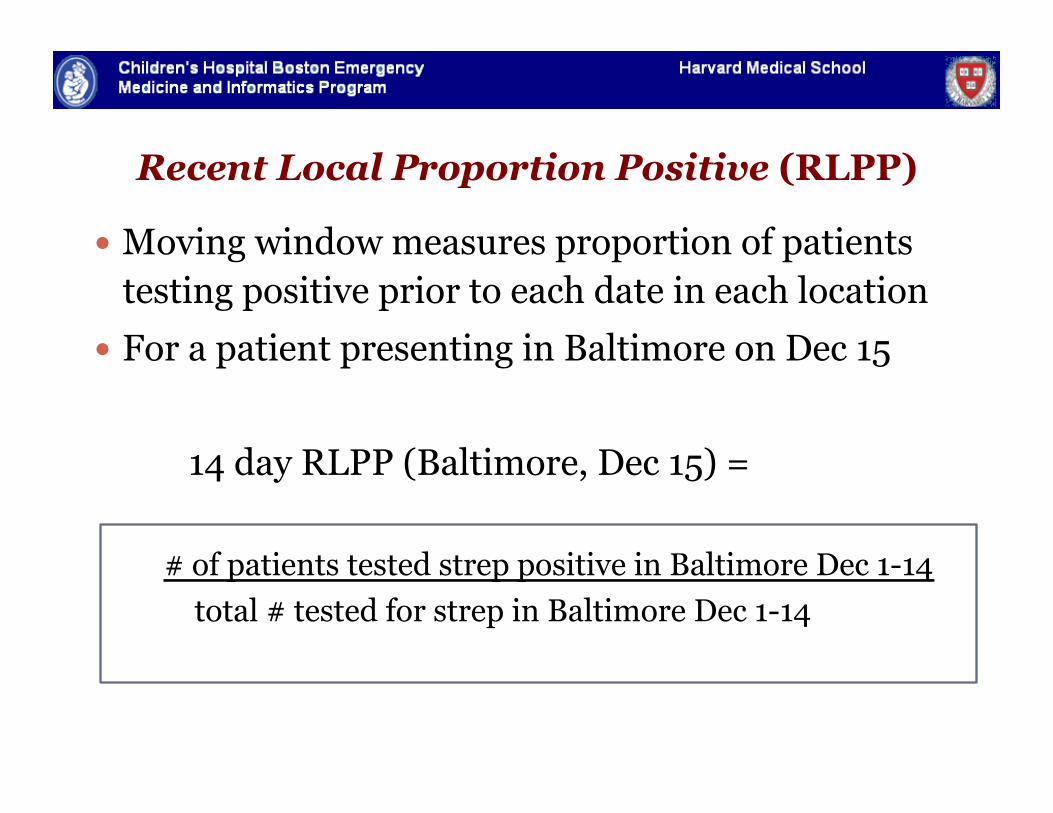
Recent Local Proportion Positive (RLPP)
Moving window measures proportion of patients testing positive prior to each date in each location
For a patient presenting in Baltimore on Dec 15
14 day RLPP (Baltimore, Dec 15) =
# of patients tested strep positive in Baltimore Dec 1-14 total # tested for strep in Baltimore Dec 1-14
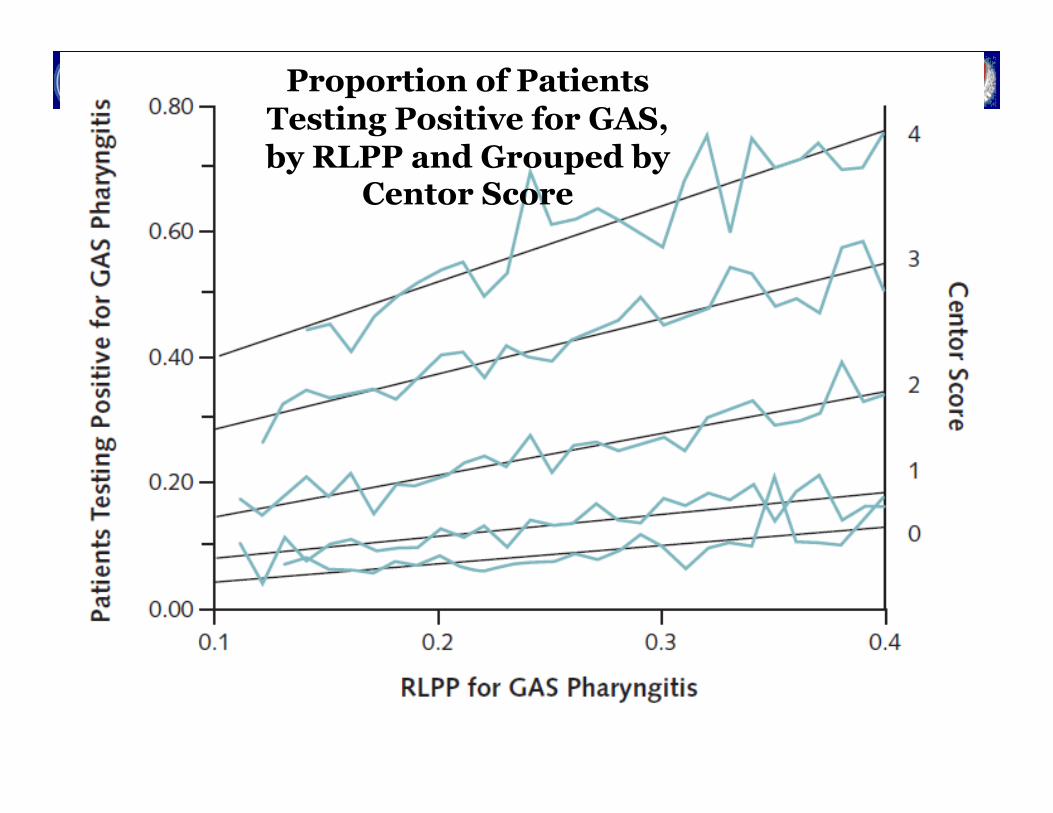
Fine, Nizet and Mandl, Annals of Internal Medicine, 2011
Fine, Nizet and Mandl, Annals of Internal Medicine, 2011
Proportion of Patients Testing Positive for GAS, by RLPP and Grouped by
Centor Score
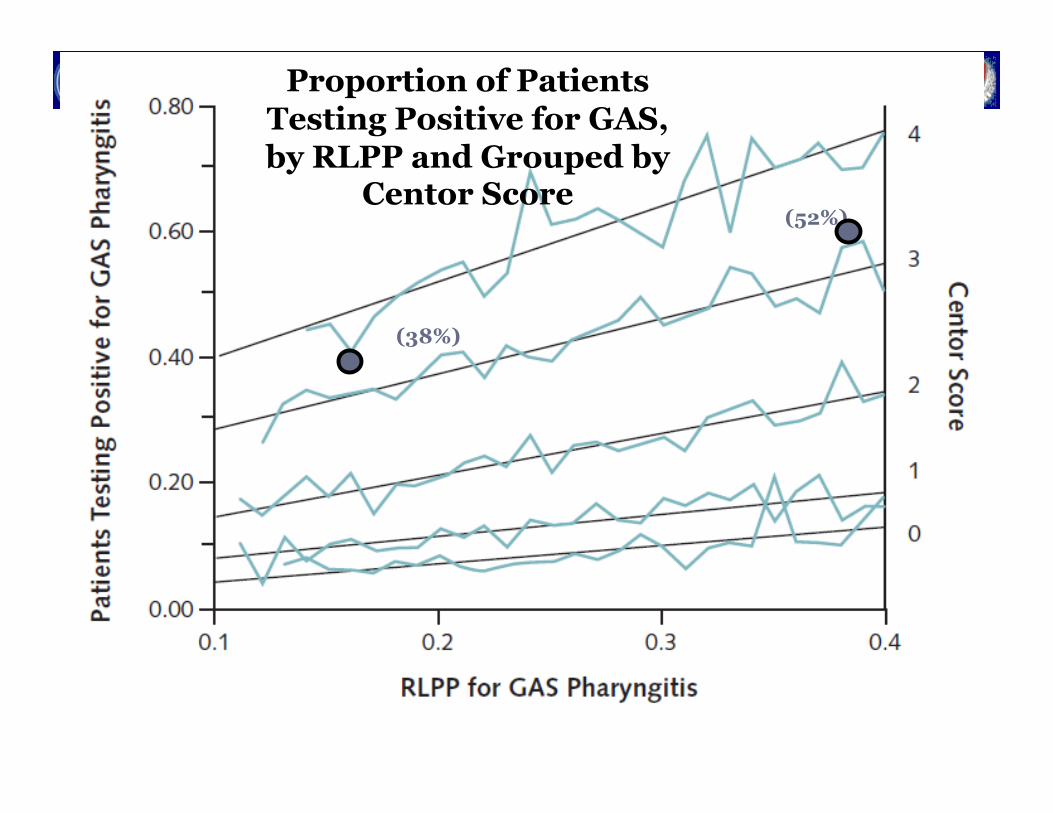
Fine, Nizet and Mandl, Annals of Internal Medicine, 2011
Proportion of Patients Testing Positive for GAS, by RLPP and Grouped by
Centor Score
(38%)
(52%)
Fine, Nizet and Mandl, Annals of Internal Medicine, 2011
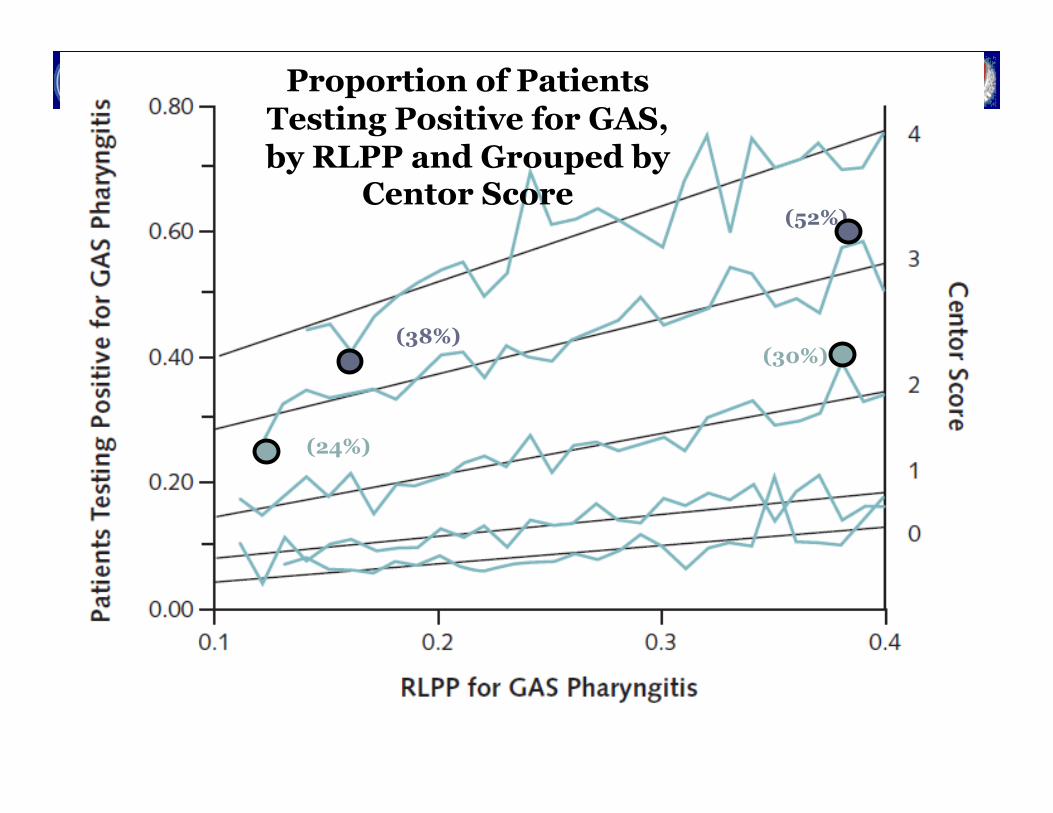
Proportion of Patients Testing Positive for GAS, by RLPP and Grouped by
Centor Score
(38%)
(52%)
(24%)
(30%)
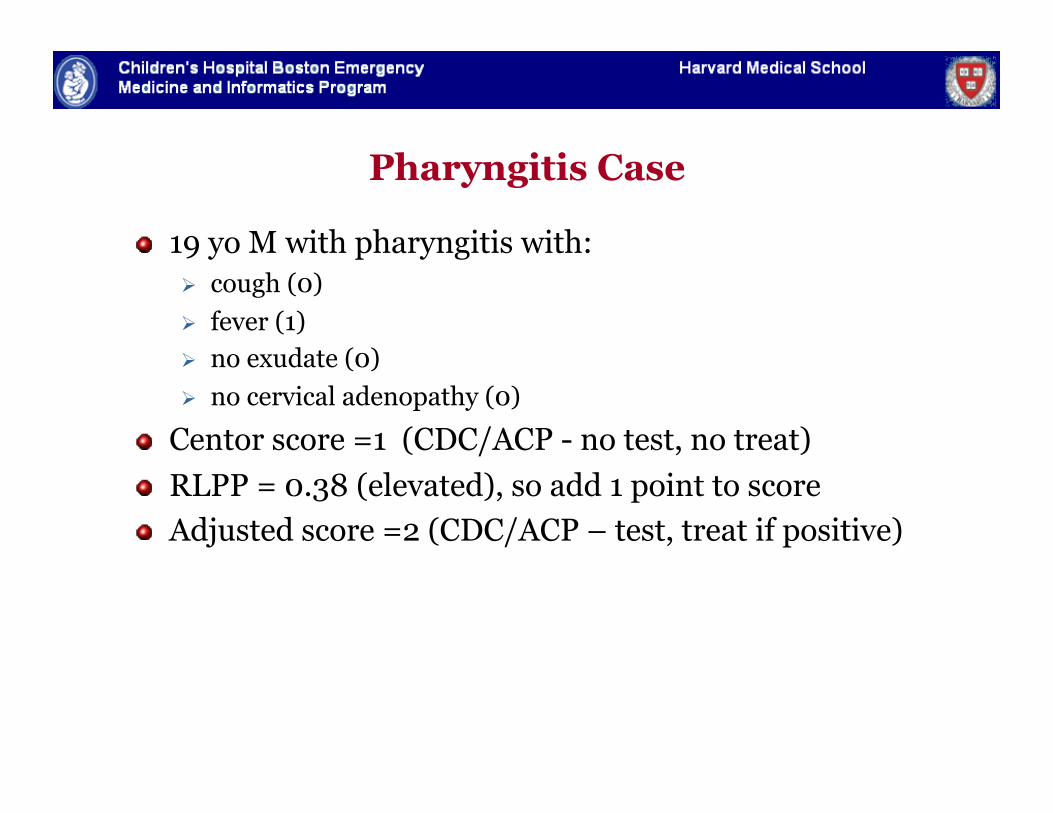
Pharyngitis Case
" 19 yo M with pharyngitis with: cough (0) fever (1) no exudate (0) no cervical adenopathy (0)
" Centor score =1 (CDC/ACP - no test, no treat) " RLPP = 0.38 (elevated), so add 1 point to score " Adjusted score =2 (CDC/ACP – test, treat if positive)
Barriers for Clinicians Home Score
" Could we bring the model to the patient?
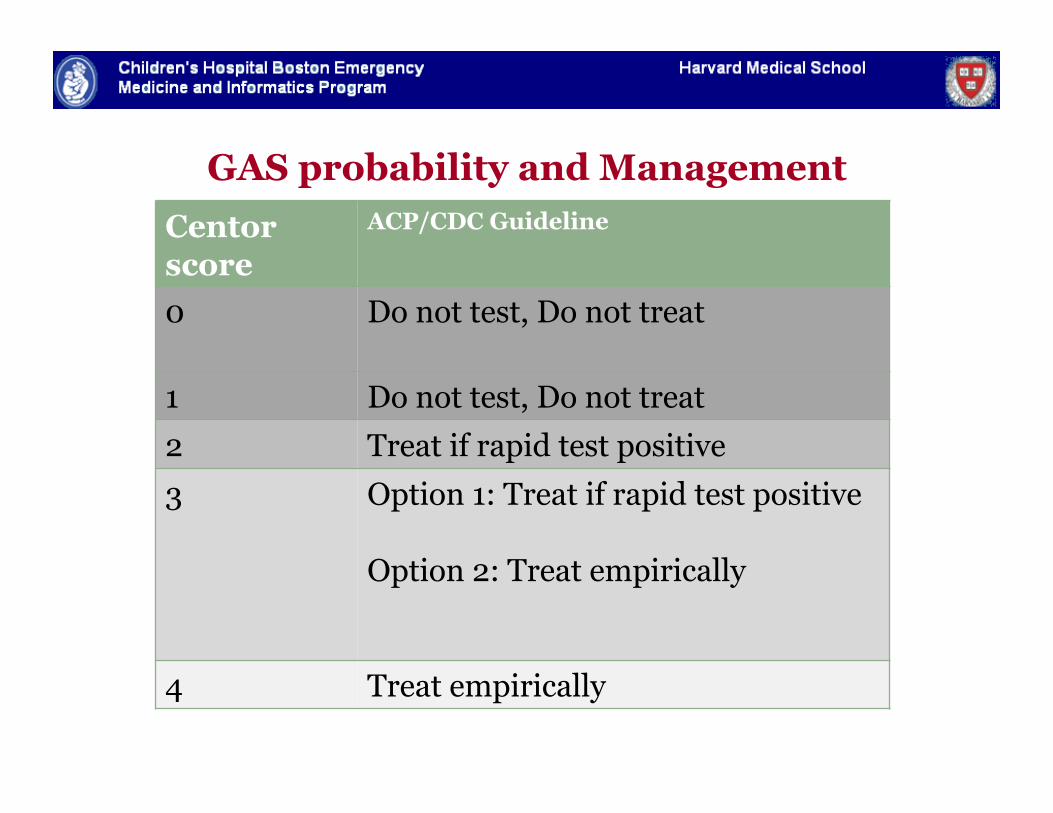
GAS probability and Management Centor score
ACP/CDC Guideline
0 Do not test, Do not treat
1 Do not test, Do not treat 2 Treat if rapid test positive 3 Option 1: Treat if rapid test positive
Option 2: Treat empirically
4 Treat empirically
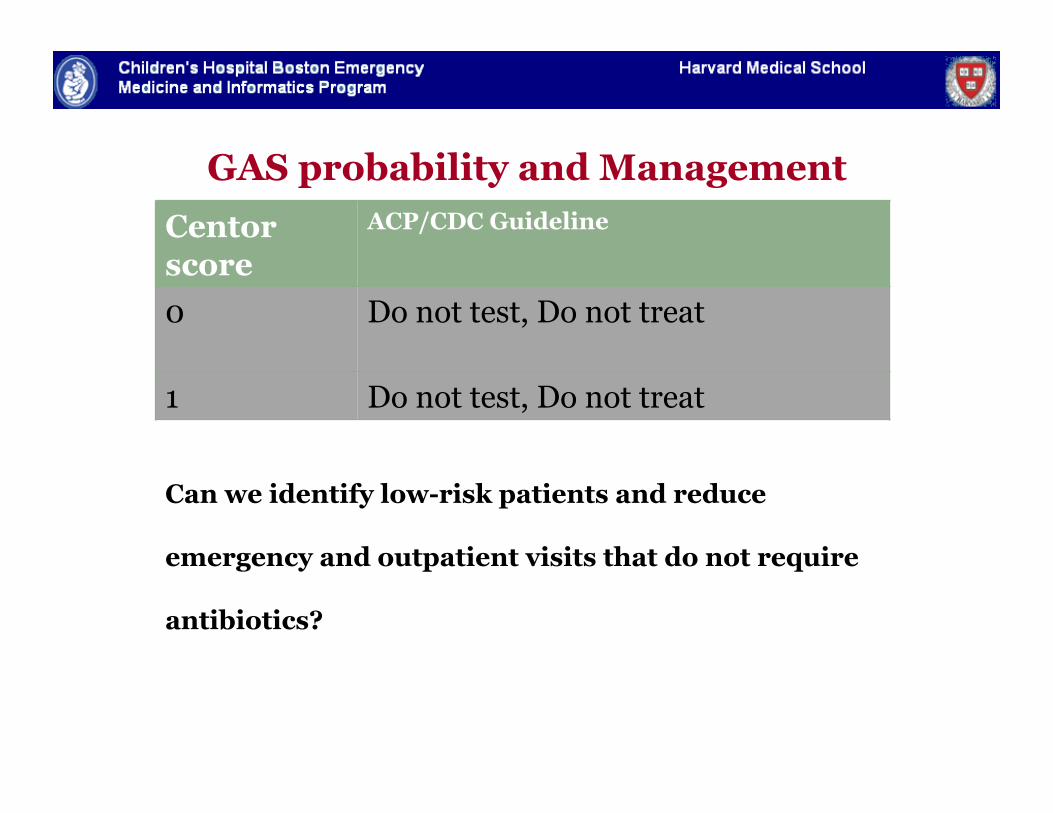
GAS probability and Management Centor score
ACP/CDC Guideline
0 Do not test, Do not treat
1 Do not test, Do not treat
Can we identify low-risk patients and reduce
emergency and outpatient visits that do not require
antibiotics?
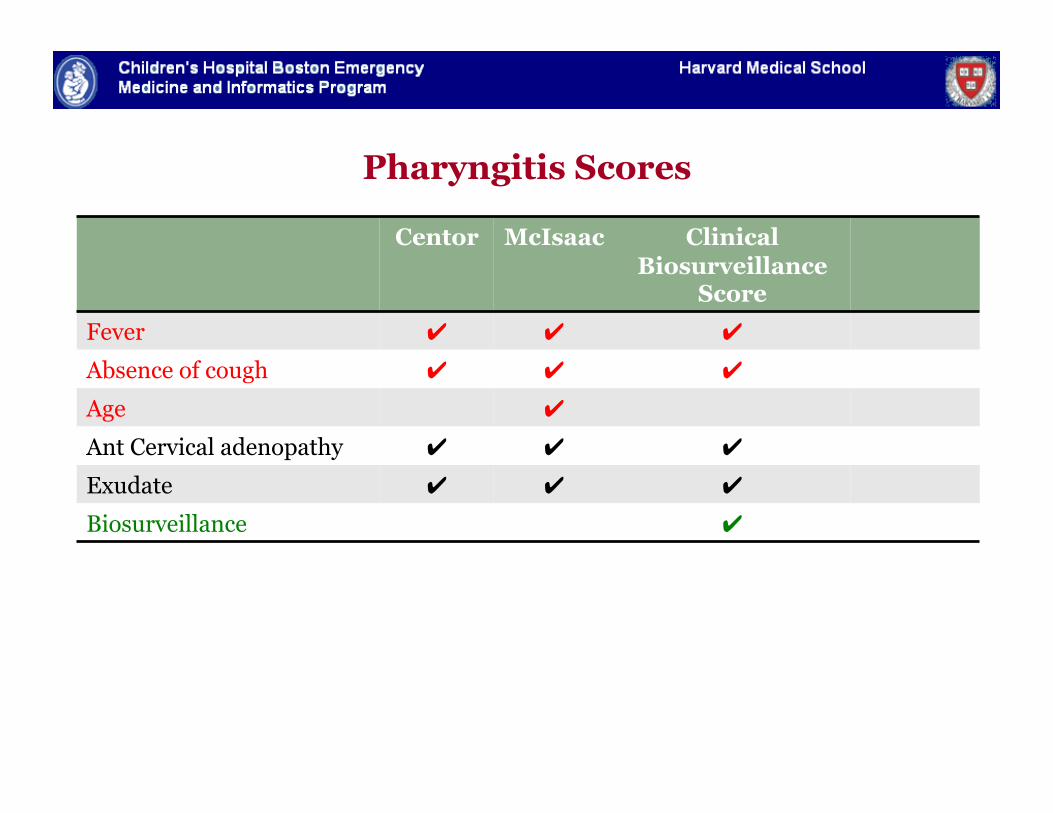
Pharyngitis Scores
Centor McIsaac Clinical Biosurveillance
Score Fever ✔ ✔ ✔
Absence of cough ✔ ✔ ✔
Age ✔
Ant Cervical adenopathy ✔ ✔ ✔
Exudate ✔ ✔ ✔
Biosurveillance ✔
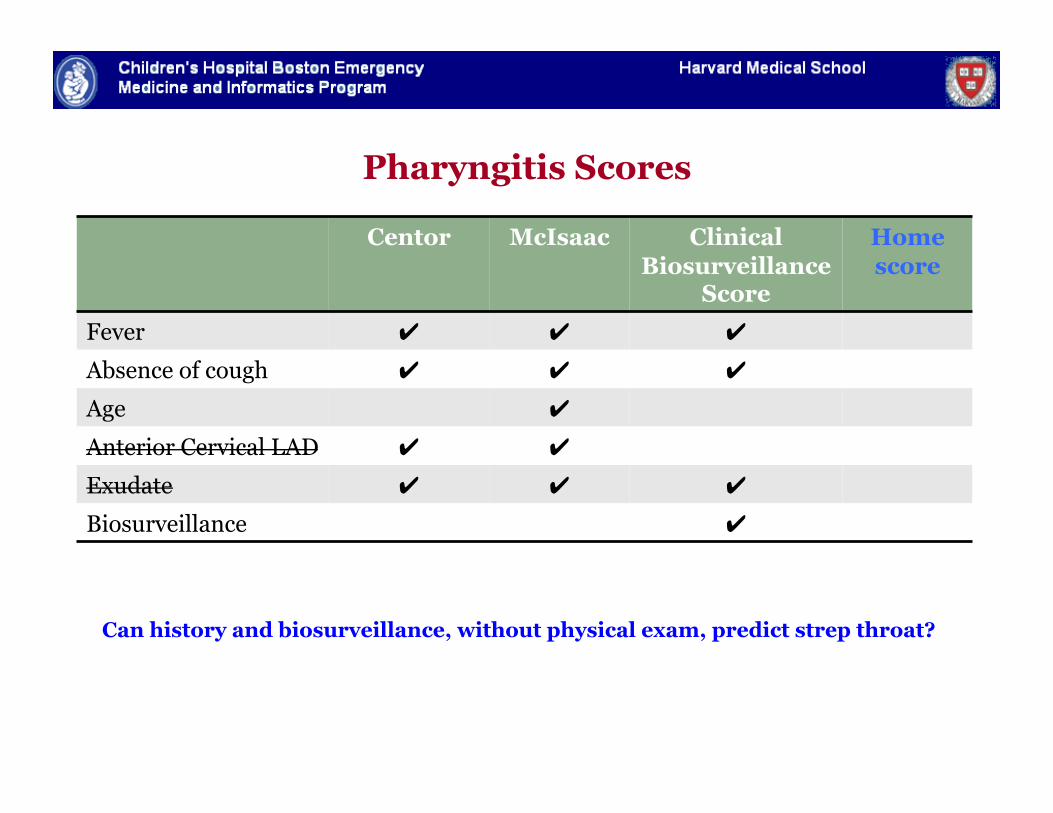
Pharyngitis Scores
Centor McIsaac Clinical Biosurveillance
Score
Home score
Fever ✔ ✔ ✔
Absence of cough ✔ ✔ ✔
Age ✔
Anterior Cervical LAD ✔ ✔
Exudate ✔ ✔ ✔
Biosurveillance ✔
Can history and biosurveillance, without physical exam, predict strep throat?
Objective
" To derive and validate a home score, assignable by
the patient, to guide whether a visit is necessary for
evaluation of pharyngitis
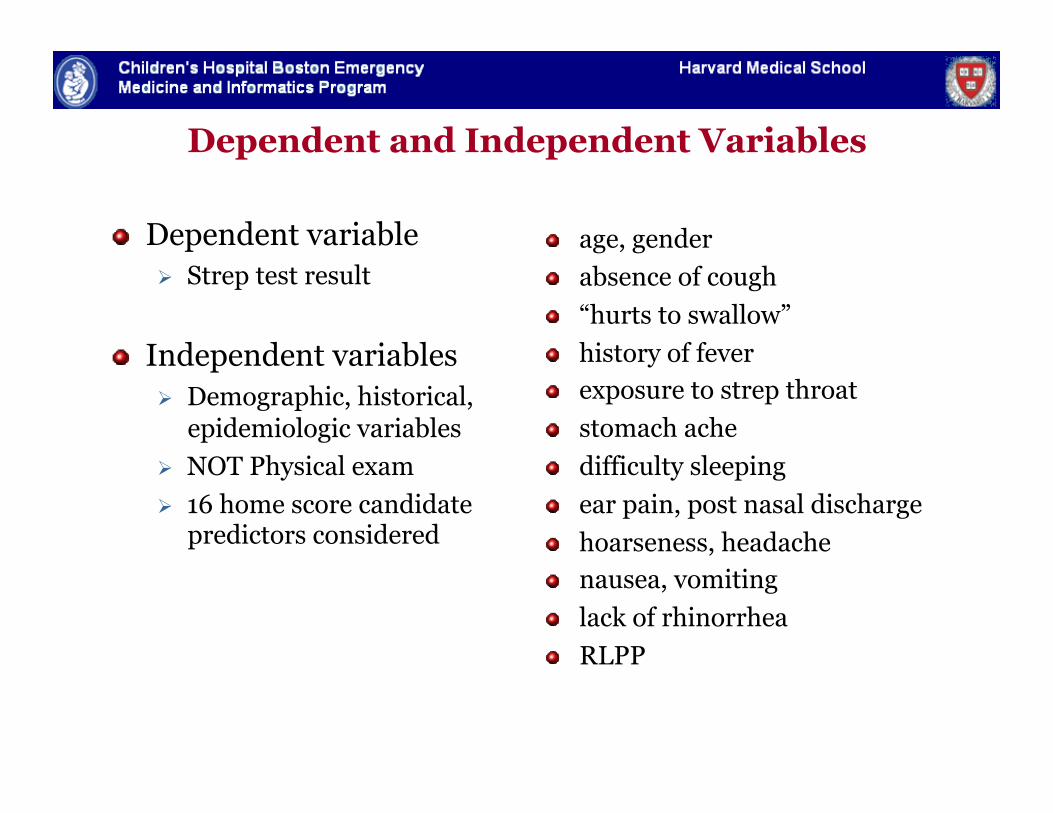
Dependent and Independent Variables
" Dependent variable Strep test result
" Independent variables Demographic, historical,
epidemiologic variables NOT Physical exam 16 home score candidate
predictors considered
" age, gender " absence of cough " “hurts to swallow” " history of fever " exposure to strep throat " stomach ache " difficulty sleeping " ear pain, post nasal discharge " hoarseness, headache " nausea, vomiting " lack of rhinorrhea " RLPP
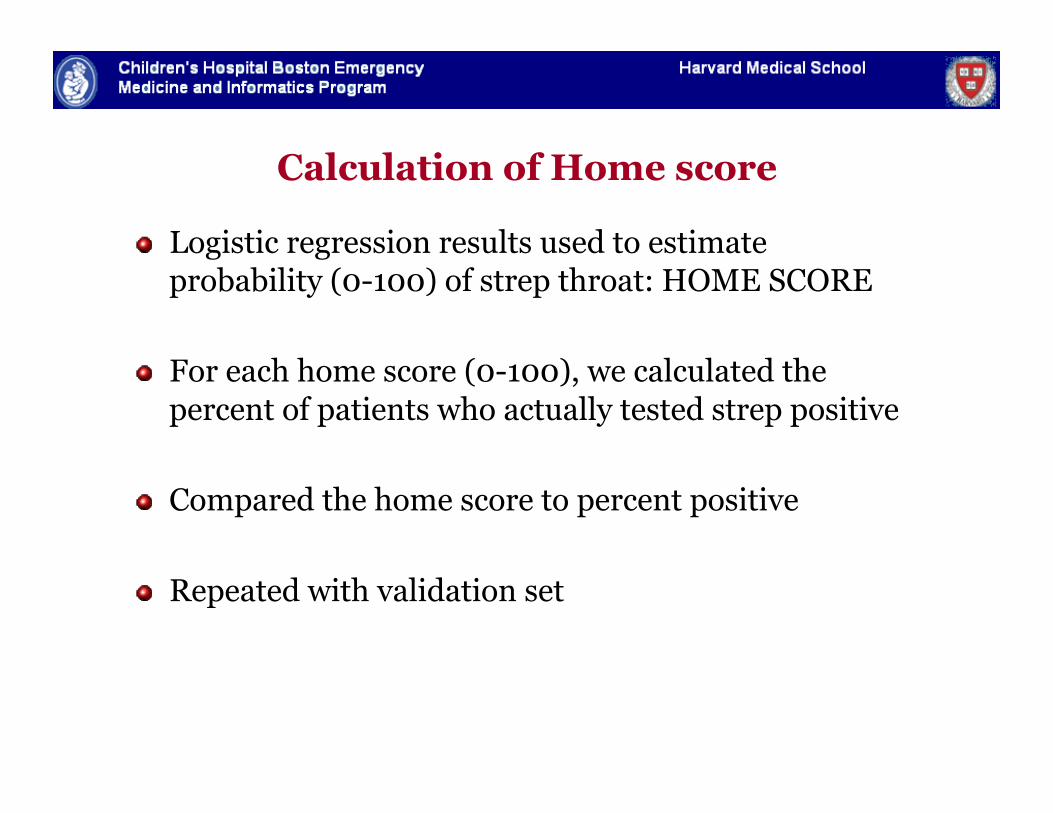
Calculation of Home score
" Logistic regression results used to estimate probability (0-100) of strep throat: HOME SCORE
" For each home score (0-100), we calculated the percent of patients who actually tested strep positive
" Compared the home score to percent positive
" Repeated with validation set
Hypothetical Cohorts of 1000 patients
" Chose a range of low-risk thresholds (10, 15, 20) at which patient would not need testing
" At these defined low-risk thresholds, we calculated:
1. Number of visits saved
2. Additional cases missed vs. standard approach
3. Number visits saved per missed case
Extrapolated National Impact
" Extrapolated to 12 million annual pharyngitis visits
" Assumed 80-90% sensitivity and 95% specificity
" Calculated potential savings based on CMS costs: strep test ($17); walk-in visit ($56-114)
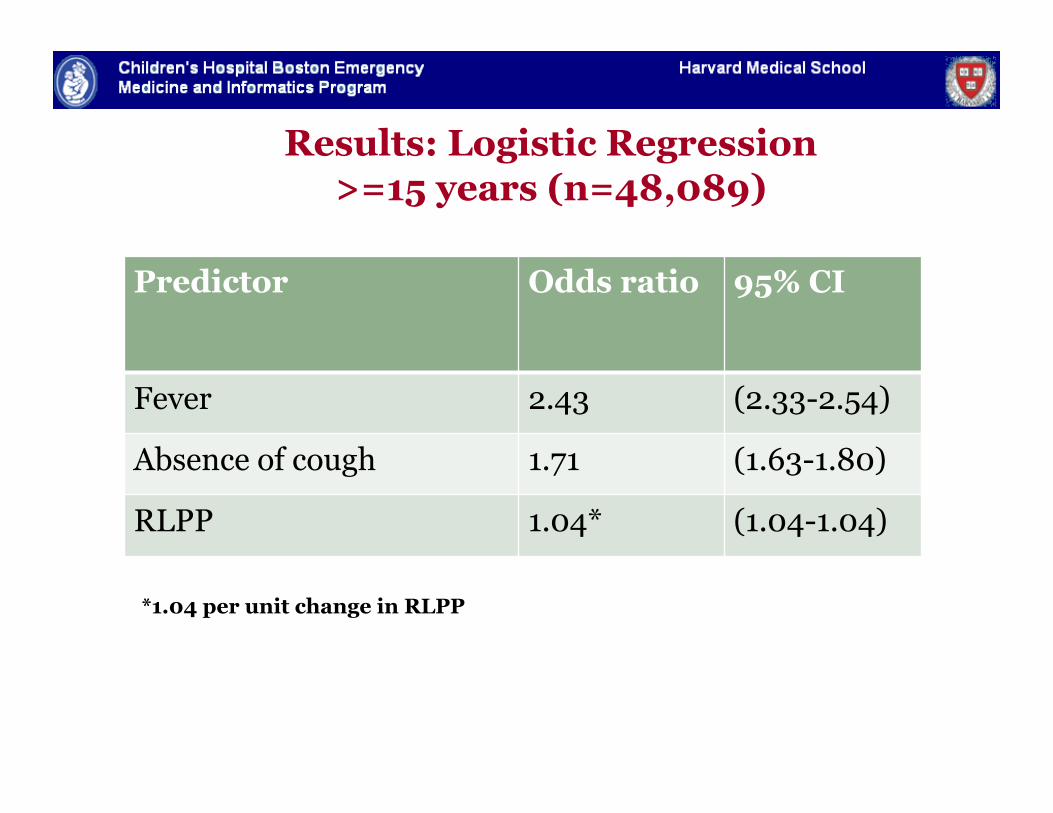
Results: Logistic Regression >=15 years (n=48,089)
Predictor Odds ratio 95% CI
Fever 2.43 (2.33-2.54)
Absence of cough 1.71 (1.63-1.80)
RLPP 1.04* (1.04-1.04)
*1.04 per unit change in RLPP
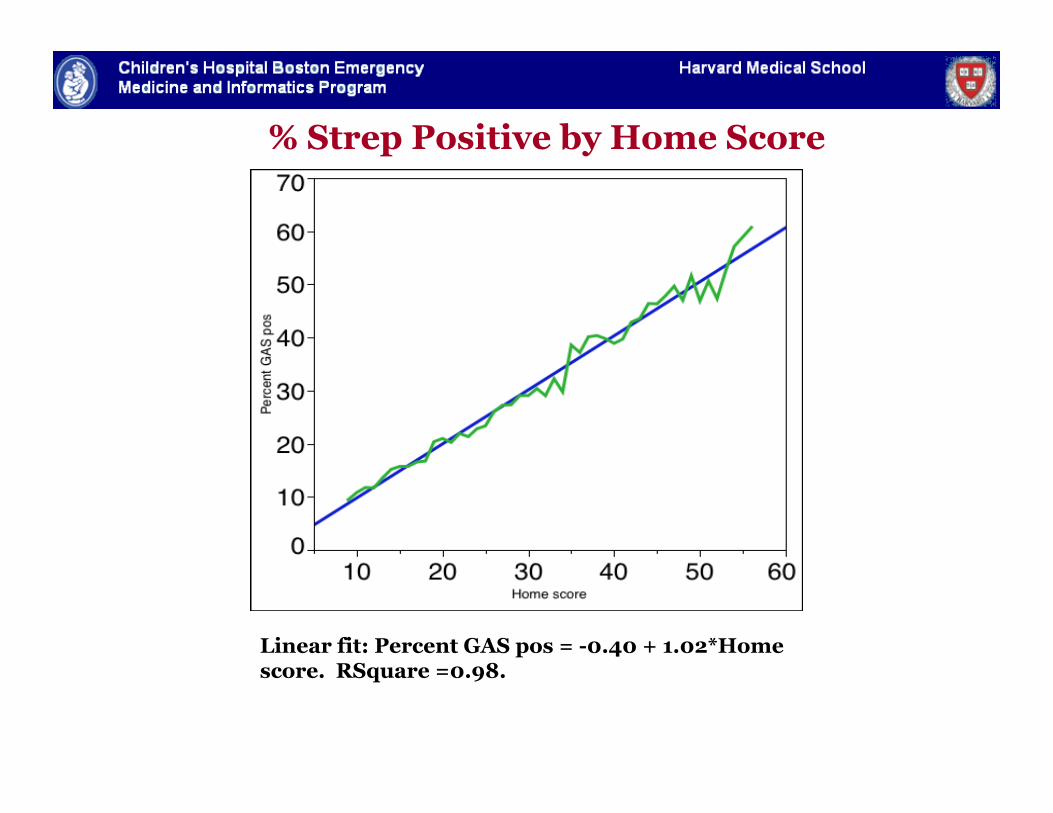
% Strep Positive by Home Score
Linear fit: Percent GAS pos = -0.40 + 1.02*Home score. RSquare =0.98.
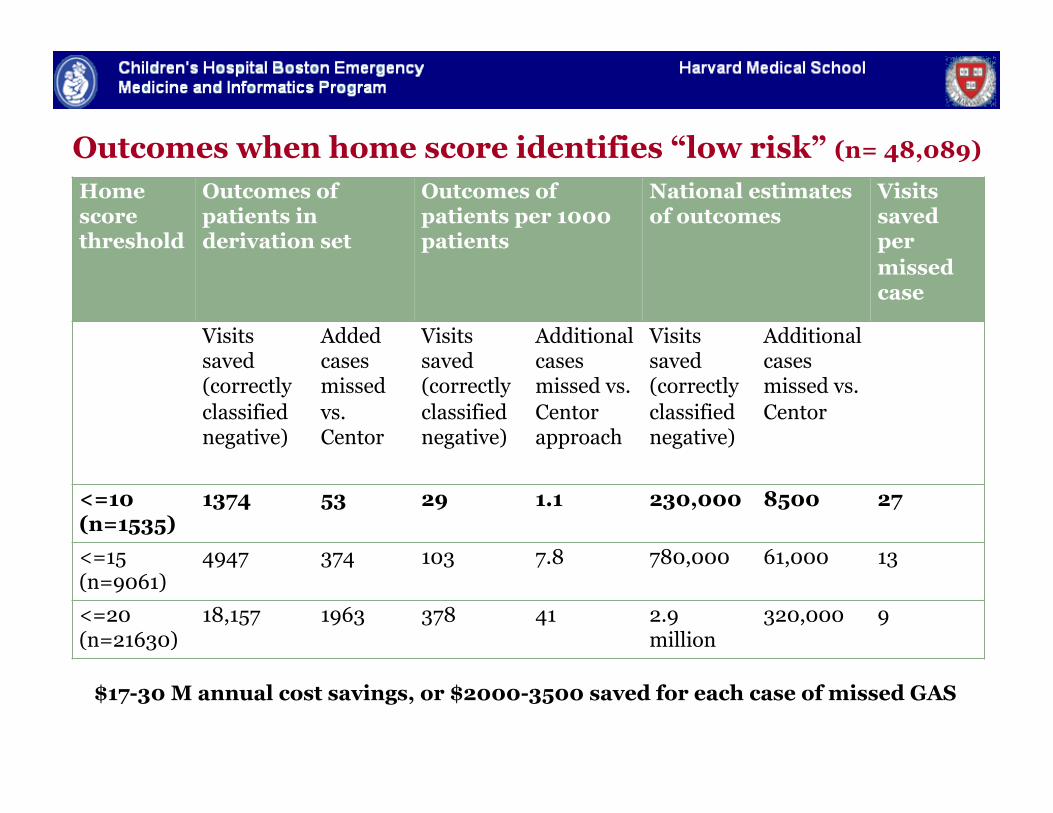
Outcomes when home score identifies “low risk” (n= 48,089)
Home score threshold
Outcomes of patients in derivation set
Outcomes of patients per 1000 patients
National estimates of outcomes
Visits saved per missed case
Visits saved (correctly classified negative)
Added cases missed vs. Centor
Visits saved (correctly classified negative)
Additional cases missed vs. Centor approach
Visits saved (correctly classified negative)
Additional cases missed vs. Centor
<=10 (n=1535)
1374 53 29 1.1 230,000 8500 27
<=15 (n=9061)
4947 374 103 7.8 780,000 61,000 13
<=20 (n=21630)
18,157 1963 378 41 2.9 million
320,000 9
$17-30 M annual cost savings, or $2000-3500 saved for each case of missed GAS
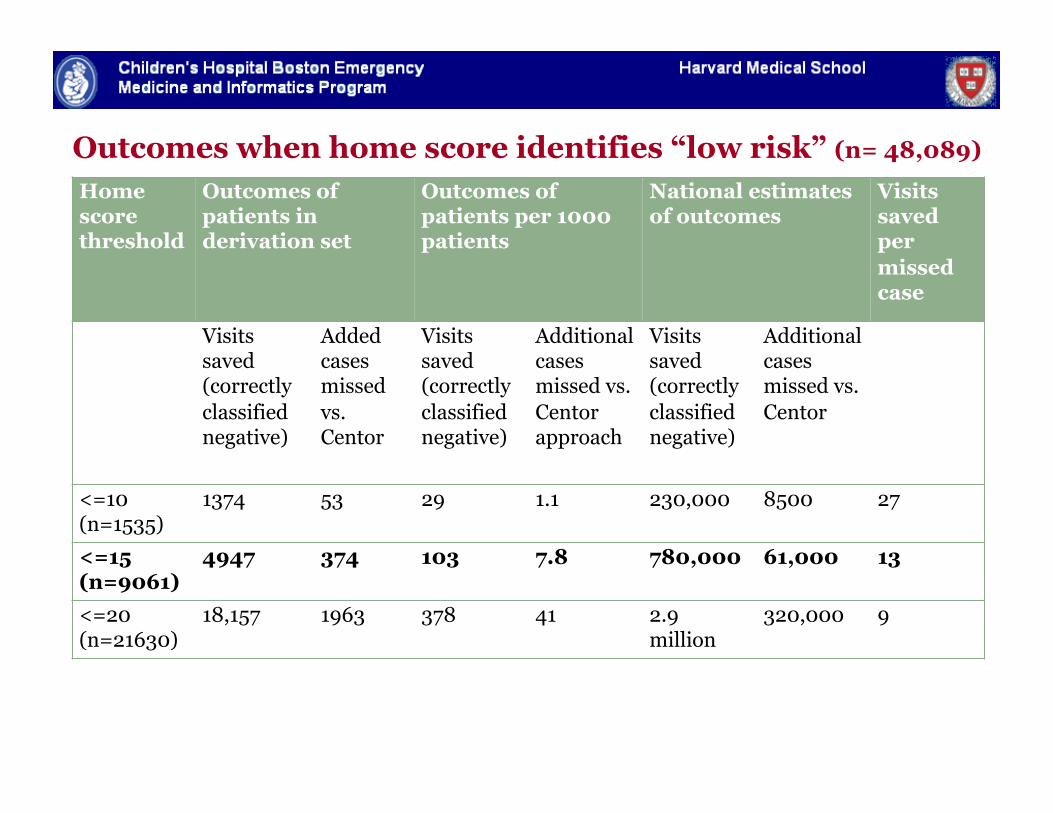
Outcomes when home score identifies “low risk” (n= 48,089)
Home score threshold
Outcomes of patients in derivation set
Outcomes of patients per 1000 patients
National estimates of outcomes
Visits saved per missed case
Visits saved (correctly classified negative)
Added cases missed vs. Centor
Visits saved (correctly classified negative)
Additional cases missed vs. Centor approach
Visits saved (correctly classified negative)
Additional cases missed vs. Centor
<=10 (n=1535)
1374 53 29 1.1 230,000 8500 27
<=15 (n=9061)
4947 374 103 7.8 780,000 61,000 13
<=20 (n=21630)
18,157 1963 378 41 2.9 million
320,000 9
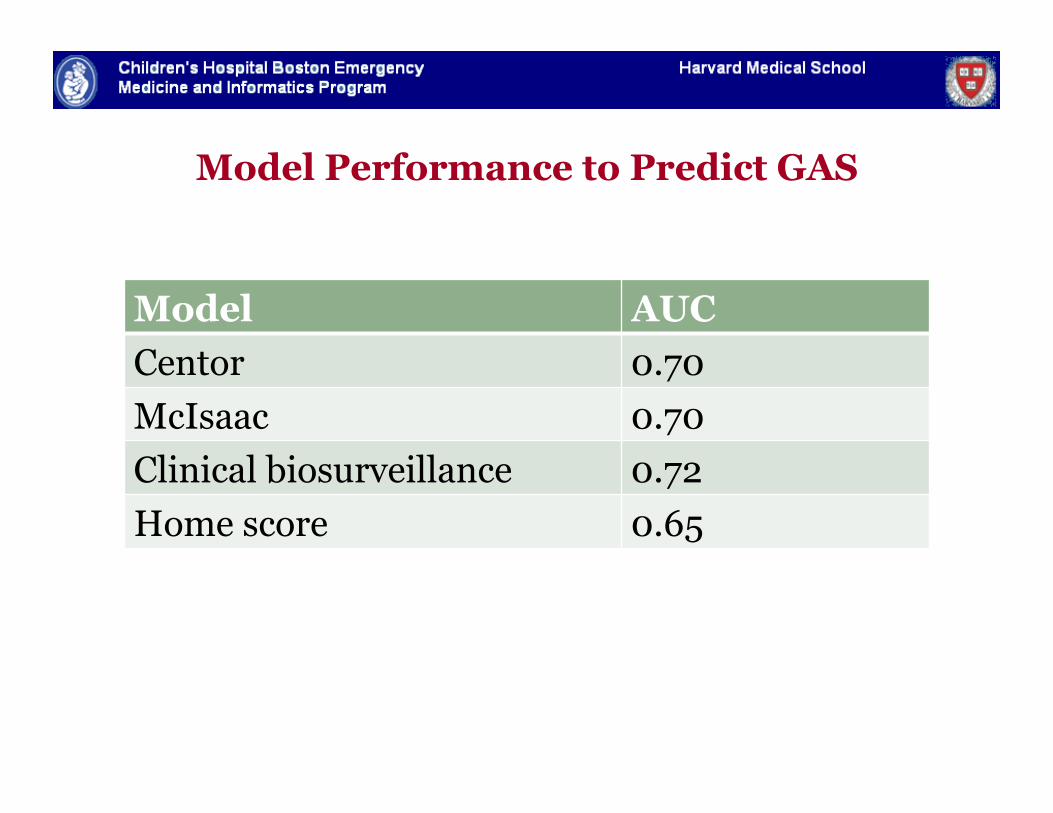
Model Performance to Predict GAS
Model AUC Centor 0.70 McIsaac 0.70 Clinical biosurveillance 0.72 Home score 0.65
Pharyngitis Take Home Points
" Epidemiologic context is important for common conditions as well
" Recent incidence can help adjust risk of Strep throat
Conclusions
1. Epidemiologic Context is an important predictor of communicable diseases. • Knowledge of recent local disease trends is important in accurately
predicting the risk of disease in an individual patient.
Conclusions
1. Epidemiologic Context is an important predictor of communicable diseases.
2. Using a biosurveillance approach may improve health outcomes and efficiency of care delivery • By prompting clinicians to consider testing for uncommon diseases
when the incidence is elevated (pertussis) • By encouraging clinicians to withhold interventions for common
diseases when the incidence is very low (strep throat)
Conclusions
1. Epidemiologic Context is an important predictor of communicable diseases.
2. Using a biosurveillance approach may improve health outcomes and efficiency of care delivery
3. Infrastructure exists to foster 3 way communication between patients, providers and public health • Like our York colleague, we hope to bring real time data to bear on
medical decision making for patients.
Thanks
Mentor: Kenneth Mandl MD MPH
Support: Centers for Disease Control and Preven5on (K01); NRSA T-‐32 Research Training in Pediatric Emergency Medicine (NICHD)
Collaborators: Ben Reis, John Brownstein, Don Goldmann, Victor Nizet, Lise Nigrovic, Karen Olson, CVS Minute Clinics, Amir Kimia, Amy Thompson, Fran Cook, Tracy Laporte, Gillian Haney
Special thanks: Gary Fleisher, Michael Shannon, Rich Bachur