Embed Size (px)
DESCRIPTION
Bayesian Biosurveillance Using Multiple Data Streams Weng-Keen Wong, Greg Cooper, Denver Dash * , John Levander, John Dowling, Bill Hogan, Mike Wagner RODS Laboratory, University of Pittsburgh * Intel Research. - PowerPoint PPT Presentation
Citation preview
2004 University of Pittsburgh
Bayesian Biosurveillance Using Multiple Data Streams
Weng-Keen Wong, Greg Cooper, Denver Dash*, John Levander, John Dowling, Bill Hogan, Mike Wagner
RODS Laboratory, University of Pittsburgh*Intel Research
This research was supported in part by grants from the National Science Foundation (IIS-0325581), the Defense Advanced Research Projects
Agency (F30602-01-2-0550), and the Pennsylvania Department of Health (ME-01-737).
2004 University of Pittsburgh
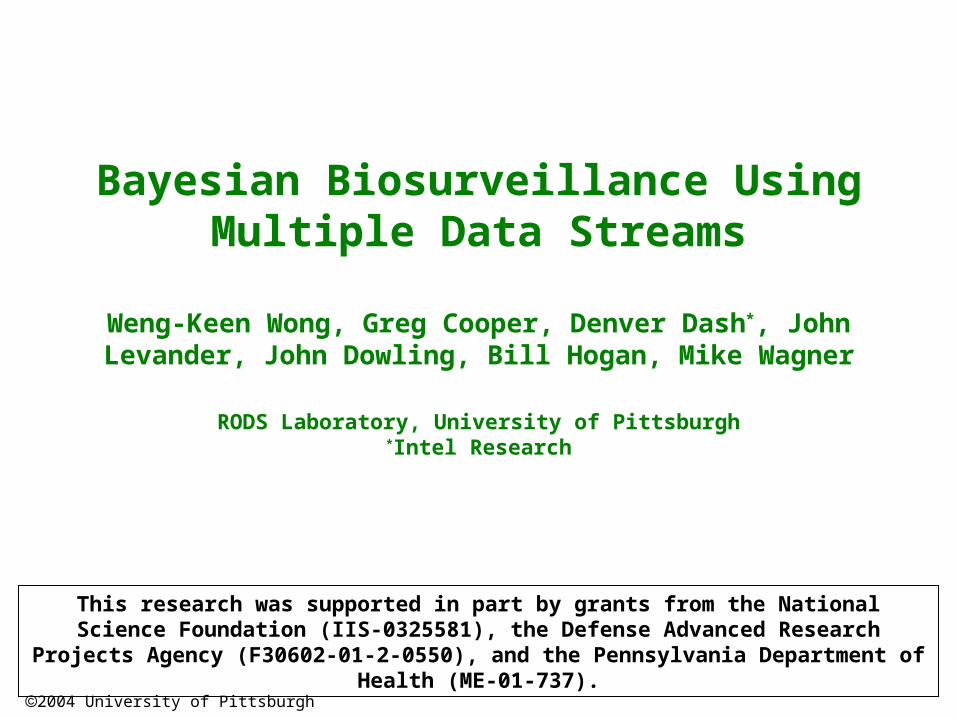
Over-the-Counter (OTC) Data Being Collected by the National Retail Data Monitor (NRDM)
19,000 stores
50% market share
nationally
>70% market share in large cities
2004 University of Pittsburgh
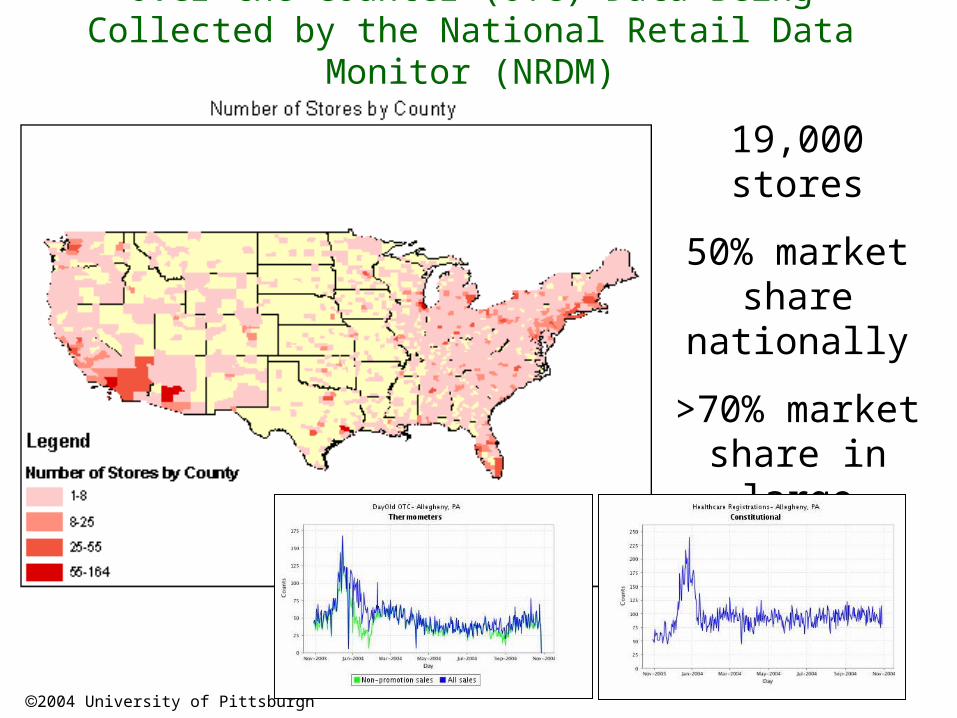
ED Chief Complaint Data Being Collected by
RODS
Date / Time Admitted
Age Gender Home Zip Work Zip Chief Complaint
Nov 1, 2004 3:02 20-30 Male 15213 Shortness of breath
Nov 1, 2004 3:09 70-80 Female 15132 15213 Fever
: : : : : :
Chief Complaint ED Records for Allegheny County
2004 University of Pittsburgh
Objective
Using the ED and OTC data streams, detect a disease outbreak in a given region as quickly and accurately as possible
2004 University of Pittsburgh
Our Approach
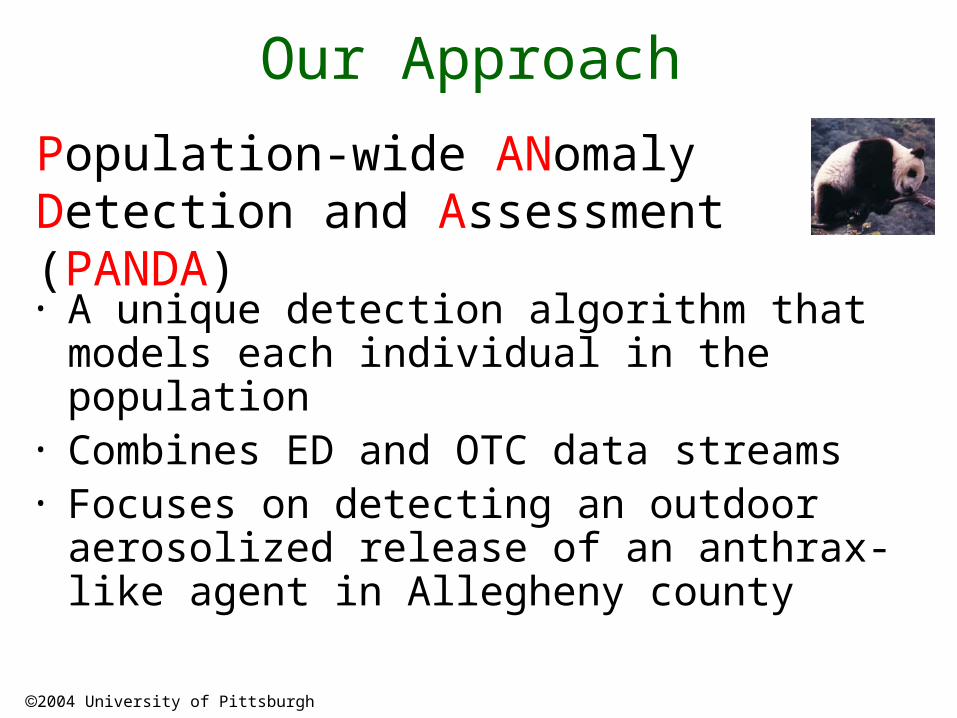
• A unique detection algorithm that models each individual in the population
• Combines ED and OTC data streams• Focuses on detecting an outdoor
aerosolized release of an anthrax-like agent in Allegheny county
Population-wide ANomaly Detection and Assessment (PANDA)
2004 University of Pittsburgh
PANDA: Population-wide Anomaly Detection and
Assessment
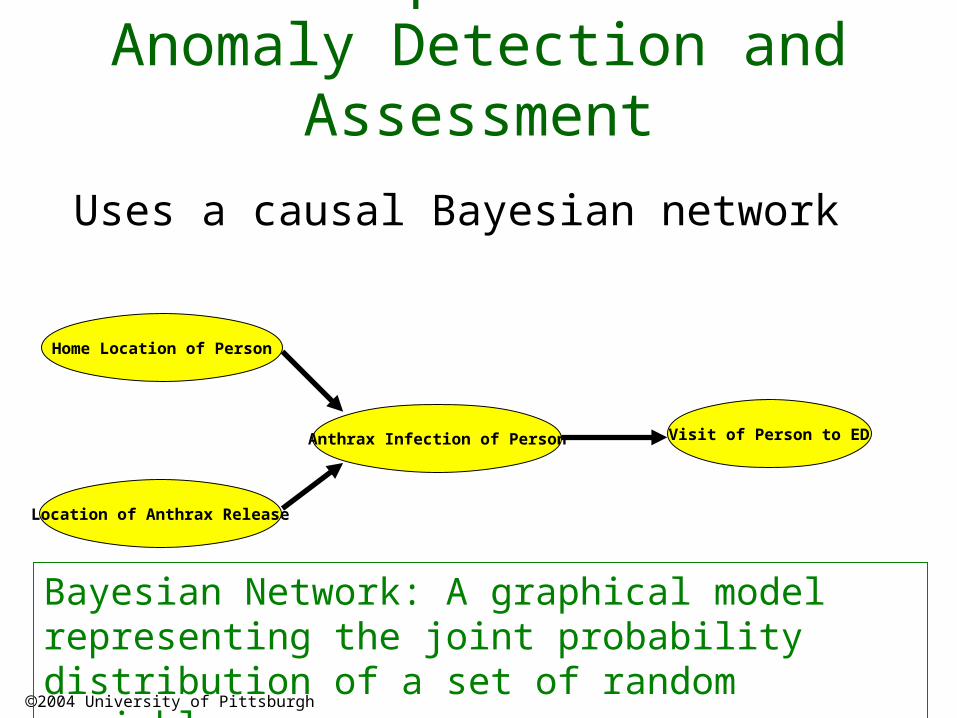
Visit of Person to ED
Location of Anthrax Release
Anthrax Infection of Person
Bayesian Network: A graphical model representing the joint probability distribution of a set of random variables
Uses a causal Bayesian network
Home Location of Person
2004 University of Pittsburgh
PANDA: Population-wide Anomaly Detection and
Assessment
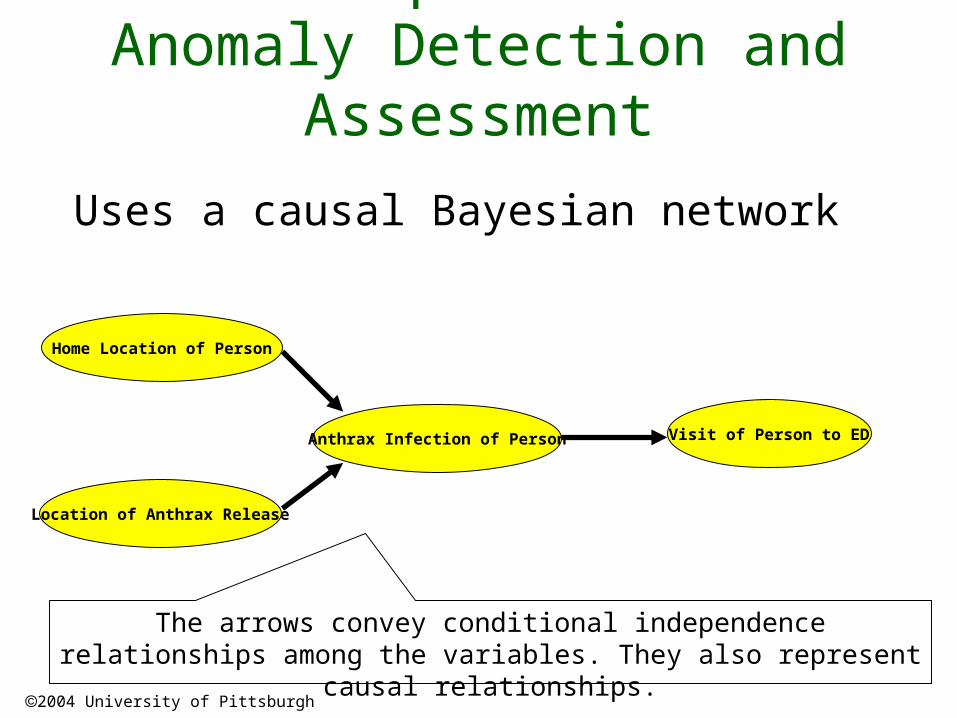
The arrows convey conditional independence relationships among the variables. They also represent causal relationships.
Uses a causal Bayesian network
Visit of Person to ED
Location of Anthrax Release
Anthrax Infection of Person
Home Location of Person
2004 University of Pittsburgh
Outline
1. Introduction2. Model3. Inference4. Conclusions
2004 University of Pittsburgh
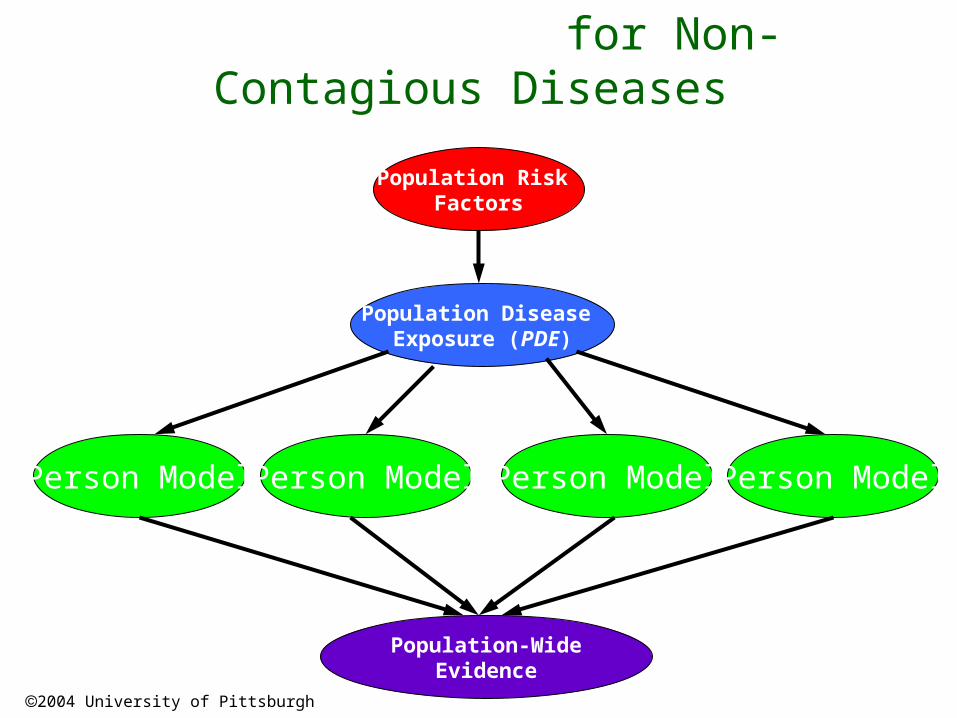
The Generic PANDA Model for Non-Contagious Diseases
Population Risk Factors
Population Disease Exposure (PDE)
Person Model
Population-WideEvidence
Person Model Person Model Person Model
2004 University of Pittsburgh
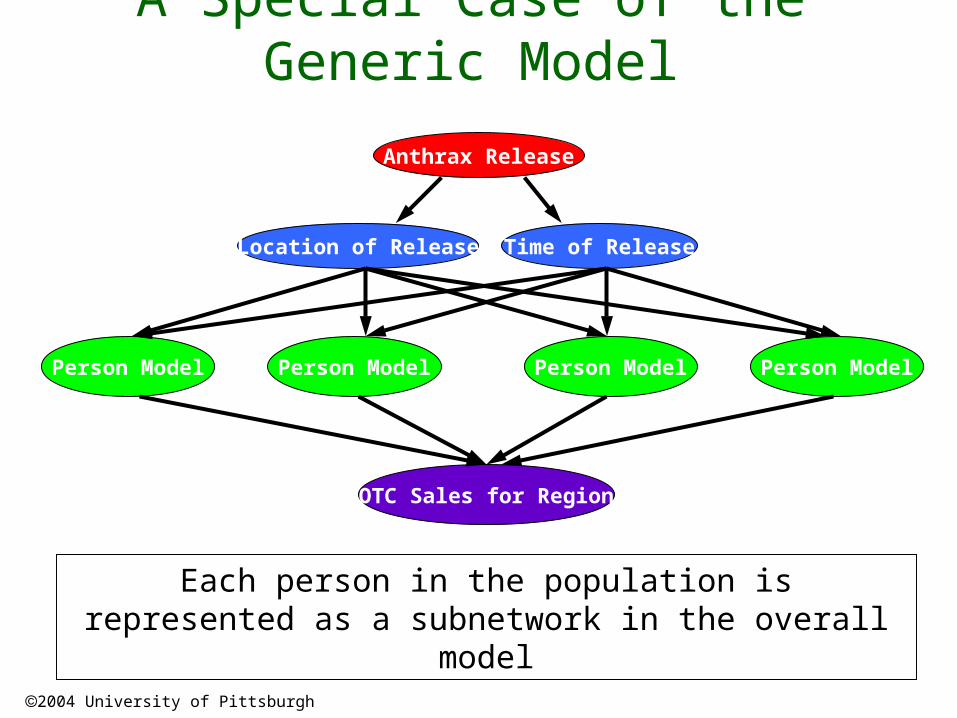
A Special Case of the Generic Model
Time of Release
Person Model
Anthrax Release
Location of Release
Person ModelPerson ModelPerson Model
OTC Sales for Region
Each person in the population is represented as a subnetwork in the overall model
2004 University of Pittsburgh
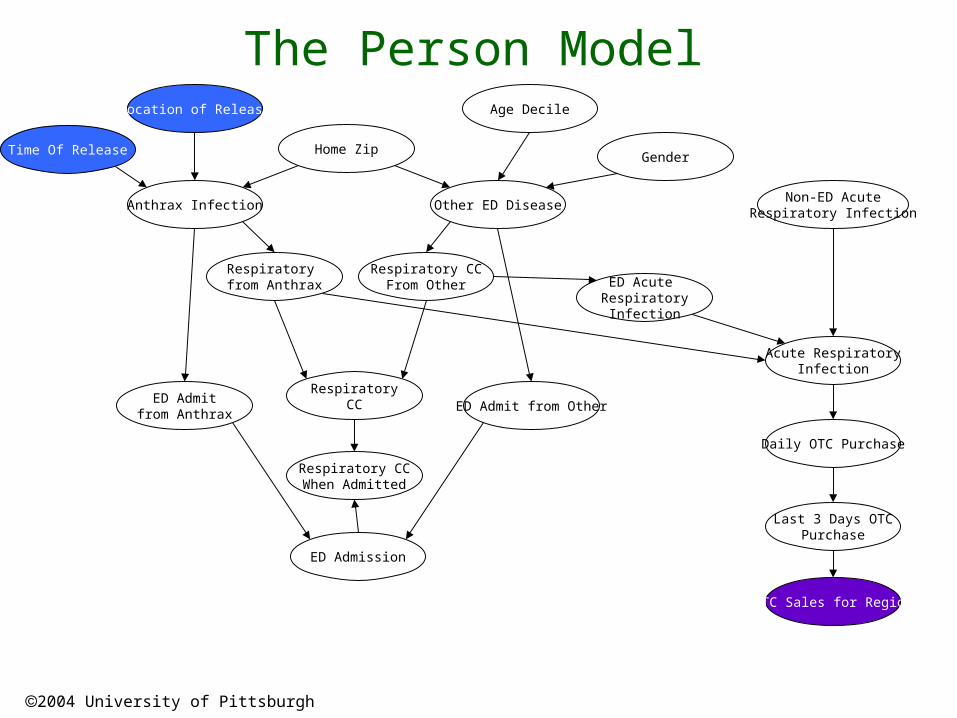
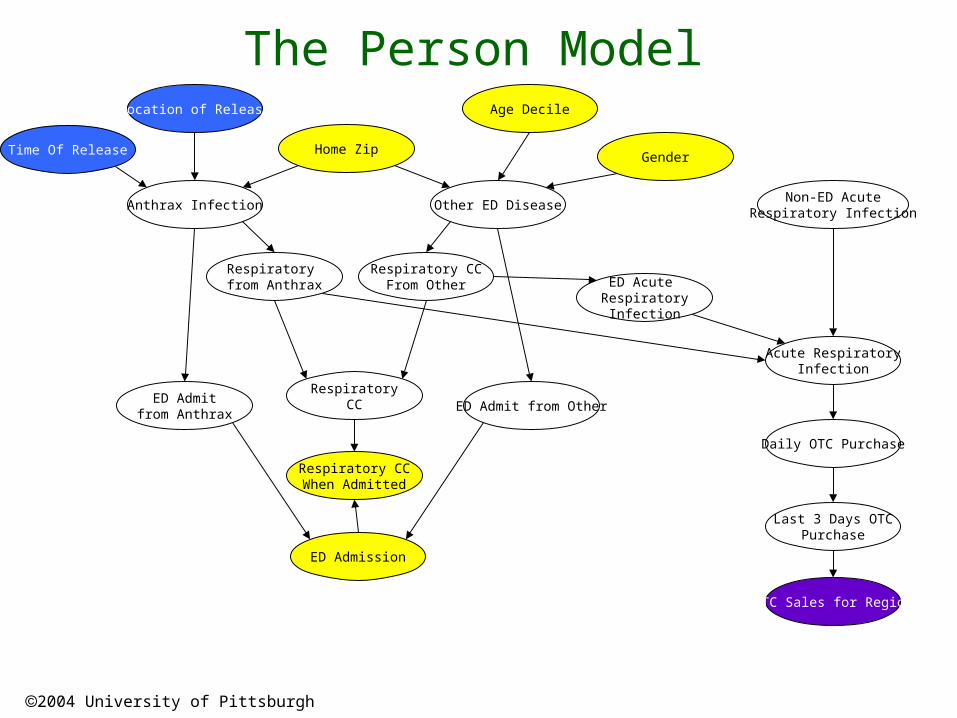
Location of Release
Time Of Release
Anthrax Infection
Home Zip
Respiratory from Anthrax
Other ED Disease
Gender
Age Decile
Respiratory CCFrom Other
RespiratoryCC
Respiratory CCWhen Admitted
ED Admitfrom Anthrax
ED Admit from Other
ED Acute Respiratory
Infection
Acute RespiratoryInfection
Daily OTC Purchase
Last 3 Days OTCPurchase
Non-ED AcuteRespiratory Infection
ED Admission
The Person Model
OTC Sales for Region
2004 University of Pittsburgh
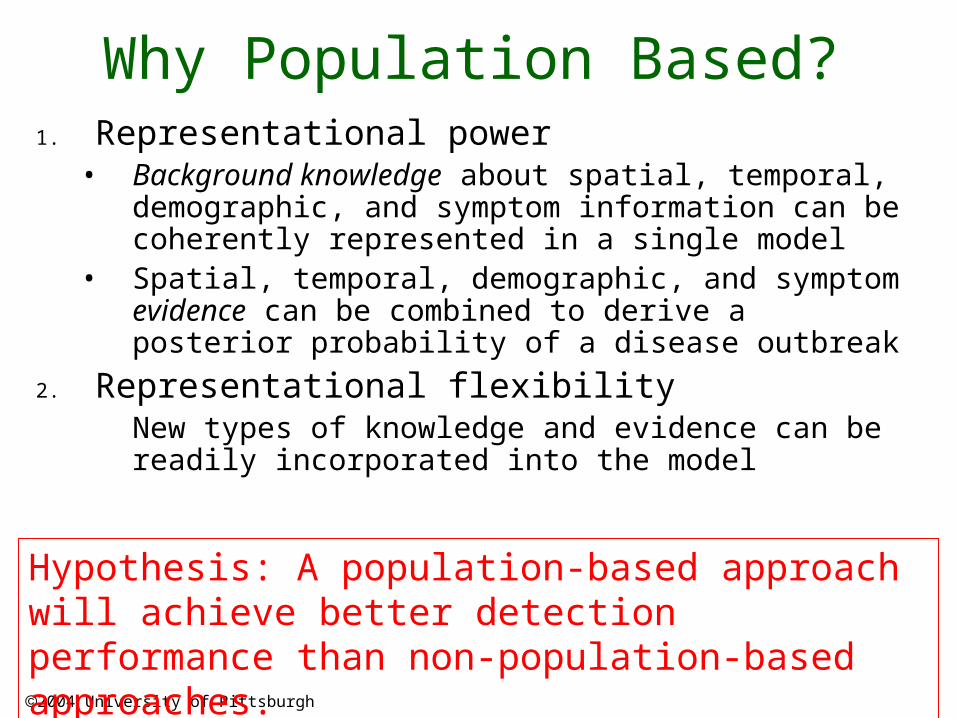
Why Population Based?1. Representational power
• Background knowledge about spatial, temporal, demographic, and symptom information can be coherently represented in a single model
• Spatial, temporal, demographic, and symptom evidence can be combined to derive a posterior probability of a disease outbreak
2. Representational flexibilityNew types of knowledge and evidence can be readily incorporated into the model
Hypothesis: A population-based approach will achieve better detection performance than non-population-based approaches.

2004 University of Pittsburgh
Computational Cost of a Population-Wide Approach?
~1.4 million people in Allegheny County, Pennsylvania
2004 University of Pittsburgh
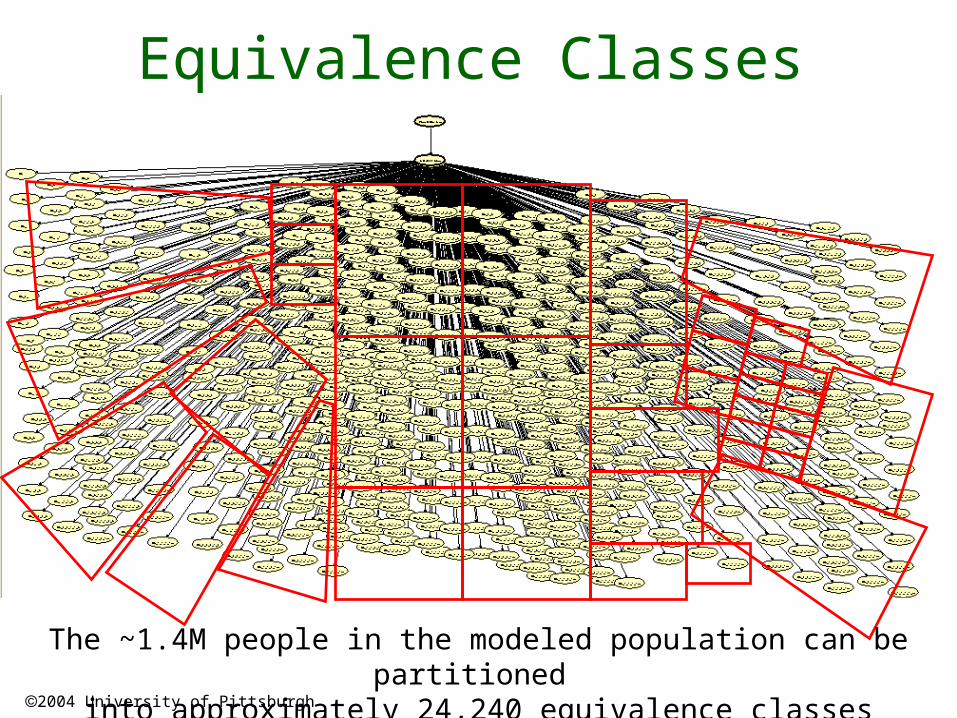
Equivalence Classes
The ~1.4M people in the modeled population can be partitioned into approximately 24,240 equivalence classes
2004 University of Pittsburgh
Location of Release
Time Of Release
Anthrax Infection
Home Zip
Respiratory from Anthrax
Other ED Disease
Gender
Age Decile
Respiratory CCFrom Other
RespiratoryCC
Respiratory CCWhen Admitted
ED Admitfrom Anthrax
ED Admit from Other
ED Acute Respiratory
Infection
Acute RespiratoryInfection
Daily OTC Purchase
Last 3 Days OTCPurchase
Non-ED AcuteRespiratory Infection
ED Admission
The Person Model
OTC Sales for Region
Location of Release
Time Of Release
Anthrax Infection
Home Zip
Respiratory from Anthrax
Other ED Disease
Gender
Age Decile
Respiratory CCFrom Other
RespiratoryCC
Respiratory CCWhen Admitted
ED Admitfrom Anthrax
ED Admit from Other
ED AcuteRespiratory
Infection
Acute RespiratoryInfection
Daily OTC Purchase
Last 3 Days OTCPurchase
Non-ED AcuteRespiratory Infection
ED Admission
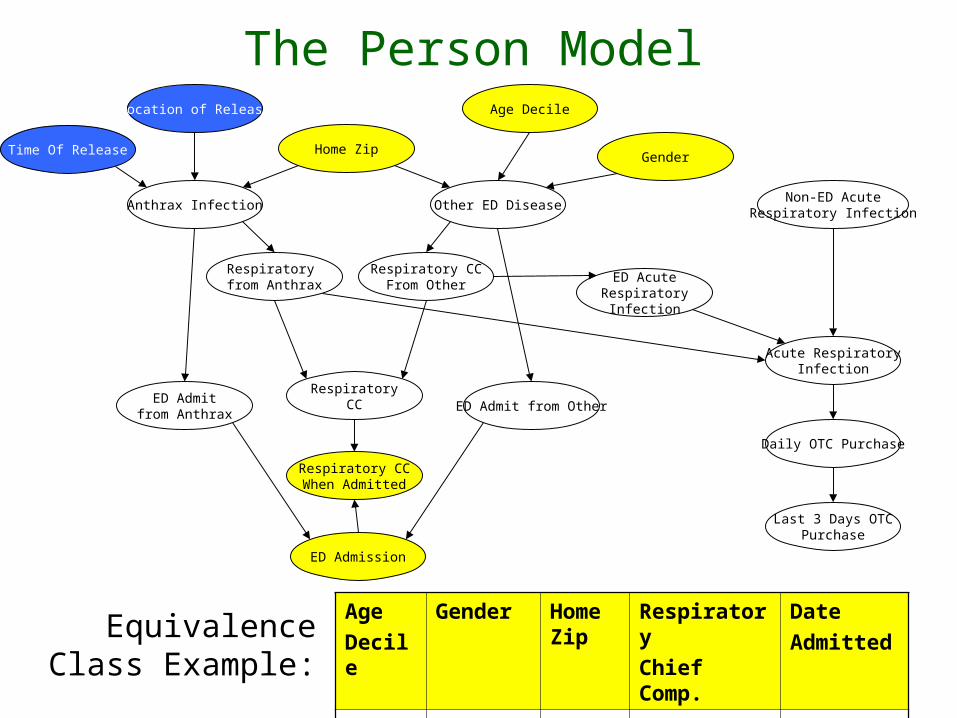
The Person Model
AgeDecile
Gender Home Zip
Respiratory Chief Comp.
DateAdmitted
20-30 Male 15213 Yes Today
Equivalence Class Example:
2004 University of Pittsburgh
Outline
1. Introduction2. Model3. Inference4. Conclusions
2004 University of Pittsburgh
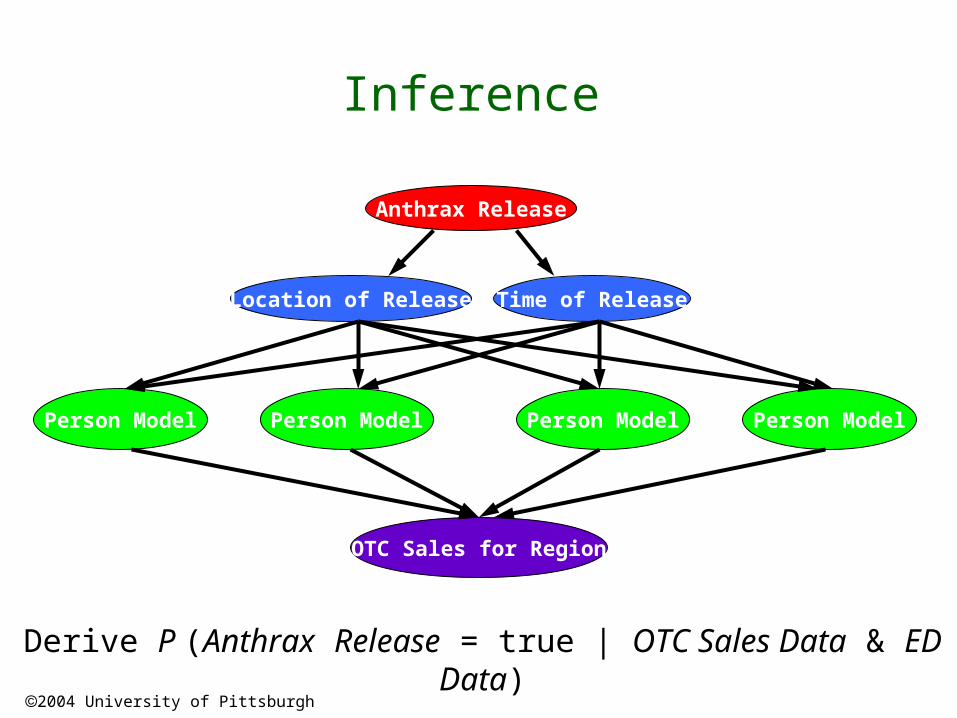
Inference
Time of Release
Person Model
Anthrax Release
Location of Release
Person ModelPerson ModelPerson Model
Derive P (Anthrax Release = true | OTC Sales Data & ED Data)
OTC Sales for Region
2004 University of Pittsburgh
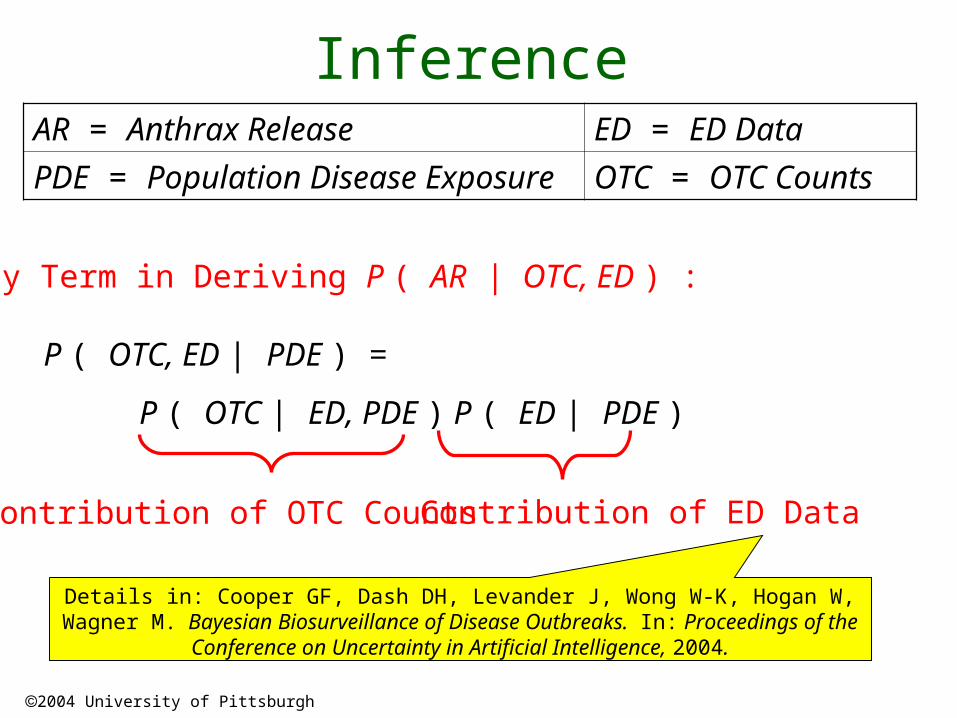
InferenceAR = Anthrax Release ED = ED Data
PDE = Population Disease Exposure
OTC = OTC Counts
P ( OTC, ED | PDE ) =
P ( OTC | ED, PDE ) P ( ED | PDE )
Contribution of ED DataContribution of OTC Counts
Key Term in Deriving P ( AR | OTC, ED ) :
Details in: Cooper GF, Dash DH, Levander J, Wong W-K, Hogan W, Wagner M. Bayesian Biosurveillance of Disease Outbreaks. In: Proceedings of the
Conference on Uncertainty in Artificial Intelligence, 2004.
2004 University of Pittsburgh
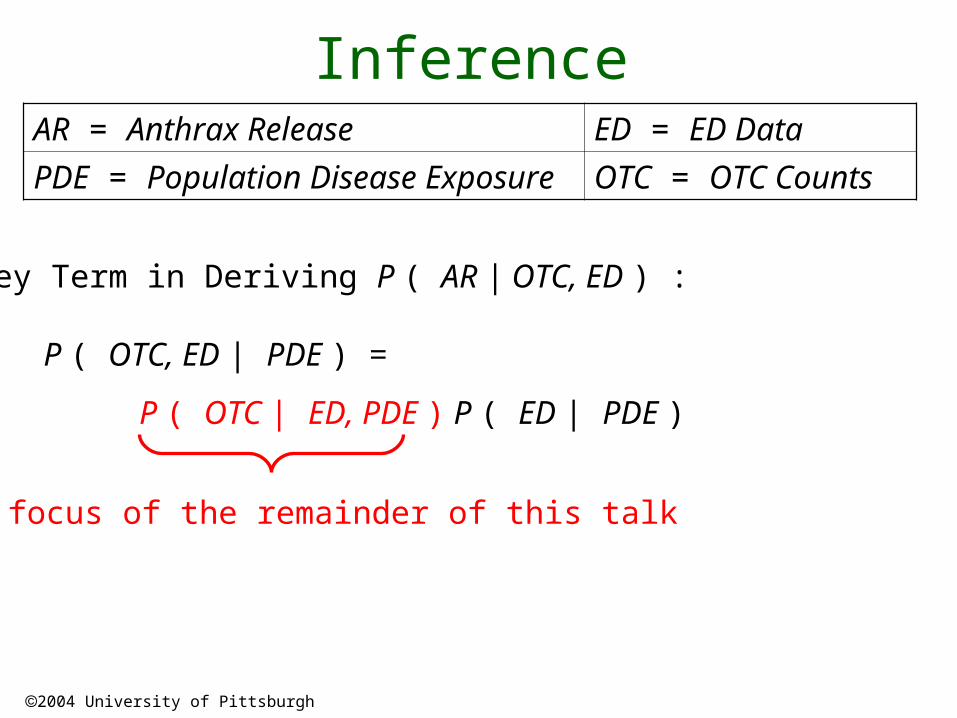
InferenceAR = Anthrax Release ED = ED Data
PDE = Population Disease Exposure
OTC = OTC Counts
P ( OTC, ED | PDE ) =
P ( OTC | ED, PDE ) P ( ED | PDE )
The focus of the remainder of this talk
Key Term in Deriving P ( AR | OTC, ED ) :
2004 University of Pittsburgh
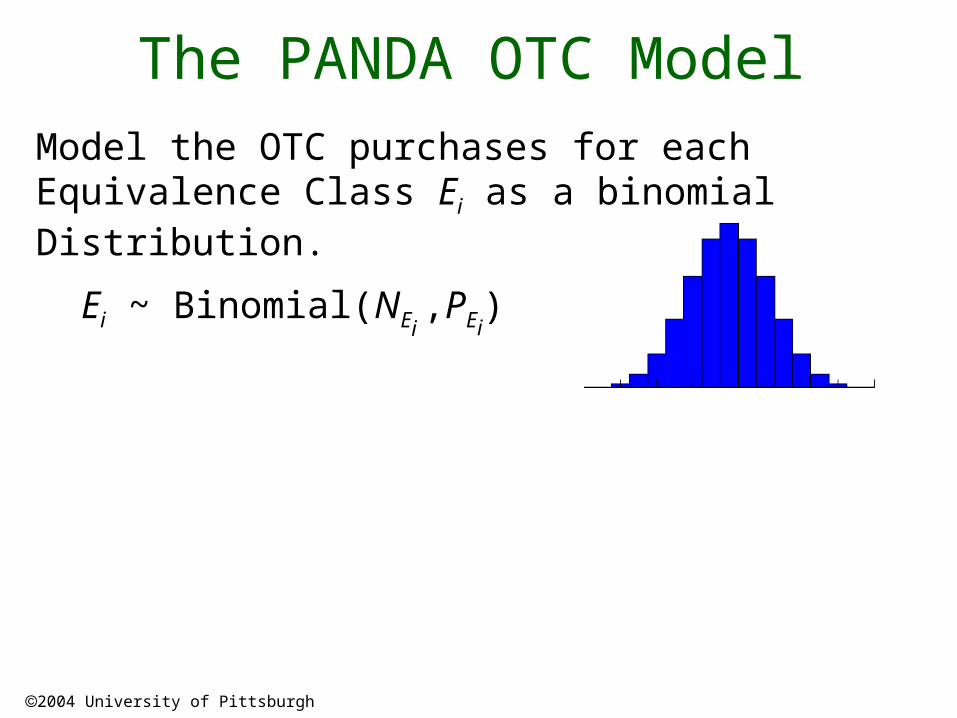
The PANDA OTC ModelModel the OTC purchases for each Equivalence Class Ei as a binomial Distribution.
Ei ~ Binomial(NEi ,PEi
)
2004 University of Pittsburgh
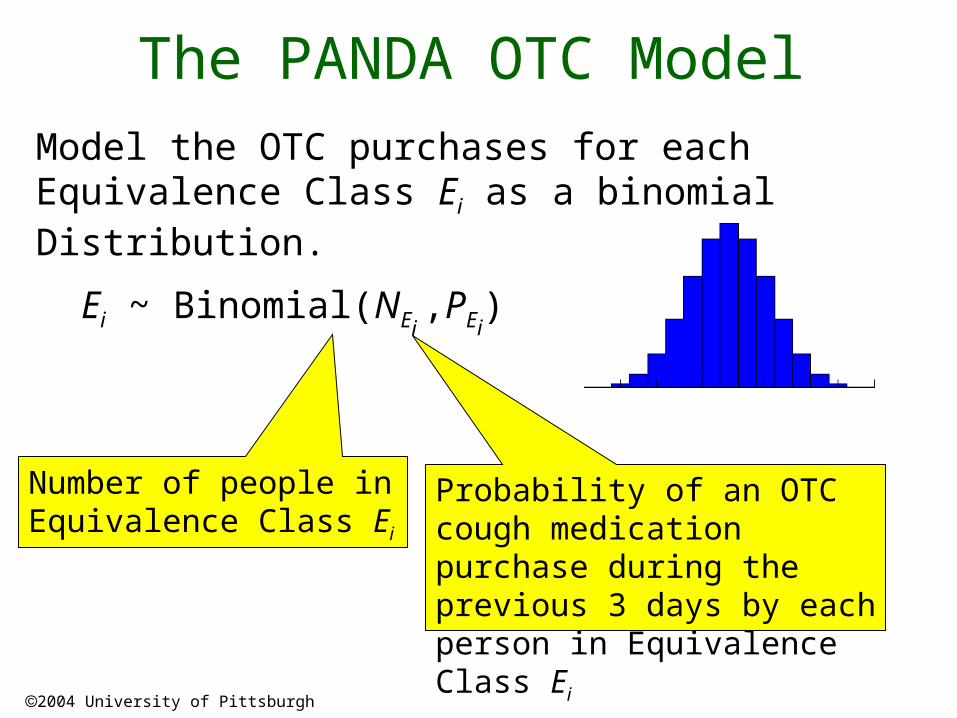
The PANDA OTC ModelModel the OTC purchases for each Equivalence Class Ei as a binomial Distribution.
Ei ~ Binomial(NEi ,PEi
)
Number of people in Equivalence Class Ei
Probability of an OTC cough medication purchase during the previous 3 days by each person in Equivalence Class Ei
2004 University of Pittsburgh
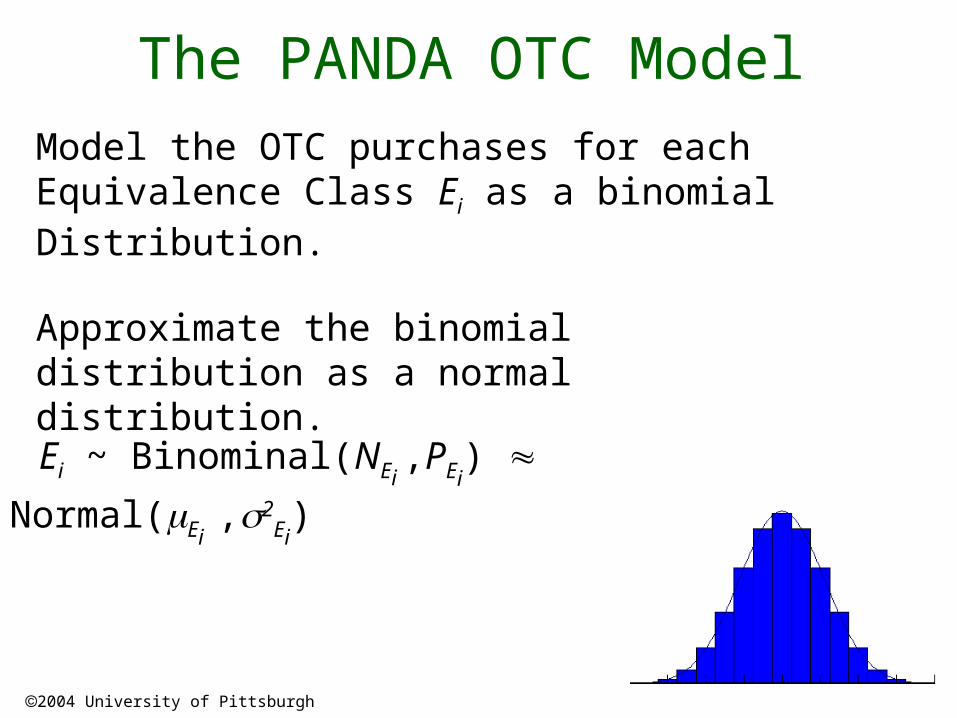
The PANDA OTC ModelModel the OTC purchases for each Equivalence Class Ei as a binomial Distribution.
Approximate the binomial distribution as a normal distribution.
Ei ~ Binominal(NEi ,PEi
)
Normal(Ei ,2
Ei)
2004 University of Pittsburgh
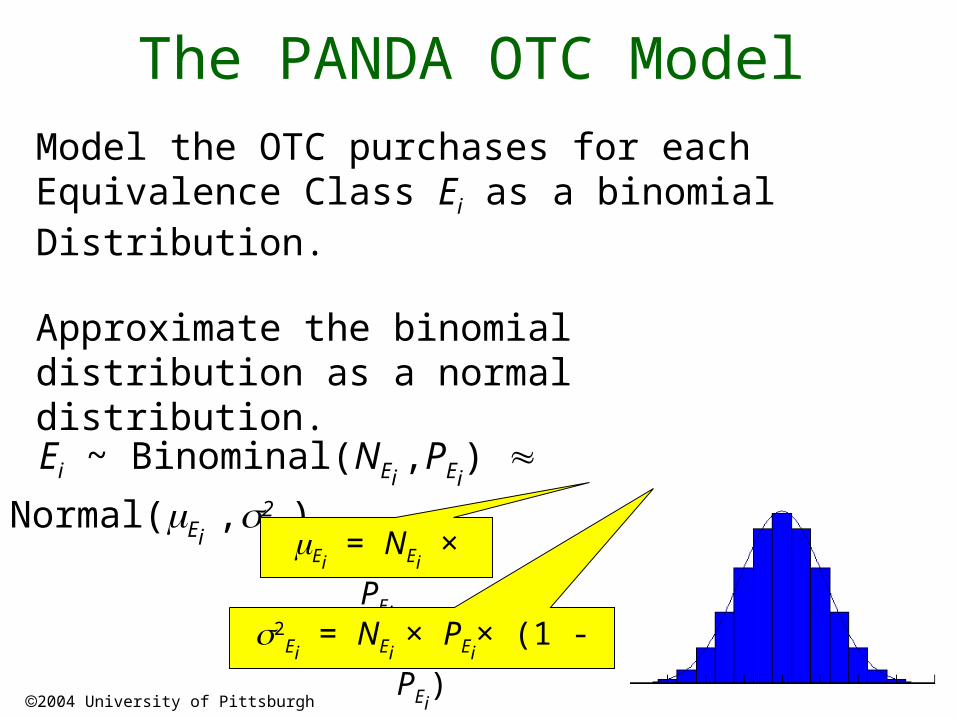
The PANDA OTC ModelModel the OTC purchases for each Equivalence Class Ei as a binomial Distribution.
Approximate the binomial distribution as a normal distribution.
Ei ~ Binominal(NEi ,PEi
)
Normal(Ei ,2
Ei)Ei
= NEi × PEi
2Ei = NEi
× PEi× (1 - PEi
)
2004 University of Pittsburgh
The PANDA OTC Model
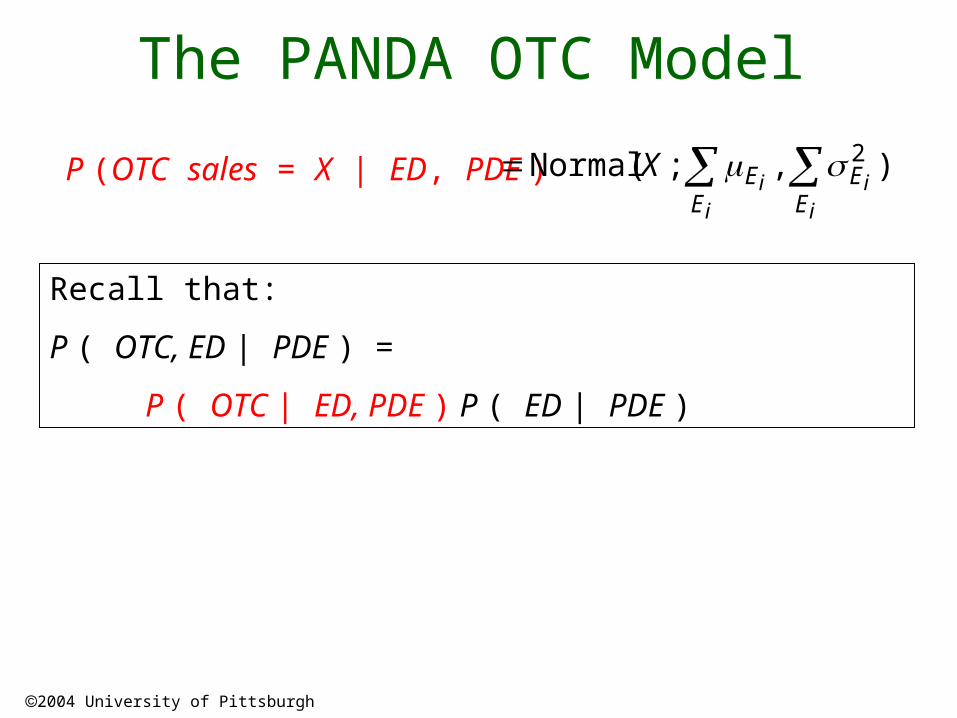
P (OTC sales = X | ED, PDE ) ),;(Normal 2i
ii
iE
EE
EX
Recall that:
P ( OTC, ED | PDE ) =
P ( OTC | ED, PDE ) P ( ED | PDE )
2004 University of Pittsburgh
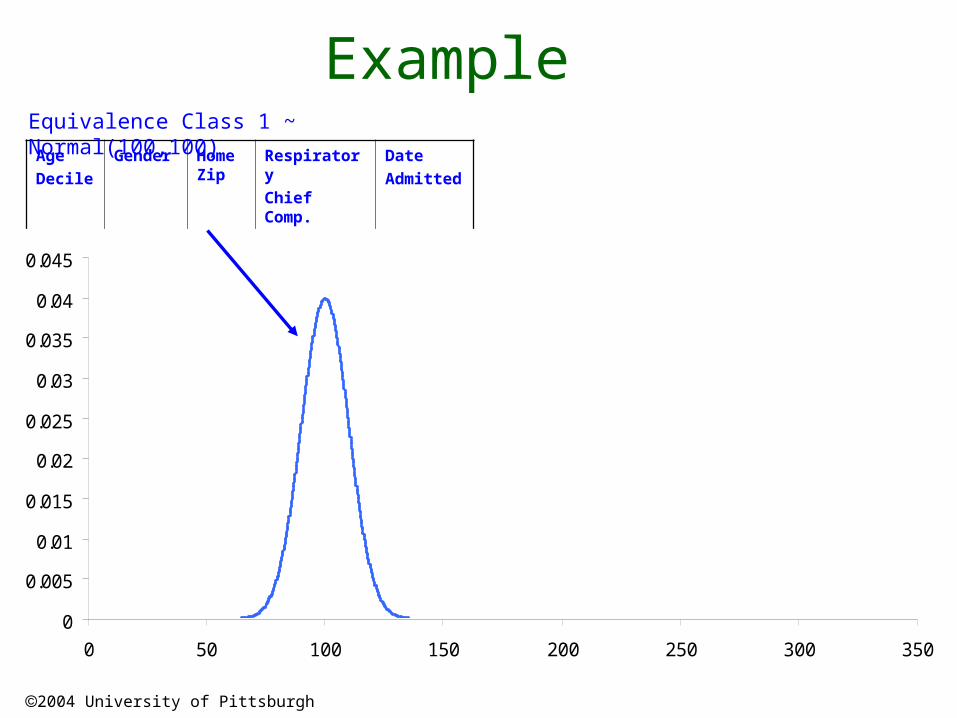
ExampleAgeDecile
Gender
Home Zip
Respiratory Chief Comp.
DateAdmitted
50-60 Male 15213
Yes Today
0
0.005
0.01
0.015
0.02
0.025
0.03
0.035
0.04
0.045
0 50 100 150 200 250 300 350
Equivalence Class 1 ~ Normal(100,100)
2004 University of Pittsburgh
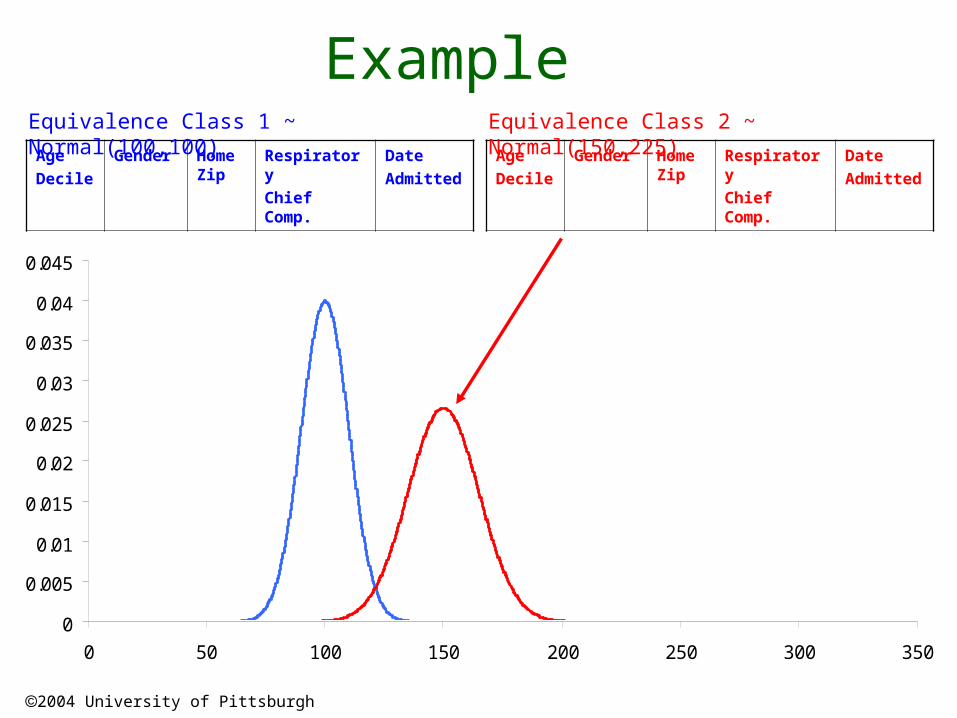
ExampleAgeDecile
Gender
Home Zip
Respiratory Chief Comp.
DateAdmitted
50-60 Male 15213
Yes Today
Equivalence Class 1 ~ Normal(100,100)
AgeDecile
Gender
Home Zip
Respiratory Chief Comp.
DateAdmitted
50-60 Female 15213
Yes Today
Equivalence Class 2 ~ Normal(150,225)
0
0.005
0.01
0.015
0.02
0.025
0.03
0.035
0.04
0.045
0 50 100 150 200 250 300 350
2004 University of Pittsburgh
0
0.005
0.01
0.015
0.02
0.025
0.03
0.035
0.04
0.045
0 50 100 150 200 250 300 350
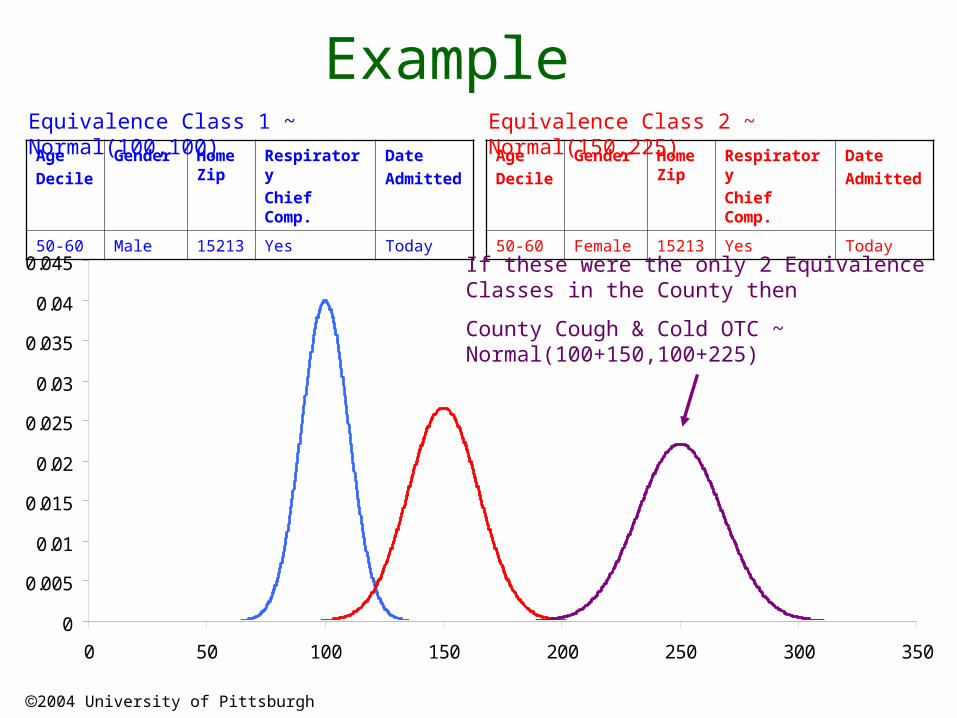
ExampleAgeDecile
Gender
Home Zip
Respiratory Chief Comp.
DateAdmitted
50-60 Male 15213
Yes Today
Equivalence Class 1 ~ Normal(100,100)
AgeDecile
Gender
Home Zip
Respiratory Chief Comp.
DateAdmitted
50-60 Female 15213
Yes Today
Equivalence Class 2 ~ Normal(150,225)
If these were the only 2 Equivalence Classes in the County then
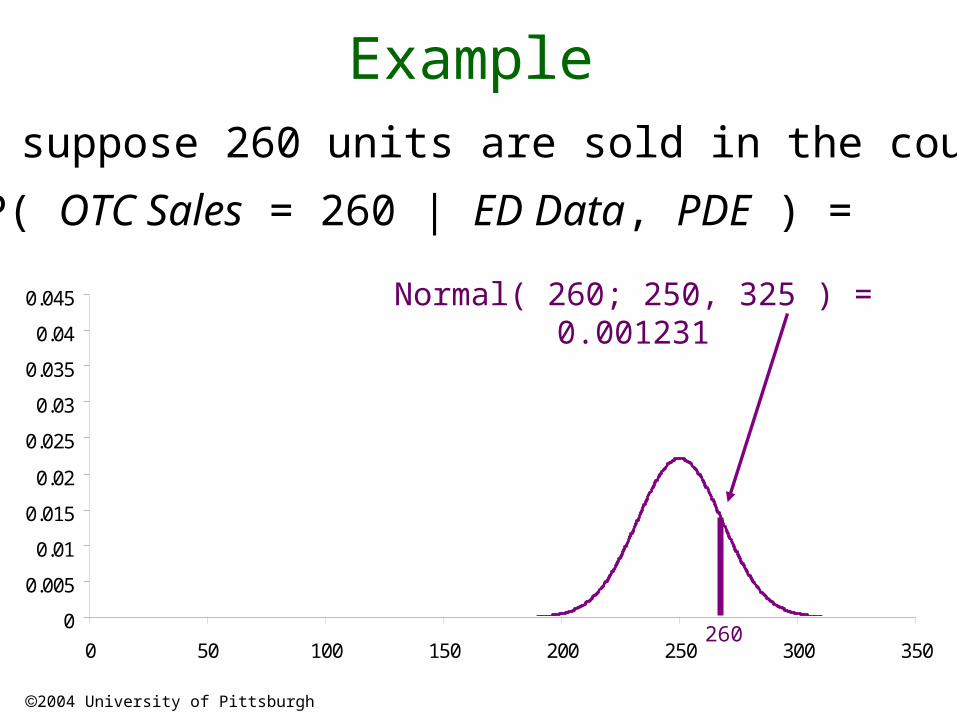
County Cough & Cold OTC ~ Normal(100+150,100+225)
2004 University of Pittsburgh
0
0.005
0.01
0.015
0.02
0.025
0.03
0.035
0.04
0.045
0 50 100 150 200 250 300 350
ExampleNow suppose 260 units are sold in the county
P( OTC Sales = 260 | ED Data, PDE ) =
Normal( 260; 250, 325 ) = 0.001231
260
2004 University of Pittsburgh
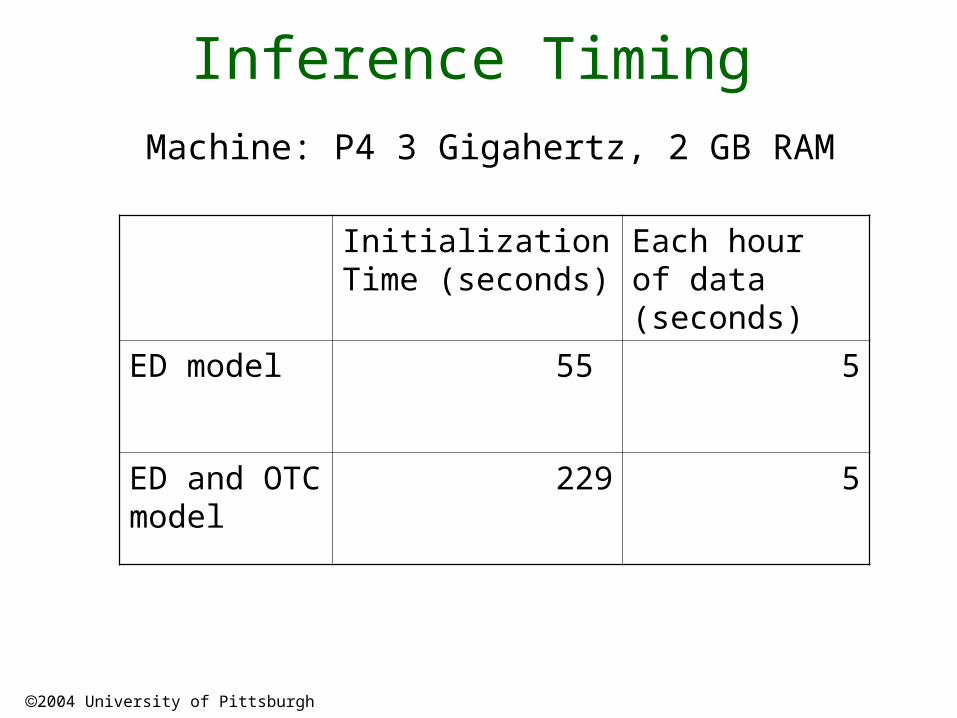
Inference TimingMachine: P4 3 Gigahertz, 2 GB RAM
Initialization Time (seconds)
Each hour of data (seconds)
ED model 55 5
ED and OTC model
229 5
2004 University of Pittsburgh
Outline
1. Introduction2. Model3. Inference4. Conclusions
2004 University of Pittsburgh
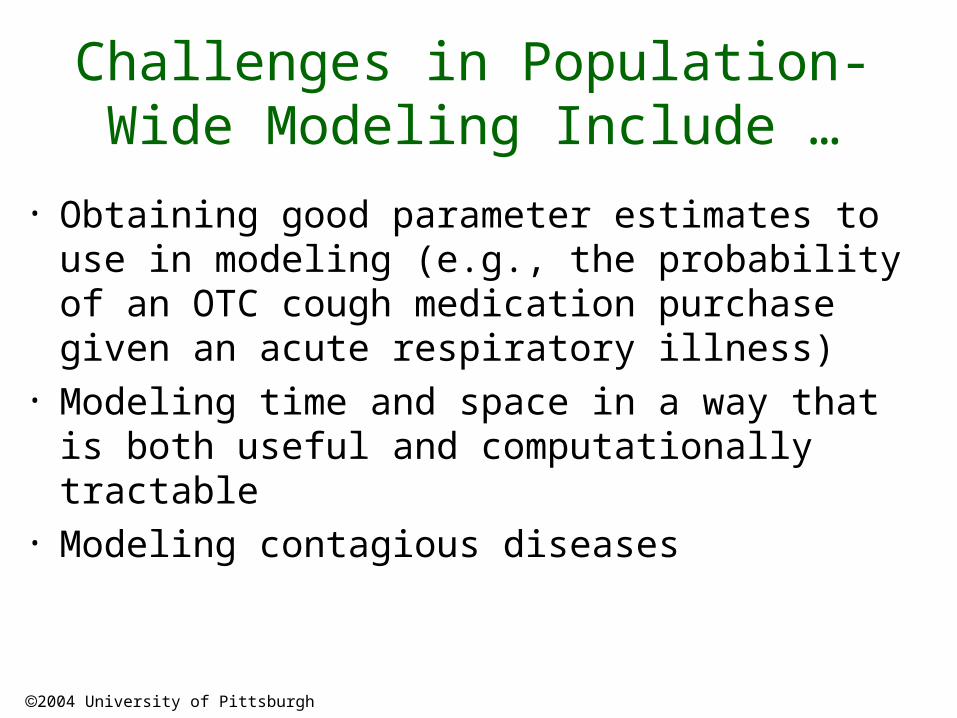
Challenges in Population-Wide Modeling Include …
• Obtaining good parameter estimates to use in modeling (e.g., the probability of an OTC cough medication purchase given an acute respiratory illness)
• Modeling time and space in a way that is both useful and computationally tractable
• Modeling contagious diseases
2004 University of Pittsburgh
Conclusions• PANDA is a multivariate algorithm that
can combine multiple data streams• Modeling each individual in the
population is computationally feasible • An evaluation of this approach using
simulations is in progress
2004 University of Pittsburgh
Thank you
http://www.cbmi.pitt.edu/panda/