Embed Size (px)
DESCRIPTION
Infrastructure and Methods to Support Real Time Biosurveillance. Kenneth D. Mandl, MD, MPH Children’s Hospital Boston Harvard Medical School. Category A agents. Anthrax ( Bacillus anthracis )• Botulism ( Clostridium botulinum toxin ) » Plague ( Yersinia pestis ) » - PowerPoint PPT Presentation
Citation preview
Infrastructure and Methods to Support Real Time Biosurveillance
Kenneth D. Mandl, MD, MPHChildren’s Hospital Boston
Harvard Medical School
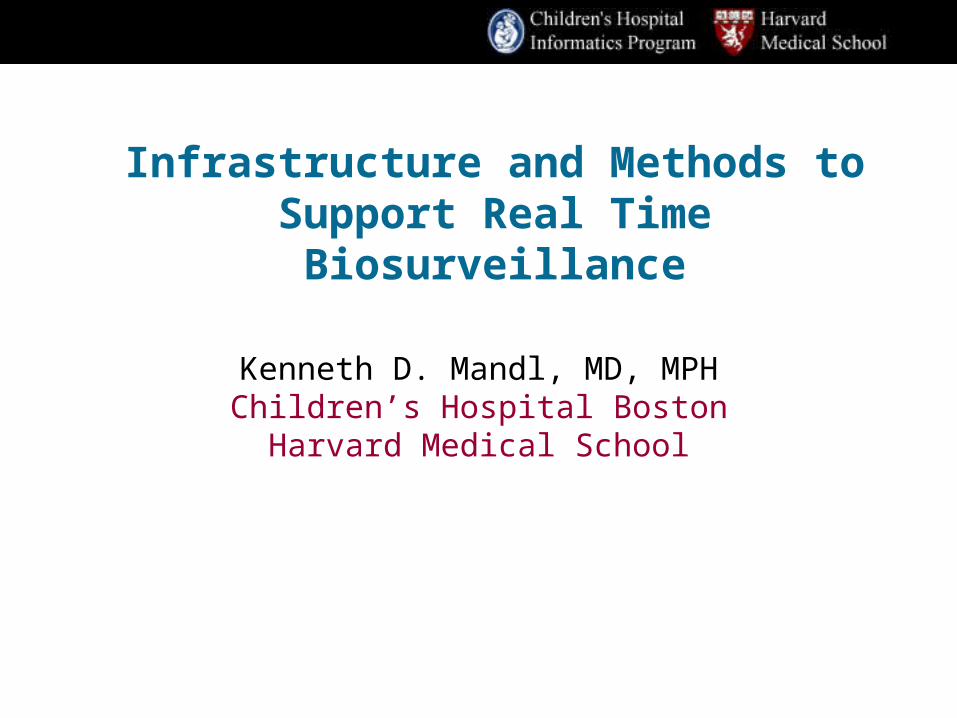
Category A agents
Anthrax (Bacillus anthracis)• Botulism (Clostridium botulinum toxin)»Plague (Yersinia pestis)»Smallpox (Variola major)»Tularemia (Francisella tularensis)»Viral hemorrhagic fevers
(filoviruses [e.g., Ebola, Marburg] and arenaviruses [e.g., Lassa])
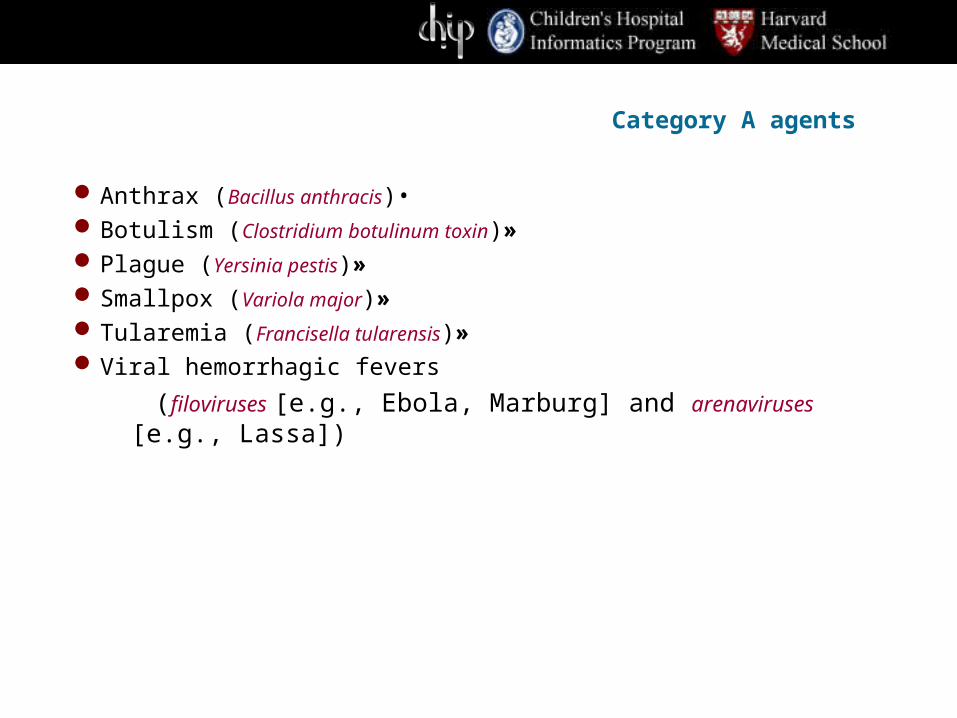
Natural history—Anthrax
Incubation is 1-6 daysFlu like symptoms followed in 2 days by acute
phase, including breathing difficulty, shock. Death within 24 hours of acute phaseTreatment must be initiated within 24
hours of symptoms
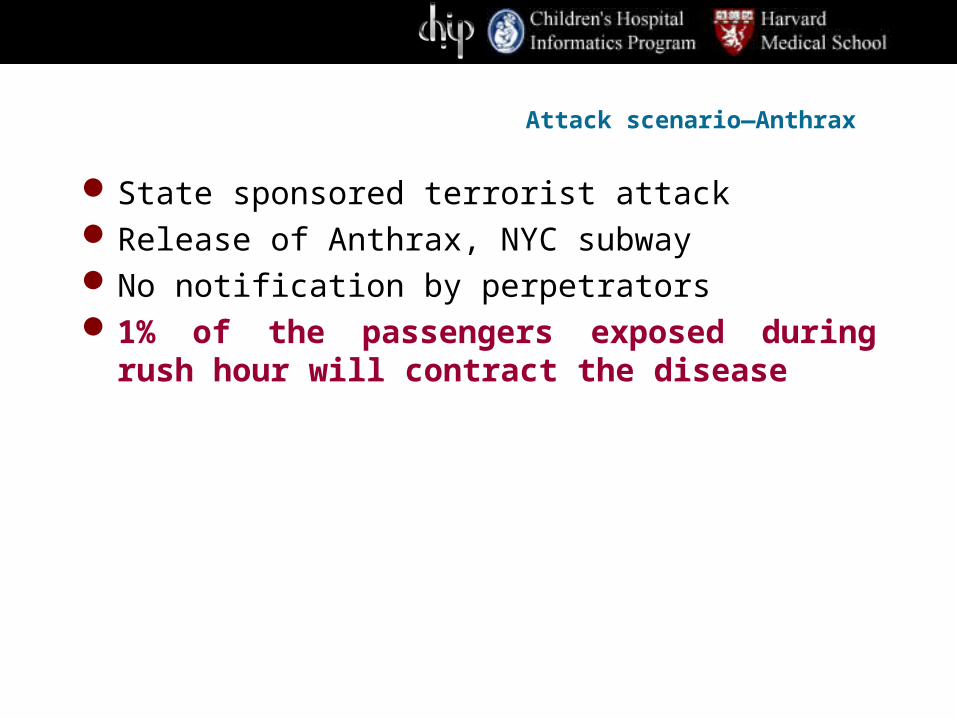
Attack scenario—Anthrax
State sponsored terrorist attackRelease of Anthrax, NYC subwayNo notification by perpetrators1% of the passengers exposed during
rush hour will contract the disease
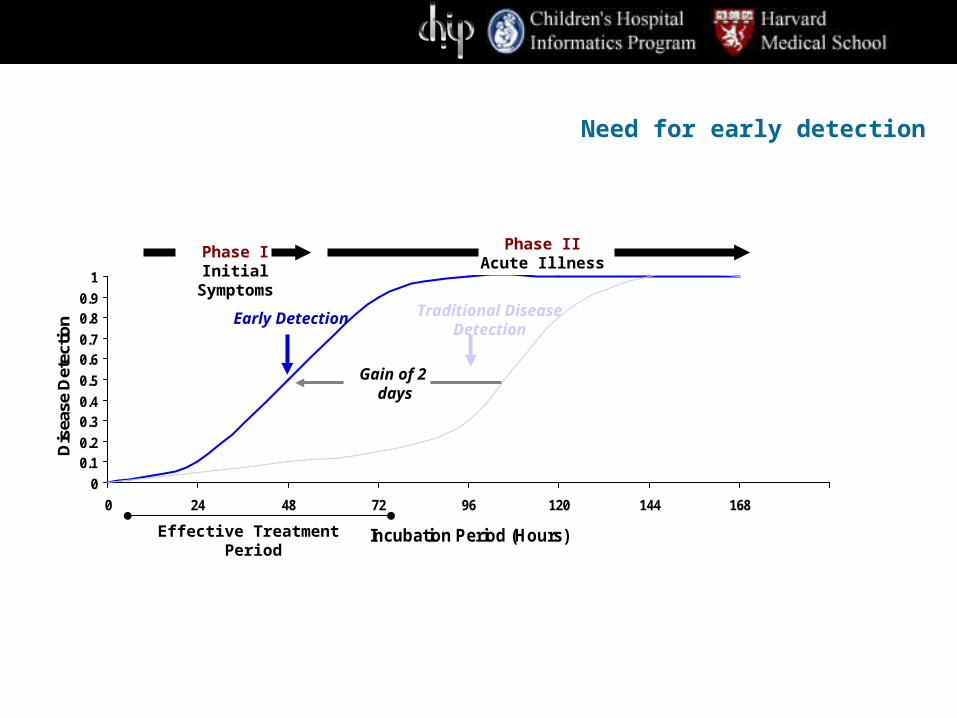
0
0.10.2
0.30.4
0.5
0.60.7
0.80.9
1
0 24 48 72 96 120 144 168
Incubation Period (Hours)
Dis
ease
Det
ectio
n
Effective Treatment Period
Gain of 2 days
Early Detection Traditional DiseaseDetection
Phase IIAcute Illness
Phase IInitial Symptoms
Need for early detection
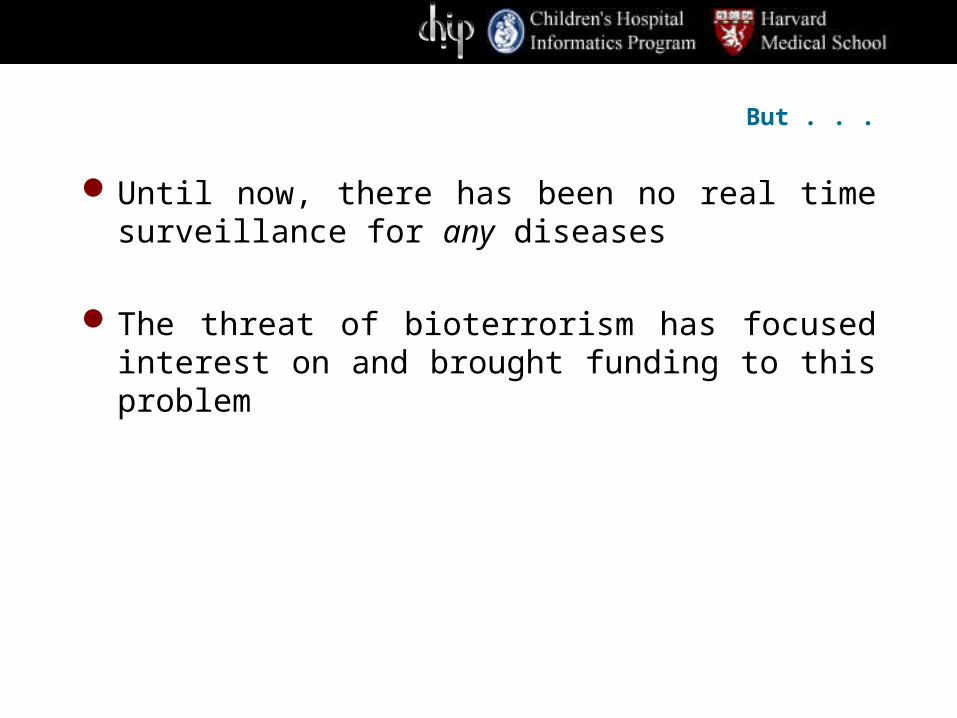
But . . .
Until now, there has been no real time surveillance for any diseases
The threat of bioterrorism has focused interest on and brought funding to this problem
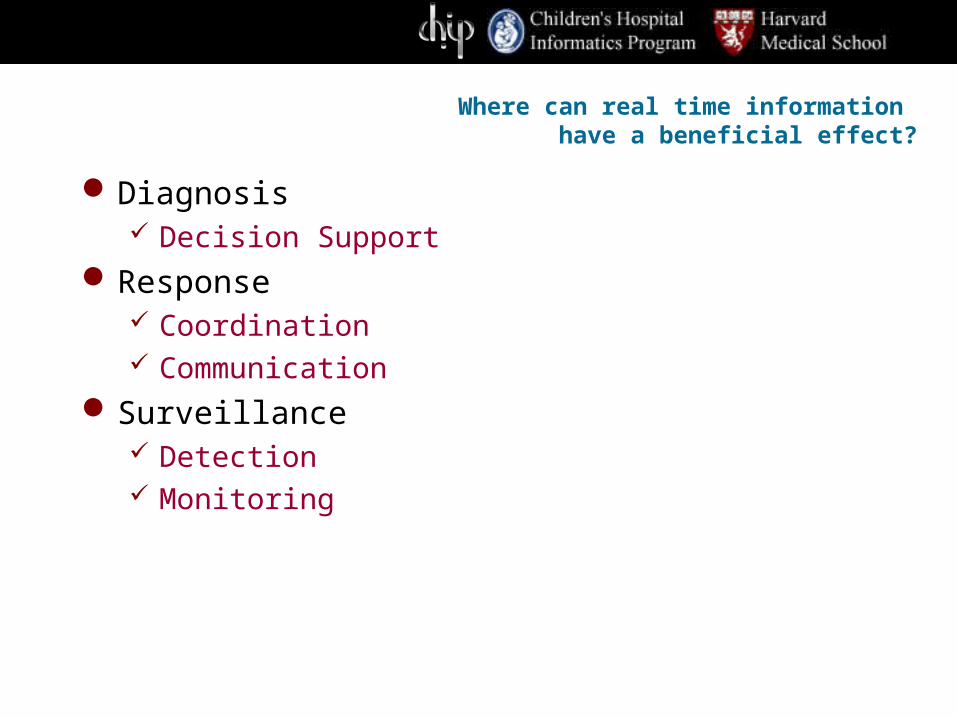
Where can real time information have a beneficial effect?
Diagnosis Decision Support
Response Coordination Communication
Surveillance Detection Monitoring
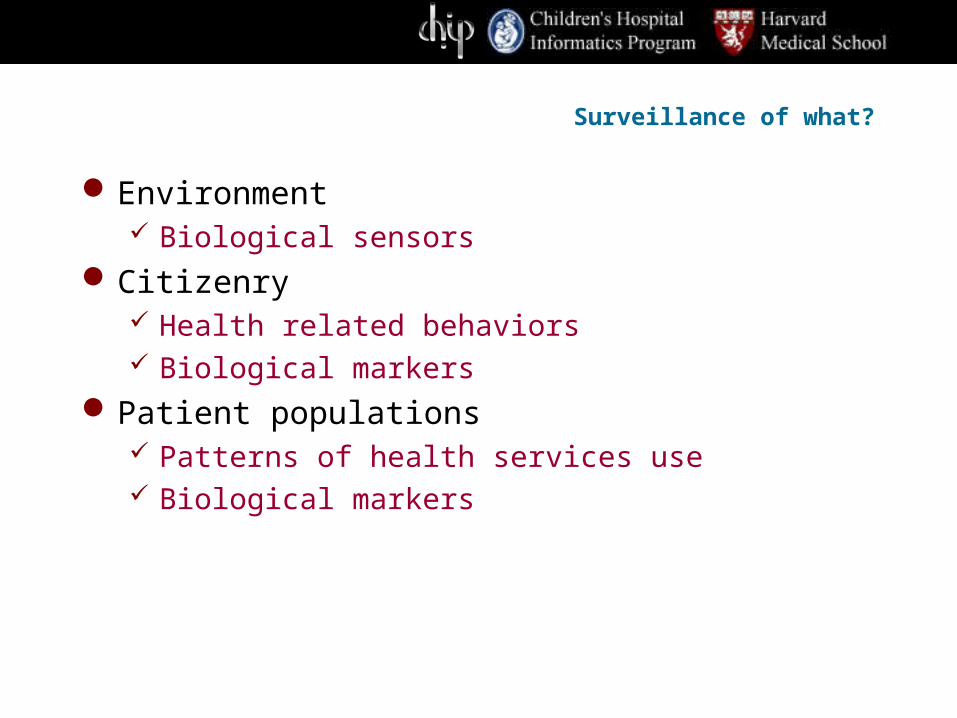
Surveillance of what?
Environment Biological sensors
Citizenry Health related behaviors Biological markers
Patient populations Patterns of health services use Biological markers
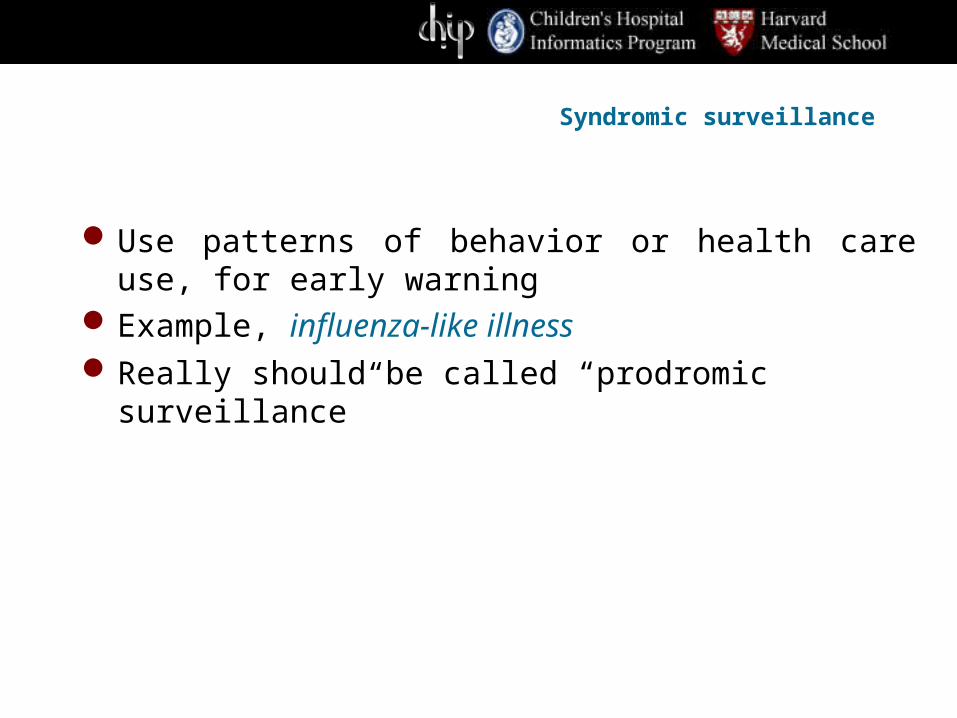
Syndromic surveillance
Use patterns of behavior or health care use, for early warning
Example, influenza-like illnessReally should be called “prodromic surveillance”
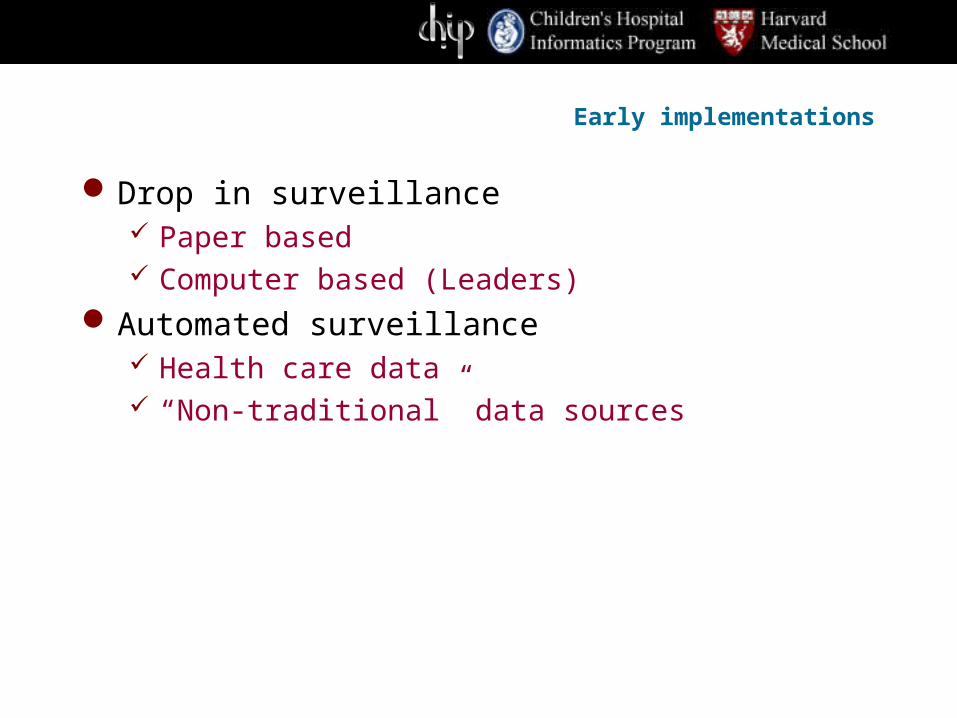
Early implementations
Drop in surveillance Paper based Computer based (Leaders)
Automated surveillance Health care data “Non-traditional” data sources
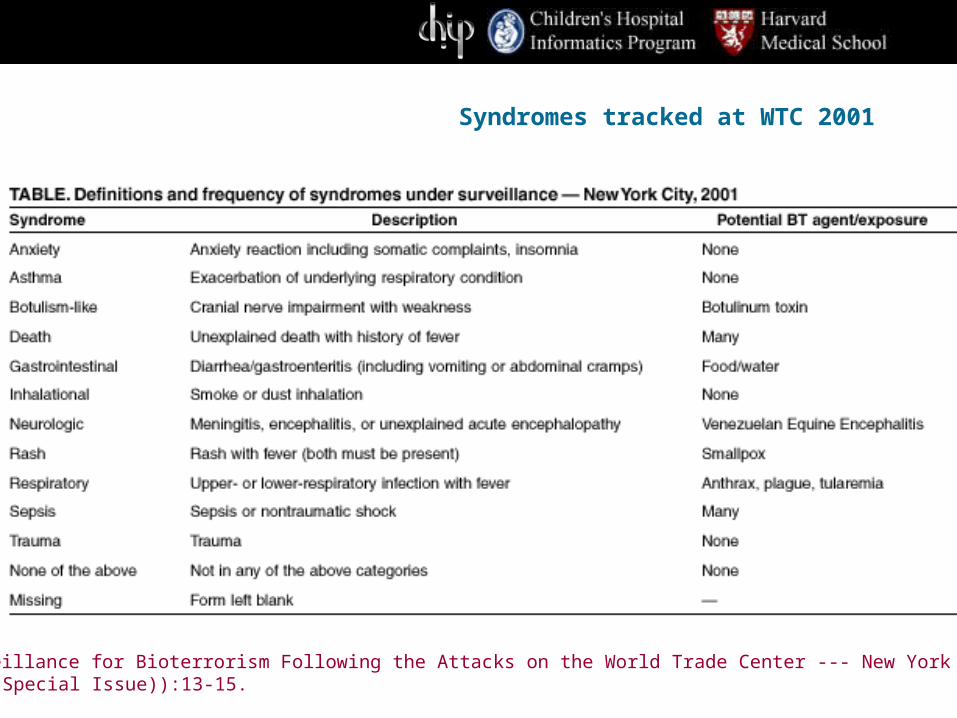
Syndromes tracked at WTC 2001
Syndromic Surveillance for Bioterrorism Following the Attacks on the World Trade Center --- New York City, 2001. MMWR. 2002;51((Special Issue)):13-15.
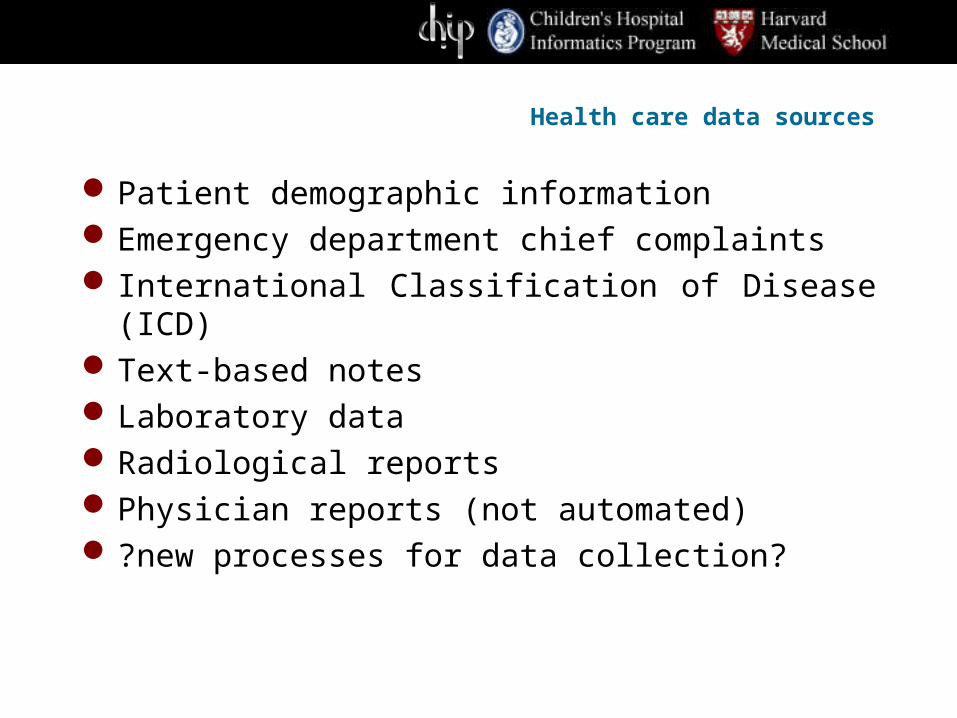
Health care data sources
Patient demographic informationEmergency department chief complaints International Classification of Disease (ICD)Text-based notesLaboratory dataRadiological reportsPhysician reports (not automated)?new processes for data collection?
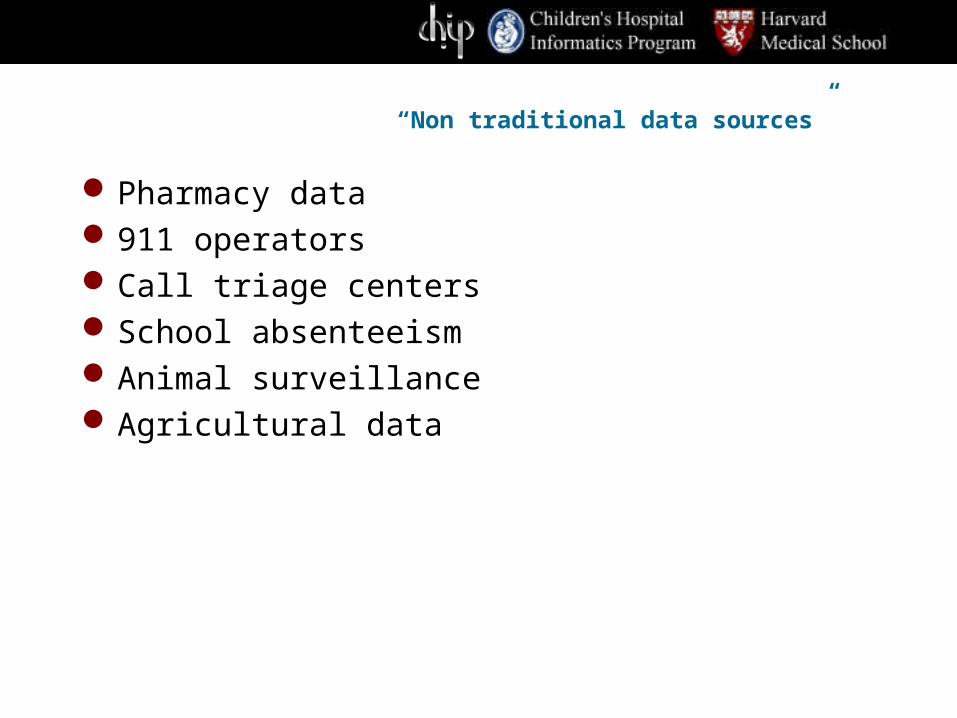
“Non traditional data sources”
Pharmacy data911 operatorsCall triage centersSchool absenteeismAnimal surveillanceAgricultural data
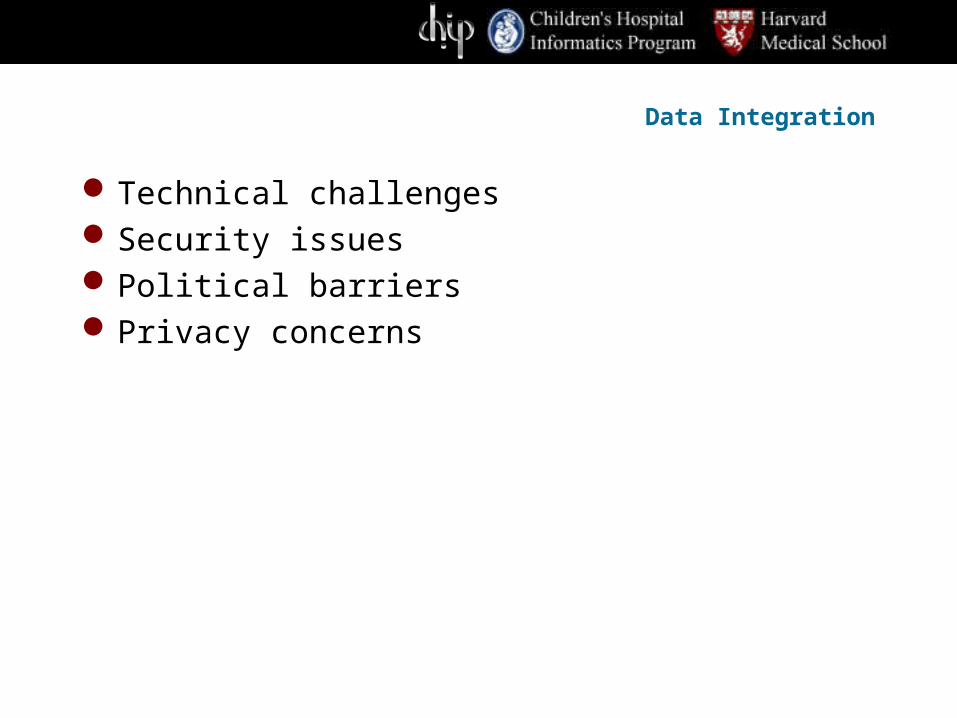
Data Integration
Technical challengesSecurity issuesPolitical barriersPrivacy concerns
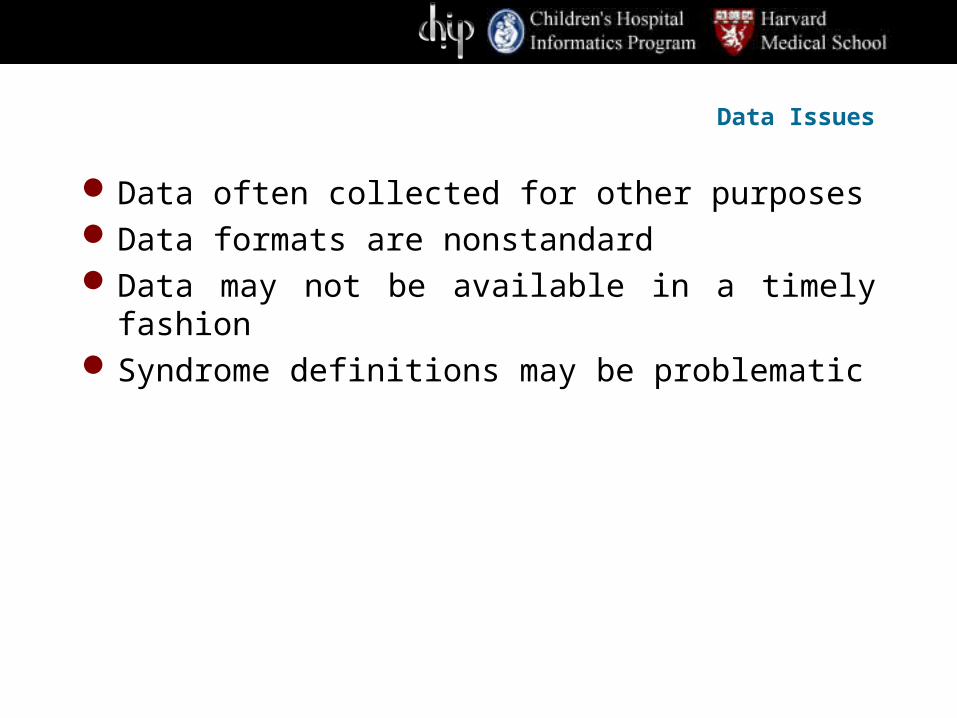
Data Issues
Data often collected for other purposesData formats are nonstandardData may not be available in a timely fashionSyndrome definitions may be problematic
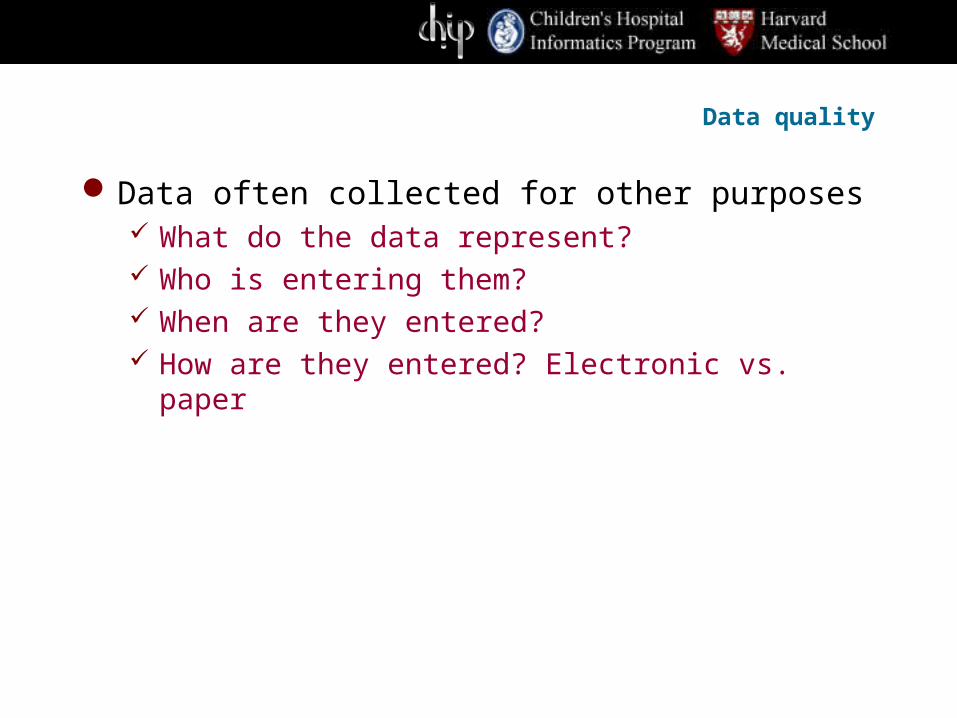
Data quality
Data often collected for other purposes What do the data represent? Who is entering them? When are they entered? How are they entered? Electronic vs. paper
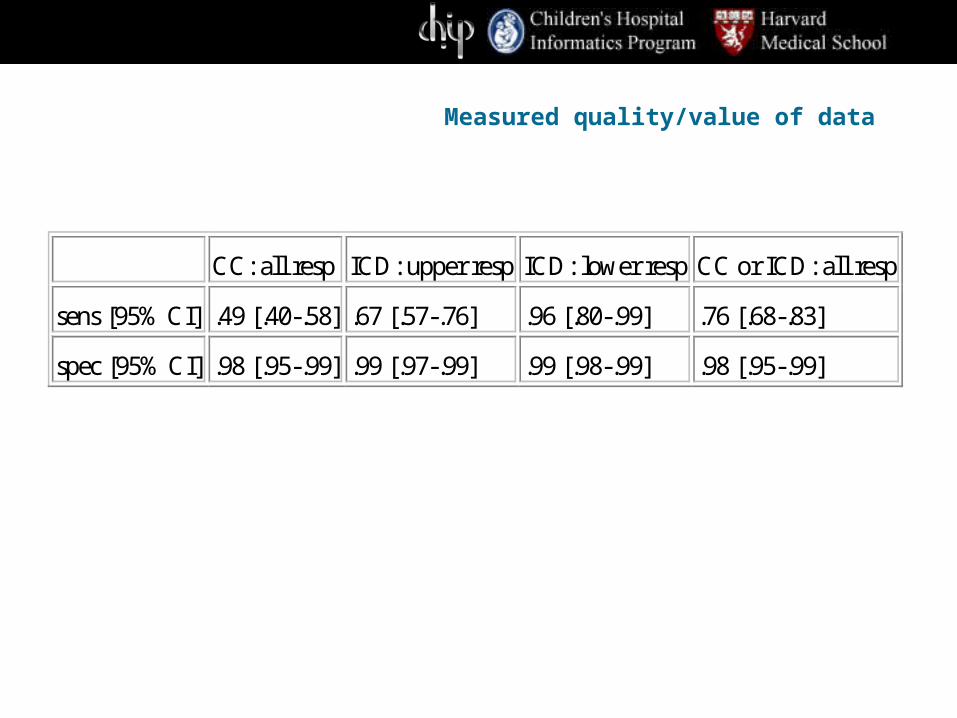
Measured quality/value of data
CC: all resp ICD: upper resp ICD: lower resp CC or ICD: all resp
sens [95% CI] .49 [.40-.58] .67 [.57-.76] .96 [.80-.99] .76 [.68-.83]
spec [95% CI] .98 [.95-.99] .99 [.97-.99] .99 [.98-.99] .98 [.95-.99]
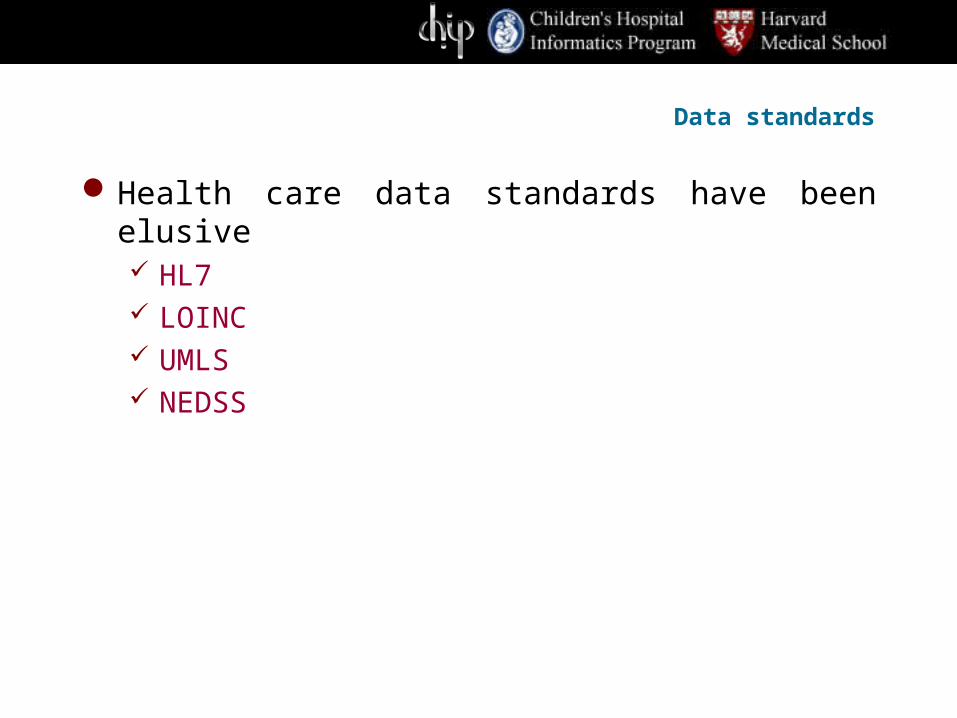
Data standards
Health care data standards have been elusive HL7 LOINC UMLS NEDSS
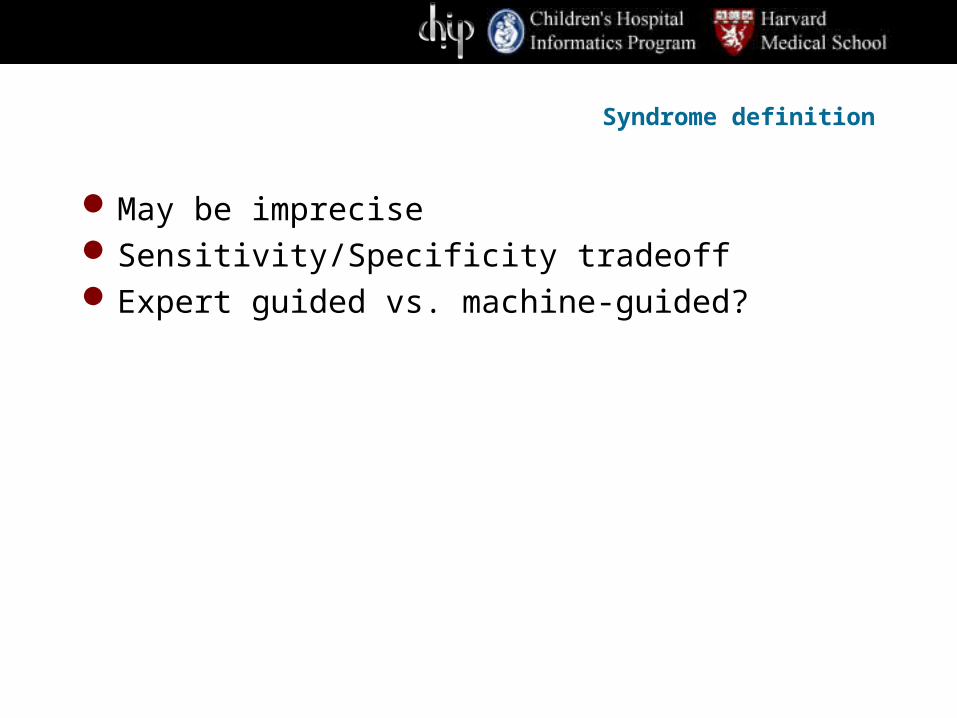
Syndrome definition
May be impreciseSensitivity/Specificity tradeoffExpert guided vs. machine-guided?
Modeling the Data
Establishing baselineDeveloping forecasting methodsDetecting temporal signalDetecting spatial signal
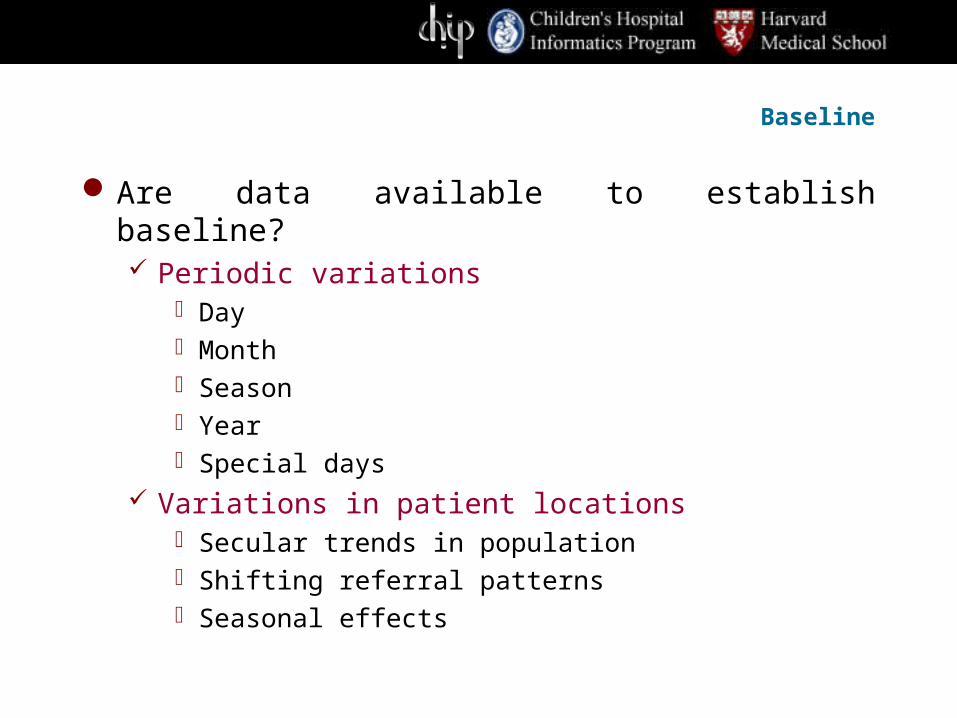
Baseline
Are data available to establish baseline? Periodic variations
Day Month Season Year Special days
Variations in patient locations Secular trends in population Shifting referral patterns Seasonal effects
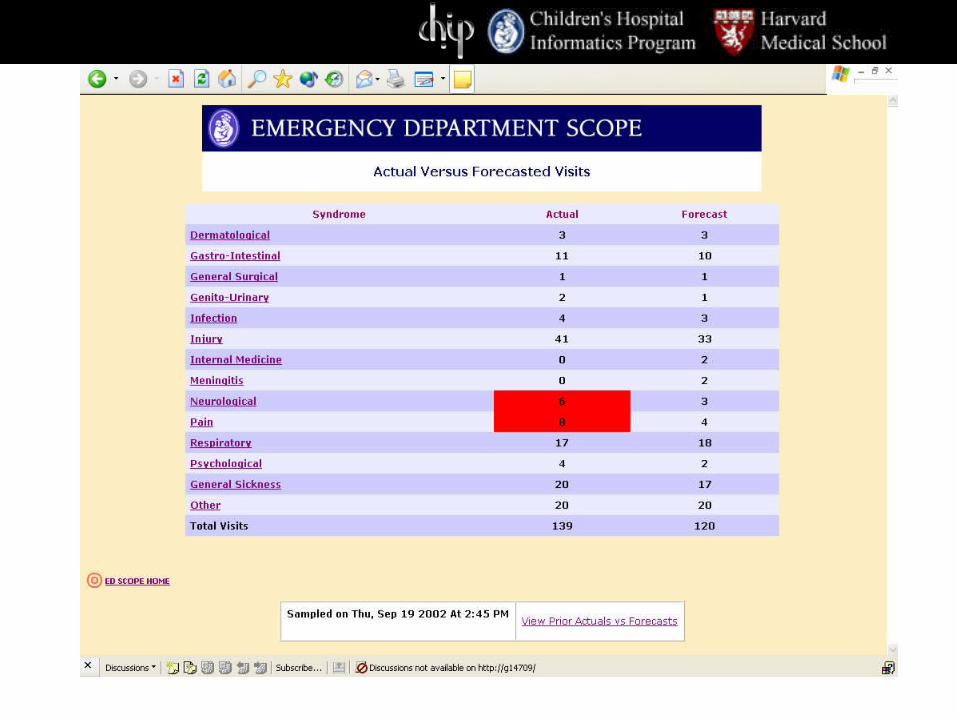
Boston data
Syndromic surveillance Influenza like illnessTime and space
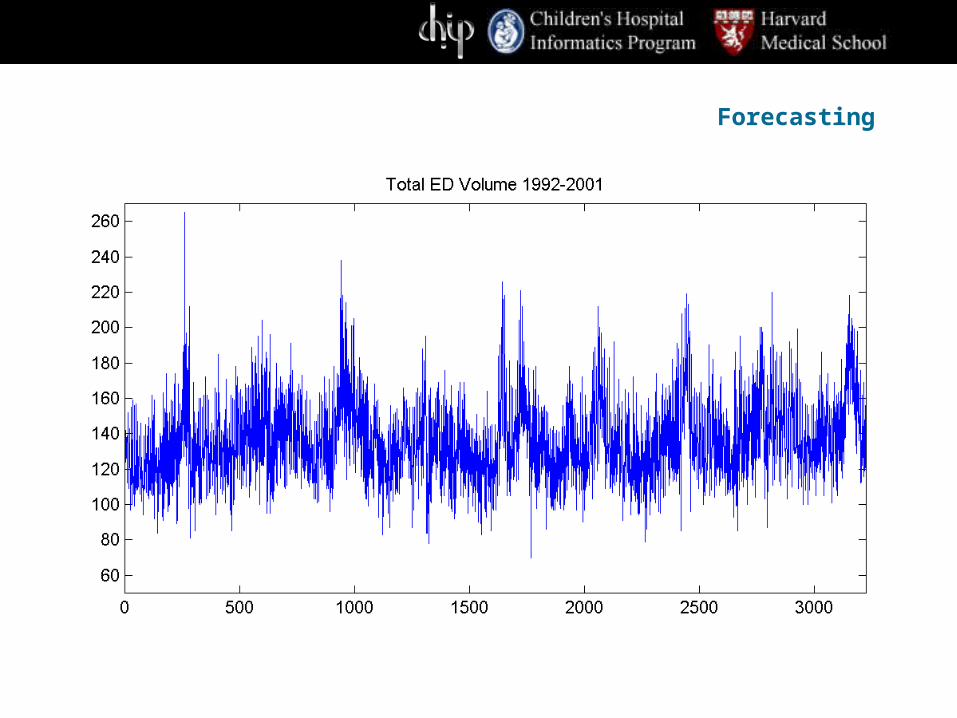
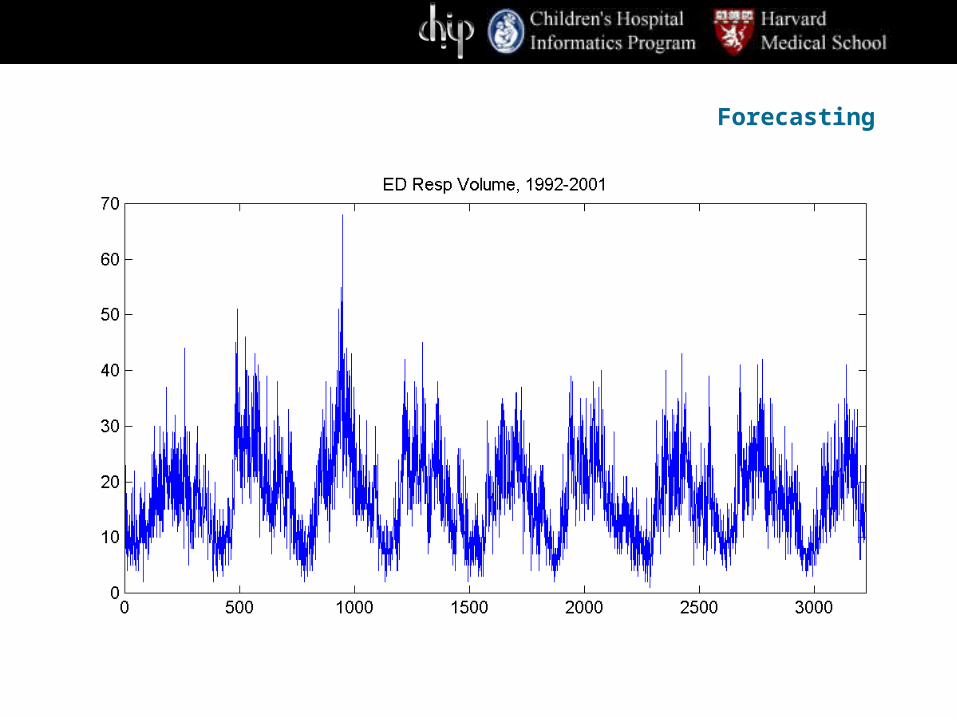
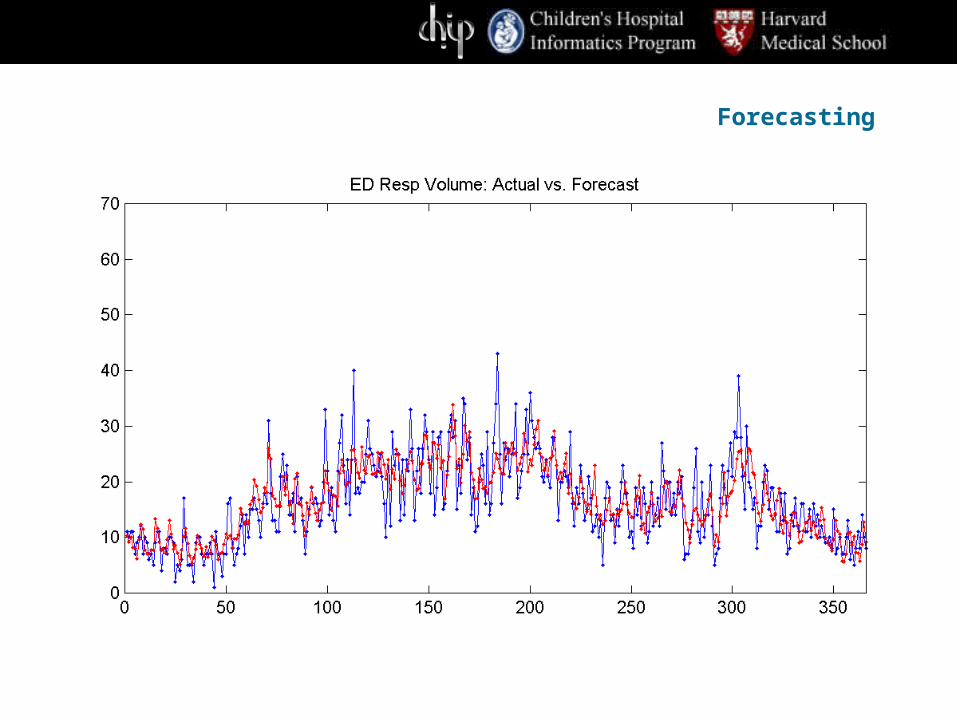
Forecasting
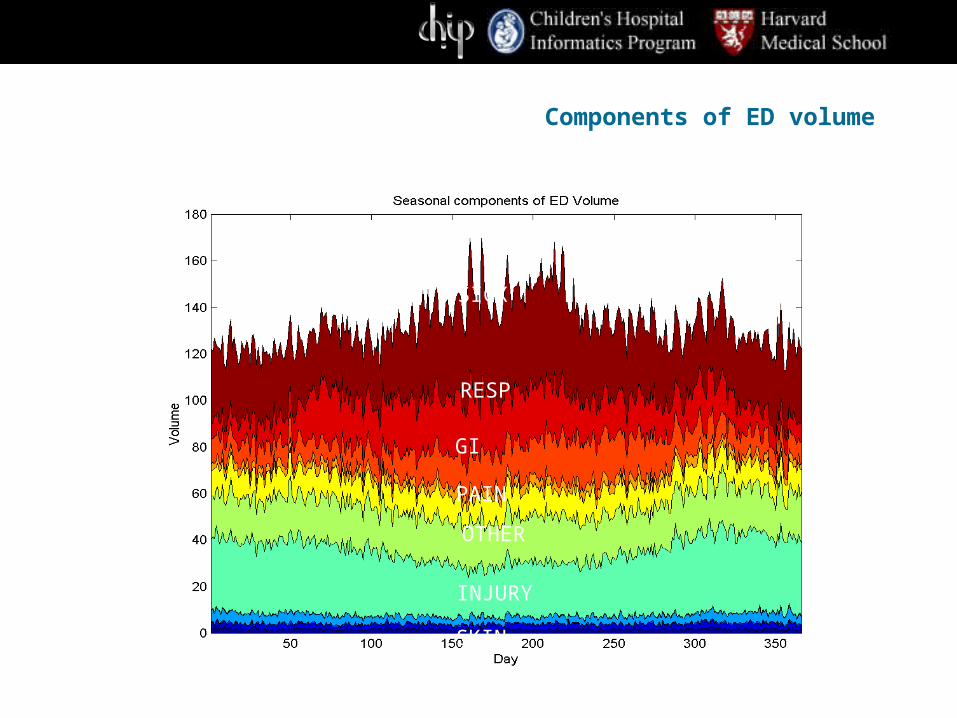
RESP
SICK
GI
PAIN
OTHER
INJURY
SKIN
Components of ED volume
Forecasting
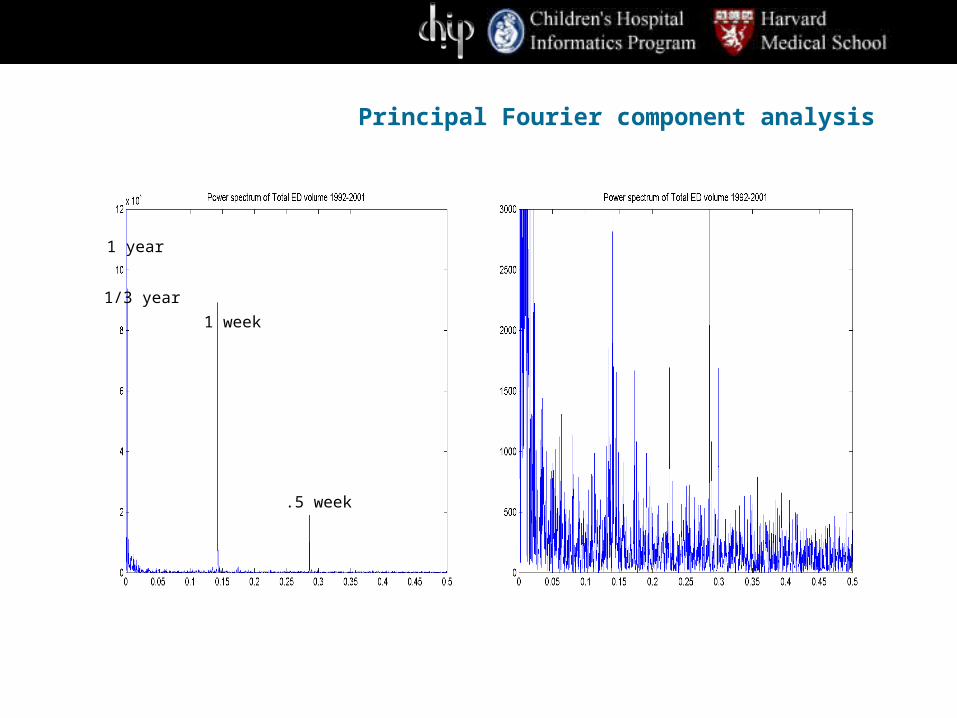
Principal Fourier component analysis
1 week
.5 week
1 year
1/3 year
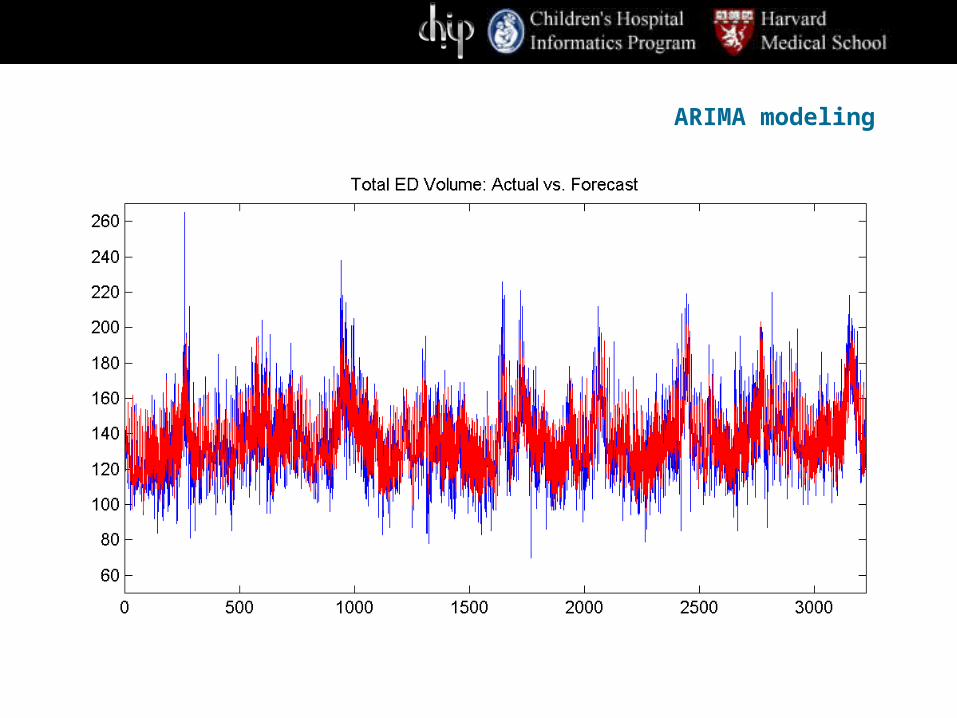
ARIMA modeling
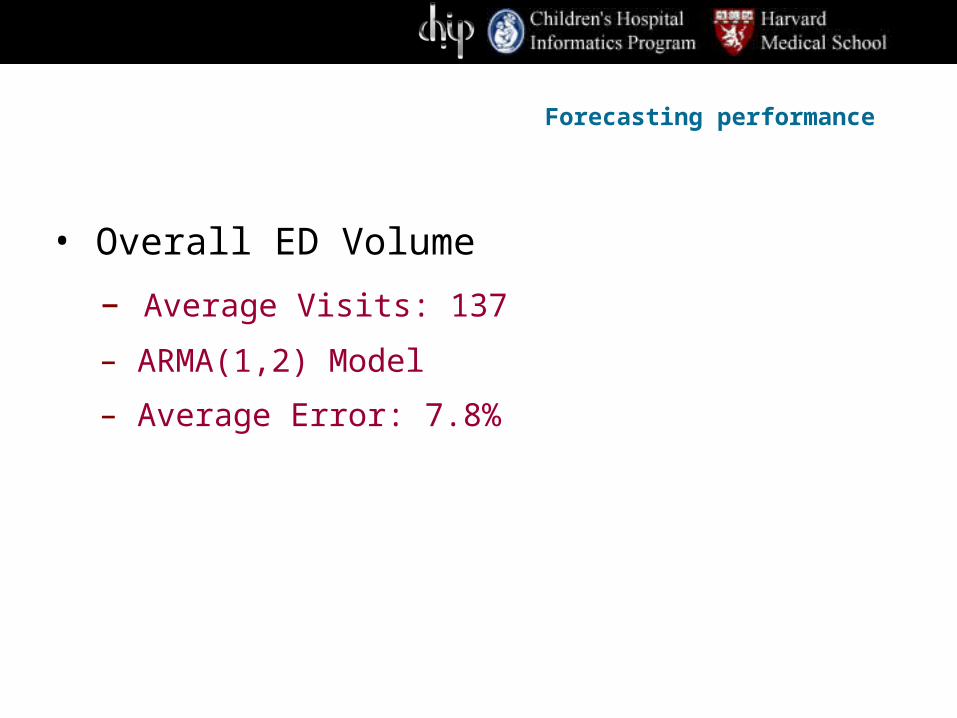
Forecasting performance
• Overall ED Volume
– Average Visits: 137
– ARMA(1,2) Model
– Average Error: 7.8%
Forecasting
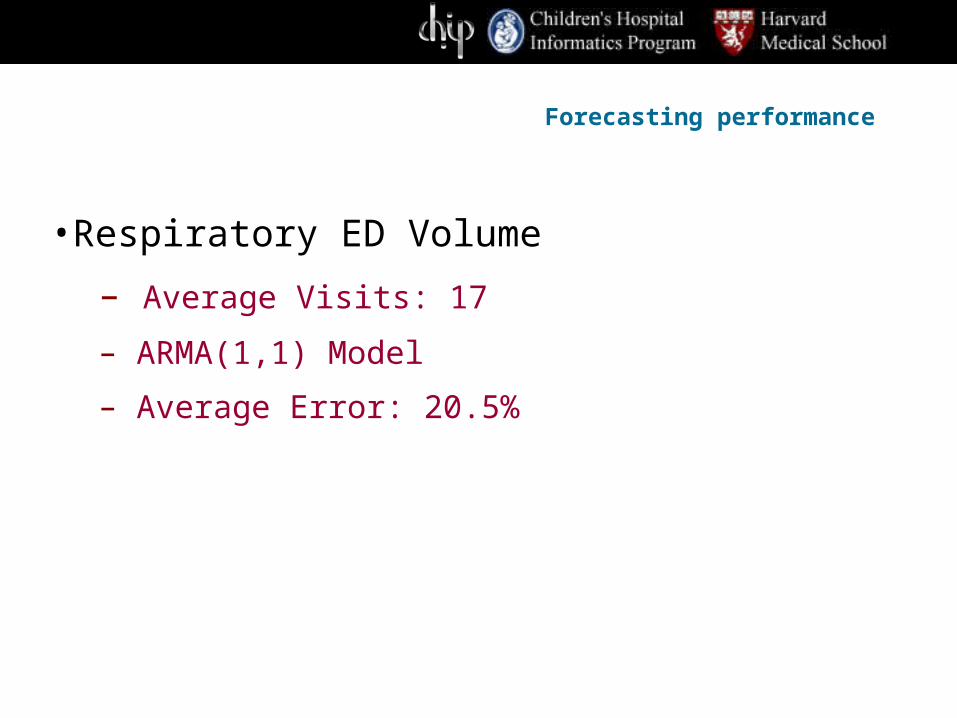
Forecasting performance
•Respiratory ED Volume
– Average Visits: 17
– ARMA(1,1) Model
– Average Error: 20.5%
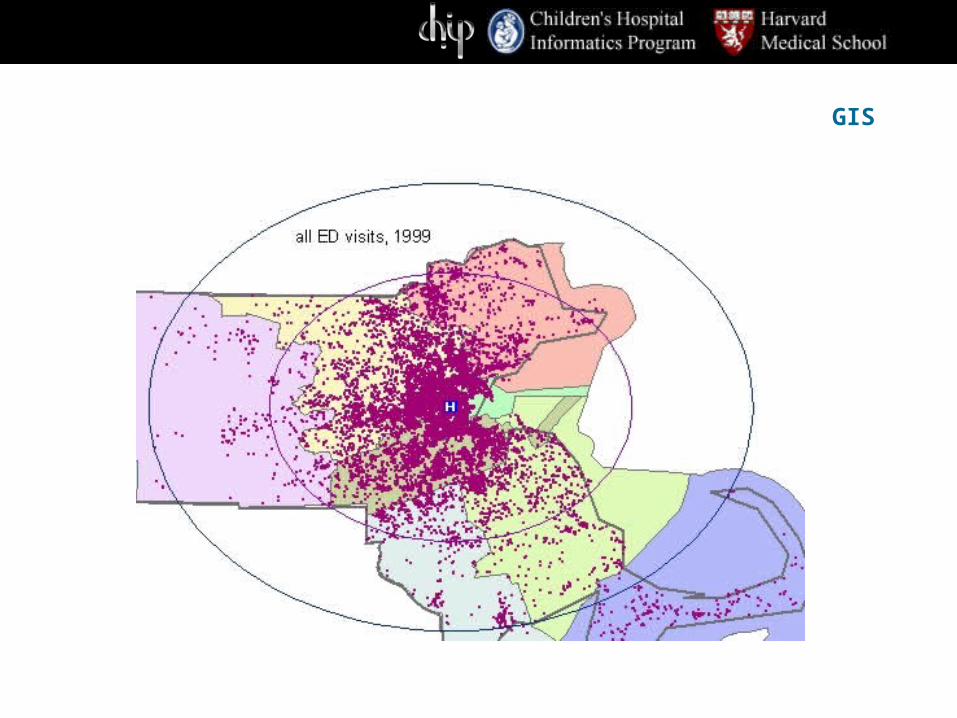
GIS
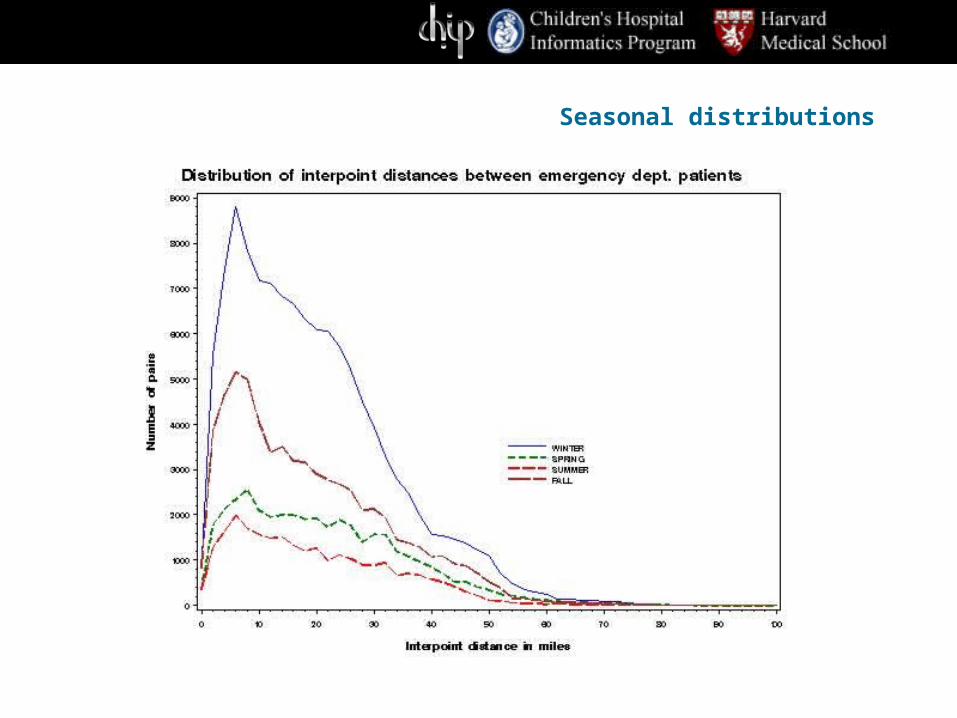
Seasonal distributions
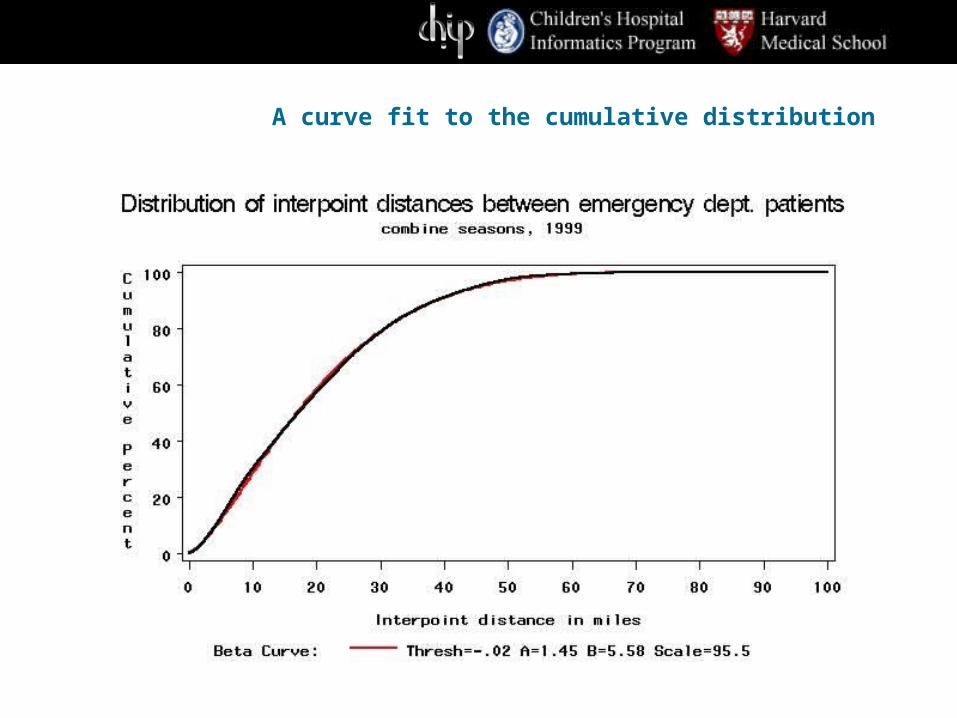
A curve fit to the cumulative distribution
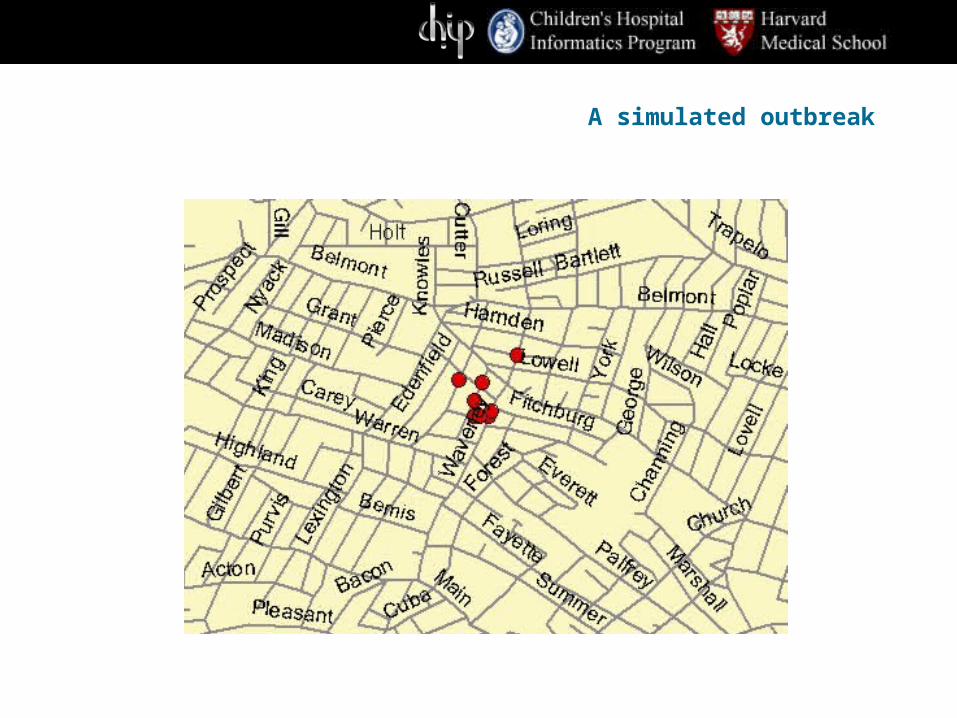
A simulated outbreak
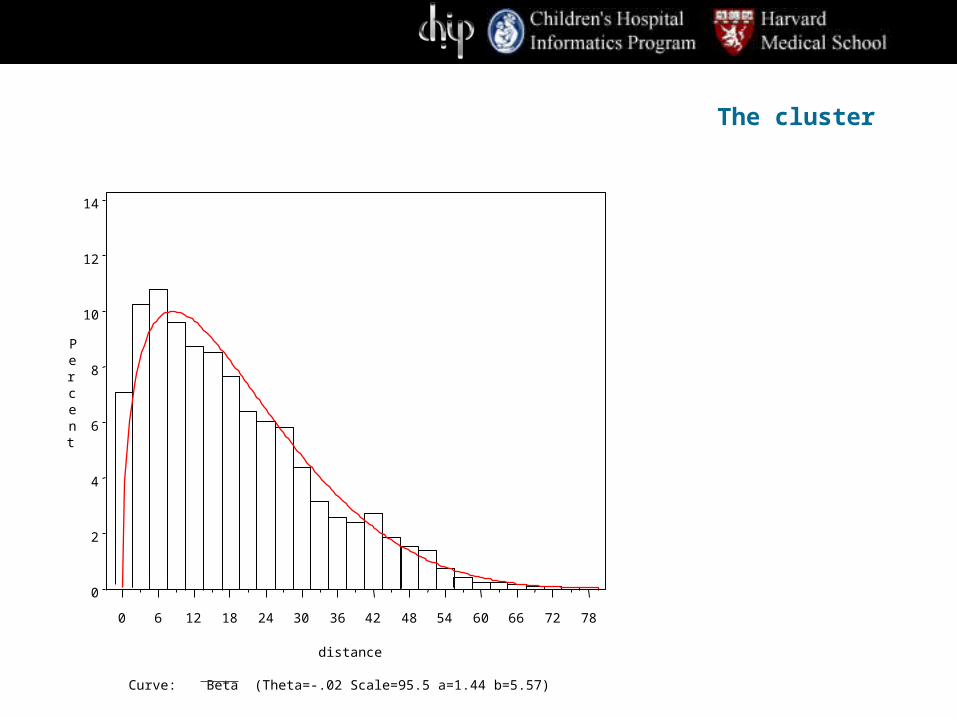
The cluster
Curve: Beta (Theta=-.02 Scale=95.5 a=1.44 b=5.57)
Percent
0
2
4
6
8
10
12
14
distance
0 6 12 18 24 30 36 42 48 54 60 66 72 78
Major issues
Will this work at all???Can we get better data?How do we tune for a particular attack?What to do without training data?What do we do with all the information?How do we set alarm thresholds?How do we protect patient privacy?

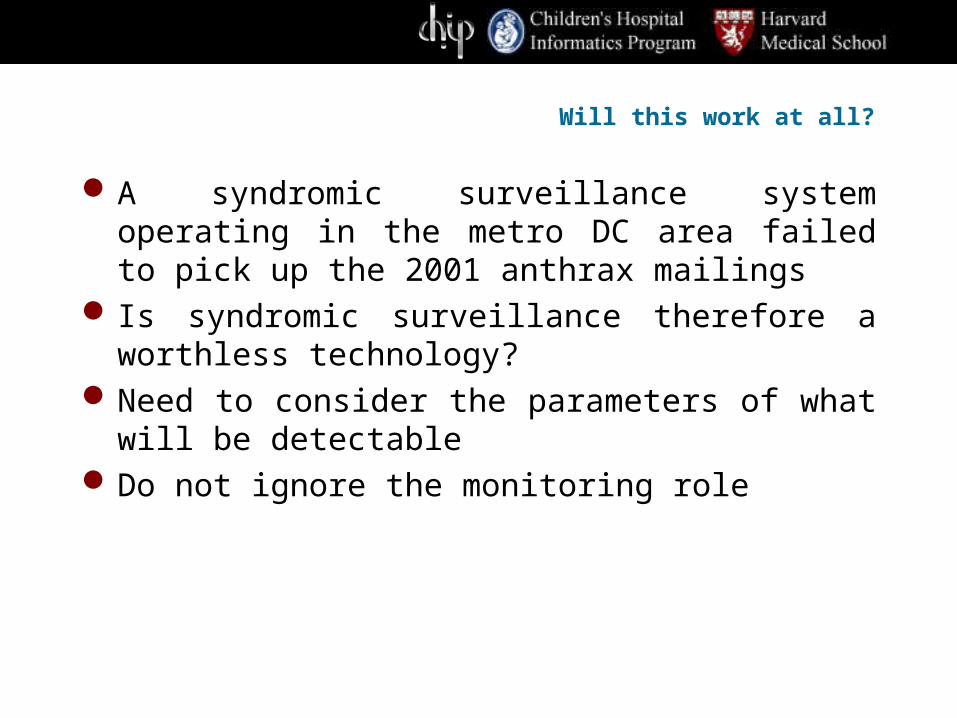
Will this work at all?
A syndromic surveillance system operating in the metro DC area failed to pick up the 2001 anthrax mailings
Is syndromic surveillance therefore a worthless technology?
Need to consider the parameters of what will be detectable
Do not ignore the monitoring role
Getting better data
Approaches to standardizing data collection DEEDS Frontlines of Medicine project National Disease Epidemiologic Surveillance
System, NEDSS
Tuning for a particular attack
Attacks may have different “shapes” in the dataDifferent methods may be more well suited to
detect each particular shape If we use multiple methods at once, how do we
deal with multiple testing?
Will this work at all?
A syndromic surveillance system operating in the metro DC area failed to pick up the 2001 anthrax mailings
Is syndromic surveillance therefore a worthless technology?
Need to consider the parameters of what will be detectable
Do not ignore the monitoring role

Getting better data
Approaches to standardizing data collection DEEDS Frontlines of Medicine project National Disease Epidemiologic Surveillance
System, NEDSS
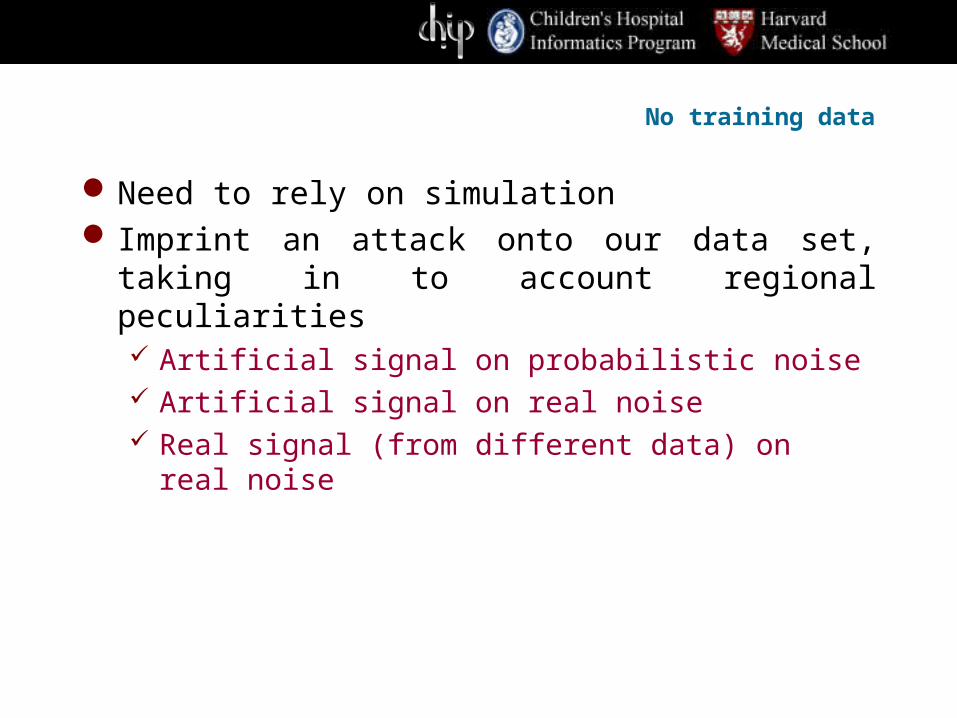
No training data
Need to rely on simulation Imprint an attack onto our data set, taking in
to account regional peculiarities Artificial signal on probabilistic noise Artificial signal on real noise Real signal (from different data) on real noise
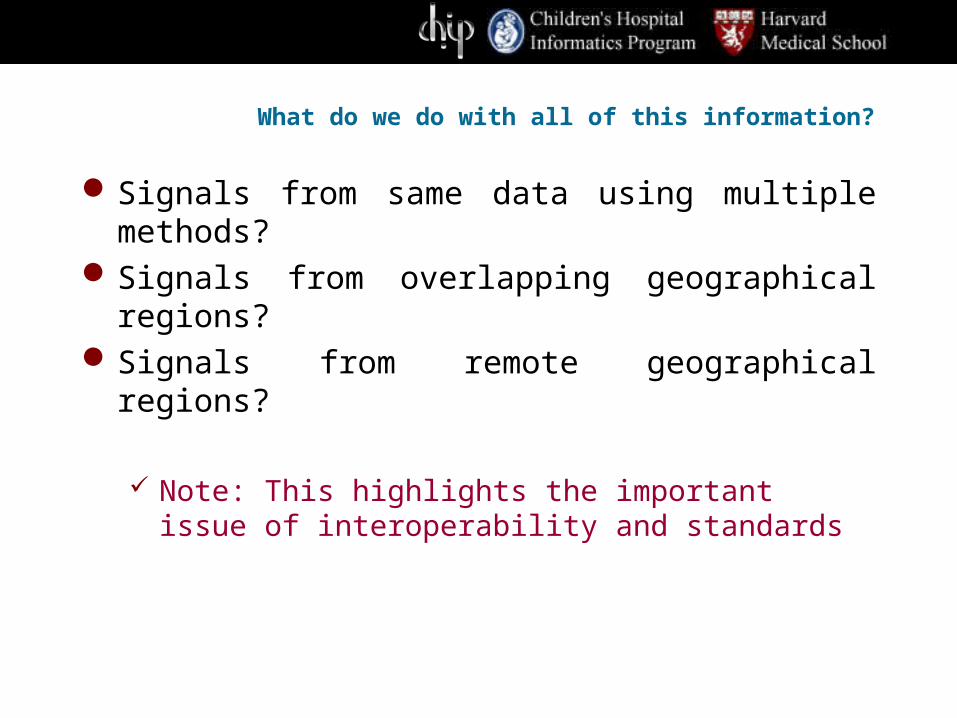
What do we do with all of this information?
Signals from same data using multiple methods?
Signals from overlapping geographical regions?
Signals from remote geographical regions?
Note: This highlights the important issue of interoperability and standards
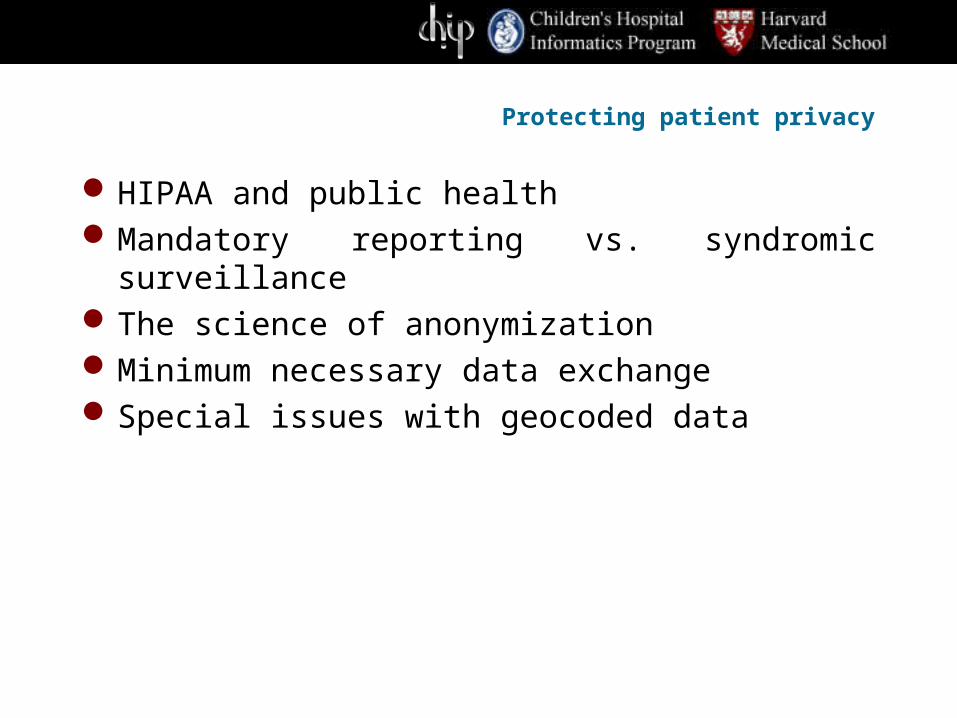
Protecting patient privacy
HIPAA and public healthMandatory reporting vs. syndromic
surveillanceThe science of anonymizationMinimum necessary data exchangeSpecial issues with geocoded data