Embed Size (px)
Citation preview
Biosurveillance: Detecting, Tracking, and Mitigating the
Effects of Natural Disease and Bioterrorism
Ronald D. Fricker, Jr.
Naval Postgraduate School
June 5, 2010
Abstract
Biosurveillance is the regular collection, analysis, and interpretation of health and health-related data for indicators of diseases and other outbreaks by public health organizations.Motivated by the threat of bioterrorism, biosurveillance systems are being developed andimplemented around the world. The goal of these systems has been expanded to includeboth early event detection and situational awareness, so that the focus is not simply ondetection, but also on response and consequence management. Whether they are usefulfor detecting bioterrorism or not, there seems to be consensus that these biosurveillancesystems are likely to be useful for detecting and responding to natural disease outbreakssuch as seasonal and pandemic flu, and thus they have the potential to significantly advanceand modernize the practice of public health surveillance.
Keywords: biosurveillance, bioterrorism, public health, early event detection, situationalawareness
1 Introduction
Bioterrorism is not a new threat in the 21st century – at least a thousand years ago the plague
and other contagious diseases were used in warfare (Gottfried, 1985; Deaux, 1969) – but today
the potential for catastrophic outcomes is greater than it has ever been. To address this threat,
the medical and public health communities are putting various measures in place, including bio-
surveillance systems designed to pro-actively monitor populations for possible disease outbreaks.
The goal is to improve the likelihood that a disease outbreak, whether man-made or natural,
is detected as early as possible so that the medical and public health communities can respond
as quickly as possible. An ideal biosurveillance system analyzes population health-related data
in near-real time to identify subtle trends not visible to individual physicians and clinicians.
As they sift through data, many of these systems use one or more statistical algorithms to
look for anomalies to trigger detection, investigation, quantification, localization, and outbreak
management.
1
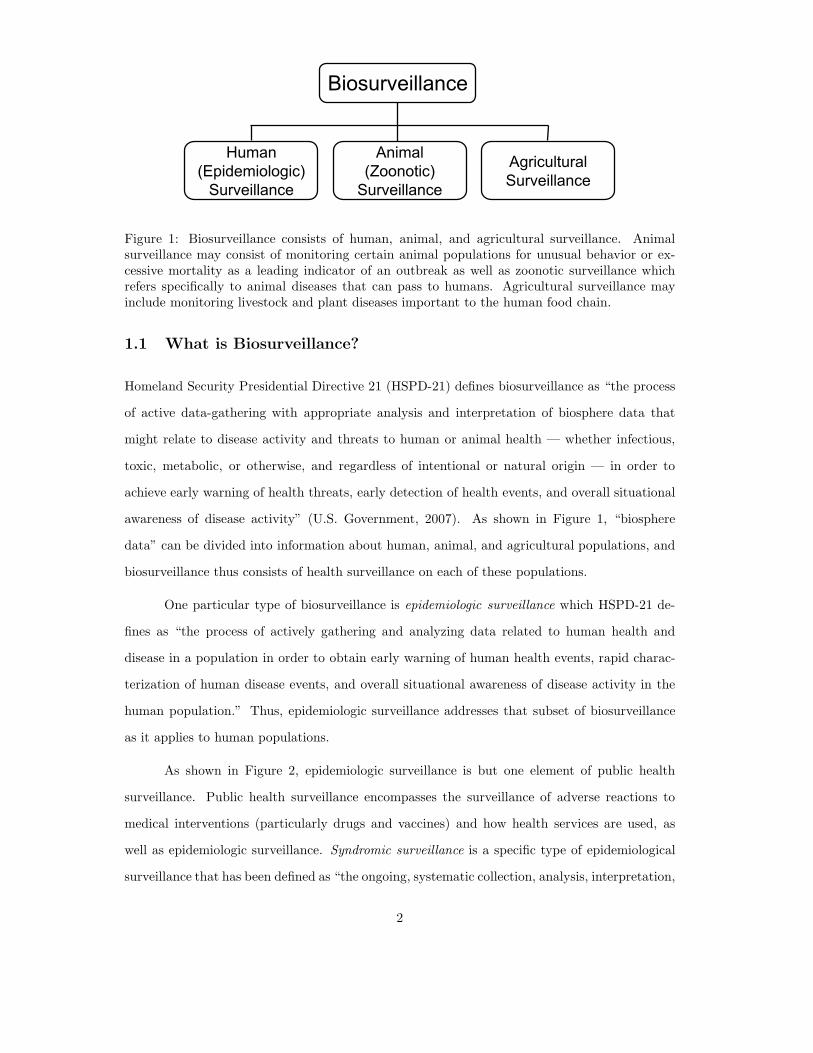
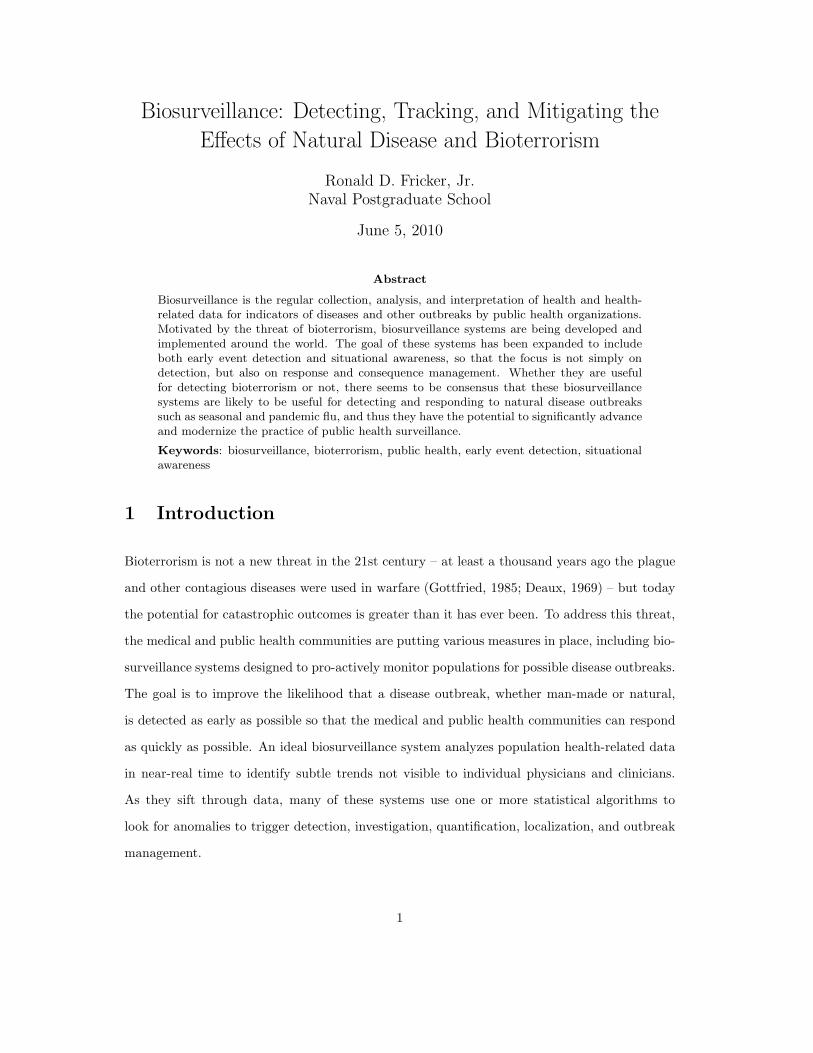
Figure 1: Biosurveillance consists of human, animal, and agricultural surveillance. Animalsurveillance may consist of monitoring certain animal populations for unusual behavior or ex-cessive mortality as a leading indicator of an outbreak as well as zoonotic surveillance whichrefers specifically to animal diseases that can pass to humans. Agricultural surveillance mayinclude monitoring livestock and plant diseases important to the human food chain.
1.1 What is Biosurveillance?
Homeland Security Presidential Directive 21 (HSPD-21) defines biosurveillance as “the process
of active data-gathering with appropriate analysis and interpretation of biosphere data that
might relate to disease activity and threats to human or animal health — whether infectious,
toxic, metabolic, or otherwise, and regardless of intentional or natural origin — in order to
achieve early warning of health threats, early detection of health events, and overall situational
awareness of disease activity” (U.S. Government, 2007). As shown in Figure 1, “biosphere
data” can be divided into information about human, animal, and agricultural populations, and
biosurveillance thus consists of health surveillance on each of these populations.
One particular type of biosurveillance is epidemiologic surveillance which HSPD-21 de-
fines as “the process of actively gathering and analyzing data related to human health and
disease in a population in order to obtain early warning of human health events, rapid charac-
terization of human disease events, and overall situational awareness of disease activity in the
human population.” Thus, epidemiologic surveillance addresses that subset of biosurveillance
as it applies to human populations.
As shown in Figure 2, epidemiologic surveillance is but one element of public health
surveillance. Public health surveillance encompasses the surveillance of adverse reactions to
medical interventions (particularly drugs and vaccines) and how health services are used, as
well as epidemiologic surveillance. Syndromic surveillance is a specific type of epidemiological
surveillance that has been defined as “the ongoing, systematic collection, analysis, interpretation,
2
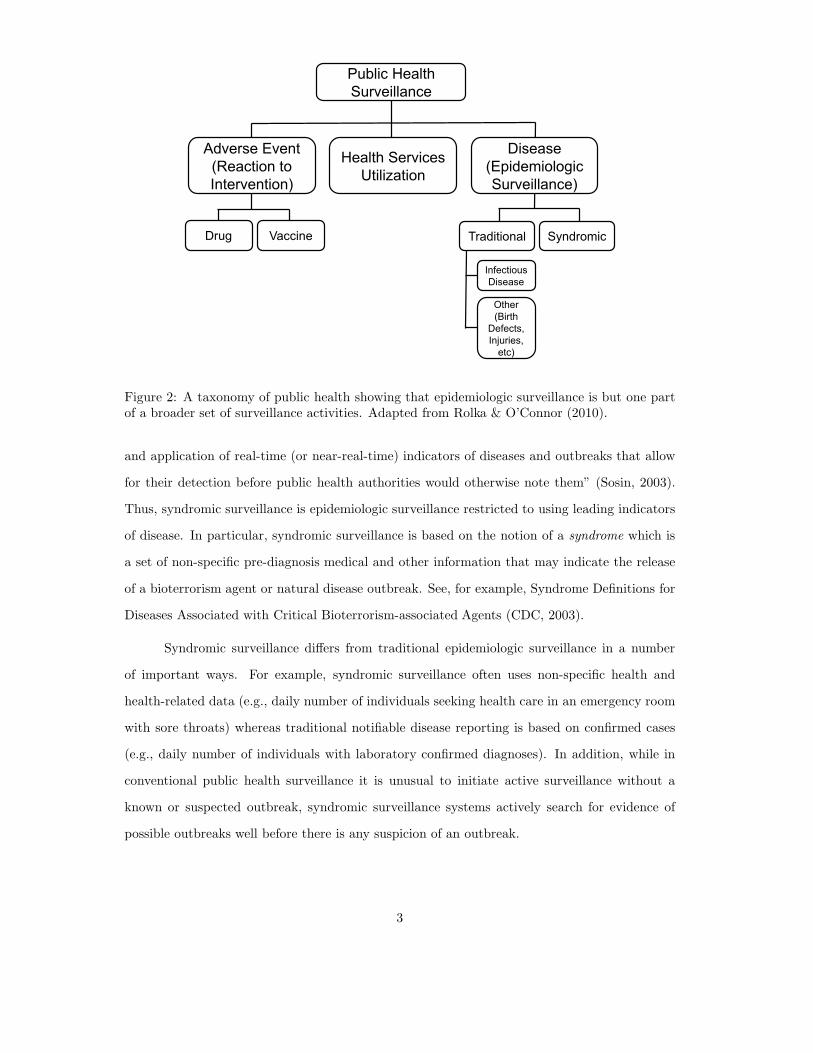
Figure 2: A taxonomy of public health showing that epidemiologic surveillance is but one partof a broader set of surveillance activities. Adapted from Rolka & O’Connor (2010).
and application of real-time (or near-real-time) indicators of diseases and outbreaks that allow
for their detection before public health authorities would otherwise note them” (Sosin, 2003).
Thus, syndromic surveillance is epidemiologic surveillance restricted to using leading indicators
of disease. In particular, syndromic surveillance is based on the notion of a syndrome which is
a set of non-specific pre-diagnosis medical and other information that may indicate the release
of a bioterrorism agent or natural disease outbreak. See, for example, Syndrome Definitions for
Diseases Associated with Critical Bioterrorism-associated Agents (CDC, 2003).
Syndromic surveillance differs from traditional epidemiologic surveillance in a number
of important ways. For example, syndromic surveillance often uses non-specific health and
health-related data (e.g., daily number of individuals seeking health care in an emergency room
with sore throats) whereas traditional notifiable disease reporting is based on confirmed cases
(e.g., daily number of individuals with laboratory confirmed diagnoses). In addition, while in
conventional public health surveillance it is unusual to initiate active surveillance without a
known or suspected outbreak, syndromic surveillance systems actively search for evidence of
possible outbreaks well before there is any suspicion of an outbreak.
3
1.2 Biosurveillance Objectives
Syndromic surveillance has also been defined as “...surveillance using health-related data that
precede diagnosis and signal a sufficient probability of a case or an outbreak to warrant further
public health response” (Fricker & Rolka, 2006; CDC, 2006a). This definition focuses on a
number of ideas important to biosurveillance.
∙ First, biosurveillance is health surveillance, not military, regulatory or intelligence surveil-
lance. It may use a wide variety of types of data, from case diagnoses to health-related
data such as counts derived from chief complaints.
∙ Second, the data and associated surveillance are generally intended to precede diagnosis
or case confirmation in order to give early warning of a possible outbreak. Clearly once
a definitive diagnosis of a bio-agent has been made the need for detection becomes moot,
though tracking the location and spread of a potential outbreak is still important whether
an outbreak has been confirmed or not.
∙ Third, the process must provide a signal of “sufficient probability” to trigger “further
public health response.” Often the goal is not to provide a definitive determination that
an outbreak is occurring but rather to signal that an outbreak may be occurring. Such a
signal indicates further information is warranted through more detailed investigation by
public health officials.
The motivation for biosurveillance, and syndromic surveillance systems in particular, is
that some bio-agents have symptoms in their prodromal stages similar to naturally-occurring
diseases. For example, in the first week or two after exposure to smallpox individuals tend to
have symptoms similar to the flu such as fever, malaise, aches, nausea and vomiting (Zubay,
2005).
Biosurveillance systems have two main objectives: to support public health situational
awareness (SA) and to enhance outbreak early event detection (EED). The CDC (2008) defines
them as:
∙ Situational awareness is the ability to utilize detailed, real-time health data to confirm,
refute and to provide an effective response to the existence of an outbreak. It also is used
to monitor an outbreaks magnitude, geography, rate of change and life cycle.
4
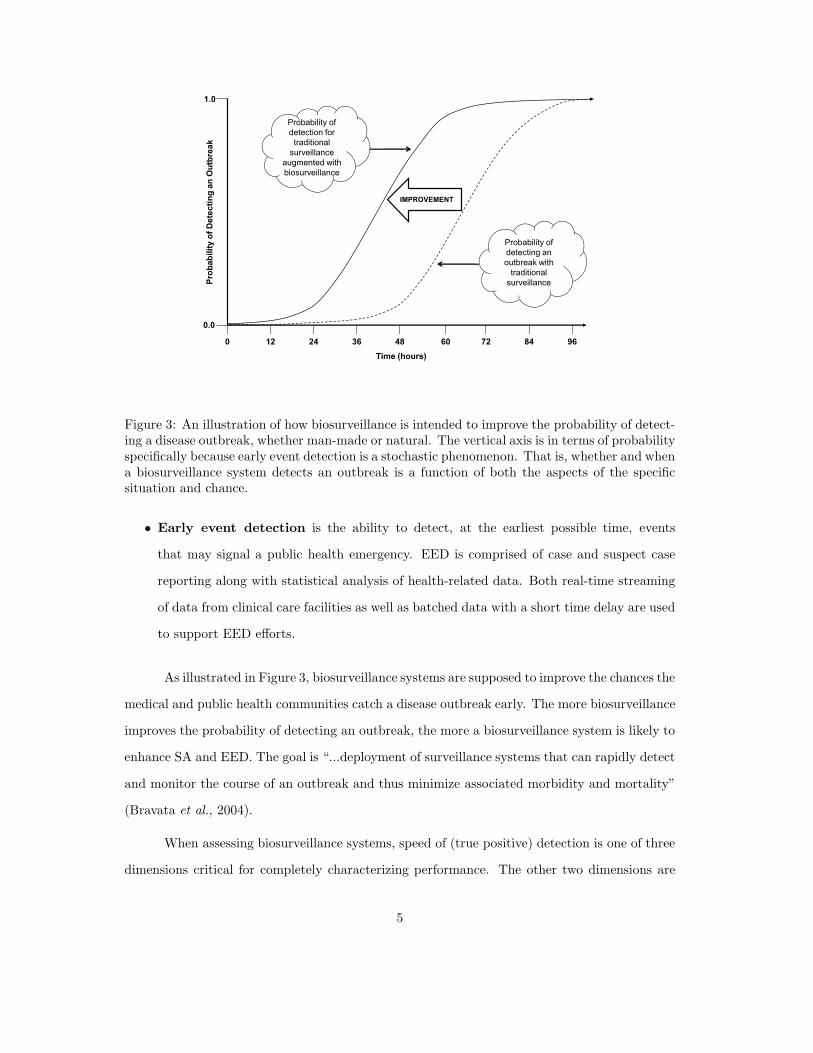
Figure 3: An illustration of how biosurveillance is intended to improve the probability of detect-ing a disease outbreak, whether man-made or natural. The vertical axis is in terms of probabilityspecifically because early event detection is a stochastic phenomenon. That is, whether and whena biosurveillance system detects an outbreak is a function of both the aspects of the specificsituation and chance.
∙ Early event detection is the ability to detect, at the earliest possible time, events
that may signal a public health emergency. EED is comprised of case and suspect case
reporting along with statistical analysis of health-related data. Both real-time streaming
of data from clinical care facilities as well as batched data with a short time delay are used
to support EED efforts.
As illustrated in Figure 3, biosurveillance systems are supposed to improve the chances the
medical and public health communities catch a disease outbreak early. The more biosurveillance
improves the probability of detecting an outbreak, the more a biosurveillance system is likely to
enhance SA and EED. The goal is “...deployment of surveillance systems that can rapidly detect
and monitor the course of an outbreak and thus minimize associated morbidity and mortality”
(Bravata et al., 2004).
When assessing biosurveillance systems, speed of (true positive) detection is one of three
dimensions critical for completely characterizing performance. The other two dimensions are
5
the rate of false positives and the probability of successfully detecting an outbreak. In the
biosurveillance literature, these dimensions are often generically referred to timeliness, specificity,
and sensitivity.
All three dimensions are necessary and they trade off. For example, for a given EED
methodology, improving the speed of detecting an outbreak generally comes at the cost of
increasing the rate of false positives. Similarly, increasing the probability of detection usually
comes at the expense of the speed of detection. These trade offs are similar to the Type I and
Type II error trade offs inherent in classical hypothesis testing, though the sequential decision
making aspect of biosurveillance adds an additional level of complexity.
See Fricker (2010b), particularly the rejoinder, for a more detailed discussion about eval-
uating biosurveillance system performance and about the appropriate metrics for quantifying
biosurveillance system performance.
2 Biosurveillance Systems
As HSPD-21 states, “A central element of biosurveillance must be an epidemiologic surveillance
system to monitor human disease activity across populations. That system must be sufficiently
enabled to identify specific disease incidence and prevalence in heterogeneous populations and
environments and must possess sufficient flexibility to tailor analyses to new syndromes and
emerging diseases.”
The use of biosurveillance, particularly in the form of syndromic surveillance, is widespread.
In 2003 it was estimated that approximately 100 state and local health jurisdictions were con-
ducting some form of syndromic surveillance (Sosin, 2003). In 2004, Bravata et al. (2004) con-
ducted a systematic review of the publicly available literature and various web sites from which
they identified 115 surveillance systems, of which they found 29 that were designed specifically
for detecting bioterrorism. In 2007-2008, Buehler et al. (2008) sent surveys to public health
officials in 59 state, territorial, and large local jurisdictions. Fifty-two officials responded (an
88 percent response rate) representing jurisdictions containing 94 percent of U.S. population.
They found that 83 percent reported conducting syndromic surveillance for a median of three
years and two-thirds said they are “highly” or “somewhat” likely to expand the use of syndromic
surveillance in the next two years.
6
Emergency
Room Chief
Complaints
Laboratory Test
Results
Data Collection
Emergency
Medical Services
(EMS)
Over-the-
Counter
Medicine Sales
Absenteeism
Records
Data
Repository
Clean
Data &
Impute as
Necessary
Parse Text
& Build
Syndrome
Indicators
Data Management Analysis Reporting
Other “Early
Detection” Data
• Temporal analyses
and signals
• Univariate
• Multivariate
• Spatio-temporal
analyses and signals
• Time series
plots
• Geo-spatial
plots and
information
overlays
• Visualization
and other
fusion tools
• Data “drill
down” capability
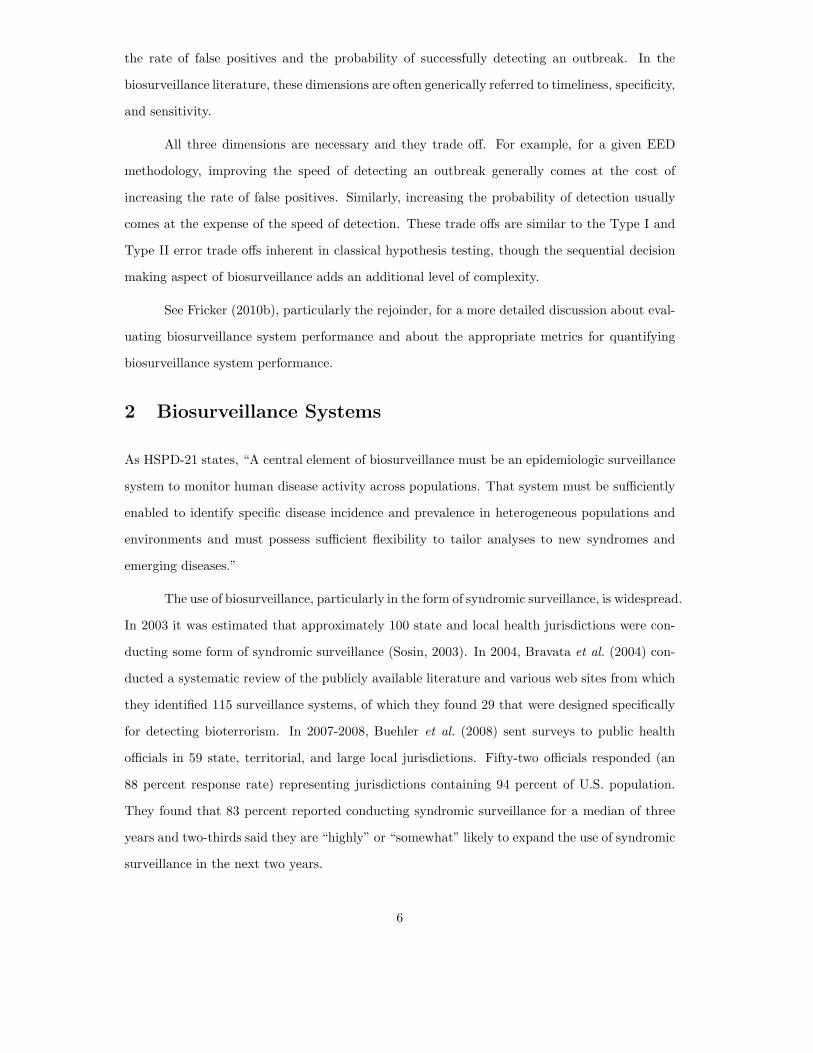
Figure 4: A biosurveillance system has four main functions: data collection, data management,analysis, and reporting. Raw data enters the system at the left and flows through the systemto become actionable information at the right.
2.1 Components
As depicted in Figure 4, a biosurveillance system has four main functions: data collection, data
management, analysis, and reporting. As illustrated in the figure, raw data enters the system
at the left and as it flows through the system becomes actionable information at the right.
Expanding on Rolka (2006), the ideal system contains the following components:
∙ The original data, to which access is gained only after appropriately addressing legal and
regulatory requirements, as well as personal privacy and proprietary issues.
∙ Computer hardware and information technology for (near) real-time assembly, recording,
transfer, and preprocessing of data.
∙ Subject matter experts, data management and data knowledge experts, as well as software
and techniques for processing incoming data into analytic databases, including processes
and procedures for managing and maintaining these databases.
∙ Statistical algorithms to analyze the data for possible outbreaks over space and time
7
that are of sufficient sensitivity to provide signals within an actionable time frame while
simultaneously limiting false positive signals to a tolerable level.
∙ Public health experts with sufficient statistical expertise that can appropriately choose
and apply the algorithms most relevant to their jurisdiction and appropriately interpret
the signals when they occur.
∙ Data display and query software, as well as the necessary underlying data, that facilitates
rapid and easy investigation and adjudication of signals by public health experts, including
the ability to “trace back” from signal to likely source.
∙ Other data displays, combined with decision support and communication tools, to support
situational awareness during an outbreak and to facilitate effective and efficient public
health response.
∙ Report production processes and access to supporting supplementary information.
Mandl et al. (2004), in Implementing Syndromic Surveillance: A Practical Guide Informed by
the Early Experience, provides a detailed discussion of what is required and guidance about how
to implement biosurveillance systems.
2.2 Examples
Below are brief descriptions of three biosurveillance systems chosen to illustrate large-scale
systems currently in operation. The first two are true systems, in the sense that they are
comprised of both dedicated computer hardware and software. The third is more properly
described as a set of software programs that can be freely downloaded and implemented by any
public health organization.
∙ BioSense. Developed and operated by the Centers for Disease Control and Prevention,
BioSense is intended to be a United States-wide biosurveillance system. Begun in 2003,
BioSense initially used Department of Defense and Department of Veterans Affairs out-
patient data along with medical laboratory test results from a nationwide commercial
laboratory. In 2006, BioSense began incorporating data from civilian hospitals as well.
The primary objective of BioSense is to “expedite event recognition and response coordi-
8
nation among federal, state, and local public health and healthcare organizations” (Tokars,
2006; CDC, 2006c).
∙ ESSENCE. An acronym for Electronic Surveillance System for the Early Notification
of Community-based Epidemics, ESSENCE was developed by the Department of Defense
in 1999. ESSENCE IV now monitors for infectious disease outbreaks at more than 300
military treatment facilities worldwide on a daily basis using data from patient visits to the
facilities and pharmacy data. For the Washington DC area, ESSENCE II monitors military
and civilian outpatient visit data as well as over-the-counter pharmacy sales and school
absenteeism (DoD, 2006; Lombardo et al., 2004; OSD, 2005). Components of ESSENCE
have been adapted and used by some public health departments.
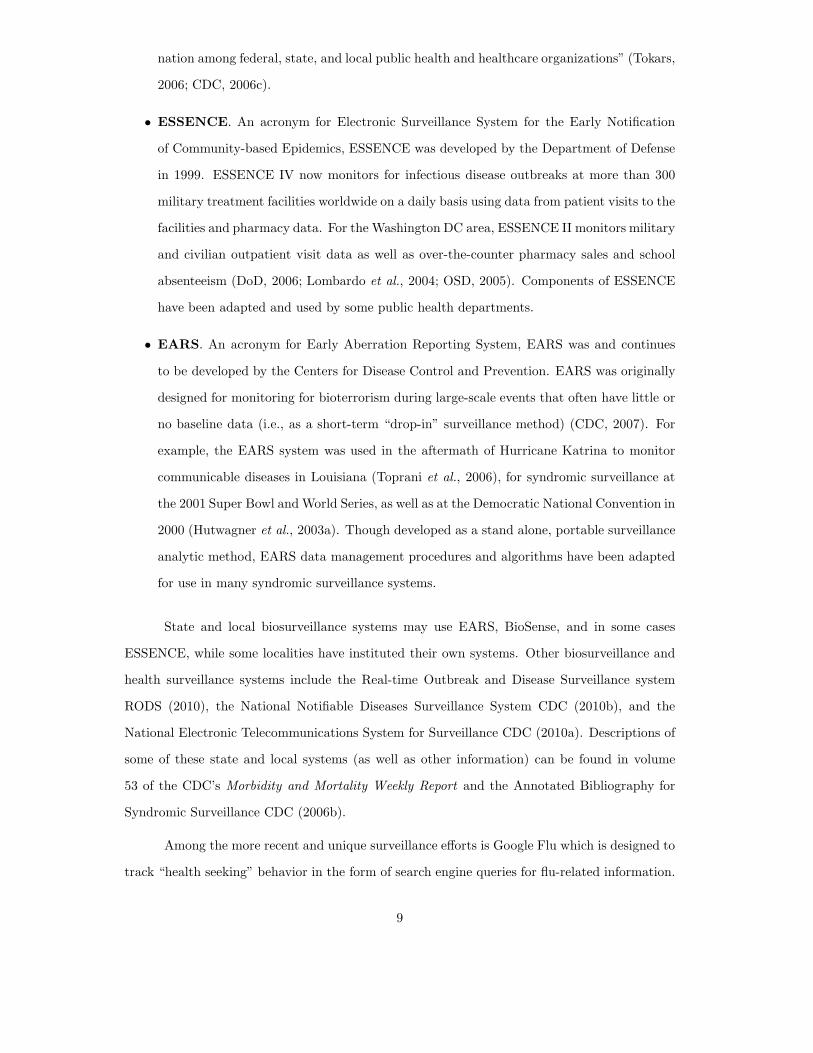
∙ EARS. An acronym for Early Aberration Reporting System, EARS was and continues
to be developed by the Centers for Disease Control and Prevention. EARS was originally
designed for monitoring for bioterrorism during large-scale events that often have little or
no baseline data (i.e., as a short-term “drop-in” surveillance method) (CDC, 2007). For
example, the EARS system was used in the aftermath of Hurricane Katrina to monitor
communicable diseases in Louisiana (Toprani et al., 2006), for syndromic surveillance at
the 2001 Super Bowl andWorld Series, as well as at the Democratic National Convention in
2000 (Hutwagner et al., 2003a). Though developed as a stand alone, portable surveillance
analytic method, EARS data management procedures and algorithms have been adapted
for use in many syndromic surveillance systems.
State and local biosurveillance systems may use EARS, BioSense, and in some cases
ESSENCE, while some localities have instituted their own systems. Other biosurveillance and
health surveillance systems include the Real-time Outbreak and Disease Surveillance system
RODS (2010), the National Notifiable Diseases Surveillance System CDC (2010b), and the
National Electronic Telecommunications System for Surveillance CDC (2010a). Descriptions of
some of these state and local systems (as well as other information) can be found in volume
53 of the CDC’s Morbidity and Mortality Weekly Report and the Annotated Bibliography for
Syndromic Surveillance CDC (2006b).
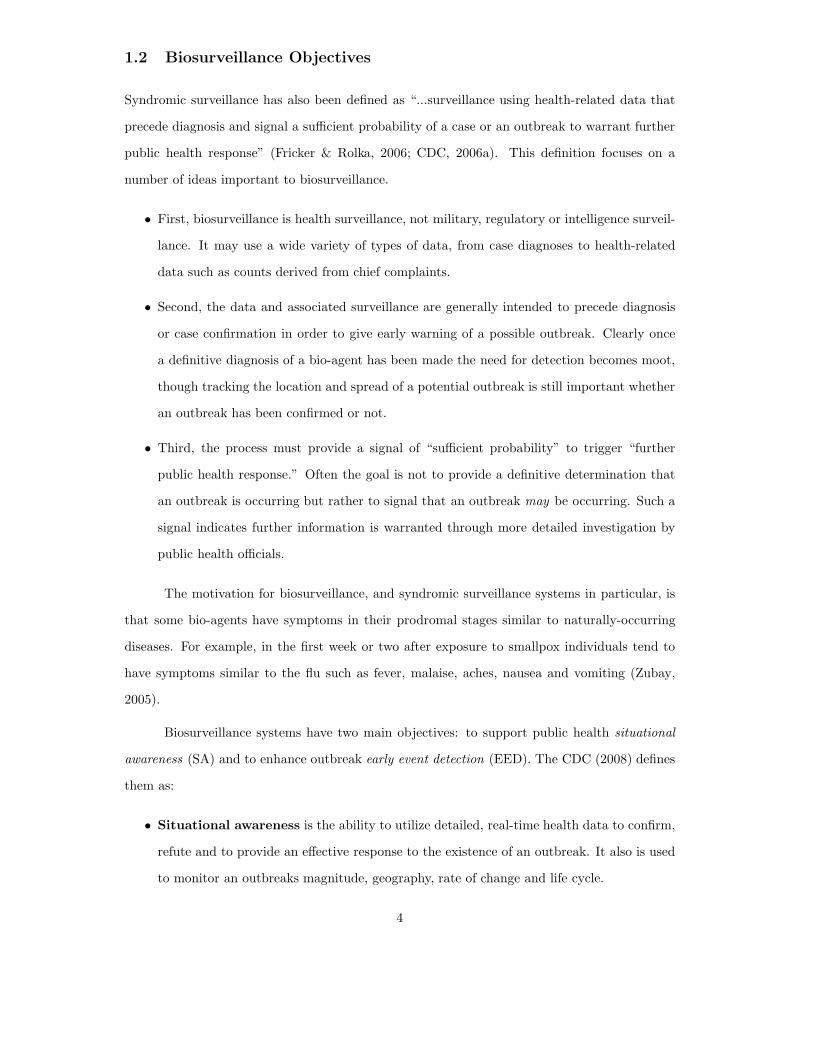
Among the more recent and unique surveillance efforts is Google Flu which is designed to
track “health seeking” behavior in the form of search engine queries for flu-related information.
9
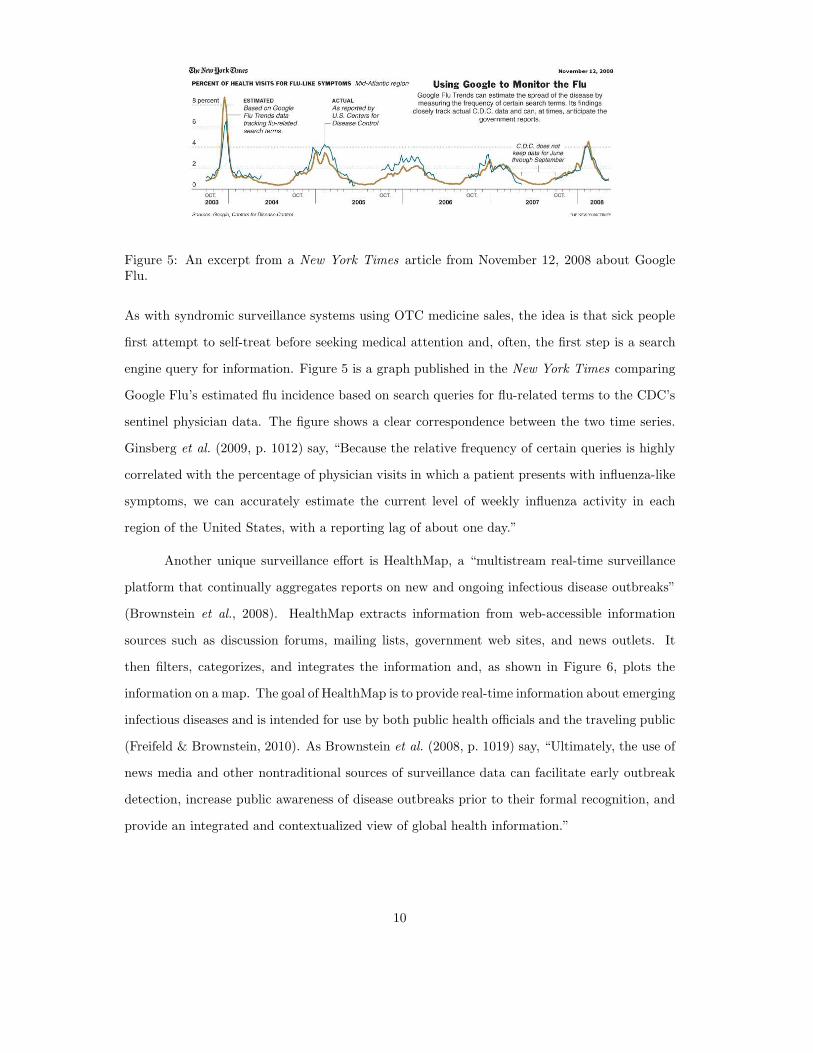
Figure 5: An excerpt from a New York Times article from November 12, 2008 about GoogleFlu.
As with syndromic surveillance systems using OTC medicine sales, the idea is that sick people
first attempt to self-treat before seeking medical attention and, often, the first step is a search
engine query for information. Figure 5 is a graph published in the New York Times comparing
Google Flu’s estimated flu incidence based on search queries for flu-related terms to the CDC’s
sentinel physician data. The figure shows a clear correspondence between the two time series.
Ginsberg et al. (2009, p. 1012) say, “Because the relative frequency of certain queries is highly
correlated with the percentage of physician visits in which a patient presents with influenza-like
symptoms, we can accurately estimate the current level of weekly influenza activity in each
region of the United States, with a reporting lag of about one day.”
Another unique surveillance effort is HealthMap, a “multistream real-time surveillance
platform that continually aggregates reports on new and ongoing infectious disease outbreaks”
(Brownstein et al., 2008). HealthMap extracts information from web-accessible information
sources such as discussion forums, mailing lists, government web sites, and news outlets. It
then filters, categorizes, and integrates the information and, as shown in Figure 6, plots the
information on a map. The goal of HealthMap is to provide real-time information about emerging
infectious diseases and is intended for use by both public health officials and the traveling public
(Freifeld & Brownstein, 2010). As Brownstein et al. (2008, p. 1019) say, “Ultimately, the use of
news media and other nontraditional sources of surveillance data can facilitate early outbreak
detection, increase public awareness of disease outbreaks prior to their formal recognition, and
provide an integrated and contextualized view of global health information.”
10
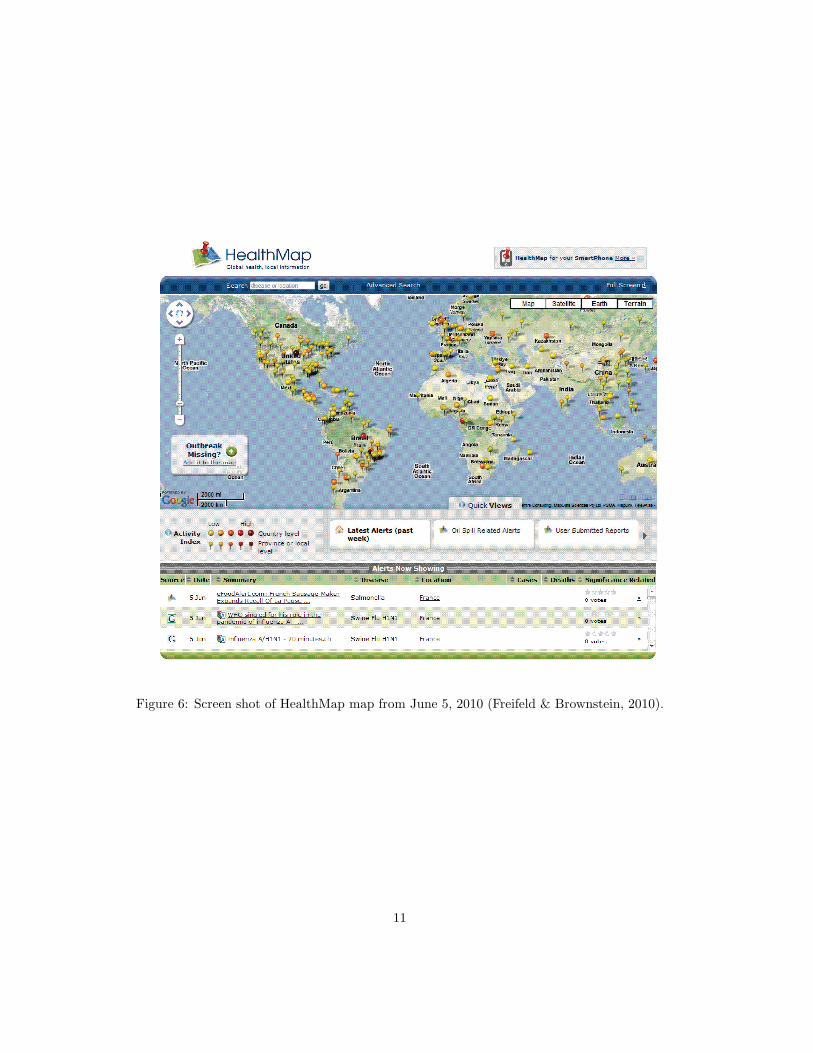
Figure 6: Screen shot of HealthMap map from June 5, 2010 (Freifeld & Brownstein, 2010).
11
3 Biosurveillance Utility & Effectiveness
In spite of the widespread and potentially expanding use of biosurveillance, questions remain
about its utility and effectiveness. Examples of papers that discuss various issues, challenges,
and important research needs associated with effective implementation and operation of bio-
surveillance systems include Fricker (2010b), Shmueli & Burkom (2009), Uscher-Pines et al.
(2009), Green (2008), Buehler et al. (2008), Fricker & Rolka (2006), Rolka (2006), Stoto et al.
(2004), Bravata et al. (2004), Reingold (2003), and Sosin (2003).
In case studies of health departments in eight U.S. states, Uscher-Pines et al. (2009) found
that fewer than half had written response protocols for responding to biosurveillance system
alerts and the health departments reported conducting in-depth investigations on fewer than
15 percent of biosurveillance system alerts. Further, Uscher-Pines et al. (2009) said, “Although
many health departments noted that the original purpose of syndromic surveillance was early
warning/detection, no health department reported using systems for this purpose. Examples of
typical statements included the following: ‘I was a big supporter of syndromic surveillance for
early warning early on, but now I am more realistic about the system’s limitations.’ ”
In the literature, Reingold (2003) suggested that a compelling case for the implementation
of biosurveillance systems has yet to be made. Cooper (2006) said, “To date no bio-terrorist
attack has been detected in the United Kingdom, or elsewhere in the world using syndromic
surveillance systems.” Stoto et al. (2004) questioned whether biosurveillance systems can achieve
an effective early detection capability. And Green (2008) said, “Syndromic surveillance systems,
based on statistical algorithms, will be of little value in early detection of bioterrorist outbreaks.
Early on in the outbreak, there will be cases serious enough to alert physicians and be given
definitive diagnoses.”
The research challenges span many disciplines and problems:
∙ Legal and regulatory challenges in order to gain access to data.
∙ Technological challenges related to designing and implementing computer hardware and
software for collecting and assembling data.
∙ Ethical and procedural issues inherent in managing and safeguarding data.
∙ Analytical challenges of assessing the likelihood of outbreaks and of displaying data to
12
enhance situational awareness.
∙ Managerial challenges of effectively assembling and operating the entire system.
These research challenges are not necessarily of equal importance nor are they listed in any type
of priority order. Furthermore, little is known about how they should be prioritized in terms
of their contributions to improving the utility and/or effectiveness of biosurveillance. However,
it is clear that improvements are necessary in all of these disciplines to achieve biosurveillance
systems that are maximally useful and effective.
Much of the continuing controversy surrounding biosurveillance stems from its initial
focus on early event detection, a use that requires a number of still unproven assumptions,
including:
∙ Leading indicators of outbreaks exist in pre-diagnosis health-related data of adequate
strength such that they are statistically detectable with satisfactory power.
∙ The leading indicators occur sufficiently far in advance of clinical diagnoses so that, when
found, they provide the public health community with enough advance notice to take
action.
∙ Statistical detection algorithms exist that produce signals reliable enough to warrant con-
tinued dedication of public health resources to investigate the signals.
Of course, a myopic focus only on early event detection in biosurveillance systems misses
important benefits such systems can provide, particularly the potential to significantly advance
and modernize the practice of public health surveillance. For example, whether or not bio-
surveillance systems prove effective at the early detection of bioterrorism, they are likely to have
a significant and continuing role in the detection and tracking of seasonal and pandemic flu, as
well as other naturally occurring disease outbreaks. This latter function is echoed in an Insti-
tute of Medicine report on Microbial Threats to Health by Smolinski et al. (2003): “[S]yndromic
surveillance is likely to be increasingly helpful in the detection and monitoring of epidemics,
as well as the evaluation of health care utilization for infectious diseases.” In a similar vein,
Uscher-Pines et al. (2009) quote a public health official: “Health departments should not be at
the mercy of alerts; they need to develop their own uses for syndromic surveillance.”
13
In terms of bioterrorism, Stoto (2006) states that biosurveillance systems build links
between public health and health care providers - links that could prove to be critical for
consequence management should a bioterrorism attack occur. Furthermore, Sosin (2003) points
out that biosurveillance systems can act as a safety net should the existing methods of detection
fail to detect an attack. As such, biosurveillance can provide additional lead-time to public health
authorities so they can take more effective public health actions. For example, a Dutch biologist
conducting automated salmonella surveillance related that the surveillance system detected an
outbreak whose occurrence was somehow missed by sentinel physicians (Burkom, 2006). And
unusual indicators in a biosurveillance system (not necessarily a signal from an EED algorithm)
may give public health organizations time to begin organizing and marshalling resources in
advance of a confirmed case and/or provide critical information about how and where to apply
resources.
4 Quantitative Methods Used in Biosurveillance Systems
Biosurveillance systems use a variety of temporal and spatial methods for early event detection.
As is discussed in more detail below, most of these have been adapted from other fields and
applications. Buckeridge et al. (2005) provides a useful classification of common surveillance
scenarios and a mapping of some early event detection methods to those scenarios.
Situational awareness is an emerging concept in biosurveillance and, as such, specific
methods for assessing and displaying relevant information has not yet been incorporated into
the systems. Currently situational awareness is limited to displaying the spatial distribution of
data via geographic information system (GIS) software. See, for example, Li et al. (2006).
4.1 Temporal Methods
Most syndromic surveillance systems apply variants of the standard univariate statistical process
control (SPC) methods: Shewhart, cumulative sum (CUSUM), and/or exponentially weighted
moving average (EWMA) charts. Woodall (2006) provides a comprehensive overview of the
application of control charts to health surveillance. Montgomery (2004) is an introduction to
these methods in a statistical process control setting and Fricker (2010a) is a primer on how
to apply these and other statistical methods to biosurviellance, both for early event detection
14
and situational awareness. Fricker (2008), Shmueli & Fienberg (2006), and Shmueli & Burkom
(2009) also review these and other methods potentially applicable to early event detection in a
biosurveillance setting.
The challenge in applying these methods is that syndromic surveillance generally violates
classical SPC assumptions. In SPC it is often reasonable to assume that:
∙ since one controls the manufacturing process, the in-control distribution is (or can reason-
ably be assumed to be) stationary;
∙ observations can be drawn from the process so they are independent (or nearly so);
∙ monitoring the process mean and standard deviation is usually sufficient;
∙ the asymptotic distributions of the statistics being monitored are known and thus can be
used to design appropriate control charts;
∙ shifts, when they occur, remain until they are detected and corrective action taken; and,
∙ temporal (as opposed to spatial) detection is the critical problem.
However, the general biosurveillance problem violates many, if not all, of these assump-
tions. For example:
∙ there is little to no control over disease incidence and thus the distribution of disease
incidence is usually non-stationary;
∙ observations (often daily counts) are autocorrelated, and the need for quick detection works
against the idea of taking measurements far enough apart to achieve (near) independence;
∙ in biosurveillance there is little information on what types of statistics are useful for mon-
itoring – one is often looking for anything that seems unusual;
∙ because individual observations are being monitored, the idea of asymptotic sampling
distributions does not apply, and the data often contain significant systematic effects that
must be accounted for;
∙ outbreaks are transient, with disease incidence returning to its original state once an
outbreak has run its course; and,
15
∙ identifying both spatial and temporal deviations are often critical.
This gap between existing SPC methods and the biosurveillance problem provides an area ripe
for new research.
In spite of the gap, the standard SPC methods are sometimes applied to biosurveillance
data with little modification (see, for example, Fricker (2007) or Stoto et al. (2006)) and in some
cases the methods are modified to attempt to account for the autocorrelation. For example,
EARS applies variants of the Shewhart control chart (see equations (1) and (2) below) and a
cumulative method (see equation (3) below). These methods use various moving windows of
data to estimate the process mean and standard deviation (Hutwagner et al., 2003a) and they
are intended to be used when little historic (“baseline”) information is available.
The EARS methods are called “C1,” “C2,” and “C3” and are defined as follows (Hut-
wagner et al., 2005). Let Y (t) be the observed count for period t representing, for example, the
number of individuals arriving at a particular hospital emergency room with a specific syndrome
on day t. The C1 calculates the statistic C1(t) as
C1(t) =Y (t)− Y1(t)
S1(t)(1)
where Y1(t) and S1(t) are the moving sample mean and standard deviation, respectively:
Y1(t) =1
7
t−7∑
j=t−1
Y (j) and S2
1(t) =
1
6
t−7∑
j=t−1
[
Y (j)− Y1(j)]2
.
If S21(t) = 0 then EARS sets it to a small positive number. As implemented in the EARS
system, the C1 signals on day t when the C1 statistic exceeds a threshold ℎ, which is fixed at
three sample standard deviations above the sample mean: C1(t) > 3.
The C2 is similar to the C1, but incorporates a two-day lag in the mean and standard
deviation calculations. Specifically, it calculates
C2(t) =Y (t)− Y3(t)
S3(t)(2)
where
Y3(t) =1
7
t−9∑
j=t−3
Y (j) and S2
3(t) =
1
6
t−9∑
j=t−3
[
Y (j)− Y3(j)]2
.
If S2
3(t) = 0 then EARS sets it to a small positive number and the C2 method signals on day t
when C2(t) > 3.
16
The C3 combines current and historical data from day t and the previous two days,
calculating the statistic C3(t) as
C3(t) = Y (t) +t−2∑
j=t−1
Y (j)× I{Y (j) < 3}, (3)
where I is the indicator function. In EARS the C3 method signals on day t when C3(t) > 2 and
Y (t) > Y3(t).
The C3 method described above, as implemented in EARS V4.5, is different from the
original EARS implementation. See Fricker (2008) for a description of the original C3 method.
BioSense originally implemented the C1, C2, and C3 methods, but has since modified the
C2. Calling the new method “W2,” it calculates the mean and standard deviation separately
for weekdays and weekends (using the relevant last seven days with a two-day lag). Following
the suggestion of Buckeridge et al. (2005), it uses an empiric method to define the threshold and
users of the system can select the threshold as an option (CDC, 2006d).
To date, multivariate SPC methods have not been incorporated into operational bio-
surveillance systems. Some research has been conducted to define and evaluate directional
multivariate methods, including Joner et al. (2008), Fricker (2007), and Stoto et al. (2006).
Whether or not multivariate methods provide additional sensitivity to detect outbreaks com-
pared to the current practice of using multiple simultaneous univariate methods has yet to be
conclusively demonstrated. Various methods have also been proposed to combine and/or adjust
for the application of multiple univariate methods in multivariate settings. See the discussion
in Rolka et al. (2007) about parallel and consensus monitoring methods and Stoto et al. (2006)
and Stoto et al. (2004) for a discussion and an evaluation of some of these methods.
Regression and time series methods have also been proposed to explicitly model, and
hence account for, seasonality. The basic idea is to model the disease incidence process, perhaps
including terms in the model for annual seasonal variations, monthly variations, and even day
of the week and holiday variations. The model is then used to either: (1) predict the expected
number of events and the difference between the expected number and observed number is
monitored for excessive deviations or, (2) model and then remove the explainable/known effects
(sometimes called preconditioning) and then the residuals are monitored using traditional SPC
methods. This is consistent with recommendations by Montgomery (2004) for autocorrelated
data. Examples in the literature include Brillman et al. (2005), who apply the CUSUM to the
17
prediction errors, the CDC’s cyclical regression models discussed in Hutwagner et al. (2003b),
log-linear regression models in Farrington et al. (1996), and time series models in Reis & Mandl
(2003). See Shmueli & Burkom (2009) for additional discussion of the use of regression and
time series methods for syndromic surveillance and Burkom et al. (2006) for a comparison of
two regression-based methods and an exponential smoothing method applied to biosurveillance
forecasting. Also see Lotze et al. (2008) for a detailed discussion of preconditioning applied to
syndromic surveillance data.
Other temporal methods that have been proposed or are in use for syndromic surveillance
include: wavelets (see Goldenberg et al. (2002), Zhang et al. (2003), Shmueli (2005), and the
discussion in Shmueli & Burkom (2009)); Bayesian networks (see Wong et al. (2005), Rolka et al.
(2007)); hidden Markov models (see Le Strat & Carrat (1999)); Bayesian dynamic models (see,
for example, Sebastiani et al. (2006)), and rule-based methods (see, for example, Wong et al.
(2003)).
4.2 Spatial and Spatio-temporal Methods
Kleinman et al. (2004) and Lazarus et al. (2002) proposed a generalized linear mixed model
(GLMM) to simultaneously monitor disease counts over time in a region divided into smaller
sub-areas (zip codes). It is statistically attractive because it uses information across the entire
region while appropriately adjusting for the smaller areas.
As described in Kleinman et al. (2004), there are two forms of the model depending on
whether individual data and covariates are available versus aggregated counts and covariates by
zip code. In the former case, the model is
E(yijt∣bi) = pijt and logit(pijt) = xijt� + bi, (4)
where yijt is an indicator for whether or not person j in area i is a case on day t, pijt is the
probability he or she is a case, xijt is a vector of observed covariates on person j and/or area
i over time up to and including day t, � is a vector of fixed effects, and bi is a random effect
for area i. When no individual level covariate information is available, the most likely situation,
the model is
E(yit∣bi) = pit and logit(pit) = xit� + bi, (5)
where yit =∑nit
j=1yijt. In this model, pit can be thought of as the probability that an individual
18
in area i will be a case on day t.
Having fit the model in equation (5), z cases are observed on day t+1. The rarity of the
observed count is assessed by calculating
Pr(Z ≥ z cases) = 1−
z−1∑
k=1
(
nit
k
)
pit(1 − pit)nit−k, (6)
where pit is calculated from the estimated coefficients in the usual way for logistic regression and
1/(pit ×# tests conducted) is proposed as the recurrence interval: the number of time periods
for which the expected number of counts of z or more cases is one (Woodall et al., 2008). Waller
(2004) recommends an alternate calculation for the recurrence interval and Woodall et al. (2008)
take issue with both the use of and recommended calculations for the recurrence interval.
The Small Area Regression and Testing (“SMART”) method in BioSense (see the BioSense
User Guide (CDC, 2006e)) is based on the Kleinman et al. (2004) and Lazarus et al. (2002)
GLMM approach. However, as implemented in BioSense it only uses spatial information to bin
data into separate time series, the output of which are subsequently combined using a Bonferroni
correction. Hence, the BioSense SMART method is properly classified as a temporal method.
The most commonly used spatial method is the scan statistic, particularly as imple-
mented in the SaTScan software (www.satscan.org). Originally developed to retrospectively
identify disease clusters (see Kulldorff, 1997), the method is now regularly used prospectively
in biosurveillance systems (see Kulldorff, 2001). For example, it was used as part of a drop-in
syndromic surveillance system in New York City after the 9/11 attack (Ackelsberg et al., 2002).
While it has been studied by the BioSense program, it has not yet been implemented in the
BioSense system interface (see Bradley (2005) and the BioSense User Guide (CDC, 2006e)).
The basic idea in SaTScan is to count the number of cases that occur in a cylinder, where
the circle is the geographic base and the height of the cylinder corresponds to time. The cylinder
is passed over space, varying the radius of the circle (up to a maximum radius that includes
50 percent of the monitored population) and the height of the cylinder and counts of cases for
those geographic regions whose centroids fall within the circle for the period of time specified
by the height of the cylinder are summed. When used for prospective biosurveillance, the start
date of the height of the cylinder is varied but the end date is fixed at the most current time
period. Conditioning on the expected spatial distribution of observations, SaTScan reports the
most likely cluster (in both space and time) and its p-value.
19
Though widely used, some aspects of the prospective application of the SaTScan method-
ology have been questioned, particularly the use of recurrence intervals and performance com-
parisons between SaTScan and other methods. See Woodall et al. (2008) for further details.
Also, see Kulldorff (2001) for other methods for disease mapping and for testing whether an
observed pattern of disease is due to chance.
Fricker & Chang (2008) introduced a new spatia-temporal methodology for biosurveil-
lance entitled the repeated two-sample rank (RTR) procedure. It is designed to sequentially
incorporate information from individual observations and thus can operate on data in real-
time as it arrives into an automated biosurveillance system. In addition, upon a signal of a
possible outbreak, the methodology suggests a way to graphically indicate the likely outbreak
location, and the output can subsequently be used to track the spread of an outbreak. Thus, the
methodology can be used for both early event detection and situational awareness in automated
biosurveillance systems.
Olson et al. (2005) and Forsberg et al. (2006) take an alternate approach to assessing
possible disease clusters using M -statistics based on the distribution of pairwise distances be-
tween cases. That is, let X = {X1, . . . , Xn} represent the locations of n cases on the plane and
let d = {d1, . . . , d(n2)} be the
(
n
2
)
interpoint distances, then the M -statistic is
M = (o− e)T S−1(o− e) (7)
where o and e are vectors of observed and expected counts of binned interpoint distances and
S−1 is the inverse of the estimate of the covariance matrix. However, Forsberg et al. (2005)
state, “...these methods still require much refinement and further research.”
Other approaches to spatial and spatio-temporal biosurveillance methods include the
Automated Epidemiologic Geotemporal Integrated Surveillance System (AEGIS) by Olson et al.
(2005) and the application of CUSUM methods to the spatial distribution of cases (see Rogerson
& Yamada (2004)). See Lawson & Kleinman (2005) for additional exposition and methods, and
Mandl et al. (2004) for further discussion on spatial and spatio-temporal modeling issues. For
spatial methods with application to more traditional public health data and problems, see Waller
& Gottway (2004).
20

5 Conclusion
Biosurveillance systems are being developed and implemented around the world. They are
motivated by a need for improved public health surveillance, not only for bioterrorism, but
also to improve detection and responsiveness to natural disease outbreaks such as H1N1, avian
influenza and SARS, and as such they hold great promise as public health tools. For additional
development and discussion, see Fricker (2010a), Lombardo & Buckeridge (2007), M’ikanatha
et al. (2007), Wagner et al. (2006), Waller & Gottway (2004), and Stroup et al. (1989).
References
Ackelsberg, J., Balter, S., Bornschelgel, K., Carubis, E., Cherry, C., Das, D., Fine, A., Karpati, A.,Layton, M., Mostashari, F., Nivin, B., Reddy, V., Weiss, D., Hutwagner, L., Seeman, G.M., McQuis-ton, J., Treadwell, T., & Rhodes, J. 2002. Syndromic Surveillance for Bioterrorism Following theAttacks on the World Trade Center - New York City, 2001. Morbidity and Mortality Weekly Report,51 (Special Issue), 13–15.
Bradley, C. 2005. Visualizing and Monitoring Data in BioSense Using SaTScan. 2005 Syndromic Surveil-lance Conference presentation. Accessed at www.cdc.gov/biosense/files/SaTScan Presentation
2005.ppt#501,1,Colleen Bradley, MSPH Syndromic Surveillance Conference, 2005 on Novem-ber 28, 2006.
Bravata, D.M., McDonald, K.M., Smithe, W.M., Rydzak, C., Szeto, H., Buckeridge, D.L., Haberland,C., & Owens, D.K. 2004. Systematic review: Surveillance Systems for Early Detection of Bioterrorism-Related Diseases. Annals of Internal Medicine, 140(11), 910–922.
Brillman, J.C., Burr, T., Forslund, D., Joyce, E., Picard, R., & Umland, E. 2005. Modeling EmergencyDepartment Visit Patterns for Infectious Disease Complaints: Results and Application to DiseaseSurveillance. BMC Medical Informatics and Decision Making, 5.
Brownstein, J.S., Freifeld, C.C., Reis, B.Y., & Mandl, K.D. 2008. Surveillance Sans Frontieres: Internet-Based Emerging Infectious Disease Intelligence and the HealthMap Project. PLoS Medicine, 5(7),1019–1024.
Buckeridge, D.L., Burkom, H., Campbell, M., Hogan, W.R., & Moore, A.W. 2005. Algorithms for RapidOutbreak Detection: A Research Synthesis. Journal of Biomedical Informatics, 99–113.
Buehler, J.W., Sonricker, A., Paladini, M., Soper, P., & Mostashari, F. 2008. Syndromic SurveillancePractice in the United States: Findings from a Survey of State, Territorial, and Selected Local HealthDepartments. Advances in Disease Surveillance, 6(3), 1–20.
Burkom, H. 2006. Personal communication, December 22, 2006.
Burkom, H.S., Murphy, S.P., & Shmueli, G. 2006. Automated Time Series Forecasting for Biosurveil-lance. Statistics in Medicine.
CDC. 2003. Syndrome Definitions for Diseases Associated with Critical Bioterrorism-associated Agentsdated October 23, 2003. Accessed at www.bt.cdc.gov/surveillance/syndromedef/ on November 21,2006.
CDC. 2006a. Accessed at www.cdc.gov/biosense/publichealth.htm on November 16, 2006.
CDC. 2006b. Annotated Bibliography for Syndromic Surveillance. Accessed at www.cdc.gov/EPO/dphsi/syndromic/evaluation.htm on November 28, 2006.
21
CDC. 2006c. BioSense. Accessed at www.cdc.gov/biosense/ on November 27, 2006.
CDC. 2006d. BioSense Bulletin. September issue.
CDC. 2006e. BioSense User Guide, Version 2.0. Accessed online at http://0-www.cdc.gov.mill1.
sjlibrary.org/biosense/files/CDC BioSense User Guide v2.0.pdf on November 28, 2006.
CDC. 2007. Early Aberration Reporting System. Accessed at www.bt.cdc.gov/surveillance/ears onApril 30, 2007.
CDC. 2008. Accessed at www.cdc.gov/BioSense/publichealth.htm accessed October 11, 2008.
CDC. 2010a. NETSS website. Accessed on-line at www.cdc.gov/ncphi/disss/nndss/netss.htm onJune 5, 2010.
CDC. 2010b. NNDSS website. Accessed on-line at www.cdc.gov/ncphi/disss/nndss/nndsshis.htm onJune 5, 2010.
Cooper, D.L. 2006. Can Syndromic Surveillance Data Detect Local Outbreaks of Communicable Dis-ease? A Model Using a Historical Cryptosporidiosis Outbreak. Epidemiology and Infection, 134,13–20.
Deaux, G. 1969. The Black Death, 1347. David McKay Company.
DoD. 2006. www.geis.fhp.osd.mil/GEIS/SurveillanceActivities/ESSENCE/ESSENCE.asp accessedon November 27, 2006.
Farrington, C.P., Andrews, N.J., Beale, A.D., & Catchpole, M.A. 1996. A Statistical Algorithm for theEarly Detection of Outbreaks of Infectious Disease. Journal of the Royal Statistical Society, Series A(Statistics in Society), 159, 547–563.
Forsberg, L., Bonetti, M., Jeffery, C., Ozonoff, A., & Pagano, M. 2005. Distance-based Methods forSpatial and Spatio-temporal Surveillance. Pages 133–152 of: Lawson, A.B., & Kleinman, K. (eds),Spatial & Syndromic Surveillance for Public Health. John Wiley & Sons.
Forsberg, L., Jeffery, C., Ozonoff, A., & Pagano, M. 2006. A Spatiotemporal Analysis of SyndromicData for Biosurveillance. Pages 173–191 of: Wilson, A., Wilson, G., & Olwell, D.H. (eds), Statisti-cal Methods in Counterterrorism: Game Theory, Modeling, Syndromic Surveillance, and BiometricAuthentication. Springer.
Freifeld, C., & Brownstein, J. 2010. HealthMap website. Accessed at http://healthmap.org/en/ onJune 5, 2010.
Fricker, R.D., Jr. 2007. Directionally Sensitive Multivariate Statistical Process Control Methods withApplication to Syndromic Surveillance. Advances in Disease Surveillance, 3(1). Available on-line atwww.isdsjournal.org.
Fricker, R.D., Jr. 2008. Syndromic Surveillance. Pages 1743–1752 of: Melnick, E., & Everitt, B. (eds),Encyclopedia of Quantitative Risk Assessment. John Wiley & Sons Ltd.
Fricker, R.D., Jr. 2010a. Introduction to Statistical Methods for Biosurveillance. Cambridge UniversityPress. In press.
Fricker, R.D., Jr. 2010b. Some Methodological Issues in Biosurveillance (with discussion and rejoinder).Statistics in Medicine. In press.
Fricker, R.D., Jr., & Chang, J.T. 2008. A Spatio-temporal Methodology for Real-time Biosurveillance.Quality Engineering, 20, 465–477.
Fricker, R.D., Jr., & Rolka, H.R. 2006. Protecting Against Biological Terrorism: Statistical Issues inElectronic Biosurveillance. Chance, 19, 4–13.
22
Ginsberg, J., Mohebbi, M.H., Patel, R.S., Brammer, L., Smolinski, M.S., & Brilliant, L. 2009. DetectingInfluenza Epidemics Using Search Engine Query Data. Nature, 457, 1012–1014.
Goldenberg, A., Shmueli, G., Caruana, R.A., & Fienberg, S.E. 2002. Early Statistical Detection ofAnthrax Outbreaks by Tracking Over-the-counter Medication Sales. Proceedings of the NationalAcademy of Sciences, 99, 5237–5240.
Gottfried, R.S. 1985. The Black Death: Natural and Human Disaster in Medieval Europe. Free Press.
Green, M. 2008. Syndromic Surveillance for Detecting Bioterrorist Events - The Right Answer to theWrong Question? Presentation given at the Naval Postgraduate School, June 9, 2008.
Hutwagner, L., Thompson, W., Seeman, G.M., & Treadwell, T. 2003a. The Bioterrorism Preparednessand Response Early Aberration Reporting System (EARS). Journal of Urban Health: Bulletin of theNew York Academy of Medicine, 80(2 (Supplement 1)), 89i–96i.
Hutwagner, L., Thompson, W., Seeman, G.M., & Treadwell, T. 2003b. The Bioterrorism Preparednessand Response Early Aberration Reporting System (EARS). Journal of Urban Health: Bulletin of theNew York Academy of Medicine, 80, 89i–96i.
Hutwagner, L.C., Browne, T., Seeman, G.M., & Fleischauer, A.T. 2005. Comparing Aberration Detec-tion Methods with Simulated Data. Emerging Infectious Diseases, 11, 314–316.
Joner, M.D., Jr., Woodall, W.H., Reynolds, M.R., Jr., & Fricker, R.D., Jr. 2008. A One-Sided MEWMAChart for Health Surveillance. Quality and Reliability Engineering International, 24, 503–519.
Kleinman, K., Lazarus, R., & Platt, R. 2004. A Generalized Linear Mixed Models Approach forDetecting Incident Clusters of Disease in Small Areas, with an Application to Biological Terrorism.American Journal of Epidemiology, 159, 217–224.
Kulldorff, M. 1997. A Spatial Scan Statistic. Communications in Statistics, Theory and Methods, 26,1481–1496.
Kulldorff, M. 2001. Prospective Time Periodic Geographical Disease Surveillance Using a Scan Statistic.Journal of the Royal Statistical Society, Series A (Statistics in Society), 164, 61–72.
Lawson, A.B., & Kleinman, K. (eds). 2005. Spatial & Syndromic Surveillance for Public Health. JohnWiley & Sons.
Lazarus, R., Kleinman, K., Dashevsky, I., Adams, C., Kludt, P., A. DeMaria, Jr., & Platt, R. 2002. Useof Automated Ambulatory-Care Encounter Records for Detection of Acute Illness Clusters, IncludingPotential Bioterrorism Events. Emerging Infectious Diseases, 8, 753–760.
Le Strat, Y., & Carrat, F. 1999. Monitoring Epidemiologic Surveillance Data Using Hidden MarkovModels. Statistics in Medicine, 18, 3463–3478.
Li, H., Faruque, F., Williams, W., & Finley, R. 2006. Real-Time Syndromic Surveillance. ArcUser: TheMagazine for ESRI Software Users, January-March issue, 17–19.
Lombardo, J.S., & Buckeridge, D.L. (eds). 2007. Disease Surveillance: A Public Health InformaticsApproach. John Wiley & Sons.
Lombardo, J.S., Burkom, H., & Pavlin, J. 2004. ESSENCE II and the Framework for EvaluatingSyndromic Surveillance Systems. Morbidity and Mortality Weekly Report, 53 (supplement), 159–165.
Lotze, T., Murphy, S. P., & Shmueli, G. 2008. Implementation and Comparison of PreprocessingMethods for Biosurveillance. Advances in Disease Surveillance, 6, 1–14.
Mandl, K.D., Overhage, J.M., Wagner, M.W., Lober, W.B., Sebastiani, P., Mostashari, F., Pavlin, J.A.,Gesteland, P.H., Treadwell, T., Koski, E., Hutwagner, L., Buckeridge, D.L., Aller, R.D., & Grannis,S. 2004. Implementing Syndromic Surveillance: A Practical Guide Informed by the Early Experience.The Journal of the American Medical Informatics Association, 11, 141–150.
23
M’ikanatha, N.M., Lynfield, R., Van Beneden, C.A., & de Valk, H. (eds). 2007. Infectious DiseaseSurveillance. 1st edn. Blackwell Publishing.
Montgomery, D.C. (ed). 2004. Introduction to Statistical Quality Control. 5th edn. John Wiley & Sons.
Olson, K.L., Bonetti, M., Pagano, M., & Mandl, K.D. 2005. Real Time Spatial Cluster Detection UsingInterpoint Distances Among Precise Patient Locations. BMC Medical Informatics and DecisionMaking, 5.
OSD. 2005. ESSENCE IV Improves Nation’s Bio-Surveillance Capability. Accessed athttp://deploymentlink.osd.mil/news/jan05/news 20050125 001.shtml on November 27, 2006.
Reingold, A. 2003. If Syndromic Surveillance is the Answer, What is the Question? Biosecurity andBioterrorism: Biodefense Strategy, Practice, and Science, 1, 1–5.
Reis, B.Y., & Mandl, K.D. 2003. Time Series Modeling for Syndromic Surveillance. BMC MedicalInformatics for Decision Making, 3.
RODS. 2010. RODS Laboratory website. Accessed on-line at https://www.rods.pitt.edu/site/ onJune 5, 2010.
Rogerson, P.A., & Yamada, I. 2004. Monitoring Change in Spatial Patterns of Disease: ComparingUnivariate and Multivariate Cumulative Sum Approaches. Statistics in Medicine, 23, 2195–2214.
Rolka, H., & O’Connor, Jean. 2010. Real-Time Public Health Biosurveillance: Systems and PolicyConsiderations. In: Infectious Disease Informatics and Biosurveillance: Research, Systems and CaseStudies. Springer.
Rolka, H., Burkom, H., Cooper, G.F., Kulldorff, M., Madigan, D., & Wong, W. 2007. Issues in AppliedStatistics for Public Health Bioterrorism Surveillance Using Multiple Data Streams: Research Needs.Statistics in Medicine, 26, 1834–1856.
Rolka, H.A. 2006. Data Analysis Research Issues and Emerging Public Health Biosurveillance Di-rections. Pages 101–107 of: Wilson, A., Wilson, G., & Olwell, D.H. (eds), Statistical Methods inCounterterrorism: Game Theory, Modeling, Syndromic Surveillance, and Biometric Authentication.Springer.
Sebastiani, P., Mandl, K.D., Szolovits, P., Kohane, I.S., & Ramoni, M.F. 2006. A Bayesian DynamicModel for Influenza (with discussion). Statistics in Medicine, 25, 1803–1825.
Shmueli, G. 2005. Wavelet-based Monitoring for Modern Biosurveillance. University of Maryland,Robert H. Smith School of Business. Technical Report RHS-06-002.
Shmueli, G., & Burkom, H.S. 2009. Statistical Challenges Facing Early Outbreak De-tection in Biosurveillance. Accessed on-line at www.rhsmith.umd.edu/faculty/gshmueli/
web/images/statchallengesbiosurveillancerevised -iii.pdf on September 27, 2009.
Shmueli, G., & Fienberg, S.E. 2006. Current and Potential Statistical Methods for Monitoring Mul-tiple Data Streams for Biosurveillance. Pages 109–140 of: Wilson, A., Wilson, G., & Olwell, D.H.(eds), Statistical Methods in Counterterrorism: Game Theory, Modeling, Syndromic Surveillance,and Biometric Authentication. Springer.
Smolinski, M.S., Hamburg, M.A., & Lederberg, J. (eds). 2003. Microbial Threats to Health: Emergence,Detection, and Response. National Academies Press.
Sosin, D.M. 2003. Syndromic Surveillance: The Case for Skillful Investment View. Biosecurity andBioterrorism: Biodefense Strategy, Practice, and Science, 1, 247–253.
Stoto, M.A. 2006. Syndromic Surveillance in Public Health Practice. Presentation to Institute ofMedicine Forum on Microbial Threats, December 12, 2006.
Stoto, M.A., Schonlau, M., & Mariano, L.T. 2004. Syndromic Surveillance: Is it Worth the Effort?Chance, 17, 19–24.
24
Stoto, M.A., Fricker, Jr., R.D., Jain, A., Diamond, A., Davies-Cole, J.O., Glymph, C., Kidane, G.,Lum, G., Jones, L., Dehan, K., & Yuan, C. 2006. Evaluating Statistical Methods for SyndromicSurveillance. Pages 141–172 of: Wilson, A., Wilson, G., & Olwell, D.H. (eds), Statistical Methods inCounterterrorism: Game Theory, Modeling, Syndromic Surveillance, and Biometric Authentication.Springer.
Stroup, D.F., Williamson, G.D., Herndon, J.L., & Karon, J.M. 1989. Detection of Aberrations in theOccurrence of Notifiable Dieseases Surveillance Data. Statistics in Medicine, 8, 323–329.
Tokars, J. 2006. The BioSense Application. Presentation at the 2006 PHIN Conference, Atlanta, GA,accessed online at http://0-www.cdc.gov.mill1.sjlibrary.org/biosense/files/Jerry Tokars.
ppt#387,1,The BioSense Application on November 27, 2006.
Toprani, A., Ratard, R., Straif-Bourgeois, S., Sokol, T., Averhoff, F., Brady, J., Staten, D., Sullivan, M.,Brooks, J.T., Rowe, A.K., Johnson, K., Vranken, P., & Sergienko, E. 2006. Surveillance in HurricaneEvacuation Centers - Louisiana. Morbidity and Mortality Weekly Report, 55, 32–35.
U.S. Government. 2007. Homeland Security Presidential Directive 21: Public Health and Medical Pre-paredness. Accessed on-line at www.fas.org/irp/offdocs/nspd/hspd-21.htm on September 29, 2009.
Uscher-Pines, L., Farrell, C.L., Babin, S.M., Cattani, J., Gaydos, C.A., Hsieh, Y., Moskal, M.D., &Rothman, R.E. 2009. Framework for the Development of Response Protocols for Public HealthSyndromic Surveillance Systems: Case Studies of 8 US States. Disaster Medicine and Public HealthPreparedness, 3, S29–S36.
Wagner, M.M., Moore, A.W., & Aryel, R.M. (eds). 2006. Handbook of Biosurveillance. Elsevier Aca-demic Press.
Waller, L.A. 2004. Invited Commentary: Syndromic Surveillance-Some Statistical Comments. AmericanJournal of Epidemiology, 159, 225–227.
Waller, L.A., & Gottway, C.A. (eds). 2004. Applied Spatial Statistics for Public Health Data. JohnWiley & Sons.
Wong, W., Moore, A., Cooper, G., & Wagner, M. 2003. WSARE: What’s Strange About Recent Events?Journal of Urban Health: Bulletin of the New York Academy of Medicine, 80 (supplement), 66i–75i.
Wong, W., Cooper, G., Dash, D., Levander, J., Dowling, J., Hogan, W., & Wagner, M. 2005. Use ofMultiple Data Streams to Conduct Bayesian Biologic Surveillance. Morbidity and Mortality WeeklyReport, 54 (supplemental), 63–69.
Woodall, W.H. 2006. The Use of Control Charts in Health-Care and Public-Health Surveillance. Journalof Quality Technology, 38, 1–16.
Woodall, W.H., Marshall, B., Joner, M.D., Fraker, S.E., & Abdel-Salam, A.G. 2008. On the Use andEvaluation of Scan Methods for Health-related Surveillance. Journal of the Royal Statistical Society:Series A (Statistics in Society), 171, 223–237.
Zhang, J., Tsui, F., Wagner, M., & Hogan, W. 2003. Detection of Outbreaks from Time Series DataUsing Wavelet Transform. AMIA Annual Symposium Proceedings, 748–752.
Zubay, G. (ed). 2005. Agents of Bioterrorism: Pathogens and their Weaponization. Columbia UniversityPress.
25