Embed Size (px)
Citation preview
How has climate change impacted marine food-webs in the past, and how might we
predict changes in the future?
John K. Pinnegar, Georg Engelhard, Julia Blanchard, Joe Scutt-Phillips, William Cheung
International Symposium: Climate Change Effects on Fish & Fisheries, Sendai, Japan. Session A2
Monday 26th April, 2010
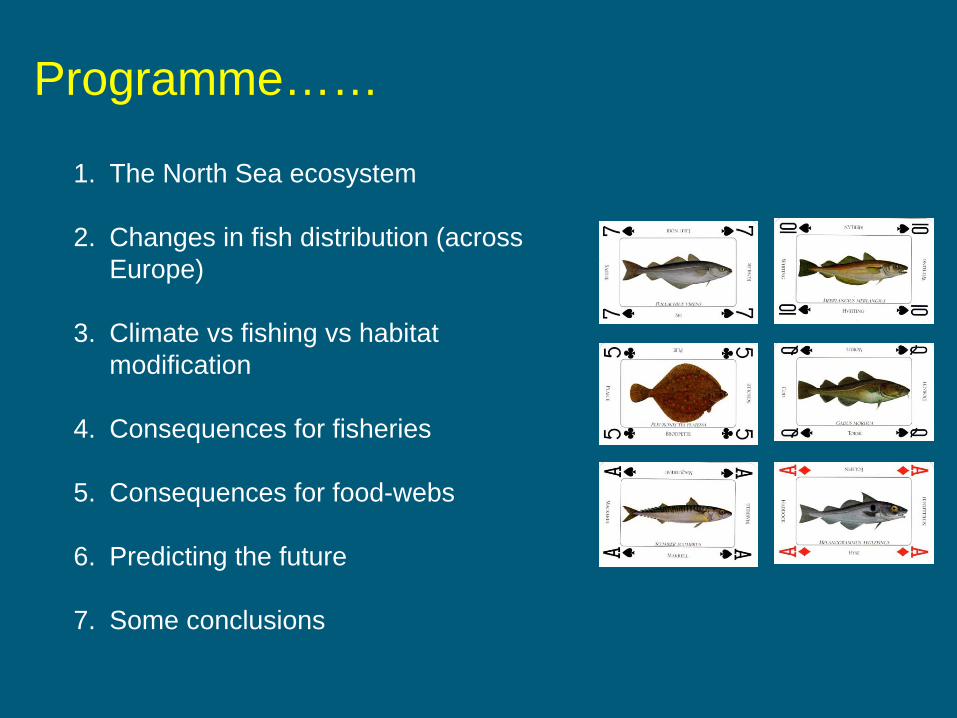
Programme……
1. The North Sea ecosystem
2. Changes in fish distribution (across Europe)
3. Climate vs fishing vs habitat modification
4. Consequences for fisheries
5. Consequences for food-webs
6. Predicting the future
7. Some conclusions
E6 E7 E8 E9 F0 F1 F2 F3 F4 F5 F6 F7 F852
51
50
49
48
47
46
45
44
43
42
41
40
39
38
37
36
35
34
33
32
31
-4 -3 -2 -1 0 1 2 3 4 5 6 7 8 9Longitude
51
52
53
54
55
56
57
58
59
60
61
62
Latitu
de
0102030405060708090100110120130140150160170180190200210220230240250260270280
Water Depth (m)
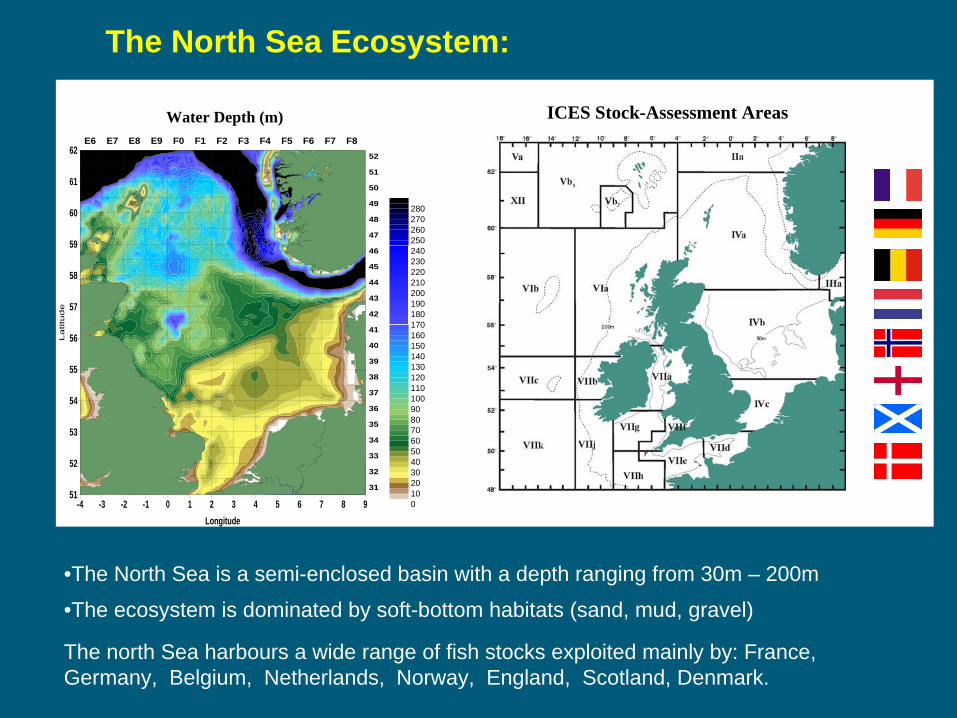
The North Sea Ecosystem:
•The North Sea is a semi-enclosed basin with a depth ranging from 30m – 200m
•The ecosystem is dominated by soft-bottom habitats (sand, mud, gravel)
The north Sea harbours a wide range of fish stocks exploited mainly by: France, Germany, Belgium, Netherlands, Norway, England, Scotland, Denmark.
ICES Stock-Assessment Areas
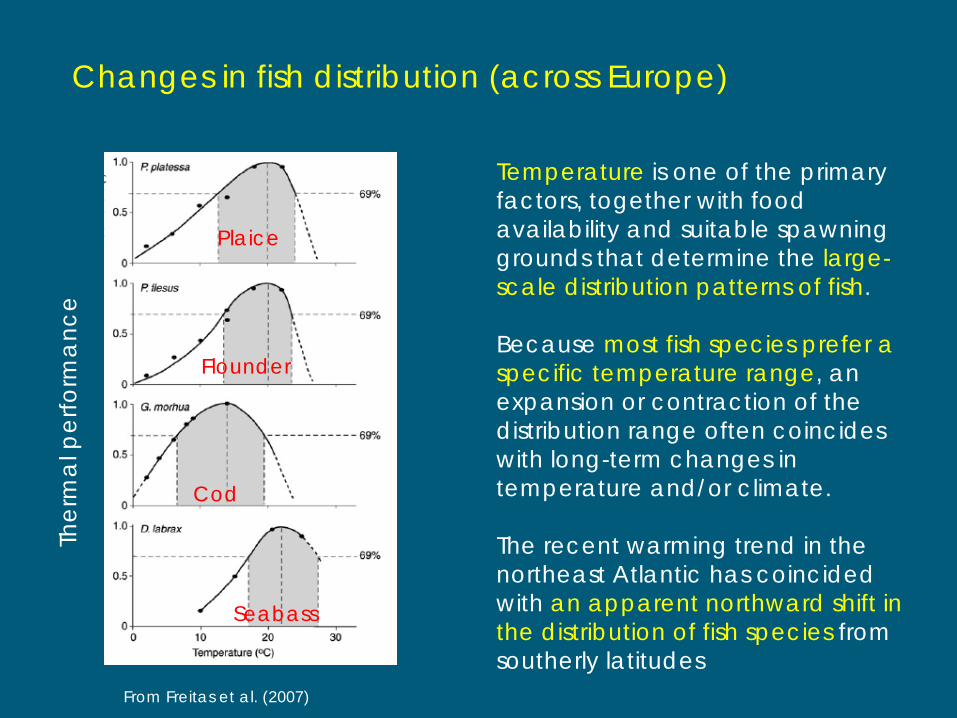
Changes in fish distribution (across Europe)
Temperature is one of the primary factors, together with food availability and suitable spawning grounds that determine the large- scale distribution patterns of fish.
Because most fish species prefer a specific temperature range, an expansion or contraction of the distribution range often coincides with long-term changes in temperature and/or climate.
The recent warming trend in the northeast Atlantic has coincided with an apparent northward shift in the distribution of fish species from southerly latitudes
Ther
mal
per
form
ance
Plaice
Flounder
Cod
Seabass
From Freitas et al. (2007)
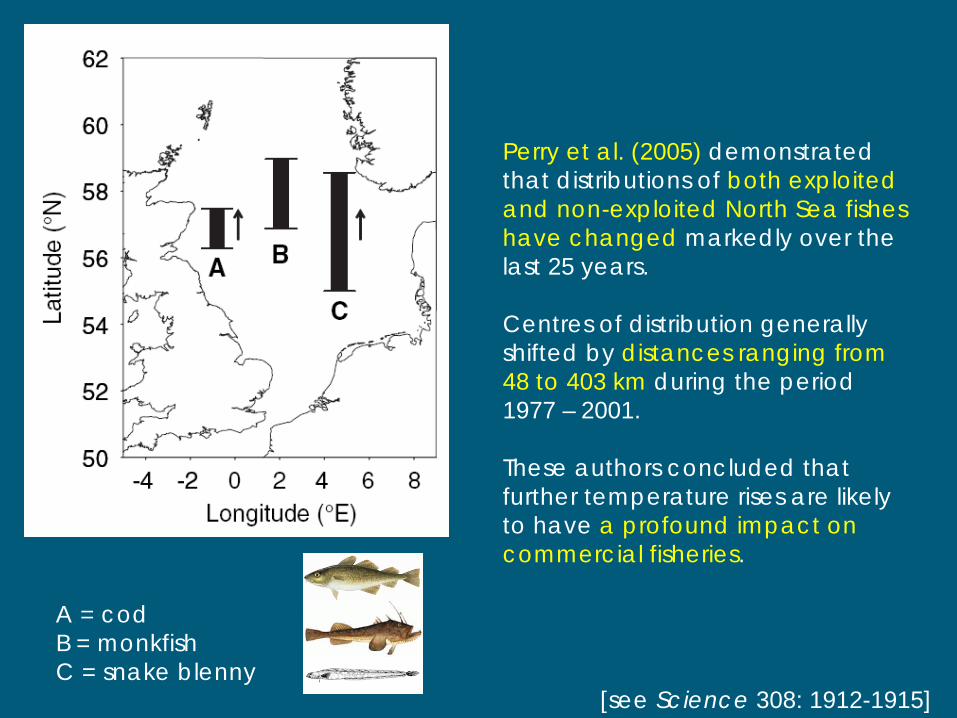
A = codB = monkfishC = snake blenny
Perry et al. (2005) demonstrated that distributions of both exploited and non-exploited North Sea fishes have changed markedly over the last 25 years.
Centres of distribution generally shifted by distances ranging from 48 to 403 km during the period 1977 – 2001.
These authors concluded that further temperature rises are likely to have a profound impact on commercial fisheries.
[see Science 308: 1912-1915]
-15 -10 -5 0 5 10
bib
lesser weaver
sole
four-bearded rockling
cuckoo ray
plaice
lemon sole
hake
angler
megrim
witch
grey gurnard
scaldfish
pogge
poor cod
Norway pout
spurdog
lesser spotted dogfish
starry ray
saithe
ling
whiting
haddock
dab
long rough dab
cod
solenette
wolffish
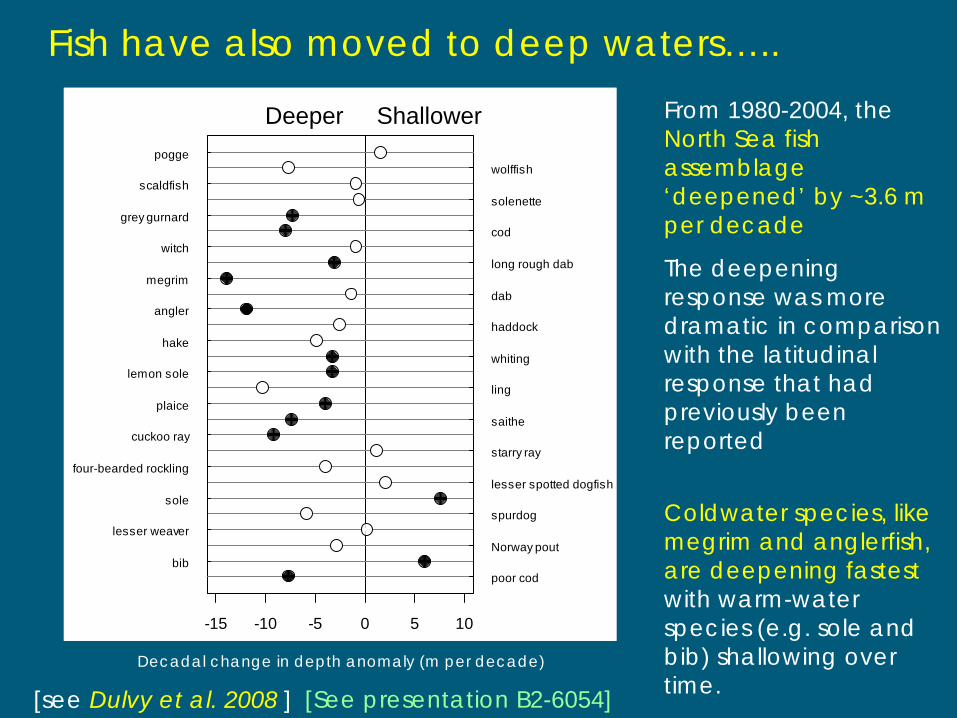
Deeper Shallower From 1980-2004, the North Sea fish assemblage ‘deepened’ by ~3.6 m per decade
The deepening response was more dramatic in comparison with the latitudinal response that had previously been reported
Coldwater species, like megrim and anglerfish, are deepening fastest with warm-water species (e.g. sole and bib) shallowing over time.
Decadal change in depth anomaly (m per decade)
Fish have also moved to deep waters…..
[see Dulvy et al. 2008 ] [See presentation B2-6054]
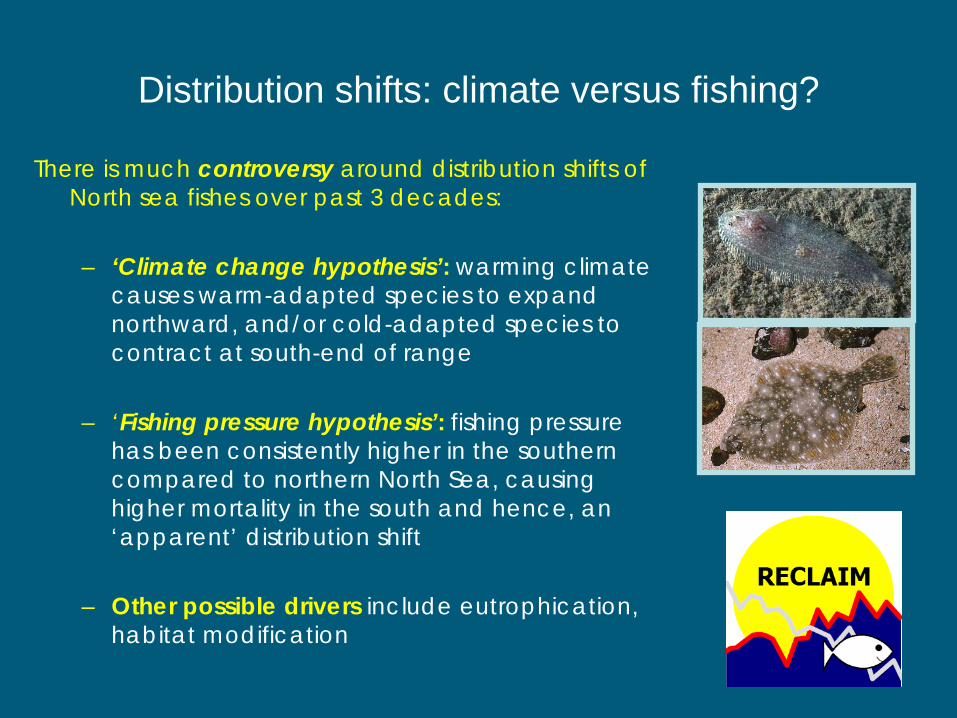
Distribution shifts: climate versus fishing?
There is much controversy around distribution shifts of North sea fishes over past 3 decades:
– ‘Climate change hypothesis’: warming climate causes warm-adapted species to expand northward, and/or cold-adapted species to contract at south-end of range
– ‘Fishing pressure hypothesis’: fishing pressure has been consistently higher in the southern compared to northern North Sea, causing higher mortality in the south and hence, an ‘apparent’ distribution shift
– Other possible drivers include eutrophication, habitat modification
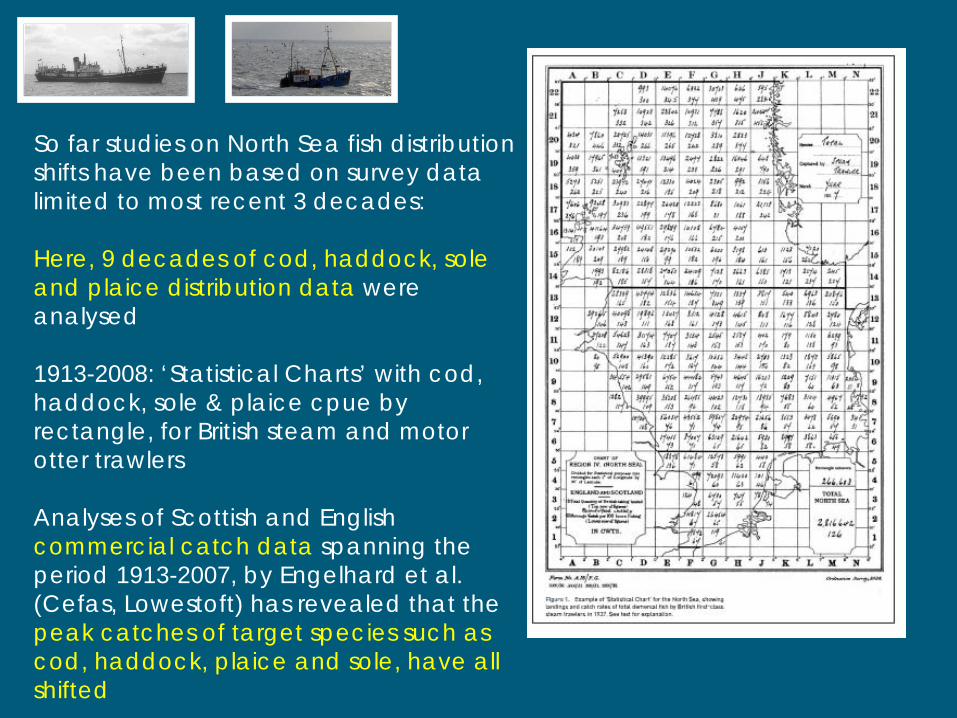
So far studies on North Sea fish distribution shifts have been based on survey data limited to most recent 3 decades:
Here, 9 decades of cod, haddock, sole and plaice distribution data were analysed
1913-2008: ‘Statistical Charts’ with cod, haddock, sole & plaice cpue by rectangle, for British steam and motor otter trawlers
Analyses of Scottish and English commercial catch data spanning the period 1913-2007, by Engelhard et al. (Cefas, Lowestoft) has revealed that the peak catches of target species such as cod, haddock, plaice and sole, have all shifted
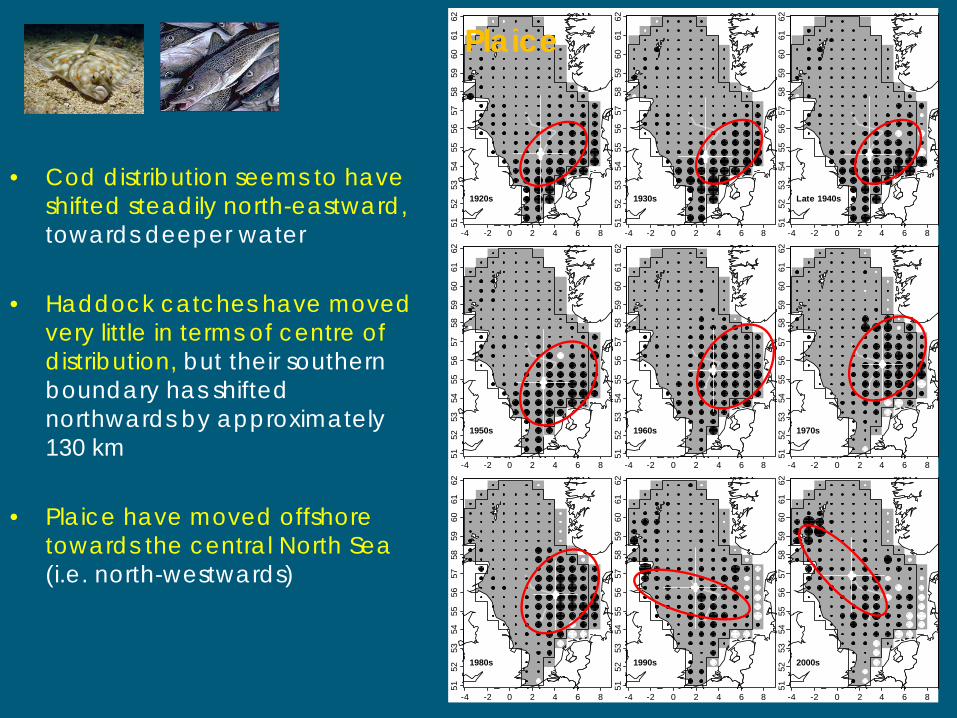
• Cod distribution seems to have shifted steadily north-eastward, towards deeper water
• Haddock catches have moved very little in terms of centre of distribution, but their southern boundary has shifted northwards by approximately 130 km
• Plaice have moved offshore towards the central North Sea (i.e. north-westwards)
-4 -2 0 2 4 6 8
5152
5354
5556
5758
5960
6162
1920s
-4 -2 0 2 4 6 8
5152
5354
5556
5758
5960
6162
1930s
-4 -2 0 2 4 6 8
5152
5354
5556
5758
5960
6162
Late 1940s
-4 -2 0 2 4 6 851
5253
5455
5657
5859
6061
62
1950s
-4 -2 0 2 4 6 8
5152
5354
5556
5758
5960
6162
1960s
-4 -2 0 2 4 6 8
5152
5354
5556
5758
5960
6162
1970s
-4 -2 0 2 4 6 8
5152
5354
5556
5758
5960
6162
1980s
-4 -2 0 2 4 6 8
5152
5354
5556
5758
5960
6162
1990s
-4 -2 0 2 4 6 8
5152
5354
5556
5758
5960
6162
2000s
Plaice
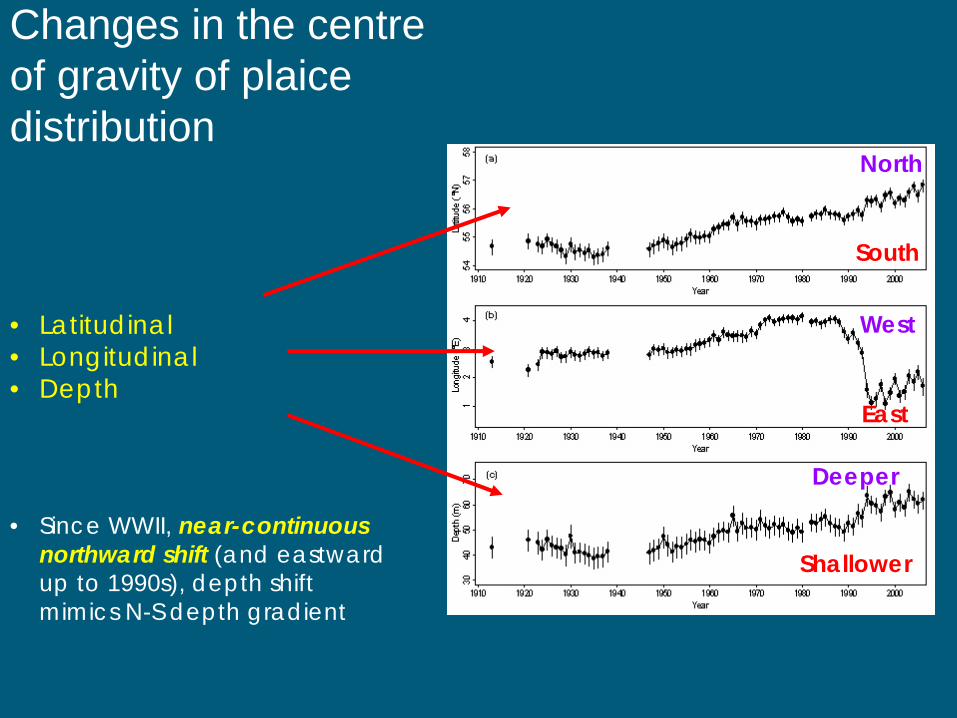
Changes in the centre of gravity of plaice distribution
• Latitudinal• Longitudinal• Depth
• Since WWII, near-continuous northward shift (and eastward up to 1990s), depth shift mimics N-S depth gradient
North
West
Deeper
South
East
Shallower
-4 -2 0 2 4 6 8
5152
5354
5556
5758
5960
6162
1920s
-4 -2 0 2 4 6 8
5152
5354
5556
5758
5960
6162
1930s
-4 -2 0 2 4 6 8
5152
5354
5556
5758
5960
6162
Late 1940s
-4 -2 0 2 4 6 851
5253
5455
5657
5859
6061
62
1950s
-4 -2 0 2 4 6 8
5152
5354
5556
5758
5960
6162
1960s
-4 -2 0 2 4 6 8
5152
5354
5556
5758
5960
6162
1970s
-4 -2 0 2 4 6 8
5152
5354
5556
5758
5960
6162
1980s
-4 -2 0 2 4 6 8
5152
5354
5556
5758
5960
6162
1990s
-4 -2 0 2 4 6 8
5152
5354
5556
5758
5960
6162
2000s
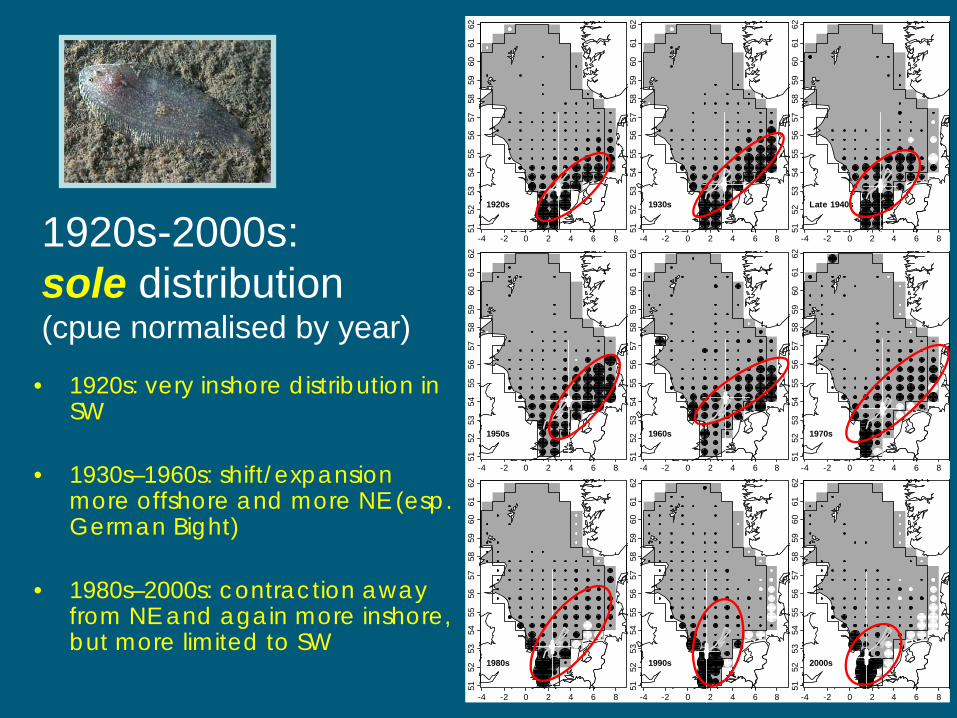
1920s-2000s: sole distribution (cpue normalised by year)
• 1920s: very inshore distribution in SW
• 1930s–1960s: shift/expansion more offshore and more NE (esp. German Bight)
• 1980s–2000s: contraction away from NE and again more inshore, but more limited to SW
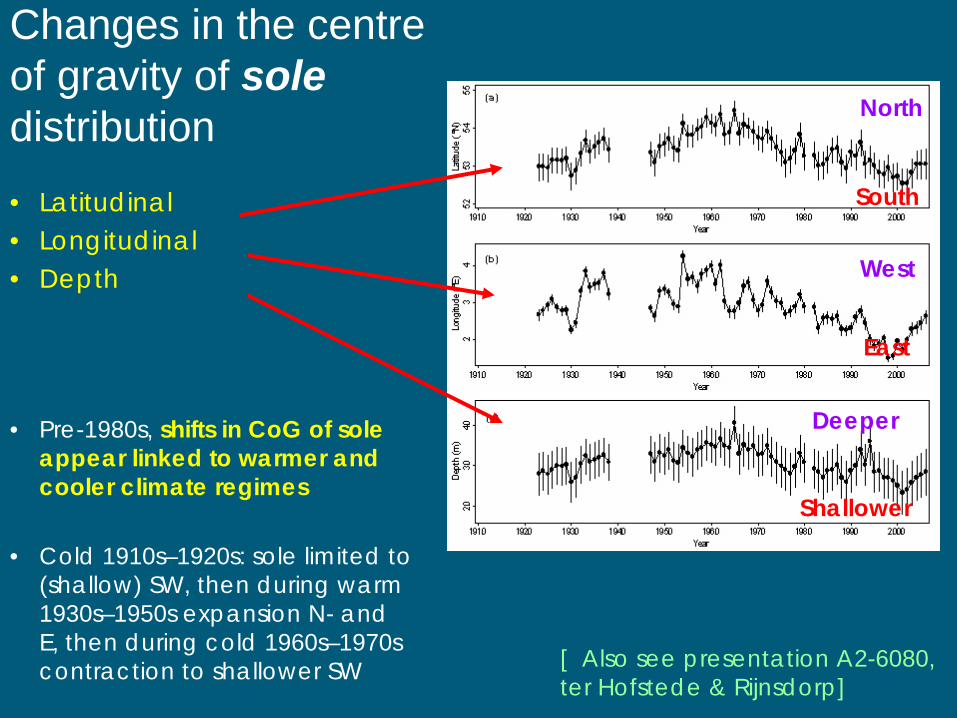
Changes in the centre of gravity of sole distribution• Latitudinal• Longitudinal• Depth
• Pre-1980s, shifts in CoG of sole appear linked to warmer and cooler climate regimes
• Cold 1910s–1920s: sole limited to (shallow) SW, then during warm 1930s–1950s expansion N- and E, then during cold 1960s–1970s contraction to shallower SW
North
West
Deeper
South
East
Shallower
[ Also see presentation A2-6080, ter Hofstede & Rijnsdorp]
7
8
9
10
11
12
13
14
1890 1910 1930 1950 1970 1990 2010
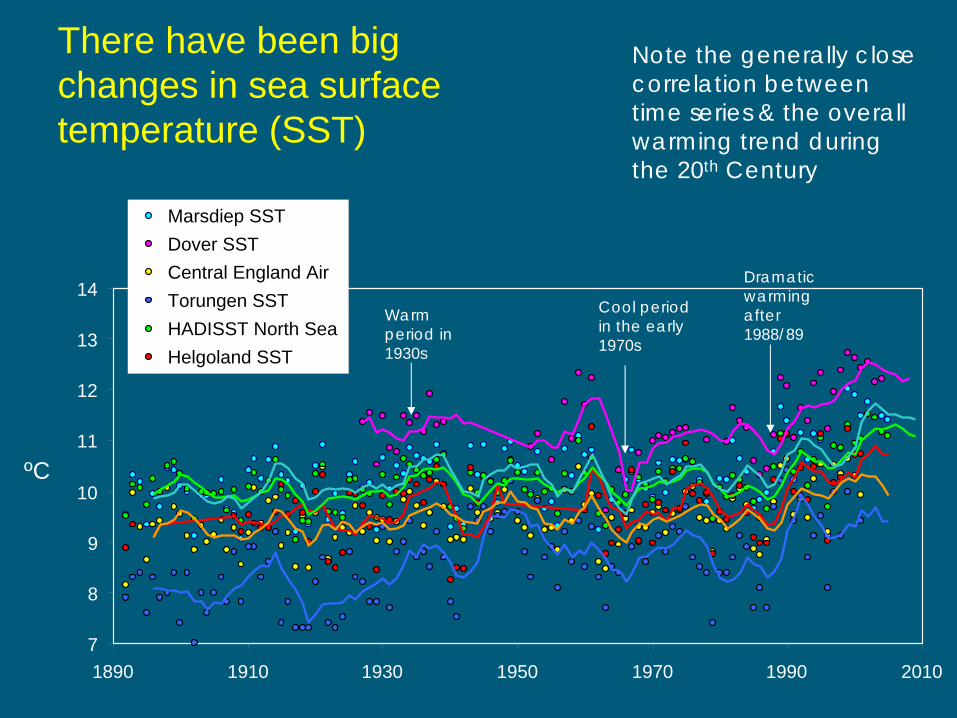
Marsdiep SSTDover SSTCentral England AirTorungen SSTHADISST North SeaHelgoland SST
Cool period in the early 1970s
Dramatic warming after 1988/89
Warm period in 1930s
ºC
Note the generally close correlation between time series & the overall warming trend during the 20th Century
There have been big changes in sea surface temperature (SST)
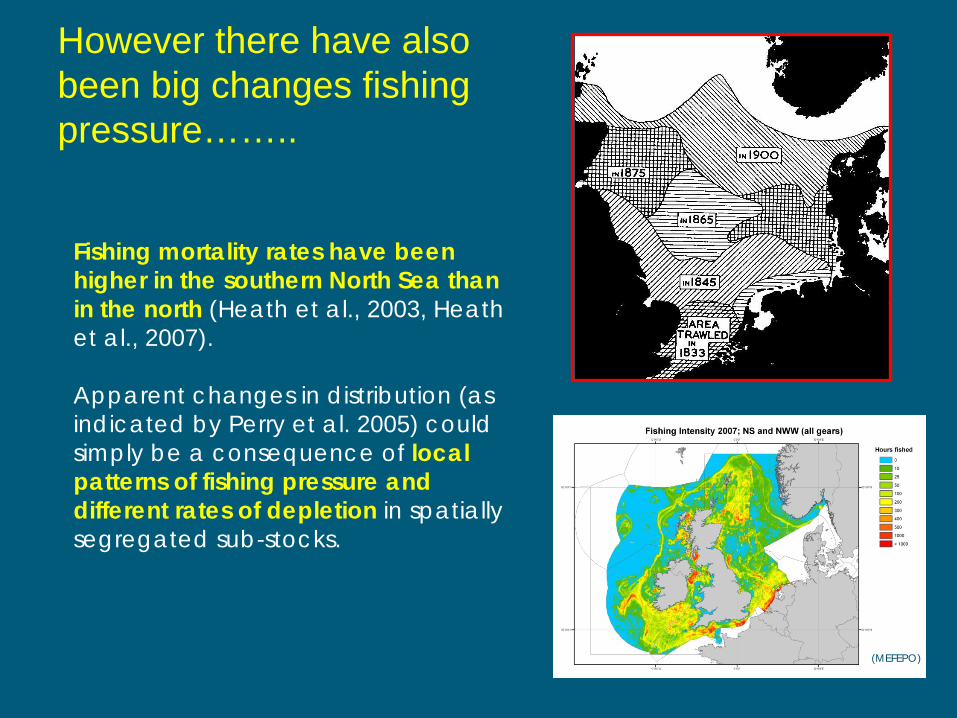
However there have also been big changes fishing pressure……..
Fishing mortality rates have been higher in the southern North Sea than in the north (Heath et al., 2003, Heath et al., 2007).
Apparent changes in distribution (as indicated by Perry et al. 2005) could simply be a consequence of local patterns of fishing pressure and different rates of depletion in spatially segregated sub-stocks.
(MEFEPO)
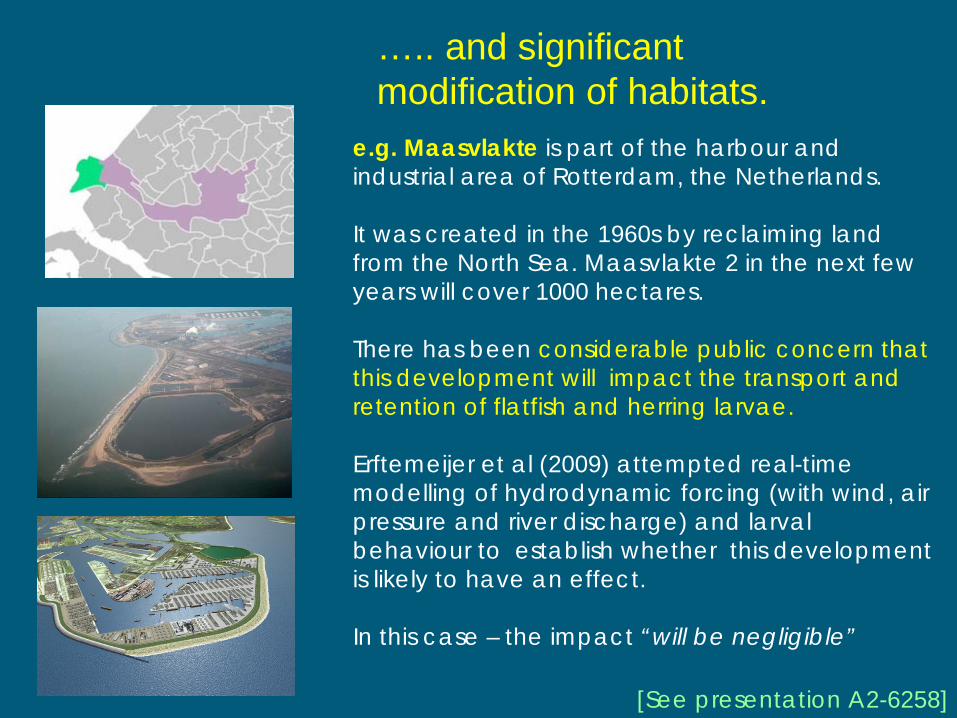
e.g. Maasvlakte is part of the harbour and industrial area of Rotterdam, the Netherlands.
It was created in the 1960s by reclaiming land from the North Sea. Maasvlakte 2 in the next few years will cover 1000 hectares.
There has been considerable public concern that this development will impact the transport and retention of flatfish and herring larvae.
Erftemeijer et al (2009) attempted real-time modelling of hydrodynamic forcing (with wind, air pressure and river discharge) and larval behaviour to establish whether this development is likely to have an effect.
In this case – the impact “will be negligible”
….. and significant modification of habitats.
[See presentation A2-6258]
What will distribution shifts mean for fisheries?
•Populations may move away from (or towards) the area where fishing fleets operate.
•Distribution changes may have significant consequences for the distance that must be travelled by fishing boats to reach the target resources with implications for fuel usage and time at sea.
•Also species distributions may migrate across the boundaries where quotas belong to different nations.
•Species may move outside the boundaries of marine protected areas / fishery closure areas
•Incoming species may be commercially exploitable and therefore offer new opportunities for fisheries.
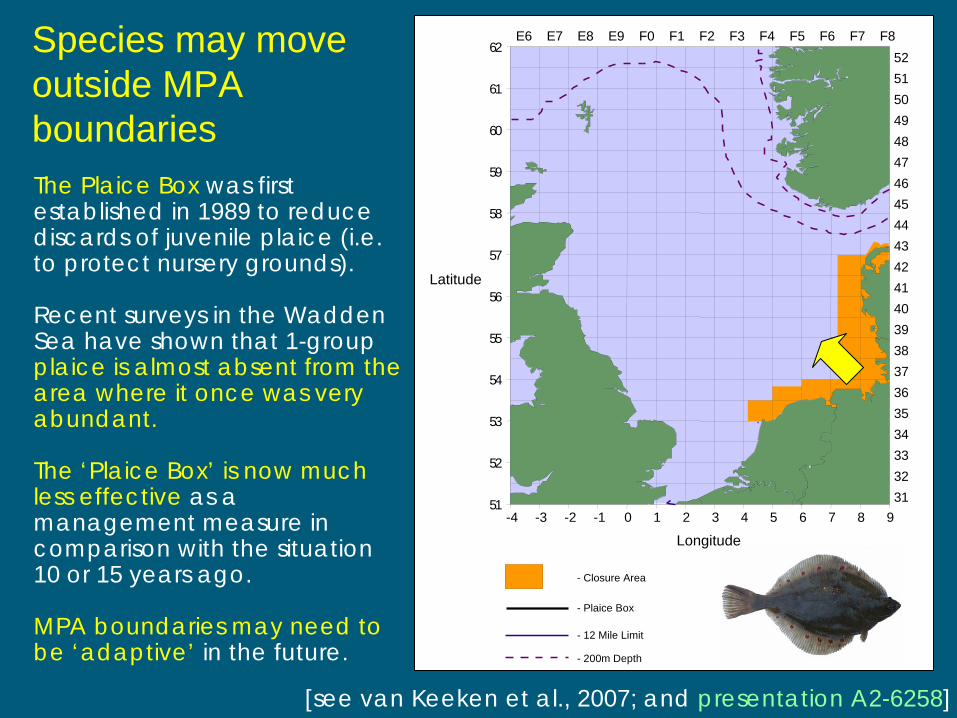
Species may move outside MPA boundaries
E6 E7 E8 E9 F0 F1 F2 F3 F4 F5 F6 F7 F852515049484746454443424140393837363534333231
-4 -3 -2 -1 0 1 2 3 4 5 6 7 8 9
Longitude
51
52
53
54
55
56
57
58
59
60
61
62
- Closure Area
- Plaice Box
- 12 Mile Limit
- 200m Depth
Latitude
The Plaice Box was first established in 1989 to reduce discards of juvenile plaice (i.e. to protect nursery grounds).
Recent surveys in the Wadden Sea have shown that 1-group plaice is almost absent from the area where it once was very abundant.
The ‘Plaice Box’ is now much less effective as a management measure in comparison with the situation 10 or 15 years ago.
MPA boundaries may need to be ‘adaptive’ in the future.
[see van Keeken et al., 2007; and presentation A2-6258]
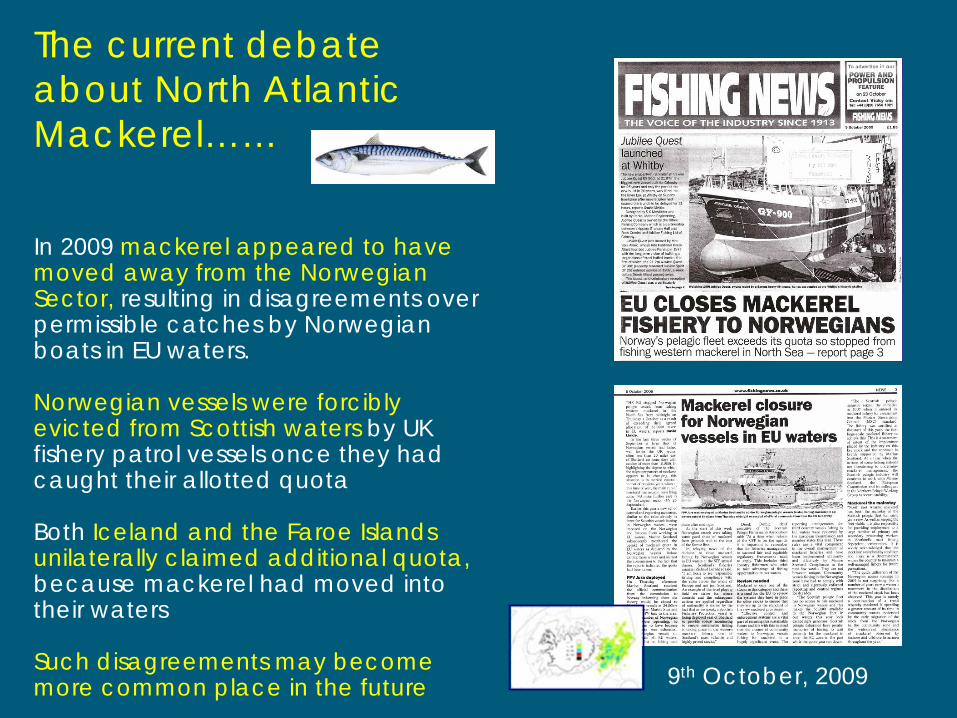
The current debate about North Atlantic Mackerel……
In 2009 mackerel appeared to have moved away from the Norwegian Sector, resulting in disagreements over permissible catches by Norwegian boats in EU waters.
Norwegian vessels were forcibly evicted from Scottish waters by UK fishery patrol vessels once they had caught their allotted quota
Both Iceland and the Faroe Islands unilaterally claimed additional quota, because mackerel had moved into their waters
Such disagreements may become more common place in the future 9th October, 2009
(a)
0
1000
2000
3000
4000
5000
6000
7000
1973
1975
1977
1979
1981
1983
1985
1987
1989
1991
1993
1995
1997
1999
2001
2003
2005
Portugal Spain
Netherlands UK
France Other
(b)
0
1000
2000
3000
4000
5000
6000
7000
1973
1976
1979
1982
1985
1988
1991
1994
1997
2000
2003
Azores Portuguese coast
Biscay Celtic Seas
West of Scotland North Sea
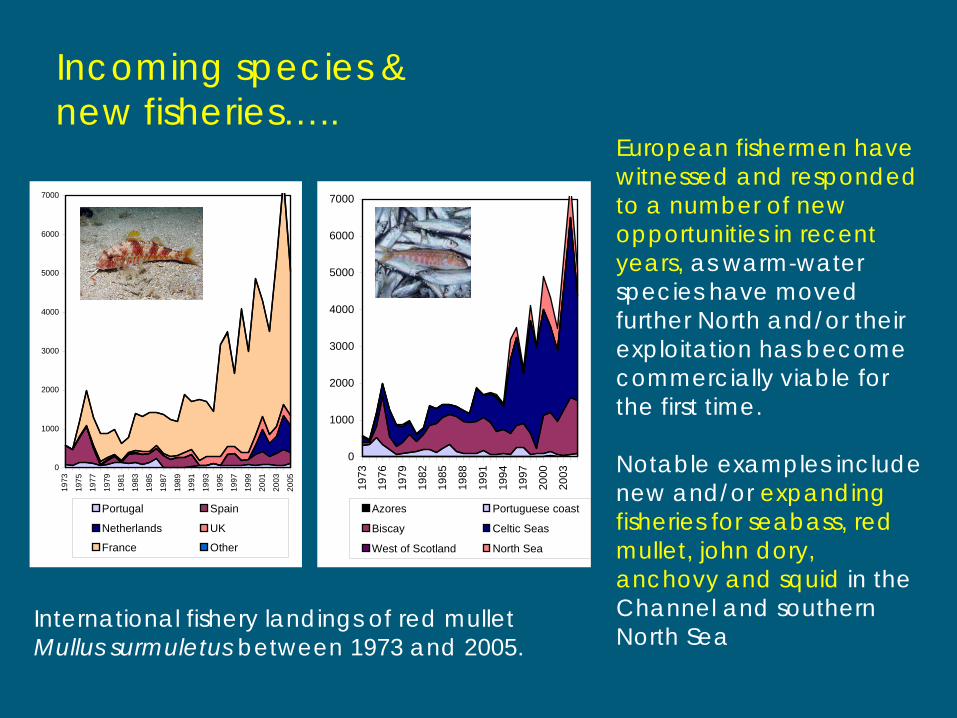
Incoming species & new fisheries…..
European fishermen have witnessed and responded to a number of new opportunities in recent years, as warm-water species have moved further North and/or their exploitation has become commercially viable for the first time.
Notable examples include new and/or expanding fisheries for seabass, red mullet, john dory, anchovy and squid in the Channel and southern North Sea
International fishery landings of red mullet Mullus surmuletus between 1973 and 2005.
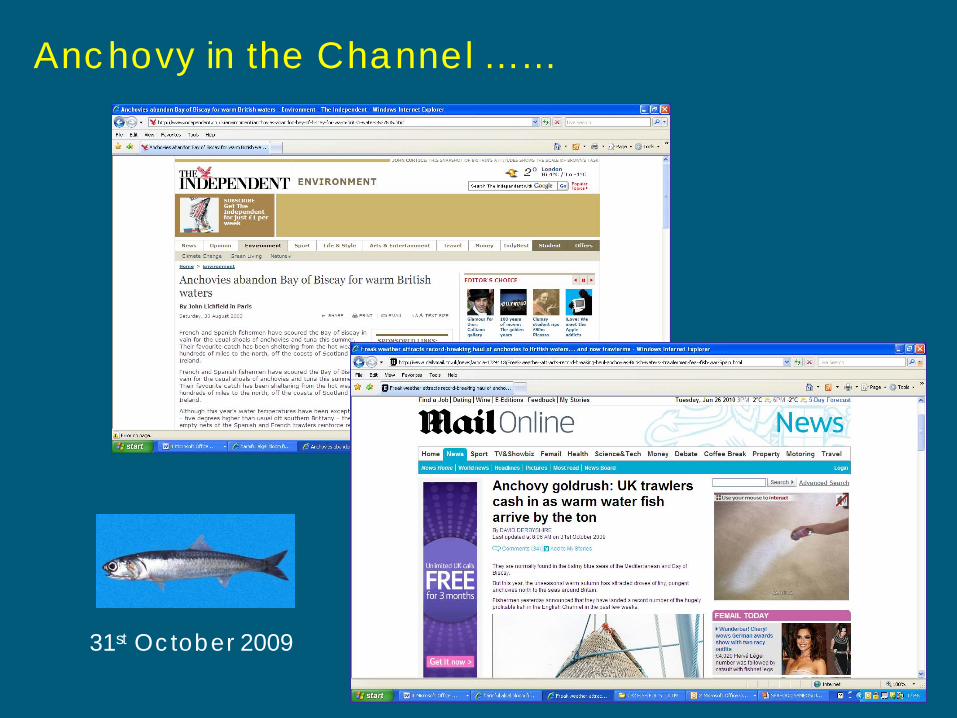
Anchovy in the Channel ……
31st October 2009
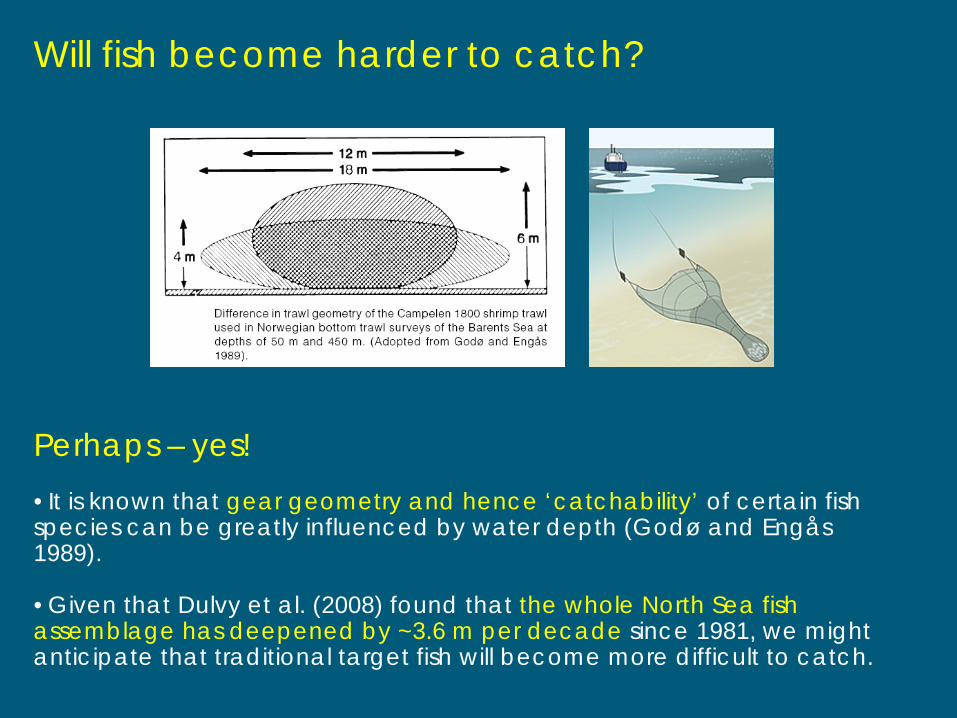
Will fish become harder to catch?
Perhaps – yes!•It is known that gear geometry and hence ‘catchability’ of certain fish species can be greatly influenced by water depth (Godø and Engås 1989).
•Given that Dulvy et al. (2008) found that the whole North Sea fish assemblage has deepened by ~3.6 m per decade since 1981, we might anticipate that traditional target fish will become more difficult to catch.
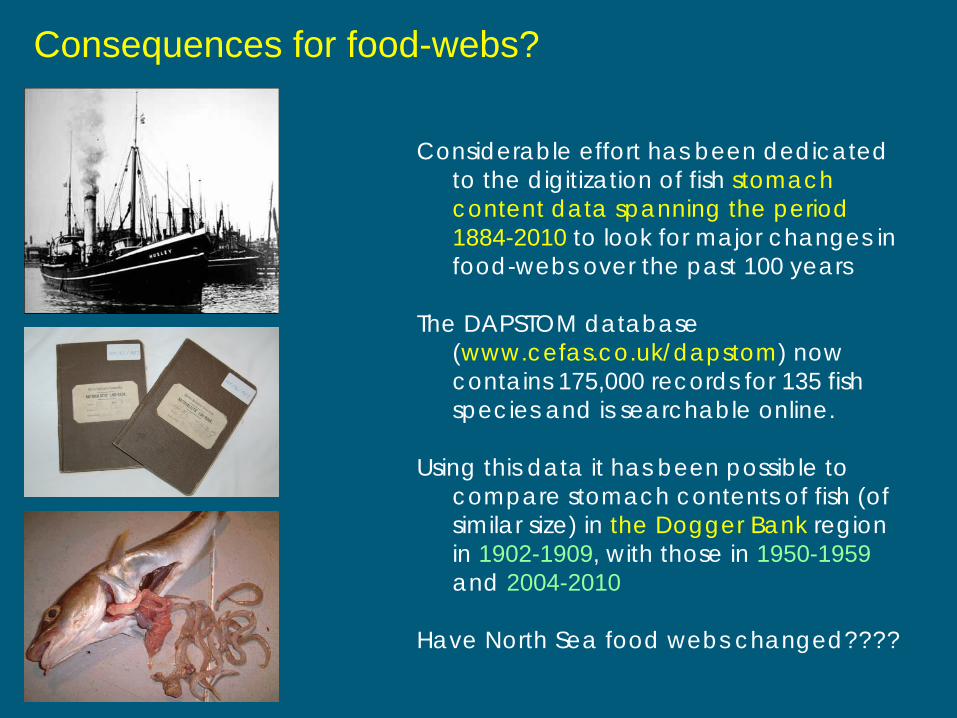
Consequences for food-webs?
Considerable effort has been dedicated to the digitization of fish stomach content data spanning the period 1884-2010 to look for major changes in food-webs over the past 100 years
The DAPSTOM database (www.cefas.co.uk/dapstom) now contains 175,000 records for 135 fish species and is searchable online.
Using this data it has been possible to compare stomach contents of fish (of similar size) in the Dogger Bank region in 1902-1909, with those in 1950-1959 and 2004-2010
Have North Sea food webs changed????
Plaice
Haddock
Cod
Dab
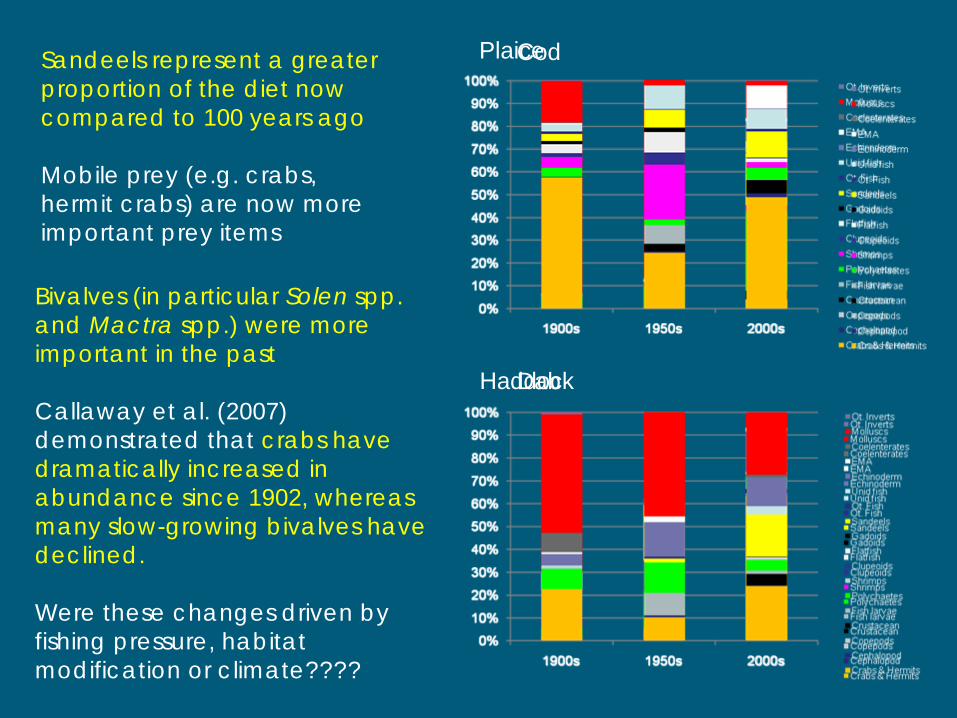
Sandeels represent a greater proportion of the diet now compared to 100 years ago
Mobile prey (e.g. crabs, hermit crabs) are now more important prey items
Bivalves (in particular Solen spp. and Mactra spp.) were more important in the past
Callaway et al. (2007) demonstrated that crabs have dramatically increased in abundance since 1902, whereas many slow-growing bivalves have declined.
Were these changes driven by fishing pressure, habitat modification or climate????
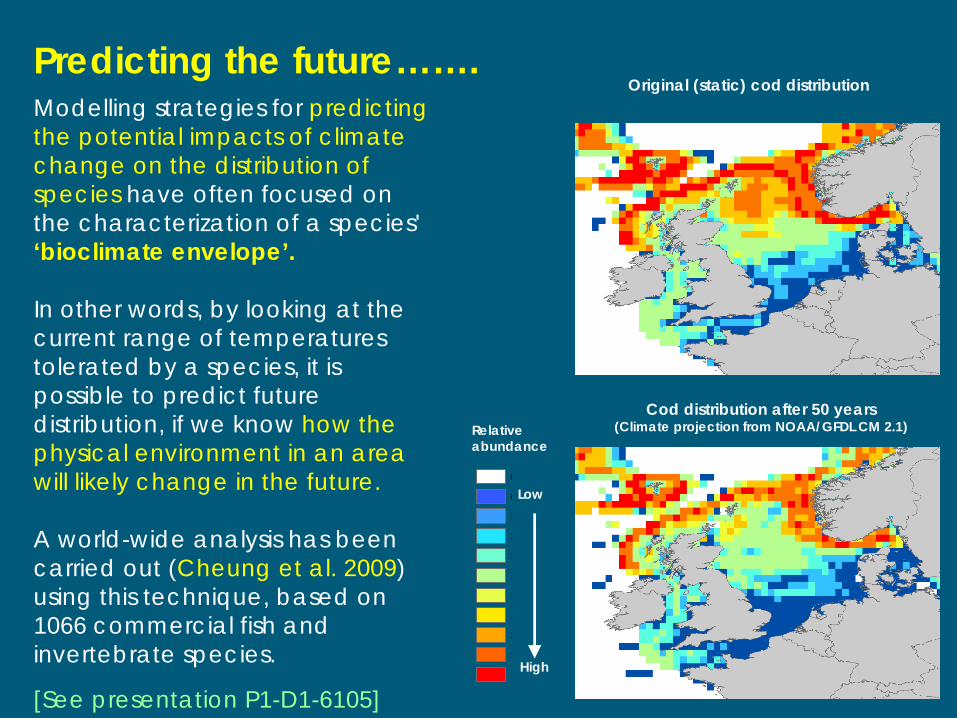
Original (static) cod distribution
0
0
>
>
>
>
>
>
>
>
>
Low
High
Relative abundance
Cod distribution after 50 years (Climate projection from NOAA/GFDL CM 2.1)
Modelling strategies for predicting the potential impacts of climate change on the distribution of species have often focused on the characterization of a species' ‘bioclimate envelope’.
In other words, by looking at the current range of temperatures tolerated by a species, it is possible to predict future distribution, if we know how the physical environment in an area will likely change in the future.
A world-wide analysis has been carried out (Cheung et al. 2009) using this technique, based on 1066 commercial fish and invertebrate species.
Predicting the future…….
[See presentation P1-D1-6105]
Predicting how food-webs might look in the future….
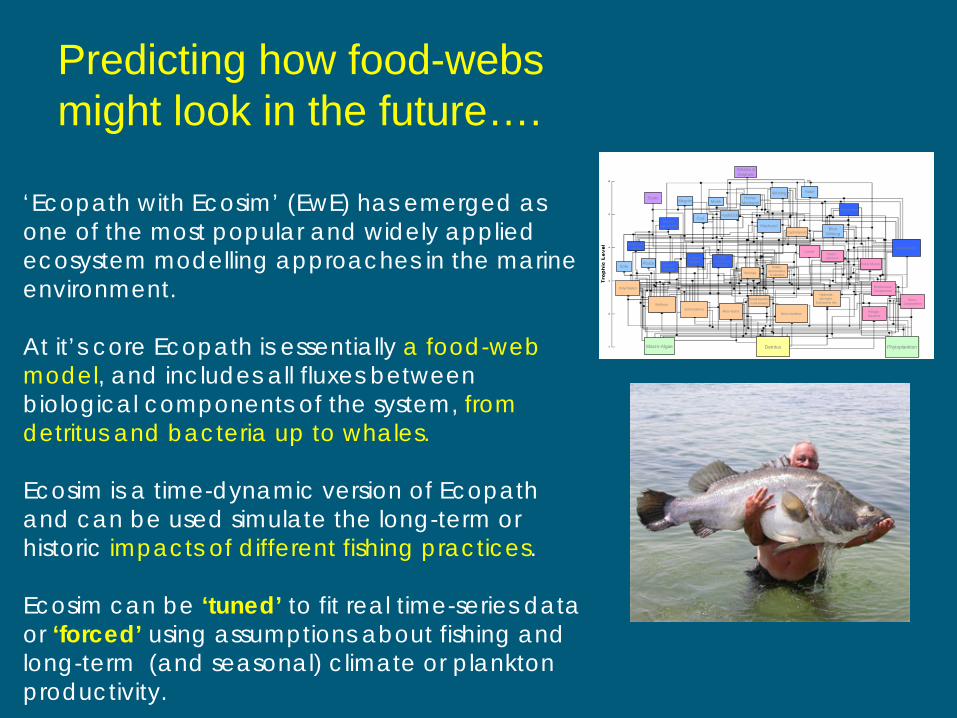
‘Ecopath with Ecosim’ (EwE) has emerged as one of the most popular and widely applied ecosystem modelling approaches in the marine environment.
At it’s core Ecopath is essentially a food-web model, and includes all fluxes between biological components of the system, from detritus and bacteria up to whales.
Ecosim is a time-dynamic version of Ecopath and can be used simulate the long-term or historic impacts of different fishing practices.
Ecosim can be ‘tuned’ to fit real time-series data or ‘forced’ using assumptions about fishing and long-term (and seasonal) climate or plankton productivity.
HakeWhiting
Monk
HaddockCod
Megrim
PlaiceSole
Mackerel
Horse Mackerel
BlueWhiting
Whales &Dolphins
Seals
Macro-carnivores
Piscivores
Planktivores
Small-crustacean
feeders
Echinod-feeders
Mollusc-feeders
Polychaete- feeders
LarvaeMacro-
plankton
Krill & Mysids
Herbivorous-Zooplankton
Micro-Zooplankton
Pelagic-Bacteria
PhytoplanktonMacro-Algae
Polychaetes
MolluscsEchinoderms Meio-fauna
Shrimps
Small-benthiccrustaceans
Crabs, anomurans & lobsters
Hydroids, sponges,
bryozoans etc.
Micro-benthos
Cephalopods
Detritus
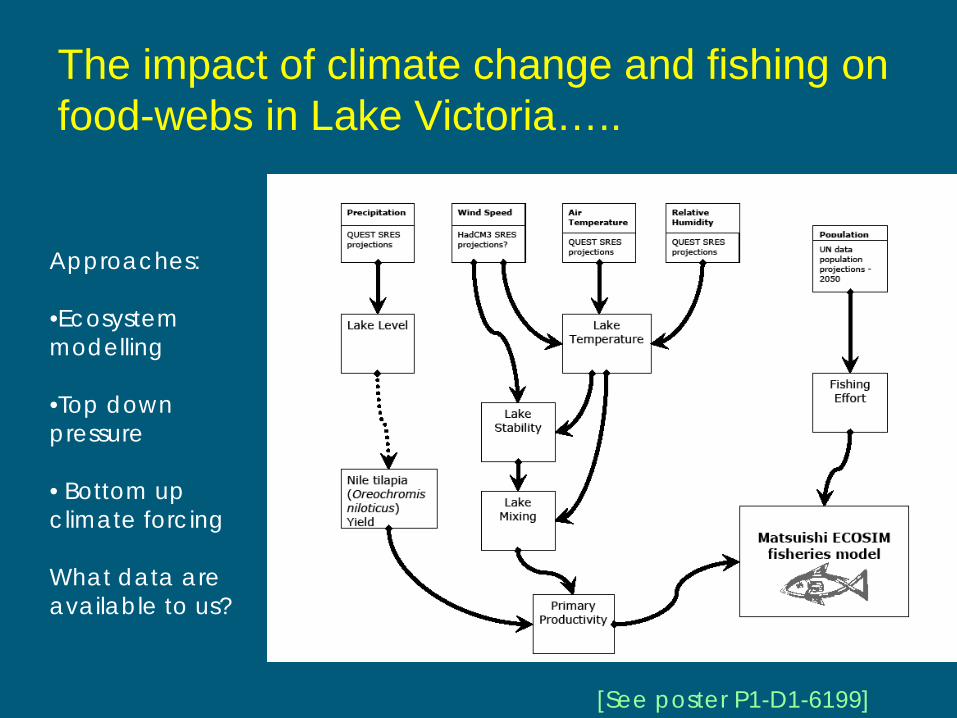
Approaches:
•Ecosystem modelling
•Top down pressure
• Bottom up climate forcing
What data are available to us?
The impact of climate change and fishing on food-webs in Lake Victoria…..
[See poster P1-D1-6199]
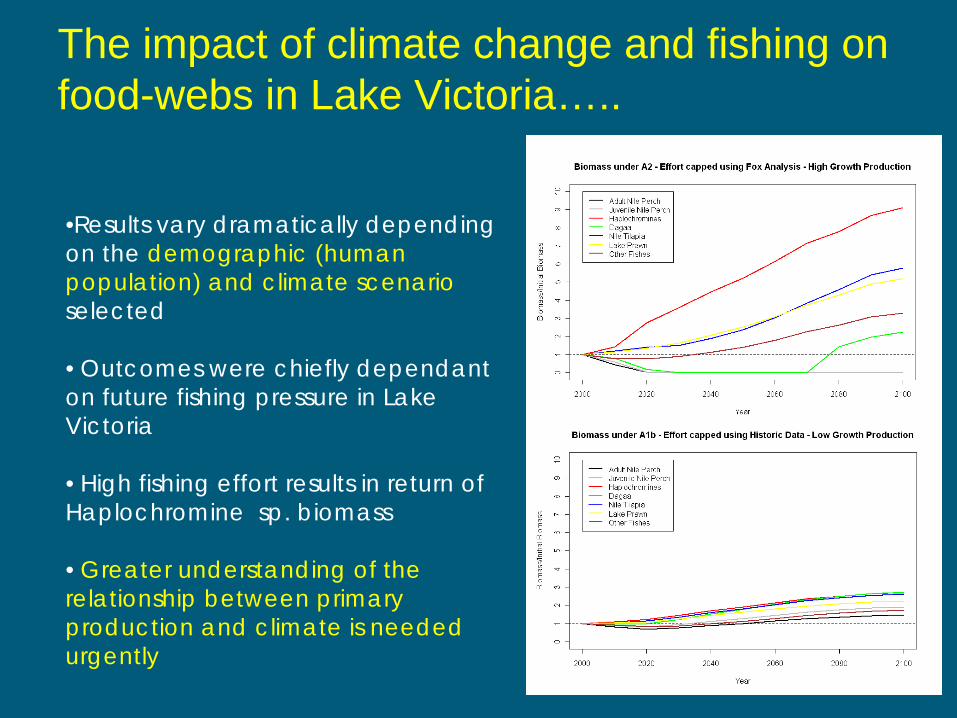
•Results vary dramatically depending on the demographic (human population) and climate scenario selected
• Outcomes were chiefly dependant on future fishing pressure in Lake Victoria
• High fishing effort results in return of Haplochromine sp. biomass
• Greater understanding of the relationship between primary production and climate is needed urgently
The impact of climate change and fishing on food-webs in Lake Victoria…..
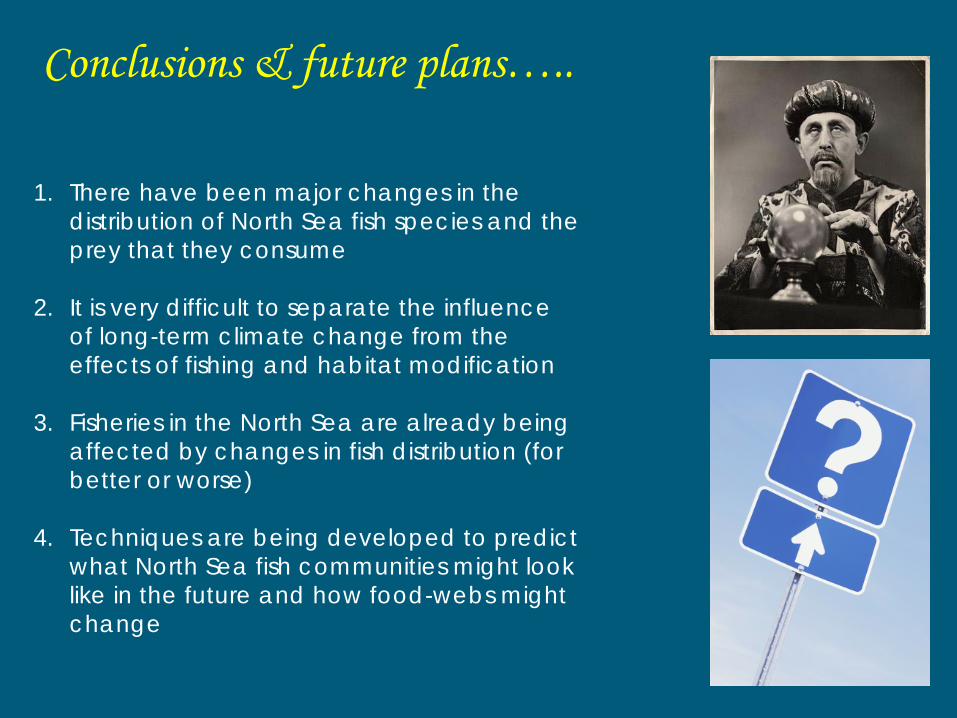
Conclusions & future plans…..
1. There have been major changes in the distribution of North Sea fish species and the prey that they consume
2. It is very difficult to separate the influence of long-term climate change from the effects of fishing and habitat modification
3. Fisheries in the North Sea are already being affected by changes in fish distribution (for better or worse)
4. Techniques are being developed to predict what North Sea fish communities might look like in the future and how food-webs might change
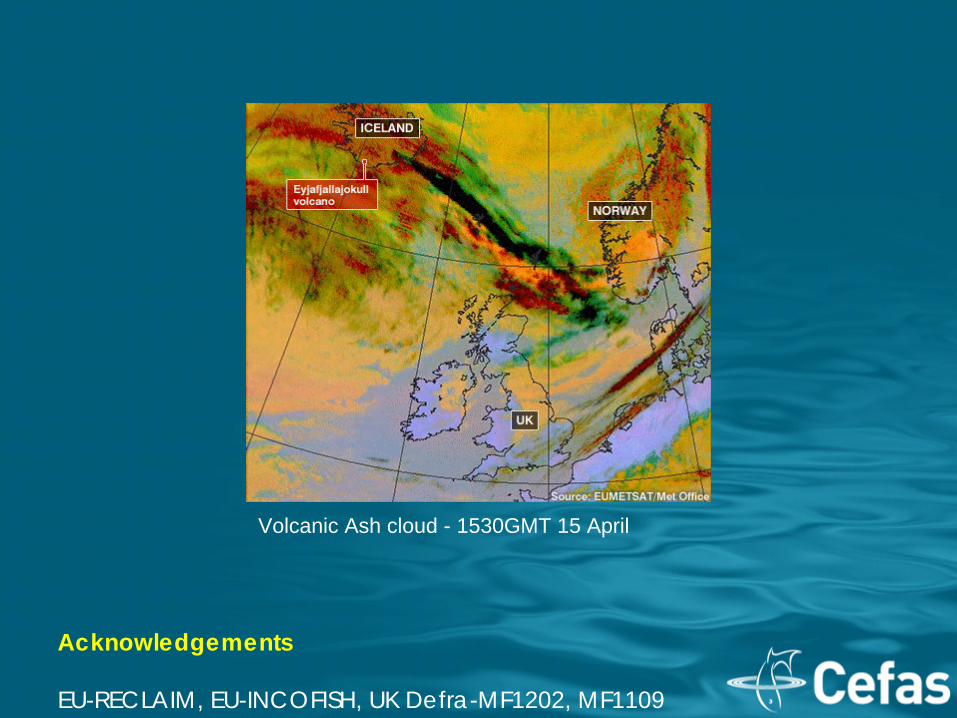
Volcanic Ash cloud - 1530GMT 15 April
Acknowledgements
EU-RECLAIM, EU-INCOFISH, UK Defra-MF1202, MF1109