Embed Size (px)
Citation preview
HARMFUL ALGAL BLOOMSGLOBAL SPREADING OR GLOBAL SYNCHRONY?
Ted Smayda
PICES
“Do links exist between the apparent increase in the duration, distribution and impact of HABs,
and environmental factors associated with human activities, including urban and agricultural runoff,
climatic change and mariculture? “
PICES
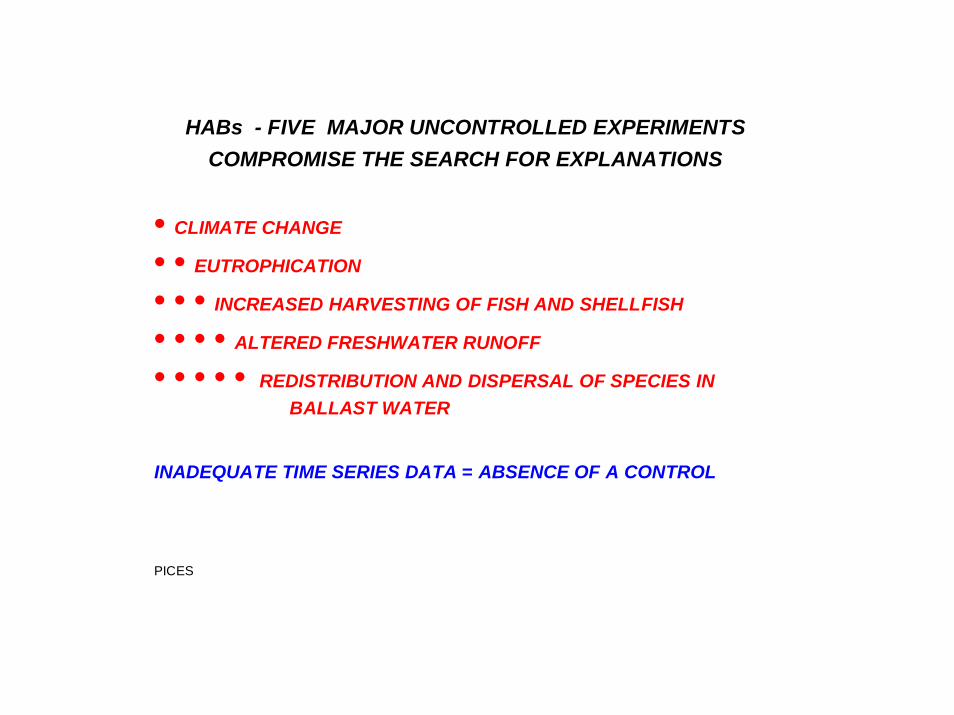
HABs - FIVE MAJOR UNCONTROLLED EXPERIMENTS COMPROMISE THE SEARCH FOR EXPLANATIONS
• CLIMATE CHANGE
• • EUTROPHICATION
• • • INCREASED HARVESTING OF FISH AND SHELLFISH
• • • • ALTERED FRESHWATER RUNOFF
• • • • • REDISTRIBUTION AND DISPERSAL OF SPECIES IN BALLAST WATER
INADEQUATE TIME SERIES DATA = ABSENCE OF A CONTROL PICES
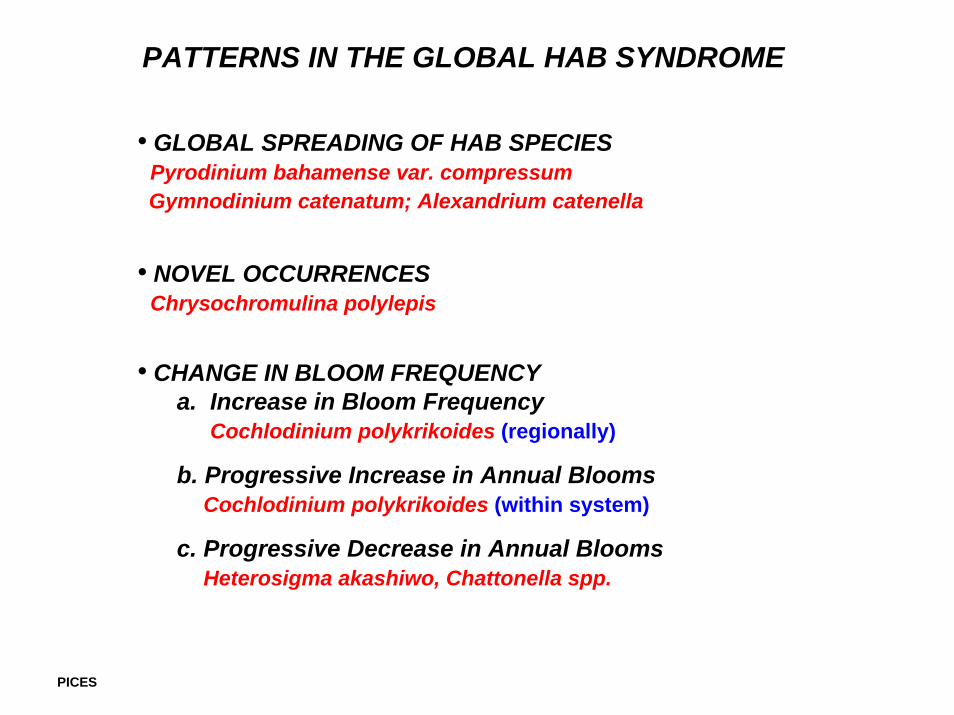
PATTERNS IN THE GLOBAL HAB SYNDROME
• GLOBAL SPREADING OF HAB SPECIESPyrodinium bahamense var. compressumGymnodinium catenatum; Alexandrium catenella
• NOVEL OCCURRENCES Chrysochromulina polylepis
• CHANGE IN BLOOM FREQUENCYa. Increase in Bloom Frequency
Cochlodinium polykrikoides (regionally)
b. Progressive Increase in Annual Blooms Cochlodinium polykrikoides (within system)
c. Progressive Decrease in Annual Blooms Heterosigma akashiwo, Chattonella spp.
PICES
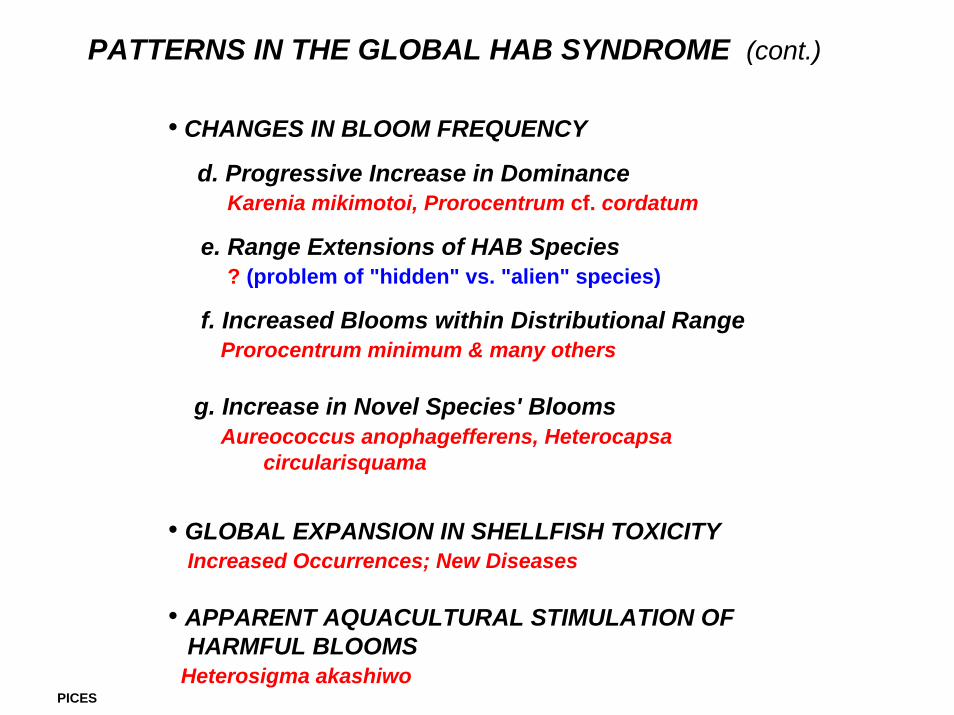
• CHANGES IN BLOOM FREQUENCY
d. Progressive Increase in Dominance Karenia mikimotoi, Prorocentrum cf. cordatum
e. Range Extensions of HAB Species ? (problem of "hidden" vs. "alien" species)
f. Increased Blooms within Distributional Range Prorocentrum minimum & many others
g. Increase in Novel Species' Blooms Aureococcus anophagefferens, Heterocapsa
circularisquama
• GLOBAL EXPANSION IN SHELLFISH TOXICITYIncreased Occurrences; New Diseases
• APPARENT AQUACULTURAL STIMULATION OF HARMFUL BLOOMS
Heterosigma akashiwo
PATTERNS IN THE GLOBAL HAB SYNDROME (cont.)
PICES
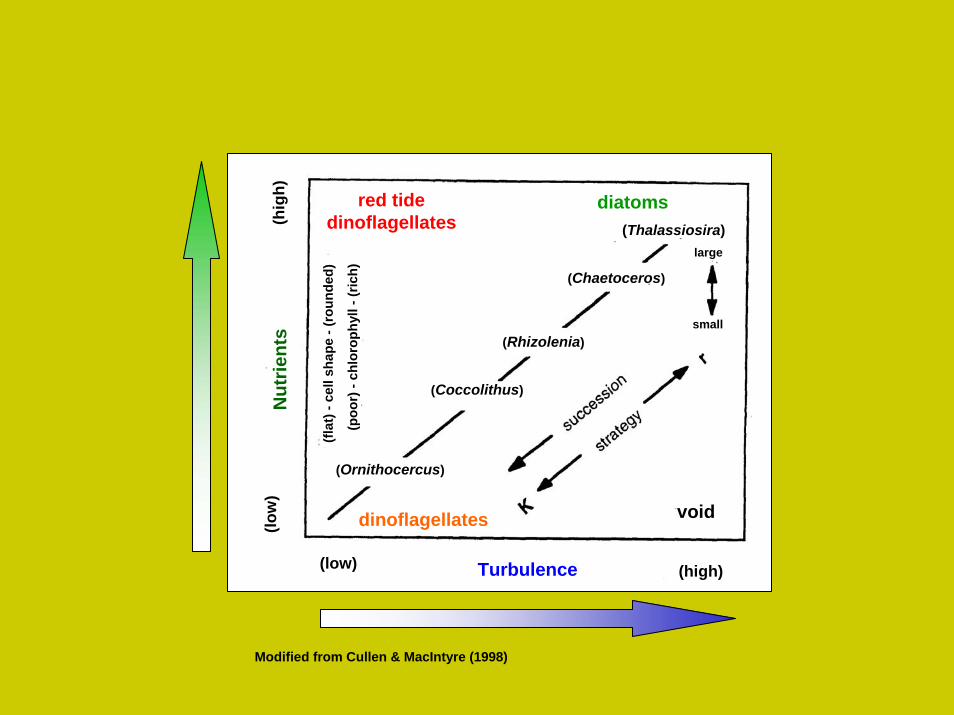
red tidedinoflagellates
diatoms
dinoflagellates
Modified from Cullen & MacIntyre (1998)
(Thalassiosira)
(Chaetoceros)
(Rhizolenia)
(Coccolithus)
(Ornithocercus)
large
small
void
Turbulence (high)(low)
(low
)(h
igh)
Nut
rient
s
(flat
) -ce
ll sh
ape
-(ro
unde
d)
(poo
r) -
chlo
roph
yll -
(ric
h)
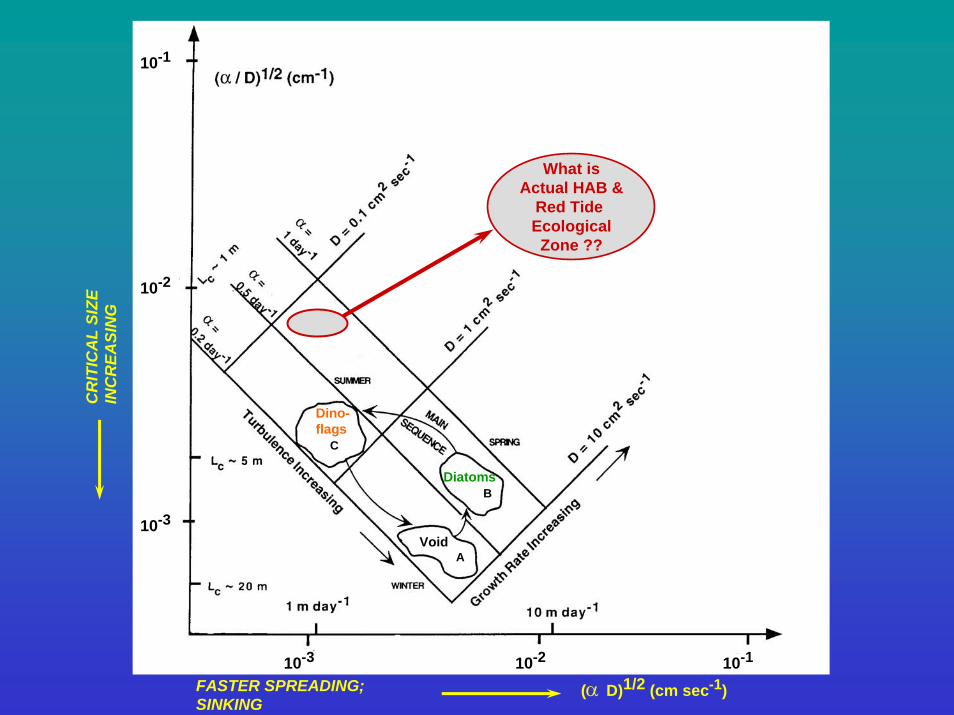
10-1
10-2
10-3
10-3 10-2 10-1
FASTER SPREADING; SINKING
(α D)1/2 (cm sec-1)
CR
ITIC
AL
SIZE
IN
CR
EASI
NG Red
TidesD
Dino-flags
Diatoms
C
B
AVoid
What isActual HAB &
Red Tide EcologicalZone ??
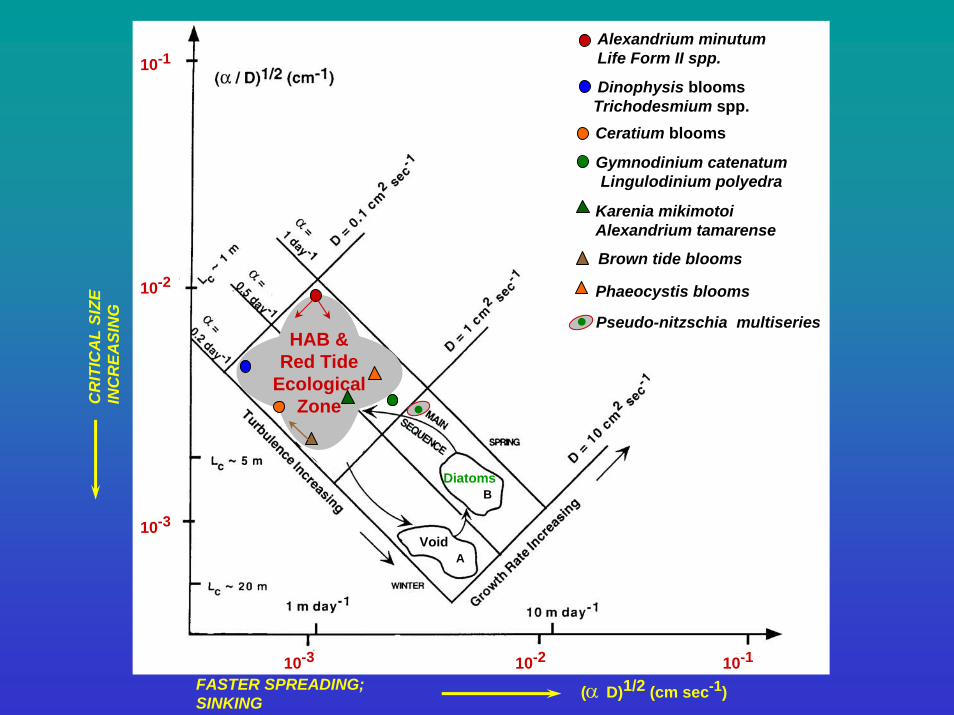
10-1
10-2
10-3
10-3 10-2 10-1
FASTER SPREADING;SINKING
(α D)1/2 (cm sec-1)
CR
ITIC
AL
SIZE
IN
CR
EASI
NG Red
TidesD
DiatomsB
AVoid
HAB &Red Tide
EcologicalZone
Alexandrium minutumLife Form II spp.
Dinophysis bloomsTrichodesmium spp.Ceratium blooms
Gymnodinium catenatumLingulodinium polyedra
Karenia mikimotoiAlexandrium tamarense
Brown tide blooms
Phaeocystis blooms
Pseudo-nitzschia multiseries
Periodic Table of the Elements
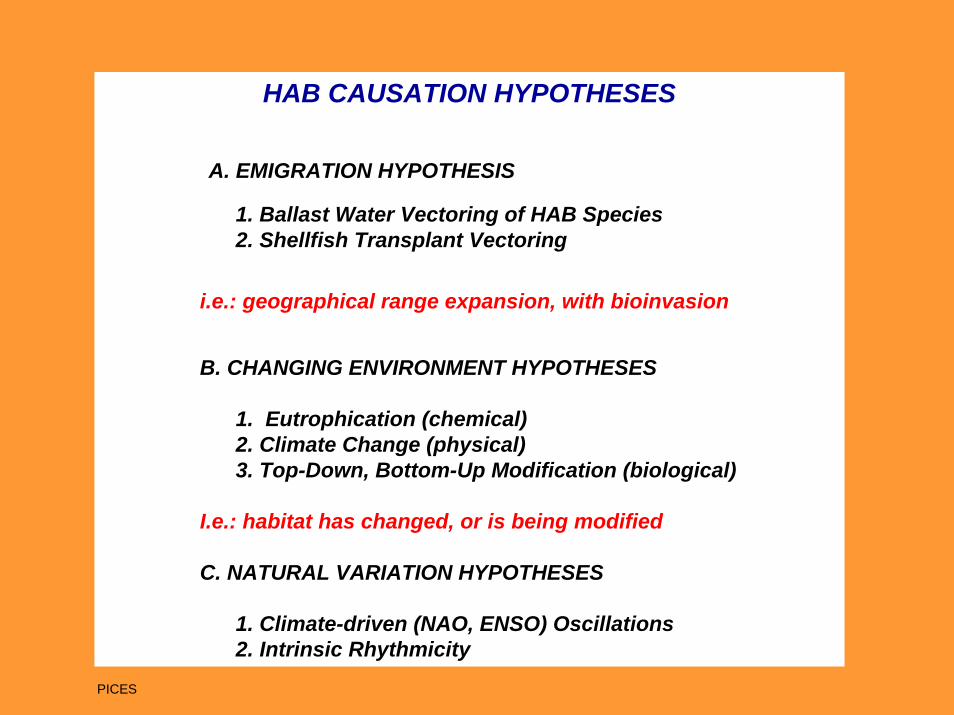
HAB CAUSATION HYPOTHESES
A. EMIGRATION HYPOTHESIS
1. Ballast Water Vectoring of HAB Species2. Shellfish Transplant Vectoring
i.e.: geographical range expansion, with bioinvasion
B. CHANGING ENVIRONMENT HYPOTHESES
1. Eutrophication (chemical)2. Climate Change (physical)3. Top-Down, Bottom-Up Modification (biological)
I.e.: habitat has changed, or is being modified
C. NATURAL VARIATION HYPOTHESES
1. Climate-driven (NAO, ENSO) Oscillations2. Intrinsic Rhythmicity
PICES
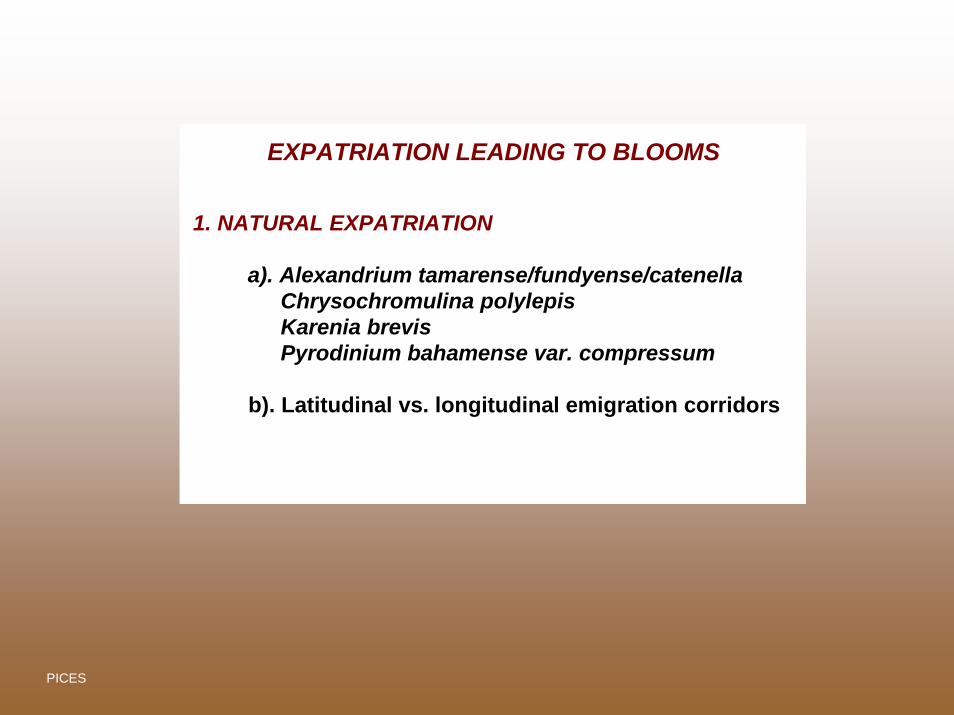
EXPATRIATION LEADING TO BLOOMS 1. NATURAL EXPATRIATION
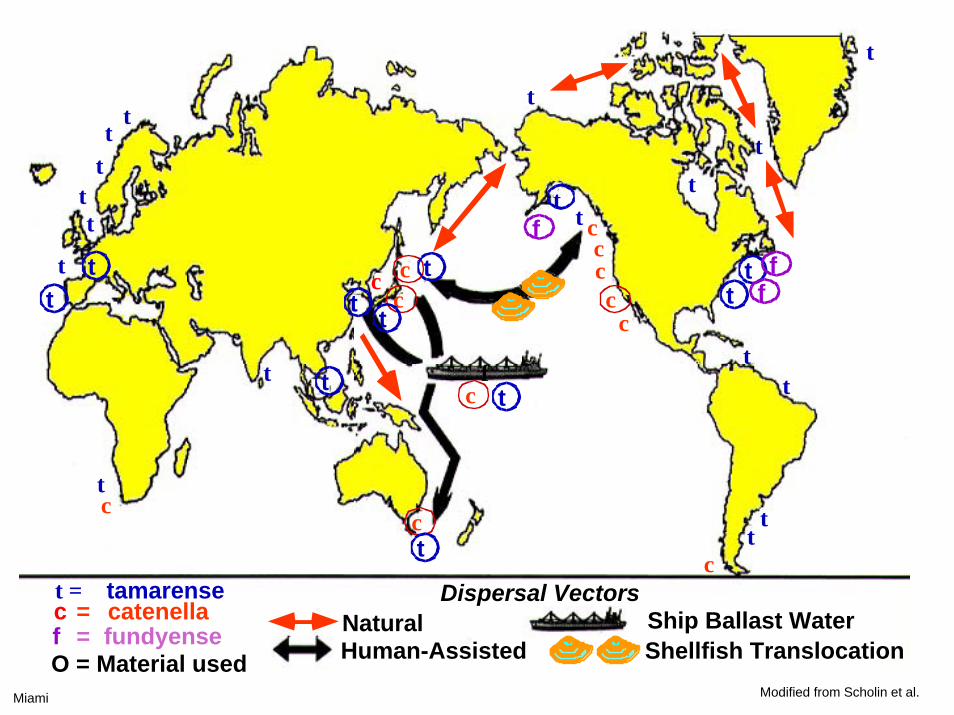
a). Alexandrium tamarense/fundyense/catenella Chrysochromulina polylepis Karenia brevis Pyrodinium bahamense var. compressum
b). Latitudinal vs. longitudinal emigration corridors
PICES
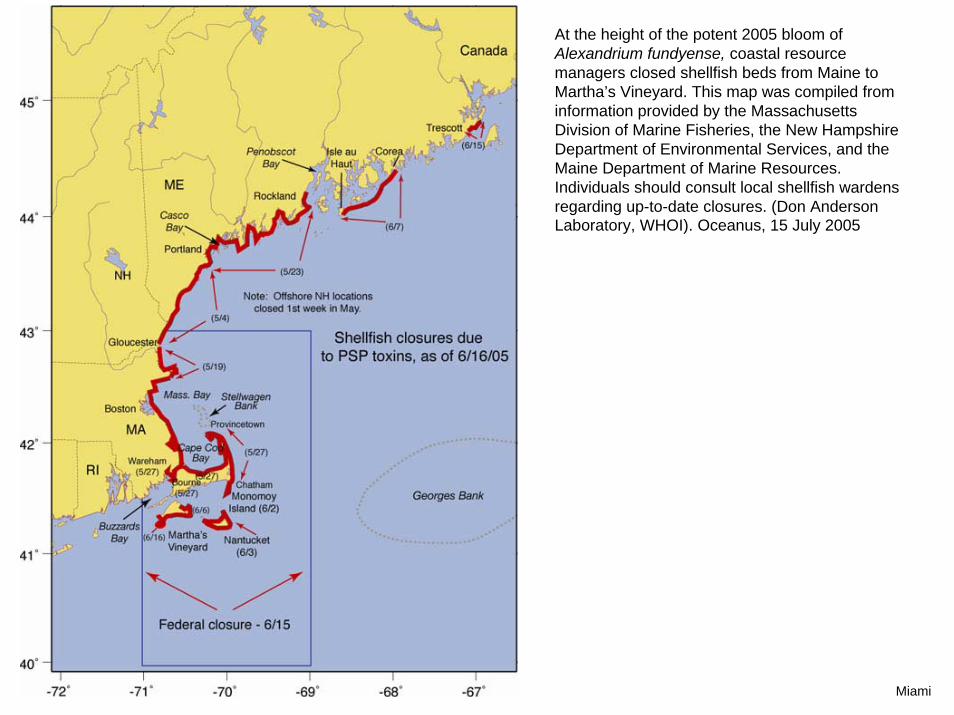
At the height of the potent 2005 bloom of Alexandrium fundyense, coastal resource managers closed shellfish beds from Maine to Martha’s Vineyard. This map was compiled from information provided by the Massachusetts Division of Marine Fisheries, the New Hampshire Department of Environmental Services, and the Maine Department of Marine Resources. Individuals should consult local shellfish wardens regarding up-to-date closures. (Don Anderson Laboratory, WHOI). Oceanus, 15 July 2005
Miami
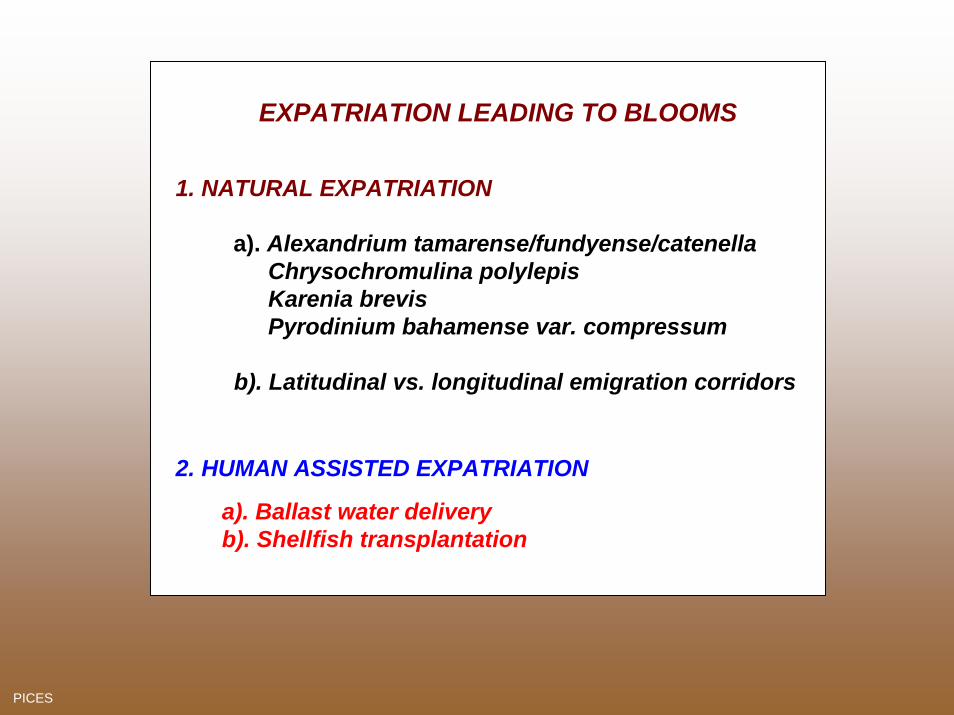
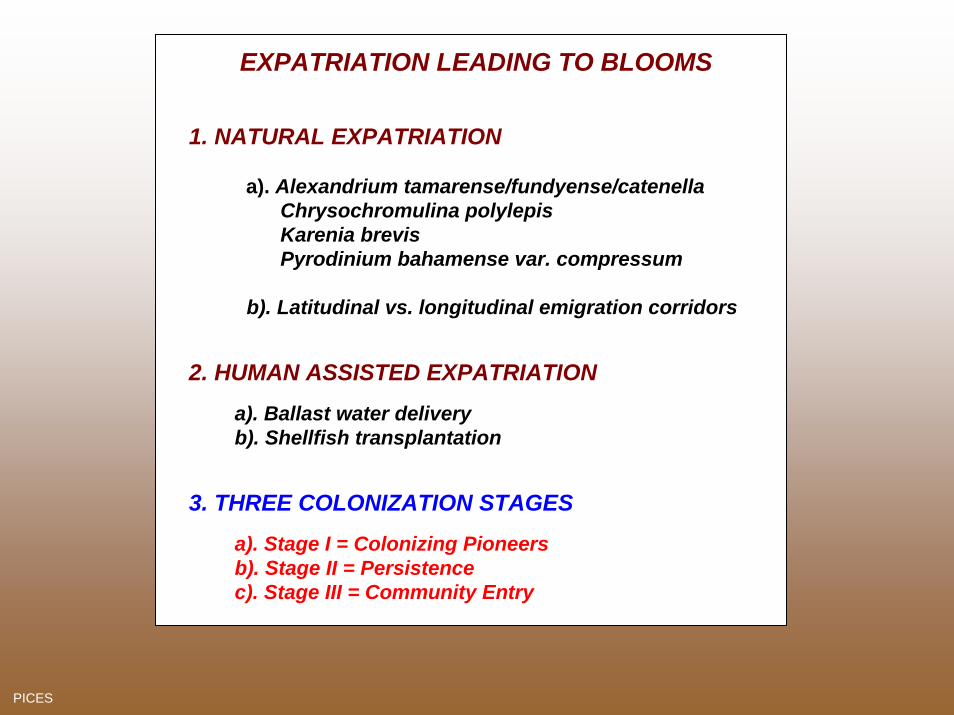
EXPATRIATION LEADING TO BLOOMS
1. NATURAL EXPATRIATION
a). Alexandrium tamarense/fundyense/catenella Chrysochromulina polylepis Karenia brevis Pyrodinium bahamense var. compressum
b). Latitudinal vs. longitudinal emigration corridors
2. HUMAN ASSISTED EXPATRIATION
a). Ballast water delivery b). Shellfish transplantation
PICES
f
ttt
t
t
t
t
t
t
t
t
t
t
tt
ttc
c
ccc
c
tc
c
cc
c
ct = tamarensec = catenellaf = fundyenseO = Material used
NaturalHuman-Assisted
Dispersal VectorsShip Ballast WaterShellfish Translocation
f
tt
t
tt t
t
t
tt
ff
Miami Modified from Scholin et al.
EXPATRIATION LEADING TO BLOOMS
1. NATURAL EXPATRIATION
a). Alexandrium tamarense/fundyense/catenella Chrysochromulina polylepis Karenia brevis Pyrodinium bahamense var. compressum
b). Latitudinal vs. longitudinal emigration corridors
2. HUMAN ASSISTED EXPATRIATION
a). Ballast water delivery b). Shellfish transplantation
3. THREE COLONIZATION STAGES
a). Stage I = Colonizing Pioneers b). Stage II = Persistence c). Stage III = Community Entry
PICES
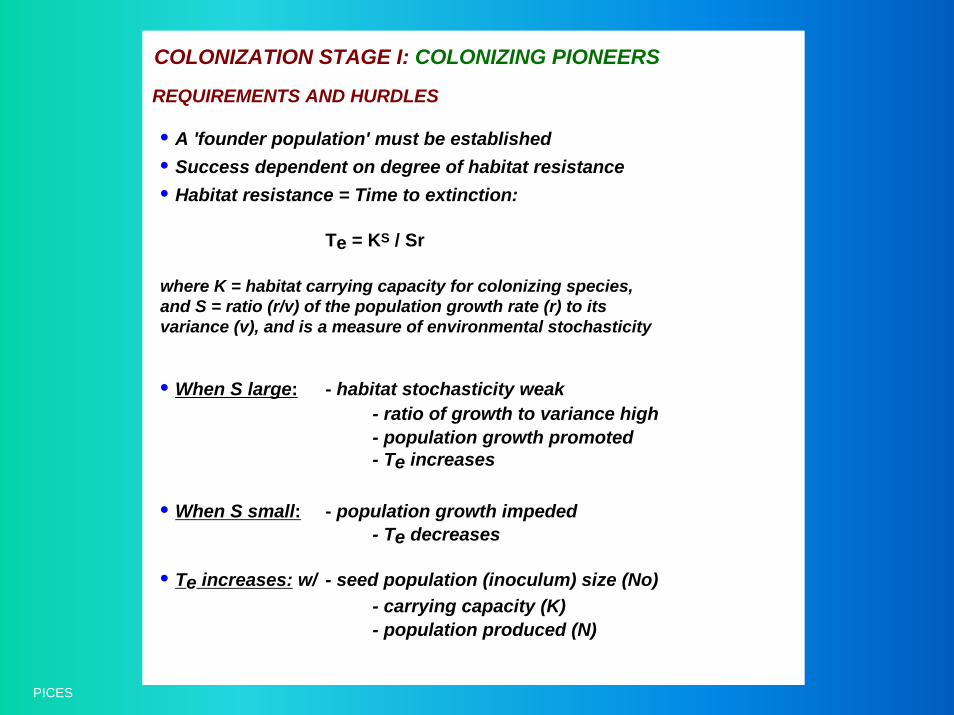
COLONIZATION STAGE I: COLONIZING PIONEERS
REQUIREMENTS AND HURDLES
• A 'founder population' must be established • Success dependent on degree of habitat resistance • Habitat resistance = Time to extinction: Te = KS / Sr
where K = habitat carrying capacity for colonizing species, and S = ratio (r/v) of the population growth rate (r) to its variance (v), and is a measure of environmental stochasticity
• When S large: - habitat stochasticity weak - ratio of growth to variance high - population growth promoted - Te increases • When S small: - population growth impeded - Te decreases
• Te increases: w/ - seed population (inoculum) size (No) - carrying capacity (K) - population produced (N)
PICES
a) b)
S = 2.0
S = 1.0
1009080
7060
50
40
30
20
10
00 20 40 60 80 100
24222018
14
642
8
1210
0
16
0 20 40 60 80 100
S = 0.6
S = 0.4
S = 0.2Tim
e to
ext
inct
ion,
rT
Tim
e to
ext
inct
ion,
rT
Population ceiling, K Propagule size, N0
S = 0.2
Hanski (1999)
Relationships between time to metapopulation extinction and population ceiling (a),and between time to extinction and propagule size (b), based on eqn 2.2. In (a) the propagule size (N0) equals the ceiling (K), in (b) K = 100.
PICES
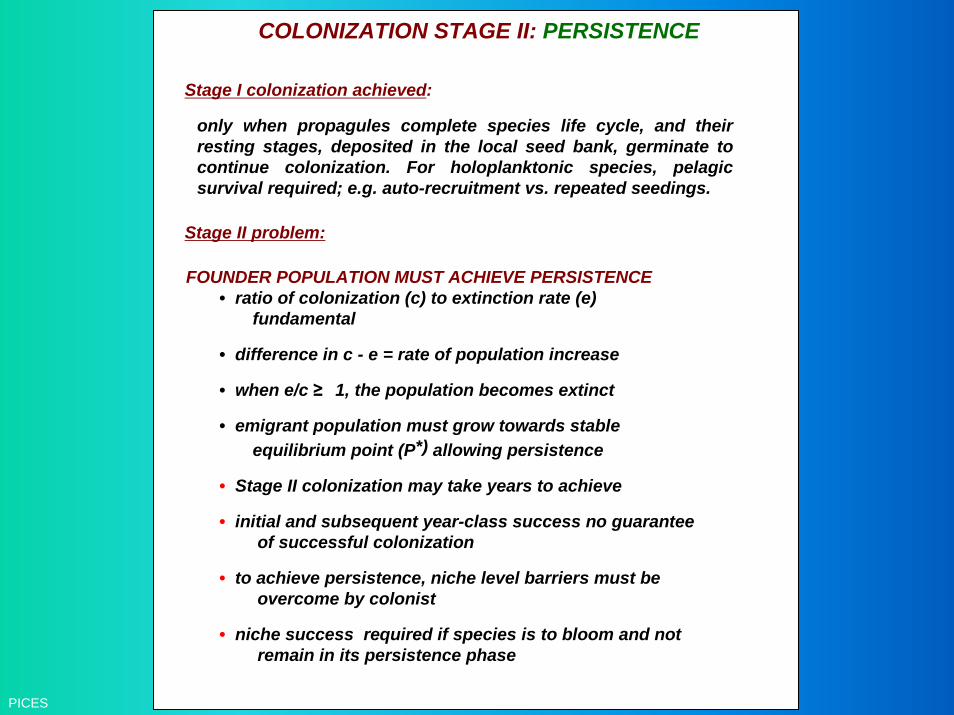
COLONIZATION STAGE II: PERSISTENCE
Stage I colonization achieved:
only when propagules complete species life cycle, and their resting stages, deposited in the local seed bank, germinate to continue colonization. For holoplanktonic species, pelagic survival required; e.g. auto-recruitment vs. repeated seedings.
Stage II problem:
FOUNDER POPULATION MUST ACHIEVE PERSISTENCE • ratio of colonization (c) to extinction rate (e) fundamental
• difference in c - e = rate of population increase
• when e/c ≥ 1, the population becomes extinct
• emigrant population must grow towards stable equilibrium point (P*) allowing persistence
• Stage II colonization may take years to achieve
• initial and subsequent year-class success no guarantee of successful colonization
• to achieve persistence, niche level barriers must be overcome by colonist
• niche success required if species is to bloom and not remain in its persistence phase
PICES
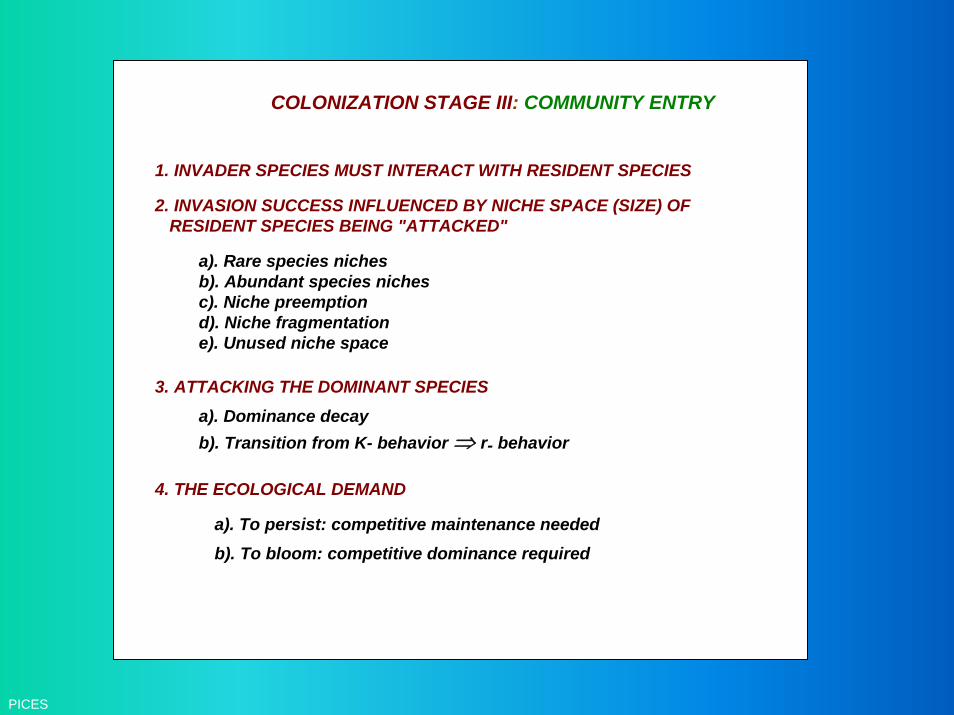
COLONIZATION STAGE III: COMMUNITY ENTRY 1. INVADER SPECIES MUST INTERACT WITH RESIDENT SPECIES
2. INVASION SUCCESS INFLUENCED BY NICHE SPACE (SIZE) OF RESIDENT SPECIES BEING "ATTACKED"
a). Rare species niches b). Abundant species niches c). Niche preemption d). Niche fragmentation e). Unused niche space
3. ATTACKING THE DOMINANT SPECIES a). Dominance decay b). Transition from K- behavior ⇒ r- behavior
4. THE ECOLOGICAL DEMAND
a). To persist: competitive maintenance needed b). To bloom: competitive dominance required
PICES
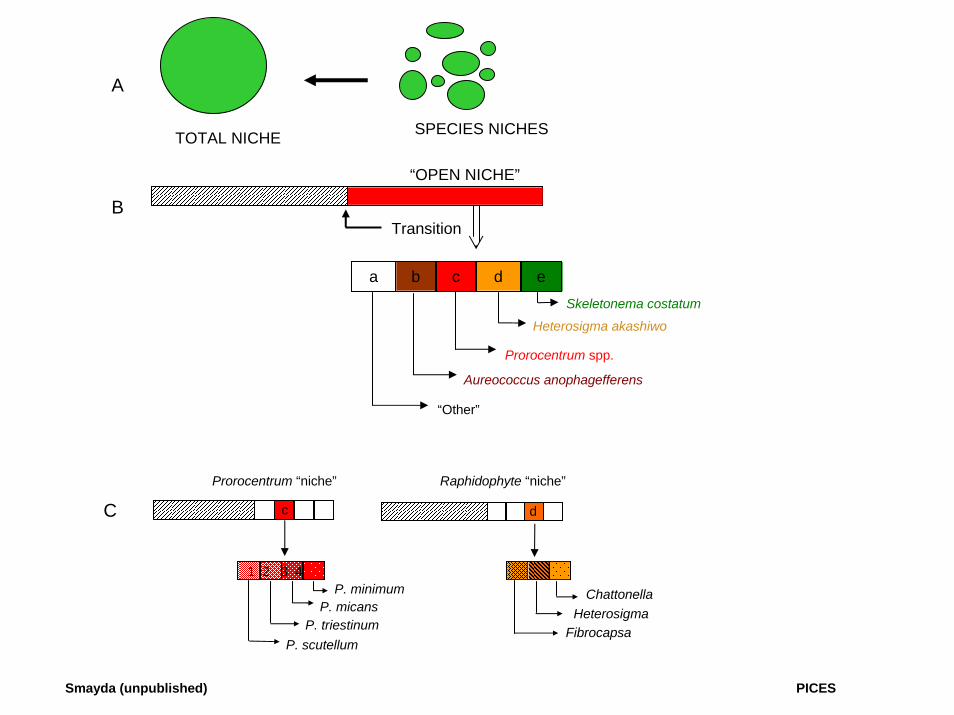
A
TOTAL NICHE SPECIES NICHES
“OPEN NICHE”
Transition
a b c d eSkeletonema costatum
Heterosigma akashiwo
Prorocentrum spp.
Aureococcus anophagefferens
“Other”
C
B
d
1 2 3 4P. minimum
P. micansP. triestinum
P. scutellum
Chattonella
FibrocapsaHeterosigma
Prorocentrum “niche” Raphidophyte “niche”
c
Smayda (unpublished) PICES
PICES
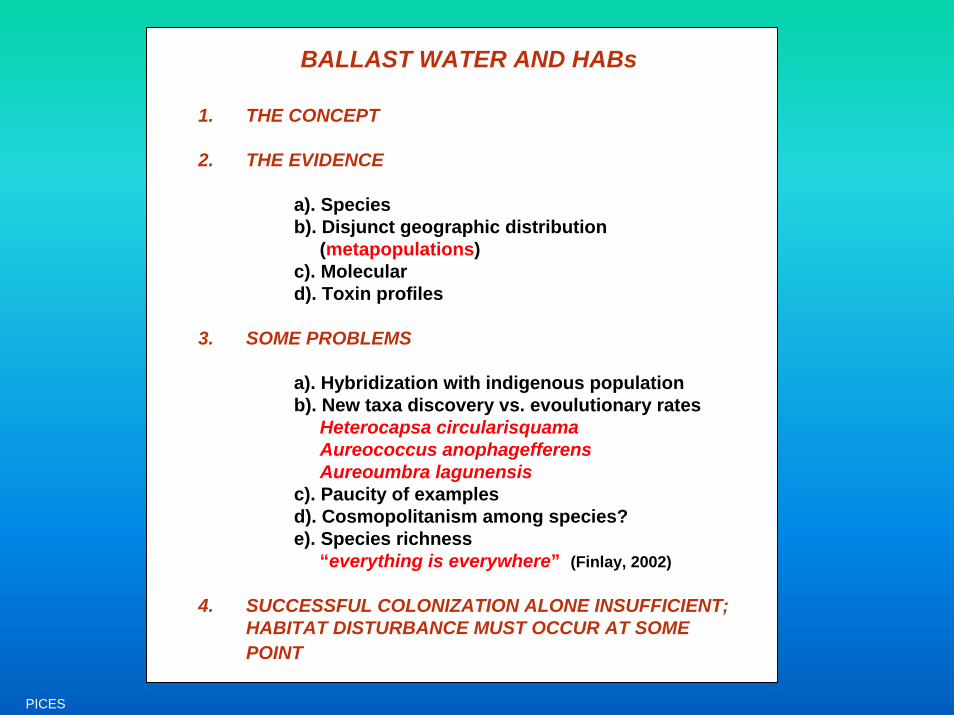
BALLAST WATER AND HABs
1. THE CONCEPT
2. THE EVIDENCE
a). Speciesb). Disjunct geographic distribution
(metapopulations)c). Moleculard). Toxin profiles
3. SOME PROBLEMS
a). Hybridization with indigenous populationb). New taxa discovery vs. evoulutionary rates
Heterocapsa circularisquamaAureococcus anophagefferensAureoumbra lagunensis
c). Paucity of examplesd). Cosmopolitanism among species?e). Species richness
“everything is everywhere” (Finlay, 2002)
4. SUCCESSFUL COLONIZATION ALONE INSUFFICIENT;HABITAT DISTURBANCE MUST OCCUR AT SOME POINT
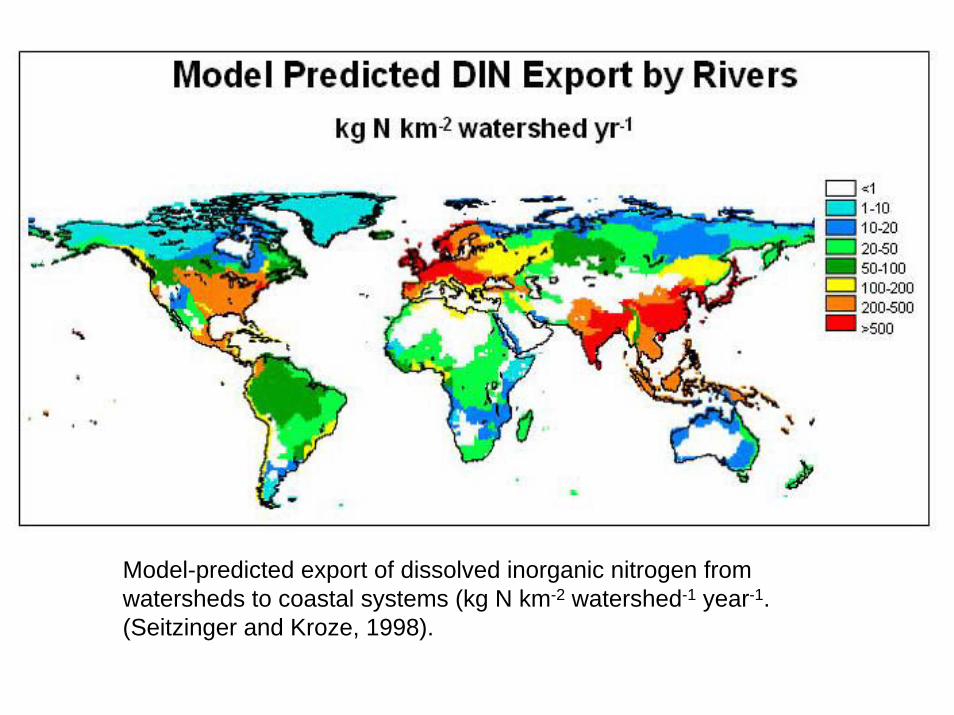
Model-predicted export of dissolved inorganic nitrogen fromwatersheds to coastal systems (kg N km-2 watershed-1 year-1.(Seitzinger and Kroze, 1998).
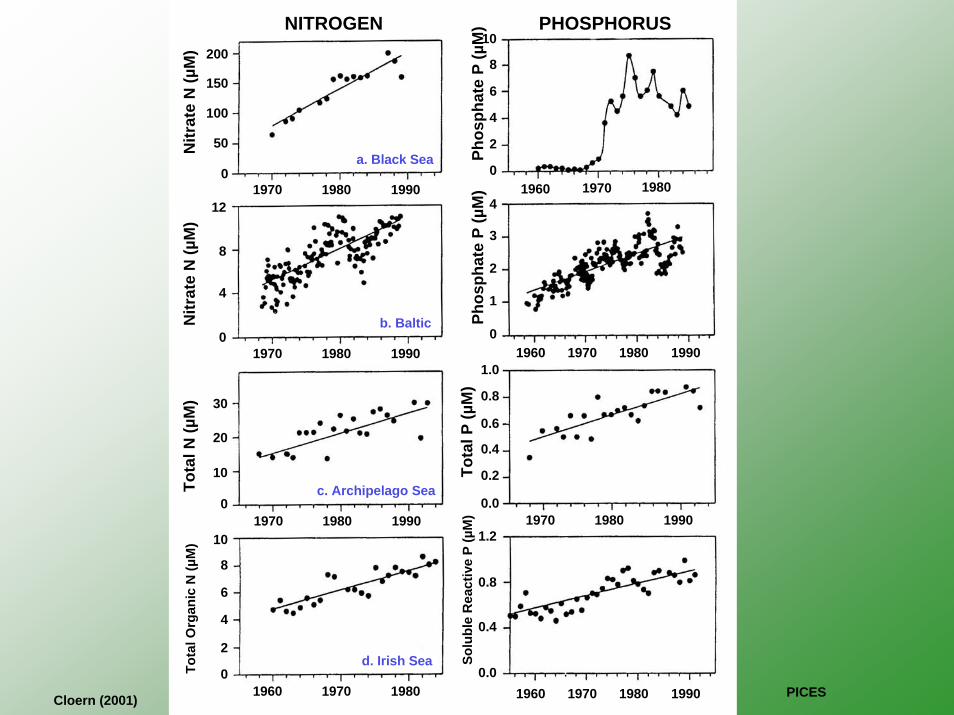
NITROGEN PHOSPHORUS
a. Black Sea
b. Baltic
c. Archipelago Sea
d. Irish Sea
Nitr
ate
N (µ
M)
Tota
l N (µ
M)
Nitr
ate
N (µ
M)
Tota
l Org
anic
N (µ
M)
Phos
phat
e P
(µM
)Ph
osph
ate
P (µ
M)
Tota
l P (µ
M)
Solu
ble
Rea
ctiv
e P
(µM
)
1970 1980 1990 1960 1970 1980
1970 1980 1990
1970 1980 1990 1970 1980 1990
1960 1970 1980 1960 1970 1980 1990
1960 1970 1980 1990
1.2
0.8
0.4
0.0
0.0
0.4
0.8
1.0
0.6
0.2
0
1
2
3
4
10
8
6
4
2
0
200
150
100
50
0
12
8
4
0
30
20
10
0
10
8
6
4
2
0
Cloern (2001) PICES
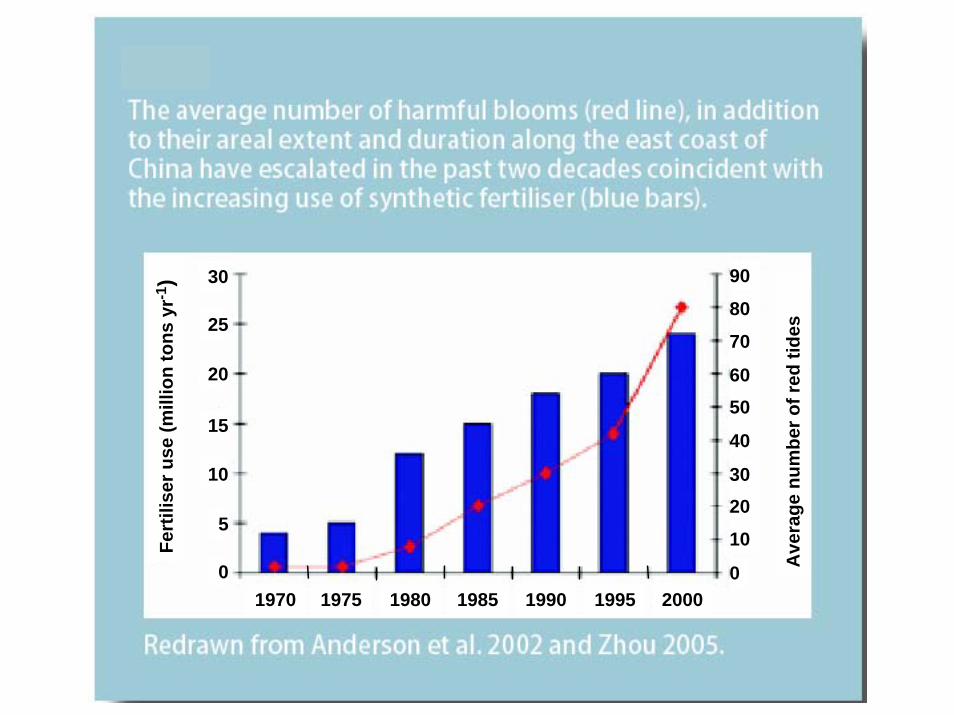
30
25
20
15
10
5
0
Fert
ilise
ruse
(mill
ion
tons
yr-1
)
Ave
rage
num
ber o
f red
tide
s
90
80
70
6050
40
3020
10
01970 1975 1980 1985 1995 20001990
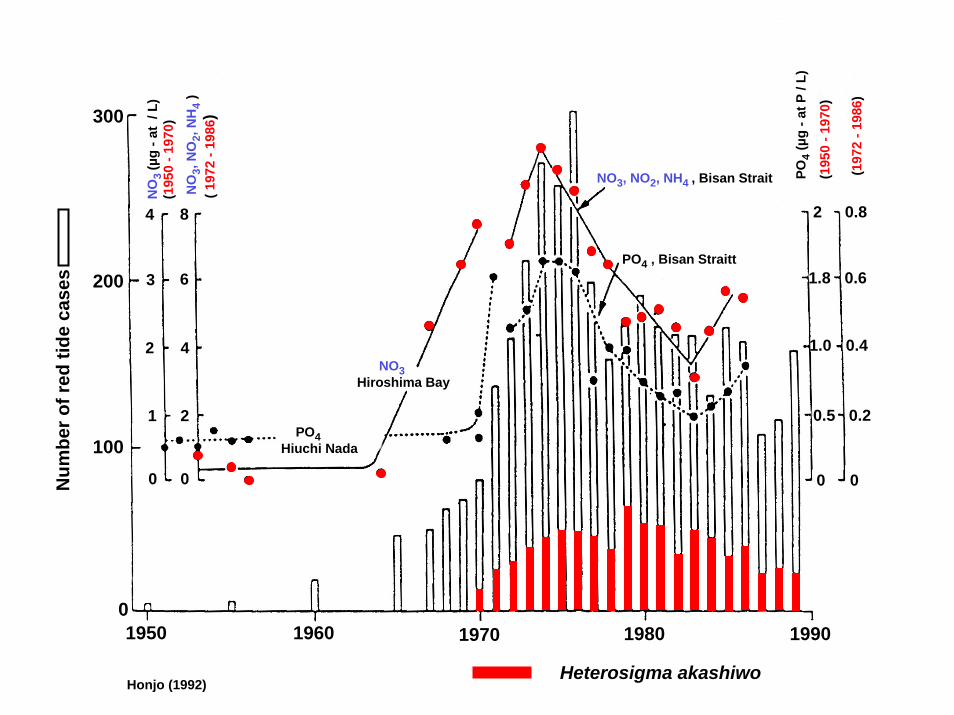
300
100
200
01950 1960 1970 1980 1990
NO
3 (µ
g -a
t / L
) (1
950
-197
0)N
O3,
NO
2, N
H4
)(1
972
-198
6 )4
3
2
1
0 0
2
4
6
8
PO4Hiuchi Nada
NO3Hiroshima Bay
NO3, NO2, NH4 , Bisan Strait
PO4 , Bisan Straitt
PO4
(µg
-at P
/ L)
(195
0 -1
970)
(197
2 -1
986)
2
1.8
1.0
0.5
0 0
0.2
0.4
0.6
0.8
Num
ber o
f red
tide
cas
es
Honjo (1992)Heterosigma akashiwo
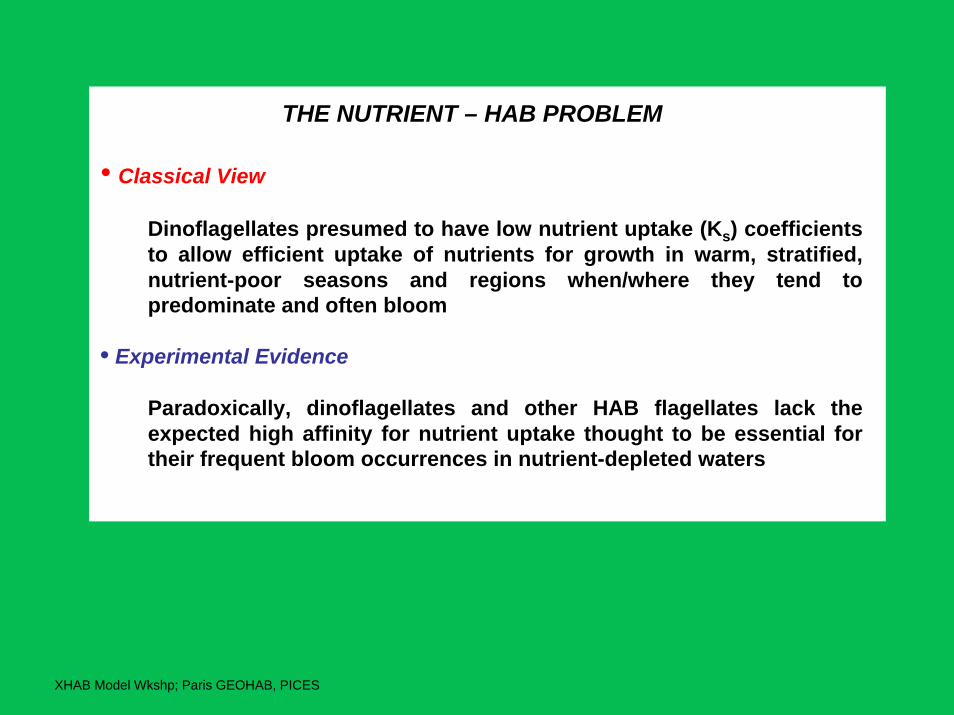
THE NUTRIENT – HAB PROBLEM
• Classical View
Dinoflagellates presumed to have low nutrient uptake (Ks) coefficients to allow efficient uptake of nutrients for growth in warm, stratified, nutrient-poor seasons and regions when/where they tend to predominate and often bloom
• Experimental Evidence
Paradoxically, dinoflagellates and other HAB flagellates lack the expected high affinity for nutrient uptake thought to be essential for their frequent bloom occurrences in nutrient-depleted waters
XHAB Model Wkshp; Paris GEOHAB, PICES
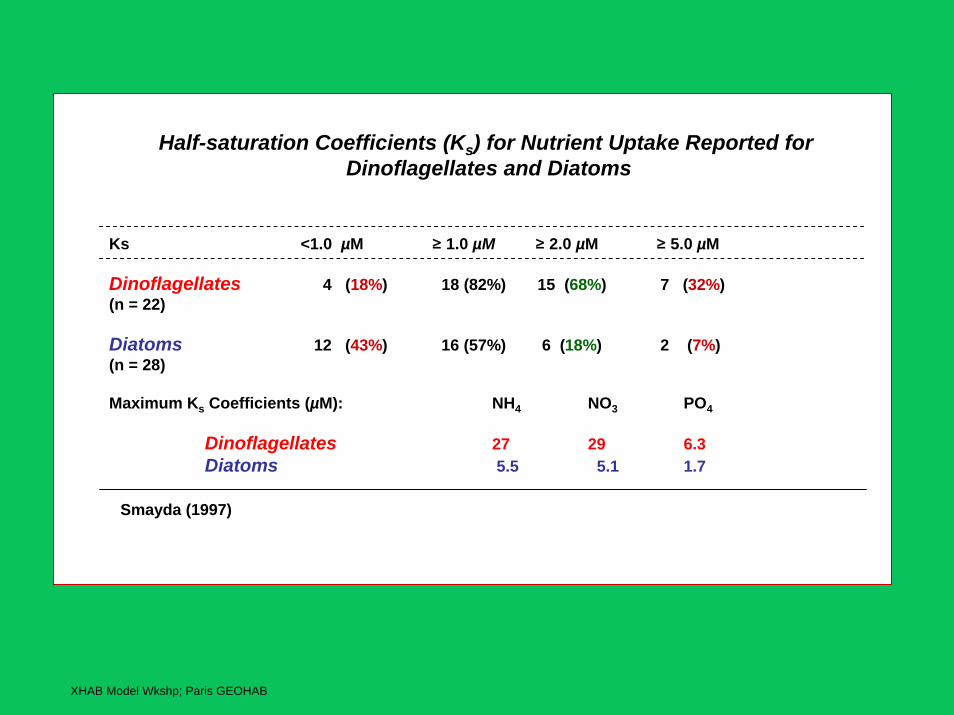
Half-saturation Coefficients (Ks) for Nutrient Uptake Reported forDinoflagellates and Diatoms
Ks <1.0 µM ≥ 1.0 µM ≥ 2.0 µM ≥ 5.0 µM
Dinoflagellates 4 (18%) 18 (82%) 15 (68%) 7 (32%)(n = 22)
Diatoms 12 (43%) 16 (57%) 6 (18%) 2 (7%)(n = 28)
Maximum Ks Coefficients (µM): NH4 NO3 PO4
Dinoflagellates 27 29 6.3Diatoms 5.5 5.1 1.7
XHAB Model Wkshp; Paris GEOHAB
Smayda (1997)
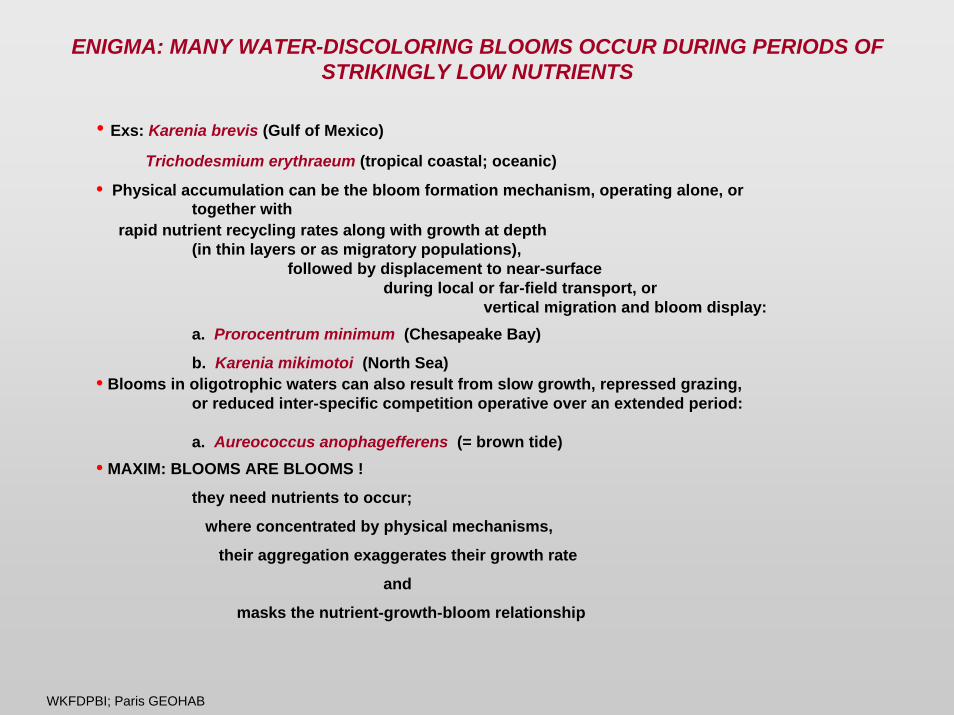
ENIGMA: MANY WATER-DISCOLORING BLOOMS OCCUR DURING PERIODS OF STRIKINGLY LOW NUTRIENTS
• Exs: Karenia brevis (Gulf of Mexico)
Trichodesmium erythraeum (tropical coastal; oceanic)
• Physical accumulation can be the bloom formation mechanism, operating alone, or together with
rapid nutrient recycling rates along with growth at depth (in thin layers or as migratory populations),
followed by displacement to near-surface during local or far-field transport, or
vertical migration and bloom display:a. Prorocentrum minimum (Chesapeake Bay)
b. Karenia mikimotoi (North Sea)• Blooms in oligotrophic waters can also result from slow growth, repressed grazing,
or reduced inter-specific competition operative over an extended period:
a. Aureococcus anophagefferens (= brown tide)• MAXIM: BLOOMS ARE BLOOMS !
they need nutrients to occur;
where concentrated by physical mechanisms,
their aggregation exaggerates their growth rate
and
masks the nutrient-growth-bloom relationship
WKFDPBI; Paris GEOHAB
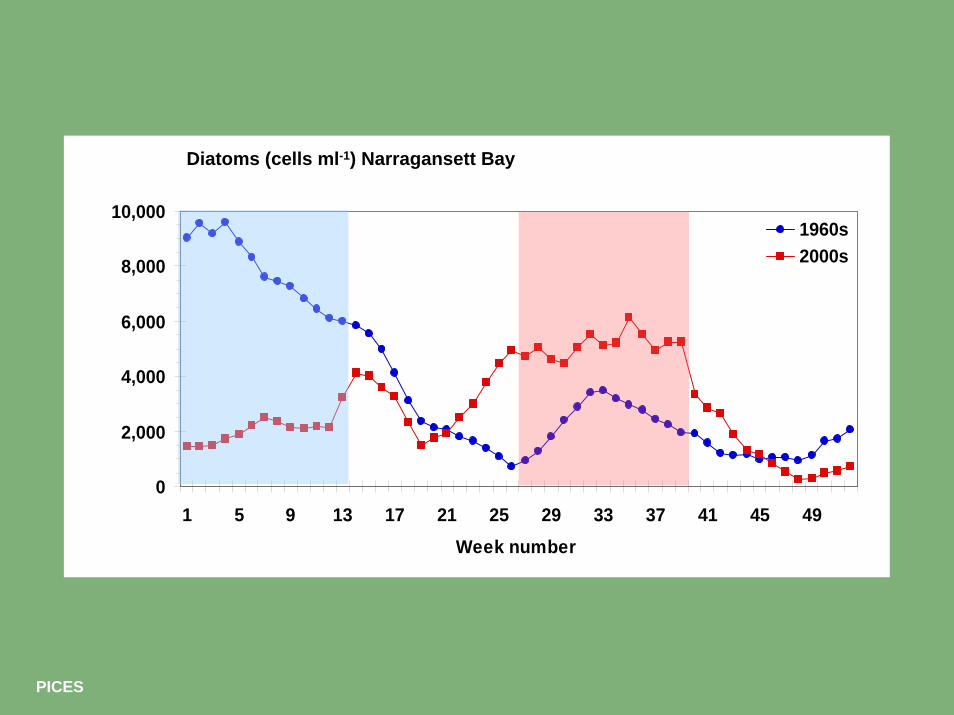
0
2,000
4,000
6,000
8,000
10,000
1 5 9 13 17 21 25 29 33 37 41 45 49Week number
1960s2000s
Diatoms (cells ml-1) Narragansett Bay
PICES
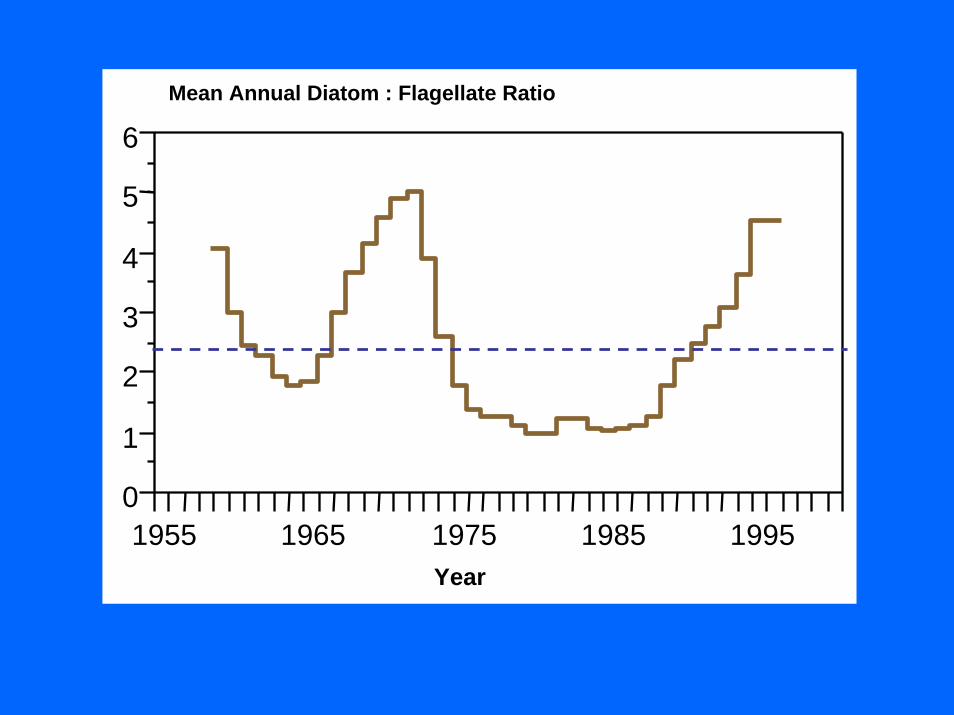
1955 1965 1975 1985 19950
1
2
3
4
5
6Mean Annual Diatom : Flagellate RatioMean Annual Diatom : Flagellate Ratio
YearYear
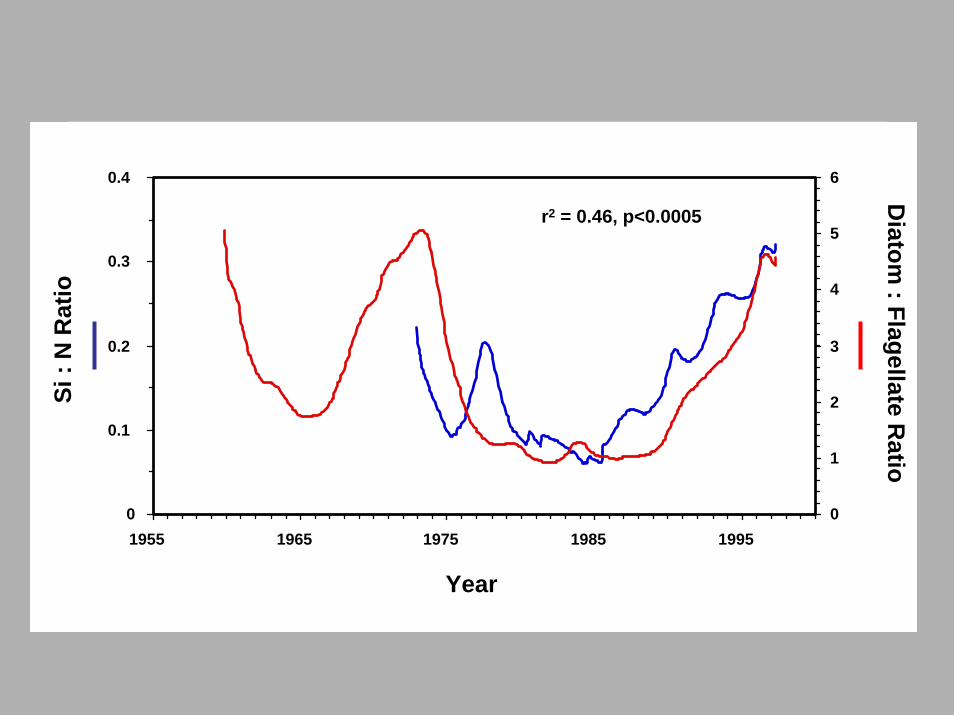
0
0.1
0.2
0.3
0.4
1955 1965 1975 1985 19950
1
2
3
4
5
6
Year
Si :
N R
atio
Diatom
: Flagellate Ratio
r2 = 0.46, p<0.0005
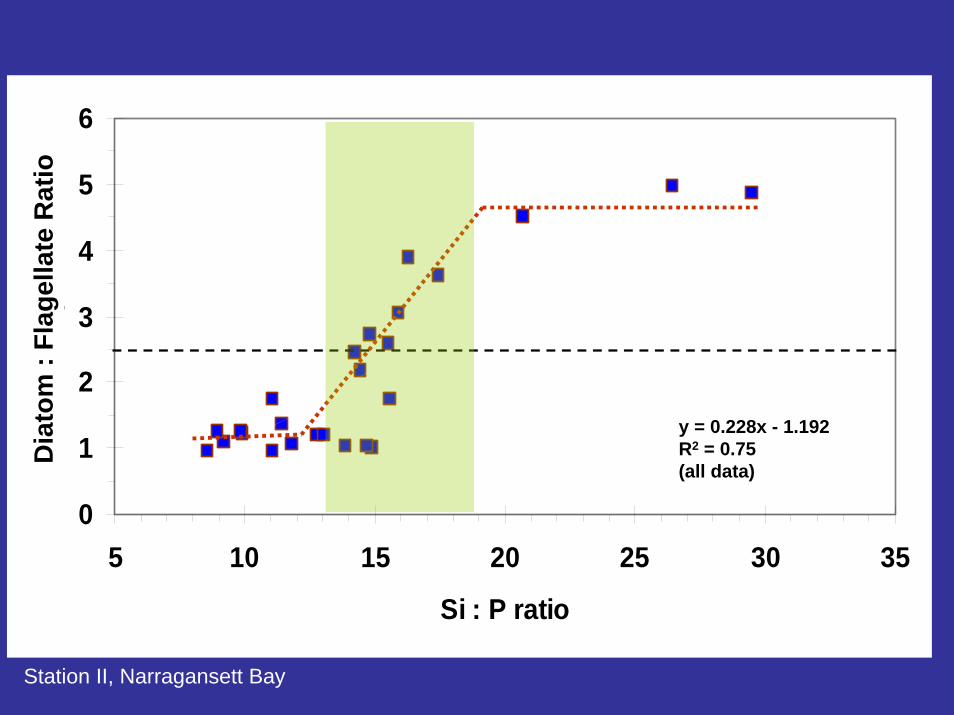
0
1
2
3
4
5
6
5 10 15 20 25 30 35
Si : P ratio
Dia
tom
: Fl
agel
late
ratio
y = 0.228x - 1.192R2 = 0.75(all data)
Dia
tom
: Fl
agel
late
Rat
io
Station II, Narragansett Bay
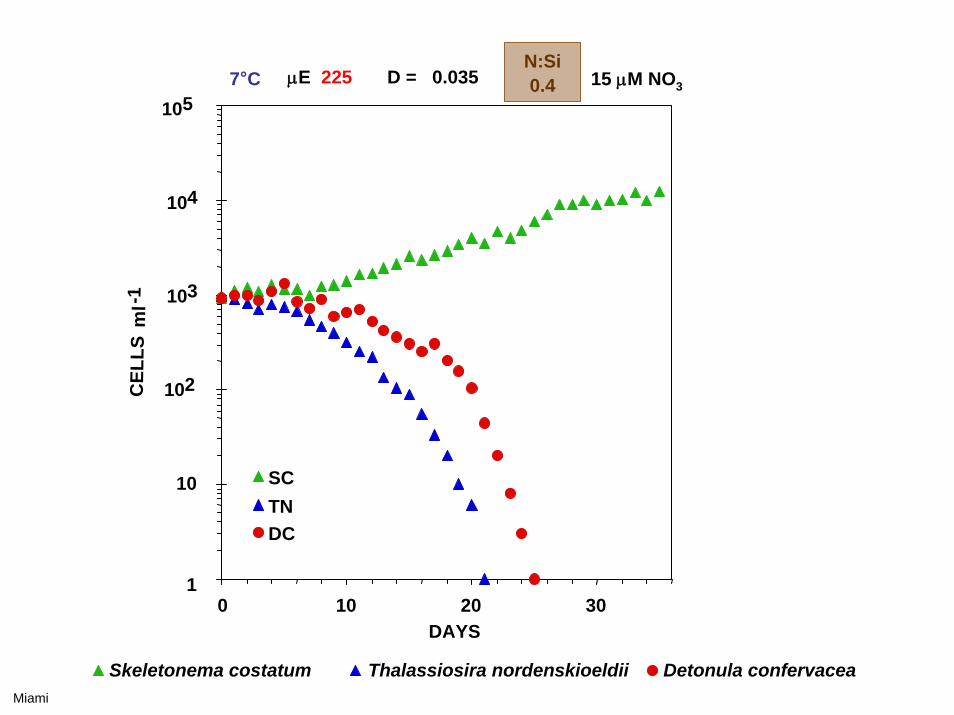
0 10 20 30
SCTNDC
105
104
103
102
10
1
CEL
LS m
l-1
DAYS
7°C μE 225 D = 0.035 15 μM NO3
Skeletonema costatum Thalassiosira nordenskioeldii Detonula confervacea
N:Si0.4
Miami
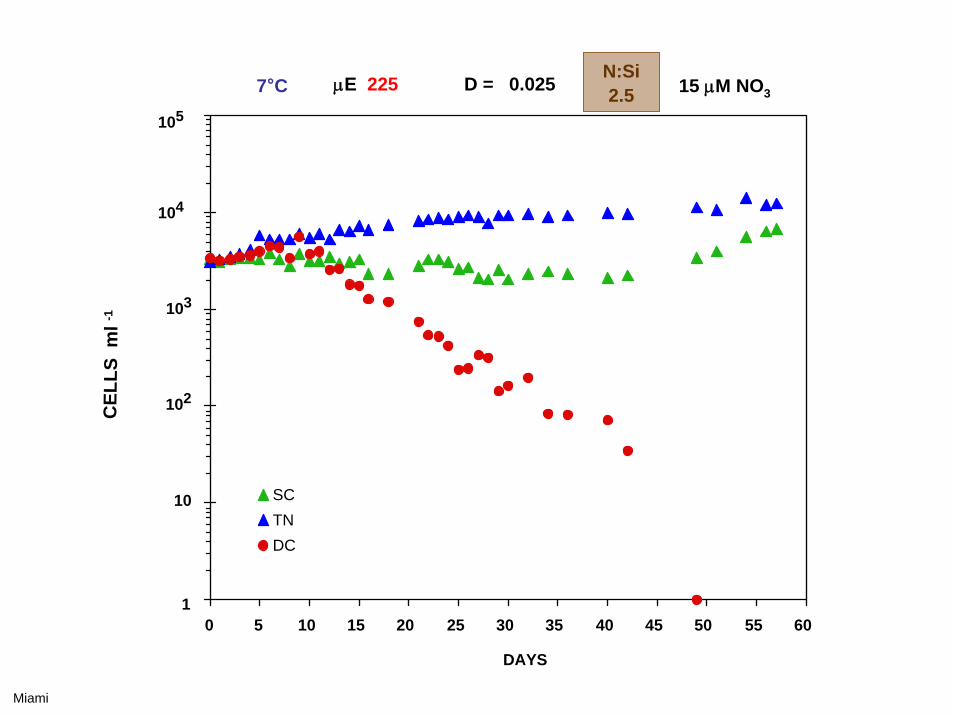
0 5 10 15 20 25 30 35 40 45 50 55 60
SCTNDC
105
104
103
102
10
1
CEL
LS m
l -1
DAYS
7°C μE 225 D = 0.025 15 μM NO3N:Si2.5
Miami
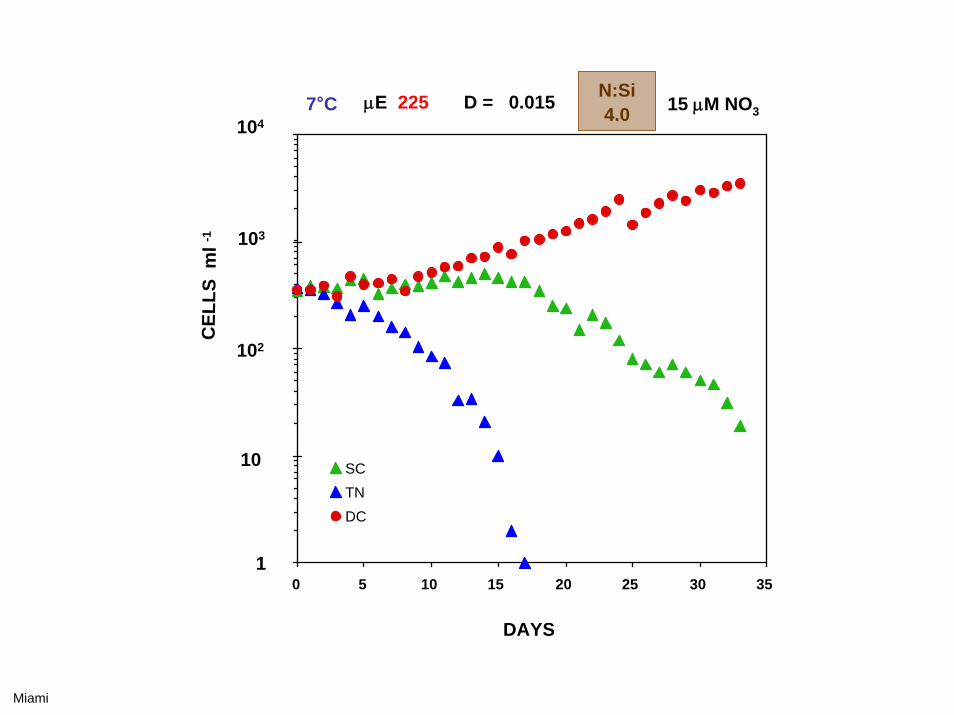
DAYS
104
103
102
10
1
CEL
LS m
l -1
0 5 10 15 20 25 30 35
SCTNDC
7°C μE 225 D = 0.015 15 μM NO3N:Si4.0
Miami
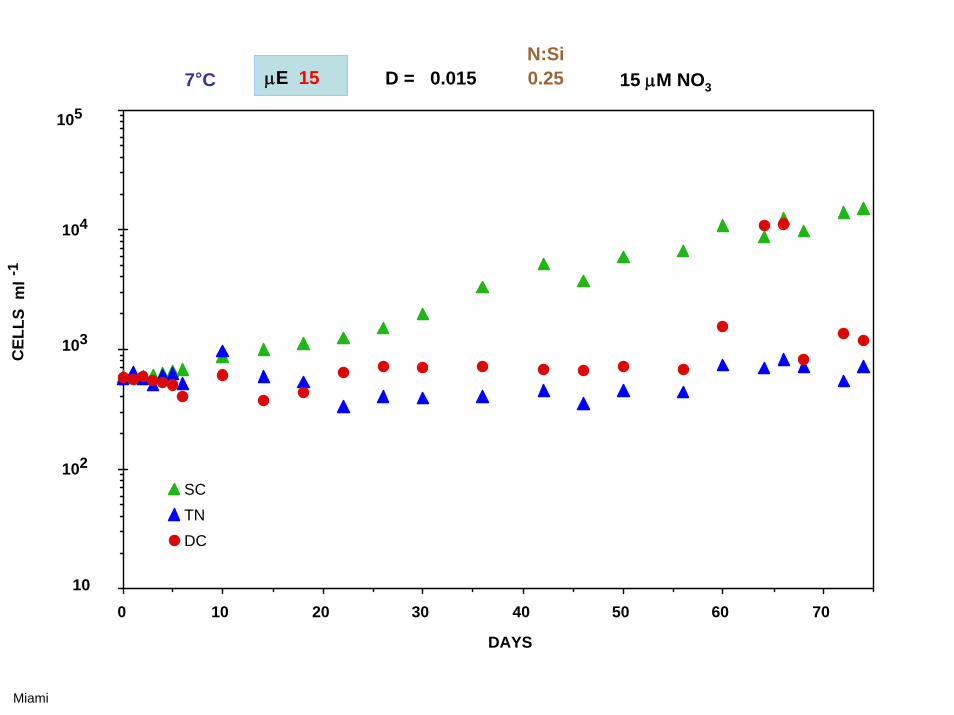
0 10 20 30 40 50 60 70
SCTNDC
DAYS
105
104
103
102
10
CEL
LS m
l-1
7°C μE 15 D = 0.015N:Si0.25 15 μM NO3
Miami
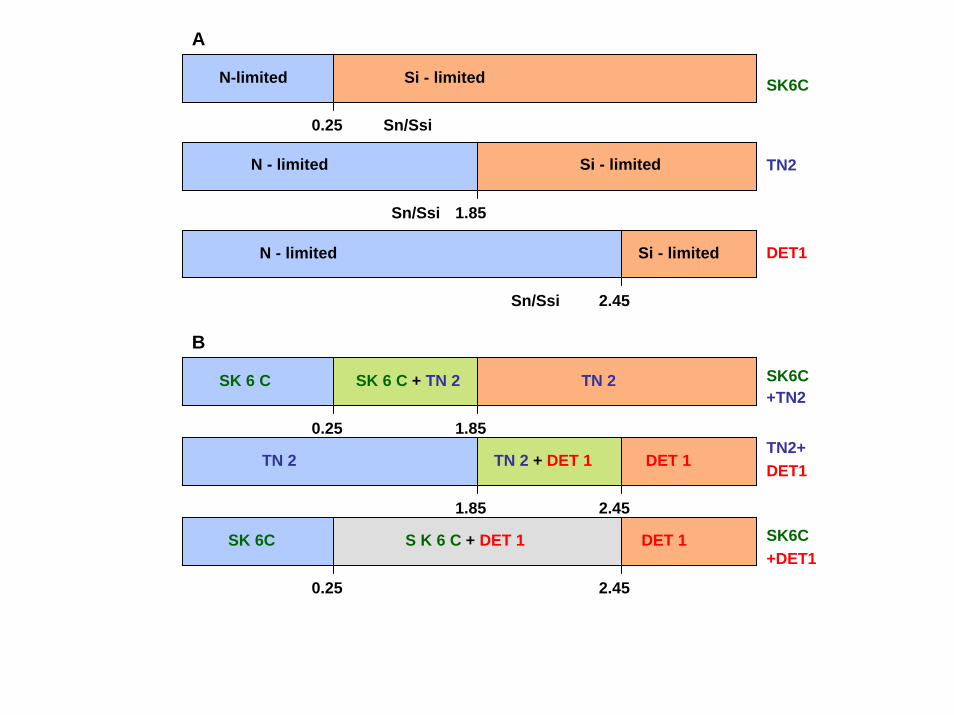
N-limited Si - limited
A
SK6C
N - limited Si - limited
N - limited Si - limited
SK 6 C SK 6 C + TN 2 TN 2
TN 2 TN 2 + DET 1 DET 1
SK 6C S K 6 C + DET 1 DET 1
0.25 Sn/Ssi
Sn/Ssi
Sn/Ssi
B
1.85
0.25
1.85
2.45
2.45
2.45
0.25
SK6C+DET1
TN2+DET1
SK6C+TN2
TN2
DET1
1.85
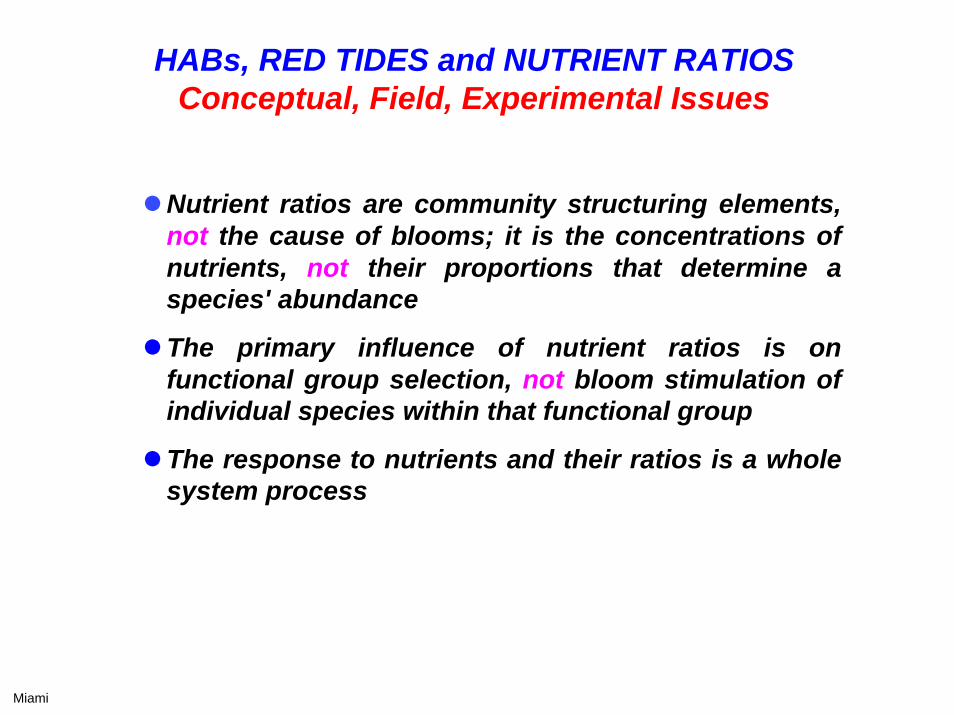
HABs, RED TIDES and NUTRIENT RATIOSConceptual, Field, Experimental Issues
Nutrient ratios are community structuring elements, not the cause of blooms; it is the concentrations of nutrients, not their proportions that determine a species' abundance
The primary influence of nutrient ratios is on functional group selection, not bloom stimulation of individual species within that functional group
The response to nutrients and their ratios is a whole system process
Miami
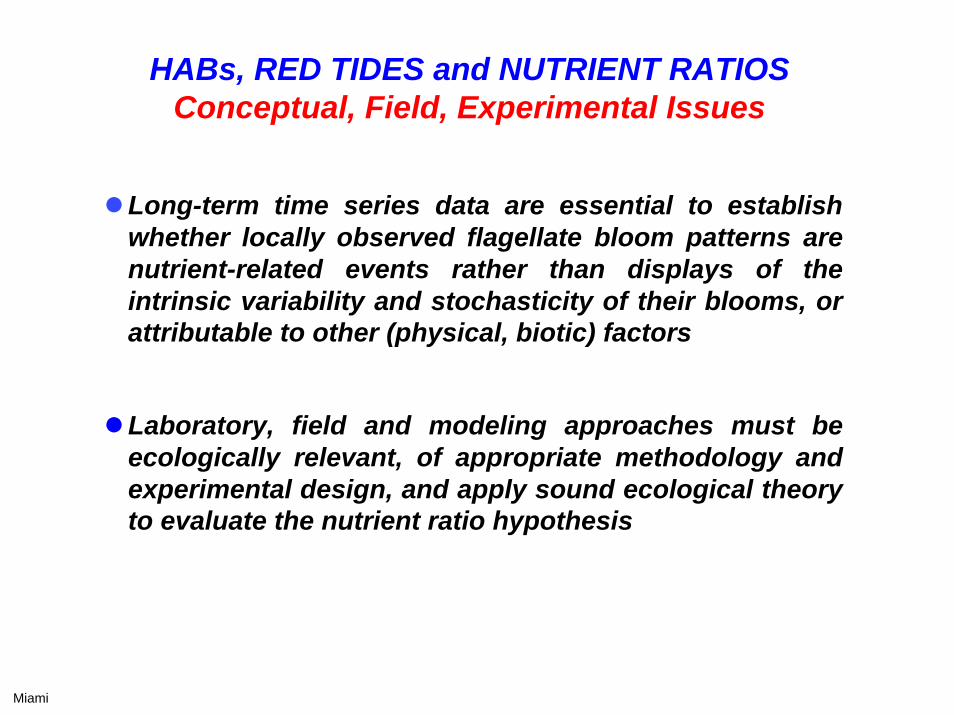
HABs, RED TIDES and NUTRIENT RATIOSConceptual, Field, Experimental Issues
Long-term time series data are essential to establish whether locally observed flagellate bloom patterns are nutrient-related events rather than displays of the intrinsic variability and stochasticity of their blooms, or attributable to other (physical, biotic) factors
Laboratory, field and modeling approaches must be ecologically relevant, of appropriate methodology and experimental design, and apply sound ecological theory to evaluate the nutrient ratio hypothesis
Miami
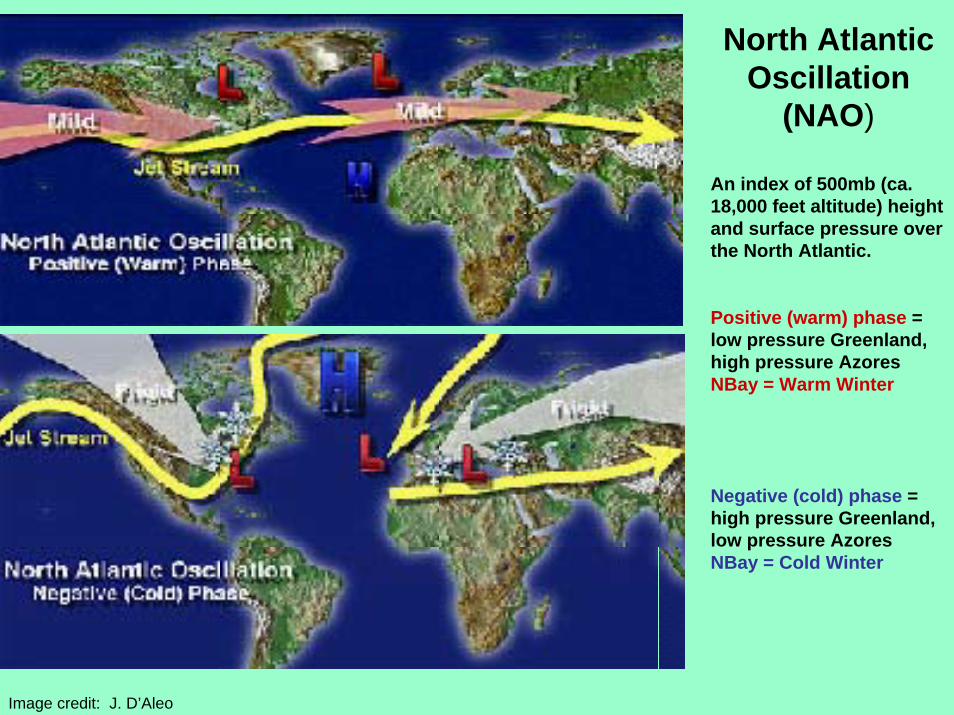
North Atlantic Oscillation
(NAO)
An index of 500mb (ca. 18,000 feet altitude) height and surface pressure over the North Atlantic.
Positive (warm) phase = low pressure Greenland, high pressure AzoresNBay = Warm Winter
Negative (cold) phase = high pressure Greenland, low pressure AzoresNBay = Cold Winter
Image credit: J. D’Aleo
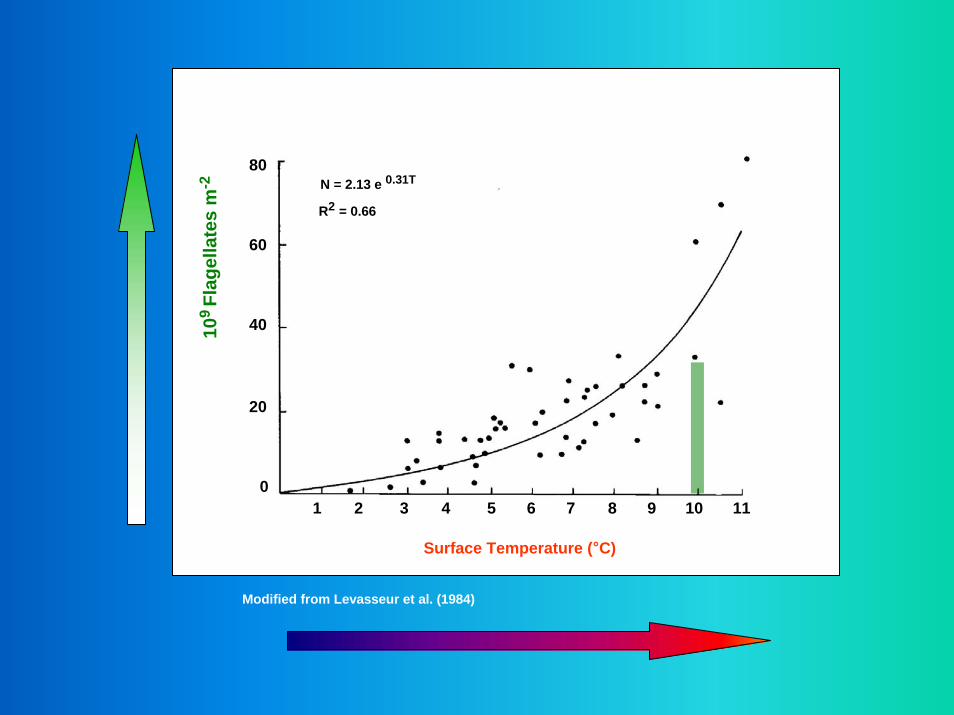
N = 2.13 e 0.31T
R2 = 0.66
1 2 3 4 5 6 7 8 9 10 11
Surface Temperature (°C)
Modified from Levasseur et al. (1984)
109
Flag
ella
tes
m-2
80
60
40
20
0
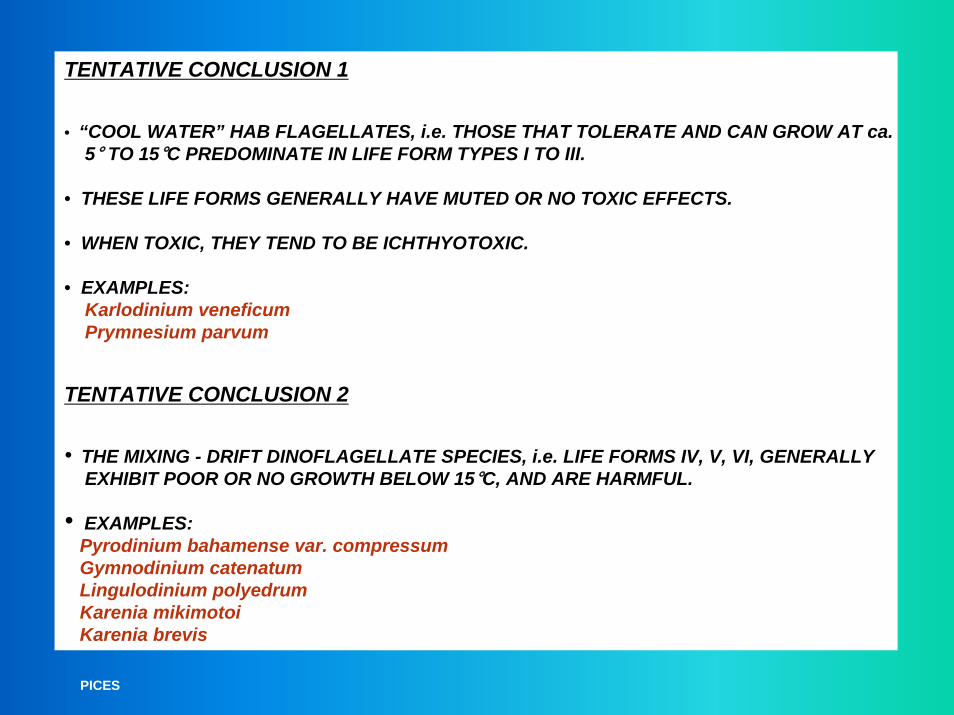
TENTATIVE CONCLUSION 1
• “COOL WATER” HAB FLAGELLATES, i.e. THOSE THAT TOLERATE AND CAN GROW AT ca. 5° TO 15°C PREDOMINATE IN LIFE FORM TYPES I TO III.
• THESE LIFE FORMS GENERALLY HAVE MUTED OR NO TOXIC EFFECTS.
• WHEN TOXIC, THEY TEND TO BE ICHTHYOTOXIC.
• EXAMPLES:Karlodinium veneficumPrymnesium parvum
TENTATIVE CONCLUSION 2
• THE MIXING - DRIFT DINOFLAGELLATE SPECIES, i.e. LIFE FORMS IV, V, VI, GENERALLY EXHIBIT POOR OR NO GROWTH BELOW 15°C, AND ARE HARMFUL.
• EXAMPLES:Pyrodinium bahamense var. compressumGymnodinium catenatumLingulodinium polyedrumKarenia mikimotoiKarenia brevis
PICES
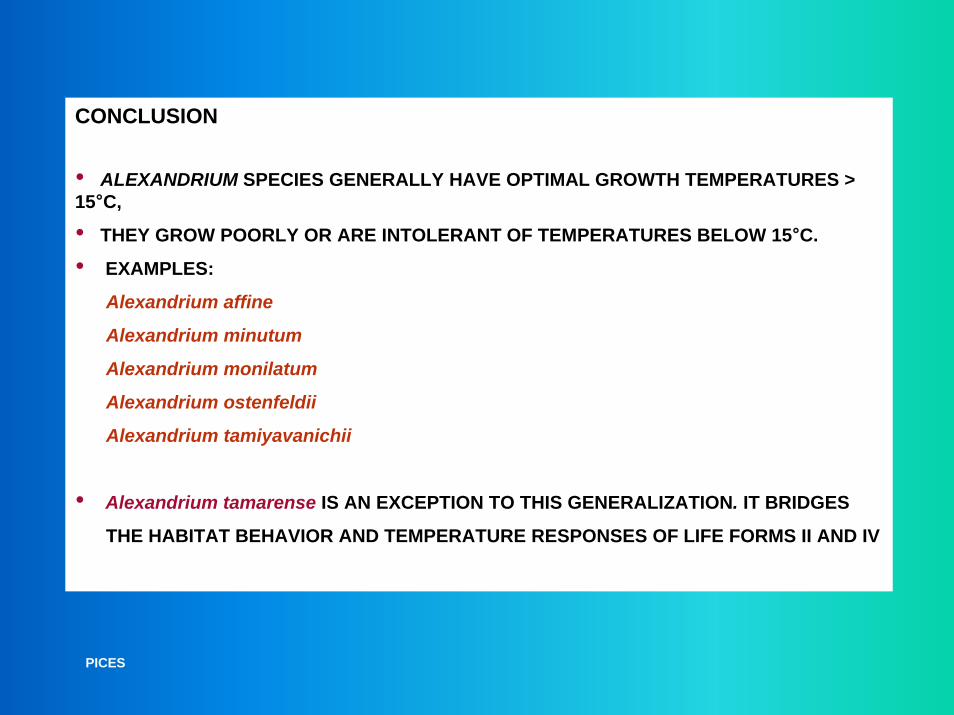
CONCLUSION
• ALEXANDRIUM SPECIES GENERALLY HAVE OPTIMAL GROWTH TEMPERATURES > 15°C,
• THEY GROW POORLY OR ARE INTOLERANT OF TEMPERATURES BELOW 15°C.
• EXAMPLES:
Alexandrium affine
Alexandrium minutum
Alexandrium monilatum
Alexandrium ostenfeldii
Alexandrium tamiyavanichii
• Alexandrium tamarense IS AN EXCEPTION TO THIS GENERALIZATION. IT BRIDGES
THE HABITAT BEHAVIOR AND TEMPERATURE RESPONSES OF LIFE FORMS II AND IV
PICES
W
W
N N
E
E
60°
0° 5° 10°
55°
50°
10° 5° 0° 5° 10°
60°
55°
50°
5°10°
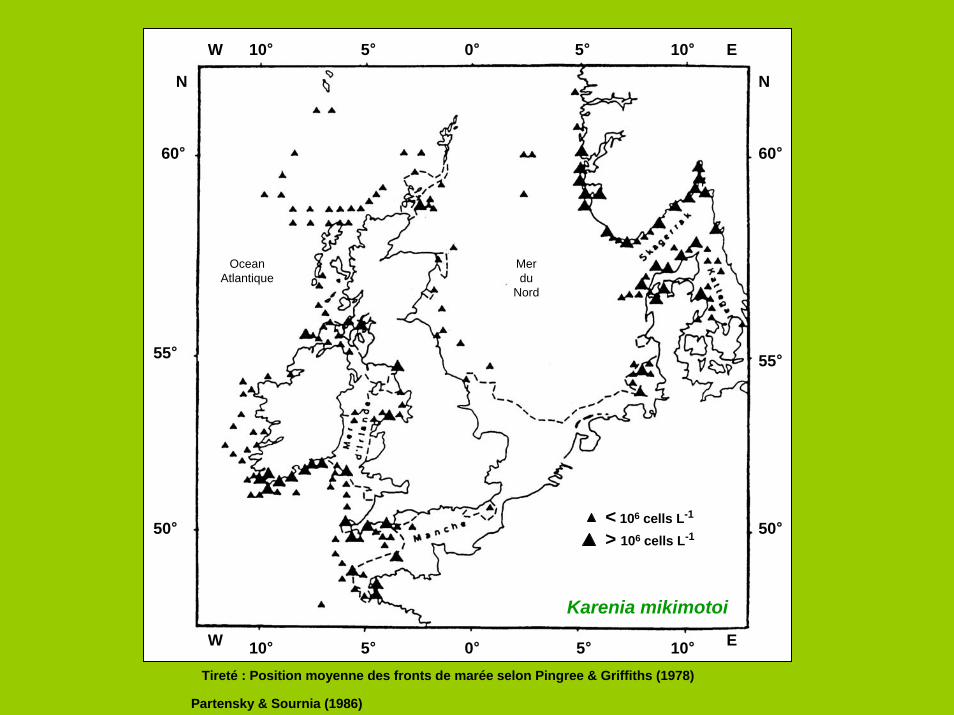
Karenia mikimotoi
Tireté : Position moyenne des fronts de marée selon Pingree & Griffiths (1978)
Partensky & Sournia (1986)
Merdu
Nord
OceanAtlantique
< 106 cells L-1
> 106 cells L-1
1.0
0.9
0.7
0.5
0.3
0.1
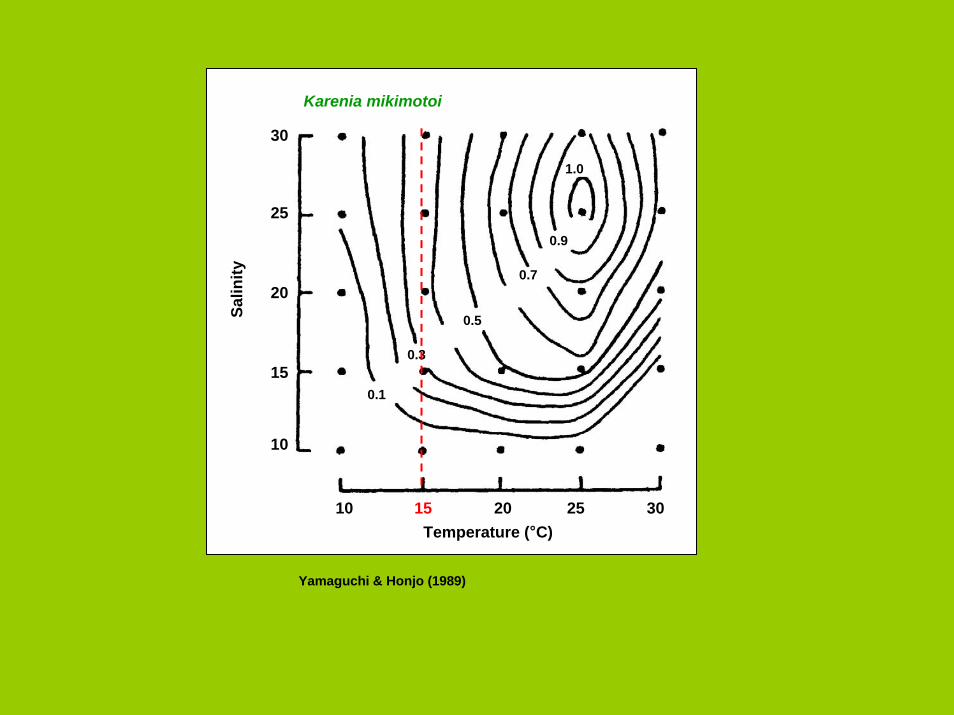
Karenia mikimotoi
Salin
ity
Temperature (°C)
Yamaguchi & Honjo (1989)
30
20
10
25
15
10 20 3015 25
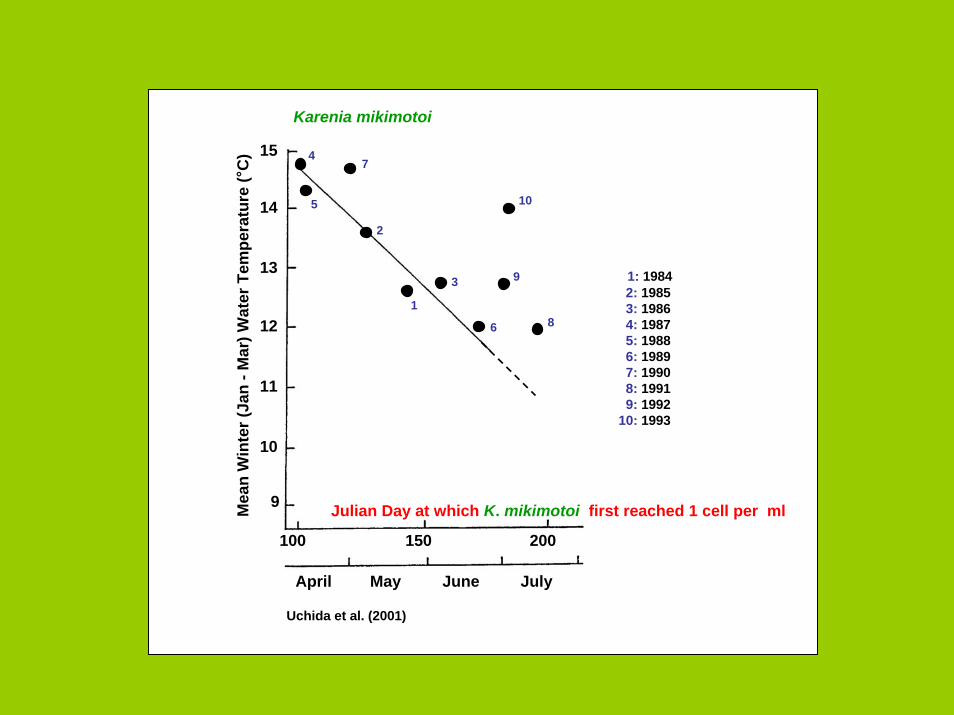
Julian Day at which K. mikimotoi first reached 1 cell per ml
April May June July
100 150 200
15
14
13
12
11
10
9
Karenia mikimotoi
Uchida et al. (2001)
Mea
n W
inte
r (Ja
n -M
ar) W
ater
Tem
pera
ture
(°C
)
1: 19842: 19853: 19864: 19875: 19886: 19897: 19908: 19919: 1992
10: 1993
1
2
3
10
9
8
7
6
5
4
A B C D E
4
3
2
1
0
-1
-2
-3
-41970 72 74 76 78 80 82 84 86 88
EOF
1st m
ode
/ ZM
T (°
C)
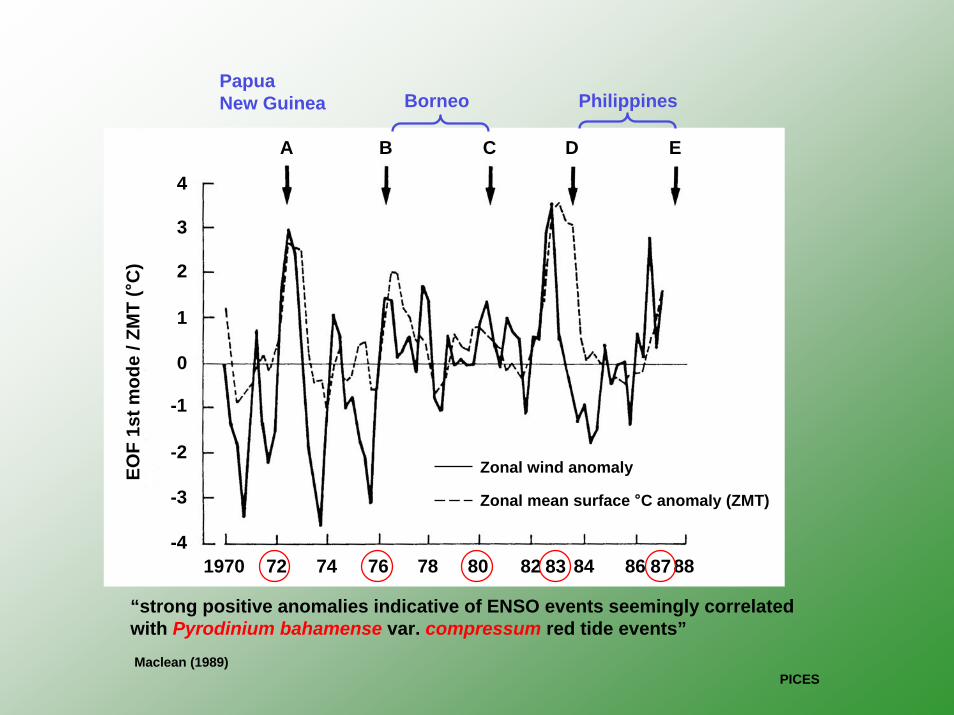
Maclean (1989)
Zonal wind anomaly
Zonal mean surface °C anomaly (ZMT)
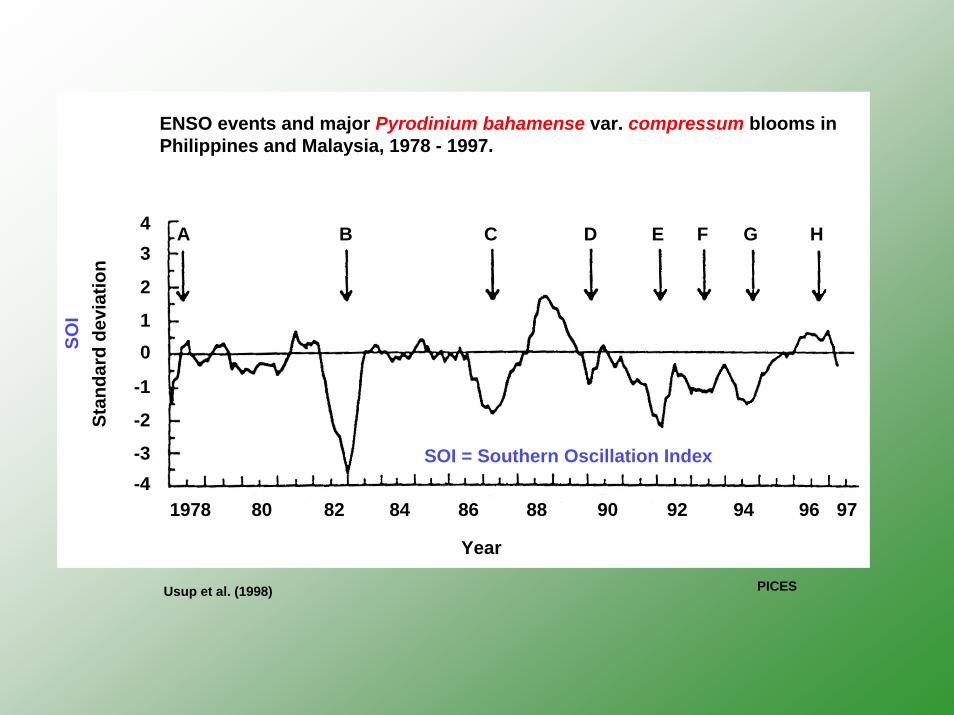
“strong positive anomalies indicative of ENSO events seemingly correlated with Pyrodinium bahamense var. compressum red tide events”
PICES
83 87
PapuaNew Guinea Borneo Philippines
Stan
dard
dev
iatio
n
43
2
10
-1
-2
-3-4
A B C D E F G H
1978 80 82 84 86 88 90 92 94 96 97
Year
Usup et al. (1998)
SOI
SOI = Southern Oscillation Index
PICES
ENSO events and major Pyrodinium bahamense var. compressum blooms in Philippines and Malaysia, 1978 - 1997.
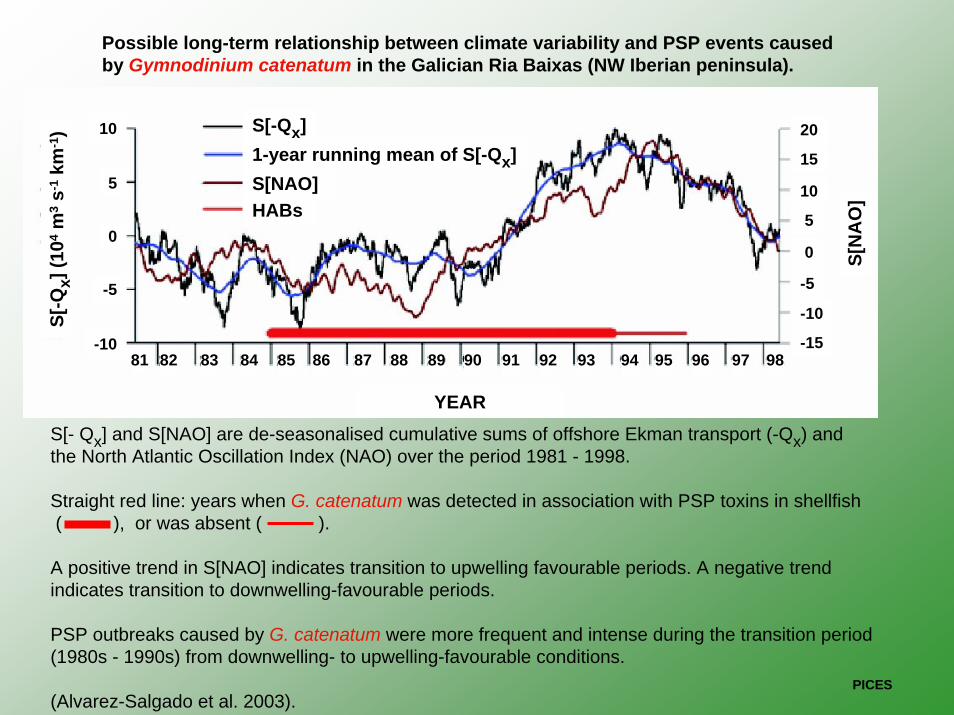
Possible long-term relationship between climate variability and PSP events caused by Gymnodinium catenatum in the Galician Ria Baixas (NW Iberian peninsula).
S[- Qx] and S[NAO] are de-seasonalised cumulative sums of offshore Ekman transport (-Qx) and the North Atlantic Oscillation Index (NAO) over the period 1981 - 1998.
Straight red line: years when G. catenatum was detected in association with PSP toxins in shellfish( ), or was absent ( ).
A positive trend in S[NAO] indicates transition to upwelling favourable periods. A negative trendindicates transition to downwelling-favourable periods.
PSP outbreaks caused by G. catenatum were more frequent and intense during the transition period(1980s - 1990s) from downwelling- to upwelling-favourable conditions.
(Alvarez-Salgado et al. 2003).
S[-Q
x] (1
04m
3s-
1km
-1)
S[N
AO
]
YEAR
S[-Qx]1-year running mean of S[-Qx]S[NAO]HABs
10
5
0
-5
-10
-10
-15
0
5
10
15
20
-5
81 83 84 85 86 8782 8988 90 91 92 93 94 95 96 97 98
PICES
THE ENIGMA
PICES
GLOBAL CHANGE ?
GLOBAL INCREASE ?
GLOBAL SPREADING ?
GLOBAL SYNCHRONY ?
350
300
250
200
150
100
50
1900 1910 19401920 1930 1960 1970 19801950
10
20
30
40
50
70
80
60
Cat
ch o
f Cal
iforn
ian
sard
ine
( )
in te
n th
ousa
nd to
ns
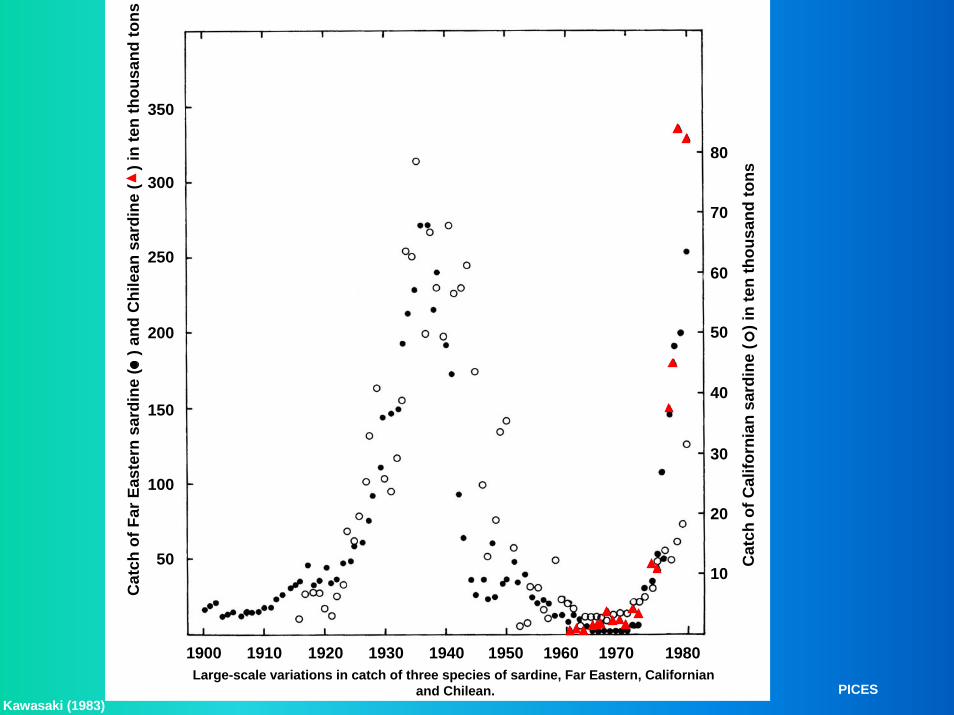
Kawasaki (1983)PICES
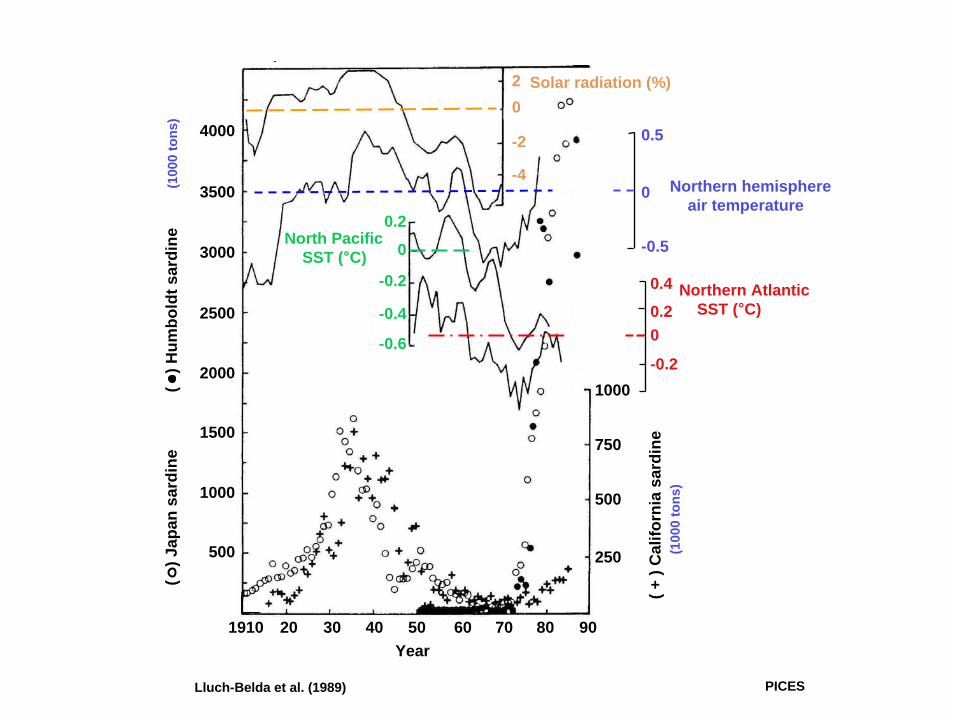
Large-scale variations in catch of three species of sardine, Far Eastern, Californian and Chilean.
Cat
ch o
f Far
Eas
tern
sar
dine
( )
and
Chi
lean
sar
dine
( )
in te
n th
ousa
nd to
ns
4000
3000
2500
3500
1000
2000
1500
500 250
500
750
1000
0.4
0.20
-0.2
0.5
0
-0.5
20
-2
-4
Solar radiation (%)
Northern hemisphereair temperature
Northern Atlantic SST (°C)
( + )
Cal
iforn
ia s
ardi
ne(1
000
tons
)
North Pacific SST (°C)
( )
Japa
n sa
rdin
e(
) H
umbo
ldt s
ardi
ne(1
000
tons
)
Year1910 20 60 70 80 9030 40 50
Lluch-Belda et al. (1989) PICES
0.2
-0.2
0
-0.4
-0.6
30-1.0
20
10
0
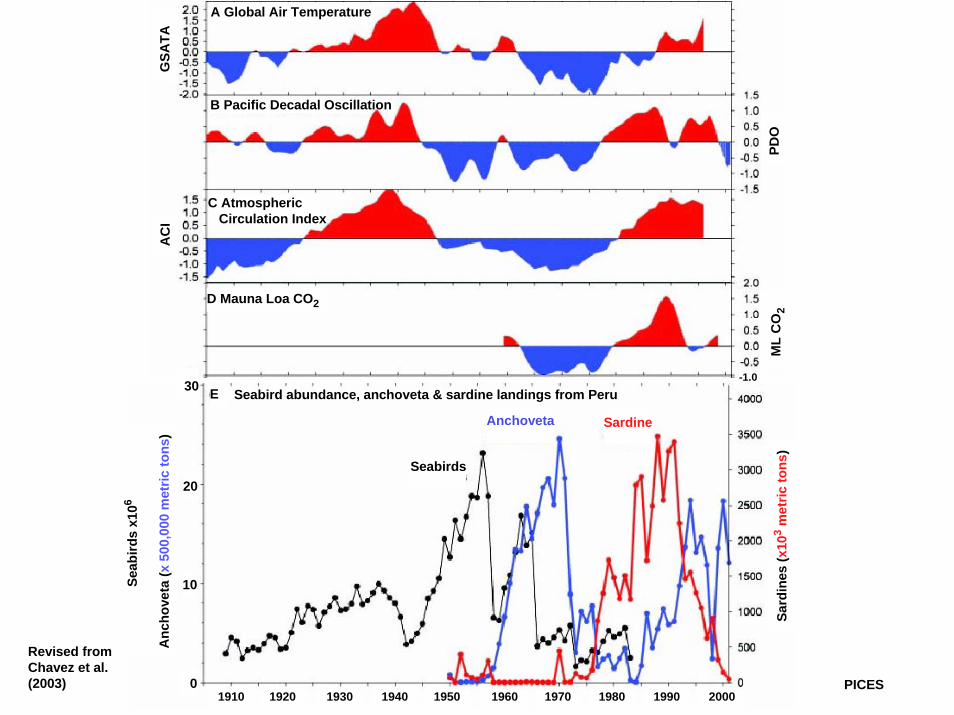
Seabirds
SardineAnchoveta
Sard
ines
(x10
3m
etric
tons
)
Seab
irds
x106
Anc
hove
ta(x
500
,000
met
ric to
ns)
ML
CO
2
D Mauna Loa CO2
PDO
C Atmospheric Circulation Index
B Pacific Decadal Oscillation
AC
IG
SATA
A Global Air Temperature
1910 1920 1930 1940 1950 1960 1970 1980 1990 2000
Revised fromChavez et al.(2003) PICES
E Seabird abundance, anchoveta & sardine landings from Peru
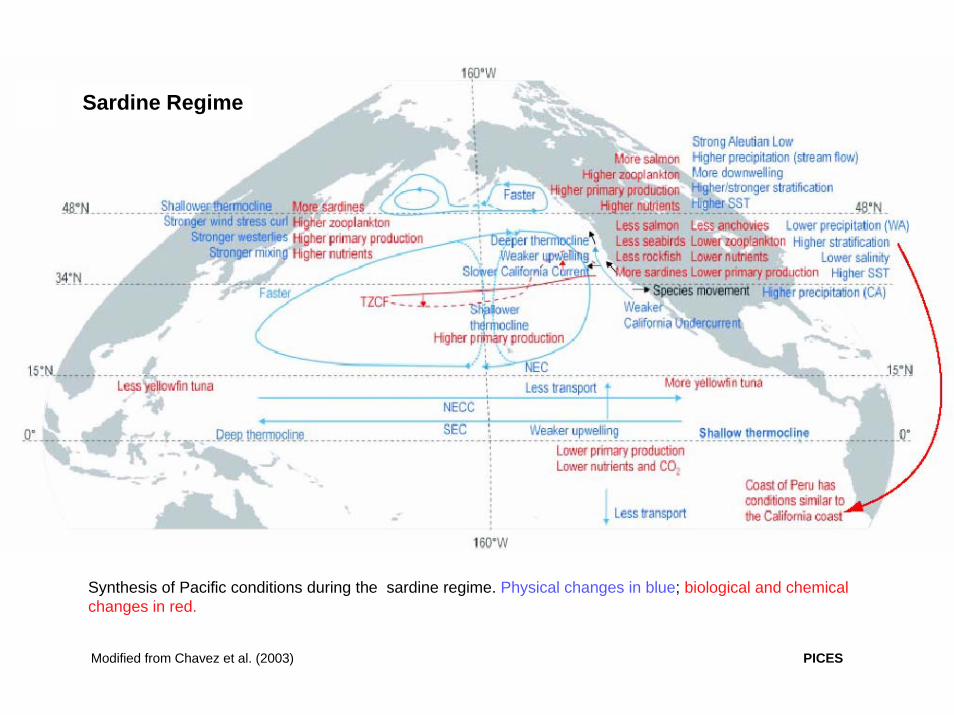
Synthesis of Pacific conditions during the sardine regime. Physical changes in blue; biological and chemical changes in red.
Modified from Chavez et al. (2003) PICES
Sardine Regime
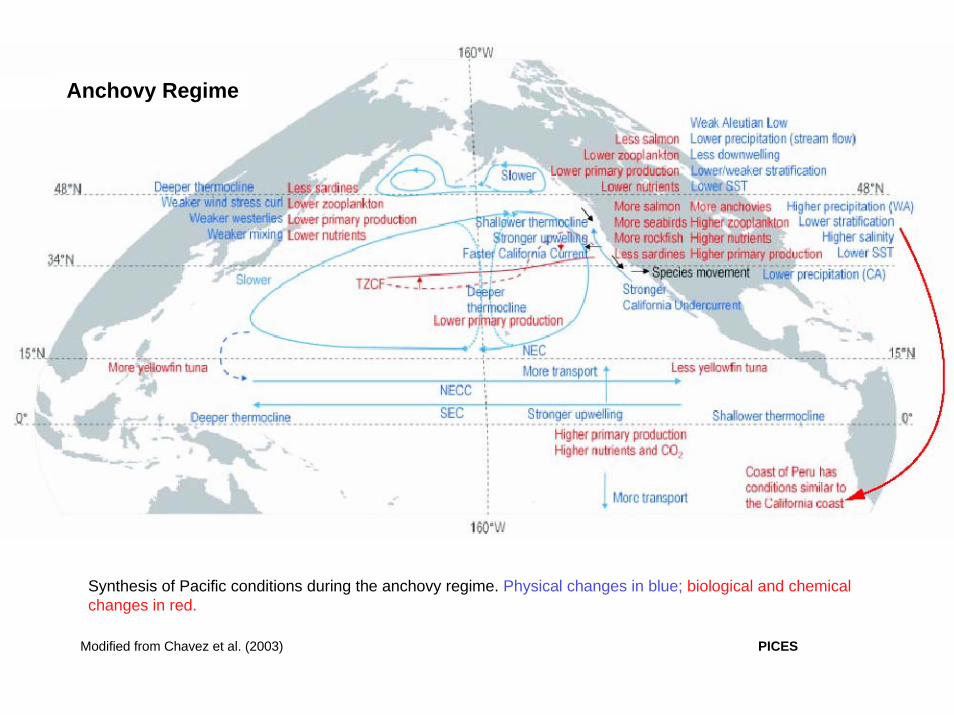
Synthesis of Pacific conditions during the anchovy regime. Physical changes in blue; biological and chemical changes in red.
Modified from Chavez et al. (2003)
Anchovy Regime
PICES
PICES
A GLOBAL SYNCHRONY IN HABS IS OCCURRING INDEPENDENT OF, BUT ENHANCED BY LOCAL AND REGIONALLY VARIABLE ANTHROPOGENIC FACTORS:
• Nutrient enrichment
• Warming, altered winds and physics
• Metapopulation hybridization (ballast vectoring)
• Food web modification (harvesting)
• Aquaculture
HYPOTHESIS
PICES
THERE IS NO UNIFORM EXPLANATION FOR THE HAB SYNDROME; i.e. THERE IS NEITHER A SINGLE, NOR A COMMON ANTHROPOGENIC CAUSE
ANTHROPOGENIC EFFECTS ARE EMBEDDED WITHIN THE GLOBAL HAB RHYTHM
ANTHROPOGENIC ENHANCEMENTS OF HABS ARE SECONDARY STIMULI TO THE GLOBAL SYNCHRONY DRIVER
HYPOTHESIS (cont.)

END