Embed Size (px)
Citation preview
Why are there more kinds of specieshere compared to there?
Theoretical Focus Conservation Focus
– Latitudinal Gradients
– Energy Theory
– Climate Attributes
– Faunal Integrity
– Human Footprint
– Habitat Attributes
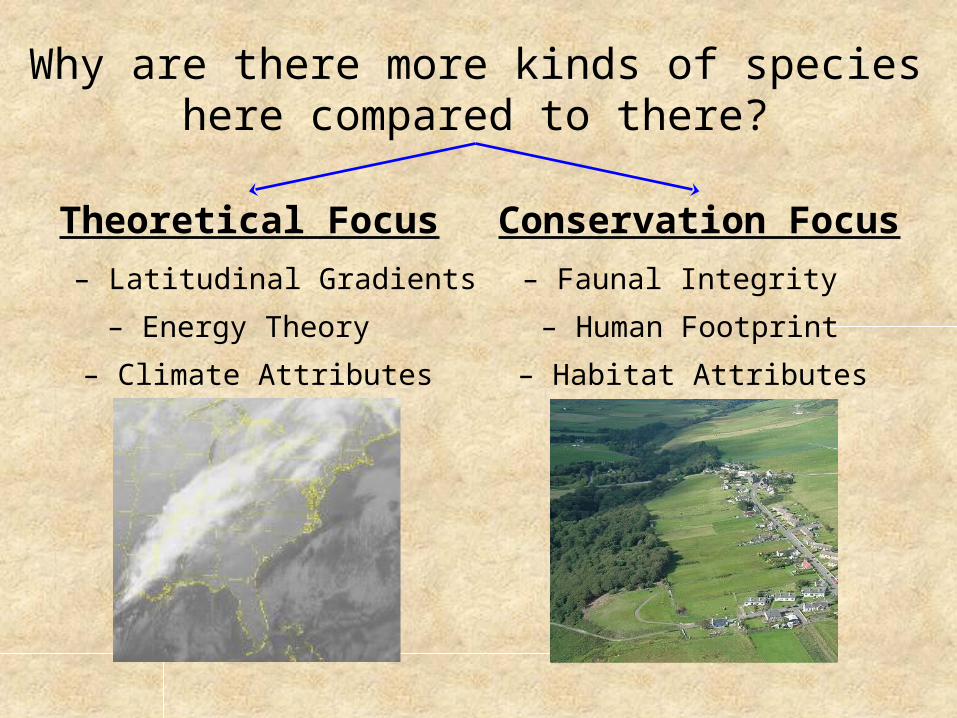
The Relative Importance ofClimate and Broad-scale Habitat
for Predicting Regional Bird Richness
Curtis H. FlatherUSDA, Forest Service Rocky Mtn Research StnFort Collins, Colorado
Kevin J. Gutzwiller Department of BiologyBaylor UniversityWaco, Texas
Outline
• Background
• Data sources and modeling approach
• Future work
• Model specification and performance
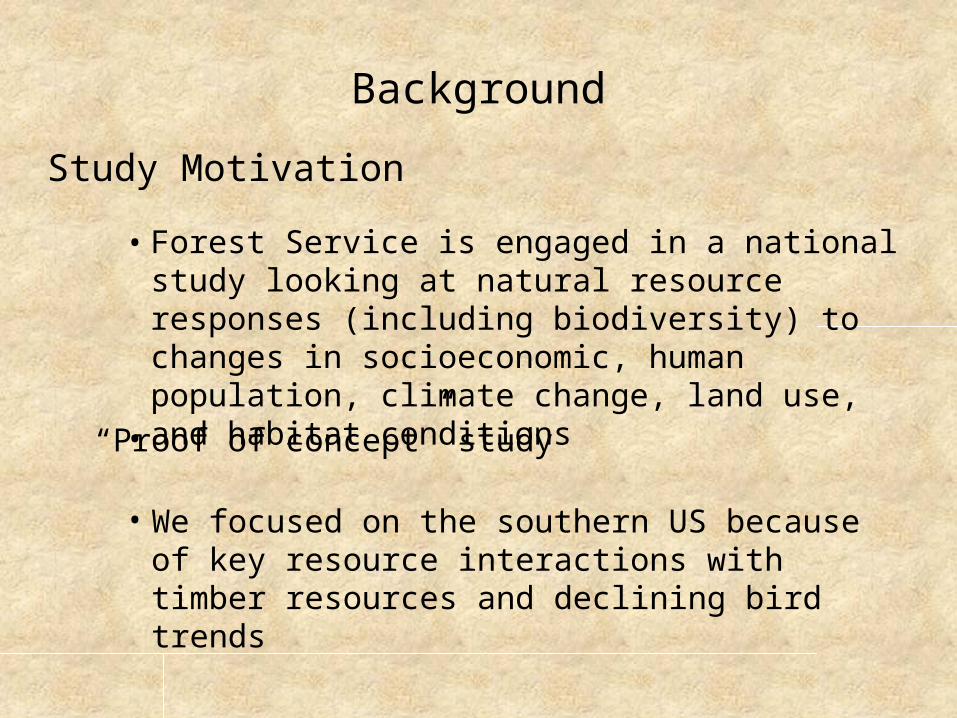
Study Motivation
• Forest Service is engaged in a national study looking at natural resource responses (including biodiversity) to changes in socioeconomic, human population, climate change, land use, and habitat conditions
• We focused on the southern US because of key resource interactions with timber resources and declining bird trends
Background
• “Proof of concept” study
Data Source
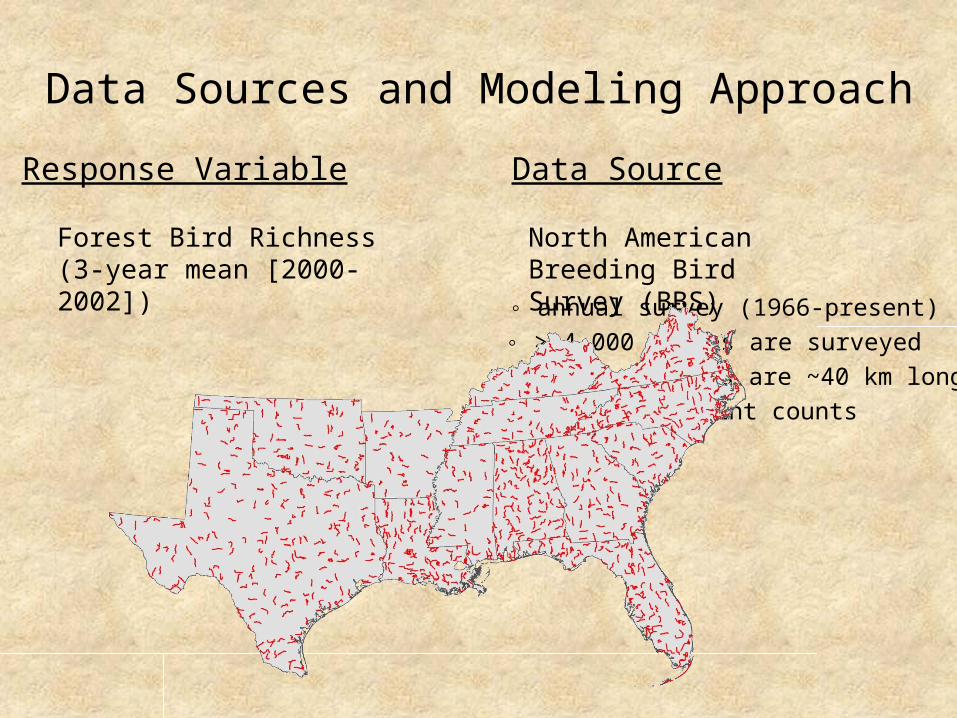
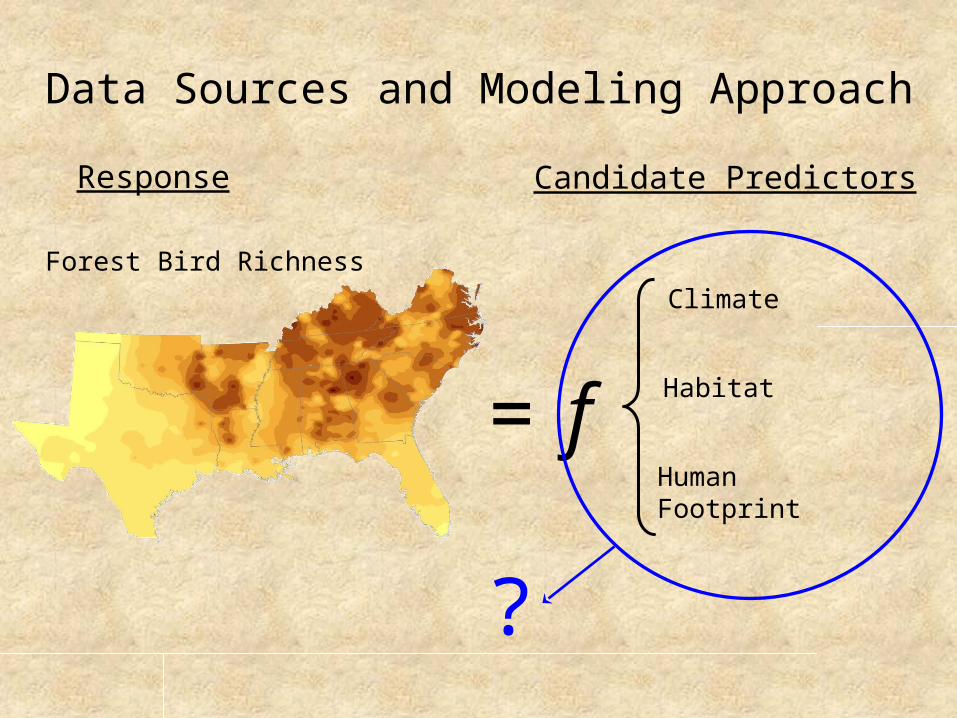
Data Sources and Modeling Approach
Response Variable
Forest Bird Richness(3-year mean [2000-2002])
North American Breeding Bird Survey (BBS)
◦ annual survey (1966-present)
◦ 50, 3-min point counts
◦ survey routes are ~40 km long◦ > 4,000 routes are surveyed
Data Source
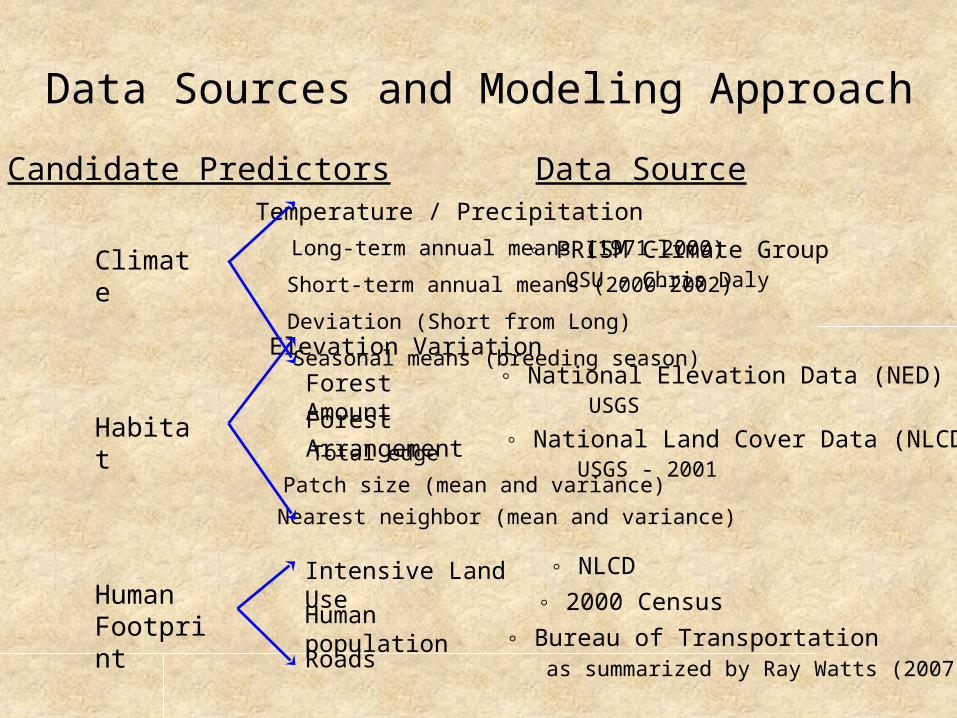
Data Sources and Modeling Approach
Candidate Predictors
Climate
HumanFootprint
Habitat
Long-term annual means (1971-2000)
Short-term annual means (2000-2002)
Deviation (Short from Long)
Seasonal means (breeding season)
Temperature / Precipitation
Elevation Variation
Forest Amount
Forest Arrangement
Patch size (mean and variance)
Nearest neighbor (mean and variance)
Total edge
◦ PRISM Climate GroupOSU - Chris Daly
◦ 2000 Census
◦ NLCD
◦ Bureau of Transportationas summarized by Ray Watts (2007)
Intensive Land Use
Human population
Roads
◦ National Land Cover Data (NLCD)USGS - 2001
◦ National Elevation Data (NED)USGS
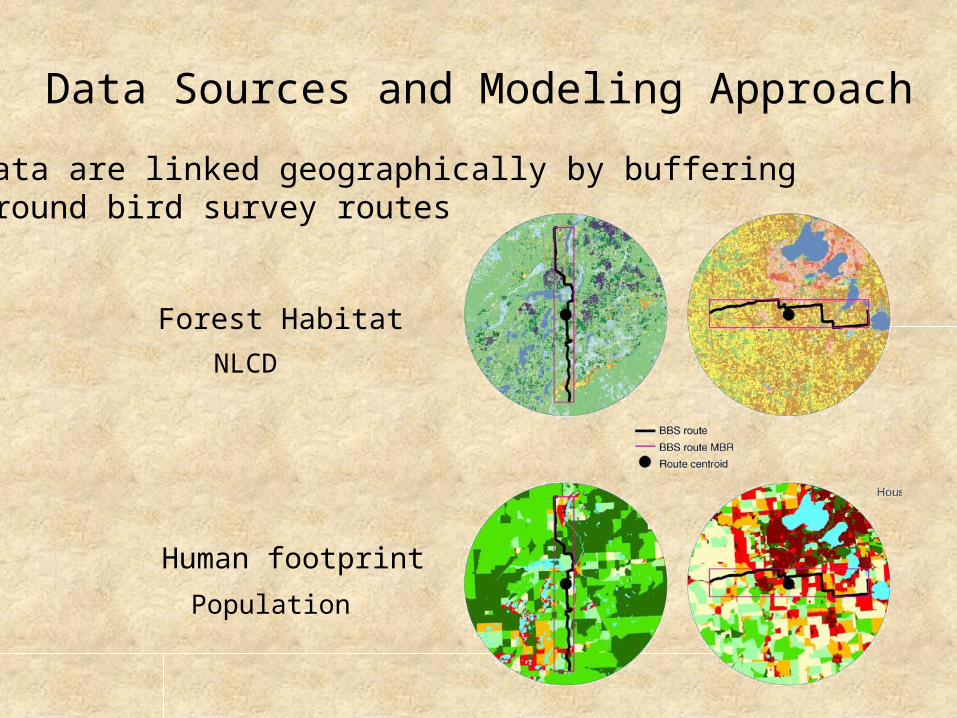
Data are linked geographically by bufferingaround bird survey routes
Data Sources and Modeling Approach
Human footprint
Forest Habitat
NLCD
Population
Data Sources and Modeling Approach
Forest Bird Richness
= fHabitat
HumanFootprint
Climate
Response Candidate Predictors
?
Data Sources and Modeling ApproachModel Estimation
◦ Multivariate Adaptive Regression Splines (MARS)
- Highly flexible modeling approach
- Nonparametric and will fit local / global relations
- Found to perform well in recent ecological applications
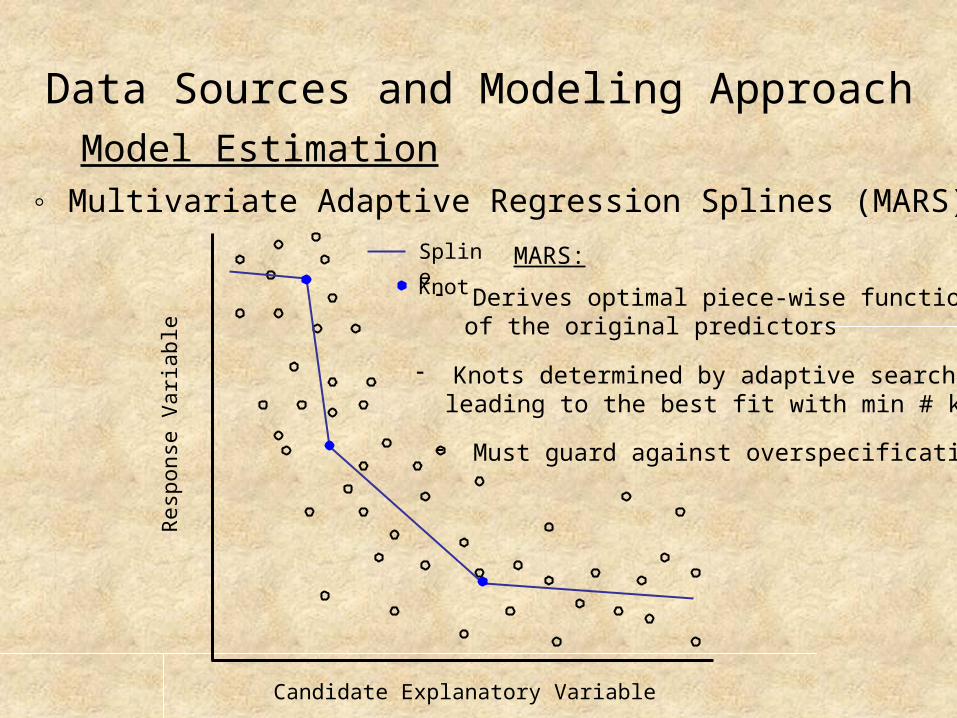
Data Sources and Modeling ApproachModel Estimation
◦ Multivariate Adaptive Regression Splines (MARS)
Knot
Spline
Candidate Explanatory Variable
Res
pons
e V
aria
ble
MARS:
- Derives optimal piece-wise functions of the original predictors
- Knots determined by adaptive search leading to the best fit with min # knots
- Must guard against overspecification
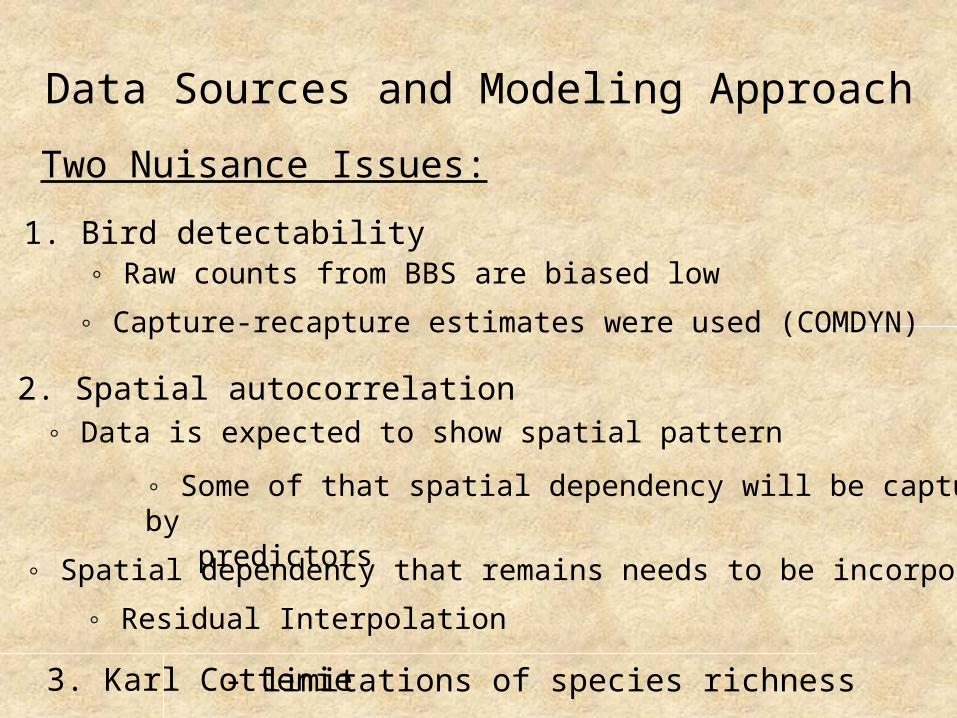
Data Sources and Modeling Approach
Two Nuisance Issues:
1. Bird detectability◦ Raw counts from BBS are biased low
◦ Capture-recapture estimates were used (COMDYN)
2. Spatial autocorrelation◦ Data is expected to show spatial pattern
◦ Some of that spatial dependency will be captured by predictors
◦ Spatial dependency that remains needs to be incorporated
◦ Residual Interpolation
3. Karl Cottenie - limitations of species richness
Model Specification & Performance
◦ N = 426 routes
Train = 326
Test = 100
◦ Two stages in the analysis
Main effects model
Main effects + interactions
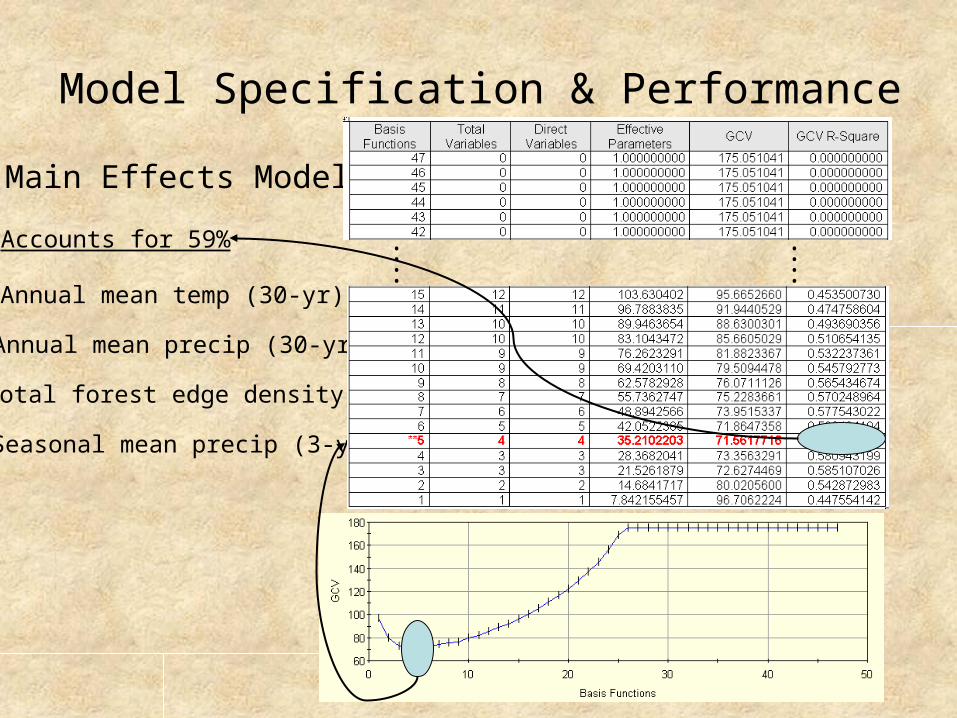
Main Effects Model
Annual mean temp (30-yr)
Annual mean precip (30-yr)
Total forest edge density
Seasonal mean precip (3-yr)
••••
••••
Accounts for 59%
Model Specification & Performance
Model Specification & Performance
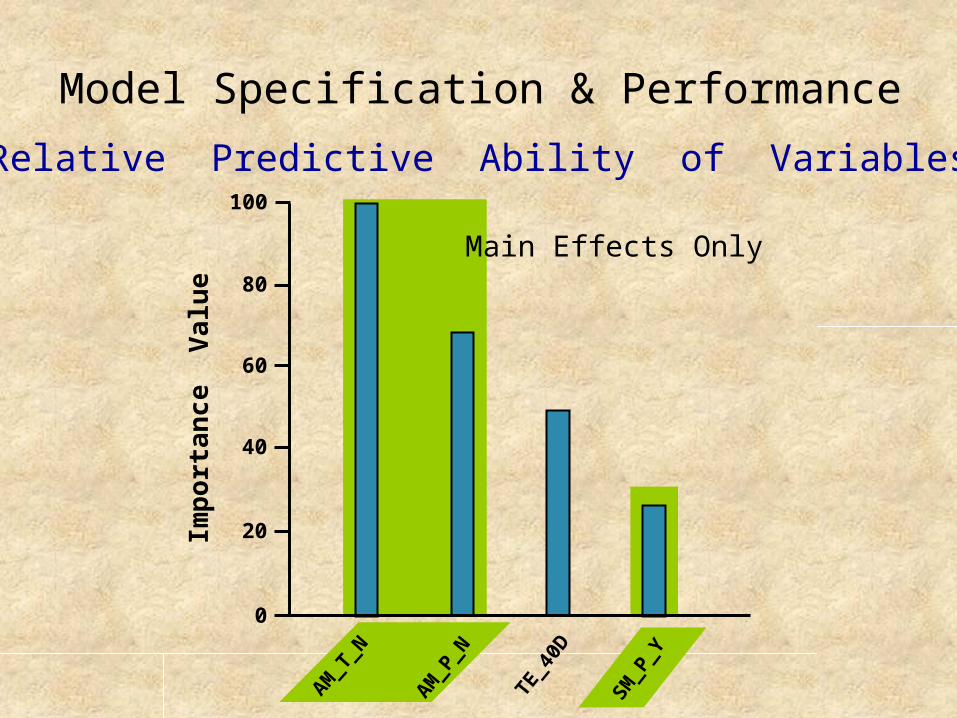
Relative Predictive Ability of VariablesIm
po
rta
nce
Va
lue
0
20
40
60
80
100
TE_4
0D
SM_P
_Y
AM_P
_N
AM_T
_N
Main Effects Only
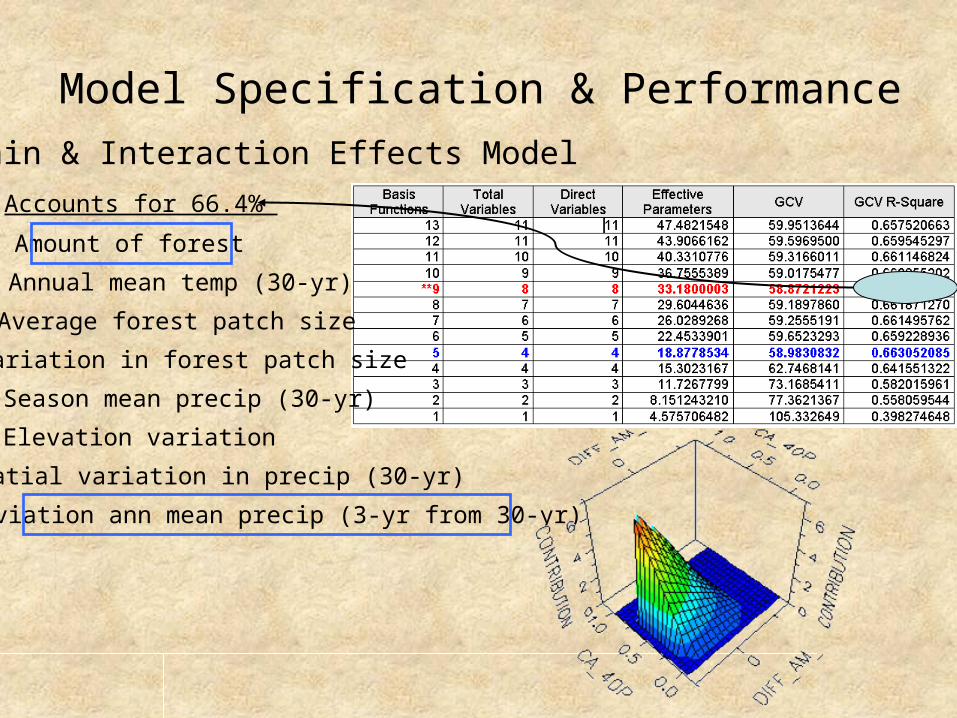
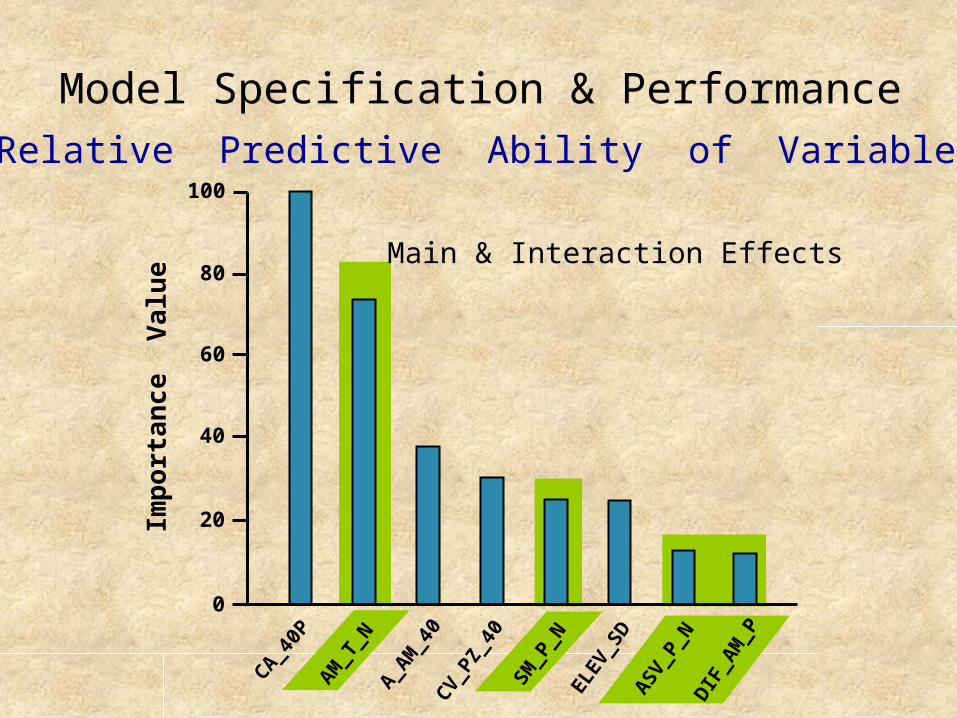
Main & Interaction Effects Model
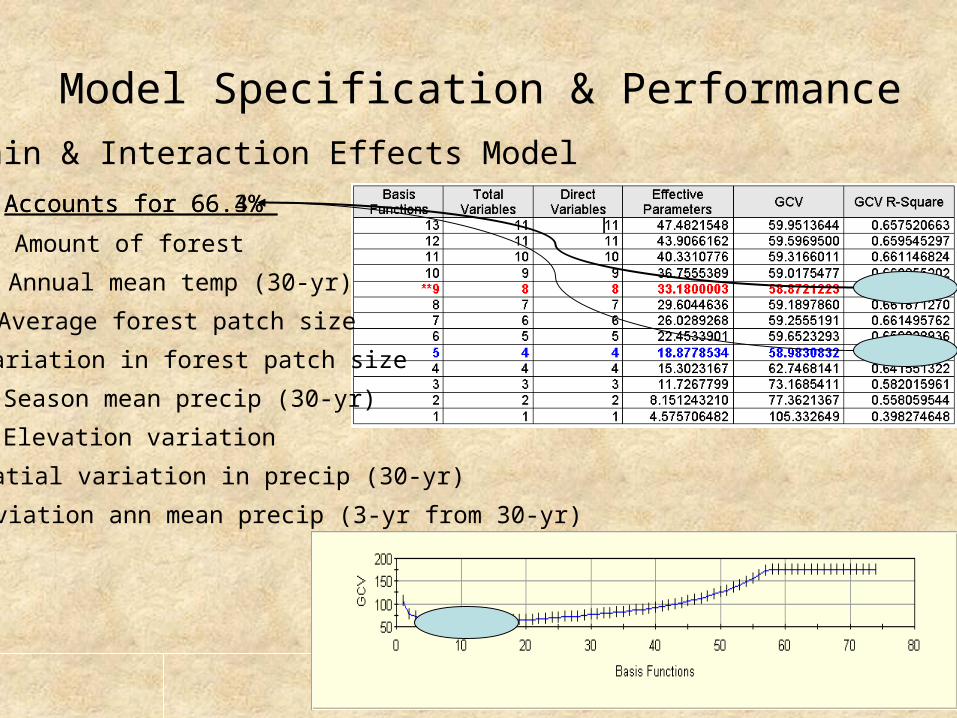
Accounts for 66.4%
Annual mean temp (30-yr)
Amount of forest
Average forest patch size
Variation in forest patch size
Season mean precip (30-yr)
Elevation variation
Spatial variation in precip (30-yr)
Deviation ann mean precip (3-yr from 30-yr)
Model Specification & Performance
Imp
ort
an
ce V
alu
e
0
20
40
60
80
100
SM_P
_N
A_AM
_40
CV_
PZ_4
0
AM_T
_N
ELEV
_SD
ASV
_P_N
DIF
_AM
_P
CA_40P
Main & Interaction Effects
Relative Predictive Ability of Variables
Model Specification & Performance
Accounts for 66.4% Accounts for 66.3%
Annual mean temp (30-yr)
Amount of forest
Average forest patch size
Variation in forest patch size
Season mean precip (30-yr)
Elevation variation
Spatial variation in precip (30-yr)
Deviation ann mean precip (3-yr from 30-yr)
Model Specification & Performance
Main & Interaction Effects Model
Imp
ort
an
ce V
alu
e
0
20
40
60
80
100
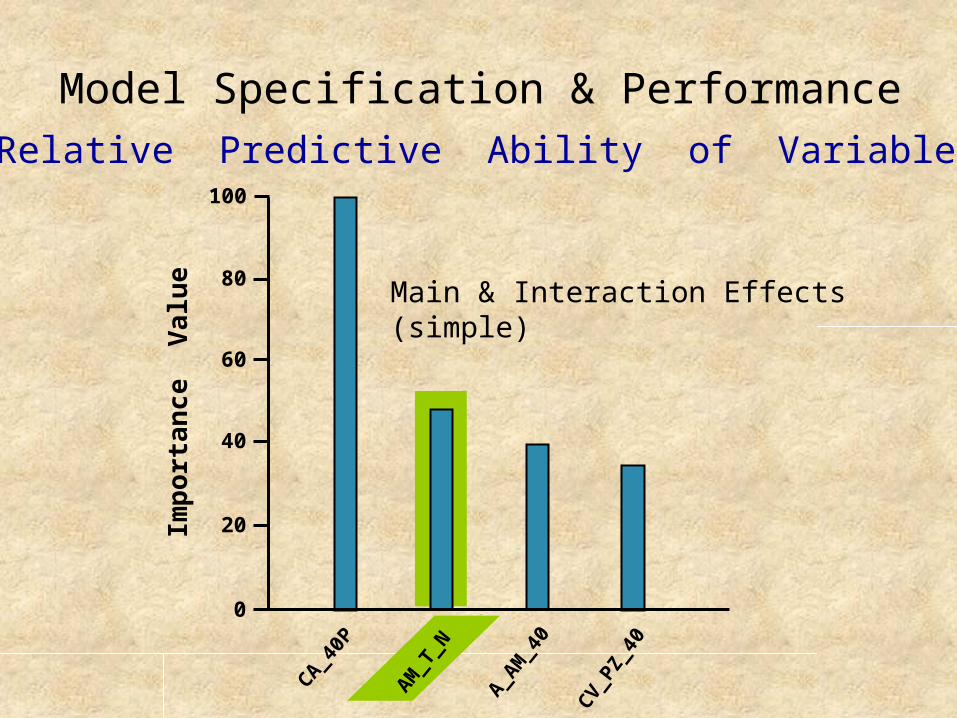
A_AM
_40
CV_
PZ_4
0
AM_T
_N
CA_40P
Main & Interaction Effects(simple)
Relative Predictive Ability of Variables
Model Specification & Performance
Model Specification & Performance
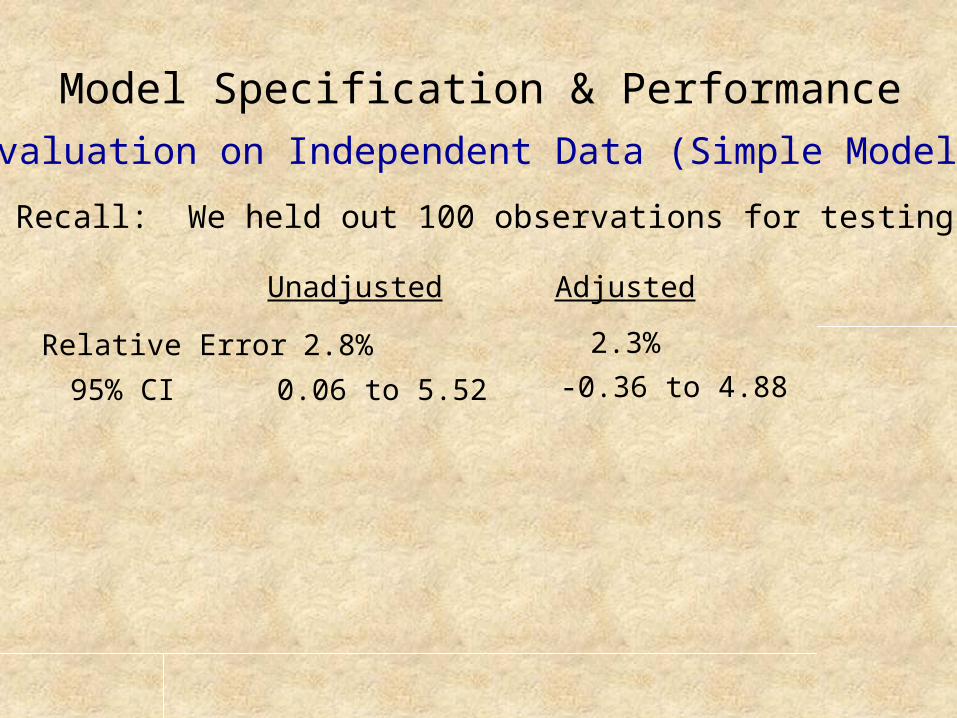
Evaluation on Independent Data (Simple Model)
◦ Recall: We held out 100 observations for testing
Unadjusted
Relative Error 2.8%
95% CI 0.06 to 5.52
2.3%
-0.36 to 4.88
Adjusted
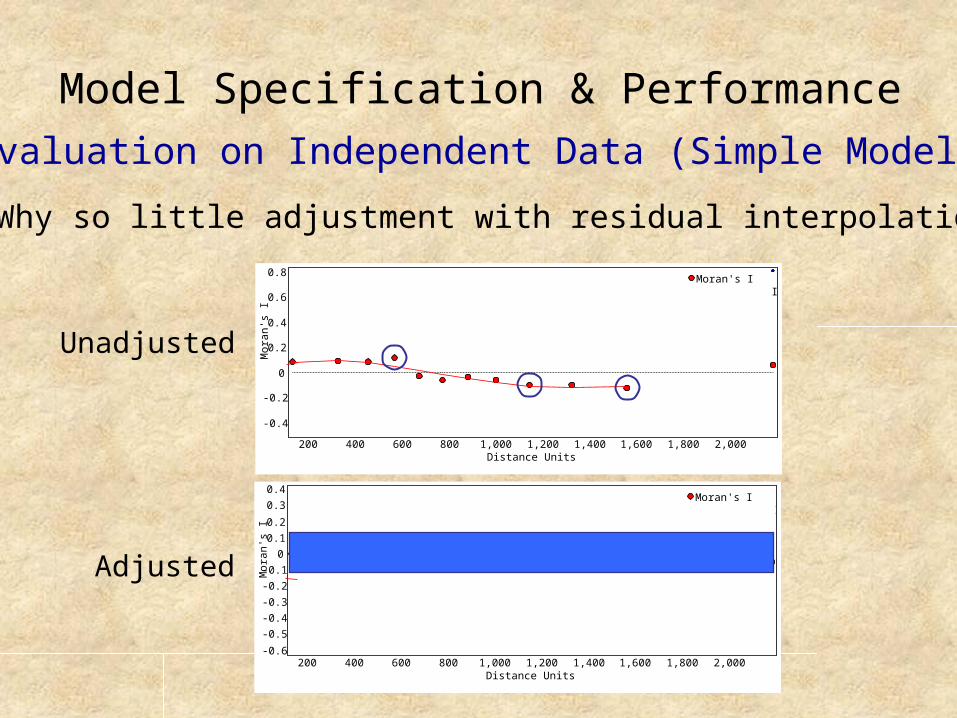
Moran's IMax Moran's I
Distance Units2,0001,8001,6001,4001,2001,000800600400200
Mor
an's
I0.8
0.6
0.4
0.2
0
-0.2
-0.4
Moran's IMax Moran's I
Distance Units2,0001,8001,6001,4001,2001,000800600400200
Mor
an's
I
0.4
0.3
0.2
0.1
0
-0.1
-0.2
-0.3
-0.4
-0.5
-0.6
Model Specification & Performance
Evaluation on Independent Data (Simple Model)
◦ Why so little adjustment with residual interpolation?
Unadjusted
Adjusted
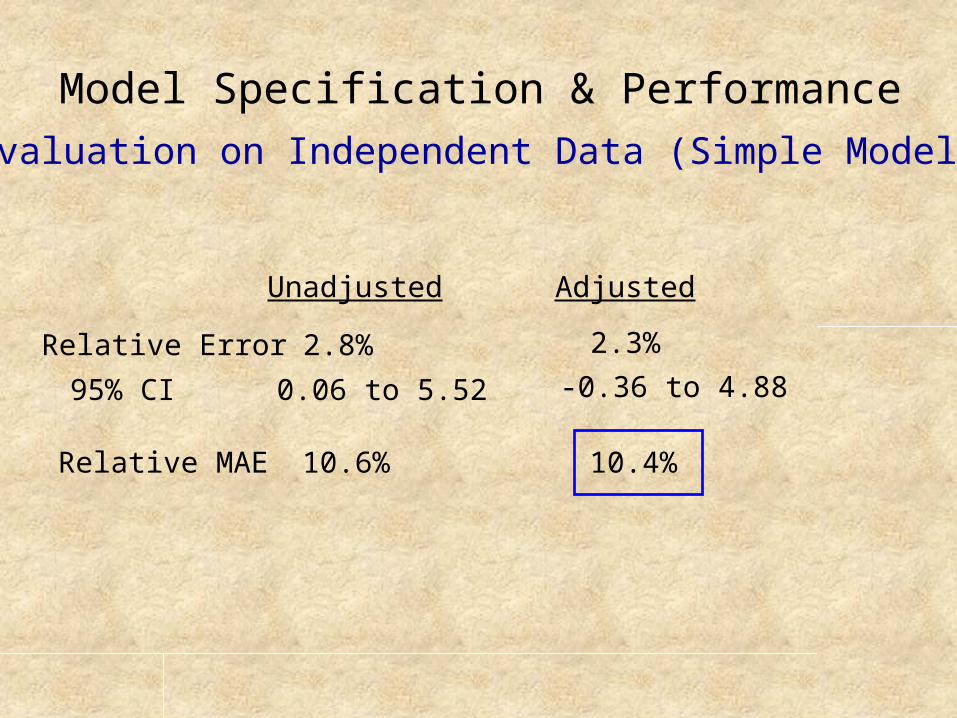
Model Specification & Performance
Evaluation on Independent Data (Simple Model)
Relative MAE 10.6% 10.4%
Unadjusted
Relative Error 2.8%
95% CI 0.06 to 5.52
2.3%
-0.36 to 4.88
Adjusted
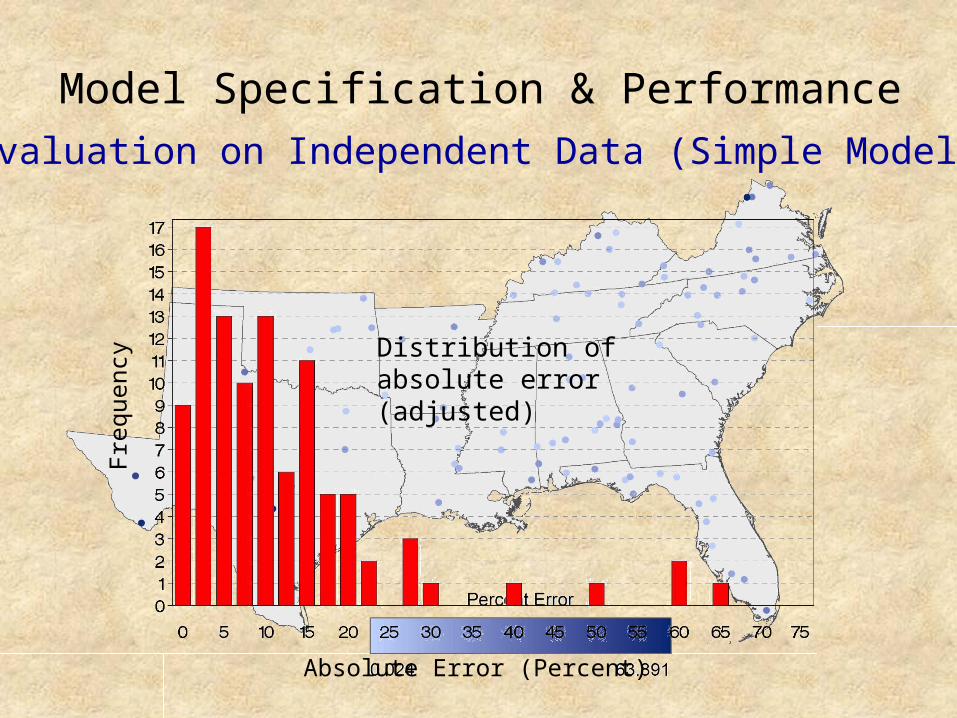
Model Specification & Performance
Evaluation on Independent Data (Simple Model)
Distribution of absolute error(adjusted)
Fre
quen
cy
Absolute Error (Percent)
Conclusions
◦ Climate and habitat characteristics are both important in predicting forest bird richness
◦ Predictive strength was generally greater for habitat-related predictors
◦ Results suggest a tradeoff: parsimony versus complexity
◦ Models provided predictions that on average had little bias but a substantial amount of residual variation remains
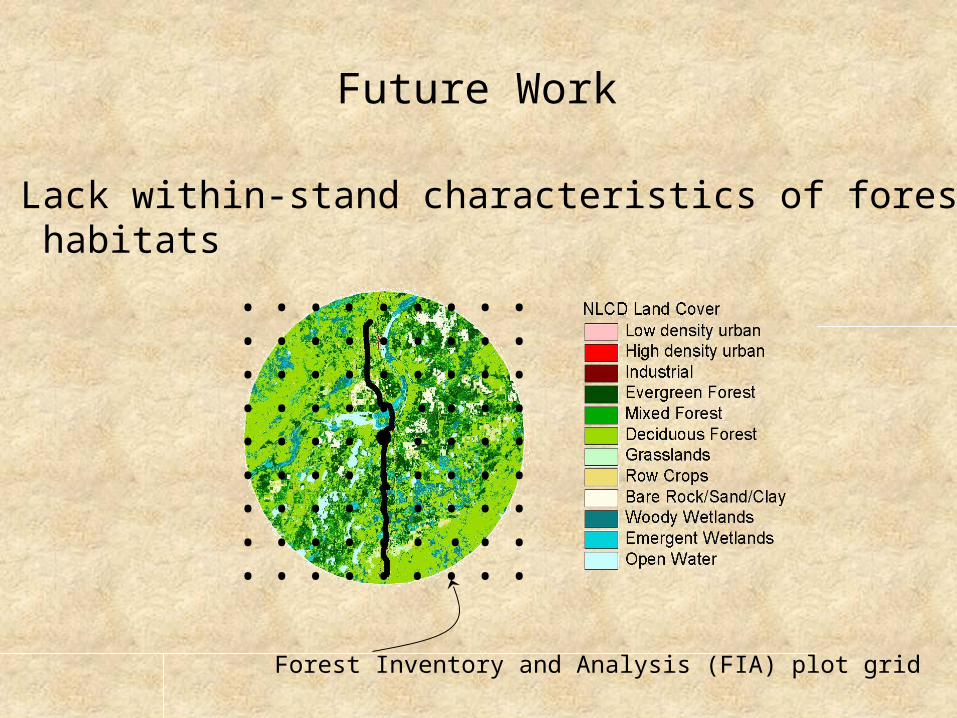
Future Work
◦ Lack within-stand characteristics of forest habitats
• •• • •• • ••• •• • •• • ••• •• • •• • ••• •• • •• • ••• •• • •• • ••• •• • •• • ••• •• • •• • ••• •• • •• • ••• •• • •• • ••
Forest Inventory and Analysis (FIA) plot grid