Embed Size (px)
Citation preview

DNV GL copy 2017 SAFER SMARTER GREENER DNV GL copy 2016 1
Regional Meeting of Asia-Pacific Least Developed Countries on Sustainable Energy
Kathmandu Nepal
22-23 March 2017
1 DNV GL copy 2017
How can DNV GL contribute in Project Preparation
Andreacute Rauwerda MBA
DNV GL copy 2017
Agenda
1 Introduction to DNV GL and DNV GL Energy
2 Due diligence
3 Climate adaptation amp resilience
4 Rural sustainable power generation
2
DNV GL copy 2017
1 Introduction to DNV GL and DNV GL Energy
3
DNV GL copy 2017
DNV GL enables right decision making in a complex world
4 4
MARITIME OIL amp GAS ENERGY BUSINESS
ASSURANCE
SOFTWARE
We are a global classification certification technical
assurance and advisory company
DNV GL copy 2017
DNV GL ndash Energy
An energy powerhouse supporting the energy industry across the value chain from policy to use with strategic advise planning implementation and energy delivery optimization
Service Lines
Markets and Policy Development
Power System Planning
Renewable Energy Integration
Asset Management Operational Excellence
New Energy Technologies
5
Key Deliverables bull Business strategy across all markets
bull Power system design and modelling
bull Technology implementation services
bull Operations and systems optimization
Innovation accelerators bull Smart Grids and Smart Energy Cities
bull Super grids and Micro grids bull Energy storage and renewables
bull Data analytics and Cyber security
DNV GL copy 2017
We provide independent assurance
Governments
bull Set up regulatory framework
bull Technical master planning road mapping
Project developers Investors (vendors buyers)
bull Technical and Environmental Due Diligence
bull Power price curve forecasting
bull Business plans (development review)
bull Certification of assets eg wind turbines solar plants hydro plant
Asset owners operators
bull Asset management planning
bull Operations amp Maintenance strategy (development verification)
Manufacturers of power equipment
bull Testing and certification of equipment
Community
bull Capacity building training
DNV GL copy 2017
2 Due diligence
7
DNV GL copy 2017
Where do DNV GL and Financial Institutions Investors and Developers meet
8 8
New technology
assessment
Due diligence ndash
energy assets
Risk
management
Knowledge
exchange
Bridge gap between
technical and
financial worlds
Breakfast sessions
Presentations
Project review
Technical cost and
schedule risk
assessments
Tools and training
Quality Assurance
Technical
Environmental
Regulatory
Cyber security
Buyer vendor
Bankability
Technology readiness
Start-ups
Strategy development
Road mapping
DNV GL copy 2017
In recent history we have advised in hundreds of due diligence projects significantly reducing the investorsrsquo risk position
9
gt250000 km of transmission and
distribution cables and
overhead lines
OUR DUE DILIGENCE EXPERIENCE IN THE LAST FIVE YEARS
gt30 GW installed capacity in
onshore and offshore
wind energy
gt1000 projects concerning solar
power installations
gt5 GW installed capacity in
thermal power
production
gt5000 km of heat transmission
and distribution
pipelines
gt100000 km of gas transmission
and distribution
pipelines
DNV GL copy 2017
Theory - Definition Due Diligence (1)
Due diligence takes different forms depending on its purpose
1 The examination of a potential target for merger acquisition privatization or
similar corporate finance transaction normally by a buyer (This can include
self due diligence or ldquoreverse due diligencerdquo ie an assessment of a company
usually by a third party on behalf of the company prior to taking the company
to market)
2 Reasonable investigation focusing on material future matters
3 An examination being achieved by asking certain key questions including
how do we buy how do we structure an acquisition and how much do we
pay
4 An investigation of current practices of process and policies
5 An examination aiming to make an acquisition decision via the principles of
valuation and shareholder value analysis
Gillman Luis (2010) Due Diligence a Strategic and Financial Approach (2nd ed) Durban LexisNexis ISBN 978-0-409-04699-1
DNV GL copy 2017
Theory ndash DD Elements (2)
11
External Audit Market and business development legal political
and socio-economical conditions
Com
pany a
naly
sis
Financial
audit
Strategic
audit
Legal
audit
Environ-
mental
audit
Organi-
zational
audit
Manage-
ment
audit
Marke-
ting audit
Technical
audit
Site visit
techical
analysis
IT
Risks
Costs
Opportu-
nities
Products
patents
licences
RampD
Sales
organi-
zation
Company
culture
personel
Manage-
ment
structure
- style
Organi-
zational
structure
corporate
connec-
tions
Environ-
mental
risks
Conta-
minated
sites
Legal
aspects
contracts
Processes
Regula-
tory
aspects
Stratigic
goals
potential
values
Accoun-
tancy
Pension
obliga-
tions
Funding
tax
Due Diligence Report
DNV GL copy 2017
DNV GL defines three types of due diligence services within the energy sector
12
Due diligence
Feasibility Operations Commissio-
ning
Product life cycle
DNV GL copy 2017
DNV GLrsquos Services in Asset Transactions
13
Legal Due Diligence Risk Analysis Laws Politics Country Specific Laws Deregulation
Integral Contractual Arrangement PPA Fuel Supply Contract OampM Contract EPC Contract Management Contract Concession Agreement Shareholder Agreement Land Use Agreement Credit Contracts
Public Acceptability Risk Analysis Local Support
Goals Highest Return Low Risk
Risk Analysis Mitigation Pass Through Insurance Project
Financing Bankability Country Risks
Market Analysis Demand Side Studies Fuel Price Development Combined Energy Supply Competition Analysis Alliances Assessment Supply Side Studies Country Comparison
Business Plan Optimization Management Operation Staffing Benchmarking
Commercial Analysis Sensitivities Risk Analysis Economical Results
Technical and Regulatory Due Diligence Dependency on Bankability Turnkey Contractor Selection Risk Analysis Appropriate Sizing Technical Alternatives Cost Assessment Implementation Management
DNV GL copy 2017
Approach
15
Gather and review
contracts and
technical DD
information
Risk based assessment and analysis
Red flag report
Final report
Kick off Meeting
Based on the review identify assess and rank risks within the contractual and technical scope Establish corrective actions for closing the gaps
Draft report and present to customer Upon receipt of feedback from customer provide the final report The results of the due diligence should serve as direct input to the financial model reps and warranties
Introduction of project teams finalizing scope and approach finalizing project
procedures
Number Name Description Prob Impact Meuro Prob
Impact
total Meuro
Risk Meuro Mitigation Comment
1 Establish and maintain good
relation with ACME Grid
2 Establish legal position of B-
corp and ACME grid if delay is
caused by ACME
3 Acquire information on
process by ACME grid
4 establish lobby contacts to
relevant politicians officials and
other wind farm operators to
keep the political pressure
1 Hiring experts with offshore
experience in project team
2 Include contingencies in
project planning
3 Select suppliers with
sufficient planning contingency
1 Very accurate mapping of as
built cable situation
2 Strict adherence to
procedures for operations within
windfamr
3 designed dockingplaces for
ships within windfarm
4 Close observation on local
shipmovements
5 Adequate condition
monitoring of cables and burial
depth
1 Discuss with local authorities
2 Set procedure for acquiring
land in working
3 Create goodwill with local
community
4 Acquire as soon as possible
1 Limited construction
activities in winter season
2 Include contingencies in
project planning
20 60
1Onshore grid
connection
Cable amp onshore works of
ACME not ready in time loss of
production
High 70 30 70
50 25
21
ACME has a legal obligation to
connect realistic projects
They will act in time if all
contracts are in placein time
and the risk profile of the
project is relatively low
2Interface
management
Timeline interfaces and set of
contractors not working as one
team leading to project delays
Medium gt 10month
30 10
12
3Cable
damages
The productivity of the windfarm
is highly dependable on its
internal cables and on the
ACME onshore cable Cable
damage can occur through a
number of reasons anchor drag
fishing freespaning etc This
could cause loss of output for a
string of turbines or loss of
output for the entire windfarm
Medium 25
20 10
125
The measures are not
extensive but have been limited
to the main measures B-Corp
cannot secure the integrity of
the ACME cable Currently
studies on necessity of extra
insurances are being made
4
Acquisition of
the German
base
B-Corp can not secure a base
for OampM in GermanyLow 10 3
The German government is
positive and willing to sell land
to B-corp It will however be a
public sale as required by
regulation If B-Corp does not
succeed consequences are
hugh All OampM by helicopter
flights and weather windows
will be more critical for
shipping movements
5Accessibility
risk
Weather circumstances leading
to time delay beyond calculated
margin
Low gt 10month 2
Data
room
Review of the Technical Project Concept contracts time schedule systems and component information Review relevant financial information from contracts and tender documents Collect and systemise information
Structure results and write draft report
Based on the risk analysis identify risks as potential show-stoppers Update daily
Delivery of final report and customer project evaluation
DNV GL copy 2017
CAPEX Review amp Benchmark
16
DNV GL independently assesses the CAPEX and OPEX of the assets under investigation
CAPEX We assess all aspects of the CAPEX of the asset 1 Replacement CAPEX 2 Expansion CAPEX 3 Compliance CAPEX
Benchmarking With our extensive experience we are able to benchmark these costs and make an accurate estimate of the future CAPEX costs related to market regulation and technical developments
DNV GL copy 2017
OPEX Review amp Benchmark
We evaluate the operational expenditures
related to the asset
We give an independent projection on the
development of your OPEX
With our 150 years hands on experience
we can give an accurate judgement on the
costs related to Maintenance and Operation
of the asset Furthermore we can also
benchmark these costs against
international similar assets
For example DNV GL has top class integrity
experts in-house to assess the current
state and future state of assets at the
energy value chain
17
DNV GL copy 2017
Projections of Regulated Revenues
18
Besides an accurate judgment of the costs the expected revenues are thoroughly reviewed
Future revenues are however highly dependent on future developments of the regulatory framework and the market
We provide projections of future regulated allowed revenues resulting tariffs and actual demand developments within the electricity market and identify and quantify potential risks resulting from future regulatory developments
DNV GL copy 2017
Business Case Development
DNV GL always provides the client with
a tailor made solution to assist and
support in making a healthy
investment decision
We review and benchmark your
investment decisions
We give projections on critical
contextual developments
ndash Tariff development
ndash Legal Compliance (new CO2
environmental or safety standards)
ndash Market development (supply and
demand projections)
Based on a diverse set of parameters
we independently develop a financial
model
19
DNV GL copy 2017
DNV GL Offers Unique Due Diligence Services
DNV GL has a long history of operational
regulatory and market experience
With our multidisciplinary expertise we are able to
accurately review audit and evaluate energy
assets
We make sure we give an accurate and integrated
reflection of the risks costs (CAPEX and OPEX)
and returns accompanying a decision to buy or sell
an energy asset
We advise both on the Buyerrsquos and Vendors side
We cover the entire energy value chain
We offer technical environmental regulatory and
commercial advisory services
20
DNV GL copy 2017
Our Capabilities in Detail
Regulatory capabilities Establishment of regulatory asset base Regulatory treatment of CAPEX and OPEX Revenue setting design and modelling Assessment of regulatory and political risks Risk mitigation strategies Institutional analysis Economic benchmarking and efficiency analysis Financial performance analysis including full-fledged financial
modelling
21
Commercial Market capabilities Analysis of the market design market arrangements (capacity
markets balancing markets etc) Access arrangements Quantitative modelling Price forecasting System expansion planning Competition analysis
Technical Capabilities Assessment of the assets condition site visits Analysis of technical operating data operating regimes and flexibility
of the assets Assessment of planning maintenance and investment (reinforcement
and extension) policies Forecasting capital and operating expenditures Business process analysis Application of quantitative methods and techniques Environmental assessment health and safety assessment
DNV GL copy 2017
Our reports identify technical risks in bankable language and contain suggestions for mitigation and impact (CAPEX OPEX)
22
DNV GL copy 2017
DNV GL has advised a wide range of owners of and investors in energy industry assets ndash a selection of clients is shown below
23
INVESTMENT BANKSPRIVATE EQUITY FUNDS ASSET OWNERS
DNV GL copy 2017
3 Climate adaptation amp resilience
24
DNV GL copy 2017
From climate data to adaptation decision making with ADAPT an application to a Vietnamese coastal city for a regional investor
Private and confidential
25
ADAPT
Climate
Projections
Hazards
Impacts
Risk
Risk
Manage-ment
Measures
Cost-
Benefit Analysis
Local sea level change
Historic river discharge
Storm surge
River flood
On planned and
existing
infrastructure
Risk-scenario based approach
Recommendations to
elevate infrastructure
Adaptation
costs
DNV GL copy 2017
Results coastal flooding maps for various flooding scenarios with inclusion of regional sea level rise
26 26
Without Sea level rise With Sea level rise
These results were used to preliminarily evaluate elevation adaptation
strategies for the site for a number of infrastructures
An initial screening of
different climatic threats
including analysis of regional
climate change projections
highlighted the relevance of
sea level rise for future
exposure of the site against
climatic threats A coastal
flooding analysis was carried
out incorporating sea level
projections
DNV GL copy 2017
Estimated area of residential building footage 880000 m2 (95M square feet)
Adaptive cost of elevation works per squared foot preliminary range estimate
32-108 USD
Raising costs for residential units
27
025m 085m
Estimated total cost for residential units [MUSD]
290-920 320-950
DNV GL copy 2017
Climate and Weather Databases
28
DNV GL copy 2017
Hazard Databases (including LIVEfeeds)
29
DNV GL copy 2017 30
Local hazard ndash Flooding at East River Electrical Substation (NY)
DNV GL copy 2017
4 Rural sustainable power generation
31
DNV GL copy 2017
Modelling amp tooling (economics dispatch and balancing) ndash Rural sustainable power generation
32
Service description
Project references
Value for Asia Pacific - Least Developed Countries
DNV GL has a modelling suit that is capable of a variety of analyses market models balancing frequency models and load-flow models The market model optimizes the dispatch of the assets given certain market conditions The market model assesses the value and the costs of assets in a particular electricity market such as the European market but can also be used for island-type systems The balancing model simulates the balancing frequency and can assess how good an asset can contribute to maintaining the right frequency or can assess the impact of a certain event on the frequency Both models can be used for any system market and for multiple scenarios of the future Other tools include operational amp investment modelling used to identify operational value of DER and to incorporate into investment calculations SOPRA CSGrip is a modular platform for off-grid (rural) power supply integrating (optimizing) renewable energy sources energy storage and diesel generator (back-up power)
bull Insight in business cases of microgrids (eg optimization of dispatch
microgrid costs vs sellingbuying electricity from the market)
bull Independent report on how gen-sets can contribute to the balancing
in a system (interconnected and island grids)
bull Medium to long-term price forecasting services for different clients in Europe to (ao) assist in investment decisions
bull Renewable integration in island grids (eg Aruba CAISO) bull Assessment of the economic impact of alternative balancing product
specifications and the benefit of fast gen-sets bull SOPRACSGrip Sustainable Off-grid Powerstation for Rural
Applications optimization tool (optimum configuration of wind solar genset battery)
DNV GL copy 2017
Analysis ndash Diesel Generator versus PV usage + Battery usage
33
0
71
64
52
44
32
15
194
138
142
147
91
100
115
0
50
100
150
200
250
0
10
20
30
40
50
60
70
80
0 1 2 3 4 5 6
CO
2 e
mis
sio
n (
ton)
Cu
rta
ilme
nt
Scenarios
Curtailment of PV ()CO2 emission of DG (ton)
Scenarios
0 - Only DG
1 - DG + PV 100
2 - DG + PV 75
3 - DG + PV 50
4 - DG + PV 100 + BS 230 kWh
5 - DG + PV 75 + BS 230 kWh
6 - DG + PV 50 + BS 230 kWh
0
50
100
150
200
250
0
50
100
150
200
250
4 5 6
kW
h
Scenarios
Battery usage
Battery capacity(kWh)
Average batteryoutput(kWhday)
Curtailment and CO2 emission
How to compare different scenarios
In other words what should be selection
criteria for component dimensioning
ndash Total price CO2 emission curtailment hellip
On which level should system components be
Eg 60 houses 5x12 houses 60x1 house etc
DNV GL copy 2017 34
DNV GL copy 2017
SAFER SMARTER GREENER
wwwdnvglcom
Thank you
Andreacute Rauwerda MBA
Principal Consultant ndash DNV GL Energy
Email andreRauwerdadnvglcom
Tel +31 26 356 6289
35

DNV GL copy 2017
DNV GLrsquos Services in Asset Transactions
13
Legal Due Diligence Risk Analysis Laws Politics Country Specific Laws Deregulation
Integral Contractual Arrangement PPA Fuel Supply Contract OampM Contract EPC Contract Management Contract Concession Agreement Shareholder Agreement Land Use Agreement Credit Contracts
Public Acceptability Risk Analysis Local Support
Goals Highest Return Low Risk
Risk Analysis Mitigation Pass Through Insurance Project
Financing Bankability Country Risks
Market Analysis Demand Side Studies Fuel Price Development Combined Energy Supply Competition Analysis Alliances Assessment Supply Side Studies Country Comparison
Business Plan Optimization Management Operation Staffing Benchmarking
Commercial Analysis Sensitivities Risk Analysis Economical Results
Technical and Regulatory Due Diligence Dependency on Bankability Turnkey Contractor Selection Risk Analysis Appropriate Sizing Technical Alternatives Cost Assessment Implementation Management
DNV GL copy 2017
Approach
15
Gather and review
contracts and
technical DD
information
Risk based assessment and analysis
Red flag report
Final report
Kick off Meeting
Based on the review identify assess and rank risks within the contractual and technical scope Establish corrective actions for closing the gaps
Draft report and present to customer Upon receipt of feedback from customer provide the final report The results of the due diligence should serve as direct input to the financial model reps and warranties
Introduction of project teams finalizing scope and approach finalizing project
procedures
Number Name Description Prob Impact Meuro Prob
Impact
total Meuro
Risk Meuro Mitigation Comment
1 Establish and maintain good
relation with ACME Grid
2 Establish legal position of B-
corp and ACME grid if delay is
caused by ACME
3 Acquire information on
process by ACME grid
4 establish lobby contacts to
relevant politicians officials and
other wind farm operators to
keep the political pressure
1 Hiring experts with offshore
experience in project team
2 Include contingencies in
project planning
3 Select suppliers with
sufficient planning contingency
1 Very accurate mapping of as
built cable situation
2 Strict adherence to
procedures for operations within
windfamr
3 designed dockingplaces for
ships within windfarm
4 Close observation on local
shipmovements
5 Adequate condition
monitoring of cables and burial
depth
1 Discuss with local authorities
2 Set procedure for acquiring
land in working
3 Create goodwill with local
community
4 Acquire as soon as possible
1 Limited construction
activities in winter season
2 Include contingencies in
project planning
20 60
1Onshore grid
connection
Cable amp onshore works of
ACME not ready in time loss of
production
High 70 30 70
50 25
21
ACME has a legal obligation to
connect realistic projects
They will act in time if all
contracts are in placein time
and the risk profile of the
project is relatively low
2Interface
management
Timeline interfaces and set of
contractors not working as one
team leading to project delays
Medium gt 10month
30 10
12
3Cable
damages
The productivity of the windfarm
is highly dependable on its
internal cables and on the
ACME onshore cable Cable
damage can occur through a
number of reasons anchor drag
fishing freespaning etc This
could cause loss of output for a
string of turbines or loss of
output for the entire windfarm
Medium 25
20 10
125
The measures are not
extensive but have been limited
to the main measures B-Corp
cannot secure the integrity of
the ACME cable Currently
studies on necessity of extra
insurances are being made
4
Acquisition of
the German
base
B-Corp can not secure a base
for OampM in GermanyLow 10 3
The German government is
positive and willing to sell land
to B-corp It will however be a
public sale as required by
regulation If B-Corp does not
succeed consequences are
hugh All OampM by helicopter
flights and weather windows
will be more critical for
shipping movements
5Accessibility
risk
Weather circumstances leading
to time delay beyond calculated
margin
Low gt 10month 2
Data
room
Review of the Technical Project Concept contracts time schedule systems and component information Review relevant financial information from contracts and tender documents Collect and systemise information
Structure results and write draft report
Based on the risk analysis identify risks as potential show-stoppers Update daily
Delivery of final report and customer project evaluation
DNV GL copy 2017
CAPEX Review amp Benchmark
16
DNV GL independently assesses the CAPEX and OPEX of the assets under investigation
CAPEX We assess all aspects of the CAPEX of the asset 1 Replacement CAPEX 2 Expansion CAPEX 3 Compliance CAPEX
Benchmarking With our extensive experience we are able to benchmark these costs and make an accurate estimate of the future CAPEX costs related to market regulation and technical developments
DNV GL copy 2017
OPEX Review amp Benchmark
We evaluate the operational expenditures
related to the asset
We give an independent projection on the
development of your OPEX
With our 150 years hands on experience
we can give an accurate judgement on the
costs related to Maintenance and Operation
of the asset Furthermore we can also
benchmark these costs against
international similar assets
For example DNV GL has top class integrity
experts in-house to assess the current
state and future state of assets at the
energy value chain
17
DNV GL copy 2017
Projections of Regulated Revenues
18
Besides an accurate judgment of the costs the expected revenues are thoroughly reviewed
Future revenues are however highly dependent on future developments of the regulatory framework and the market
We provide projections of future regulated allowed revenues resulting tariffs and actual demand developments within the electricity market and identify and quantify potential risks resulting from future regulatory developments
DNV GL copy 2017
Business Case Development
DNV GL always provides the client with
a tailor made solution to assist and
support in making a healthy
investment decision
We review and benchmark your
investment decisions
We give projections on critical
contextual developments
ndash Tariff development
ndash Legal Compliance (new CO2
environmental or safety standards)
ndash Market development (supply and
demand projections)
Based on a diverse set of parameters
we independently develop a financial
model
19
DNV GL copy 2017
DNV GL Offers Unique Due Diligence Services
DNV GL has a long history of operational
regulatory and market experience
With our multidisciplinary expertise we are able to
accurately review audit and evaluate energy
assets
We make sure we give an accurate and integrated
reflection of the risks costs (CAPEX and OPEX)
and returns accompanying a decision to buy or sell
an energy asset
We advise both on the Buyerrsquos and Vendors side
We cover the entire energy value chain
We offer technical environmental regulatory and
commercial advisory services
20
DNV GL copy 2017
Our Capabilities in Detail
Regulatory capabilities Establishment of regulatory asset base Regulatory treatment of CAPEX and OPEX Revenue setting design and modelling Assessment of regulatory and political risks Risk mitigation strategies Institutional analysis Economic benchmarking and efficiency analysis Financial performance analysis including full-fledged financial
modelling
21
Commercial Market capabilities Analysis of the market design market arrangements (capacity
markets balancing markets etc) Access arrangements Quantitative modelling Price forecasting System expansion planning Competition analysis
Technical Capabilities Assessment of the assets condition site visits Analysis of technical operating data operating regimes and flexibility
of the assets Assessment of planning maintenance and investment (reinforcement
and extension) policies Forecasting capital and operating expenditures Business process analysis Application of quantitative methods and techniques Environmental assessment health and safety assessment
DNV GL copy 2017
Our reports identify technical risks in bankable language and contain suggestions for mitigation and impact (CAPEX OPEX)
22
DNV GL copy 2017
DNV GL has advised a wide range of owners of and investors in energy industry assets ndash a selection of clients is shown below
23
INVESTMENT BANKSPRIVATE EQUITY FUNDS ASSET OWNERS
DNV GL copy 2017
3 Climate adaptation amp resilience
24
DNV GL copy 2017
From climate data to adaptation decision making with ADAPT an application to a Vietnamese coastal city for a regional investor
Private and confidential
25
ADAPT
Climate
Projections
Hazards
Impacts
Risk
Risk
Manage-ment
Measures
Cost-
Benefit Analysis
Local sea level change
Historic river discharge
Storm surge
River flood
On planned and
existing
infrastructure
Risk-scenario based approach
Recommendations to
elevate infrastructure
Adaptation
costs
DNV GL copy 2017
Results coastal flooding maps for various flooding scenarios with inclusion of regional sea level rise
26 26
Without Sea level rise With Sea level rise
These results were used to preliminarily evaluate elevation adaptation
strategies for the site for a number of infrastructures
An initial screening of
different climatic threats
including analysis of regional
climate change projections
highlighted the relevance of
sea level rise for future
exposure of the site against
climatic threats A coastal
flooding analysis was carried
out incorporating sea level
projections
DNV GL copy 2017
Estimated area of residential building footage 880000 m2 (95M square feet)
Adaptive cost of elevation works per squared foot preliminary range estimate
32-108 USD
Raising costs for residential units
27
025m 085m
Estimated total cost for residential units [MUSD]
290-920 320-950
DNV GL copy 2017
Climate and Weather Databases
28
DNV GL copy 2017
Hazard Databases (including LIVEfeeds)
29
DNV GL copy 2017 30
Local hazard ndash Flooding at East River Electrical Substation (NY)
DNV GL copy 2017
4 Rural sustainable power generation
31
DNV GL copy 2017
Modelling amp tooling (economics dispatch and balancing) ndash Rural sustainable power generation
32
Service description
Project references
Value for Asia Pacific - Least Developed Countries
DNV GL has a modelling suit that is capable of a variety of analyses market models balancing frequency models and load-flow models The market model optimizes the dispatch of the assets given certain market conditions The market model assesses the value and the costs of assets in a particular electricity market such as the European market but can also be used for island-type systems The balancing model simulates the balancing frequency and can assess how good an asset can contribute to maintaining the right frequency or can assess the impact of a certain event on the frequency Both models can be used for any system market and for multiple scenarios of the future Other tools include operational amp investment modelling used to identify operational value of DER and to incorporate into investment calculations SOPRA CSGrip is a modular platform for off-grid (rural) power supply integrating (optimizing) renewable energy sources energy storage and diesel generator (back-up power)
bull Insight in business cases of microgrids (eg optimization of dispatch
microgrid costs vs sellingbuying electricity from the market)
bull Independent report on how gen-sets can contribute to the balancing
in a system (interconnected and island grids)
bull Medium to long-term price forecasting services for different clients in Europe to (ao) assist in investment decisions
bull Renewable integration in island grids (eg Aruba CAISO) bull Assessment of the economic impact of alternative balancing product
specifications and the benefit of fast gen-sets bull SOPRACSGrip Sustainable Off-grid Powerstation for Rural
Applications optimization tool (optimum configuration of wind solar genset battery)
DNV GL copy 2017
Analysis ndash Diesel Generator versus PV usage + Battery usage
33
0
71
64
52
44
32
15
194
138
142
147
91
100
115
0
50
100
150
200
250
0
10
20
30
40
50
60
70
80
0 1 2 3 4 5 6
CO
2 e
mis
sio
n (
ton)
Cu
rta
ilme
nt
Scenarios
Curtailment of PV ()CO2 emission of DG (ton)
Scenarios
0 - Only DG
1 - DG + PV 100
2 - DG + PV 75
3 - DG + PV 50
4 - DG + PV 100 + BS 230 kWh
5 - DG + PV 75 + BS 230 kWh
6 - DG + PV 50 + BS 230 kWh
0
50
100
150
200
250
0
50
100
150
200
250
4 5 6
kW
h
Scenarios
Battery usage
Battery capacity(kWh)
Average batteryoutput(kWhday)
Curtailment and CO2 emission
How to compare different scenarios
In other words what should be selection
criteria for component dimensioning
ndash Total price CO2 emission curtailment hellip
On which level should system components be
Eg 60 houses 5x12 houses 60x1 house etc
DNV GL copy 2017 34
DNV GL copy 2017
SAFER SMARTER GREENER
wwwdnvglcom
Thank you
Andreacute Rauwerda MBA
Principal Consultant ndash DNV GL Energy
Email andreRauwerdadnvglcom
Tel +31 26 356 6289
35
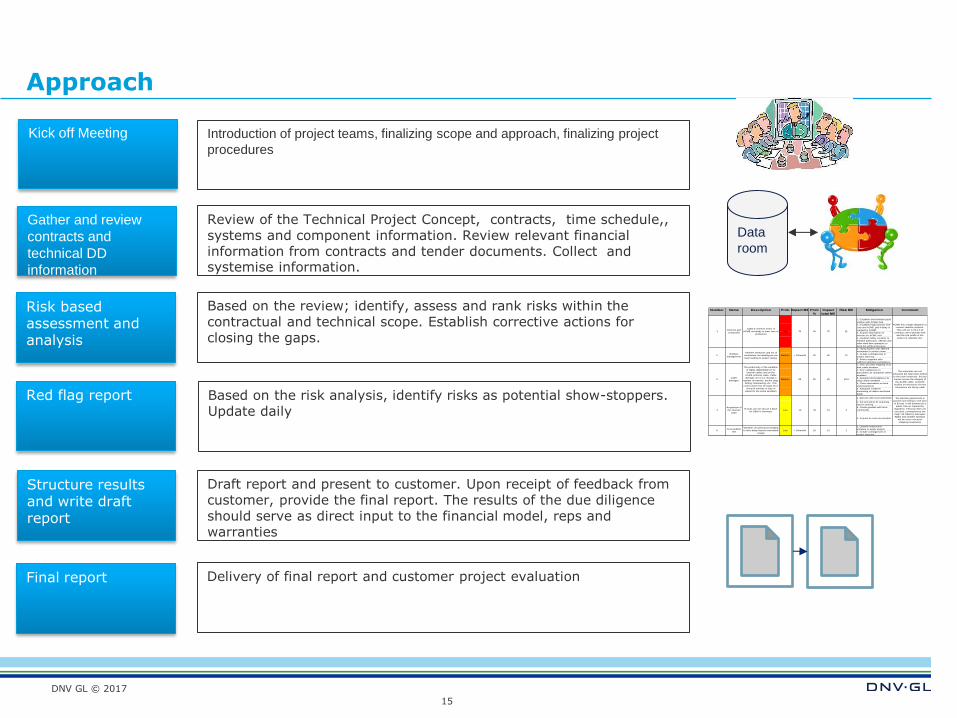
DNV GL copy 2017
Approach
15
Gather and review
contracts and
technical DD
information
Risk based assessment and analysis
Red flag report
Final report
Kick off Meeting
Based on the review identify assess and rank risks within the contractual and technical scope Establish corrective actions for closing the gaps
Draft report and present to customer Upon receipt of feedback from customer provide the final report The results of the due diligence should serve as direct input to the financial model reps and warranties
Introduction of project teams finalizing scope and approach finalizing project
procedures
Number Name Description Prob Impact Meuro Prob
Impact
total Meuro
Risk Meuro Mitigation Comment
1 Establish and maintain good
relation with ACME Grid
2 Establish legal position of B-
corp and ACME grid if delay is
caused by ACME
3 Acquire information on
process by ACME grid
4 establish lobby contacts to
relevant politicians officials and
other wind farm operators to
keep the political pressure
1 Hiring experts with offshore
experience in project team
2 Include contingencies in
project planning
3 Select suppliers with
sufficient planning contingency
1 Very accurate mapping of as
built cable situation
2 Strict adherence to
procedures for operations within
windfamr
3 designed dockingplaces for
ships within windfarm
4 Close observation on local
shipmovements
5 Adequate condition
monitoring of cables and burial
depth
1 Discuss with local authorities
2 Set procedure for acquiring
land in working
3 Create goodwill with local
community
4 Acquire as soon as possible
1 Limited construction
activities in winter season
2 Include contingencies in
project planning
20 60
1Onshore grid
connection
Cable amp onshore works of
ACME not ready in time loss of
production
High 70 30 70
50 25
21
ACME has a legal obligation to
connect realistic projects
They will act in time if all
contracts are in placein time
and the risk profile of the
project is relatively low
2Interface
management
Timeline interfaces and set of
contractors not working as one
team leading to project delays
Medium gt 10month
30 10
12
3Cable
damages
The productivity of the windfarm
is highly dependable on its
internal cables and on the
ACME onshore cable Cable
damage can occur through a
number of reasons anchor drag
fishing freespaning etc This
could cause loss of output for a
string of turbines or loss of
output for the entire windfarm
Medium 25
20 10
125
The measures are not
extensive but have been limited
to the main measures B-Corp
cannot secure the integrity of
the ACME cable Currently
studies on necessity of extra
insurances are being made
4
Acquisition of
the German
base
B-Corp can not secure a base
for OampM in GermanyLow 10 3
The German government is
positive and willing to sell land
to B-corp It will however be a
public sale as required by
regulation If B-Corp does not
succeed consequences are
hugh All OampM by helicopter
flights and weather windows
will be more critical for
shipping movements
5Accessibility
risk
Weather circumstances leading
to time delay beyond calculated
margin
Low gt 10month 2
Data
room
Review of the Technical Project Concept contracts time schedule systems and component information Review relevant financial information from contracts and tender documents Collect and systemise information
Structure results and write draft report
Based on the risk analysis identify risks as potential show-stoppers Update daily
Delivery of final report and customer project evaluation
DNV GL copy 2017
CAPEX Review amp Benchmark
16
DNV GL independently assesses the CAPEX and OPEX of the assets under investigation
CAPEX We assess all aspects of the CAPEX of the asset 1 Replacement CAPEX 2 Expansion CAPEX 3 Compliance CAPEX
Benchmarking With our extensive experience we are able to benchmark these costs and make an accurate estimate of the future CAPEX costs related to market regulation and technical developments
DNV GL copy 2017
OPEX Review amp Benchmark
We evaluate the operational expenditures
related to the asset
We give an independent projection on the
development of your OPEX
With our 150 years hands on experience
we can give an accurate judgement on the
costs related to Maintenance and Operation
of the asset Furthermore we can also
benchmark these costs against
international similar assets
For example DNV GL has top class integrity
experts in-house to assess the current
state and future state of assets at the
energy value chain
17
DNV GL copy 2017
Projections of Regulated Revenues
18
Besides an accurate judgment of the costs the expected revenues are thoroughly reviewed
Future revenues are however highly dependent on future developments of the regulatory framework and the market
We provide projections of future regulated allowed revenues resulting tariffs and actual demand developments within the electricity market and identify and quantify potential risks resulting from future regulatory developments
DNV GL copy 2017
Business Case Development
DNV GL always provides the client with
a tailor made solution to assist and
support in making a healthy
investment decision
We review and benchmark your
investment decisions
We give projections on critical
contextual developments
ndash Tariff development
ndash Legal Compliance (new CO2
environmental or safety standards)
ndash Market development (supply and
demand projections)
Based on a diverse set of parameters
we independently develop a financial
model
19
DNV GL copy 2017
DNV GL Offers Unique Due Diligence Services
DNV GL has a long history of operational
regulatory and market experience
With our multidisciplinary expertise we are able to
accurately review audit and evaluate energy
assets
We make sure we give an accurate and integrated
reflection of the risks costs (CAPEX and OPEX)
and returns accompanying a decision to buy or sell
an energy asset
We advise both on the Buyerrsquos and Vendors side
We cover the entire energy value chain
We offer technical environmental regulatory and
commercial advisory services
20
DNV GL copy 2017
Our Capabilities in Detail
Regulatory capabilities Establishment of regulatory asset base Regulatory treatment of CAPEX and OPEX Revenue setting design and modelling Assessment of regulatory and political risks Risk mitigation strategies Institutional analysis Economic benchmarking and efficiency analysis Financial performance analysis including full-fledged financial
modelling
21
Commercial Market capabilities Analysis of the market design market arrangements (capacity
markets balancing markets etc) Access arrangements Quantitative modelling Price forecasting System expansion planning Competition analysis
Technical Capabilities Assessment of the assets condition site visits Analysis of technical operating data operating regimes and flexibility
of the assets Assessment of planning maintenance and investment (reinforcement
and extension) policies Forecasting capital and operating expenditures Business process analysis Application of quantitative methods and techniques Environmental assessment health and safety assessment
DNV GL copy 2017
Our reports identify technical risks in bankable language and contain suggestions for mitigation and impact (CAPEX OPEX)
22
DNV GL copy 2017
DNV GL has advised a wide range of owners of and investors in energy industry assets ndash a selection of clients is shown below
23
INVESTMENT BANKSPRIVATE EQUITY FUNDS ASSET OWNERS
DNV GL copy 2017
3 Climate adaptation amp resilience
24
DNV GL copy 2017
From climate data to adaptation decision making with ADAPT an application to a Vietnamese coastal city for a regional investor
Private and confidential
25
ADAPT
Climate
Projections
Hazards
Impacts
Risk
Risk
Manage-ment
Measures
Cost-
Benefit Analysis
Local sea level change
Historic river discharge
Storm surge
River flood
On planned and
existing
infrastructure
Risk-scenario based approach
Recommendations to
elevate infrastructure
Adaptation
costs
DNV GL copy 2017
Results coastal flooding maps for various flooding scenarios with inclusion of regional sea level rise
26 26
Without Sea level rise With Sea level rise
These results were used to preliminarily evaluate elevation adaptation
strategies for the site for a number of infrastructures
An initial screening of
different climatic threats
including analysis of regional
climate change projections
highlighted the relevance of
sea level rise for future
exposure of the site against
climatic threats A coastal
flooding analysis was carried
out incorporating sea level
projections
DNV GL copy 2017
Estimated area of residential building footage 880000 m2 (95M square feet)
Adaptive cost of elevation works per squared foot preliminary range estimate
32-108 USD
Raising costs for residential units
27
025m 085m
Estimated total cost for residential units [MUSD]
290-920 320-950
DNV GL copy 2017
Climate and Weather Databases
28
DNV GL copy 2017
Hazard Databases (including LIVEfeeds)
29
DNV GL copy 2017 30
Local hazard ndash Flooding at East River Electrical Substation (NY)
DNV GL copy 2017
4 Rural sustainable power generation
31
DNV GL copy 2017
Modelling amp tooling (economics dispatch and balancing) ndash Rural sustainable power generation
32
Service description
Project references
Value for Asia Pacific - Least Developed Countries
DNV GL has a modelling suit that is capable of a variety of analyses market models balancing frequency models and load-flow models The market model optimizes the dispatch of the assets given certain market conditions The market model assesses the value and the costs of assets in a particular electricity market such as the European market but can also be used for island-type systems The balancing model simulates the balancing frequency and can assess how good an asset can contribute to maintaining the right frequency or can assess the impact of a certain event on the frequency Both models can be used for any system market and for multiple scenarios of the future Other tools include operational amp investment modelling used to identify operational value of DER and to incorporate into investment calculations SOPRA CSGrip is a modular platform for off-grid (rural) power supply integrating (optimizing) renewable energy sources energy storage and diesel generator (back-up power)
bull Insight in business cases of microgrids (eg optimization of dispatch
microgrid costs vs sellingbuying electricity from the market)
bull Independent report on how gen-sets can contribute to the balancing
in a system (interconnected and island grids)
bull Medium to long-term price forecasting services for different clients in Europe to (ao) assist in investment decisions
bull Renewable integration in island grids (eg Aruba CAISO) bull Assessment of the economic impact of alternative balancing product
specifications and the benefit of fast gen-sets bull SOPRACSGrip Sustainable Off-grid Powerstation for Rural
Applications optimization tool (optimum configuration of wind solar genset battery)
DNV GL copy 2017
Analysis ndash Diesel Generator versus PV usage + Battery usage
33
0
71
64
52
44
32
15
194
138
142
147
91
100
115
0
50
100
150
200
250
0
10
20
30
40
50
60
70
80
0 1 2 3 4 5 6
CO
2 e
mis
sio
n (
ton)
Cu
rta
ilme
nt
Scenarios
Curtailment of PV ()CO2 emission of DG (ton)
Scenarios
0 - Only DG
1 - DG + PV 100
2 - DG + PV 75
3 - DG + PV 50
4 - DG + PV 100 + BS 230 kWh
5 - DG + PV 75 + BS 230 kWh
6 - DG + PV 50 + BS 230 kWh
0
50
100
150
200
250
0
50
100
150
200
250
4 5 6
kW
h
Scenarios
Battery usage
Battery capacity(kWh)
Average batteryoutput(kWhday)
Curtailment and CO2 emission
How to compare different scenarios
In other words what should be selection
criteria for component dimensioning
ndash Total price CO2 emission curtailment hellip
On which level should system components be
Eg 60 houses 5x12 houses 60x1 house etc
DNV GL copy 2017 34
DNV GL copy 2017
SAFER SMARTER GREENER
wwwdnvglcom
Thank you
Andreacute Rauwerda MBA
Principal Consultant ndash DNV GL Energy
Email andreRauwerdadnvglcom
Tel +31 26 356 6289
35
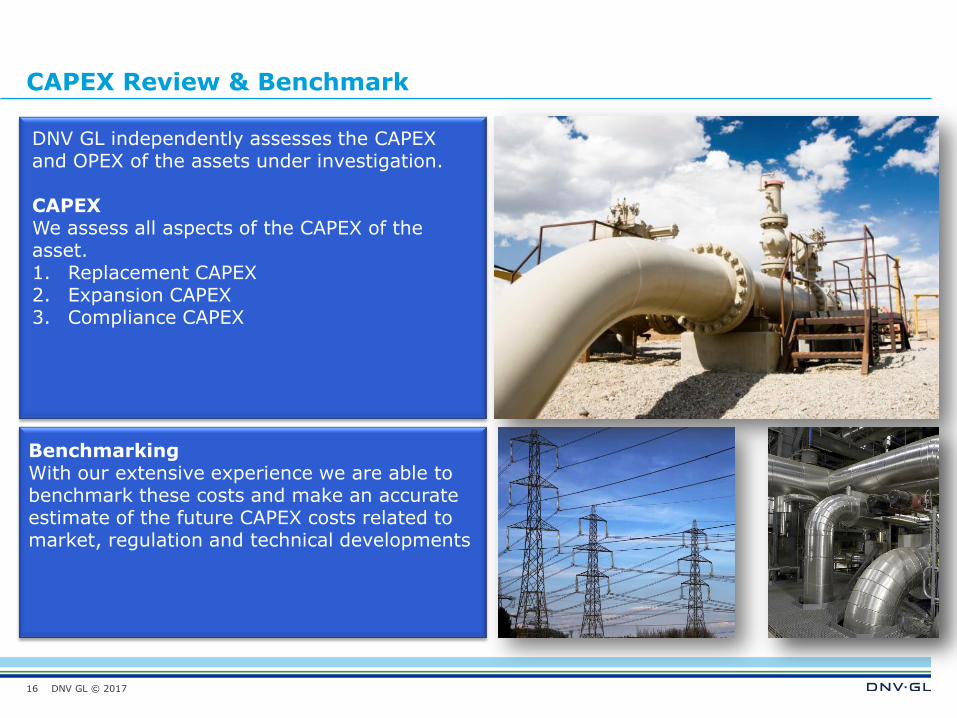
DNV GL copy 2017
Climate and Weather Databases
28
DNV GL copy 2017
Hazard Databases (including LIVEfeeds)
29
DNV GL copy 2017 30
Local hazard ndash Flooding at East River Electrical Substation (NY)
DNV GL copy 2017
4 Rural sustainable power generation
31
DNV GL copy 2017
Modelling amp tooling (economics dispatch and balancing) ndash Rural sustainable power generation
32
Service description
Project references
Value for Asia Pacific - Least Developed Countries
DNV GL has a modelling suit that is capable of a variety of analyses market models balancing frequency models and load-flow models The market model optimizes the dispatch of the assets given certain market conditions The market model assesses the value and the costs of assets in a particular electricity market such as the European market but can also be used for island-type systems The balancing model simulates the balancing frequency and can assess how good an asset can contribute to maintaining the right frequency or can assess the impact of a certain event on the frequency Both models can be used for any system market and for multiple scenarios of the future Other tools include operational amp investment modelling used to identify operational value of DER and to incorporate into investment calculations SOPRA CSGrip is a modular platform for off-grid (rural) power supply integrating (optimizing) renewable energy sources energy storage and diesel generator (back-up power)
bull Insight in business cases of microgrids (eg optimization of dispatch
microgrid costs vs sellingbuying electricity from the market)
bull Independent report on how gen-sets can contribute to the balancing
in a system (interconnected and island grids)
bull Medium to long-term price forecasting services for different clients in Europe to (ao) assist in investment decisions
bull Renewable integration in island grids (eg Aruba CAISO) bull Assessment of the economic impact of alternative balancing product
specifications and the benefit of fast gen-sets bull SOPRACSGrip Sustainable Off-grid Powerstation for Rural
Applications optimization tool (optimum configuration of wind solar genset battery)
DNV GL copy 2017
Analysis ndash Diesel Generator versus PV usage + Battery usage
33
0
71
64
52
44
32
15
194
138
142
147
91
100
115
0
50
100
150
200
250
0
10
20
30
40
50
60
70
80
0 1 2 3 4 5 6
CO
2 e
mis
sio
n (
ton)
Cu
rta
ilme
nt
Scenarios
Curtailment of PV ()CO2 emission of DG (ton)
Scenarios
0 - Only DG
1 - DG + PV 100
2 - DG + PV 75
3 - DG + PV 50
4 - DG + PV 100 + BS 230 kWh
5 - DG + PV 75 + BS 230 kWh
6 - DG + PV 50 + BS 230 kWh
0
50
100
150
200
250
0
50
100
150
200
250
4 5 6
kW
h
Scenarios
Battery usage
Battery capacity(kWh)
Average batteryoutput(kWhday)
Curtailment and CO2 emission
How to compare different scenarios
In other words what should be selection
criteria for component dimensioning
ndash Total price CO2 emission curtailment hellip
On which level should system components be
Eg 60 houses 5x12 houses 60x1 house etc
DNV GL copy 2017 34
DNV GL copy 2017
SAFER SMARTER GREENER
wwwdnvglcom
Thank you
Andreacute Rauwerda MBA
Principal Consultant ndash DNV GL Energy
Email andreRauwerdadnvglcom
Tel +31 26 356 6289
35
DNV GL copy 2017
Hazard Databases (including LIVEfeeds)
29
DNV GL copy 2017 30
Local hazard ndash Flooding at East River Electrical Substation (NY)
DNV GL copy 2017
4 Rural sustainable power generation
31
DNV GL copy 2017
Modelling amp tooling (economics dispatch and balancing) ndash Rural sustainable power generation
32
Service description
Project references
Value for Asia Pacific - Least Developed Countries
DNV GL has a modelling suit that is capable of a variety of analyses market models balancing frequency models and load-flow models The market model optimizes the dispatch of the assets given certain market conditions The market model assesses the value and the costs of assets in a particular electricity market such as the European market but can also be used for island-type systems The balancing model simulates the balancing frequency and can assess how good an asset can contribute to maintaining the right frequency or can assess the impact of a certain event on the frequency Both models can be used for any system market and for multiple scenarios of the future Other tools include operational amp investment modelling used to identify operational value of DER and to incorporate into investment calculations SOPRA CSGrip is a modular platform for off-grid (rural) power supply integrating (optimizing) renewable energy sources energy storage and diesel generator (back-up power)
bull Insight in business cases of microgrids (eg optimization of dispatch
microgrid costs vs sellingbuying electricity from the market)
bull Independent report on how gen-sets can contribute to the balancing
in a system (interconnected and island grids)
bull Medium to long-term price forecasting services for different clients in Europe to (ao) assist in investment decisions
bull Renewable integration in island grids (eg Aruba CAISO) bull Assessment of the economic impact of alternative balancing product
specifications and the benefit of fast gen-sets bull SOPRACSGrip Sustainable Off-grid Powerstation for Rural
Applications optimization tool (optimum configuration of wind solar genset battery)
DNV GL copy 2017
Analysis ndash Diesel Generator versus PV usage + Battery usage
33
0
71
64
52
44
32
15
194
138
142
147
91
100
115
0
50
100
150
200
250
0
10
20
30
40
50
60
70
80
0 1 2 3 4 5 6
CO
2 e
mis
sio
n (
ton)
Cu
rta
ilme
nt
Scenarios
Curtailment of PV ()CO2 emission of DG (ton)
Scenarios
0 - Only DG
1 - DG + PV 100
2 - DG + PV 75
3 - DG + PV 50
4 - DG + PV 100 + BS 230 kWh
5 - DG + PV 75 + BS 230 kWh
6 - DG + PV 50 + BS 230 kWh
0
50
100
150
200
250
0
50
100
150
200
250
4 5 6
kW
h
Scenarios
Battery usage
Battery capacity(kWh)
Average batteryoutput(kWhday)
Curtailment and CO2 emission
How to compare different scenarios
In other words what should be selection
criteria for component dimensioning
ndash Total price CO2 emission curtailment hellip
On which level should system components be
Eg 60 houses 5x12 houses 60x1 house etc
DNV GL copy 2017 34
DNV GL copy 2017
SAFER SMARTER GREENER
wwwdnvglcom
Thank you
Andreacute Rauwerda MBA
Principal Consultant ndash DNV GL Energy
Email andreRauwerdadnvglcom
Tel +31 26 356 6289
35
DNV GL copy 2017
4 Rural sustainable power generation
31
DNV GL copy 2017
Modelling amp tooling (economics dispatch and balancing) ndash Rural sustainable power generation
32
Service description
Project references
Value for Asia Pacific - Least Developed Countries
DNV GL has a modelling suit that is capable of a variety of analyses market models balancing frequency models and load-flow models The market model optimizes the dispatch of the assets given certain market conditions The market model assesses the value and the costs of assets in a particular electricity market such as the European market but can also be used for island-type systems The balancing model simulates the balancing frequency and can assess how good an asset can contribute to maintaining the right frequency or can assess the impact of a certain event on the frequency Both models can be used for any system market and for multiple scenarios of the future Other tools include operational amp investment modelling used to identify operational value of DER and to incorporate into investment calculations SOPRA CSGrip is a modular platform for off-grid (rural) power supply integrating (optimizing) renewable energy sources energy storage and diesel generator (back-up power)
bull Insight in business cases of microgrids (eg optimization of dispatch
microgrid costs vs sellingbuying electricity from the market)
bull Independent report on how gen-sets can contribute to the balancing
in a system (interconnected and island grids)
bull Medium to long-term price forecasting services for different clients in Europe to (ao) assist in investment decisions
bull Renewable integration in island grids (eg Aruba CAISO) bull Assessment of the economic impact of alternative balancing product
specifications and the benefit of fast gen-sets bull SOPRACSGrip Sustainable Off-grid Powerstation for Rural
Applications optimization tool (optimum configuration of wind solar genset battery)
DNV GL copy 2017
Analysis ndash Diesel Generator versus PV usage + Battery usage
33
0
71
64
52
44
32
15
194
138
142
147
91
100
115
0
50
100
150
200
250
0
10
20
30
40
50
60
70
80
0 1 2 3 4 5 6
CO
2 e
mis
sio
n (
ton)
Cu
rta
ilme
nt
Scenarios
Curtailment of PV ()CO2 emission of DG (ton)
Scenarios
0 - Only DG
1 - DG + PV 100
2 - DG + PV 75
3 - DG + PV 50
4 - DG + PV 100 + BS 230 kWh
5 - DG + PV 75 + BS 230 kWh
6 - DG + PV 50 + BS 230 kWh
0
50
100
150
200
250
0
50
100
150
200
250
4 5 6
kW
h
Scenarios
Battery usage
Battery capacity(kWh)
Average batteryoutput(kWhday)
Curtailment and CO2 emission
How to compare different scenarios
In other words what should be selection
criteria for component dimensioning
ndash Total price CO2 emission curtailment hellip
On which level should system components be
Eg 60 houses 5x12 houses 60x1 house etc
DNV GL copy 2017 34
DNV GL copy 2017
SAFER SMARTER GREENER
wwwdnvglcom
Thank you
Andreacute Rauwerda MBA
Principal Consultant ndash DNV GL Energy
Email andreRauwerdadnvglcom
Tel +31 26 356 6289
35

DNV GL copy 2017
Analysis ndash Diesel Generator versus PV usage + Battery usage
33
0
71
64
52
44
32
15
194
138
142
147
91
100
115
0
50
100
150
200
250
0
10
20
30
40
50
60
70
80
0 1 2 3 4 5 6
CO
2 e
mis
sio
n (
ton)
Cu
rta
ilme
nt
Scenarios
Curtailment of PV ()CO2 emission of DG (ton)
Scenarios
0 - Only DG
1 - DG + PV 100
2 - DG + PV 75
3 - DG + PV 50
4 - DG + PV 100 + BS 230 kWh
5 - DG + PV 75 + BS 230 kWh
6 - DG + PV 50 + BS 230 kWh
0
50
100
150
200
250
0
50
100
150
200
250
4 5 6
kW
h
Scenarios
Battery usage
Battery capacity(kWh)
Average batteryoutput(kWhday)
Curtailment and CO2 emission
How to compare different scenarios
In other words what should be selection
criteria for component dimensioning
ndash Total price CO2 emission curtailment hellip
On which level should system components be
Eg 60 houses 5x12 houses 60x1 house etc
DNV GL copy 2017 34
DNV GL copy 2017
SAFER SMARTER GREENER
wwwdnvglcom
Thank you
Andreacute Rauwerda MBA
Principal Consultant ndash DNV GL Energy
Email andreRauwerdadnvglcom
Tel +31 26 356 6289
35

DNV GL copy 2017 34
DNV GL copy 2017
SAFER SMARTER GREENER
wwwdnvglcom
Thank you
Andreacute Rauwerda MBA
Principal Consultant ndash DNV GL Energy
Email andreRauwerdadnvglcom
Tel +31 26 356 6289
35

DNV GL copy 2017
SAFER SMARTER GREENER
wwwdnvglcom
Thank you
Andreacute Rauwerda MBA
Principal Consultant ndash DNV GL Energy
Email andreRauwerdadnvglcom
Tel +31 26 356 6289
35