Embed Size (px)
Citation preview

–
SAFER, SMARTER, GREENER

© 2015 DNV GL All rights reserved. This publication or parts thereof may not be reproduced or
transmitted in any form or by any means, including photocopying or recording, without the prior written
consent of DNV GL.
TABLE OF CONTENTS
1. Executive Summary ........................................................................................ 1
2. Introduction ................................................................................................... 2
3. EPA’s 111(d)– What is it all about? .................................................................... 4
3-1 State Compliance Plans ................................................................................ 7
3-2 States, Multi-States, and the Role of Utilities .................................................. 8
3-3 Compliance Timeline .................................................................................. 10
3-4 Estimated Impact by the EPA ...................................................................... 11
4. Utility Perspective on EPA’s 111(d) .................................................................. 11
4-1 Utility Perspective on EPA’s Authority Under 111(d) ....................................... 11
4-2 Utility Perspective on the Four Building Blocks of 111(d) ................................ 14
4-3 Utility Perspective on Timeline of 111(d) ...................................................... 16
5. State Perspective on EPA’s 111(d) ................................................................... 17
6. DNV GL’s Perspective on EPA’s 111(d) ............................................................. 18
6-1 Is the Clean Power Plan Achievable by 2030? ................................................ 18
6-2 Implementation Likely to be Delayed ........................................................... 21
6-3 The Clean Power Plan Creates Winners and Losers ......................................... 21
6-4 A Broader Range of Compliance Options is Needed ........................................ 24
7. Developing Strategy and Compliance Under Uncertainty .................................... 26
7-1 Designing Actionable State Implementation Plans .......................................... 26
7-2 DNV GL Services to Work Towards Compliance.............................................. 28
Acknowledgements ........................................................................................... 30
About the contributing authors.............................................................................. 31
DNV KEMA is now DNV GL .................................................................................... 33
About DNV GL .................................................................................................. 33
In the Energy industry ...................................................................................... 33
1
1. EXECUTIVE SUMMARY
EPA’s proposed regulations of carbon dioxide emissions under the “The Clean Power Plan” calls for
emission reductions from existing fossil fuel-fired electric generating units of 30 percent by 2030,
compared to 2005 levels. EPA proposes to achieve these reductions through four building blocks: heat
rate improvements; increased dispatch of natural gas combined cycle units; increased reliance on
renewable and nuclear generation; and increased end-use energy efficiency.
The proposed regulation has triggered 1.6 million responses filed during the June-December 2014
public comment period. Judging from these responses, the review from both regulators and the
industry is mixed, and it is clear that much remains to be done before workable regulations are in
place across the United States. In addition to a myriad technical concerns, many stakeholders
question EPA’s regulatory authority to mandate the proposed actions. This is likely to trigger
extensive political, regulatory and legal debates, leading to delayed implementation.
The Clean Power Plan introduces the most significant environmental reform to the power industry
since the Clean Air Act of 1970. Power plant owners will need to devise a strategy for controlling
compliance costs and identifying growth opportunities. Based on this, they need to determine the best
regulatory strategy at the state and federal level.
At the same time, the sweeping reforms call for states to do much of the work in designing a workable
policy that achieves the EPA goals. State regulators need to decide how to best implement the plan
and need to find the most cost effective collaborative approach for reducing emissions without
hurting key industries and rate payers within their jurisdictions.
DNV GL finds that there are several issues that need to be considered carefully and that are likely to
lead to significant delays in implementing the Clean Power Plan:
Broader set of compliance options needed. Even though states have a large number of
compliance options, significant cost savings could be unlocked by considering inclusion of
other industrial CO2 emission sectors as well as offsets.
Regulations take time. Not only do states need to decide how to collaborate on the Clean
Power Plan before the 2016 filing deadline, but they will also need to agree on a staggering
amount of
detail – how to report, monitor, and verify emissions and emission reductions, how to store
and transfer data, how to resolve disputes, etc. DNV GL expects that this will delay
implementation by at least a couple of years compared to the targeted 2020 start of the plan’s
implementation phase.
Winners and losers. DNV GL estimates that the Clean Power Plan will cost 80-120 Billion
dollars to implement. In addition, the impact on owners and operators of power plants will
2
vary significantly depending on the asset base and the states in which electricity providers are
active. Ultimately, this will impact both rate payers and investors. Unless state or federal
regulators can address issues around potentially unequal impact among rate payers and
investors, legal challenges and delays are likely.
Security and Reliability. New state regulations need to balance long term security of the energy
supply against greenhouse gas reductions – maintaining diversity in the supply chain will
likely be important for controlling costs and reliability. In phasing out coal-fired generation,
regulators will also need to consider implications for reliability as baseload generation is
replaced by less-reliable renewable sources.
This white paper provides an overview of the key pieces of the U.S. Environmental Protection
Agency’s proposed carbon regulations under section 111(d) of the Clean Air Act, and identifies
stakeholder inputs, risks, opportunities, and potential compliance options for state regulators and for
power industry stakeholders.
2. INTRODUCTION
On June 2, 2014, the U.S. Environmental Protection Agency issued proposed emission guidelines for
states to follow in developing plans to address carbon dioxide (CO2) emissions from existing fossil
fuel-fired electric utility generating units (EGUs). The proposal, issued under Section 111(d) of the
Clean Air Act (CAA), is formally known as Carbon Pollution Emission Guidelines for Existing
Stationary Sources: Electric Utility Generating Units, and is also referred to as 111(d) or the Clean
Power Plan (CPP).
The proposed guidelines of 111(d) are designed to achieve a 30 percent cut from 2005 emissions by
2030, with an interim target of 25 percent on average between 2020 and 2029. Each state has an
individual target to meet, with those targets expressed in a lb/MWh rate-based or mass-based CO2
emission performance levels. The EPA came up with these reduction targets using the “best system of
emission reduction” (BSER) determination, looking at technical feasibility, system costs, and
technology diffusion within each state. The BSER form four “building blocks”, which the EPA used to
determine the states’ emission goals.

3
Figure 2-1. BSER Building Blocks for 111(d)
These four blocks relate to 1) heat rate improvement at coal plants, 2) higher dispatch of natural gas
generators, 3) increased renewable electricity and nuclear generation, and 4) demand side
management programs. These blocks also act as tools for the states to design and implement their
plans to meet their respective emissions performance level.
States must develop plans to describe how they intend to use these tools to meet these goals. EPA has
laid out several criteria and requirements that states need to develop in their plans in order to be
considered compliant, with a deadline to submit by June 30, 2016. States are required to begin making
emissions reductions by 2020, and be in full compliance with their emission performance level no
later than 2030.
While there are differing opinions about the goals of 111(d)—some utilities support the goals, while
many others oppose them—nearly all companies with affected sources believe that the regulations
proposed under 111(d) need to be changed. Many believe the EPA has overstepped its legal authority,
or the goals set forth are either unachievable or damaging to grid reliability. Similarly, several states
are concerned that 111(d) puts their state at an economic disadvantage compared to neighboring
states, or that the goals do not take into account previous CO2 reduction efforts. Most of the concerns
from the states mirror those from the utilities, and several are bringing lawsuits against the EPA at
this time.
The final version of 111(d) will not be issued until the summer of 2015 at the earliest, and there is a
high probability that legal challenges from multiple parties could hold up rule implementation.
However, from national and global perspectives, carbon regulation has become an increasingly
important part of the business conversation. From international agreements that the US has recently
engaged in, to multi-billion dollar companies factoring carbon pricing into their long-term business
4
planning, it is imperative for every company and business to take stock of their current carbon
impacts, and understand what can be done to mitigate those emissions.
DNV GL has the technical and business expertise to help companies navigate those waters, regardless
of the final requirements of proposed rules like 111(d). These range the from Supply-Side services
such as renewable energy and retrofit support, Demand-Side services like Market Assessment and
Energy Efficiency Potential, and finally program development and implementation, such as Energy
Master Planning and Smart Green Cities Action Plans. DNV GL has been offering these services for
years, and has a proven track record of delivering value to clients in these areas.
3. EPA’S 111(D)– WHAT IS IT ALL ABOUT?
On June 2, 2014, the U.S. Environmental Protection Agency issued proposed emission guidelines for
states to follow in developing plans to address carbon dioxide (CO2) emissions from existing fossil
fuel-fired electric utility generating units (EGUs). The proposal, issued under Section 111(d) of the
Clean Air Act (CAA), is formally known as Carbon Pollution Emission Guidelines for Existing
Stationary Sources: Electric Utility Generating Units, and is also referred to as 111(d) or the Clean
Power Plan (CPP).1
111(d) is one of three rules addressing CO2 emissions from utility sources. The first, called Standards
of Performance for Greenhouse Gas Emissions From New Stationary Sources: Electric Utility
Generating Units, initially released in March 2012 and then re-proposed in September 2013,
addresses new electric generating unit emissions.2 Concurrent with the 111(d) proposed rules for
existing utility sources released in June, 2014, EPA released proposed standards of performance to
limit emissions from modified and reconstructed
fossil-fired electric utility steam generating units and natural gas-fired stationary combustion
turbines.3
The proposed guidelines of 111(d) are designed to achieve a 30 percent cut from 2005 emissions by
2030, with an interim target of 25 percent on average between 2020 and 2029. Each state has an
individual target to meet, with those targets expressed in a lb/MWh rate-based or mass-based CO2
emission performance levels. Figure 3-1 below illustrates the percent reduction targets of emission
rates set by EPA for the 2030 goal. The vast majority of states have a target between -20% and -40%.
1 Federal Register,” Carbon Pollution Emission Guidelines for Existing Stationary Sources: Electric Utility Generating Units,” accessed on
12/18/2014 from https://www.federalregister.gov/articles/2014/06/18/2014-13726/carbon-pollution-emission-guidelines-for-existing-
stationary-sources-electric-utility-generating 2 Federal Register, 79 FR 1429, “Standards of Performance for Greenhouse Gas Emissions From New Stationary Sources: Electric Utility
Generating Units,” pg. 1429 -1519 (91 pages) accessed on 12/18/2014 from https://www.federalregister.gov/articles/2014/01/08/2013-
28668/standards-of-performance-for-greenhouse-gas-emissions-from-new-stationary-sources-electric-utility 3 Federal Register, 79 FR 34959, “Carbon Pollution Standards for Modified and Reconstructed Stationary Sources: Electric Utility Generating
Units,” pg. 34959 -34994 accessed on 12/18/2014 from https://www.federalregister.gov/articles/2014/06/18/2014-13725/carbon-pollution-standards-for-modified-and-reconstructed-stationary-sources-electric-utility
5
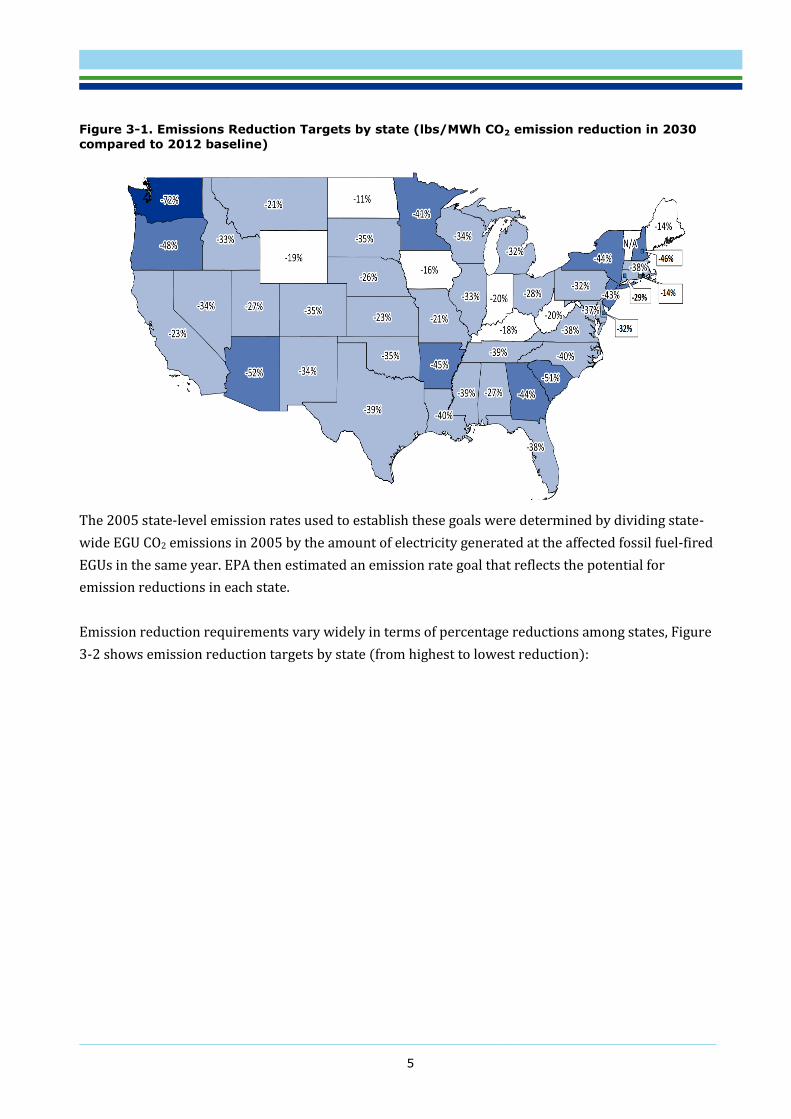
Figure 3-1. Emissions Reduction Targets by state (lbs/MWh CO2 emission reduction in 2030
compared to 2012 baseline)
The 2005 state-level emission rates used to establish these goals were determined by dividing state-
wide EGU CO2 emissions in 2005 by the amount of electricity generated at the affected fossil fuel-fired
EGUs in the same year. EPA then estimated an emission rate goal that reflects the potential for
emission reductions in each state.
Emission reduction requirements vary widely in terms of percentage reductions among states, Figure
3-2 shows emission reduction targets by state (from highest to lowest reduction):

6
Figure 3-2. Carbon Emission Reduction Targets by State until 2030 (Continental U.S.)
The EPA came up with these reduction targets using the “best system of emission reduction” (BSER)
determination, looking at technical feasibility, system costs, and technology diffusion within each
state.
Figure 3-3 shows the building blocks of 111(d). The BSER form four “building blocks”, which the EPA
used to determine the states’ emission goals. These four blocks relate to 1) heat rate improvement at
coal plants, 2) higher dispatch of natural gas generators, 3) increased renewable electricity and
nuclear generation, and 4) demand side management programs. These blocks also act as tools for the
states to design and implement their plans to meet their respective emissions performance level.4
Figure 3-3. EPA’s Best System of Emission Reductions (BSER) proposed in the existing Source Rule under 111(d)
4 Federal Register, 79 FR 34878”, Carbon Pollution Emission Guidelines for Existing Stationary Sources: Electric Utility Generating Units,”
accessed on 12/18/2014 from https://www.federalregister.gov/articles/2014/06/18/2014-13726/carbon-pollution-emission-guidelines-for-existing-stationary-sources-electric-utility-generating
0%
10%
20%
30%
40%
50%
60%
70%
80%
WA
SC
NH
GA NJ
LA
TX
TN
VA
MD
OK
NV
WI
IL PA
CT
UT
NE
KS
MT
WV
KY
ME
ND
The four building blocks
of 111(d)
Improve exisiting coal-fired steam EGU heat rates.
Increase use of existing and under construction NGCC
units.
Add renewable capacity, and
discourage early retirement of
nuclear plants.
Implement demand-side
energy efficiency programs

7
A unique feature of 111(d) is that it does not target individual units. Instead, it allows states flexibility
in designing their state implementation plans to meet their CO2 reduction goals. The next section
explores the criteria for those plans set out by the EPA, and potential impacts of those plans.
3-1 State Compliance Plans
For many years, Section 110 of the CAA has required states to meet National Ambient Air Quality
Standards by developing state implementation plans (SIPs). These plans are focused around meeting
air quality standards in a geographical area for criteria air pollutant (such as lead, sulfur dioxide,
nitrous oxide, etc.) from specific sources.
The proposed rule under 111(d) differentiates itself by pursuing a system-wide approach rather than
a source-based approach. The source-based approach used in section 110 limits emissions almost
exclusively at the source of air pollution, usually power plants. The system-wide approach looks
beyond the source and allows the examination of all options that could be used to reduce emissions.5
The system approach also incorporates consideration of cost, technical feasibility and other factors.
For this system approach, EPA has laid out several criteria and requirements that states need to
accomplish in their plans in order to be considered compliant. These are the initial steps in planning
and monitoring that states need to provide to the EPA by June 30, 2016. Figure 3-4 shows how EPA is
proposing to evaluate and approve state plans based on four general criteria. Below these four
general criteria are twelve (12) tangible action items associated with compliance. These twelve steps
are the elements included in the Federal Register required for state compliance.6
5 Federal Register, “Carbon Pollution Emission Guidelines for Existing Stationary Sources: Electric Utility Generating Units,” accessed on
December 3, 2014 from https://www.federalregister.gov/articles/2014/06/18/2014-13726/carbon-pollution-emission-guidelines-for-existing-
stationary-sources-electric-utility-generating#h-9 6 Ibid. pg. 34838

8
Figure 3-4. Criteria for State Plans to be in Compliance with 111(d)
3-2 States, Multi-States, and the Role of Utilities
One important aspect of 111(d) is who will be held responsible for meeting targets set by the EPA.
The proposed 111(d) rule has options for the state plans to hold the EGUs fully responsible for the
emission targets (either rate or mass-based), or to have plans that rely on a portfolio approach, where
the building blocks being implemented can impact both affected EGUs as well as entities other than
the identified EGUs impacted in the state.
The proposed rule identifies two main types of portfolio approaches: utility-driven and state-driven.
The utility-driven portfolio approach takes a resource planning approach to emission reductions
whereby the state plan is envisioned to set performance standards, emission targets or similar goals
to which the utility needs to conform.
Under the state-driven portfolio approach, the measures in a state plan could include emission
standards for affected EGUs, but also requirements that apply to entities other than affected EGUs, for
example, renewable portfolio standards (RPS) or end-use energy efficiency resource standards
(EERS), both of which can apply to sectors outside of the power sector.7 The state plans could also
include a common mass-cap for the electricity sector in the state under which a cap and trade system
7 Federal Register, 79 FR pg. 34901, “Carbon Pollution Emission Guidelines for Existing Stationary Sources: Electric Utility Generating Units ,”
accessed on 12/12/2004 from https://www.federalregister.gov/articles/2014/06/18/2014-13726/carbon-pollution-emission-guidelines-for-existing-stationary-sources-electric-utility-generating
Criteria for State Plans compliance
Enforceable measures that reduce EGU CO2
emissions
Identification of affected entities
Identification of state emission performance
level
Plan and geographic scope
Projected emissions goal and
timeline to achieve
Identification of emission standards
Quantifiable and enforceable standard
Plan to achieve emission
performance level
Quantifiable and verifiable emission
reductions
Identification of milestones
Description of state reporting
Monitoring and reporting plan
Reporting on plan implementation and
progress toward CO2 goal
Identification of backstop measures
Certification of hearing on state plan
Supporting material

9
could be established, similar to what is currently in place in California or the Regional Greenhouse Gas
Initiative in the Northeast. Table 3-1 below lays out the different approaches for 111(d), and the
target of reductions for each of those approaches.
Table 3-1. Four approaches for how 111(d) can be implemented
Approach Measurement Target of reductions
Rate-based CO2
Emissions Limits for
Affected EGUs
Rate-based emission
reduction targets
Affected EGUs
Mass-based CO2
Emissions Limits for
Affected EGUs
Mass-based emission
reduction targets
Affected EGUs
Utility-Driven Portfolio
Approach
Rate-based or
mass-based emission
reduction targets
Measures that directly apply to affected
EGUs (e.g., repowering or retirement of
one or more EGUs) as well as RE and
demand-side EE measures that avoid
affected EGU CO2 emissions
State-Driven Portfolio
Approach
Rate-based or
mass-based emission
reduction targets
Measures that directly apply to affected
EGUs, as well as requirements that apply
to entities other than affected EGUs, for
example, renewable portfolio standards
or end-use energy efficiency resource
standards
Multi-state action. As part of the rulemaking process, the EPA was aware that several states are
currently engaged in multi-state carbon exchanges, and wanted to have a flexible mechanism for
those systems to be accounted for in the state plans. A multi-state approach incorporating either a
rate- or mass-based goal would also be approvable based upon a demonstration that the state's plan
would achieve the equivalent in stringency, including compliance timing, to the state-specific rate-
based goal set by the EPA.8 As such, the EPA is seeking comment on whether states participating in
multi-state plans need to have a single submittal from all participating states, or if each state still
needs to submit an individual plan.
Both the common multi-state submittal and each individual participating state submittal would be
required to address all twelve plan components described in Figure 3-4. This is another component of
111(d) that is still under discussion, but the main emphasis from the EPA is that if states want to join
a multi-state plan that is already in existence, or create a new one, there will be mechanisms in place
for those multi-state plans to be documented.
8 Ibid. pg.34837

10
3-3 Compliance Timeline
EPA’s proposal calls for finalizing the Clean Power Plan rulemaking by June 1, 2015. Under the current
timeline, states are required to submit their plans by June 30, 2016. If a state is unable to complete its
entire plan in that time, it must submit an initial plan meeting certain minimum requirements, and
then the full plan by June 30 of either 2017 or 2018, depending on whether inter-state emissions
trading is part of the plan. States are required to begin making emissions reductions by 2020, and to
be in full compliance with their emission performance level no later than 2030. This timeline may
shift due to legal challenges and other hurdles, further discussed in Section 6-2.
Figure 3-5. Timeline of 111(d) implementation and compliance
Carbon market design; program design; litigation support;
investment/retirement analysis; power market studies
Carbon offset registration, monitoring and verification (certification);
operation of utility and state programs

11
3-4 Estimated Impact by the EPA
The EPA anticipates the following impacts related to implementing 111(d):
Average nationwide retail electricity prices will increase by roughly 6 to 7 percent in 2020
relative to the base case (i.e. conditions without the proposed guidelines), and by roughly 3
percent in 2030 for the contiguous United States relative to the base case. 9
Average monthly electricity bills are anticipated to increase by roughly 3 percent in 2020, but
decline by approximately 9 percent by 2030.10
Increasing penetration of demand-side programs will offset increased prices to end users by
their expected savings from reduced electricity use.
Domestic coal demand and coal prices to decline as a result of implementing the plan with
prices falling 16 to 17 percent in 2020 and roughly 18 percent in 2030, relative to business-as-
usual.
Delivered natural gas prices to increase by 9 to 12 percent in 2020 and power sector gas
consumption to increase by 1.2 trillion cubic feet (TCF) in 2020 relative to the base case, and
then begin to decline over time.
CO2 emission reductions up to 555 million tons per year by 2030 with annual compliance
costs of about $8 billion in 2030 (in 2011 dollars), equivalent to $13–$16 per ton of CO2
reduction. These costs include the amortized cost of capital investment, needed new capacity,
shifts between or amongst various fuels, deployment of energy efficiency programs, and other
actions associated with compliance.11
4. UTILITY PERSPECTIVE ON EPA’S 111(D)
While there are differing opinions about the goals of 111(d)—some utilities support the goals, while
many others oppose them—nearly all companies with affected sources believe that the regulations
proposed under 111(d) need to be changed in several ways.
4-1 Utility Perspective on EPA’s Authority Under 111(d)
The National Rural Electric Cooperative Association (NRECA) submitted comments on the proposed
rules that aggressively challenge EPA’s legal authority to promulgate rules under Section 111(d),
especially in the form being proposed. Their concerns include procedural issues regarding whether
Section 111(d) can be used to regulate electric power plant carbon dioxide emissions, as well as
doubts about the workability of the entire rule proposed by EPA. NRECA, which represents
cooperatives with a significant portion of the generating mix invested in coal, says in its comments
9 Ibid. pg. 34934
10 Ibid. pg.34934
11 Federal Register, 79 FR pg. 34934, “Carbon Pollution Emission Guidelines for Existing Stationary Sources: Electric Utility Generating Units ,”
accessed on 12/12/2004 from https://www.federalregister.gov/articles/2014/06/18/2014-13726/carbon-pollution-emission-guidelines-for-existing-stationary-sources-electric-utility-generating
12
that “Because the proposed rule is unlawful and unworkable as drafted, EPA should decline to finalize
it in its present form.”12
Several Investor Owned Utilities (IOUs), mostly from the southern and mid-western regions of the US,
believe that the EPA has exceeded their authority in their decision to regulate CO2 under 111(d) of the
CAA. Figure 4-1 provides a geographical look at what these utilities are saying around the country.
12
National Rural Electric Cooperative Association,” Comments on Proposed Carbon Pollution Emission Guidelines for Existing Stationary Sources:
Electric Utility Generating Units and Notice of Data Availability,” accessed on 12/18/2014 from http://www.eenews.net/assets/2014/12/15/document_ew_01.pdf

13
Figure 4-1. Utility perspective on 111(d) and corresponding generation fuel mix of that utility in certain service territories
13
13
Regulations.gov, “Standards of Performance for Greenhouse Gas Emissions from Existing Sources: Electric Utility Generating Units,” accessed on 12/24/2014 from
http://www.regulations.gov/#!docketBrowser;rpp=25;po=0;D=EPA-HQ-OAR-2013-0602
Coal Natural Gas/Oil Nuclear Renewables Hydro Other
Utility generation fuel mix
14
4-2 Utility Perspective on the Four Building Blocks of 111(d)
The majority of the comments filed from utilities to the EPA focused around the four building blocks of
the 111(d) proposed rule, and concerns, as well as suggestions related to these options. For most of the
comments submitted, there were many similarities in concerns across the utilities.
The first building block of improving existing coal-fired steam EGU heat rates was met with much
skepticism. AEP stated that “given the inherent variability in heat rate due to duty cycles and other
uncontrollable factors, and the lack of an effective real-time heat rate measurement technique, it is
infeasible to establish traditional emission limitations or standards based on improved heat rates.” 14
Dominion also had similar perspective. They stated that industry consultants have reviewed the EPA’s
heat rate improvement methods, and believe that the short-term and long-term benefits are exaggerated.
Dominion states that many of these improvements depend on the specifics of the plants, while the EPA
cites the improvements on an industry-wide aggregate basis. Dominion believes that it is inappropriate
to apply measures determined in aggregate to individual units. They also feel that EPA hasn’t taken into
consideration that several plants may have already incorporated these efficiency increases, and therefore
the need to adjust the expected gains that could be made in different regions. 15
The second building block (increased use of existing and under construction natural gas units) was
received with concern from both heavy users of natural gas, as well as utilities that have very little
deployment of this resource. Florida Electric Power Coordinating Group notes that Natural Gas Combined
Cycle (NGCC) goal of 70% capacity factor in unachievable in the timeframe allotted. They believe the
quantity of natural gas, as well as infrastructure for distribution, is inadequate to meet this rate in
Florida.16 On the other side, utilities like Xcel were concerned that the rule doesn’t consider the impact of
renewable energy on the dispatch of natural gas combined cycle plants, related to the 70% capacity factor
target in 111(d).17 Xcel believes that EPA should consider the impact of high levels of wind penetration on
reducing NG capacity factors, and recalculate the baseline NGCC capacity factors for each state. These
wind/NGCC “displacement factors” demonstrate that NGCCs in states with high wind penetration have a
lower capacity factor due directly to the operation of wind generation in those states and their utility
systems, and the 70% capacity factor goal actually punishes states that have higher deployment of wind.
14
American Electric Power, “Comment submitted by John M. McManus, Vice President, Environmental Services, American Electric Power (AEP),”
accessed on 12/18/2014 from http://www.regulations.gov/#!documentDetail;D=EPA-HQ-OAR-2013-0602-24030 15
Dominion Resources Services, Inc., “Comment submitted by Pamela F. Faggert, Chief Environmental Officer and Vice President, Corporate
Compliance, Dominion Resources Services, Inc.,” pg. 39 accessed on 12/18/2014 from http://www.regulations.gov/#!documentDetail;D=EPA-HQ-
OAR-2013-0602-22566 16
Florida Electric Power Coordinating Group, Inc,” Comment submitted by Hopping Green & Sams, P.A., on behalf of Florida Electric Power
Coordinating Group, Inc.,” pg.6, accessed on 12/18/2014 from http://www.regulations.gov/#!documentDetail;D=EPA-HQ-OAR-2013-0602-22811 17
Xcel Energy, “Comment submitted by Frank P. Prager, Vice President, Policy and Strategy, Xcel Energy Inc,” accessed on 12/18/2014 from
http://www.regulations.gov/#!documentDetail;D=EPA-HQ-OAR-2013-0602-22976
15
The third building block focuses on adding renewable capacity, and discouraging early retirement of
nuclear plants. Among many utilities, TVA’s public comments present cross-cutting concerns regarding
the ability to reach the stated goals relating to renewable energy. One major concern they express is that
EPA does not give any credit for early actions on C02 reductions before 2012, but continues to measure
reductions from 2005 levels. TVA reduced its CO2 emissions over 20% between 2005 and 2012, and they
feel those savings should count towards their goal. 18 In regards to future renewable generation, TVA also
expresses concerns about how the EPA predicted future growth of renewables, and the resource
availability to utilities. TVA states that prior growth of renewable resources is not necessarily an
indication of future growth, as technical potential is not synonymous with achievable renewable
generation because it does not consider a variety of critical factors that affect actual deployment of
renewable energy. For the nuclear energy component of this building block, TVA states that EPA’s plan
does not consider whether these nuclear units are “at risk” when setting the state goals. These are
nuclear plants that are not economically viable in capacity markets due to low natural gas prices and
units that are not planning to seek re-licensure through the Nuclear Regulatory Commission.
National Grid comments on the treatment of hydroelectric power under this third building block, and the
fact that RGGI and other states agree that it should be counted toward compliance, and not considered
part of the base. National Grid would like to see EPA include hydroelectric resources in the goal
computation procedure, and permit all existing and future hydroelectric resources to qualify for
compliance purposes.19
Finally, the fourth building block relates to energy efficiency. AEP writes that in regards to energy
efficiency, “there is no single ‘best practice’ that can be established for all states. Each state should be
allowed to incorporate its energy planning strategy into a plan under section 111(d) to the extent it
determines is appropriate.”20 Finally, Dominion states that “EPA’s yet to be determined evaluation,
measurement and verification protocols must be issued…to ensure that states are investing in those
programs that are acceptable to the EPA.”21 Dominion also points out that EPA’s approach towards
energy efficiency targets doesn’t recognize different regulatory models and rate structures from state to
state. To achieve the state’s target for energy efficiency, it may require a state commission to approve
18
Tennessee Valley Authority, “TVA Comments to EPA on the Proposed Carbon Pollution Emission Guidelines for
Existing Stationary Sources: Electric Generating Units ,” pg. 2 accessed on 12/18/2014 from
http://www.seealliance.org/wp-content/uploads/TVA-2.pdf 19
National Grid, “Comment submitted by Edward White, Vice President Environmental, National Grid,” pg.1 accessed on 12/18/2014 from
http://www.regulations.gov/#!documentDetail;D=EPA-HQ-OAR-2013-0602-24299 20
American Electric Power, “Comment submitted by John M. McManus, Vice President, Environmental Services, American Electric Power (AEP),” pg. 2
accessed on 12/18/2014 from http://www.regulations.gov/#!documentDetail;D=EPA-HQ-OAR-2013-0602-24030 21
Dominion Resources Services, Inc., “Comment submitted by Pamela F. Faggert, Chief Environmental Officer and Vice President, Corporate
Compliance, Dominion Resources Services, Inc.,” pg. 7 accessed on 12/18/2014 from http://www.regulations.gov/#!documentDetail;D=EPA-HQ-
OAR-2013-0602-22566

16
programs that are not cost-effective, thus “usurping the state commission’s authority to protect
ratepayers.”22
4-3 Utility Perspective on Timeline of 111(d)
In a press release issued in conjunction with the filing of its comments on the Clean Power Plan, Edison
Electric Institute president Tom Kuhn said, “The transition to a cleaner generating fleet requires a great
deal of time, infrastructure development and planning that EPA has not allowed for in the proposed
guidelines’ compliance schedule.”23 The issue surrounding timeframe and interim goals is shared by many
utilities as well.
The interim compliance period of 2020-2029 is especially problematic to the electric power sector, as it is
seen as something that would lead to suboptimal deployment of capital, e.g. installing large amounts of
gas-fired generation in order to meet the near-term requirements, while blocking the way for more cost-
effective compliance methods that take longer to implement. Furthermore, there is uncertainty about the
availability and accessibility of an adequate supply of natural gas to support an expanded reliance on gas-
fired power plants.
These concerns are echoed by system operators as well. John Bear, chief executive for the Midcontinent
Independent System Operator, said in a letter to EPA that the interim emissions reduction targets present
"an unrealistic time frame for action" and pose a risk to reliability beginning in 2020. MISO estimates that
14,000 MW—a fourth of the coal-fueled generation expected to exist in the midcontinent region in
2020—may be forced offline under 111(d).24
22
Ibid. pg.35 23
Edison Electric Institute, “EEI Submits Comments to EPA on the Proposed Guidelines for Greenhouse Gas Emissions From Existing Generation
Units,” accessed on 12/18/2014 from
http://www.eei.org/resourcesandmedia/newsroom/Pages/Press%20Releases/EEI%20Submits%20Comments%20to%20EPA%20on%20the%20Pro
posed%20Guidelines%20for%20Greenhouse%20Gas%20Emissions%20From%20Existing%20Generation%20Units.aspx 24
Midcontinent Independent System Operator, Inc , “MISO Comments to EPA on Proposed CPP,” accessed on 12/18/2014 from
https://www.misoenergy.org/Library/Repository/Communication%20Material/EPA%20Regulations/MISO%20Comments%20to%20EPA%20on%20P
roposed%20CPP%2011-25-14.pdf

17
5. STATE PERSPECTIVE ON EPA’S 111(D)
Several states are concerned that the EPA ruling on 111(d) does not provide fair or clear approach to
reaching the stated CO2 reduction goals.25 26 27 Many states submitted comments to EPA regarding their
concerns, and these comments were publicly available in a similar fashion to the comments from utilities.
Most of the concerns from the states mirrored those from the utilities, and could be categorized as
follows:
States that have already reduced a large amount of CO2, or already integrated natural gas into a
large chunk of their fuel mix, feel they are getting penalized by having CO2 targets that may not
incorporate that effort.
Concern that different CO2 targets across all of the states provides an uneven playing field. Some
states believe that they will be placed at an economic disadvantage to neighboring states after
comparing the CO2 reduction targets.
Concern that there will be a large decline in employment opportunity for states that rely heavily
on CO2 heavy fuel sources.
Concern that EPA does not have the authority to regulate entities under 111(d) that are already
being regulated under section 112 of the CAA.28
Other states wrote a letter in support of the law and EPA, with comments meant to help guide the EPA for
smoother implementation29:
Establish the performance level of the standard based on a “best system of emission reduction”
that reflects the full range of approaches that states have successfully demonstrated can cost-
effectively reduce carbon pollution from the electricity system as a whole;
Establish the form of the emission guideline in a way that equitably recognizes the different
starting points and circumstances of different states, including the pollution reductions achieved
by states through climate and clean energy programs; and
Allow for a variety of rigorous state compliance options, including options for compliance through
participation in regional emission budget trading programs and state portfolio programs.
25
Alabama Department of Environmental Management, “Comments to EPA on 111(d),” accessed on 12/18/2014 from
http://www.seealliance.org/wp-content/uploads/ADEM.pdf 26
Virginia Department of Environmental Quality, “Comments to EPA on 111(d),” accessed on 12/18/2014 from
http://www.seealliance.org/wp-content/uploads/Virginia-DEQ.pdf 27
Louisiana Department of Environmental Quality, “Comments to EPA on 111(d),” accessed on 12/18.2014 from
http://www.seealliance.org/wp-content/uploads/Louisiana-DEQ.pdf 28
Attorneys General of the States of Oklahoma, West Virginia, Nebraska, Alabama, Florida, Georgia, Indiana, Kansas, Louisiana, Michigan, Montana,
North Dakota, Ohio, South Carolina, South Dakota, Utah and Wyoming,” Comment from the Attorneys General … on Proposed EPA Carbon Pollution
Emission Guidelines for Existing Stationary Sources: Electric Utility Generating Units,” accessed on 12/12/2014 from
http://www.ok.gov/oag/documents/EPA%20Comment%20Letter%20111d%2011-24-2014.pdf 29
State Environmental Agency leaders from CA, CO, DE, IL, ME, MD, MA, MN, NH, NY, OR, RI, VT, WA, Open Letter to the EPA Administrator Gina
McCarthy on Emission Standards Under Clean Air Act Section 111(d), December 16, 2013.,”States’ §111(d) Implementation Group Input to EPA on
Carbon Pollution Standards for Existing Power Plants,” accessed on 12/23/2014 from http://www.regulations.gov/#!documentDetail;D=EPA-HQ-
OAR-2013-0602-0198

18
6. DNV GL’S PERSPECTIVE ON EPA’S 111(D)
Will EPA’s Clean Power Plan be implemented in line with its current schedule? What is the impact on the
industry? What options should be considered besides what is already in the Clean Power Plan?
The Clean Power Plan leaves many questions unanswered and electricity providers have valid reasons to
be concerned about long term implications. A great deal is at stake and depending on when and how the
state plans are implemented, the costs to the industry and to rate payers will vary considerably. This
section provides DNV GL perspective on whether the goals of 111(d) can be achieved in allotted time,
discussing the potential winners and losers, and addressing the various compliance options that could be
implemented at the utility or state level.
6-1 Is the Clean Power Plan Achievable by 2030?
In 2012, the total emissions of CO2 from US power plants were about 2.2 billion tons and the total average
emissions per MWh amounted to about 1,300 pounds.30 If the 2030 emissions goals set up by the EPA
under the Clean Power Plan (Figure 3-1) were aggregated across all states and weighted by actual 2012
emissions, this would correspond to a national emissions goal of about 1,012 lb per MWh. Thus, by 2030,
the power sector would need to be about 30 percent cleaner than today. Even if we were to account for
potential load growth and only allowing natural gas fired power plants to be built in the future, an
additional 500 million tons of CO2 needs to be removed from the power sector.
Where will these emission reductions come from? There are several resource alternatives that could
potentially replace coal fired generation. First, in 2013-2014, between 5,000-8,000 MW of coal fired
generation has retired. This takes care of about 200 million tons, but leaves nearly 300 million tons per
year to be removed (see Figure 6-1), corresponding to another 40,000 MW of coal fired capacity yet to be
retired. Most of these additional retirements have already been announced by utilities but it is not yet
clear exactly what new capacity will take its place.
30
EIA,“ Table 9.1. Emissions from Energy Consumption at Conventional Power Plants and Combined-Heat-and-Power Plants ,” accessed on
12/24/2014 from http://www.eia.gov/electricity/annual/html/epa_09_01.html

19
Figure 6-1. 2030 Emission Reduction Goals and Incremental Reduction Needs
There are several options for replacing retiring coal fired generation—nuclear, combined cycle gas
capacity, wind, solar, energy efficiency are all potentially part of the mix. Figure 6-2 shows a simplified
example of how much of each resource would be needed if only one resource-type were to replace coal.
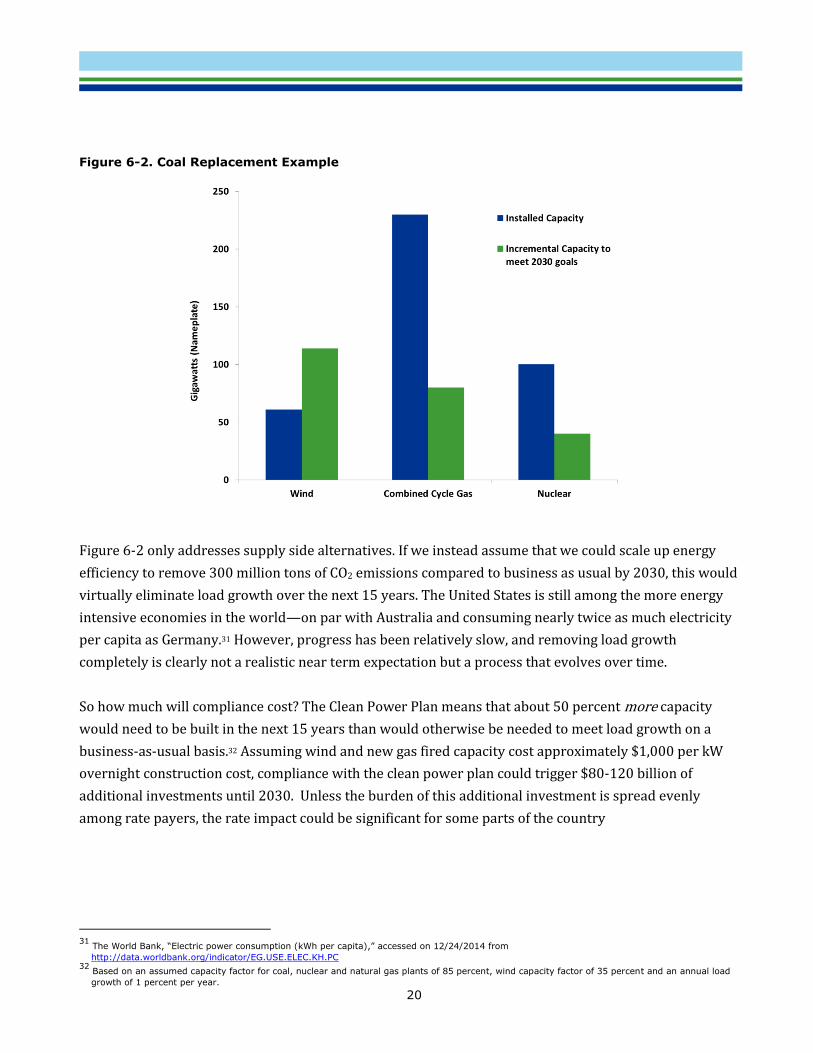
While clearly simplified, Figure 6-2 suggests that meeting the 2030 emissions goals would require a
substantial scale-up of investments in the 2015-2030 period. For example, if only wind were to replace
coal fired generation, it would require nearly 120,000 MW of new capacity, about twice the current total
installed base across the continent. If instead coal were to be replaced by natural gas, a much higher
number of coal plants would need to be retired – while clean, natural gas plants still emits about half as
much as coal fired plants.
20
Figure 6-2. Coal Replacement Example
Figure 6-2 only addresses supply side alternatives. If we instead assume that we could scale up energy
efficiency to remove 300 million tons of CO2 emissions compared to business as usual by 2030, this would
virtually eliminate load growth over the next 15 years. The United States is still among the more energy
intensive economies in the world—on par with Australia and consuming nearly twice as much electricity
per capita as Germany.31 However, progress has been relatively slow, and removing load growth
completely is clearly not a realistic near term expectation but a process that evolves over time.
So how much will compliance cost? The Clean Power Plan means that about 50 percent more capacity
would need to be built in the next 15 years than would otherwise be needed to meet load growth on a
business-as-usual basis.32 Assuming wind and new gas fired capacity cost approximately $1,000 per kW
overnight construction cost, compliance with the clean power plan could trigger $80-120 billion of
additional investments until 2030. Unless the burden of this additional investment is spread evenly
among rate payers, the rate impact could be significant for some parts of the country
31
The World Bank, “Electric power consumption (kWh per capita),” accessed on 12/24/2014 from
http://data.worldbank.org/indicator/EG.USE.ELEC.KH.PC 32
Based on an assumed capacity factor for coal, nuclear and natural gas plants of 85 percent, wind capacity factor of 35 percent and an annual load
growth of 1 percent per year.

21
6-2 Implementation Likely to be Delayed
EPA expects to finalize the Clean Power Plan rulemaking by June 1, 2015. States will be required to
submit their plans by June 30, 2016. If a state is unable to complete its entire plan in that time, they must
submit an initial plan meeting certain minimum requirements, and then the full plan by June 30 of either
2017 or 2018, depending on whether inter-state emissions trading is part of the plan. States are required
to begin making emissions reductions by 2020, and to be in full compliance with their emission
performance level no later than 2030.
There are already some signals that suggest that the Clean Power Plan may get significantly delayed. A
number of states (Oklahoma, West Virginia, Nebraska, Alabama, Florida, Georgia, Indiana, Kansas,
Louisiana, Michigan, Montana, North Dakota, Ohio, South Carolina, South Dakota, Utah, and Wyoming)
have decided to sue the EPA, claiming that the regulations are not only unprecedented but also illegal.33
The initial 90 day public commenting period was extended until December 2014 and over 3 million
comments were filed as highlighted above.34 Given the broad nature of the Plan and its uneven impact on
states as well as the significance of the both emission reductions and the level of state effort required to
design programs, it is a virtual certainty that implementation will be delayed. Further contributing to
likely delays is the fact that between today and the plan’s implementation date lie many federal and state
elections that may alter the course and ambition of the Clean Power Plan, including two presidential
elections.
6-3 The Clean Power Plan Creates Winners and Losers
Many utilities have a multi-state footprint and will thus be subject to a multitude of state-specific
emissions targets under the Clean Power Plan. The carbon footprint for utilities also varies widely—while
some rely heavily on coal, others are more dependent on nuclear and gas fired generation for their
electricity supply. But it is not sufficient to merely look at which utility has the highest number of coal-
fired power plants to find utilities at risk. The state goals and total exposure to carbon reduction targets
must also be taken into account. For example, a power company with mostly nuclear assets that operates
mainly in states with only modest carbon reduction targets may not be significantly impacted by the
Clean Power Plan, whereas a utility with high emissions on a per megawatt-hour basis and operates in
states with stringent emissions reductions requirements has much at stake, and potentially a lot to lose
unless flexible compliance mechanisms can be devised.
33
Attorneys General of the States of Oklahoma, West Virginia, Nebraska, Alabama, Florida, Georgia, Indiana, Kansas, Louisiana, Michigan, Montana,
North Dakota, Ohio, South Carolina, South Dakota, Utah and Wyoming,” Comment from the Attorneys General … on Proposed EPA Carbon Pollution
Emission Guidelines for Existing Stationary Sources: Electric Utility Generating Units,” accessed on 12/12/2014 from
http://www.ok.gov/oag/documents/EPA%20Comment%20Letter%20111d%2011-24-2014.pdf 34
Regulations.gov, “Standards of Performance for Greenhouse Gas Emissions from Existing Sources: Electric Utility Generating Units,” accessed on
12/23/2014 from http://www.regulations.gov/#!docketDetail;D=EPA-HQ-OAR-2013-0602

22
To determine who is most at risk, DNV GL developed a new metric that translates state emission
restrictions into corresponding carbon emission constraints for power producers depending on each
company’s unique combination of states in which it is active in and the emissions profile of its generation
fleet. We call this the Implied Emissions Goal for each company. Using this metric, a company that has
lower emissions than its peers (or the national average) and that operates in states with less ambitious
carbon reduction should have a lower hurdle of emissions reductions than power companies active in
states with more stringent emission reduction requirements and higher-emitting power plants. Figure
6-3 identifies how the top 50 largest power companies in the United States (generation by holding
company) compare with respect to emissions and the stringency of emission reductions that each
respective company will face with its current generator portfolio. Figure 6-3 suggests that there is a wide
spread in how exposed the companies are to the Clean Power Plan.

23
Figure 6-3. Risk analysis for largest US utilities with respect to current emissions and the stringency of emission reductions
1. PG&E Corp
2. Public Service Enterprise Group Inc
3. Exelon Corp 4. Pinnacle West Capital Corp
5. NextEra Energy Inc
6. Entergy Corp
7. Dominion Resources Inc 8. Calpine Corp
9. LS Power Group
10. Entegra Power Group LLC
11. Tenaska Inc 12. SCANA Corp
13. Carlyle Group (The)
14. GDF SUEZ SA
15. Energy Capital Partners
16. Southern Co 17. Duke Energy Corp
18. Tennessee Valley Authority
19. General Electric Co
20. Energy Future Holdings Corp 21. JEA
22. Salt River Project
23. Xcel Energy Inc
24. TECO Energy Inc
25. CPS Energy
26. NRG Energy Inc 27. OGE Energy Corp
28. Cleco Corp
29. Energy Investors Funds Group
30. Santee Cooper 31. FirstEnergy Corp
32. Lower Colorado River Authority
33. Los Angeles Dept of Water & Power
34. CMS Energy Corp 35. Dynegy Inc
36. Nebraska Public Power District
37. Berkshire Hathaway Inc
38. American Electric Power Co Inc
39. Ameren Corp 40. Westar Energy Inc
41. DTE Energy Co
42. PPL Corp
43. Tri State Generation & Transmission Association Inc 44. Wisconsin Energy Corp
45. Associated Electric Coop Inc
46. AES Corp (The)

24
With the Clean Power Plan in its current form, Figure 6-3 suggests that that many companies will face
hard choices on what resources to invest in and need to carefully consider the risks with each. Figure 6-3
also suggests that the impact will be very uneven – while some companies may escape virtually
unscathed, others may be forced to make significant investments resulting in steep rate increases.
Resource choices are many and each comes with its own set of risks: Wind is relatively affordable and
offers zero emissions but is intermittent. Nuclear energy offers emissions-free baseload energy but the
upfront costs are high, fuel disposal is controversial and the public opinion on the used nuclear energy is
mixed. The currently favored choice is natural gas—a combination of low gas prices, lower emissions and
lower capital costs means that combined cycle natural gas plants compete head-to-head with coal for
serving baseload needs. But fuel price risks remain a potential concern as gas prices tend to vary widely.
In addition to cost and emissions, reliability, fuel security and risk must also be factored in. Even though
each company’s situation and asset base is unique, a few general observations emerge if the Clean Power
Plan is implemented in its current form:
The industry is facing a huge challenge in re-juvenating its assets portfolio with gas-fired
generation, wind and solar, and possibly nuclear generation
Investor-owned companies will see a significant impact on their valuation
The rate increases for some utilities will be dramatic
State implementation plan designs will be a major factor in how high the compliance costs will go
and what the impact on rate payers will be
6-4 A Broader Range of Compliance Options is Needed
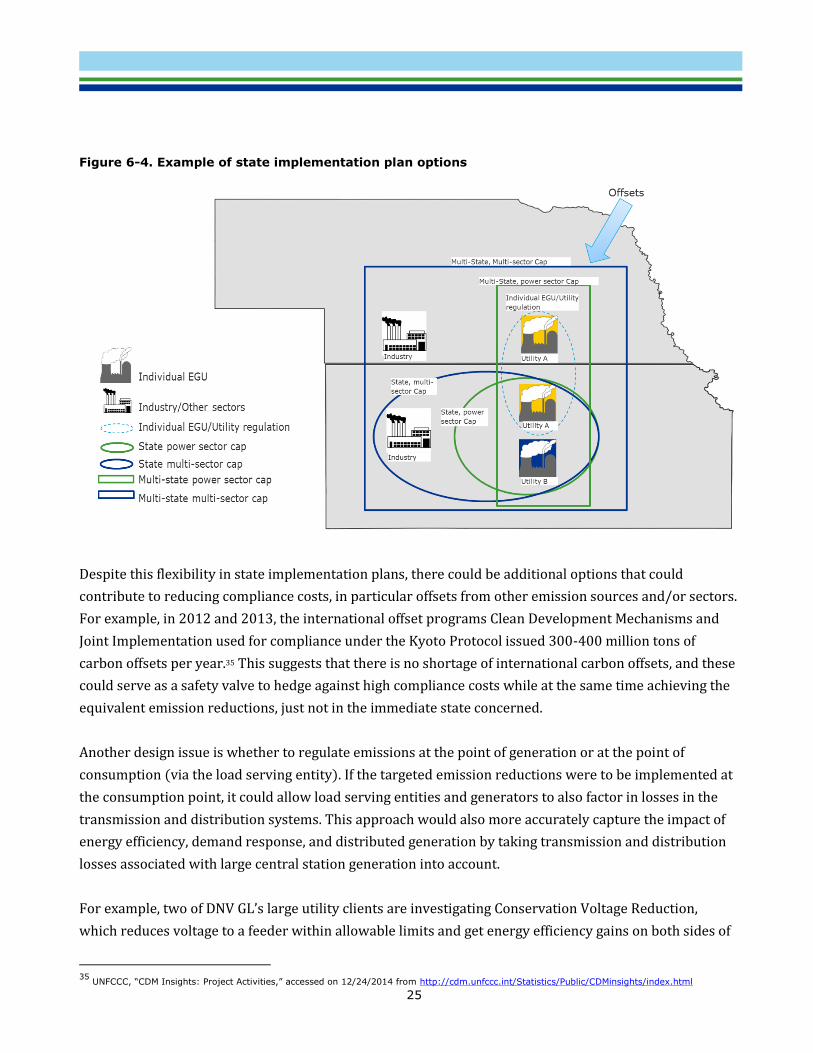
The options open to states for devising their respective state implementation plans are outlined in
Section 3, above. Figure 6-4, below, outlines the options open to states, ranging from direct regulation of
individual generating units (EGUs) to setting a mass-cap for emissions which could include only the
power sector or possibly multiple sectors and could also include a single state or multiple states.
25
Figure 6-4. Example of state implementation plan options
Despite this flexibility in state implementation plans, there could be additional options that could
contribute to reducing compliance costs, in particular offsets from other emission sources and/or sectors.
For example, in 2012 and 2013, the international offset programs Clean Development Mechanisms and
Joint Implementation used for compliance under the Kyoto Protocol issued 300-400 million tons of
carbon offsets per year.35 This suggests that there is no shortage of international carbon offsets, and these
could serve as a safety valve to hedge against high compliance costs while at the same time achieving the
equivalent emission reductions, just not in the immediate state concerned.
Another design issue is whether to regulate emissions at the point of generation or at the point of
consumption (via the load serving entity). If the targeted emission reductions were to be implemented at
the consumption point, it could allow load serving entities and generators to also factor in losses in the
transmission and distribution systems. This approach would also more accurately capture the impact of
energy efficiency, demand response, and distributed generation by taking transmission and distribution
losses associated with large central station generation into account.
For example, two of DNV GL’s large utility clients are investigating Conservation Voltage Reduction,
which reduces voltage to a feeder within allowable limits and get energy efficiency gains on both sides of
35
UNFCCC, “CDM Insights: Project Activities,” accessed on 12/24/2014 from http://cdm.unfccc.int/Statistics/Public/CDMinsights/index.html
26
the meter. DNV GL is currently providing the impact analysis for these types of programs, as utilities
want to be able to gain as much efficiency from their existing infrastructure before having to undertake
capital intensive retrofits or even new, renewable generation construction.
A broader set of options will contribute to lower compliance costs and ultimately help reduce the impact
for rate payers. But the myriad of choices creates a complex set of options to consider when designing,
monitoring and evaluating a plan to demonstrate compliance with the 111(d). The next section outlines
the service offerings that DNV GL provides to help clients understand these choices, and help develop a
plan that fits their needs.
7. DEVELOPING STRATEGY AND COMPLIANCE UNDER UNCERTAINTY
There is tremendous uncertainty on how the Clean Power Plan will play out and when it will be
implemented. The complexity is also increased by the “usual suspects” economic growth, electric
demand growth, technological change, fuel prices and capital costs for new resources. Despite this
complexity, states must devise implementation plans that will impact the power industry for decades and
investors must make long-term choices on generation supply and transmission infrastructure. DNV GL
has supported numerous power companies with decisions and investment strategy that factors in
uncertainty and have supported states and utilities with developing long term policy for renewable
generation. Tools and techniques we utilize include scenario based strategic planning, policy road-
mapping, technology road-mapping, and detailed operational research to find performance
improvements.
7-1 Designing Actionable State Implementation Plans
State implementation plans are due on June 30, 2016 with an additional grace period until June 30, 2017.
The deadline for multi-state implementation plans has currently been defined as June 30, 2018. It is likely
that these deadlines will slide since the EPA has already introduced delays in their own planning dates.
Implementation is targeted to start in 2020, and be in full compliance with EPA’s mandated emission
performance levels no later than 2030.
DNV GL’s approach for designing actionable policy draws on our experience in supporting a number of
states on important sustainability policy to improve energy efficiency, renewable energy policy, and
market design. EPA’s Clean Power Plan calls for a comprehensive examination of policy options uniquely
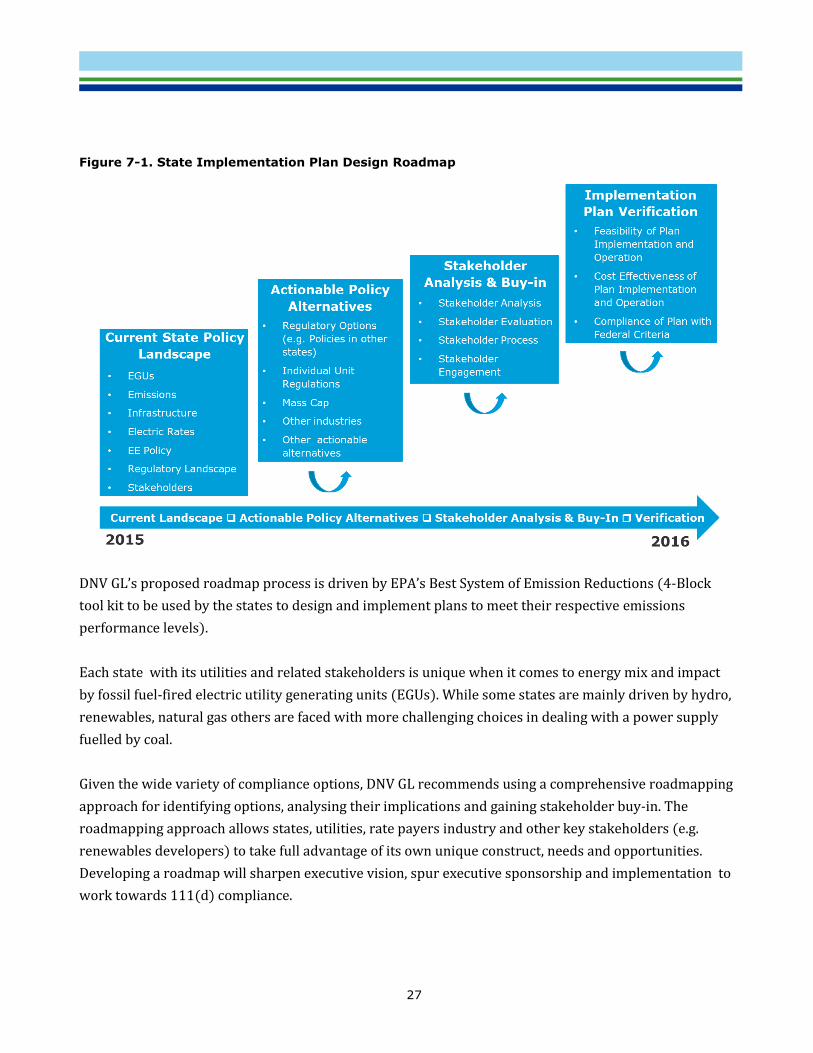
defined by opportunities and constraints in each state. Figure 7-1 outlines the roadmap process for
getting from today’s confusing array of compliance options to a state implementation plan.
27
Figure 7-1. State Implementation Plan Design Roadmap
DNV GL’s proposed roadmap process is driven by EPA’s Best System of Emission Reductions (4-Block
tool kit to be used by the states to design and implement plans to meet their respective emissions
performance levels).
Each state with its utilities and related stakeholders is unique when it comes to energy mix and impact
by fossil fuel-fired electric utility generating units (EGUs). While some states are mainly driven by hydro,
renewables, natural gas others are faced with more challenging choices in dealing with a power supply
fuelled by coal.
Given the wide variety of compliance options, DNV GL recommends using a comprehensive roadmapping
approach for identifying options, analysing their implications and gaining stakeholder buy-in. The
roadmapping approach allows states, utilities, rate payers industry and other key stakeholders (e.g.
renewables developers) to take full advantage of its own unique construct, needs and opportunities.
Developing a roadmap will sharpen executive vision, spur executive sponsorship and implementation to
work towards 111(d) compliance.

28
7-2 DNV GL Services to Work Towards Compliance
Internationally, DNV GL’s legacy companies DNV and GL have been active for more than 15 years in
helping companies identify carbon offsets and perform monitoring, validation and verification of carbon
emissions.
DNV GL offers services across the energy supply chain which can provide support to customers who are
trying to navigate the potential compliance options under EPA’s 111(d). We have extensive experience in
power system planning and understand the unique concerns clients have when considering upgrading
conventional generation and increasing their reliance on renewable generation. Furthermore, we
understand the importance demand-side management will play in meeting the goals of 111(d), and offer
program planning, implementation, and evaluation services to support clients in this area as well. DNV
GL’s rate & cost of service support, and load research & forecasting services, can help clients understand
the potential impact of 111(d) on their markets.
Table 7-1 provides an overview of the service offerings the DNV GL offers to clients that will aid them in
being in compliance with 111(d) carbon reduction goals. All of these services are professional resources
that DNV GL has been offering for years, and we have a proven track record of delivering value to clients
in these areas.

29
Table 7-1 DNV GL Service Offerings that support the four building blocks of 111(d)
Supply-Side Services Demand-Side Services EGU Retrofit Support:
Improve power plant operations to reduce emissions
Inspections/Certification of retrofit projects
Identify most cost-effective retrofit options for improving heat rates at existing facilities
Run utility PMO for large and complex retrofit projects
Market Assessment and Energy Efficiency Potential:
Saturation Studies
Potential Studies
Market Segmentation
Strategic Planning
Program Design
Program Implementation
Cost Effectiveness Screening
Evaluation, Measurement, and Verification:
Portfolio Evaluation
Impact Evaluation
Process Evaluation
Renewable Energy Support:
Grid integration of renewables and analysis of inertia and flexibility
Near term forecasting of renewable generation and weather
Distributed Energy Resources (DERs), storage integration, distribution systems
DSM Program Planning and Implementation:
Program Design
Program Implementation including administrative support and delivery
Carbon Emission Impact Modelling:
Estimating Carbon Impacts from Program Evaluation
Estimating Carbon Reduction Potential of DSM Measures
Conservation Voltage Reduction
Implementation
Evaluation and Measurement
Microgrid Analysis and Optimization TRM Development/ Deemed Savings Calculations
Load Research and Forecasting
Rate and Cost of Service Support
Energy Master Planning
Establish current energy consumption, greenhouse gas emissions, and energy cost baselines
Identify and prioritize energy efficiency, clean energy, and green power procurement options to be implemented over a long-term horizon
Establish milestones and verification processes
Smart Green Cities Action Plans
Develop a shared understanding of municipal and utility resources, needs, and energy goals
Develop an implantation plan that can include benchmarking, climate action planning, energy manager services, tools for analyzing infrastructure savings

30
ACKNOWLEDGEMENTS
The authors would like to thank Dr. Miriam Goldberg, Tim Pettit, Tamara Kuiken Whitiken, Jane Howell
and Bethany Genier for their invaluable support to develop this white paper. We would also like to
express our sincere appreciation for the insightful comments given by Robert Wilhite.

31
ABOUT THE CONTRIBUTING AUTHORS
Olof Bystrom Head of Section DNV GL Energy
Olof Bystrom leads DNV GL’s wholesale energy market practice. His
consulting engagements focus on utility strategy, renewables integration
and energy economics. The wholesale team covers analytical needs from
real-time operational issues that help clients understand market design and
reliability, to long term forecasts that support strategic decisions.
Dr. Bystrom has 15 years of experience in energy, climate change and
environmental markets.
Contact Info:
510 407 3576
Bert Taube Consultant
DNV GL Energy
Bert Taube is a Principal Consultant in DNV GL’s Policy Advisory and
Research practice. He is focused on project developments related to
energy efficiency programs, utility load and financial solutions as well as
data technology. Bert has spent more than 20 years creating and leading
projects for high-voltage power transmission and electric transportation
networks as well as Big Data analytics and automation software to serve
mission-critical industries.
Contact Info:
408 307 4424
Jason Symonds Consultant
DNV GL Energy
Jason Symonds is a consultant in DNV GL’s Policy Advisory and Research
practice, with experience helping utility clients perform M&V evaluations
on both residential and non-residential energy efficiency programs. This
includes developing energy efficiency potential models, as well as
performing program attribution methodology, and incorporating
Net-to-Gross Ratios into impact analysis. He has developed and
implemented surveys for Transportation and Renewable Energy program
evaluations, collecting primary data from program participants and
vendors.
Contact Info:
571 286 8174

32
Kristina Kelly Consultant
DNV GL Energy
Kristina Kelly, a Senior Consultant in DNV GL’s Policy, Advisory, and
Research team, has been working at DNV GL since June 2008 and has
ten years of energy research and analysis experience. In her current
position, Ms. Kelly has managed a number of electric and gas efficiency
potential studies and evaluations of the energy and carbon savings
attributable to the ENERGY STAR program and clean energy policy
support programs funded by the State Energy Program. Ms. Kelly also
oversaw the recent analysis of carbon and labor impacts associated with
ARRA-funded energy programs.
Contact Info:
339 234 3330
Dick Bratcher Senior Principal
Consultant
DNV GL Energy
Dick Bratcher has spent 35 years working on environmental issues
associated with the electric power industry. His practice at DNV GL is
focused on development and delivery of consulting services that help
clients assess risks, develop strategies, and implement mitigation and
adaptation measures to minimize physical, regulatory, reputational, and
financial risk associated with greenhouse gases and other emissions.
Contact Info:
510 338 8062
Curt Puckett Head of Department
DNV GL Energy
Curt Puckett is Head of the Client Care Department of DNV GL’s Policy
Advisory and Research Business. Curt has been in the interval load data
analysis area of the utility sector since 1979. He spent the early part of
his career with Consumers Energy (Jackson Michigan) in the areas of load
research and energy efficiency/ demand response evaluation. In 1990,
Curt Puckett and Roger Wright created a start-up called RLW Analytics
addressing the growing need to evaluate the performance of energy
efficiency and demand response programs. He was named President and
CEO of RLW in 2005. The company was acquired by KEMA in 2009.
Subsequent mergers with DNV and GL made it become part of DNV GL
Energy. Curt has held a variety of leadership positions within KEMA, DNV
KEMA and DNV ever since RLW’s acquisition.
Contact Info:
517 898 7078

33
DNV KEMA IS NOW DNV GL
About DNV GL
Driven by its purpose of safeguarding life, property and the environment, DNV GL enables organizations
to advance the safety and sustainability of their business. DNV GL provides classification and technical
assurance along with software and independent expert advisory services to the maritime, oil & gas and
energy industries. It also provides certification services to customers across a wide range of industries.
DNV GL, whose origins go back to 1864, operates globally in more than 100 countries with its 16,000
professionals dedicated to helping their customers make the world safer, smarter and greener.
In the Energy industry
In DNV GL we unite the strengths of DNV, KEMA, Garrad Hassan, and GL Renewables Certification.
DNV GL’s 2,500 energy experts support customers around the globe in delivering a safe, reliable, efficient,
and sustainable energy supply. We deliver world-renowned testing, certification and advisory services to
the energy value chain including renewables and energy efficiency. Our expertise spans onshore and
offshore wind power, solar, conventional generation, transmission and distribution, smart grids, and
sustainable energy use, as well as energy markets and regulations. Our testing, certification and advisory
services are delivered independent from each other.
Learn more at www.dnvgl.com/energy.
DNV GL can help you identify the challenges and opportunities meeting the goals of 111(d) will bring.
Contact Olof Bystrom at [email protected] or Bert Taube at [email protected] to find out
how we can help you develop a roadmap to successfully navigate these changes.