Embed Size (px)
Citation preview
RESEARCH Open Access
Host habitat is the major determinant ofthe gut microbiome of fishPil Soo Kim1†, Na-Ri Shin1,2†, Jae-Bong Lee3†, Min-Soo Kim1, Tae Woong Whon1, Dong-Wook Hyun1, Ji-Hyun Yun1,Mi-Ja Jung1, Joon Yong Kim1 and Jin-Woo Bae1*
Abstract
Background: Our understanding of the gut microbiota of animals is largely based on studies of mammals. Tobetter understand the evolutionary basis of symbiotic relationships between animal hosts and indigenous microbes,it is necessary to investigate the gut microbiota of non-mammalian vertebrate species. In particular, fish have thehighest species diversity among groups of vertebrates, with approximately 33,000 species. In this study, wecomprehensively characterized gut bacterial communities in fish.
Results: We analyzed 227 individual fish representing 14 orders, 42 families, 79 genera, and 85 species. The fish gutmicrobiota was dominated by Proteobacteria (51.7%) and Firmicutes (13.5%), different from the dominant taxareported in terrestrial vertebrates (Firmicutes and Bacteroidetes). The gut microbial community in fish was morestrongly shaped by host habitat than by host taxonomy or trophic level. Using a machine learning approachtrained on the microbial community composition or predicted functional profiles, we found that the host habitatexhibited the highest classification accuracy. Principal coordinate analysis revealed that the gut bacterial communityof fish differs significantly from those of other vertebrate classes (reptiles, birds, and mammals).
Conclusions: Collectively, these data provide a reference for future studies of the gut microbiome of aquaticanimals as well as insights into the relationship between fish and their gut bacteria, including the key role of hosthabitat and the distinct compositions in comparison with those of mammals, reptiles, and birds.
Keywords: Fish, Fish gut microbiota, Freshwater fish, Seawater fish, Vertebrate gut microbiota
BackgroundMulticellular eukaryotes appeared 1.2 billion years ago,followed by a long evolutionary history of mutual inter-actions between multicellular and single-celled organ-isms [1]. According to Van Valen’s “Red Queenhypothesis,” evolution is driven by competition amongtaxa for survival under constantly changing environ-ments [2]. Indeed, co-existence with microbes poses oneof the greatest challenges for animals. At the same time,
hosts and microbes can establish symbiotic relationships,in which each species benefits from mutualistic interac-tions [3]. The symbiotic microbiota contributes to ani-mal adaptation to various habitats by providingcomplementary functional resources (e.g., by digestingindigestible dietary fiber, producing essential vitamins,protecting against enteropathogens, maintaining im-mune homeostasis, and contributing to intestinal matur-ation) over a long period of co-evolution [4–10].In the last decade, numerous studies have explored gut
microbial communities of various animal hosts. How-ever, these studies have mostly focused on the gutmicrobiota of mammals [11], which represent less than10% of all vertebrate diversity. By contrast, there aremore than 33,000 species of fish, representing the
© The Author(s). 2021 Open Access This article is licensed under a Creative Commons Attribution 4.0 International License,which permits use, sharing, adaptation, distribution and reproduction in any medium or format, as long as you giveappropriate credit to the original author(s) and the source, provide a link to the Creative Commons licence, and indicate ifchanges were made. The images or other third party material in this article are included in the article's Creative Commonslicence, unless indicated otherwise in a credit line to the material. If material is not included in the article's Creative Commonslicence and your intended use is not permitted by statutory regulation or exceeds the permitted use, you will need to obtainpermission directly from the copyright holder. To view a copy of this licence, visit http://creativecommons.org/licenses/by/4.0/.The Creative Commons Public Domain Dedication waiver (http://creativecommons.org/publicdomain/zero/1.0/) applies to thedata made available in this article, unless otherwise stated in a credit line to the data.
* Correspondence: [email protected]†Pil Soo Kim, Na-Ri Shin and Jae-Bong Lee contributed equally to this work.1Department of Biology and Department of Life and NanopharmaceuticalSciences, Kyung Hee University, Dongdaemun-gu, Seoul 02447, Republic ofKoreaFull list of author information is available at the end of the article
Kim et al. Microbiome (2021) 9:166 https://doi.org/10.1186/s40168-021-01113-x
greatest species diversity among groups of vertebrates[12, 13]. This focus on a single class of animals allowsonly limited insight into the vertebrate gut microbiota.To understand the co-evolution of vertebrates and gutmicrobes, broad analyses of fish are essential. The gutmicrobiota has been evaluated in a few model fish spe-cies, such as zebrafish [14], guppy [15], and rainbowtrout [16], and in economically valuable aquatic animals,such as carp [17], Atlantic salmon [18], sturgeon [19],and Atlantic cod [20]. However, these studies are insuffi-cient to comprehensively understand the composition ofthe gut microbiota in fish and patterns of co-evolution.Here, we aimed to resolve long-standing questions
about the gut microbiota in fish. For example, is the gutmicrobiota in fish shaped by the host habitat? Do geneticfactors in fish affect the structure of the gut microbiotaand, if so, to what extent? How does the gut microbiotaof fish differ from those of other vertebrates? To resolvethese issues, we comprehensively characterized the gutmicrobiota of 227 individual fish representing 85 speciesobtained from lakes, a stream, and seas (i.e., habitatswith distinct differences in nutrient availability, salinity,temperature, and depth) (Figs. 1 and 2). We used a clus-tering approach to find the primary determinants of thestructures of the gut microbiome and verified these de-terminants using unsupervised and supervised machinelearning approaches, likes PAM clustering and randomforest classification. To gain a wider perspective, wecompared gut microbial communities in fish and othervertebrates (mammals, reptiles, and birds) by using prin-cipal coordinate analysis (PCoA). These data serve as areference for future studies of the gut microbiota of fishand other aquatic animals. Our findings also support thenotion that symbiotic relationships between microbesand vertebrates are important for adaptation and provideinsights into the nature of interspecific microbiome vari-ation in various fish species.
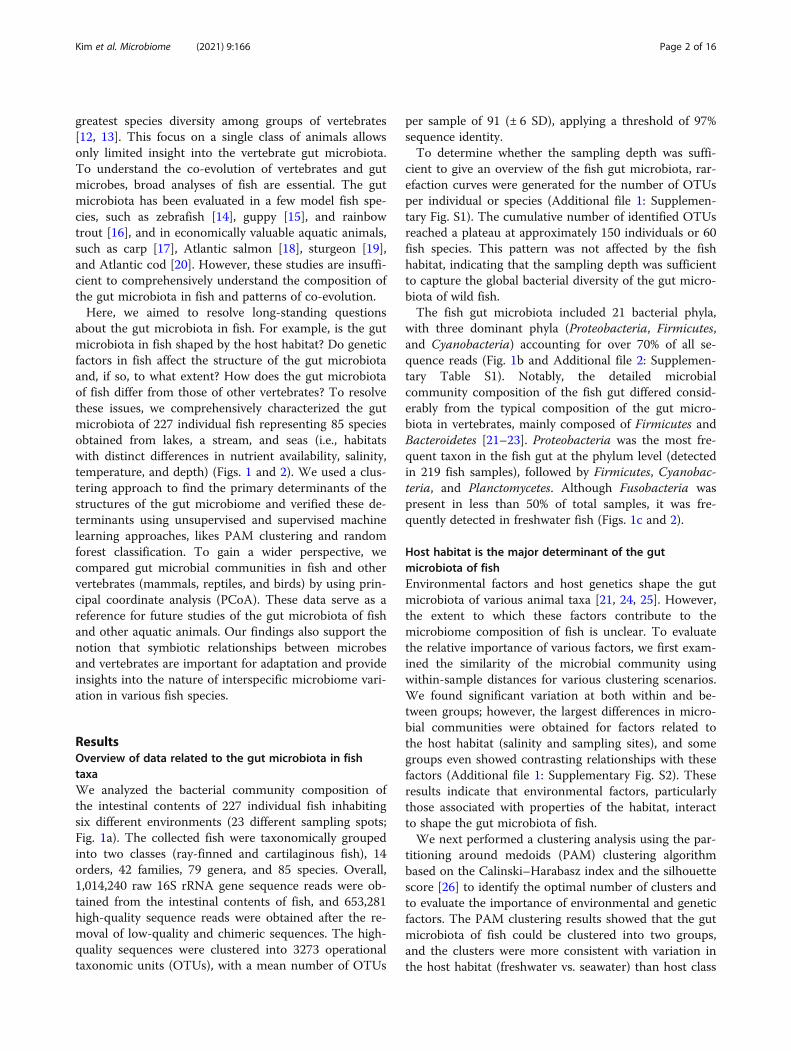
ResultsOverview of data related to the gut microbiota in fishtaxaWe analyzed the bacterial community composition ofthe intestinal contents of 227 individual fish inhabitingsix different environments (23 different sampling spots;Fig. 1a). The collected fish were taxonomically groupedinto two classes (ray-finned and cartilaginous fish), 14orders, 42 families, 79 genera, and 85 species. Overall,1,014,240 raw 16S rRNA gene sequence reads were ob-tained from the intestinal contents of fish, and 653,281high-quality sequence reads were obtained after the re-moval of low-quality and chimeric sequences. The high-quality sequences were clustered into 3273 operationaltaxonomic units (OTUs), with a mean number of OTUs
per sample of 91 (± 6 SD), applying a threshold of 97%sequence identity.To determine whether the sampling depth was suffi-
cient to give an overview of the fish gut microbiota, rar-efaction curves were generated for the number of OTUsper individual or species (Additional file 1: Supplemen-tary Fig. S1). The cumulative number of identified OTUsreached a plateau at approximately 150 individuals or 60fish species. This pattern was not affected by the fishhabitat, indicating that the sampling depth was sufficientto capture the global bacterial diversity of the gut micro-biota of wild fish.The fish gut microbiota included 21 bacterial phyla,
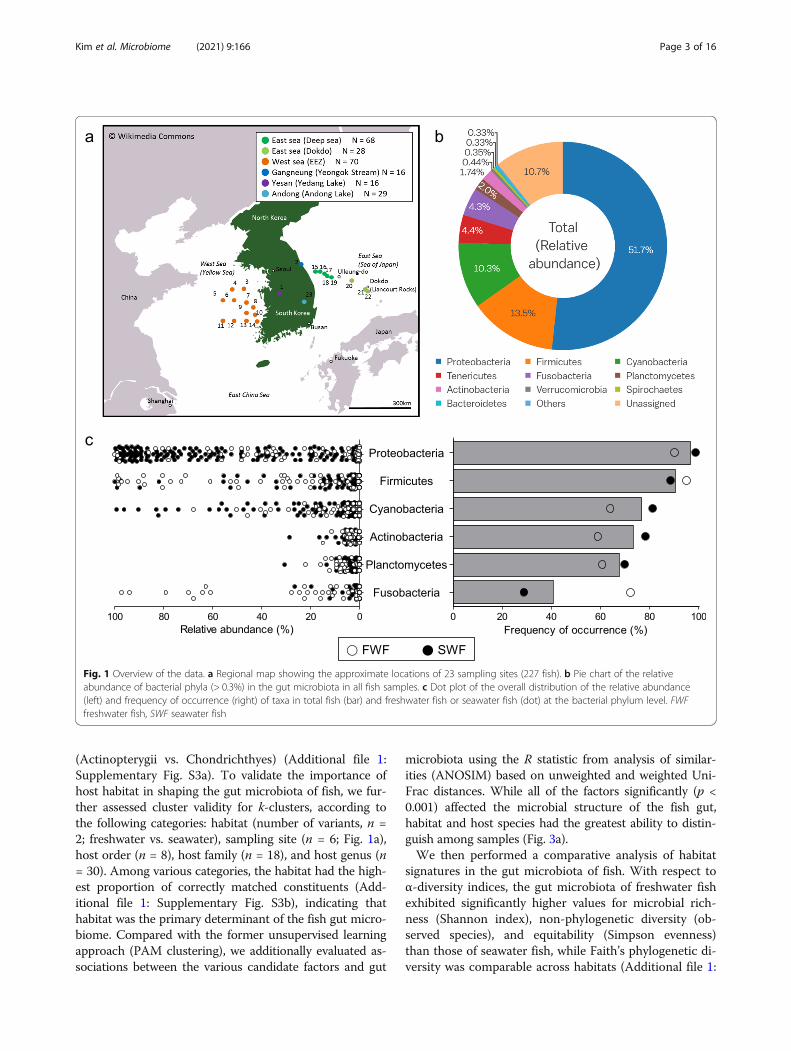
with three dominant phyla (Proteobacteria, Firmicutes,and Cyanobacteria) accounting for over 70% of all se-quence reads (Fig. 1b and Additional file 2: Supplemen-tary Table S1). Notably, the detailed microbialcommunity composition of the fish gut differed consid-erably from the typical composition of the gut micro-biota in vertebrates, mainly composed of Firmicutes andBacteroidetes [21–23]. Proteobacteria was the most fre-quent taxon in the fish gut at the phylum level (detectedin 219 fish samples), followed by Firmicutes, Cyanobac-teria, and Planctomycetes. Although Fusobacteria waspresent in less than 50% of total samples, it was fre-quently detected in freshwater fish (Figs. 1c and 2).
Host habitat is the major determinant of the gutmicrobiota of fishEnvironmental factors and host genetics shape the gutmicrobiota of various animal taxa [21, 24, 25]. However,the extent to which these factors contribute to themicrobiome composition of fish is unclear. To evaluatethe relative importance of various factors, we first exam-ined the similarity of the microbial community usingwithin-sample distances for various clustering scenarios.We found significant variation at both within and be-tween groups; however, the largest differences in micro-bial communities were obtained for factors related tothe host habitat (salinity and sampling sites), and somegroups even showed contrasting relationships with thesefactors (Additional file 1: Supplementary Fig. S2). Theseresults indicate that environmental factors, particularlythose associated with properties of the habitat, interactto shape the gut microbiota of fish.We next performed a clustering analysis using the par-
titioning around medoids (PAM) clustering algorithmbased on the Calinski–Harabasz index and the silhouettescore [26] to identify the optimal number of clusters andto evaluate the importance of environmental and geneticfactors. The PAM clustering results showed that the gutmicrobiota of fish could be clustered into two groups,and the clusters were more consistent with variation inthe host habitat (freshwater vs. seawater) than host class
Kim et al. Microbiome (2021) 9:166 Page 2 of 16
(Actinopterygii vs. Chondrichthyes) (Additional file 1:Supplementary Fig. S3a). To validate the importance ofhost habitat in shaping the gut microbiota of fish, we fur-ther assessed cluster validity for k-clusters, according tothe following categories: habitat (number of variants, n =2; freshwater vs. seawater), sampling site (n = 6; Fig. 1a),host order (n = 8), host family (n = 18), and host genus (n= 30). Among various categories, the habitat had the high-est proportion of correctly matched constituents (Add-itional file 1: Supplementary Fig. S3b), indicating thathabitat was the primary determinant of the fish gut micro-biome. Compared with the former unsupervised learningapproach (PAM clustering), we additionally evaluated as-sociations between the various candidate factors and gut
microbiota using the R statistic from analysis of similar-ities (ANOSIM) based on unweighted and weighted Uni-Frac distances. While all of the factors significantly (p <0.001) affected the microbial structure of the fish gut,habitat and host species had the greatest ability to distin-guish among samples (Fig. 3a).We then performed a comparative analysis of habitat
signatures in the gut microbiota of fish. With respect toα-diversity indices, the gut microbiota of freshwater fishexhibited significantly higher values for microbial rich-ness (Shannon index), non-phylogenetic diversity (ob-served species), and equitability (Simpson evenness)than those of seawater fish, while Faith’s phylogenetic di-versity was comparable across habitats (Additional file 1:
Fig. 1 Overview of the data. a Regional map showing the approximate locations of 23 sampling sites (227 fish). b Pie chart of the relativeabundance of bacterial phyla (> 0.3%) in the gut microbiota in all fish samples. c Dot plot of the overall distribution of the relative abundance(left) and frequency of occurrence (right) of taxa in total fish (bar) and freshwater fish or seawater fish (dot) at the bacterial phylum level. FWFfreshwater fish, SWF seawater fish
Kim et al. Microbiome (2021) 9:166 Page 3 of 16
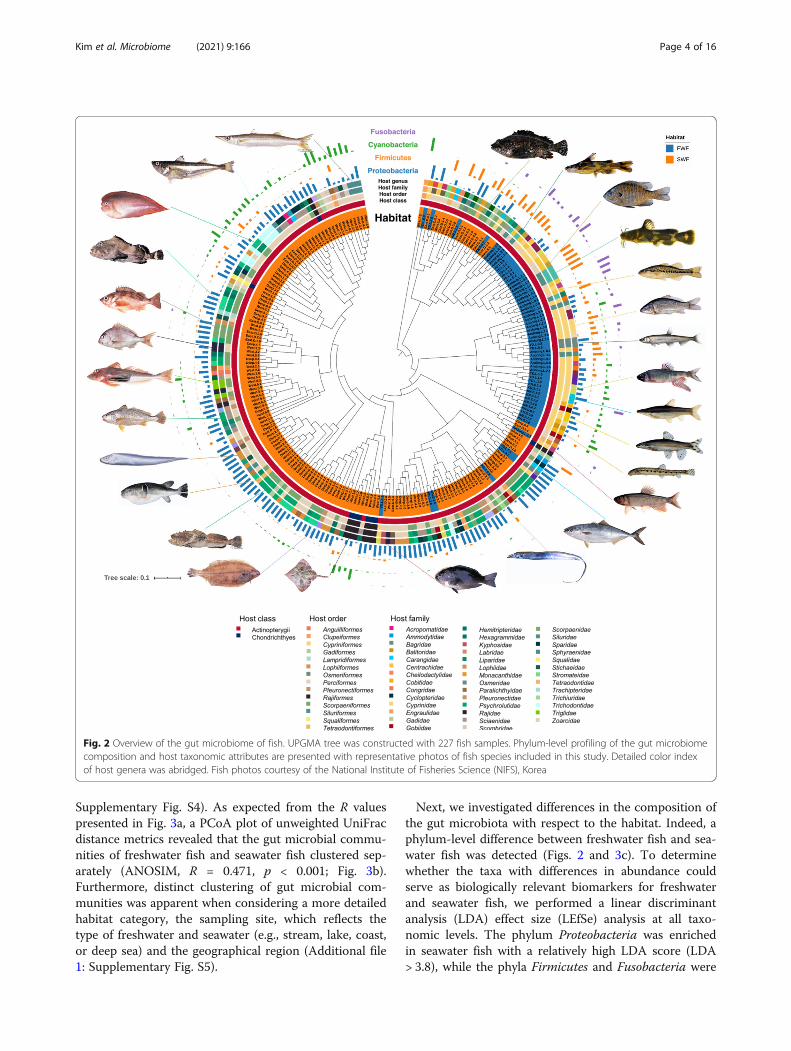
Supplementary Fig. S4). As expected from the R valuespresented in Fig. 3a, a PCoA plot of unweighted UniFracdistance metrics revealed that the gut microbial commu-nities of freshwater fish and seawater fish clustered sep-arately (ANOSIM, R = 0.471, p < 0.001; Fig. 3b).Furthermore, distinct clustering of gut microbial com-munities was apparent when considering a more detailedhabitat category, the sampling site, which reflects thetype of freshwater and seawater (e.g., stream, lake, coast,or deep sea) and the geographical region (Additional file1: Supplementary Fig. S5).
Next, we investigated differences in the composition ofthe gut microbiota with respect to the habitat. Indeed, aphylum-level difference between freshwater fish and sea-water fish was detected (Figs. 2 and 3c). To determinewhether the taxa with differences in abundance couldserve as biologically relevant biomarkers for freshwaterand seawater fish, we performed a linear discriminantanalysis (LDA) effect size (LEfSe) analysis at all taxo-nomic levels. The phylum Proteobacteria was enrichedin seawater fish with a relatively high LDA score (LDA> 3.8), while the phyla Firmicutes and Fusobacteria were
Fig. 2 Overview of the gut microbiome of fish. UPGMA tree was constructed with 227 fish samples. Phylum-level profiling of the gut microbiomecomposition and host taxonomic attributes are presented with representative photos of fish species included in this study. Detailed color indexof host genera was abridged. Fish photos courtesy of the National Institute of Fisheries Science (NIFS), Korea
Kim et al. Microbiome (2021) 9:166 Page 4 of 16
significantly enriched in freshwater fish (Additional file1: Supplementary Fig. S6a). At the family level, Moraxel-laceae, Vibrionaceae, and Enterobacteriaceae (all in theclass Gammaproteobacteria), and Alcaligenaceae (Beta-proteobacteria) were significantly more abundant in
seawater fish than in freshwater fish, whereas Aeromona-daceae (Gammaproteobacteria) was significantly moreabundant in freshwater fish. The family Clostridiaceae(Clostridia) was more abundant in freshwater fish thanin seawater fish, whereas Leuconostocaceae (Bacilli) was
Fig. 3 Fish gut microbiota is determined by the host habitat. a Analysis of the contributions of host environmental or genetic factors to the fishgut microbiota. Variation was determined by between-sample unweighted or weighted UniFrac distances. The size effect and statisticalsignificance were calculated by ANOSIM using the R “vegan” package in the QIIME pipeline. b PCoA of unweighted UniFrac distances for 227 fishsamples (ANOSIM, R = 0.47, p < 0.001) and boxplots illustrating PC1 coordinates of freshwater and seawater fish. The center line shows themedian, the boxes cover the 25th to 75th percentiles, and the whiskers extend to 1.5× the interquartile range c Bar charts of the relativeabundance of bacterial phyla in the gut microbiota of fish from different habitats. d OTU network-based analysis of the microbial communities infish from different habitats. The edges connecting nodes representing fish samples (circles) to species-level OTUs in a particular sample arecolored according to the host habitat type (edge-weighted spring embedded model in Cytoscape v. 3.0.1). FWF freshwater fish, SWF seawater fish
Kim et al. Microbiome (2021) 9:166 Page 5 of 16
more abundant in seawater fish. Furthermore, mostOTUs belonging to Fusobacteriaceae, showing a higherfrequency in freshwater fish than in seawater fish, wereassigned to Cetobacterium at the genus level (Additionalfile 1: Supplementary Fig. S6b and Additional file 2: Sup-plementary Table S1).We then used a network-based approach to test
whether gut microbial communities clustered by fishhabitat at the OTU level. In the analysis, a node repre-sents an individual fish and the OTUs are connected tothe host fish in which they were detected. In agreementwith the compositional differences noted above, in theOTU network-based analysis, the host nodes were morelikely to connect to nodes of other hosts sharing thesame habitat than to those from different habitats (Fig.3d). Based on the OTU network-based analysis, wefound that freshwater fish had a significantly highernumber of connections (i.e., degree) and higher be-tweenness centrality than those of seawater fish, whileseawater fish had higher neighborhood connectivity(Additional file 8: Supplementary Table S7). These re-sults suggested that microbial diversity in freshwater fishis greater than that in seawater fish, analogous to the re-sults based on alpha-diversity estimates.In ecology, the trophic level is the position occupied
by an organism in the food chain. Primary consumers,usually herbivores, occupy lower trophic levels, whilepredatory species (e.g., carnivores) occupy higher levels[27, 28]. Hence, we further investigated the trophic levelof individual fish species to assess the effect of the hostdietary gradient on the microbial community. A PCoAplot considering the trophic level, as determined usingFishBase [13], revealed a distinct microbial gradientbased on the ecological position of fish in the food chain(Additional file 1: Supplementary Fig. S7). These resultssuggested that the host trophic level is weakly but sig-nificantly (ANOSIM, R = 0.14, p < 0.001) associated withthe gut microbial community assemblage.
Host divergence had little influence on the gutmicrobiota of fishWe observed a statistically significant relationship be-tween the gut microbial community structure and thehost genetic variation in the cytochrome c subunit I(CO1) gene, although the degree of distinguishability didnot exceed that for the habitat, as determined by the Rvalue from ANOSIM. The host taxon-dependent vari-ation in the gut microbial community was greater atlower taxonomic levels than at higher taxonomic levels(Fig. 3a). Remarkable variation in both the microbialcommunity composition and structure was observedwith respect to the host order (Additional file 1: Supple-mentary Fig. S8a). Differences in the relative abundancesof several bacterial taxa depended on the host order. For
example, Epsilonproteobacteria was relatively enriched inTetraodontiformes, whereas the relative abundance ofGammaproteobacteria was higher in Lampriformes andOsmeriformes than in other host orders. Firmicutes,mainly represented by the class Clostridia, was relativelymore abundant in Siluriformes, Gadiformes, Cyprini-formes, and Osmeriformes than in other host orders.The phylum Cyanobacteria was enriched in Perciformes,Rajiformes, Clupeiformes, and Lophiiformes, whereasthe phylum Fusobacteria was over-represented in Perci-formes, Tetraodontiformes, Siluriformes, Cypriniformes,and Lophiiformes. Microbial communities showed sig-nificantly greater clustering within the same host orderthan across different host orders (ANOSIM, R = 0.20, p< 0.001) (Additional file 1: Supplementary Fig. S8b).Considering the host species-specificity of the gut
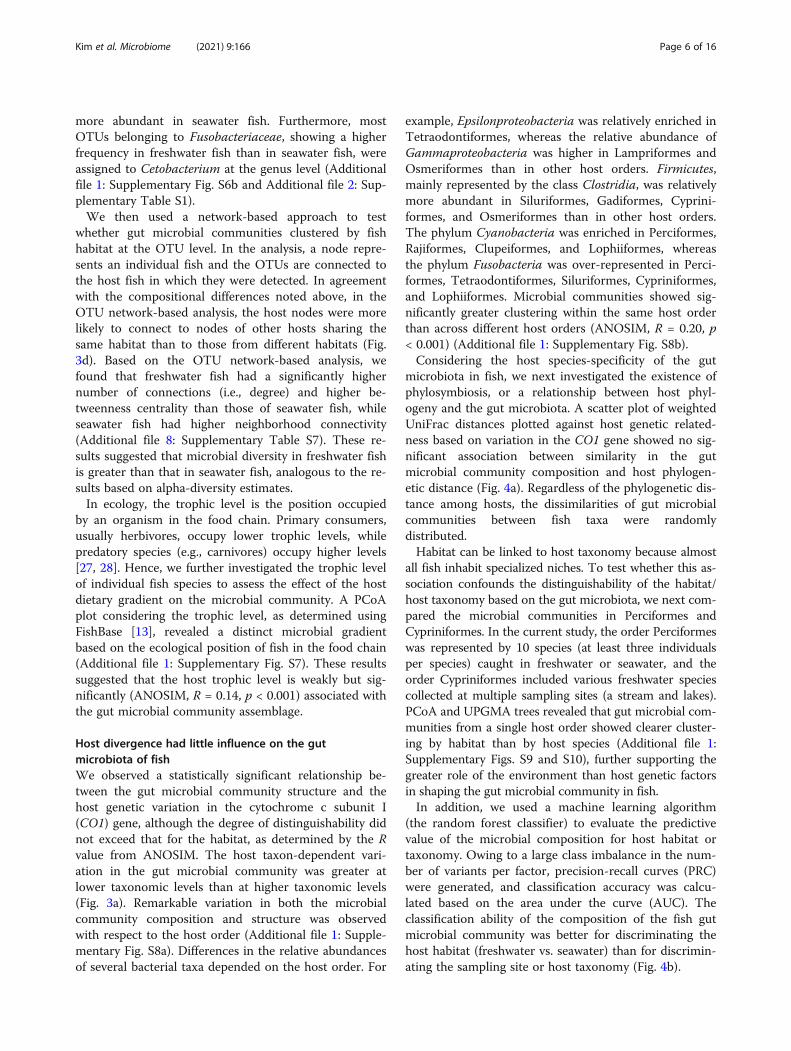
microbiota in fish, we next investigated the existence ofphylosymbiosis, or a relationship between host phyl-ogeny and the gut microbiota. A scatter plot of weightedUniFrac distances plotted against host genetic related-ness based on variation in the CO1 gene showed no sig-nificant association between similarity in the gutmicrobial community composition and host phylogen-etic distance (Fig. 4a). Regardless of the phylogenetic dis-tance among hosts, the dissimilarities of gut microbialcommunities between fish taxa were randomlydistributed.Habitat can be linked to host taxonomy because almost
all fish inhabit specialized niches. To test whether this as-sociation confounds the distinguishability of the habitat/host taxonomy based on the gut microbiota, we next com-pared the microbial communities in Perciformes andCypriniformes. In the current study, the order Perciformeswas represented by 10 species (at least three individualsper species) caught in freshwater or seawater, and theorder Cypriniformes included various freshwater speciescollected at multiple sampling sites (a stream and lakes).PCoA and UPGMA trees revealed that gut microbial com-munities from a single host order showed clearer cluster-ing by habitat than by host species (Additional file 1:Supplementary Figs. S9 and S10), further supporting thegreater role of the environment than host genetic factorsin shaping the gut microbial community in fish.In addition, we used a machine learning algorithm
(the random forest classifier) to evaluate the predictivevalue of the microbial composition for host habitat ortaxonomy. Owing to a large class imbalance in the num-ber of variants per factor, precision-recall curves (PRC)were generated, and classification accuracy was calcu-lated based on the area under the curve (AUC). Theclassification ability of the composition of the fish gutmicrobial community was better for discriminating thehost habitat (freshwater vs. seawater) than for discrimin-ating the sampling site or host taxonomy (Fig. 4b).
Kim et al. Microbiome (2021) 9:166 Page 6 of 16
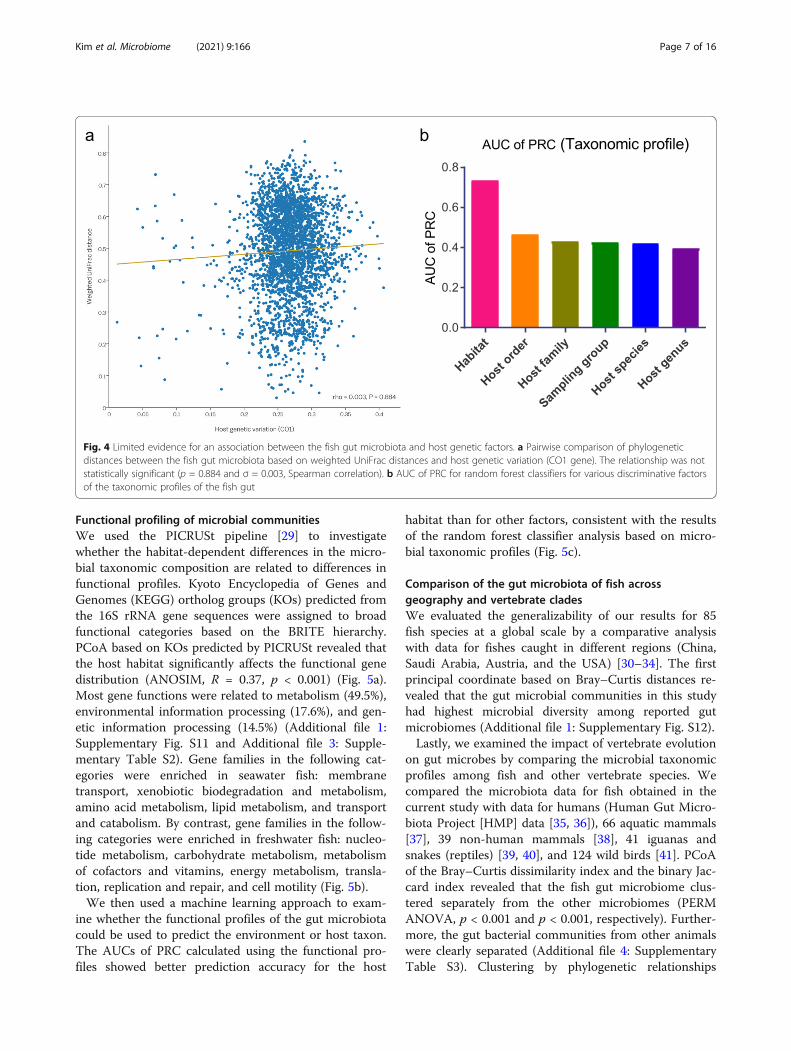
Functional profiling of microbial communitiesWe used the PICRUSt pipeline [29] to investigatewhether the habitat-dependent differences in the micro-bial taxonomic composition are related to differences infunctional profiles. Kyoto Encyclopedia of Genes andGenomes (KEGG) ortholog groups (KOs) predicted fromthe 16S rRNA gene sequences were assigned to broadfunctional categories based on the BRITE hierarchy.PCoA based on KOs predicted by PICRUSt revealed thatthe host habitat significantly affects the functional genedistribution (ANOSIM, R = 0.37, p < 0.001) (Fig. 5a).Most gene functions were related to metabolism (49.5%),environmental information processing (17.6%), and gen-etic information processing (14.5%) (Additional file 1:Supplementary Fig. S11 and Additional file 3: Supple-mentary Table S2). Gene families in the following cat-egories were enriched in seawater fish: membranetransport, xenobiotic biodegradation and metabolism,amino acid metabolism, lipid metabolism, and transportand catabolism. By contrast, gene families in the follow-ing categories were enriched in freshwater fish: nucleo-tide metabolism, carbohydrate metabolism, metabolismof cofactors and vitamins, energy metabolism, transla-tion, replication and repair, and cell motility (Fig. 5b).We then used a machine learning approach to exam-
ine whether the functional profiles of the gut microbiotacould be used to predict the environment or host taxon.The AUCs of PRC calculated using the functional pro-files showed better prediction accuracy for the host
habitat than for other factors, consistent with the resultsof the random forest classifier analysis based on micro-bial taxonomic profiles (Fig. 5c).
Comparison of the gut microbiota of fish acrossgeography and vertebrate cladesWe evaluated the generalizability of our results for 85fish species at a global scale by a comparative analysiswith data for fishes caught in different regions (China,Saudi Arabia, Austria, and the USA) [30–34]. The firstprincipal coordinate based on Bray–Curtis distances re-vealed that the gut microbial communities in this studyhad highest microbial diversity among reported gutmicrobiomes (Additional file 1: Supplementary Fig. S12).Lastly, we examined the impact of vertebrate evolution
on gut microbes by comparing the microbial taxonomicprofiles among fish and other vertebrate species. Wecompared the microbiota data for fish obtained in thecurrent study with data for humans (Human Gut Micro-biota Project [HMP] data [35, 36]), 66 aquatic mammals[37], 39 non-human mammals [38], 41 iguanas andsnakes (reptiles) [39, 40], and 124 wild birds [41]. PCoAof the Bray–Curtis dissimilarity index and the binary Jac-card index revealed that the fish gut microbiome clus-tered separately from the other microbiomes (PERMANOVA, p < 0.001 and p < 0.001, respectively). Further-more, the gut bacterial communities from other animalswere clearly separated (Additional file 4: SupplementaryTable S3). Clustering by phylogenetic relationships
Fig. 4 Limited evidence for an association between the fish gut microbiota and host genetic factors. a Pairwise comparison of phylogeneticdistances between the fish gut microbiota based on weighted UniFrac distances and host genetic variation (CO1 gene). The relationship was notstatistically significant (p = 0.884 and σ = 0.003, Spearman correlation). b AUC of PRC for random forest classifiers for various discriminative factorsof the taxonomic profiles of the fish gut
Kim et al. Microbiome (2021) 9:166 Page 7 of 16
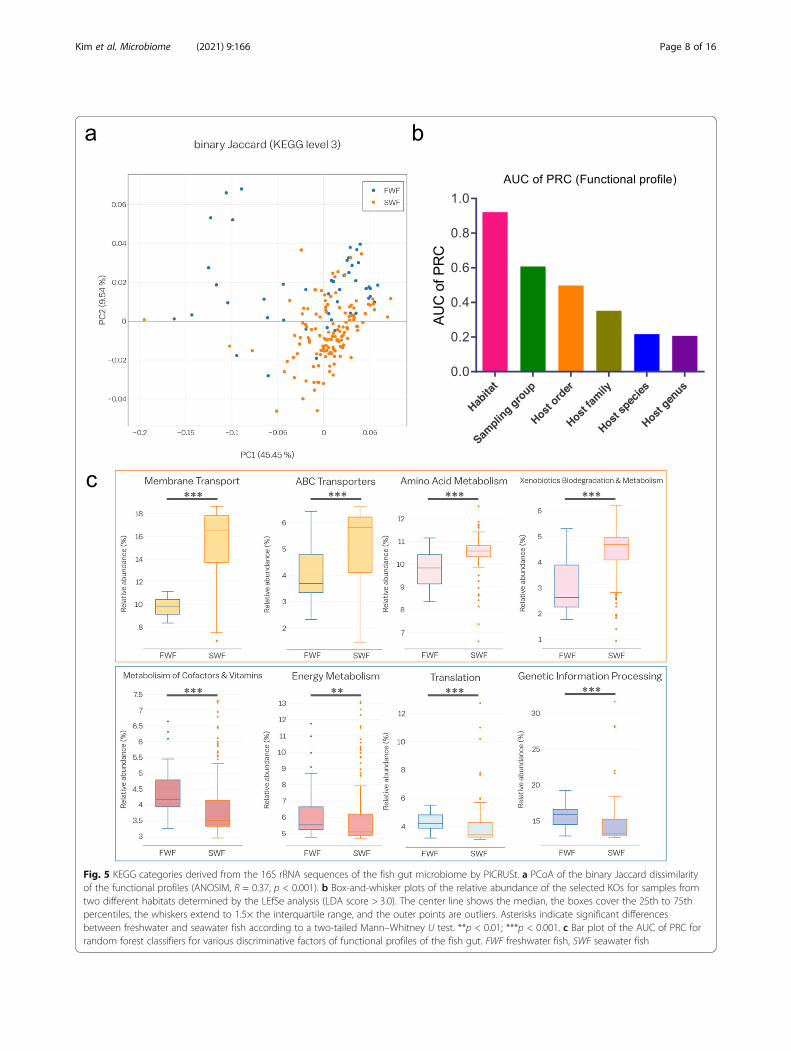
Fig. 5 KEGG categories derived from the 16S rRNA sequences of the fish gut microbiome by PICRUSt. a PCoA of the binary Jaccard dissimilarityof the functional profiles (ANOSIM, R = 0.37, p < 0.001). b Box-and-whisker plots of the relative abundance of the selected KOs for samples fromtwo different habitats determined by the LEfSe analysis (LDA score > 3.0). The center line shows the median, the boxes cover the 25th to 75thpercentiles, the whiskers extend to 1.5× the interquartile range, and the outer points are outliers. Asterisks indicate significant differencesbetween freshwater and seawater fish according to a two-tailed Mann–Whitney U test. **p < 0.01; ***p < 0.001. c Bar plot of the AUC of PRC forrandom forest classifiers for various discriminative factors of functional profiles of the fish gut. FWF freshwater fish, SWF seawater fish
Kim et al. Microbiome (2021) 9:166 Page 8 of 16
among hosts was clearly evident in a PCoA of the binaryJaccard index at the family level (Fig. 6), and significantdifferences were observed (ANOSIM, R = 0.64, p <0.001). As shown in Fig. 6a, the gut microbiome of fishshowed slight overlap with the gut microbiomes ofaquatic mammals (dolphins and sea lions) and snakes,while the avian gut microbiome was distinct from thoseof other vertebrates. When examining the microbialcomposition of each host group, the components of thegut microbiota of each host differed at the microbialphylum level. Proteobacteria was most abundant in fish,Firmicutes was enriched in birds and reptiles, and Bac-teroidetes was enriched in humans (Fig. 6b–d).
DiscussionWe characterized the gut microbial communities of vari-ous wild fish. Few studies have focused on the fish gutmicrobiota, despite the importance of fish in the evolu-tionary history of vertebrates and the tremendous spe-cies diversity, accounting for nearly half of all vertebratespecies [13]. The gut microbiota of vertebrates is host-specific and arose as a result of co-evolution betweenhosts and microbes [42, 43]. Even in invertebrate species(e.g., shrimp or insect species), the gut microbiota is dis-tinguished by the presence of specific commensal bacter-ial consortia [44, 45]. As expected, we found that the gutmicrobiota of wild fish is a host-specific and
Fig. 6 Fish gut microbiota clustered separately from the microbiotas of other vertebrates. a PCoA of the binary Jaccard indices of the gutmicrobiota from fish and various vertebrates (iguanas, snakes, aquatic mammals, birds, terrestrial mammals, and humans; sequences wereobtained from the NCBI SRA and the Qiita server). b–d PCoA plots colored by the relative abundance of the phyla Proteobacteria (b), Firmicutes(c), and Bacteroidetes (d). Color intensity is proportional to the relative abundance (%) of each phylum
Kim et al. Microbiome (2021) 9:166 Page 9 of 16
deterministic microbial assemblage. Furthermore, weshowed that the gut microbiota is primarily determinedby the fish environment, rather than by genetic factors.The gut microbiota of most vertebrates, including am-
phibians, reptiles, mammals, and birds, is dominated bythe phyla Firmicutes and Bacteroidetes [22, 36, 46, 47].Indeed, a bloom of Proteobacteria is considered a sign ofdysbiosis or instability of the gut microbial communityin mammals [48]. Many commensal Proteobacteria canbecome pathobionts, infecting the host under specificconditions and facilitating inflammation [49, 50]. How-ever, in the current study, Proteobacteria dominated thegut microbiota of the majority of fish, in agreement withrecent studies of the gut microbiota of fish [14, 15].These compositional differences at the phylum level canbe explained by a partial projection of the vast diversityof marine Proteobacteria associated with the unseg-mented digestive system of fish, unlike that of mammals[51, 52]. A stochastic assemblage of environmental mi-crobes in the fish gut microbiota is unlikely because thepredominant bacterial taxa in the ocean or other aquatichabitats, such as SAR11 (Pelagibacter ubiqueHTCC1062), SAR116 (Puniceispirillum marinumIMCC1322), and SAR86, were absent or not abundant inthe fish gut (Additional file 5: Supplementary Table S4)[53, 54]. Our results were based on observations of boththe gut digesta and mucosa of collected fish, which areessentially microbial reservoirs including allochthonousand autochthonous microbes, respectively. Nonetheless,predominant environmental microbes were rarely ob-served [55]. These findings prompt the question ofwhether Proteobacteria outcompete other environmentalbacterial taxa in the aquatic habitat or whether they havebeen selected by the host itself [56–58].We found that host habitat was the predominant de-
terminant of the fish gut microbial community. Assess-ments of the discriminative structuring factors of the gutmicrobiota using both unsupervised and supervisedlearning approaches, such as PAM clustering, ANOSIM,and random forest classifier analysis, supported the im-portance of habitat, and this was particularly apparent infish with a similar genetic background (e.g., Perciformesand Cypriniformes). Nevertheless, various other factorsthat were examined, including host taxonomy andtrophic level, contributed to the fish gut microbial com-munity (Fig. 3a). Environmental factors could not ex-plain a large portion of the total variance (Fig. 3b;variation explained by PC1 at 7.43%) in the fish gutmicrobiota. Hence, intrinsic genetic factors are also im-portant, and the species-specificity of the gut microbiotais a result of the intrinsic genetic background of thehost.Differences in the microbial compositional with re-
spect to salinity can be explained in terms of host
adaptation to the environment. The dominant taxamight reflect the affinity of the host for gut bacteria thatcontribute to the maintenance of immune function andmetabolic activity. For example, the high proportion ofFusobacteria in freshwater fish might be associated withvitamin B12 (cobalamin). Cetobacterium somerae (orderFusobacteriales) is widely distributed in various fresh-water fish, and its prevalence is negatively correlatedwith the dietary availability of vitamin B12 [59, 60]. Dif-ferent environmental conditions affect vitamin B12 avail-ability, and freshwater fish harbor more vitamin B12-synthesizing bacteria, such as C. somerae, to satisfy theirdietary needs. The importance of metabolic properties isconsistent with the predicted functions of gut bacteria infreshwater fish, which showed a relatively high abun-dance of genes related to the metabolism of cofactorsand vitamins. This suggests that basic nutrient availabil-ity in the environment drives selection of the fish gutmicrobiota to account for the nutritional deficiencies ofthe host. Based on the performance of classifiers, betterresults are obtained when using functional profiles as atraining trait than when using taxonomic profiles. Envir-onmental factors (e.g., habitat type) result in functionalredundancy, with the host physiology governed by theability to adapt.We also observed high similarity between the gut
microbiota of hosts that share feeding preferences. Theaverage trophic level of seawater fish collected in thecurrent study was higher than that of freshwater fish.Seawater fish show carnivorous and herbivorous dietarypreferences, while freshwater fish tend to show omnivor-ous dietary preferences [28]. In particular, the family En-terobacteriaceae was significantly enriched in seawaterfish, consistent with results for other carnivorous fish[15, 61]. Further, a bloom of marine-associated bacteria,such as Enterobacteriaceae and Moraxellaceae, is corre-lated with a low-fiber or animal-based diet in humans[62, 63]. By contrast, Clostridium and Aeromonadaceaewere predominant in freshwater fish in the current study.Several Clostridium species are well-known cellulose-degraders associated with herbivorous vertebrates [64, 65].Aeromonas is dominant in fish feeding on detritus of plantorigin and in omnivorous freshwater fish (intermediatetrophic level) [15, 66]. Differences in the gut microbiotaare not simply a consequence of the host diet or feedingpreference, as divergence between the gut microbiota offreshwater and seawater fish can also be a cause of thefunctional potential of hosts (Fig. 5).In a comparison between fish and other vertebrates,
including Reptilia, Avia, and Mammalia, we detectedclearly distinct structures of each gut microbiota (Fig. 6).This was observed despite analogous taxon with similarmetabolic or biological roles, i.e., a relatively high pro-portion of Enterobacteriaceae and Moraxellaceae
Kim et al. Microbiome (2021) 9:166 Page 10 of 16
(Proteobacteria) in animal-based diet vertebrates [62, 63]and the dominance of Clostridium species (Firmicutes)in plant-based diet vertebrates [64, 65]. Unlike the gutmicrobial composition of fish, the dominant gut bacteriaof terrestrial mammals and humans belong to the phylaFirmicutes and Bacteroidetes. Firmicutes is the soleprominent microbial phylum in the guts of reptiles andbirds. This difference at the microbial phylum level canbe explained by evolved differences between fish andother vertebrates in the selectivity of the gut environ-ment [15, 67]. Early fish arose 600 million years ago andbecame ancestors of all extant vertebrate clades [12].Since the appearance of early vertebrates, they haveevolved a number of physiological adaptations for sur-vival in various environments. During this process, sym-biotic gut microbes and host species co-evolved tosurvive in the continuously changing environment. It isdifficult to experimentally simulate gut microbial selec-tion and colonization during vertebrate evolution; how-ever, surveys and experiments involving extantvertebrate species can provide insight into the contribu-tion of various environmental and genetic factors to thegut microbiota.Our species-wide study included an unprecedented
number of fishes; however, it had several limitations.Since sample collection focused on East Asia (theKorean peninsula), the taxa are not representative ofthe total species diversity of fish. Although the num-ber of samples in our study was sufficient for cap-turing microbial diversity reported in various fishesfrom other regions (China, Saudi Arabia, Austria,and the USA), our findings may not be representa-tive of all fish species. Further studies including abroader range of species or more detailed metadatafor the surrounding environment (e.g., precise esti-mates of salinity, temperature, or prey composition)are necessary to elucidate the contributions of par-ticular environmental factors to shaping the fish gutmicrobiota. The detailed characterization of eco-logical niches and metabolic differences among fishwill improve our understanding of the fundamentalassemblage of the gut microbial consortium in fish.Furthermore, we analyzed the 16S rRNA gene toevaluate the bacterial composition and predictedfunctional profiles using the PICRUSt pipeline. Theseanalyses indicated that some taxa are linked to spe-cific biological activities of the fish host. Additionalmeta-omics analyses, including shotgun metagenomicsequencing and metaproteomics and metabolomicsapproaches, could yield a more comprehensive data-set for detailed analyses of the determinants of thespecific consortia of gut microbes in fish and expandour understanding of fundamental contributions ofmicrobes to fish biology [68].
ConclusionsIn summary, our results provide a comprehensive viewof the fish gut microbiota. In particular, we found thathost habitat (freshwater vs. seawater) has a dominantrole in shaping wild fish gut microbial communities overhost taxonomy and trophic level. Moreover, the micro-bial functional profiles predicted from 16S rRNA genesequences were predominantly determined by host habi-tat. We further demonstrate that random forest classi-fiers trained on microbial community composition orfunctional features showed better prediction accuracyfor the host habitat than for other factors. In addition,the fish gut microbiome in a PCoA plot clustered separ-ately from those of other vertebrates, such as mammals,reptiles, and birds. Our findings improve our under-standing of the long-term co-evolution of vertebratesand their indigenous microbial communities.
MethodsSample collectionGut samples from 227 seawater and freshwater fish werecollected at 23 sites in Korea between June 2013 andOctober 2013 (Figs. 1a and 2 and Additional files 6 and7: Supplementary Tables S5-6). Seawater fish werecaught by the fisheries resource research vessel Tamgu-20 of the National Institute of Fisheries Science (NIFS),Korea. During a seasonal fisheries resource investigationof the deep sea of East Sea, near the seas of Ulleung-doand Dok-do, and West Sea, 175 seawater fish werecaught by bottom trawling, mid-water (pelagic) trawling,and trammel. Freshwater fish were collected in collabor-ation with the Inland Fisheries Research Institute (NIFS)by using cast net and fish traps. All procedures for thecollection and handling of seawater and freshwater fisheswere approved by the NIFS and performed under thesupervision of authorized and experienced members ofthe NIFS staff. The seawater fish were handled in a la-boratory facility on the fishing vessel and the freshwaterfish were handled at appropriate facilities near the fishingsites. All fish were stunned and dissected immediatelyafter catching. Approximately 1.0–1.5 cm of the rectumwas collected using sterile instruments, and the samples,including the luminal content and mucosa, were stored at− 80 °C until analyses. An accompanying fish taxonomistidentified the fish host species by briefly assessing fishmorphological characteristics during sample collection.The fish host species were re-identified in the laboratoryby a molecular phylogenetic analysis (vide infra).
DNA extraction and pyrosequencing of bacterial 16SrRNA genesThe gut specimens were squeezed out with sterile in-struments to collect the luminal content. The gut sam-ples were cut laterally to remove the mucus layer of the
Kim et al. Microbiome (2021) 9:166 Page 11 of 16
fish gut by visual inspection. A cover glass was used toseparate the mucus layer from the gut samples. The lu-minal content and mucus layer were pooled and trans-ferred to a sterile conical tube containing 6.5 mMdithiothreitol for mucus degradation [69]. After incuba-tion for 1 h at 37 °C, the pellet was collected by centrifu-gation and re-suspended in 750 μl lysis buffer (500 mMNaCl, 50 mM Tris-HCl, pH 8.0, 50 mM EDTA, and 4%sodium dodecyl sulfate). To maximize microbial cell lysisbefore DNA extraction, the re-suspended pellets werehomogenized by shaking in a sterile screw-cap tube con-taining zirconia beads (2.3 and 0.1 mm diameter) andglass beads (0.5 mm diameter) using FastPrep-24 (MPBiomedicals, Santa Ana, CA, USA) for 50 s at 6.0 m/s.Genomic DNA from the homogenized samples was thenextracted by the standard phenol-chloroform extractionmethod using the UltraClean Microbial DNA IsolationKit (MOBIO, London, UK). The hypervariable regionsV1–V3 of the 16S rRNA gene were amplified from theextracted genomic DNA of the sampled fish guts byusing a sample-specific barcoded bacterial primer set[70] and Ex-Taq premix (Takara Bio, Kyoto, Japan). Thepolymerase chain reaction (PCR) conditions were as fol-lows: 94 °C for 10 min; followed by 29 cycles of 94 °Cfor 60 s, 50 °C for 30 s, and 72 °C for 1 min 30 s;followed by a final extension step at 72 °C for 10 min.Four independent PCR products for each sample werepooled and purified using the QIAquick PCR Purifica-tion Kit (QIAGEN, Hilden, Germany). The concentra-tion of purified PCR products was determined using theQuant-it PicoGreen dsDNA Assay Kit (Life Technolo-gies, Carlsbad, CA, USA). The quality and quantity ofDNA were checked using a Bioanalyzer 2100 instrument(Agilent, Santa Clara, CA, USA) and a DNA 1000 LabChip (Agilent). The pooled DNA was then amplified byemulsion PCR before 454 pyrosequencing using a GSFLX Titanium instrument (Roche, Basel, Switzerland) bya certified service provider (Macrogen, Seoul, Korea), ac-cording to the manufacturer’s instructions.
Identification of fish host species and phylogeneticanalysis of fishTo identify the fish host species, genomic DNA was ex-tracted from the fish flesh collected aseptically from eachspecimen. Tissue fragments were suspended in 750 μllysis buffer and homogenized by using FastPrep-24(MPbio) with glass beads (0.5 mm diameter) for 40 s at6.0 m/s. DNA was extracted using a standard phenol-chloroform extraction method. The CO1 gene was amp-lified by using AccuPower PCR Premix (Bioneer, Dae-jeon, Korea) and the CO1 gene primer cocktail set 3[71]. The PCR conditions were as follows: initial de-naturation at 95 °C for 3 min; followed by 30 cycles of94 °C for 30 s, 52 °C for 40 s, and 72 °C for 1 min;
followed by a final extension step at 72 °C for 10 min[71]. The PCR products were sequenced using the Big-Dye Terminator Cycle Sequencing Ready Reaction Kit(Applied Biosystems, Foster City, CA, USA), accordingto the manufacturer’s instructions. The reaction prod-ucts were analyzed using an automated DNA analyzersystem (PRISM 3730XL DNA Analyzer, Applied Biosys-tems). Sequence fragments were assembled using Seq-Man (DNASTAR, Madison, WI, USA). The assembledCO1 gene sequences were then compared with otherCO1 gene sequences in the nucleotide collection (nr/nt)of the GenBank database by searches using the BasicLocal Alignment Search Tool (BLAST) [72]. The CO1gene sequences were aligned using the multiple align-ment program CLUSTAL W (v. 1.4), and a phylogenetictree was generated by using MEGA 6 [73, 74] using themaximum-likelihood algorithm with 1000 bootstrap rep-licates [75].
Sequence analysisThe raw 16S rRNA sequences generated using the GSFLX Titanium platform were processed using QIIME (v.1.8.0) [76]. All raw sequences with average quality scoresbelow 25 and those shorter than 200 bp or longer than1000 bp were removed. The quality-filtered sequenceswere denoised using the QIIME denoising algorithms[77]. The sequences were then clustered into OTUs at a97% sequence similarity threshold using UCLUST [78]in QIIME. The OTUs were generated by searchesagainst the Greengenes reference database from August2013 using a subsampled open-reference method [79].Before further analysis, chimeric sequences were de-tected by comparing with a reference database usingUSEARCH (v. 7.0.1090) [78] and were removed. A rep-resentative sequence for each OTU was picked andaligned with the Greengenes reference database by usingPyNAST [80]. The alignments were used for phylogen-etic tree construction using the FastTree algorithm [81].An even-depth rarefied OTU table matrix (600 se-quences) was constructed to calculate various diversityindices [82]. The Ribosomal Database Project classifieragainst the Greengenes reference database was used at aminimal confidence of 60% [83] for the taxonomic as-signment of representative OTUs. The calculation of α-diversity indices (phylogenetic diversity, observed speciescount, Chao1 richness estimators, and the Shannon andSimpson indices) and β-diversity indices (Bray–Curtisdissimilarity and UniFrac weighted and unweighted met-rics), as well as PCoA, were performed using QIIMEpipelines. The calculated coordination was visualizedusing a web-based visualization tool, Plotly (http://plot.ly). To check for the presence of transient environmentalbacteria in the gut microbiota, the full dataset wasBLAST-searched against SAR11 (GenBank accession no.
Kim et al. Microbiome (2021) 9:166 Page 12 of 16
CP000084), SAR86 (JX530677), and SAR116 (CP001751)sequences. PICRUSt (http://picrust.github.io) [29] wasused to examine the functional profiles of the fish gutmicrobial community based on the 16S rRNA gene com-position. For the PICRUSt analysis, an OTU table wasconstructed by closed-reference OTU picking againstthe May 2013 Greengenes database using QIIME. TheOTU table was converted into the PICRUSt format andnormalized by the 16S rRNA gene copy number to cor-rect for the over- and under-estimation of microbialabundance. The normalized dataset was analyzed usingthe KO dataset [84]. Detailed microbiome analyticalscripts and computational environments are providedonline (Additional file 10: Supplementary Method).
Comparison of the gut microbiota among various animalsGut microbiota data from various organisms were used formeta-analysis. For comparison with previously reported fishmicrobiome studies, we obtained the unprocessed micro-biome sequence data from NCBI Sequence Read Archive(SRA) [30–34] (Additional file 9: Supplementary Table S8).All fish microbiome data were processed by QIIME pipelineand OTUs were clustered against Greengenes DB (ver. gg_13_8) with open-reference OTU picking methods (pick_open_reference_otus.py). Owing to differences in DNA extractionmethods and sequencing platforms among studies, the con-structed OTU table was collapsed to the genus-level and usedfor further analyses. The human gut microbiota dataset wasdownloaded from the NIH HMP (http://hmpdacc.org/) [36].The aquatic mammalian gut microbiota [37] data were ob-tained from the NCBI SRA. The land and marine iguana gutmicrobiota data [39] were downloaded from the Dryad datapackage [85]. Non-human mammalian gut microbiota [38],snake gut microbiota [40], and wild avian gut microbiota [41]data were obtained from the Qiita database (https://qiita.ucsd.edu/), as pre-processed data. Closed-reference OTU pickingmethods (pick_closed_reference_otus.py) were used to clusterthe OTUs against the same reference sequences (gg_13_8)using the QIIME pipeline (v. 1.8.0). After discarding the un-aligned sequences, an even-depth rarefied OTU table was gen-erated and used for subsequent analyses. A non-phylogeneticβ-diversity metric (the binary Jaccard index) was calculatedand visualized by PCoA.
OTU network-based analysisFor an OTU network-based analysis, OTU networkmaps were constructed using QIIME and visualizedusing Cytoscape (v. 3.0.1) [86, 87]. Briefly, the OTU tablegenerated at the 97% sequence similarity threshold wasconverted to the Cytoscape format (make_otu_net-work.py). In the converted OTU network maps, the sam-ples and OTUs were set to represent network nodesconnected by edges, which represented OTU abundancein the samples. The edge-weighted spring embedded
model was derived to arrange network constituents.Topological analysis of OTU network was performedusing Cytoscape and MCODE plug-in toolkit [88].
Statistical analysisAll statistical analyses were performed using GraphPadPrism (v. 5.0; GraphPad, San Diego, CA, USA). The sig-nificance of differences between groups was assessedusing two-tailed Mann–Whitney U tests. To comparethe β-diversity indices among multiple groups, one-wayanalysis of variance was used, followed by Duncan’spost-hoc tests. For multiple comparisons, p values werecorrected by the Benjamini–Hochberg false discoveryrate (FDR) procedure, and FDR < 0.05 was consideredstatistically significant. ANOSIM and PERMANOVAtests with the β-diversity matrix were performed usingthe QIIME pipeline (compare_categories.py). Statisticalsignificance for both tests was determined based on10,000 permutations. Assessment models to identify thediscriminative factors shaping the fish gut microbiotawere constructed using random forest classifiers inWeka v. 3.8.3 open source software (http://www.cs.waikato.ac.nz/~ml/weka/index.html) developed at Wai-kato University, New Zealand [89, 90]. The random for-est classifiers were trained using individually generatedinput tables of the relative OTU abundance and discrim-inative variables with 10-fold cross-validation. To deter-mine the optimal number of clusters for evaluating thecohesiveness of clusters with various metadata, theCalinski–Harabasz index (CH index) and the silhouettescore were calculated for each set of clusters generatedby PAM clustering [26] (https://enterotype.embl.de/enterotypes.html#). The differentially abundant taxo-nomic and functional features were also confirmed usingLEfSe in the Galaxy server (http://huttenhower.sph.harvard.edu/galaxy/) [91, 92]. The significance thresholdof the α parameter for the Kruskal–Wallis test for clas-ses was set to 0.05. The threshold for the logarithmicLDA score for taxonomic features was 3.8, and that forfunctional features was 3.0.
AbbreviationsANOSIM: Analysis of similarities; AUC: Area under the curve; BLAST: BasicLocal Alignment Search Tool; CO1: Cytochrome c oxidase subunit I;FDR: False discovery rate; KEGG: Kyoto Encyclopedia of Genes and Genomes;KO: KEGG orthology; LDA: Linear discriminant analysis; LEfSe: Lineardiscriminant analysis effect size; OTU: Operational taxonomic unit;PCoA: Principal coordinate analysis; PERMANOVA: Permutational multivariateanalysis of variance; PICRUSt: Phylogenetic Investigation of Communities byReconstruction of Unobserved States; PRC: Precision-recall curves
Supplementary InformationThe online version contains supplementary material available at https://doi.org/10.1186/s40168-021-01113-x.
Additional file 1. Supplementary Figures (S1–S12).
Kim et al. Microbiome (2021) 9:166 Page 13 of 16
Additional file 2. Supplementary Table S1.
Additional file 3. Supplementary Table S2.
Additional file 4. Supplementary Table S3.
Additional file 5. Supplementary Table S4.
Additional file 6. Supplementary Table S5.
Additional file 7. Supplementary Table S6.
Additional file 8. Supplementary Table S7.
Additional file 9. Supplementary Table S8.
Additional file 10. Supplementary Method.
AcknowledgmentsWe would like to thank Dr. Hae Won Lee, Dr. Jae Hyeong Yang, and Dr. MiYoung Song at the National Institute of Fisheries Science (NIFS) for theiroutstanding assistance in collecting fish specimens, as well as the captainand crew members of the fisheries resource research vessel Tamgu-20 of theNIFS for their assistance during expeditions.
Authors’ contributionsPSK, J-BL, and J-WB planned and designed the research and experiments.PSK, J-BL, D-WH, and JYK undertook the field work and processing of sam-ples. PSK, N-RS, M-SK, TWW, D-WH, J-HY, M-JJ, JYK, and J-WB performed theexperiments and analyzed the data. PSK, N-RS, and J-WB wrote the paper. Allauthors read and approved the final manuscript.
FundingThis work was supported by a grant from the National Institute of BiologicalResources (NIBR), funded by the Ministry of Environment (MOE) of theRepublic of Korea (NIBR202002108 to J-WB); a grant from the Mid-Career Re-searcher Program (NRF-2020R1A2C3012797 to J-WB) and through the Na-tional Research Foundation of Korea (NRF); National Research Foundation ofKorea (NRF) grants funded by the Korean government (MSIT) (grant numberNRF-2018R1A5A1025077 to J-WB) and (NRF-2015034891 to PSK/Global Ph.D.Fellowship Program) ; a grant from the KRIBB Research Initiative Program(KGM5232113 to N-RS); and a grant from the National Institute of FisheriesScience (R2017027 to J-BL).
Availability of data and materialsThe obtained 16S rRNA gene sequences for the fish gut microbiota and theCO1 gene sequences for collected fish were submitted to the EuropeanNucleotide Archive (ENA) of EMBL-EBI and NCBI GenBank databases underthe accession numbers PRJEB31232 (16S rRNA gene sequences) andMK560532-MK560758 (CO1 gene sequences), respectively.
Declarations
Ethics approvalAll experiments were approved by the Institutional Animal Care and UseCommittee of Kyung Hee University and performed in accordance with theprotocol KHUASP(SE)-15-087.
Consent for publicationNot applicable.
Competing interestsThe authors declare that they have no competing interests.
Author details1Department of Biology and Department of Life and NanopharmaceuticalSciences, Kyung Hee University, Dongdaemun-gu, Seoul 02447, Republic ofKorea. 2Biological Resource Center, Korea Research Institute of Bioscienceand Biotechnology, Jeongeup, Jeollabuk-do 56212, Republic of Korea.3Distant-water Fisheries Resources Division, National Institute of FisheriesScience, Gijang-eup, Busan 46083, Republic of Korea.
Received: 15 March 2021 Accepted: 14 June 2021
References1. Butterfield NJ, Knoll AH, Swett K. A bangiophyte red alga from the
Proterozoic of arctic Canada. Science. 1990;250(4977):104–7. https://doi.org/10.1126/science.11538072.
2. Van Valen L. A new evolutionary law. Evol Theor. 1973;1:1–30.3. Hentschel U, Steinert M, Hacker J. Common molecular mechanisms of
symbiosis and pathogenesis. Trends Microbiol. 2000;8(5):226–31. https://doi.org/10.1016/S0966-842X(00)01758-3.
4. Bäckhed F, Ding H, Wang T, Hooper LV, Koh GY, Nagy A, et al. The gutmicrobiota as an environmental factor that regulates fat storage. Proc NatlAcad Sci U S A. 2004;101(44):15718–23. https://doi.org/10.1073/pnas.0407076101.
5. Bäckhed F, Ley RE, Sonnenburg JL, Peterson DA, Gordon JI. Host-bacterialmutualism in the human intestine. Science. 2005;307(5717):1915–20. https://doi.org/10.1126/science.1104816.
6. Robosky LC, Wells DF, Egnash LA, Manning ML, Reily MD, Robertson DGJTS.Metabonomic identification of two distinct phenotypes in Sprague-Dawley(Crl: CD (SD)) rats. Toxicol Sci. 2005;87(1):277–84. https://doi.org/10.1093/toxsci/kfi214.
7. Turnbaugh PJ, Ley RE, Mahowald MA, Magrini V, Mardis ER, Gordon JI. Anobesity-associated gut microbiome with increased capacity for energyharvest. Nature. 2006;444(7122):1027–131. https://doi.org/10.1038/nature05414.
8. Stecher B, Robbiani R, Walker AW, Westendorf AM, Barthel M, Kremer M,et al. Salmonella enterica serovar typhimurium exploits inflammation tocompete with the intestinal microbiota. PLoS Biol. 2007;5(10):e244.
9. Round JL, Mazmanian SK. The gut microbiota shapes intestinal immuneresponses during health and disease. Nat Rev Immunol. 2009;9(5):313–23.https://doi.org/10.1038/nri2515.
10. Hoffmann C, Hill DA, Minkah N, Kirn T, Troy A, Artis D, et al. Community-wide response of the gut microbiota to enteropathogenic Citrobacterrodentium infection revealed by deep sequencing. Infect Immun. 2009;77(10):4668–78. https://doi.org/10.1128/IAI.00493-09.
11. Colston TJ, Jackson CR. Microbiome evolution along divergent branches ofthe vertebrate tree of life: what is known and unknown. Mol Ecol. 2016;25(16):3776–800. https://doi.org/10.1111/mec.13730.
12. Nelson JS. Fishes of the World: John Wiley & Sons; 2006.13. Froese R, Pauly D. FishBase: Species list: World Wide Web electronic
publication; 2019.14. Roeselers G, Mittge EK, Stephens WZ, Parichy DM, Cavanaugh CM, Guillemin
K, et al. Evidence for a core gut microbiota in the zebrafish. ISME J. 2011;5(10):1595–608. https://doi.org/10.1038/ismej.2011.38.
15. Sullam KE, Essinger SD, Lozupone CA, O’CONNOR MP, Rosen GL, Knight R,et al. Environmental and ecological factors that shape the gut bacterialcommunities of fish: a meta-analysis. Mol Ecol. 2012;21(13):3363–78. https://doi.org/10.1111/j.1365-294X.2012.05552.x.
16. Navarrete P, Magne F, Mardones P, Riveros M, Opazo R, Suau A, et al.Molecular analysis of intestinal microbiota of rainbow trout (Oncorhynchusmykiss). FEMS Microbiol Ecol. 2010;71(1):148–56. https://doi.org/10.1111/j.1574-6941.2009.00769.x.
17. Ye L, Amberg J, Chapman D, Gaikowski M, Liu W-T. Fish gut microbiotaanalysis differentiates physiology and behavior of invasive Asian carp andindigenous American fish. ISME J. 2013.
18. Hovda MB, Lunestad BT, Fontanillas R, Rosnes JT. Molecular characterisationof the intestinal microbiota of farmed Atlantic salmon (Salmo salar L.).Aquaculture. 2007;272(1):581–8. https://doi.org/10.1016/j.aquaculture.2007.08.045.
19. Geraylou Z, Souffreau C, Rurangwa E, D'Hondt S, Callewaert L, Courtin CM,et al. Effects of arabinoxylan-oligosaccharides (AXOS) on juvenile Siberiansturgeon (Acipenser baerii) performance, immune responses andgastrointestinal microbial community. Fish Shellfish Immunol. 2012;33(4):718–24. https://doi.org/10.1016/j.fsi.2012.06.010.
20. Wilson B, Danilowicz BS, Meijer WG. The diversity of bacterial communitiesassociated with Atlantic cod Gadus morhua. Microb Ecol. 2008;55(3):425–34.https://doi.org/10.1007/s00248-007-9288-0.
21. Ley RE, Lozupone CA, Hamady M, Knight R, Gordon JI. Worlds withinworlds: evolution of the vertebrate gut microbiota. Nat Rev Microbiol. 2008;6(10):776–88. https://doi.org/10.1038/nrmicro1978.
Kim et al. Microbiome (2021) 9:166 Page 14 of 16
22. Waite DW, Taylor MW. Characterizing the avian gut microbiota:membership, driving influences, and potential function. Front Microbiol.2014;5:223.
23. Nishida AH, Ochman H. Rates of gut microbiome divergence in mammals.Mol Ecol. 2018;27(8):1884–97. https://doi.org/10.1111/mec.14473.
24. Benson AK, Kelly SA, Legge R, Ma F, Low SJ, Kim J, et al. Individuality in gutmicrobiota composition is a complex polygenic trait shaped by multipleenvironmental and host genetic factors. Proc Natl Acad Sci U S A. 2010;107(44):18933–8. https://doi.org/10.1073/pnas.1007028107.
25. Campbell JH, Foster CM, Vishnivetskaya T, Campbell AG, Yang ZK, WymoreA, et al. Host genetic and environmental effects on mouse intestinalmicrobiota. ISME J. 2012;6(11):2033–44. https://doi.org/10.1038/ismej.2012.54.
26. Arumugam M, Raes J, Pelletier E, Le Paslier D, Yamada T, Mende DR, et al.Enterotypes of the human gut microbiome. Nature. 2011;473(7346):174.
27. Lindeman RL. The trophic-dynamic aspect of ecology. Ecology. 1942;23(4):399–417. https://doi.org/10.2307/1930126.
28. Stergiou KI, Karpouzi VS. Feeding habits and trophic levels of Mediterraneanfish. Rev Fish Biol Fish. 2002;11(3):217–54.
29. Langille MG, Zaneveld J, Caporaso JG, McDonald D, Knights D, Reyes JA,et al. Predictive functional profiling of microbial communities using 16SrRNA marker gene sequences. Nat Biotechnol. 2013;31(9):814–21. https://doi.org/10.1038/nbt.2676.
30. Youngblut ND, Reischer GH, Walters W, Schuster N, Walzer C, Stalder G,et al. Host diet and evolutionary history explain different aspects of gutmicrobiome diversity among vertebrate clades. Nat Commun. 2019;10(1):1–15.
31. Song SJ, Sanders JG, Delsuc F, Metcalf J, Amato K, Taylor MW, et al.Comparative analyses of vertebrate gut microbiomes reveal convergencebetween birds and bats. MBio. 2020;11(1).
32. Miyake S, Ngugi DK, Stingl U. Diet strongly influences the gut microbiota ofsurgeonfishes. Mol Ecol. 2015;24(3):656–72. https://doi.org/10.1111/mec.13050.
33. Sherrill-Mix S, McCormick K, Lauder A, Bailey A, Zimmerman L, Li Y, et al.Allometry and ecology of the bilaterian gut microbiome. Mbio. 2018;9(2).
34. Li T, Long M, Li H, Gatesoupe F-J, Zhang X, Zhang Q, et al. Multi-omicsanalysis reveals a correlation between the host phylogeny, gut microbiotaand metabolite profiles in cyprinid fishes. Front Microbiol. 2017;8:454.
35. Methé BA, Nelson KE, Pop M, Creasy HH, Giglio MG, Huttenhower C, et al. Aframework for human microbiome research. Nature. 2012;486(7402):215.
36. Huttenhower C, Gevers D, Knight R, Abubucker S, Badger JH, Chinwalla AT,et al. Structure, function and diversity of the healthy human microbiome.Nature. 2012;486(7402):207.
37. Bik EM, Costello EK, Switzer AD, Callahan BJ, Holmes SP, Wells RS, et al.Marine mammals harbor unique microbiotas shaped by and yet distinctfrom the sea. Nat Commun. 2016;7(1):10516. https://doi.org/10.1038/ncomms10516.
38. Muegge BD, Kuczynski J, Knights D, Clemente JC, González A, Fontana L,et al. Diet drives convergence in gut microbiome functions acrossmammalian phylogeny and within humans. Science. 2011;332(6032):970–4.https://doi.org/10.1126/science.1198719.
39. Lankau EW, Hong PY, Mackie RI. Ecological drift and local exposures driveenteric bacterial community differences within species of Galapagos iguanas.Mol Ecol. 2012;21(7):1779–88. https://doi.org/10.1111/j.1365-294X.2012.05502.x.
40. Costello EK, Gordon JI, Secor SM, Knight R. Postprandial remodeling of thegut microbiota in Burmese pythons. ISME J. 2010;4(11):1375–85. https://doi.org/10.1038/ismej.2010.71.
41. Peralta-Sánchez JM, Martín-Platero AM, Wegener-Parfrey L, Martínez-BuenoM, Rodríguez-Ruano S, Navas-Molina JA, et al. Bacterial density rather thandiversity correlates with hatching success across different avian species.FEMS Microbiol Ecol. 2018;94(3):fiy022.
42. Ley RE, Hamady M, Lozupone C, Turnbaugh PJ, Ramey RR, Bircher JS, et al.Evolution of mammals and their gut microbes. Science. 2008;320(5883):1647–51. https://doi.org/10.1126/science.1155725.
43. Vital M, Gao J, Rizzo M, Harrison T, Tiedje JM. Diet is a major factorgoverning the fecal butyrate-producing community structure acrossMammalia, Aves and Reptilia. ISME J. 2015;9(4):832–43. https://doi.org/10.1038/ismej.2014.179.
44. Yun J-H, Roh SW, Whon TW, Jung M-J, Kim M-S, Park D-S, et al. Insect gutbacterial diversity determined by environmental habitat, diet,developmental stage, and phylogeny of host. Appl Environ Microbiol. 2014;80(17):5254–64. https://doi.org/10.1128/AEM.01226-14.
45. Rungrassamee W, Klanchui A, Maibunkaew S, Chaiyapechara S,Jiravanichpaisal P, Karoonuthaisiri N. Characterization of intestinal bacteria inwild and domesticated adult black tiger shrimp (Penaeus monodon). PLoSOne. 2014;9(3):e91853. https://doi.org/10.1371/journal.pone.0091853.
46. Hong P-Y, Wheeler E, Cann IK, Mackie RI. Phylogenetic analysis of the fecalmicrobial community in herbivorous land and marine iguanas of theGalápagos Islands using 16S rRNA-based pyrosequencing. ISME J. 2011;5(9):1461–70. https://doi.org/10.1038/ismej.2011.33.
47. Colombo BM, Scalvenzi T, Benlamara S, Pollet N. Microbiota and mucosalimmunity in amphibians. Front Immunol. 2015;6:111.
48. Shin N-R, Whon TW, Bae J-W. Proteobacteria: microbial signature ofdysbiosis in gut microbiota. Trends Biotechnol. 2015;33(9):496–503. https://doi.org/10.1016/j.tibtech.2015.06.011.
49. Morgan XC, Tickle TL, Sokol H, Gevers D, Devaney KL, Ward DV, et al. Dysfunction ofthe intestinal microbiome in inflammatory bowel disease and treatment. GenomeBiol. 2012;13(9):R79. https://doi.org/10.1186/gb-2012-13-9-r79.
50. Walujkar SA, Dhotre DP, Marathe NP, Lawate PS, Bharadwaj RS, Shouche YS.Characterization of bacterial community shift in human Ulcerative Colitispatients revealed by Illumina based 16S rRNA gene amplicon sequencing.Gut Pathog. 2014;6(1):22. https://doi.org/10.1186/1757-4749-6-22.
51. Guillaume J, Kaushik S, Bergot P, Metailler R. Nutrition and feeding of fishand crustaceans: Springer Science & Business Media; 2001.
52. Sunagawa S, Coelho LP, Chaffron S, Kultima JR, Labadie K, Salazar G, et al.Structure and function of the global ocean microbiome. Science. 2015;348(6237):1261359. https://doi.org/10.1126/science.1261359.
53. Morris RM, Rappé MS, Connon SA, Vergin KL, Siebold WA, Carlson CA, et al.SAR11 clade dominates ocean surface bacterioplankton communities.Nature. 2002;420(6917):806–10. https://doi.org/10.1038/nature01240.
54. Dupont CL, Rusch DB, Yooseph S, Lombardo M-J, Richter RA, Valas R, et al.Genomic insights to SAR86, an abundant and uncultivated marine bacteriallineage. ISME J. 2012;6(6):1186–99. https://doi.org/10.1038/ismej.2011.189.
55. Talwar C, Nagar S, Lal R, Negi RK. Fish gut microbiome: current approachesand future perspectives. Indian J Microbiol. 2018;58(4):397–414. https://doi.org/10.1007/s12088-018-0760-y.
56. Hosokawa T, Kikuchi Y, Nikoh N, Shimada M, Fukatsu T. Strict host-symbiontcospeciation and reductive genome evolution in insect gut bacteria. PLoSBiol. 2006;4(10):e337. https://doi.org/10.1371/journal.pbio.0040337.
57. Rousk J, Bååth E, Brookes PC, Lauber CL, Lozupone C, Caporaso JG, et al. Soilbacterial and fungal communities across a pH gradient in an arable soil.ISME J. 2010;4(10):1340–51. https://doi.org/10.1038/ismej.2010.58.
58. Nicholson JK, Holmes E, Kinross J, Burcelin R, Gibson G, Jia W, et al. Host-gutmicrobiota metabolic interactions. Science. 2012;336(6086):1262–7. https://doi.org/10.1126/science.1223813.
59. Sugita H, Miyajima C, Deguchi Y. The vitamin B12-producing ability of theintestinal microflora of freshwater fish. Aquaculture. 1991;92:267–76. https://doi.org/10.1016/0044-8486(91)90028-6.
60. Tsuchiya C, Sakata T, Sugita H. Novel ecological niche of Cetobacteriumsomerae, an anaerobic bacterium in the intestinal tracts of freshwater fish.Lett Appl Microbiol. 2008;46(1):43–8.
61. Baldo L, Pretus JL, Riera JL, Musilova Z, Nyom ARB, Salzburger W.Convergence of gut microbiotas in the adaptive radiations of African cichlidfishes. ISME J. 2017;11(9):1975–87. https://doi.org/10.1038/ismej.2017.62.
62. De Filippo C, Cavalieri D, Di Paola M, Ramazzotti M, Poullet JB, Massart S,et al. Impact of diet in shaping gut microbiota revealed by a comparativestudy in children from Europe and rural Africa. Proc Natl Acad Sci U S A.2010;107(33):14691–6. https://doi.org/10.1073/pnas.1005963107.
63. David LA, Maurice CF, Carmody RN, Gootenberg DB, Button JE, Wolfe BE,et al. Diet rapidly and reproducibly alters the human gut microbiome.Nature. 2014;505(7484):559–63. https://doi.org/10.1038/nature12820.
64. Xue Z, Zhang W, Wang L, Hou R, Zhang M, Fei L, et al. The bamboo-eatinggiant panda harbors a carnivore-like gut microbiota, with excessive seasonalvariations. MBio. 2015;6(3):e00022. https://doi.org/10.1128/mBio.00022-15.
65. Liu H, Guo X, Gooneratne R, Lai R, Zeng C, Zhan F, et al. The gutmicrobiome and degradation enzyme activity of wild freshwater fishesinfluenced by their trophic levels. Sci Rep. 2016;6(1):24340. https://doi.org/10.1038/srep24340.
66. Nayak SK. Role of gastrointestinal microbiota in fish. Aquac Res. 2010;41(11):1553–73. https://doi.org/10.1111/j.1365-2109.2010.02546.x.
67. Rawls JF, Mahowald MA, Ley RE, Gordon JI. Reciprocal gut microbiotatransplants from zebrafish and mice to germ-free recipients reveal host habitatselection. Cell. 2006;127(2):423–33. https://doi.org/10.1016/j.cell.2006.08.043.
Kim et al. Microbiome (2021) 9:166 Page 15 of 16
68. Ghanbari M, Kneifel W, Domig KJ. A new view of the fish gut microbiome:advances from next-generation sequencing. Aquaculture. 2015;448:464–75.https://doi.org/10.1016/j.aquaculture.2015.06.033.
69. Lim YW, Evangelista JS, Schmieder R, Bailey B, Haynes M, Furlan M, et al.Clinical insights from metagenomic analysis of sputum samples frompatients with cystic fibrosis. J Clin Microbiol. 2014;52(2):425–37. https://doi.org/10.1128/JCM.02204-13.
70. Shin N-R, Lee J-C, Lee H-Y, Kim M-S, Whon TW, Lee M-S, et al. An increase inthe Akkermansia spp. population induced by metformin treatment improvesglucose homeostasis in diet-induced obese mice. Gut. 2014;63(5):727–35.https://doi.org/10.1136/gutjnl-2012-303839.
71. Ivanova NV, Zemlak TS, Hanner RH, Hebert PD. Universal primer cocktails forfish DNA barcoding. Mol Ecol Notes. 2007;7(4):544–8. https://doi.org/10.1111/j.1471-8286.2007.01748.x.
72. Johnson M, Zaretskaya I, Raytselis Y, Merezhuk Y, McGinnis S, Madden TL.NCBI BLAST: a better web interface. Nucleic Acids Res. 2008;36(suppl 2):W5–9. https://doi.org/10.1093/nar/gkn201.
73. Tamura K, Stecher G, Peterson D, Filipski A, Kumar S. MEGA6: molecularevolutionary genetics analysis version 6.0. Mol Biol Evol. 2013;30(12):2725–9.https://doi.org/10.1093/molbev/mst197.
74. Thompson JD, Higgins DG, Gibson TJ. CLUSTAL W: improving the sensitivityof progressive multiple sequence alignment through sequence weighting,position-specific gap penalties and weight matrix choice. Nucleic Acids Res.1994;22(22):4673–80. https://doi.org/10.1093/nar/22.22.4673.
75. Felsenstein J. Evolutionary trees from DNA sequences: a maximumlikelihood approach. J Mol Evol. 1981;17(6):368–76. https://doi.org/10.1007/BF01734359.
76. Caporaso JG, Kuczynski J, Stombaugh J, Bittinger K, Bushman FD, CostelloEK, et al. QIIME allows analysis of high-throughput community sequencingdata. Nat Methods. 2010;7(5):335–6. https://doi.org/10.1038/nmeth.f.303.
77. Reeder J, Knight R. Rapidly denoising pyrosequencing amplicon reads byexploiting rank-abundance distributions. Nat Methods. 2010;7(9):668–9.https://doi.org/10.1038/nmeth0910-668b.
78. Edgar RC. Search and clustering orders of magnitude faster than BLAST.Bioinformatics. 2010;26(19):2460–1. https://doi.org/10.1093/bioinformatics/btq461.
79. Rideout JR, He Y, Navas-Molina JA, Walters WA, Ursell LK, Gibbons SM, et al.Subsampled open-reference clustering creates consistent, comprehensiveOTU definitions and scales to billions of sequences. PeerJ. 2014;2:e545.https://doi.org/10.7717/peerj.545.
80. Caporaso JG, Bittinger K, Bushman FD, DeSantis TZ, Andersen GL, Knight R.PyNAST: a flexible tool for aligning sequences to a template alignment.Bioinformatics. 2010;26(2):266–7. https://doi.org/10.1093/bioinformatics/btp636.
81. Price MN, Dehal PS, Arkin AP. FastTree: computing large minimum evolutiontrees with profiles instead of a distance matrix. Mol Biol Evol. 2009;26(7):1641–50. https://doi.org/10.1093/molbev/msp077.
82. McDonald D, Clemente JC, Kuczynski J, Rideout JR, Stombaugh J, Wendel D,et al. The biological observation matrix (BIOM) format or: how I learned tostop worrying and love the ome-ome. GigaScience. 2012;1(1):7. https://doi.org/10.1186/2047-217X-1-7.
83. DeSantis TZ, Hugenholtz P, Larsen N, Rojas M, Brodie EL, Keller K, et al.Greengenes, a chimera-checked 16S rRNA gene database and workbenchcompatible with ARB. Appl Environ Microbiol. 2006;72(7):5069–72. https://doi.org/10.1128/AEM.03006-05.
84. Kanehisa M, Goto S. KEGG: kyoto encyclopedia of genes and genomes.Nucleic Acids Res. 2000;28(1):27–30. https://doi.org/10.1093/nar/28.1.27.
85. Wheeler EL, Hong P, Mackie RI. Data from: ecological drift and localexposures drive gastrointestinal bacterial community differences amongGalápagos iguana populations. In: Dryad Data Repository; 2012.
86. Shannon P, Markiel A, Ozier O, Baliga NS, Wang JT, Ramage D, et al.Cytoscape: a software environment for integrated models of biomolecularinteraction networks. Genome Res. 2003;13(11):2498–504. https://doi.org/10.1101/gr.1239303.
87. Navas-Molina JA, Peralta-Sánchez JM, González A, McMurdie PJ, Vázquez-Baeza Y, Xu Z, et al. Advancing our understanding of the humanmicrobiome using QIIME. Methods Enzymol. 2013;531:371–444. https://doi.org/10.1016/B978-0-12-407863-5.00019-8.
88. Bader GD, Hogue CW. An automated method for finding molecularcomplexes in large protein interaction networks. BMC Bioinform. 2003;4(1):1–27.
89. Breiman L. Random forests. Mach Learn. 2001;45(1):5–32. https://doi.org/10.1023/A:1010933404324.
90. Hall M, Frank E, Holmes G, Pfahringer B, Reutemann P, Witten IH. The WEKAdata mining software: an update. ACM SIGKDD Explor Newslett. 2009;11(1):10–8. https://doi.org/10.1145/1656274.1656278.
91. Segata N, Izard J, Waldron L, Gevers D, Miropolsky L, Garrett WS, et al.Metagenomic biomarker discovery and explanation. Genome Biol. 2011;12(6):R60. https://doi.org/10.1186/gb-2011-12-6-r60.
92. Goecks J, Nekrutenko A, Taylor J. Galaxy: a comprehensive approach forsupporting accessible, reproducible, and transparent computationalresearch in the life sciences. Genome Biol. 2010;11(8):R86. https://doi.org/10.1186/gb-2010-11-8-r86.
Publisher’s NoteSpringer Nature remains neutral with regard to jurisdictional claims inpublished maps and institutional affiliations.
Kim et al. Microbiome (2021) 9:166 Page 16 of 16