Embed Size (px)
Citation preview
Page 1/28
Host Habitat Is the Major Determinant of the GutMicrobiome of FishPil Soo Kim
Kyung Hee UniversityNa-Ri Shin
Korea Research Institute of Bioscience and BiotechnologyJae-Bong Lee
National Institute of Fisheries ScienceMin-Soo Kim
Kyung Hee UniversityTae Woong Whon
Kyung Hee UniversityDong-Wook Hyun
Kyung Hee UniversityJi-Hyun Yun
Kyung Hee UniversityMi-Ja Jung
Kyung Hee UniversityJoon Yong Kim
Kyung Hee UniversityJin-Woo Bae ( [email protected] )
Kyung Hee University https://orcid.org/0000-0001-6433-5270
Research Article
Keywords: Fish, Fish gut microbiota, Freshwater �sh, Seawater �sh, Vertebrate gut microbiota
Posted Date: March 22nd, 2021
DOI: https://doi.org/10.21203/rs.3.rs-332643/v1
License: This work is licensed under a Creative Commons Attribution 4.0 International License. Read Full License

Page 2/28
Version of Record: A version of this preprint was published at Microbiome on July 31st, 2021. See thepublished version at https://doi.org/10.1186/s40168-021-01113-x.

Page 3/28
AbstractBackground: Our understanding of the gut microbiota of animals is largely based on studies ofmammals. To better understand the evolutionary basis of symbiotic relationships between animal hostsand indigenous microbes, it is necessary to investigate the gut microbiota of non-mammalian vertebratespecies. In particular, �sh have the highest species diversity among groups of vertebrates, withapproximately 33,000 species. In this study, we comprehensively characterized gut bacterial communitiesin �sh.
Results: We analyzed 227 individual �sh representing 14 orders, 42 families, 79 genera, and 85 species.The �sh gut microbiota was dominated by Proteobacteria (51.7%) and Firmicutes (13.5%), different fromthe dominant taxa reported in terrestrial vertebrates (Firmicutes and Bacteroidetes). The gut microbialcommunity in �sh was more strongly shaped by host habitat than by host taxonomy or trophic level.Using a machine learning approach trained on the microbial community composition or predictedfunctional pro�les, we found that the host habitat exhibited the highest classi�cation accuracy. Principalcoordinate analysis revealed that the gut bacterial community of �sh differs signi�cantly from those ofother vertebrate classes (reptiles, birds, and mammals).
Conclusions: Collectively, these data provide a reference for future studies of the gut microbiome ofaquatic animals as well as insights into the relationship between �sh and their gut bacteria, including thekey role of host habitat and the distinct compositions in comparison with those of mammals, reptiles,and birds.
BackgroundMulticellular eukaryotes appeared 1.2 billion years ago, followed by a long evolutionary history of mutualinteractions between multicellular and single-celled organisms [1]. According to Van Valen’s “Red Queenhypothesis,” evolution is driven by competition among taxa for survival under constantly changingenvironments [2]. Indeed, co-existence with microbes poses one of the greatest challenges for animals. Atthe same time, hosts and microbes can establish symbiotic relationships, in which each species bene�tsfrom mutualistic interactions [3]. The symbiotic microbiota contributes to animal adaptation to varioushabitats by providing complementary functional resources (e.g., by digesting indigestible dietary �ber,producing essential vitamins, protecting against enteropathogens, maintaining immune homeostasis,and contributing to intestinal maturation) over a long period of co-evolution [4–10].
In the last decade, numerous studies have explored gut microbial communities of various animal hosts.However, these studies have mostly focused on the gut microbiota of mammals [11], which represent lessthan 10% of all vertebrate diversity. By contrast, there are more than 33,000 species of �sh, representingthe greatest species diversity among groups of vertebrates [12, 13]. This focus on a single class ofanimals allows only limited insight into the vertebrate gut microbiota. To understand the co-evolution ofvertebrates and gut microbes, broad analyses of �sh are essential. The gut microbiota has been

Page 4/28
evaluated in a few model �sh species, such as zebra�sh [14], guppy [15], and rainbow trout [16], and ineconomically valuable aquatic animals, such as carp [17], Atlantic salmon [18], sturgeon [19], and Atlanticcod [20]. However, these studies are insu�cient to comprehensively understand the composition of thegut microbiota in �sh and patterns of co-evolution.
Here, we aimed to resolve long-standing questions about the gut microbiota in �sh. For example, is thegut microbiota in �sh shaped by the host habitat? Do genetic factors in �sh affect the structure of the gutmicrobiota and, if so, to what extent? How does the gut microbiota of �sh differ from those of othervertebrates? To resolve these issues, we comprehensively characterized the gut microbiota of 227individual �sh representing 85 species obtained from lakes, a stream, and seas (i.e., habitats with distinctdifferences in nutrient availability, salinity, temperature, and depth) (Figs. 1 and 2). We used a clusteringapproach to �nd the primary determinants of the structures of the gut microbiome and veri�ed thesedeterminants using unsupervised and supervised machine learning approaches, likes PAM clustering andrandom forest classi�cation. To gain a wider perspective, we compared gut microbial communities in �shand other vertebrates (mammals, reptiles, and birds) by using principal coordinate analysis (PCoA).These data serve as a reference for future studies of the gut microbiota of �sh and other aquatic animals.Our �ndings also support the notion that symbiotic relationships between microbes and vertebrates areimportant for adaptation and provide insights into the nature of interspeci�c microbiome variation invarious �sh species.
Results
Overview of data related to the gut microbiota in �sh taxaWe analyzed the bacterial community composition of the intestinal contents of 227 individual �shinhabiting six different environments (23 different sampling spots; Fig. 1a). The collected �sh weretaxonomically grouped into two classes (ray-�nned and cartilaginous �sh), 14 orders, 42 families, 79genera, and 85 species. Overall, 1,014,240 raw 16S rRNA gene sequence reads were obtained from theintestinal contents of �sh, and 653,281 high-quality sequence reads were obtained after the removal oflow-quality and chimeric sequences. The high-quality sequences were clustered into 3,273 operationaltaxonomic units (OTUs), with a mean number of OTUs per sample of 91 (± 6 SD), applying a threshold of97% sequence identity.
To determine whether the sampling depth was su�cient to give an overview of the �sh gut microbiota,rarefaction curves were generated for the number of OTUs per individual or species (Additional �le 1:Supplementary Fig. S1). The cumulative number of identi�ed OTUs reached a plateau at approximately150 individuals or 60 �sh species. This pattern was not affected by the �sh habitat, indicating that thesampling depth was su�cient to capture the global bacterial diversity of the gut microbiota of wild �sh.
The �sh gut microbiota included 21 bacterial phyla, with three dominant phyla (Proteobacteria,Firmicutes, and Cyanobacteria) accounting for over 70% of all sequence reads (Fig. 1b and Additional �le
Page 5/28
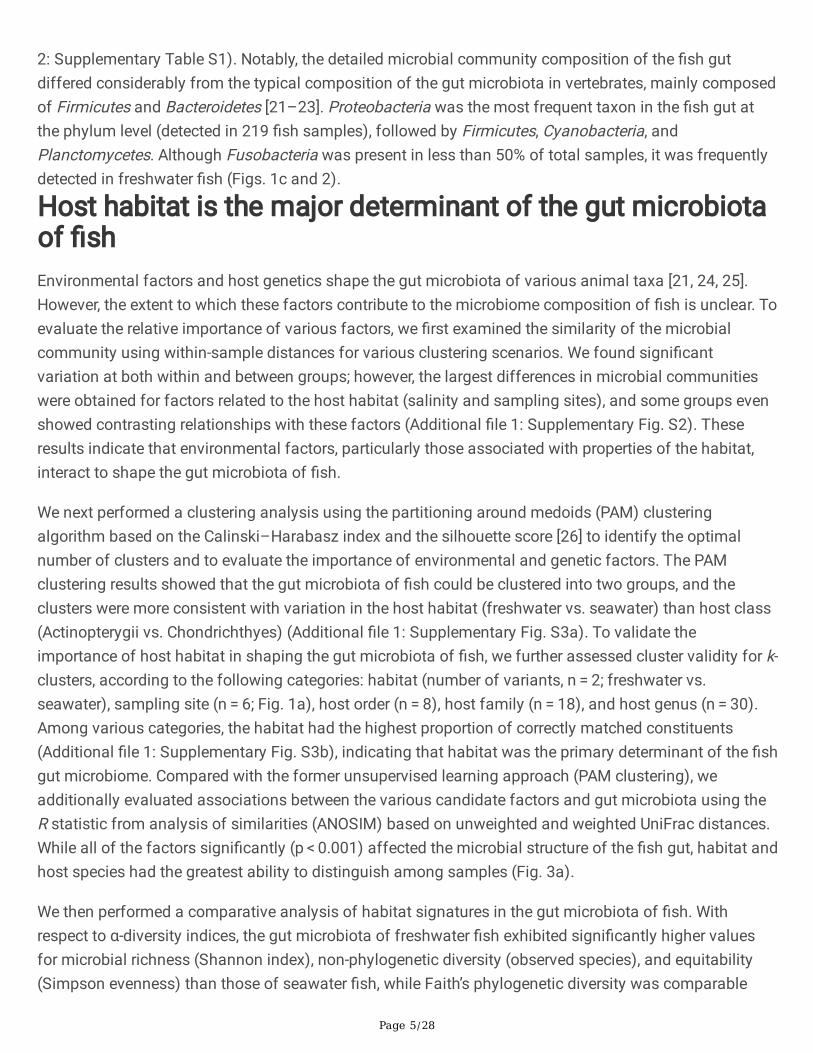
2: Supplementary Table S1). Notably, the detailed microbial community composition of the �sh gutdiffered considerably from the typical composition of the gut microbiota in vertebrates, mainly composedof Firmicutes and Bacteroidetes [21–23]. Proteobacteria was the most frequent taxon in the �sh gut atthe phylum level (detected in 219 �sh samples), followed by Firmicutes, Cyanobacteria, andPlanctomycetes. Although Fusobacteria was present in less than 50% of total samples, it was frequentlydetected in freshwater �sh (Figs. 1c and 2).
Host habitat is the major determinant of the gut microbiotaof �shEnvironmental factors and host genetics shape the gut microbiota of various animal taxa [21, 24, 25].However, the extent to which these factors contribute to the microbiome composition of �sh is unclear. Toevaluate the relative importance of various factors, we �rst examined the similarity of the microbialcommunity using within-sample distances for various clustering scenarios. We found signi�cantvariation at both within and between groups; however, the largest differences in microbial communitieswere obtained for factors related to the host habitat (salinity and sampling sites), and some groups evenshowed contrasting relationships with these factors (Additional �le 1: Supplementary Fig. S2). Theseresults indicate that environmental factors, particularly those associated with properties of the habitat,interact to shape the gut microbiota of �sh.
We next performed a clustering analysis using the partitioning around medoids (PAM) clusteringalgorithm based on the Calinski–Harabasz index and the silhouette score [26] to identify the optimalnumber of clusters and to evaluate the importance of environmental and genetic factors. The PAMclustering results showed that the gut microbiota of �sh could be clustered into two groups, and theclusters were more consistent with variation in the host habitat (freshwater vs. seawater) than host class(Actinopterygii vs. Chondrichthyes) (Additional �le 1: Supplementary Fig. S3a). To validate theimportance of host habitat in shaping the gut microbiota of �sh, we further assessed cluster validity for k-clusters, according to the following categories: habitat (number of variants, n = 2; freshwater vs.seawater), sampling site (n = 6; Fig. 1a), host order (n = 8), host family (n = 18), and host genus (n = 30).Among various categories, the habitat had the highest proportion of correctly matched constituents(Additional �le 1: Supplementary Fig. S3b), indicating that habitat was the primary determinant of the �shgut microbiome. Compared with the former unsupervised learning approach (PAM clustering), weadditionally evaluated associations between the various candidate factors and gut microbiota using theR statistic from analysis of similarities (ANOSIM) based on unweighted and weighted UniFrac distances.While all of the factors signi�cantly (p < 0.001) affected the microbial structure of the �sh gut, habitat andhost species had the greatest ability to distinguish among samples (Fig. 3a).
We then performed a comparative analysis of habitat signatures in the gut microbiota of �sh. Withrespect to α-diversity indices, the gut microbiota of freshwater �sh exhibited signi�cantly higher valuesfor microbial richness (Shannon index), non-phylogenetic diversity (observed species), and equitability(Simpson evenness) than those of seawater �sh, while Faith’s phylogenetic diversity was comparable

Page 6/28
across habitats (Additional �le 1: Supplementary Fig. S4). As expected from the R-values presented inFig. 3a, a PCoA plot of unweighted UniFrac distance metrics revealed that the gut microbial communitiesof freshwater �sh and seawater �sh clustered separately (ANOSIM, R = 0.471, p < 0.001; Fig. 3b).Furthermore, distinct clustering of gut microbial communities was apparent when considering a moredetailed habitat category, the sampling site, which re�ects the type of freshwater and seawater (e.g.,stream, lake, coast, or deep sea) and the geographical region (Additional �le 1: Supplementary Fig. S5).
Next, we investigated differences in the composition of the gut microbiota with respect to the habitat.Indeed, a phylum-level difference between freshwater �sh and seawater �sh was detected (Figs. 2 and3c). To determine whether the taxa with differences in abundance could serve as biologically relevantbiomarkers for freshwater and seawater �sh, we performed a linear discriminant analysis (LDA) effectsize (LEfSe) analysis at all taxonomic levels. The phylum Proteobacteria was enriched in seawater �shwith a relatively high LDA score (LDA > 3.8), while the phyla Firmicutes and Fusobacteria weresigni�cantly enriched in freshwater �sh (Additional �le 1: Supplementary Fig. S6a). At the family level,Moraxellaceae, Vibrionaceae, and Enterobacteriaceae (all in the class Gammaproteobacteria), andAlcaligenaceae (Betaproteobacteria) were signi�cantly more abundant in seawater �sh than in freshwater�sh, whereas Aeromonadaceae (Gammaproteobacteria) was signi�cantly more abundant in freshwater�sh. The family Clostridiaceae (Clostridia) was more abundant in freshwater �sh than in seawater �sh,whereas Leuconostocaceae (Bacilli) was more abundant in seawater �sh. Furthermore, most OTUsbelonging to Fusobacteriaceae, showing a higher frequency in freshwater �sh than in seawater �sh, wereassigned to Cetobacterium at the genus level (Additional �le 1: Supplementary Fig. S6b and Additional�le 2: Supplementary Table S1).
We then used a network-based approach to test whether gut microbial communities clustered by �shhabitat at the OTU level. In the analysis, a node represents an individual �sh and the OTUs are connectedto the host �sh in which they were detected. In agreement with the compositional differences notedabove, in the OTU network-based analysis, the host nodes were more likely to connect to nodes of otherhosts sharing the same habitat than to those from different habitats (Fig. 3d).
In ecology, the trophic level is the position occupied by an organism in the food chain. Primaryconsumers, usually herbivores, occupy lower trophic levels, while predatory species (e.g., carnivores)occupy higher levels [27, 28]. Hence, we further investigated the trophic level of individual �sh species toassess the effect of the host dietary gradient on the microbial community. A PCoA plot considering thetrophic level, as determined using FishBase [13], revealed a distinct microbial gradient based on theecological position of �sh in the food chain (Additional �le 1: Supplementary Fig. S7). These resultssuggested that the host trophic level is weakly but signi�cantly (ANOSIM, R = 0.14, p < 0.001) associatedwith the gut microbial community assemblage.
Host divergence had little in�uence on the gut microbiotaof �sh

Page 7/28
We observed a statistically signi�cant relationship between the gut microbial community structure andthe host genetic variation in the cytochrome c subunit I (CO1) gene, although the degree ofdistinguishability did not exceed that for the habitat, as determined by the R value from ANOSIM. Thehost taxon-dependent variation in the gut microbial community was greater at lower taxonomic levelsthan at higher taxonomic levels (Fig. 3a). Remarkable variation in both the microbial communitycomposition and structure was observed with respect to the host order (Additional �le 1: SupplementaryFig. S8a). Differences in the relative abundances of several bacterial taxa depended on the host order. Forexample, Epsilonproteobacteria was relatively enriched in Tetraodontiformes, whereas the relativeabundance of Gammaproteobacteria was higher in Lampriformes and Osmeriformes than in other hostorders. Firmicutes, mainly represented by the class Clostridia, was relatively more abundant inSiluriformes, Gadiformes, Cypriniformes, and Osmeriformes than in other host orders. The phylumCyanobacteria was enriched in Perciformes, Rajiformes, Clupeiformes, and Lophiiformes, whereas thephylum Fusobacteria was over-represented in Perciformes, Tetraodontiformes, Siluriformes,Cypriniformes, and Lophiiformes. Microbial communities showed signi�cantly greater clustering withinthe same host order than across different host orders (ANOSIM, R = 0.20, p < 0.001) (Additional �le 1:Supplementary Fig. S8b).
Considering the host species-speci�city of the gut microbiota in �sh, we next investigated the existence ofphylosymbiosis, or a relationship between host phylogeny and the gut microbiota. A scatter plot ofweighted UniFrac distances plotted against host genetic relatedness based on variation in the CO1 geneshowed no signi�cant association between similarity in the gut microbial community composition andhost phylogenetic distance (Fig. 4a). Regardless of the phylogenetic distance among hosts, thedissimilarities of gut microbial communities between �sh taxa were randomly distributed.
Habitat can be linked to host taxonomy because almost all �sh inhabit specialized niches. To testwhether this association confounds the distinguishability of the habitat/host taxonomy based on the gutmicrobiota, we next compared the microbial communities in Perciformes and Cypriniformes. In thecurrent study, the order Perciformes was represented by 10 species (at least three individuals per species)caught in freshwater or seawater, and the order Cypriniformes included various freshwater speciescollected at multiple sampling sites (a stream and lakes). PCoA and UPGMA trees revealed that gutmicrobial communities from a single host order showed clearer clustering by habitat than by host species(Additional �le 1: Supplementary Figs. S9 and S10), further supporting the greater role of the environmentthan host genetic factors in shaping the gut microbial community in �sh.
In addition, we used a machine learning algorithm (the random forest classi�er) to evaluate the predictivevalue of the microbial composition for host habitat or taxonomy. Owing to a large class imbalance in thenumber of variants per factor, precision-recall curves (PRC) were generated, and classi�cation accuracywas calculated based on the area under the curve (AUC). The classi�cation ability of the composition ofthe �sh gut microbial community was better for discriminating the host habitat (freshwater vs. seawater)than for discriminating the sampling site or host taxonomy (Fig. 4b).
Functional pro�ling of microbial communities

Page 8/28
We used the PICRUSt pipeline [29] to investigate whether the habitat-dependent differences in themicrobial taxonomic composition are related to differences in functional pro�les. Kyoto Encyclopedia ofGenes and Genomes (KEGG) ortholog groups (KOs) predicted from the 16S rRNA gene sequences wereassigned to broad functional categories based on the BRITE hierarchy. PCoA based on KOs predicted byPICRUSt revealed that the host habitat signi�cantly affects the functional gene distribution (ANOSIM, R = 0.37, p < 0.001) (Fig. 5a). Most gene functions were related to metabolism (49.5%), environmentalinformation processing (17.6%), and genetic information processing (14.5%) (Additional �le 1:Supplementary Fig. S11 and Additional �le 3: Supplementary Table S2). Gene families in the followingcategories were enriched in seawater �sh: membrane transport, xenobiotic biodegradation andmetabolism, amino acid metabolism, lipid metabolism, and transport and catabolism. By contrast, genefamilies in the following categories were enriched in freshwater �sh: nucleotide metabolism,carbohydrate metabolism, metabolism of cofactors and vitamins, energy metabolism, translation,replication and repair, and cell motility (Fig. 5b).
We then used a machine learning approach to examine whether the functional pro�les of the gutmicrobiota could be used to predict the environment or host taxon. The AUCs of PRC calculated using thefunctional pro�les showed better prediction accuracy for the host habitat than for other factors,consistent with the results of the random forest classi�er analysis based on microbial taxonomic pro�les(Fig. 5c).
Comparison of the gut microbiota of �sh and othervertebrate speciesLastly, we examined the impact of vertebrate evolution on gut microbes by comparing the microbialtaxonomic pro�les among �sh and other vertebrate species. We compared the microbiota data for �shobtained in the current study with data for humans (Human Gut Microbiota Project [HMP] data [30, 31]),66 aquatic mammals [32], 39 non-human mammals [33], 41 iguanas and snakes (reptiles) [34, 35], and124 wild birds [36]. PCoA of the Bray–Curtis dissimilarity index and the binary Jaccard index revealedthat the �sh gut microbiome clustered separately from the other microbiomes (PERMANOVA, p < 0.001and p < 0.001, respectively). Furthermore, the gut bacterial communities from other animals were clearlyseparated (Additional �le 4: Supplementary Table S3). Clustering by phylogenetic relationships amonghosts was clearly evident in a PCoA of the binary Jaccard index at the family level (Fig. 6), and signi�cantdifferences were observed (ANOSIM, R = 0.64, p < 0.001). As shown in Fig. 6a, the gut microbiome of �shshowed slight overlap with the gut microbiomes of aquatic mammals (dolphins and sea lions) andsnakes, while the avian gut microbiome was distinct from those of other vertebrates. When examining themicrobial composition of each host group, the components of the gut microbiota of each host differed atthe microbial phylum level. Proteobacteria was most abundant in �sh, Firmicutes was enriched in birdsand reptiles, and Bacteroidetes was enriched in humans (Fig. 6b–d).
Discussion

Page 9/28
We characterized the gut microbial communities of various wild �sh. Few studies have focused on the�sh gut microbiota, despite the importance of �sh in the evolutionary history of vertebrates and thetremendous species diversity, accounting for nearly half of all vertebrate species [13]. The gut microbiotaof vertebrates is host-speci�c and arose as a result of co-evolution between hosts and microbes [37, 38].Even in invertebrate species (e.g., shrimp or insect species), the gut microbiota is distinguished by thepresence of speci�c commensal bacterial consortia [39, 40]. As expected, we found that the gutmicrobiota of wild �sh is a host-speci�c and deterministic microbial assemblage. Furthermore, weshowed that the gut microbiota is primarily determined by the �sh environment, rather than by geneticfactors.
The gut microbiota of most vertebrates, including amphibians, reptiles, mammals, and birds, isdominated by the phyla Firmicutes and Bacteroidetes [22, 31, 41, 42]. Indeed, a bloom of Proteobacteria isconsidered a sign of dysbiosis or instability of the gut microbial community in mammals [43]. Manycommensal Proteobacteria can become pathobionts, infecting the host under speci�c conditions andfacilitating in�ammation [44, 45]. However, in the current study, Proteobacteria dominated the gutmicrobiota of the majority of �sh, in agreement with recent studies of the gut microbiota of �sh [14, 15].These compositional differences at the phylum level can be explained by a partial projection of the vastdiversity of marine Proteobacteria associated with the unsegmented digestive system of �sh, unlike thatof mammals [46, 47]. A stochastic assemblage of environmental microbes in the �sh gut microbiota isunlikely because the predominant bacterial taxa in the ocean or other aquatic habitats, such as SAR11(Pelagibacter ubique HTCC1062), SAR116 (Puniceispirillum marinum IMCC1322), and SAR86, wereabsent or not abundant in the �sh gut (Additional �le 5: Supplementary Table S4) [48, 49]. These �ndingsprompt the question of whether Proteobacteria outcompete other environmental bacterial taxa in theaquatic habitat or whether they have been selected by the host itself [50–52].
We found that host habitat was the predominant determinant of the �sh gut microbial community.Assessments of the discriminative structuring factors of the gut microbiota using both unsupervised andsupervised learning approaches, such as PAM clustering, ANOSIM, and random forest classi�er analysis,supported the importance of habitat, and this was particularly apparent in �sh with a similar geneticbackground (e.g., Perciformes and Cypriniformes). Nevertheless, various other factors that wereexamined, including host taxonomy and trophic level, contributed to the �sh gut microbial community(Fig. 3a). Environmental factors could not explain a large portion of the total variance (Fig. 3b; variationexplained by PC1 at 7.43%) in the �sh gut microbiota. Hence, intrinsic genetic factors are also important,and the species-speci�city of the gut microbiota is a result of the intrinsic genetic background of the host.
Differences in the microbial compositional with respect to salinity can be explained in terms of hostadaptation to the environment. The dominant taxa might re�ect the a�nity of the host for gut bacteriathat contribute to the maintenance of immune function and metabolic activity. For example, the highproportion of Fusobacteria in freshwater �sh might be associated with vitamin B12 (cobalamin).Cetobacterium somerae (order Fusobacteriales) is widely distributed in various freshwater �sh, and itsprevalence is negatively correlated with the dietary availability of vitamin B12 [53, 54]. Different
Page 10/28
environmental conditions affect vitamin B12 availability, and freshwater �sh harbor more vitamin B12-synthesizing bacteria, such as C. somerae, to satisfy their dietary needs. The importance of metabolicproperties is consistent with the predicted functions of gut bacteria in freshwater �sh, which showed arelatively high abundance of genes related to the metabolism of cofactors and vitamins. This suggeststhat basic nutrient availability in the environment drives selection of the �sh gut microbiota to account forthe nutritional de�ciencies of the host. Based on the performance of classi�ers, better results areobtained when using functional pro�les as a training trait than when using taxonomic pro�les.Environmental factors (e.g., habitat type) result in functional redundancy, with the host physiologygoverned by the ability to adapt.
We also observed high similarity between the gut microbiota of hosts that share feeding preferences. Theaverage trophic level of seawater �sh collected in the current study was higher than that of freshwater�sh. Seawater �sh show carnivorous and herbivorous dietary preferences, while freshwater �sh tend toshow omnivorous dietary preferences [28]. In particular, the family Enterobacteriaceae was signi�cantlyenriched in seawater �sh, consistent with results for other carnivorous �sh [15, 55]. Further, a bloom ofmarine-associated bacteria, such as Enterobacteriaceae and Moraxellaceae, is correlated with a low-�beror animal-based diet in humans [56, 57]. By contrast, Clostridium and Aeromonadaceae werepredominant in freshwater �sh in the current study. Several Clostridium species are well-known cellulose-degraders associated with herbivorous vertebrates [58, 59]. Aeromonas is dominant in �sh feeding ondetritus of plant origin and in omnivorous freshwater �sh (intermediate trophic level) [15, 60]. Differencesin the gut microbiota are not simply a consequence of the host diet or feeding preference, as divergencebetween the gut microbiota of freshwater and seawater �sh can also be a cause of the functionalpotential of hosts (Fig. 5).
In a comparison between �sh and other vertebrates, including Reptilia, Avia, and Mammalia, we detectedclearly distinct structures of each gut microbiota (Fig. 6). This was observed despite analogous taxonwith similar metabolic or biological roles, i.e., a relatively high proportion of Enterobacteriaceae andMoraxellaceae (Proteobacteria) in animal-based diet vertebrates [56, 57] and the dominance ofClostridium species (Firmicutes) in plant-based diet vertebrates [58, 59]. Unlike the gut microbialcomposition of �sh, the dominant gut bacteria of terrestrial mammals and humans belong to the phylaFirmicutes and Bacteroidetes. Firmicutes is the sole prominent microbial phylum in the guts of reptilesand birds. This difference at the microbial phylum level can be explained by evolved differences between�sh and other vertebrates in the selectivity of the gut environment [15, 61]. Early �sh arose 600 millionyears ago and became ancestors of all extant vertebrate clades [12]. Since the appearance of earlyvertebrates, they have evolved a number of physiological adaptations for survival in variousenvironments. During this process, symbiotic gut microbes and host species co-evolved to survive in thecontinuously changing environment. It is di�cult to experimentally simulate gut microbial selection andcolonization during vertebrate evolution; however, surveys and experiments involving extant vertebratespecies can provide insight into the contribution of various environmental and genetic factors to the gutmicrobiota.

Page 11/28
Our species-wide study included an unprecedented number of �sh; however, it had several limitations.Since sample collection focused on East Asia (the Korean peninsula), the taxa are not representative ofthe total species diversity of �sh. The analysis should be extended to other �sh species and several otherfactors, especially microbial communities in the surrounding environment. The detailed characterizationof ecological niches and metabolic differences among �sh will improve our understanding of thefundamental assemblage of the gut microbial consortium in �sh. Furthermore, we analyzed the 16S rRNAgene to evaluate the bacterial composition and predicted functional pro�les using the PICRUSt pipeline.These analyses indicated that some taxa are linked to speci�c biological activities of the �sh host.Additional studies involving shotgun metagenomic sequencing could yield a more comprehensivedataset for detailed analyses of the determinants of the speci�c consortia of gut microbes in �sh andtheir roles.
ConclusionsIn summary, our results provide a comprehensive view of the �sh gut microbiota. In particular, we foundthat host habitat (freshwater vs. seawater) has a dominant role in shaping wild �sh gut microbialcommunities over host taxonomy and trophic level. Moreover, the microbial functional pro�les predictedfrom 16S rRNA gene sequences were predominantly determined by host habitat. We further demonstratethat random forest classi�ers trained on microbial community composition or functional featuresshowed better prediction accuracy for the host habitat than for other factors. In addition, the �sh gutmicrobiome in a PCoA plot clustered separately from those of other vertebrates, such as mammals,reptiles, and birds. Our �ndings improve our understanding of the long-term co-evolution of vertebratesand their indigenous microbial communities.
Methods
Sample collectionGut samples from 227 seawater and freshwater �sh were collected at 23 sites in Korea between June2013 and October 2013 (Figs. 1a and 2 and Additional �les 6 and 7: Supplementary Tables S5-6).Seawater �sh were caught by the �sheries resource research vessel Tamgu-20 of the National Institute ofFisheries Science (NIFS), Korea. During a seasonal �sheries resource investigation of the deep sea ofEast Sea, near the seas of Ulleung-do and Dok-do, and West Sea, 175 seawater �sh were caught bybottom trawling, mid-water (pelagic) trawling, and trammel. Freshwater �sh were collected incollaboration with the Inland Fisheries Research Institute (NIFS) by using cast net and �sh traps. Allprocedures for the collection and handling of seawater and freshwater �shes were approved by the NIFSand performed under the supervision of authorized and experienced members of the NIFS staff. Theseawater �sh were handled in a laboratory facility on the �shing vessel and the freshwater �sh werehandled at appropriate facilities near the �shing sites. All �sh were stunned and dissected immediatelyafter catching. Approximately 1.0–1.5 cm of the rectum was collected using sterile instruments, and thesamples, including the luminal content and mucosa, were stored at − 80°C until analyses. An
Page 12/28
accompanying �sh taxonomist identi�ed the �sh host species by brie�y assessing �sh morphologicalcharacteristics during sample collection. The �sh host species were re-identi�ed in the laboratory by amolecular phylogenetic analysis (vide infra).
DNA extraction and pyrosequencing of bacterial 16S rRNAgenesThe gut specimens were squeezed out with sterile instruments to collect the luminal content. The gutsamples were cut laterally to remove the mucus layer of the �sh gut by visual inspection. A cover glasswas used to separate the mucus layer from the gut samples. The luminal content and mucus layer werepooled and transferred to a sterile conical tube containing 6.5 mM dithiothreitol for mucus degradation[62]. After incubation for 1 h at 37°C, the pellet was collected by centrifugation and re-suspended in 750 µllysis buffer (500 mM NaCl, 50 mM Tris-HCl, pH 8.0, 50 mM EDTA, and 4% sodium dodecyl sulfate). Tomaximize microbial cell lysis before DNA extraction, the re-suspended pellets were homogenized byshaking in a sterile screw-cap tube containing zirconia beads (2.3 and 0.1 mm diameter) and glass beads(0.5 mm diameter) using FastPrep-24 (MP Biomedicals, Santa Ana, CA, USA) for 50 s at 6.0 m/s.Genomic DNA from the homogenized samples was then extracted by the standard phenol-chloroformextraction method using the UltraClean Microbial DNA Isolation Kit (MOBIO, London, UK). Thehypervariable regions V1–V3 of the 16S rRNA gene were ampli�ed from the extracted genomic DNA ofthe sampled �sh guts by using a sample-speci�c barcoded bacterial primer set [63] and Ex-Taq premix(Takara Bio, Kyoto, Japan). The polymerase chain reaction (PCR) conditions were as follows: 94°C for 10min; followed by 29 cycles of 94°C for 60 s, 50°C for 30 s, and 72°C for 1 min 30 s; followed by a �nalextension step at 72°C for 10 min. Four independent PCR products for each sample were pooled andpuri�ed using the QIAquick PCR Puri�cation Kit (Qiagen, Hilden, Germany). The concentration of puri�edPCR products was determined using the Quant-it PicoGreen dsDNA Assay Kit (Life Technologies,Carlsbad, CA, USA). The quality and quantity of DNA were checked using a Bioanalyzer 2100 instrument(Agilent, Santa Clara, CA, USA) and a DNA 1000 Lab Chip (Agilent). The pooled DNA was then ampli�edby emulsion PCR before 454 pyrosequencing using a GS FLX Titanium instrument (Roche, Basel,Switzerland) by a certi�ed service provider (Macrogen, Seoul, Korea), according to the manufacturer’sinstructions.
Identi�cation of �sh host species and phylogenetic analysisof �shTo identify the �sh host species, genomic DNA was extracted from the �sh �esh collected asepticallyfrom each specimen. Tissue fragments were suspended in 750 µl lysis buffer and homogenized by usingFastPrep-24 (MPbio) with glass beads (0.5 mm diameter) for 40 s at 6.0 m/s. DNA was extracted using astandard phenol-chloroform extraction method. The CO1 gene was ampli�ed by using AccuPower PCRPremix (Bioneer, Daejeon, Korea) and the CO1 gene primer cocktail set 3 [64]. The PCR conditions were asfollows: initial denaturation at 95°C for 3 min; followed by 30 cycles of 94°C for 30 s, 52°C for 40 s, and72°C for 1 min; followed by a �nal extension step at 72°C for 10 min [64]. The PCR products were
Page 13/28
sequenced using the BigDye Terminator Cycle Sequencing Ready Reaction Kit (Applied Biosystems,Foster City, CA, USA), according to the manufacturer’s instructions. The reaction products were analyzedusing an automated DNA analyzer system (PRISM 3730XL DNA Analyzer, Applied Biosystems). Sequencefragments were assembled using SeqMan (DNASTAR, Madison, WI, USA). The assembled CO1 genesequences were then compared with other CO1 gene sequences in the nucleotide collection (nr/nt) of theGenBank database by searches using the Basic Local Alignment Search Tool (BLAST) [65]. The CO1 genesequences were aligned using the multiple alignment program CLUSTAL W (v. 1.4), and a phylogenetictree was generated by using MEGA 6 [66, 67] using the maximum-likelihood algorithm with 1000bootstrap replicates [68].
Sequence analysisThe raw 16S rRNA sequences generated using the GS FLX Titanium platform were processed usingQIIME (v. 1.8.0) [69]. All raw sequences with average quality scores below 25 and those shorter than 200bp or longer than 1000 bp were removed. The quality-�ltered sequences were denoised using the QIIMEdenoising algorithms [70]. The sequences were then clustered into OTUs at a 97% sequence similaritythreshold using UCLUST [71] in QIIME. The OTUs were generated by searches against the Greengenesreference database from August 2013 using a subsampled open-reference method [72]. Before furtheranalysis, chimeric sequences were detected by comparing with a reference database using USEARCH (v.7.0.1090) [71] and were removed. A representative sequence for each OTU was picked and aligned withthe Greengenes reference database by using PyNAST [73]. The alignments were used for phylogenetictree construction using the FastTree algorithm [74]. An even-depth rare�ed OTU table matrix (600sequences) was constructed to calculate various diversity indices [75]. The Ribosomal Database Projectclassi�er against the Greengenes reference database was used at a minimal con�dence of 60% [76] forthe taxonomic assignment of representative OTUs. The calculation of α-diversity indices (phylogeneticdiversity, observed species count, Chao1 richness estimators, and the Shannon and Simpson indices) andβ-diversity indices (Bray–Curtis dissimilarity and UniFrac weighted and unweighted metrics), as well asPCoA, were performed using QIIME pipelines. The calculated coordination was visualized using a web-based visualization tool, Plotly (http://plot.ly). To check for the presence of transient environmentalbacteria in the gut microbiota, the full dataset was BLAST-searched against SAR11 (GenBank accessionno. CP000084), SAR86 (JX530677), and SAR116 (CP001751) sequences. PICRUSt(http://picrust.github.io) [29] was used to examine the functional pro�les of the �sh gut microbialcommunity based on the 16S rRNA gene composition. For the PICRUSt analysis, an OTU table wasconstructed by closed-reference OTU picking against the May 2013 Greengenes database using QIIME.The OTU table was converted into the PICRUSt format and normalized by the 16S rRNA gene copynumber to correct for the over- and under-estimation of microbial abundance. The normalized datasetwas analyzed using the KO dataset [77]. Detailed microbiome analytical scripts and computationalenvironments are provided online (Additional �le 8: Supplementary Method).
Comparison of the gut microbiota among various animals

Page 14/28
Gut microbiota data from various organisms were used for meta-analysis. The human gut microbiotadataset was downloaded from the NIH HMP (http://hmpdacc.org/) [31]. The aquatic mammalian gutmicrobiota [32] data were obtained from the NCBI Sequence Read Archive (SRA). The land and marineiguana gut microbiota data [34] were downloaded from the Dryad data package [78]. Non-humanmammalian gut microbiota [33], snake gut microbiota [35], and wild avian gut microbiota [36] data wereobtained from the Qiita database (https://qiita.ucsd.edu/), as pre-processed data. Closed-reference OTUpicking methods (pick_closed_reference_otus.py) were used to cluster the OTUs against the samereference sequences (gg_13_8) using the QIIME pipeline (v. 1.8.0). After discarding the unalignedsequences, an even-depth rare�ed OTU table was generated and used for subsequent analyses. A non-phylogenetic β-diversity metric (the binary Jaccard index) was calculated and visualized by PCoA.
OTU network-based analysisFor an OTU network-based analysis, OTU network maps were constructed using QIIME and visualizedusing Cytoscape (v. 3.0.1) [79, 80]. Brie�y, the OTU table generated at the 97% sequence similaritythreshold was converted to the Cytoscape format (make_otu_network.py). In the converted OTU networkmaps, the samples and OTUs were set to represent network nodes connected by edges, which representedOTU abundance in the samples. The edge-weighted spring embedded model was derived to arrangenetwork constituents.
Statistical analysisAll statistical analyses were performed using GraphPad Prism (v. 5.0; GraphPad, San Diego, CA, USA).The signi�cance of differences between groups was assessed using two-tailed Mann–Whitney U-tests.To compare the β-diversity indices among multiple groups, one-way analysis of variance was used,followed by Duncan’s post-hoc tests. For multiple comparisons, p-values were corrected by theBenjamini–Hochberg false discovery rate (FDR) procedure, and FDR < 0.05 was considered statisticallysigni�cant. ANOSIM and PERMANOVA tests with the β-diversity matrix were performed using the QIIMEpipeline (compare_categories.py). Statistical signi�cance for both tests was determined based on 10,000permutations. Assessment models to identify the discriminative factors shaping the �sh gut microbiotawere constructed using random forest classi�ers in Weka v. 3.8.3 open source software(http://www.cs.waikato.ac.nz/~ml/weka/index.html) developed at Waikato University, New Zealand [81,82]. The random forest classi�ers were trained using individually generated input tables of the relativeOTU abundance and discriminative variables with 10-fold cross-validation. To determine the optimalnumber of clusters for evaluating the cohesiveness of clusters with various metadata, the Calinski–Harabasz index (CH index) and the silhouette score were calculated for each set of clusters generated byPAM clustering [26] (https://enterotype.embl.de/enterotypes.html#). The differentially abundanttaxonomic and functional features were also con�rmed using LEfSe in the Galaxy server(http://huttenhower.sph.harvard.edu/galax y/) [83, 84]. The signi�cance threshold of the α parameter forthe Kruskal–Wallis test for classes was set to 0.05. The threshold for the logarithmic LDA score fortaxonomic features was 3.8, and that for functional features was 3.0.
Page 15/28
List Of AbbreviationsANOSIM, analysis of similarities;
AUC, area under the curve;
BLAST, Basic Local Alignment Search Tool;
CO1, cytochrome c oxidase subunit I;
FDR, false discovery rate;
KEGG, Kyoto Encyclopedia of Genes and Genomes;
KO, KEGG orthology;
LDA, linear discriminant analysis;
LEfSe, linear discriminant analysis effect size;
OTU, operational taxonomic unit;
PCoA, principal coordinate analysis;
PERMANOVA, permutational multivariate analysis of variance;
PICRUSt, Phylogenetic Investigation of Communities by Reconstruction of Unobserved States;
PRC, precision-recall curves.
DeclarationsEthics approval
All experiments were approved by the Institutional Animal Care and Use Committee of Kyung HeeUniversity and performed in accordance with the protocol KHUASP(SE)-15-087.
Consent for publication
Not applicable.
Availability of data and material
The obtained 16S rRNA gene sequences for the �sh gut microbiota and the CO1 gene sequences forcollected �sh were submitted to the European Nucleotide Archive (ENA) of EMBL-EBI and NCBI GenBank

Page 16/28
databases under the accession numbers PRJEB31232 (16S rRNA gene sequences) and MK560532-MK560758 (CO1 gene sequences), respectively.
Competing interests
The authors declare that they have no competing interests.
Funding
This work was supported by a grant from the National Institute of Biological Resources (NIBR), funded bythe Ministry of Environment (MOE) of the Republic of Korea (NIBR202002108 to J-WB) and a grant fromthe Mid-Career Researcher Program (NRF-2020R1A2C3012797 to J-WB) through the National ResearchFoundation of Korea (NRF), and KRIBB Research Initiative Program (KGM5232113 to N-RS).
Authors' contributions
PSK, J-BL, and J-WB planned and designed the research and experiments. PSK, J-BL, D-WH, and JYKundertook the �eld work and processing of samples. PSK, N-RS, M-SK, TWW, D-WH, J-HY, M-JJ, JYK, andJ-WB performed the experiments and analyzed the data. PSK, N-RS, and J-WB wrote the paper. All authorsread and approved the �nal manuscript.
Acknowledgments
We would like to thank Dr. Hae Won Lee, Dr. Jae Hyeong Yang, and Dr. Mi Young Song at the NationalInstitute of Fisheries Science (NIFS) for their outstanding assistance in collecting �sh specimens, as wellas the captain and crew members of the �sheries resource research vessel Tamgu-20 of the NIFS for theirassistance during expeditions.
References1. Butter�eld NJ, Knoll AH, Swett K: A bangiophyte red alga from the Proterozoic of arctic Canada.
Science 1990, 250(4977):104-107.
2. Van Valen L: A new evolutionary law. Evol Theor 1973, 1:1-30.
3. Hentschel U, Steinert M, Hacker J: Common molecular mechanisms of symbiosis and pathogenesis.Trends Microbiol 2000, 8(5):226-231.
4. Bäckhed F, Ding H, Wang T, Hooper LV, Koh GY, Nagy A, Semenkovich CF, Gordon JI: The gutmicrobiota as an environmental factor that regulates fat storage. Proc Natl Acad Sci USA 2004,101(44):15718-15723.
5. Bäckhed F, Ley RE, Sonnenburg JL, Peterson DA, Gordon JI: Host-bacterial mutualism in the humanintestine. Science 2005, 307(5717):1915-1920.
�. Robosky LC, Wells DF, Egnash LA, Manning ML, Reily MD, Robertson DGJTS: Metabonomicidenti�cation of two distinct phenotypes in Sprague-Dawley (Crl: CD (SD)) rats. Toxicol Sci 2005,

Page 17/28
87(1):277-284.
7. Turnbaugh PJ, Ley RE, Mahowald MA, Magrini V, Mardis ER, Gordon JI: An obesity-associated gutmicrobiome with increased capacity for energy harvest. Nature 2006, 444(7122):1027-1131.
�. Stecher B, Robbiani R, Walker AW, Westendorf AM, Barthel M, Kremer M, Chaffron S, Macpherson AJ,Buer J, Parkhill J: Salmonella enterica serovar typhimurium exploits in�ammation to compete withthe intestinal microbiota. PLoS Biol 2007, 5(10):e244.
9. Round JL, Mazmanian SK: The gut microbiota shapes intestinal immune responses during healthand disease. Nat Rev Immunol 2009, 9(5):313-323.
10. Hoffmann C, Hill DA, Minkah N, Kirn T, Troy A, Artis D, Bushman F: Community-wide response of thegut microbiota to enteropathogenic Citrobacter rodentium infection revealed by deep sequencing.Infect Immun 2009, 77(10):4668-4678.
11. Colston TJ, Jackson CR: Microbiome evolution along divergent branches of the vertebrate tree of life:what is known and unknown. Mol Ecol 2016, 25(16):3776-3800.
12. Nelson JS: Fishes of the World: John Wiley & Sons; 2006.
13. Froese R, Pauly D: FishBase. Species list: World Wide Web electronic publication. In.; 2019.
14. Roeselers G, Mittge EK, Stephens WZ, Parichy DM, Cavanaugh CM, Guillemin K, Rawls JF: Evidencefor a core gut microbiota in the zebra�sh. ISME J 2011, 5(10):1595-1608.
15. Sullam KE, Essinger SD, Lozupone CA, O’CONNOR MP, Rosen GL, Knight R, Kilham SS, Russell JA:Environmental and ecological factors that shape the gut bacterial communities of �sh: a meta‐analysis. Mol Ecol 2012, 21(13):3363-3378.
1�. Navarrete P, Magne F, Mardones P, Riveros M, Opazo R, Suau A, Pochart P, Romero J: Molecularanalysis of intestinal microbiota of rainbow trout (Oncorhynchus mykiss). FEMS Microbiol Ecol2010, 71(1):148-156.
17. Ye L, Amberg J, Chapman D, Gaikowski M, Liu W-T: Fish gut microbiota analysis differentiatesphysiology and behavior of invasive Asian carp and indigenous American �sh. ISME J 2013.
1�. Hovda MB, Lunestad BT, Fontanillas R, Rosnes JT: Molecular characterisation of the intestinalmicrobiota of farmed Atlantic salmon (Salmo salar L.). Aquaculture 2007, 272(1):581-588.
19. Geraylou Z, Souffreau C, Rurangwa E, D'Hondt S, Callewaert L, Courtin CM, Delcour JA, Buyse J,Ollevier F: Effects of arabinoxylan-oligosaccharides (AXOS) on juvenile Siberian sturgeon (Acipenserbaerii) performance, immune responses and gastrointestinal microbial community. Fish & shell�shimmunology 2012, 33(4):718-724.
20. Wilson B, Danilowicz BS, Meijer WG: The diversity of bacterial communities associated with Atlanticcod Gadus morhua. Microb Ecol 2008, 55(3):425-434.
21. Ley RE, Lozupone CA, Hamady M, Knight R, Gordon JI: Worlds within worlds: evolution of thevertebrate gut microbiota. Nat Rev Microbiol 2008, 6(10):776-788.
22. Waite DW, Taylor MW: Characterizing the avian gut microbiota: membership, driving in�uences, andpotential function. Front Microbiol 2014, 5:223.
Page 18/28
23. Nishida AH, Ochman H: Rates of gut microbiome divergence in mammals. Mol Ecol 2018,27(8):1884-1897.
24. Benson AK, Kelly SA, Legge R, Ma F, Low SJ, Kim J, Zhang M, Oh PL, Nehrenberg D, Hua K:Individuality in gut microbiota composition is a complex polygenic trait shaped by multipleenvironmental and host genetic factors. Proc Natl Acad Sci USA 2010, 107(44):18933-18938.
25. Campbell JH, Foster CM, Vishnivetskaya T, Campbell AG, Yang ZK, Wymore A, Palumbo AV, CheslerEJ, Podar M: Host genetic and environmental effects on mouse intestinal microbiota. ISME J 2012,6(11):2033.
2�. Arumugam M, Raes J, Pelletier E, Le Paslier D, Yamada T, Mende DR, Fernandes GR, Tap J, Bruls T,Batto J-MJn: Enterotypes of the human gut microbiome. 2011, 473(7346):174.
27. Lindeman RL: The trophic‐dynamic aspect of ecology. Ecology 1942, 23(4):399-417.
2�. Stergiou KI, Karpouzi VS: Feeding habits and trophic levels of Mediterranean �sh. Rev Fish BiolFisher 2002, 11(3):217-254.
29. Langille MG, Zaneveld J, Caporaso JG, McDonald D, Knights D, Reyes JA, Clemente JC, Burkepile DE,Thurber RLV, Knight R: Predictive functional pro�ling of microbial communities using 16S rRNAmarker gene sequences. Nat Biotechnol 2013, 31(9):814-821.
30. Methé BA, Nelson KE, Pop M, Creasy HH, Giglio MG, Huttenhower C, Gevers D, Petrosino JF,Abubucker S, Badger JH: A framework for human microbiome research. Nature 2012, 486(7402):215.
31. Huttenhower C, Gevers D, Knight R, Abubucker S, Badger JH, Chinwalla AT, Creasy HH, Earl AM,FitzGerald MG, Fulton RSJN: Structure, function and diversity of the healthy human microbiome.2012, 486(7402):207.
32. Bik EM, Costello EK, Switzer AD, Callahan BJ, Holmes SP, Wells RS, Carlin KP, Jensen ED, Venn-Watson S, Relman DA: Marine mammals harbor unique microbiotas shaped by and yet distinct fromthe sea. Nat Commun 2016, 7:10516.
33. Muegge BD, Kuczynski J, Knights D, Clemente JC, González A, Fontana L, Henrissat B, Knight R,Gordon JI: Diet drives convergence in gut microbiome functions across mammalian phylogeny andwithin humans. Science 2011, 332(6032):970-974.
34. Lankau EW, Hong PY, Mackie RI: Ecological drift and local exposures drive enteric bacterialcommunity differences within species of Galapagos iguanas. Mol Ecol 2012, 21(7):1779-1788.
35. Costello EK, Gordon JI, Secor SM, Knight R: Postprandial remodeling of the gut microbiota inBurmese pythons. ISME J 2010, 4(11):1375-1385.
3�. Peralta-Sánchez JM, Martín-Platero AM, Wegener-Parfrey L, Martínez-Bueno M, Rodríguez-Ruano S,Navas-Molina JA, Vázquez-Baeza Y, Martín-Gálvez D, Martín-Vivaldi M, Ibáñez-Álamo JD: Bacterialdensity rather than diversity correlates with hatching success across different avian species. FEMSMicrobiol Ecol 2018, 94(3):�y022.
37. Ley RE, Hamady M, Lozupone C, Turnbaugh PJ, Ramey RR, Bircher JS, Schlegel ML, Tucker TA,Schrenzel MD, Knight R: Evolution of mammals and their gut microbes. Science 2008,320(5883):1647-1651.
Page 19/28
3�. Vital M, Gao J, Rizzo M, Harrison T, Tiedje JM: Diet is a major factor governing the fecal butyrate-producing community structure across Mammalia, Aves and Reptilia. ISME J 2015, 9(4):832.
39. Yun J-H, Roh SW, Whon TW, Jung M-J, Kim M-S, Park D-S, Yoon C, Nam Y-D, Kim Y-J, Choi J-H: Insectgut bacterial diversity determined by environmental habitat, diet, developmental stage, andphylogeny of host. Appl Environ Microbiol 2014, 80(17):5254-5264.
40. Rungrassamee W, Klanchui A, Maibunkaew S, Chaiyapechara S, Jiravanichpaisal P, KaroonuthaisiriN: Characterization of intestinal bacteria in wild and domesticated adult black tiger shrimp (Penaeusmonodon). PloS One 2014, 9(3):e91853.
41. Hong P-Y, Wheeler E, Cann IK, Mackie RI: Phylogenetic analysis of the fecal microbial community inherbivorous land and marine iguanas of the Galápagos Islands using 16S rRNA-basedpyrosequencing. ISME J 2011, 5(9):1461-1470.
42. Colombo BM, Scalvenzi T, Benlamara S, Pollet N: Microbiota and mucosal immunity in amphibians.Front Immunol 2015, 6:111.
43. Shin N-R, Whon TW, Bae J-W: Proteobacteria: microbial signature of dysbiosis in gut microbiota.Trends Biotechnol 2015, 33(9):496-503.
44. Morgan XC, Tickle TL, Sokol H, Gevers D, Devaney KL, Ward DV, Reyes JA, Shah SA, LeLeiko N,Snapper SB: Dysfunction of the intestinal microbiome in in�ammatory bowel disease and treatment.Genome Biol 2012, 13(9):R79.
45. Walujkar SA, Dhotre DP, Marathe NP, Lawate PS, Bharadwaj RS, Shouche YS: Characterization ofbacterial community shift in human Ulcerative Colitis patients revealed by Illumina based 16S rRNAgene amplicon sequencing. Gut Pathog 2014, 6(1):22.
4�. Guillaume J, Kaushik S, Bergot P, Metailler R: Nutrition and feeding of �sh and crustaceans: SpringerScience & Business Media; 2001.
47. Sunagawa S, Coelho LP, Chaffron S, Kultima JR, Labadie K, Salazar G, Djahanschiri B, Zeller G,Mende DR, Alberti A: Structure and function of the global ocean microbiome. Science 2015,348(6237):1261359.
4�. Morris RM, Rappé MS, Connon SA, Vergin KL, Siebold WA, Carlson CA, Giovannoni SJ: SAR11 cladedominates ocean surface bacterioplankton communities. Nature 2002, 420(6917):806.
49. Dupont CL, Rusch DB, Yooseph S, Lombardo M-J, Richter RA, Valas R, Novotny M, Yee-Greenbaum J,Selengut JD, Haft DH: Genomic insights to SAR86, an abundant and uncultivated marine bacteriallineage. ISME J 2012, 6(6):1186.
50. Hosokawa T, Kikuchi Y, Nikoh N, Shimada M, Fukatsu T: Strict host-symbiont cospeciation andreductive genome evolution in insect gut bacteria. PLoS Biol 2006, 4(10):e337.
51. Rousk J, Bååth E, Brookes PC, Lauber CL, Lozupone C, Caporaso JG, Knight R, Fierer N: Soil bacterialand fungal communities across a pH gradient in an arable soil. ISME J 2010, 4(10):1340.
52. Nicholson JK, Holmes E, Kinross J, Burcelin R, Gibson G, Jia W, Pettersson S: Host-gut microbiotametabolic interactions. Science 2012, 336(6086):1262-1267.

Page 20/28
53. Sugita H, Miyajima C, Deguchi Y: The vitamin B12-producing ability of the intestinal micro�ora offreshwater �sh. Aquaculture 1991, 92:267-276.
54. Tsuchiya C, Sakata T, Sugita H: Novel ecological niche of Cetobacterium somerae, an anaerobicbacterium in the intestinal tracts of freshwater �sh. Lett Appl Microbiol 2008, 46(1):43-48.
55. Baldo L, Pretus JL, Riera JL, Musilova Z, Nyom ARB, Salzburger W: Convergence of gut microbiotasin the adaptive radiations of African cichlid �shes. ISME J 2017, 11(9):1975.
5�. De Filippo C, Cavalieri D, Di Paola M, Ramazzotti M, Poullet JB, Massart S, Collini S, Pieraccini G,Lionetti P: Impact of diet in shaping gut microbiota revealed by a comparative study in children fromEurope and rural Africa. Proc Natl Acad Sci USA 2010, 107(33):14691-14696.
57. David LA, Maurice CF, Carmody RN, Gootenberg DB, Button JE, Wolfe BE, Ling AV, Devlin AS, Varma Y,Fischbach MA: Diet rapidly and reproducibly alters the human gut microbiome. Nature 2014,505(7484):559.
5�. Xue Z, Zhang W, Wang L, Hou R, Zhang M, Fei L, Zhang X, Huang H, Bridgewater LC, Jiang Y: Thebamboo-eating giant panda harbors a carnivore-like gut microbiota, with excessive seasonalvariations. MBio 2015, 6(3):e00022-00015.
59. Liu H, Guo X, Gooneratne R, Lai R, Zeng C, Zhan F, Wang W: The gut microbiome and degradationenzyme activity of wild freshwater �shes in�uenced by their trophic levels. Sci Rep 2016, 6:24340.
�0. Nayak SK: Role of gastrointestinal microbiota in �sh. Aquac Res 2010, 41(11):1553-1573.
�1. Rawls JF, Mahowald MA, Ley RE, Gordon JI: Reciprocal gut microbiota transplants from zebra�shand mice to germ-free recipients reveal host habitat selection. Cell 2006, 127(2):423-433.
�2. Lim YW, Evangelista JS, Schmieder R, Bailey B, Haynes M, Furlan M, Maughan H, Edwards R, RohwerF, Conrad D: Clinical insights from metagenomic analysis of sputum samples from patients withcystic �brosis. J Clin Microbiol 2014, 52(2):425-437.
�3. Shin N-R, Lee J-C, Lee H-Y, Kim M-S, Whon TW, Lee M-S, Bae J-W: An increase in the Akkermansiaspp. population induced by metformin treatment improves glucose homeostasis in diet-inducedobese mice. Gut 2014, 63(5):727-735.
�4. Ivanova NV, Zemlak TS, Hanner RH, Hebert PD: Universal primer cocktails for �sh DNA barcoding.Mol Ecol Notes 2007, 7(4):544-548.
�5. Johnson M, Zaretskaya I, Raytselis Y, Merezhuk Y, McGinnis S, Madden TL: NCBI BLAST: a betterweb interface. Nucleic Acids Res 2008, 36(suppl 2):W5-W9.
��. Tamura K, Stecher G, Peterson D, Filipski A, Kumar S: MEGA6: molecular evolutionary geneticsanalysis version 6.0. Mol Biol Evol 2013, 30(12):2725-2729.
�7. Thompson JD, Higgins DG, Gibson TJ: CLUSTAL W: improving the sensitivity of progressive multiplesequence alignment through sequence weighting, position-speci�c gap penalties and weight matrixchoice. Nucleic Acids Res 1994, 22(22):4673-4680.
��. Felsenstein J: Evolutionary trees from DNA sequences: a maximum likelihood approach. J Mol Evol1981, 17(6):368-376.

Page 21/28
�9. Caporaso JG, Kuczynski J, Stombaugh J, Bittinger K, Bushman FD, Costello EK, Fierer N, Pena AG,Goodrich JK, Gordon JI et al: QIIME allows analysis of high-throughput community sequencing data.Nature methods 2010, 7(5):335-336.
70. Reeder J, Knight R: Rapidly denoising pyrosequencing amplicon reads by exploiting rank-abundancedistributions. Nature methods 2010, 7(9):668-669.
71. Edgar RC: Search and clustering orders of magnitude faster than BLAST. Bioinformatics 2010,26(19):2460-2461.
72. Rideout JR, He Y, Navas-Molina JA, Walters WA, Ursell LK, Gibbons SM, Chase J, McDonald D,Gonzalez A, Robbins-Pianka A: Subsampled open-reference clustering creates consistent,comprehensive OTU de�nitions and scales to billions of sequences. PeerJ 2014, 2:e545.
73. Caporaso JG, Bittinger K, Bushman FD, DeSantis TZ, Andersen GL, Knight R: PyNAST: a �exible toolfor aligning sequences to a template alignment. Bioinformatics 2010, 26(2):266-267.
74. Price MN, Dehal PS, Arkin AP: FastTree: computing large minimum evolution trees with pro�lesinstead of a distance matrix. Mol Biol Evol 2009, 26(7):1641-1650.
75. McDonald D, Clemente JC, Kuczynski J, Rideout JR, Stombaugh J, Wendel D, Wilke A, Huse S,Hufnagle J, Meyer F: The Biological Observation Matrix (BIOM) format or: how I learned to stopworrying and love the ome-ome. GigaScience 2012, 1(1):7.
7�. DeSantis TZ, Hugenholtz P, Larsen N, Rojas M, Brodie EL, Keller K, Huber T, Dalevi D, Hu P, AndersenGL: Greengenes, a chimera-checked 16S rRNA gene database and workbench compatible with ARB.Appl Environ Microbiol 2006, 72(7):5069-5072.
77. Kanehisa M, Goto S: KEGG: kyoto encyclopedia of genes and genomes. Nucleic Acids Res 2000,28(1):27-30.
7�. Wheeler EL, Hong P, Mackie RI: Data from: Ecological drift and local exposures drive gastrointestinalbacterial community differences among Galápagos iguana populations. In.: Dryad Data Repository;2012.
79. Shannon P, Markiel A, Ozier O, Baliga NS, Wang JT, Ramage D, Amin N, Schwikowski B, Ideker T:Cytoscape: a software environment for integrated models of biomolecular interaction networks.Genome Res 2003, 13(11):2498-2504.
�0. Navas-Molina JA, Peralta-Sánchez JM, González A, McMurdie PJ, Vázquez-Baeza Y, Xu Z, Ursell LK,Lauber C, Zhou H, Song SJ: Advancing our understanding of the human microbiome using QIIME.Method Enzymol 2013, 531:371-444.
�1. Breiman L: Random forests. Mach Learn 2001, 45(1):5-32.
�2. Hall M, Frank E, Holmes G, Pfahringer B, Reutemann P, Witten IH: The WEKA data mining software: anupdate. ACM SIGKDD Explor Newslett 2009, 11(1):10-18.
�3. Segata N, Izard J, Waldron L, Gevers D, Miropolsky L, Garrett WS, Huttenhower C: Metagenomicbiomarker discovery and explanation. Genome Biol 2011, 12(6):R60.
Page 22/28
�4. Goecks J, Nekrutenko A, Taylor J: Galaxy: a comprehensive approach for supporting accessible,reproducible, and transparent computational research in the life sciences. Genome Biol 2010,11(8):R86.
Figures
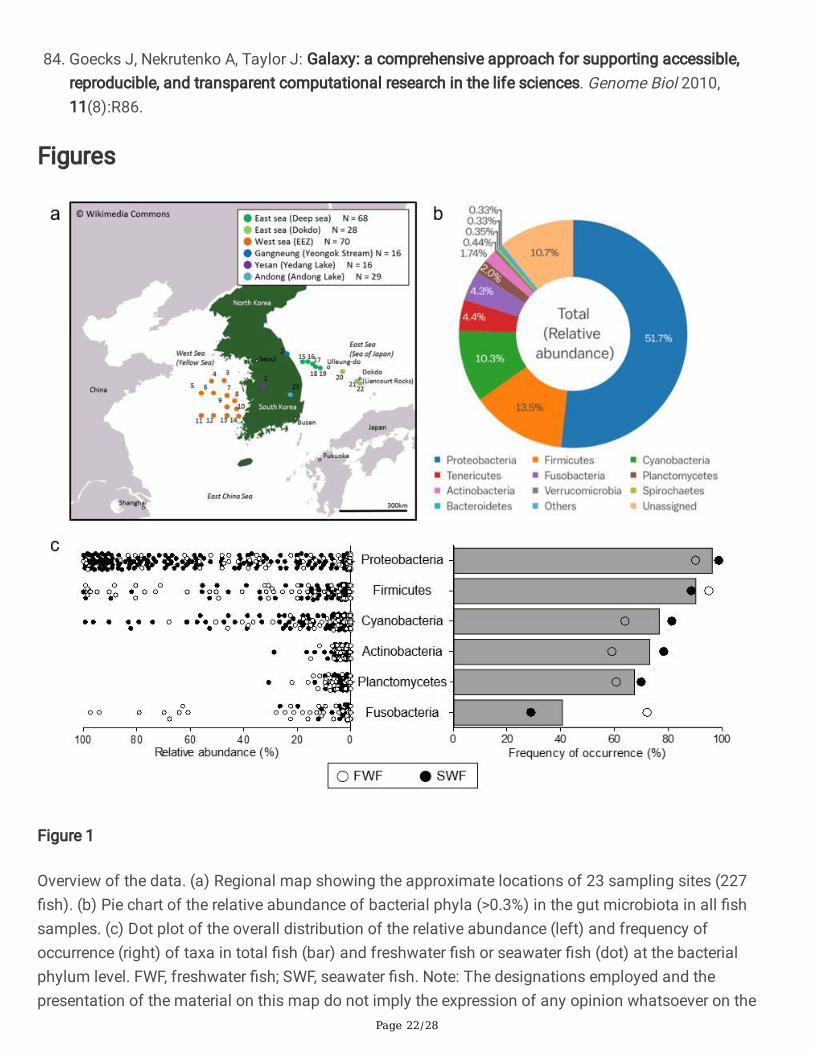
Figure 1
Overview of the data. (a) Regional map showing the approximate locations of 23 sampling sites (227�sh). (b) Pie chart of the relative abundance of bacterial phyla (>0.3%) in the gut microbiota in all �shsamples. (c) Dot plot of the overall distribution of the relative abundance (left) and frequency ofoccurrence (right) of taxa in total �sh (bar) and freshwater �sh or seawater �sh (dot) at the bacterialphylum level. FWF, freshwater �sh; SWF, seawater �sh. Note: The designations employed and thepresentation of the material on this map do not imply the expression of any opinion whatsoever on the
Page 23/28
part of Research Square concerning the legal status of any country, territory, city or area or of itsauthorities, or concerning the delimitation of its frontiers or boundaries. This map has been provided bythe authors.
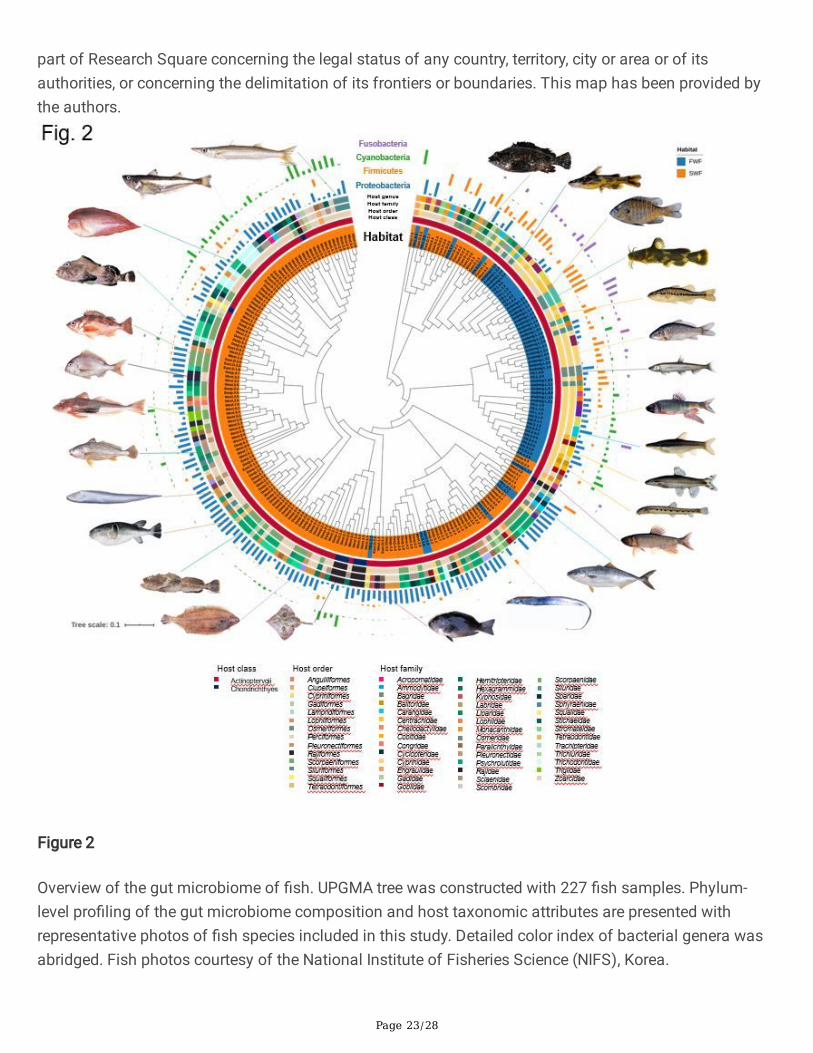
Figure 2
Overview of the gut microbiome of �sh. UPGMA tree was constructed with 227 �sh samples. Phylum-level pro�ling of the gut microbiome composition and host taxonomic attributes are presented withrepresentative photos of �sh species included in this study. Detailed color index of bacterial genera wasabridged. Fish photos courtesy of the National Institute of Fisheries Science (NIFS), Korea.
Page 24/28
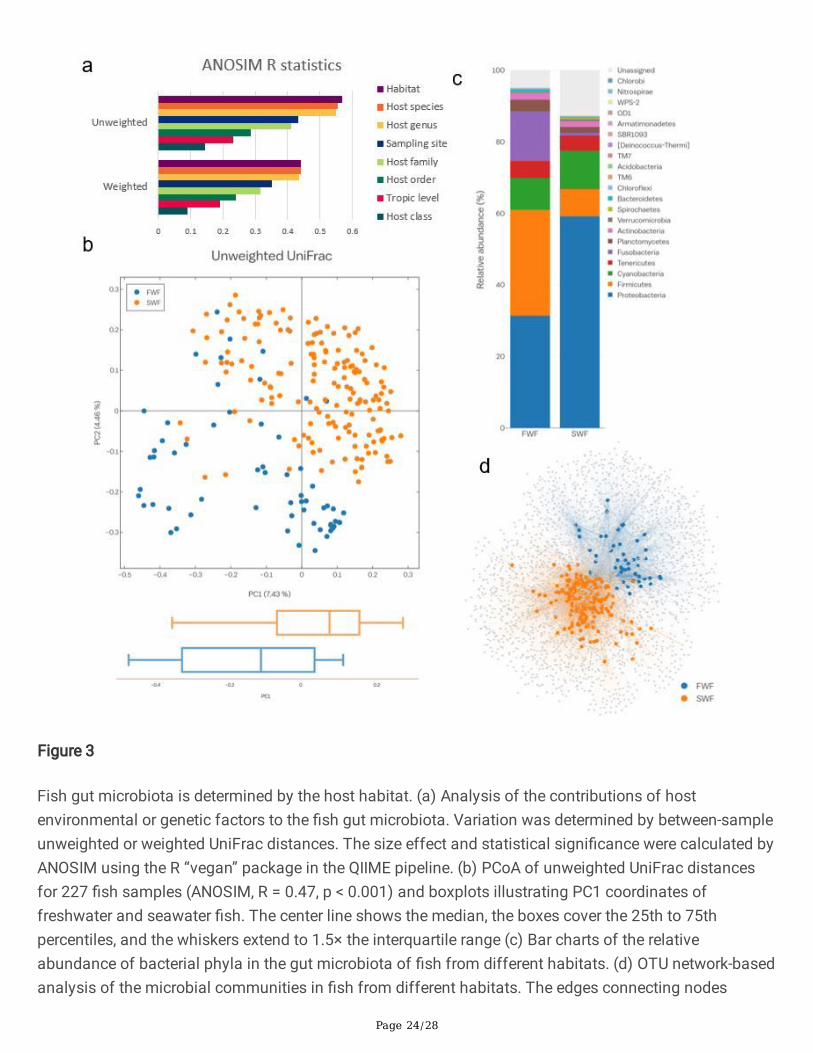
Figure 3
Fish gut microbiota is determined by the host habitat. (a) Analysis of the contributions of hostenvironmental or genetic factors to the �sh gut microbiota. Variation was determined by between-sampleunweighted or weighted UniFrac distances. The size effect and statistical signi�cance were calculated byANOSIM using the R “vegan” package in the QIIME pipeline. (b) PCoA of unweighted UniFrac distancesfor 227 �sh samples (ANOSIM, R = 0.47, p < 0.001) and boxplots illustrating PC1 coordinates offreshwater and seawater �sh. The center line shows the median, the boxes cover the 25th to 75thpercentiles, and the whiskers extend to 1.5× the interquartile range (c) Bar charts of the relativeabundance of bacterial phyla in the gut microbiota of �sh from different habitats. (d) OTU network-basedanalysis of the microbial communities in �sh from different habitats. The edges connecting nodes

Page 25/28
representing �sh samples (circles) to species-level OTUs in a particular sample are colored according tothe host habitat type (edge-weighted spring embedded model in Cytoscape v. 3.0.1). FWF, freshwater �sh;SWF, seawater �sh.
Figure 4
Limited evidence for an association between the �sh gut microbiota and host genetic factors. (a)Pairwise comparison of phylogenetic distances between the �sh gut microbiota based on weightedUniFrac distances and host genetic variation (CO1 gene). The relationship was not statistically signi�cant(p = 0.884 and σ = 0.003, Spearman correlation). (b) AUC of PRC for random forest classi�ers for variousdiscriminative factors of the taxonomic pro�les of the �sh gut.
Page 26/28
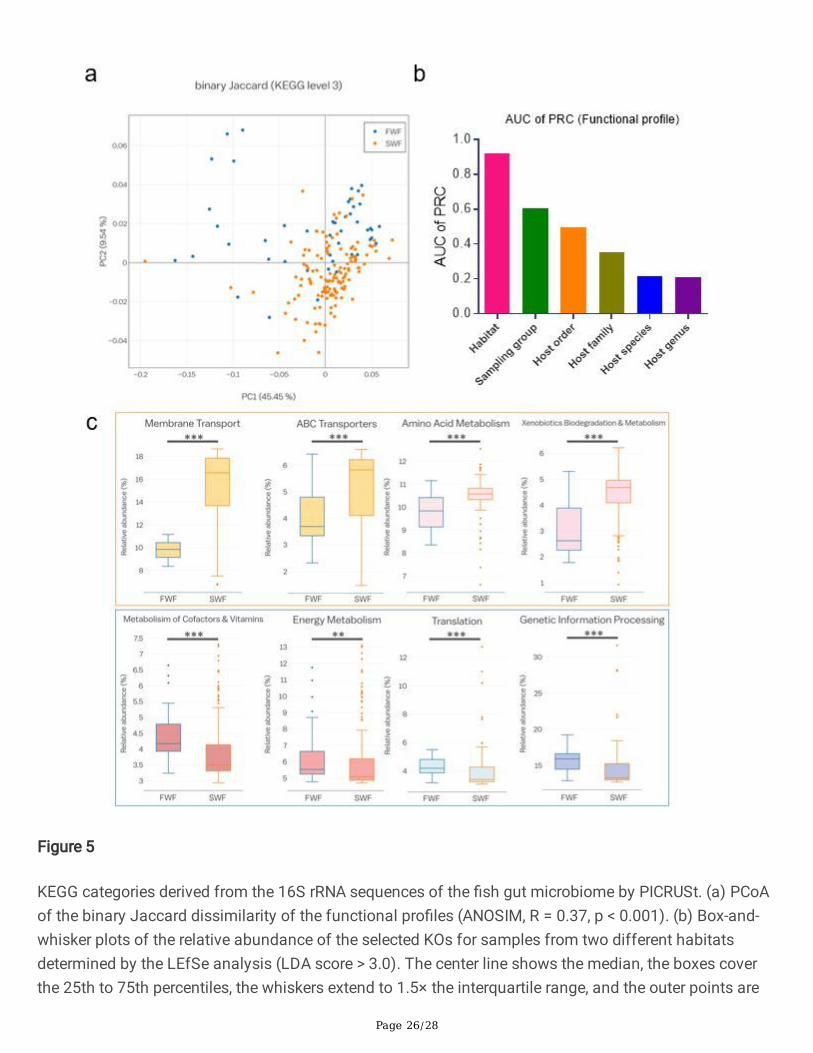
Figure 5
KEGG categories derived from the 16S rRNA sequences of the �sh gut microbiome by PICRUSt. (a) PCoAof the binary Jaccard dissimilarity of the functional pro�les (ANOSIM, R = 0.37, p < 0.001). (b) Box-and-whisker plots of the relative abundance of the selected KOs for samples from two different habitatsdetermined by the LEfSe analysis (LDA score > 3.0). The center line shows the median, the boxes coverthe 25th to 75th percentiles, the whiskers extend to 1.5× the interquartile range, and the outer points are
Page 27/28
outliers. Asterisks indicate signi�cant differences between freshwater and seawater �sh according to atwo-tailed Mann–Whitney U-test. **p < 0.01; ***p < 0.001. (c) Bar plot of the AUC of PRC for randomforest classi�ers for various discriminative factors of functional pro�les of the �sh gut. FWF, freshwater�sh; SWF, seawater �sh.
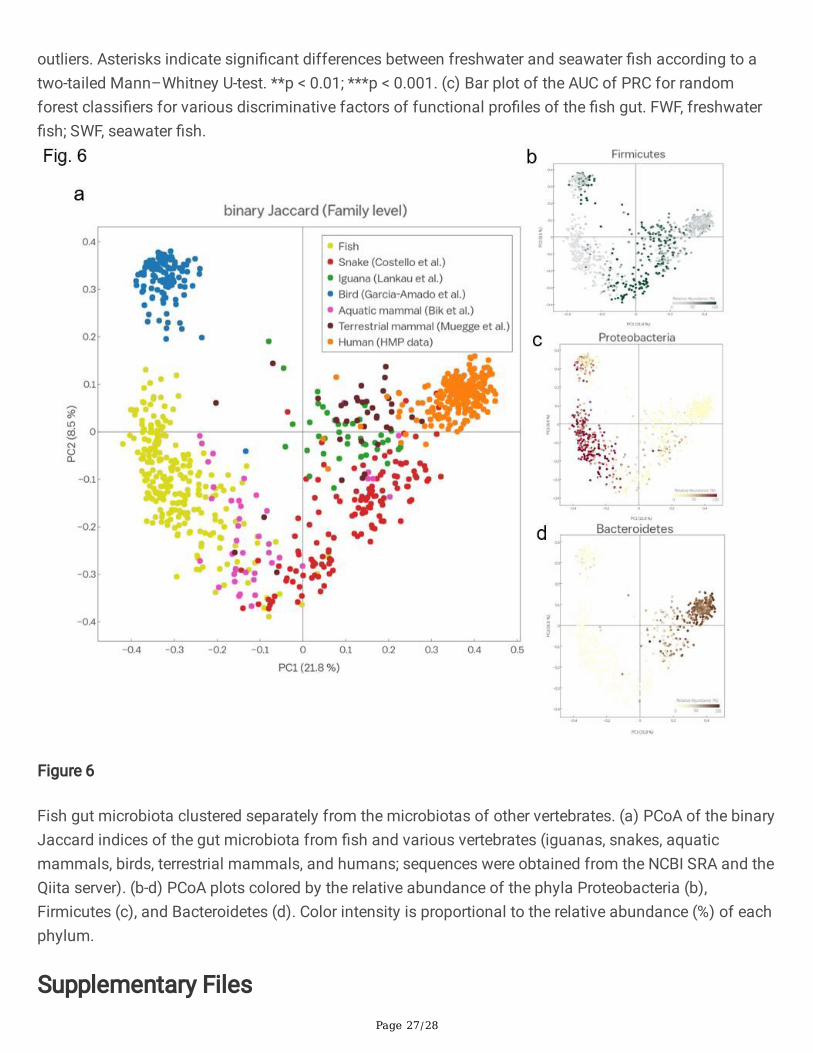
Figure 6
Fish gut microbiota clustered separately from the microbiotas of other vertebrates. (a) PCoA of the binaryJaccard indices of the gut microbiota from �sh and various vertebrates (iguanas, snakes, aquaticmammals, birds, terrestrial mammals, and humans; sequences were obtained from the NCBI SRA and theQiita server). (b-d) PCoA plots colored by the relative abundance of the phyla Proteobacteria (b),Firmicutes (c), and Bacteroidetes (d). Color intensity is proportional to the relative abundance (%) of eachphylum.
Supplementary Files

Page 28/28
This is a list of supplementary �les associated with this preprint. Click to download.
Additional�le1SupplementaryFigures2021.docx
Additional�le2SuppleTableS1Relativeabundance.xlsx
Additional�le3SuppleTableS2fxnpro�le.xlsx
Additional�le4SuppleTableS3betameta.xlsx
Additional�le5SuppleTableS4blastresults.xlsx
Additional�le6SuppleTableS5samplingsite.xlsx
Additional�le7SuppleTableS6collected�sh.xlsx
Additional�le8SuppleMethodscript.txt