Embed Size (px)
Citation preview
SAP Benchmarking for Capital Project and
Portfolio Management
Horst Hönig
March 2012
© 2012 SAP AG. All rights reserved. 2
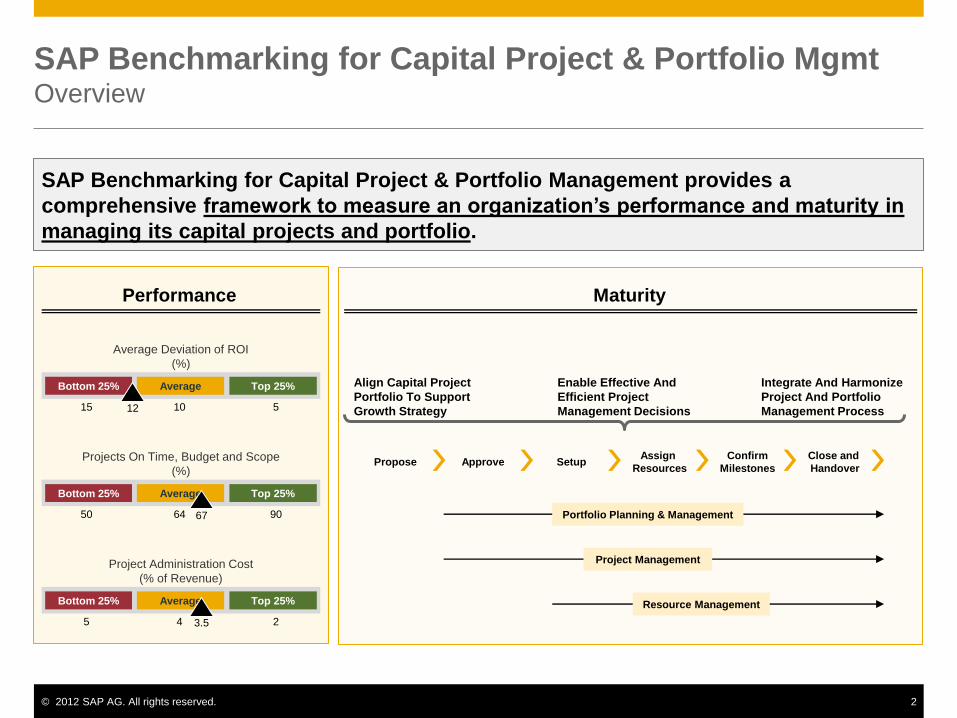
SAP Benchmarking for Capital Project & Portfolio Mgmt Overview
SAP Benchmarking for Capital Project & Portfolio Management provides a
comprehensive framework to measure an organization’s performance and maturity in
managing its capital projects and portfolio.
Average Deviation of ROI
(%)
Bottom 25% Average Top 25%
5 10 12 15
Projects On Time, Budget and Scope
(%)
Bottom 25% Average Top 25%
90 64 67 50
Project Administration Cost
(% of Revenue)
Bottom 25% Average Top 25%
2 4 3.5 5
Performance
Align Capital Project
Portfolio To Support
Growth Strategy
Integrate And Harmonize
Project And Portfolio
Management Process
Enable Effective And
Efficient Project
Management Decisions
Propose Approve Setup Assign
Resources
Confirm
Milestones
Close and
Handover
Project Management
Resource Management
Maturity
Portfolio Planning & Management
© 2012 SAP AG. All rights reserved. 3
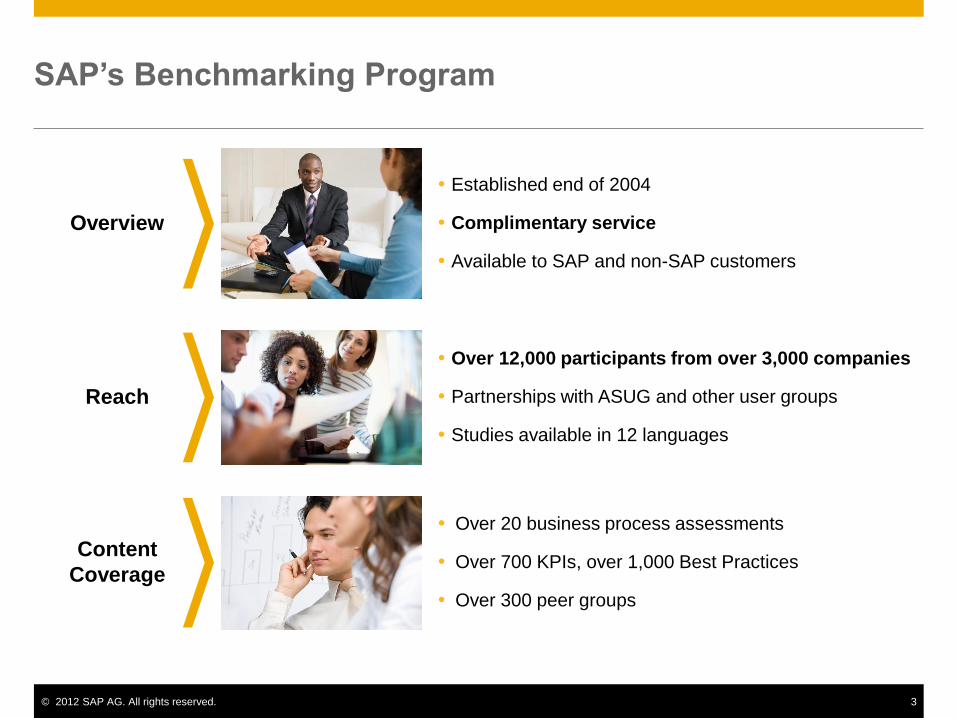
SAP’s Benchmarking Program
Established end of 2004
Complimentary service
Available to SAP and non-SAP customers
Overview
Reach
Over 12,000 participants from over 3,000 companies
Partnerships with ASUG and other user groups
Studies available in 12 languages
Content
Coverage
Over 20 business process assessments
Over 700 KPIs, over 1,000 Best Practices
Over 300 peer groups
© 2012 SAP AG. All rights reserved. 4
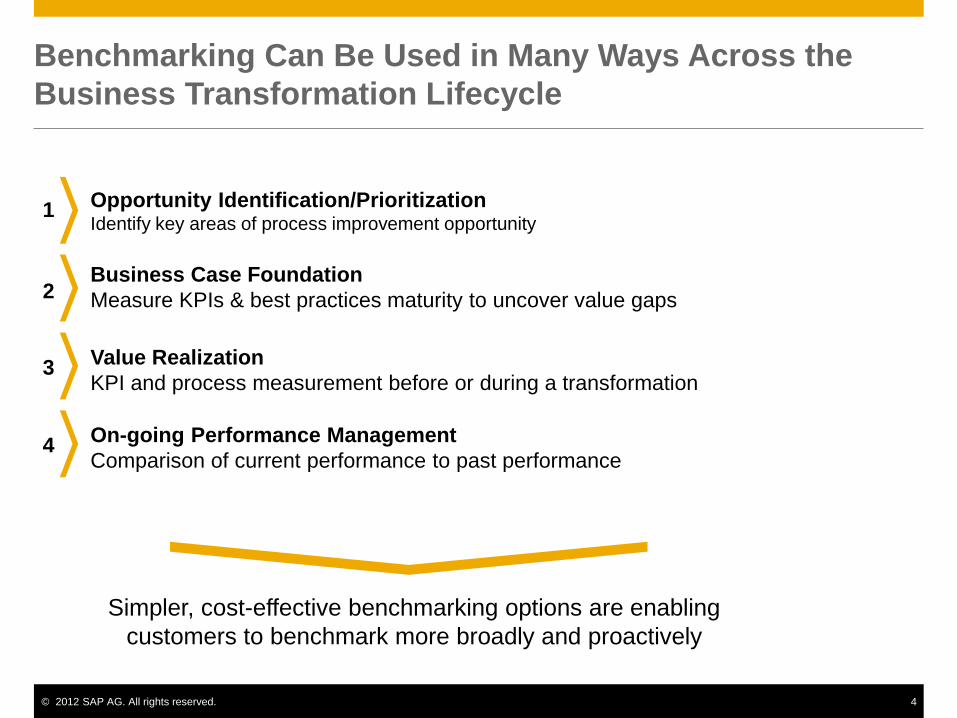
Benchmarking Can Be Used in Many Ways Across the
Business Transformation Lifecycle
Simpler, cost-effective benchmarking options are enabling
customers to benchmark more broadly and proactively
Opportunity Identification/Prioritization Identify key areas of process improvement opportunity
1
Business Case Foundation
Measure KPIs & best practices maturity to uncover value gaps 2
Value Realization
KPI and process measurement before or during a transformation 3
On-going Performance Management
Comparison of current performance to past performance 4
Capital Project and Portfolio Management
Benchmarking Results - Sample Report
© 2012 SAP AG. All rights reserved. 6
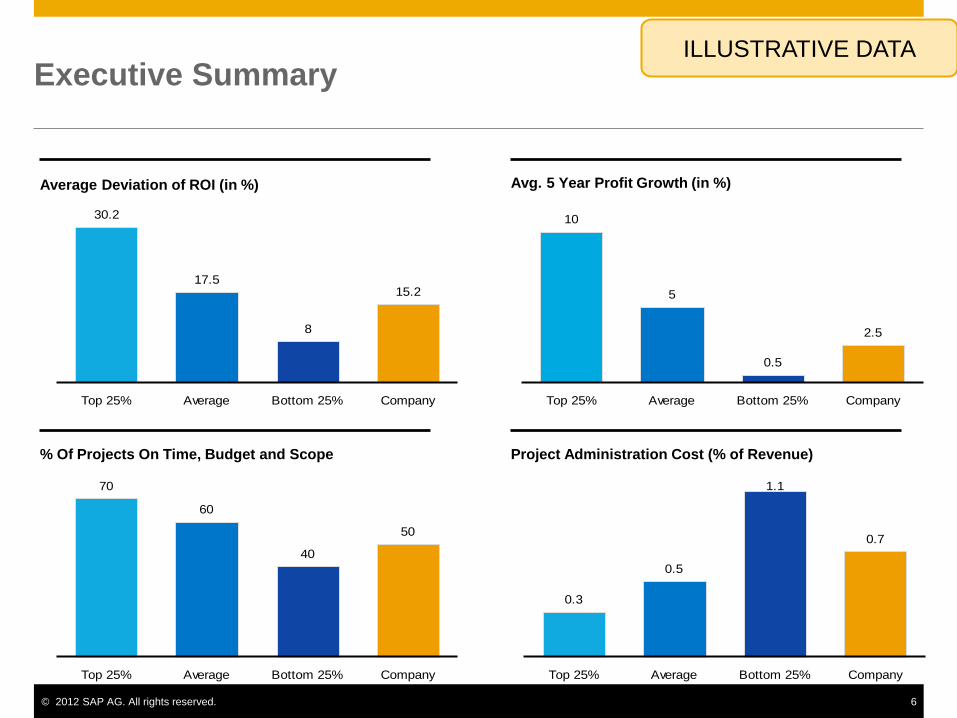
Executive Summary
30.2
17.5
8
15.2
Top 25% Average Bottom 25% Company
10
5
0.5
2.5
Top 25% Average Bottom 25% Company
70
60
40
50
Top 25% Average Bottom 25% Company
0.3
0.5
1.1
0.7
Top 25% Average Bottom 25% Company
Average Deviation of ROI (in %) Avg. 5 Year Profit Growth (in %)
% Of Projects On Time, Budget and Scope Project Administration Cost (% of Revenue)
ILLUSTRATIVE DATA
© 2012 SAP AG. All rights reserved. 7
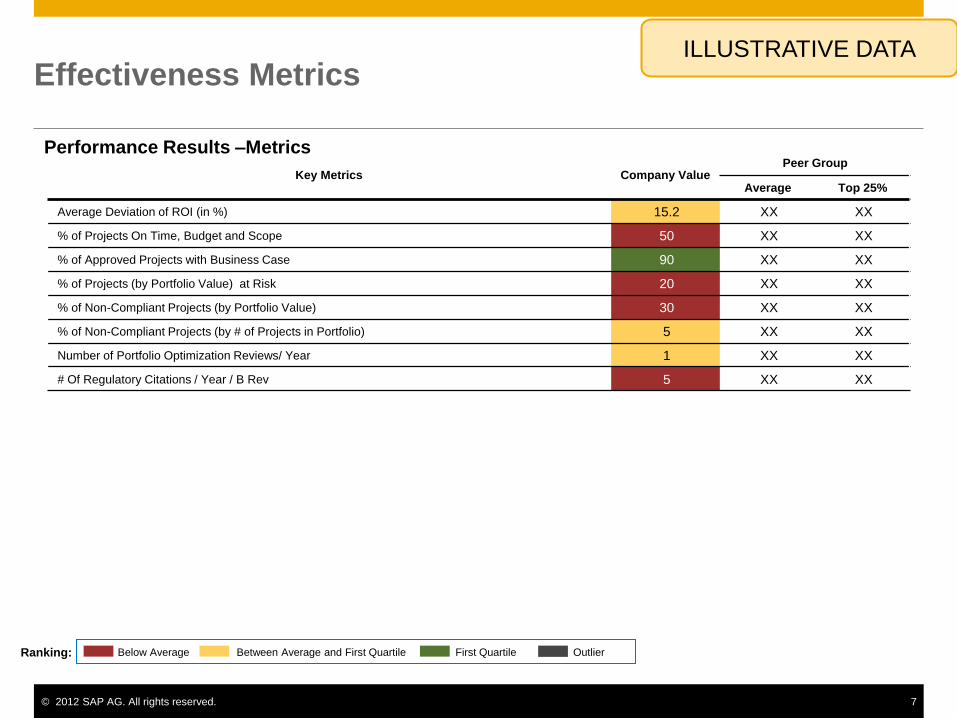
Effectiveness Metrics
Key Metrics Company Value Peer Group
Average Top 25%
Average Deviation of ROI (in %) 15.2 XX XX
% of Projects On Time, Budget and Scope 50 XX XX
% of Approved Projects with Business Case 90 XX XX
% of Projects (by Portfolio Value) at Risk 20 XX XX
% of Non-Compliant Projects (by Portfolio Value) 30 XX XX
% of Non-Compliant Projects (by # of Projects in Portfolio) 5 XX XX
Number of Portfolio Optimization Reviews/ Year 1 XX XX
# Of Regulatory Citations / Year / B Rev 5 XX XX
Performance Results –Metrics
First Quartile Between Average and First Quartile Below Average Outlier Ranking:
ILLUSTRATIVE DATA
© 2012 SAP AG. All rights reserved. 8
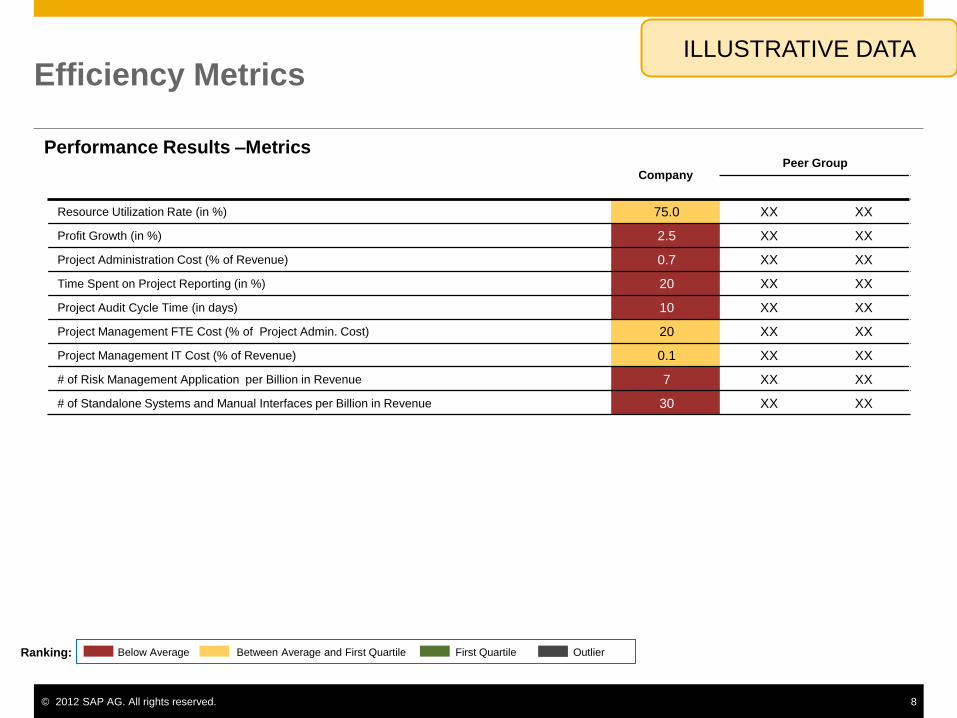
Efficiency Metrics
Company Peer Group
Resource Utilization Rate (in %) 75.0 XX XX
Profit Growth (in %) 2.5 XX XX
Project Administration Cost (% of Revenue) 0.7 XX XX
Time Spent on Project Reporting (in %) 20 XX XX
Project Audit Cycle Time (in days) 10 XX XX
Project Management FTE Cost (% of Project Admin. Cost) 20 XX XX
Project Management IT Cost (% of Revenue) 0.1 XX XX
# of Risk Management Application per Billion in Revenue 7 XX XX
# of Standalone Systems and Manual Interfaces per Billion in Revenue 30 XX XX
Performance Results –Metrics
First Quartile Between Average and First Quartile Below Average Outlier Ranking:
ILLUSTRATIVE DATA
© 2012 SAP AG. All rights reserved. 9
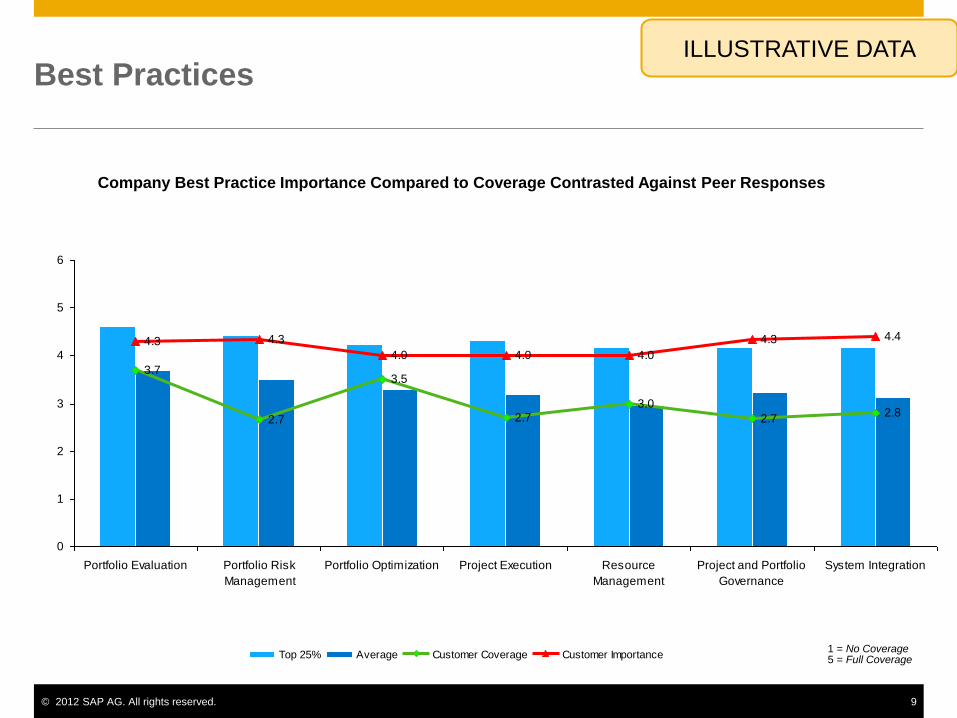
Best Practices
3.7
2.7
3.5
2.73.0
2.72.8
4.3 4.3
4.0 4.0 4.0
4.3 4.4
0
1
2
3
4
5
6
Portfolio Evaluation Portfolio Risk
Management
Portfolio Optimization Project Execution Resource
Management
Project and Portfolio
Governance
System Integration
Top 25% Average Customer Coverage Customer Importance
Company Best Practice Importance Compared to Coverage Contrasted Against Peer Responses
1 = No Coverage 5 = Full Coverage
ILLUSTRATIVE DATA
© 2012 SAP AG. All rights reserved. 10
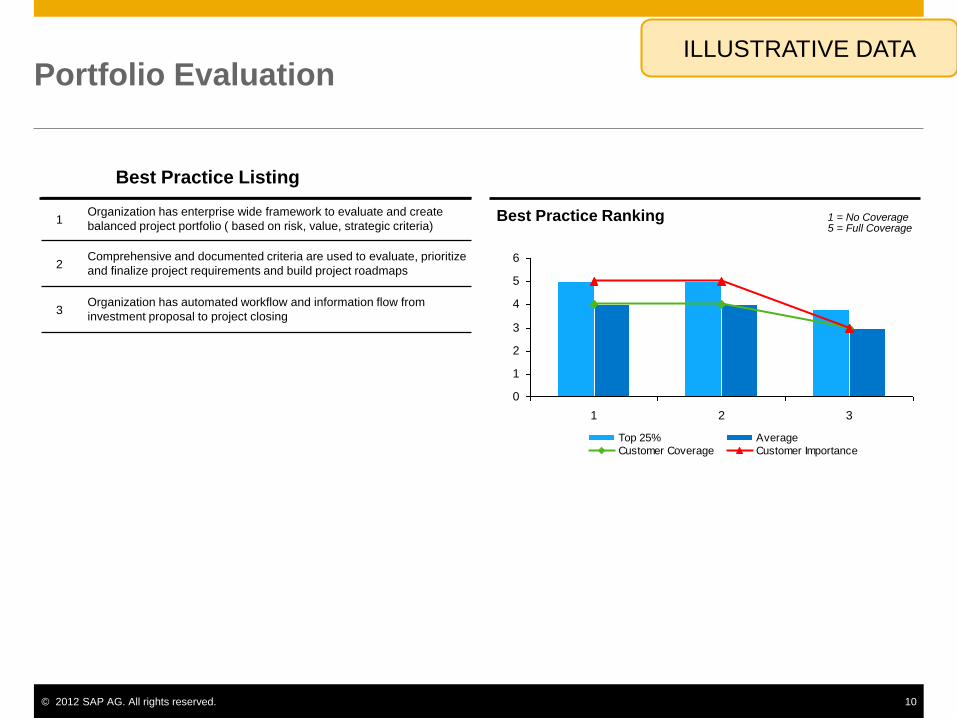
Portfolio Evaluation
0
1
2
3
4
5
6
1 2 3
Top 25% Average
Customer Coverage Customer Importance
Best Practice Ranking 1 Organization has enterprise wide framework to evaluate and create
balanced project portfolio ( based on risk, value, strategic criteria)
2 Comprehensive and documented criteria are used to evaluate, prioritize
and finalize project requirements and build project roadmaps
3 Organization has automated workflow and information flow from
investment proposal to project closing
Best Practice Listing
1 = No Coverage 5 = Full Coverage
ILLUSTRATIVE DATA
© 2012 SAP AG. All rights reserved. 11
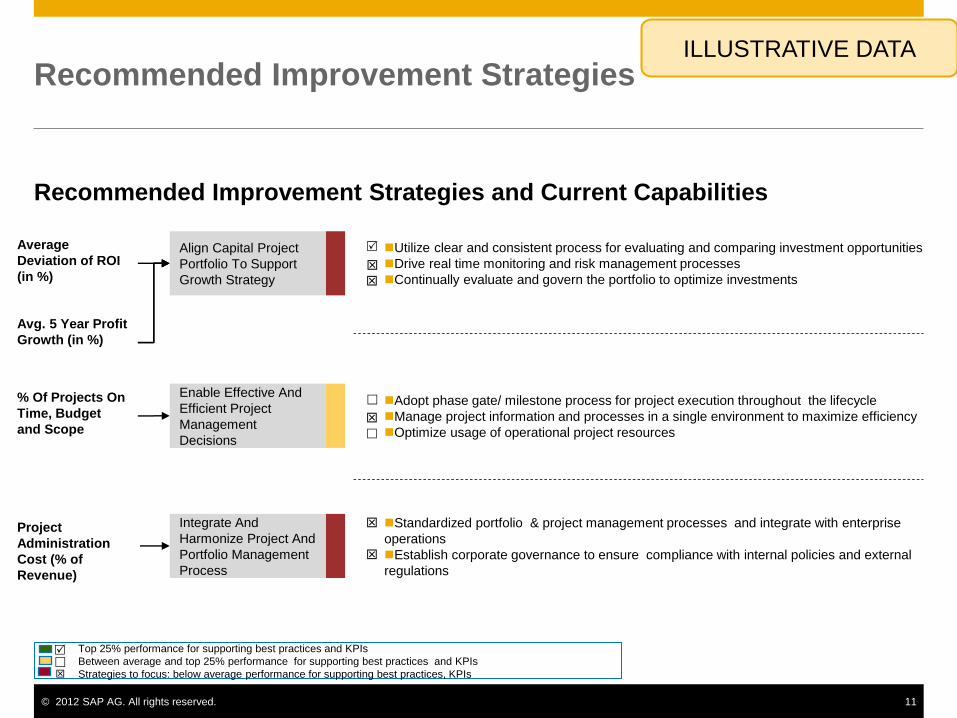
Recommended Improvement Strategies
Recommended Improvement Strategies and Current Capabilities
Average
Deviation of ROI
(in %)
% Of Projects On
Time, Budget
and Scope
Avg. 5 Year Profit
Growth (in %)
Project
Administration
Cost (% of
Revenue)
Utilize clear and consistent process for evaluating and comparing investment opportunities
Drive real time monitoring and risk management processes
Continually evaluate and govern the portfolio to optimize investments
Adopt phase gate/ milestone process for project execution throughout the lifecycle
Manage project information and processes in a single environment to maximize efficiency
Optimize usage of operational project resources
Standardized portfolio & project management processes and integrate with enterprise
operations
Establish corporate governance to ensure compliance with internal policies and external
regulations
R
T
Top 25% performance for supporting best practices and KPIs
Between average and top 25% performance for supporting best practices and KPIs
Strategies to focus: below average performance for supporting best practices, KPIs
Align Capital Project
Portfolio To Support
Growth Strategy
Enable Effective And
Efficient Project
Management
Decisions
Integrate And
Harmonize Project And
Portfolio Management
Process
R
T
T
T
T
T
ILLUSTRATIVE DATA
Benchmarking Process and Other Surveys
© 2012 SAP AG. All rights reserved. 13
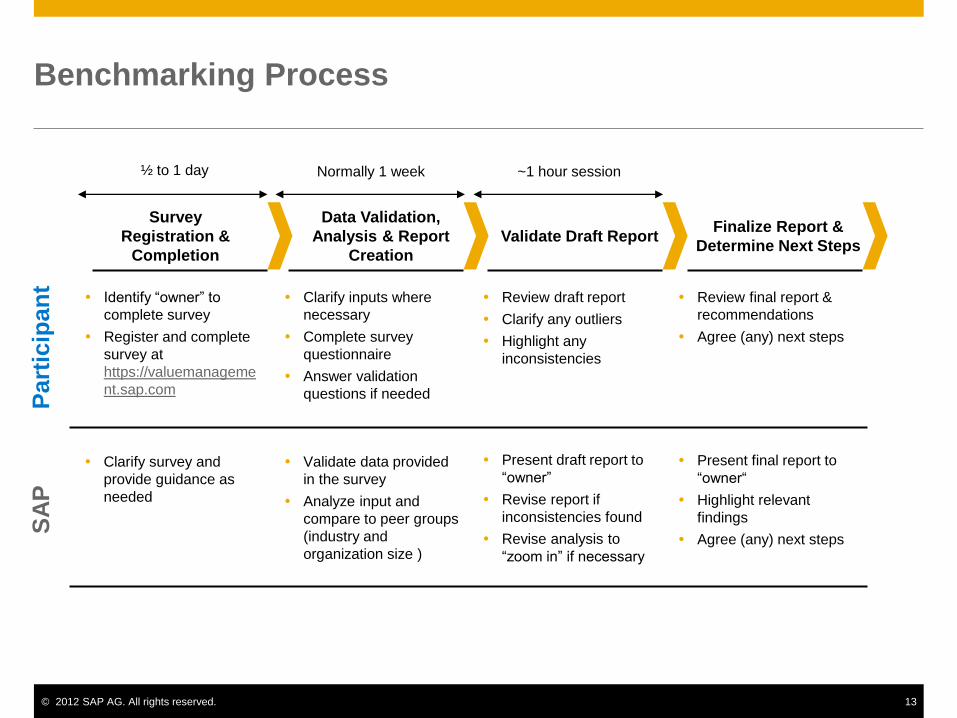
Benchmarking Process
Present draft report to
“owner”
Revise report if
inconsistencies found
Revise analysis to
“zoom in” if necessary
Present final report to
“owner“
Highlight relevant
findings
Agree (any) next steps
Identify “owner” to
complete survey
Register and complete
survey at
https://valuemanageme
nt.sap.com
Validate data provided
in the survey
Analyze input and
compare to peer groups
(industry and
organization size )
Clarify survey and
provide guidance as
needed
Part
icip
an
t S
AP
Clarify inputs where
necessary
Complete survey
questionnaire
Answer validation
questions if needed
Review draft report
Clarify any outliers
Highlight any
inconsistencies
Review final report &
recommendations
Agree (any) next steps
½ to 1 day Normally 1 week ~1 hour session
Survey
Registration &
Completion
Data Validation,
Analysis & Report
Creation
Validate Draft Report Finalize Report &
Determine Next Steps
© 2012 SAP AG. All rights reserved. 14
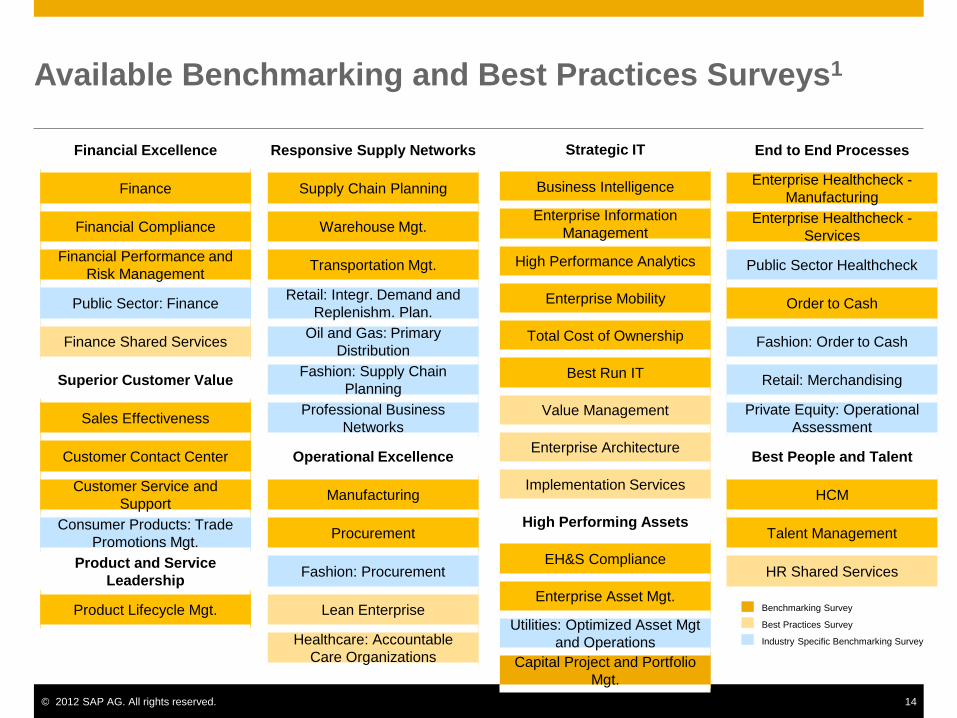
Available Benchmarking and Best Practices Surveys1
Financial Excellence
Finance
Financial Compliance
Financial Performance and
Risk Management
Public Sector: Finance
Finance Shared Services
Superior Customer Value
Sales Effectiveness
Customer Contact Center
Customer Service and
Support
Consumer Products: Trade
Promotions Mgt.
Product and Service
Leadership
Product Lifecycle Mgt.
Responsive Supply Networks
Supply Chain Planning
Warehouse Mgt.
Transportation Mgt.
Retail: Integr. Demand and
Replenishm. Plan.
Oil and Gas: Primary
Distribution
Fashion: Supply Chain
Planning
Professional Business
Networks
Operational Excellence
Manufacturing
Procurement
Fashion: Procurement
Lean Enterprise
Healthcare: Accountable
Care Organizations
End to End Processes
Enterprise Healthcheck -
Manufacturing
Enterprise Healthcheck -
Services
Public Sector Healthcheck
Order to Cash
Fashion: Order to Cash
Retail: Merchandising
Private Equity: Operational
Assessment
Best People and Talent
HCM
Talent Management
HR Shared Services
Strategic IT
Business Intelligence
Enterprise Information
Management
High Performance Analytics
Enterprise Mobility
Total Cost of Ownership
Best Run IT
Value Management
Enterprise Architecture
Implementation Services
High Performing Assets
EH&S Compliance
Enterprise Asset Mgt.
Utilities: Optimized Asset Mgt
and Operations
Capital Project and Portfolio
Mgt.
Benchmarking Survey
Best Practices Survey
Industry Specific Benchmarking Survey