Embed Size (px)
Citation preview
Energy Efficient Computing: From Bits toEnergy Efficient Computing: From Bits to Buildings
Horst D. SimonLawrence Berkeley National LaboratoryLawrence Berkeley National Laboratory
and EECS Dept., UC [email protected]
The Salishan Conference on High-Speed ComputingApril 29, 2009
AcknowledgementsA l b f i di id l h t ib t d tA large number of individuals have contributed to energy efficiency in computing at Berkeley Lab, UC Berkeley, and to this presentation:
David Bailey (CRD), Michael Banda (CRD), Michael Bennett (ITD), Shoaib Kamil (CRD), Jonathan Koomey (Stanford), Randy Katz (EECS) T J Ki (EECS) Ch k M P l d (CRD) B(EECS), Tsu Jae King (EECS), Chuck McParland (CRD), Bruce Nordman (EETD), Lenny Oliker (CRD), Ekow Otoo (CRD), Vern Paxson(UCB/ICSI/CRD), Doron Rotem (CRD), Dale Sartor (EETD), John Shalf(NERSC), Erich Strohmaier (CRD), Bill Tschudi (EETD), Howard Walter (NERSC), Michael Wehner (CRD), Kathy Yelick (NERSC/CRD) … and many others
Almost all Berkeley resources about energy efficiency are available at htt // lbl /CS/ht l/ %20 ffi i t%20http://www.lbl.gov/CS/html/energy%20efficient%20computing.html
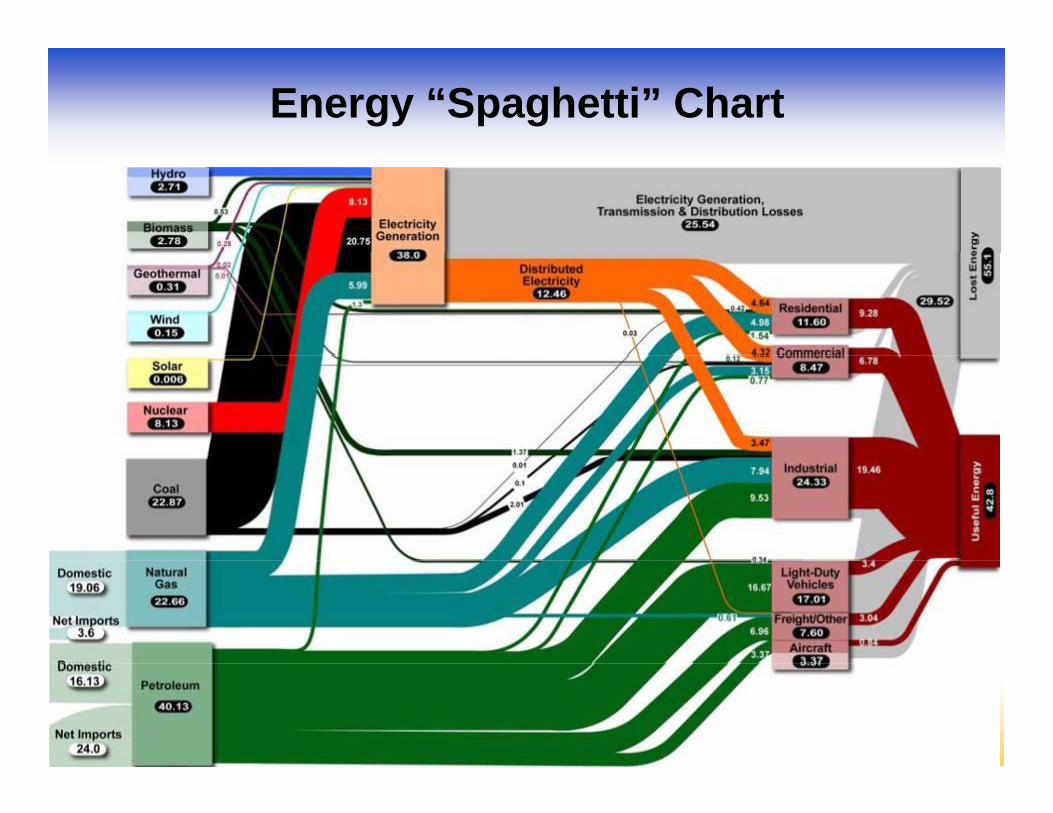
Energy “Spaghetti” Chart
10-8-2008 3
Power has become an industry-wide issue for computingp g
Two interrelated issues: Building and infrastructure
problem -- continued increaseproblem continued increase in demand for computing (“buildings”)
Computer technology problem -- no more power density
li (“bit ”)scaling (“bits”)
Why does saving energy matter?Why does saving energy matter?
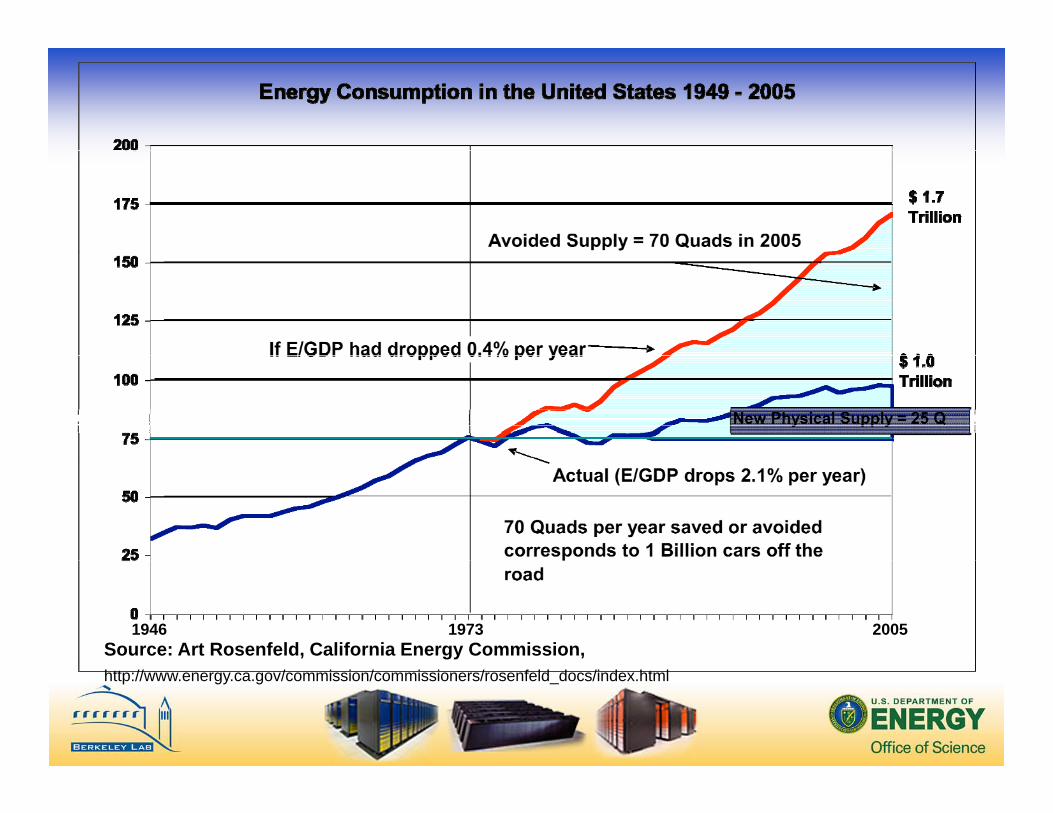
Source: Art Rosenfeld, California Energy Commission,1946 1973 2005
http://www.energy.ca.gov/commission/commissioners/rosenfeld_docs/index.html
An Honest Question?
Does the HPC community really care about reducing the carbon footprint?
NO!
HPC Interests
• Energy efficiency in computer rooms– Spend more resources on computingSpend more resources on computing
than on infrastructure• Energy efficient technologyEnergy efficient technology
– Maintain performance growth and get things done that could not be donethings done that could not be done before
Khazzoom-Brookes Postulate
• Energy efficiency at the micro-level leads to higher energy consumption g gy pat the macro-level– cheaper energy increases usecheaper energy increases use– increased energy efficiency leads to
economic growthg– increased efficiency in one bottleneck
resource increases use of companion technologies
• HPC follows Khazzoom-Brookes
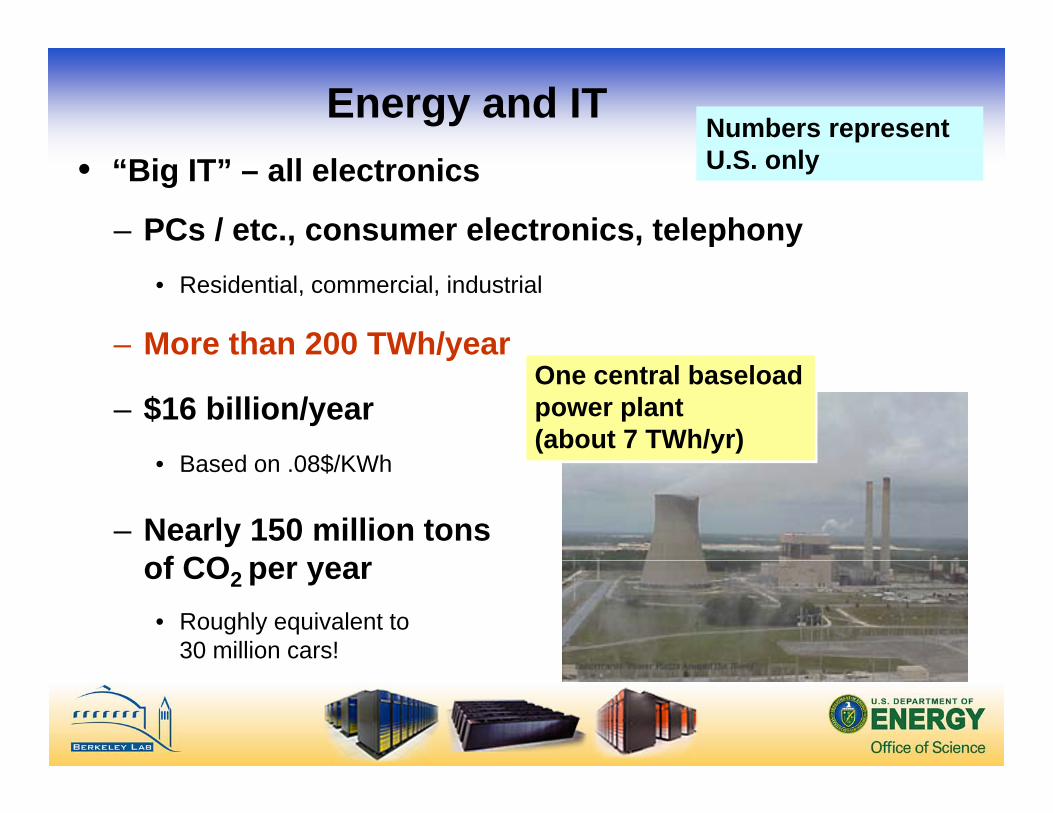
Energy and ITNumbers represent U S l• “Big IT” – all electronics
– PCs / etc., consumer electronics, telephony
U.S. only
• Residential, commercial, industrial
– More than 200 TWh/yeary
– $16 billion/yearB d 08$/KWh
One central baseload power plant (about 7 TWh/yr)
• Based on .08$/KWh
– Nearly 150 million tonsf COof CO2 per year
• Roughly equivalent to 30 million cars!
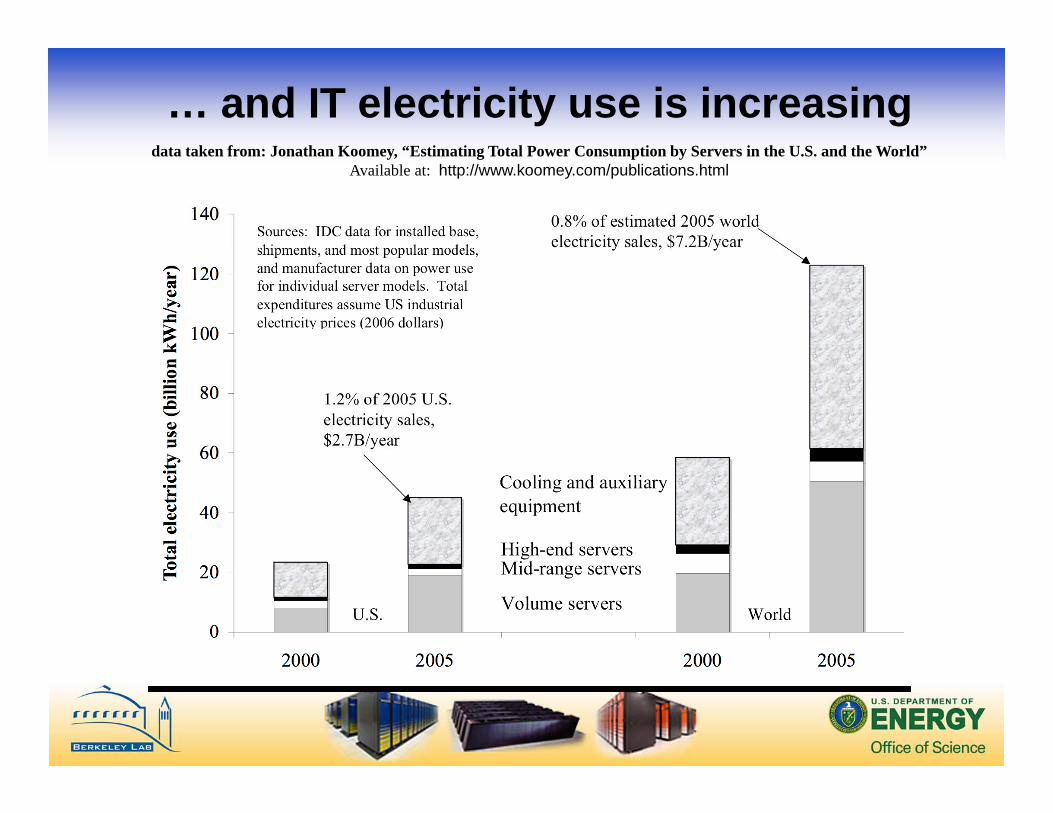
… and IT electricity use is increasingdata taken from: Jonathan Koomey “Estimating Total Power Consumption by Servers in the U S and the World”data taken from: Jonathan Koomey, “Estimating Total Power Consumption by Servers in the U.S. and the World”
Available at: http://www.koomey.com/publications.html
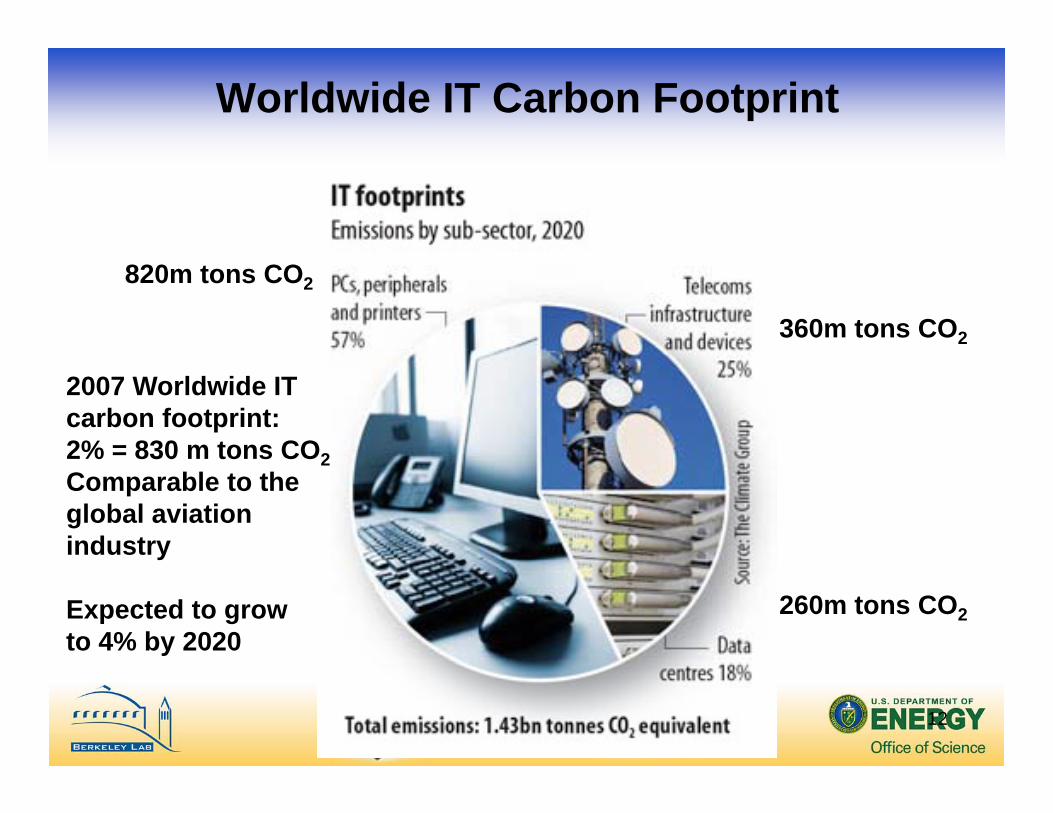
Worldwide IT Carbon Footprint
820m tons CO2
360m tons CO2
2007 Worldwide ITcarbon footprint:2% = 830 m tons CO22% 830 m tons CO2Comparable to theglobal aviation industry
260m tons CO2Expected to grow to 4% by 2020
12
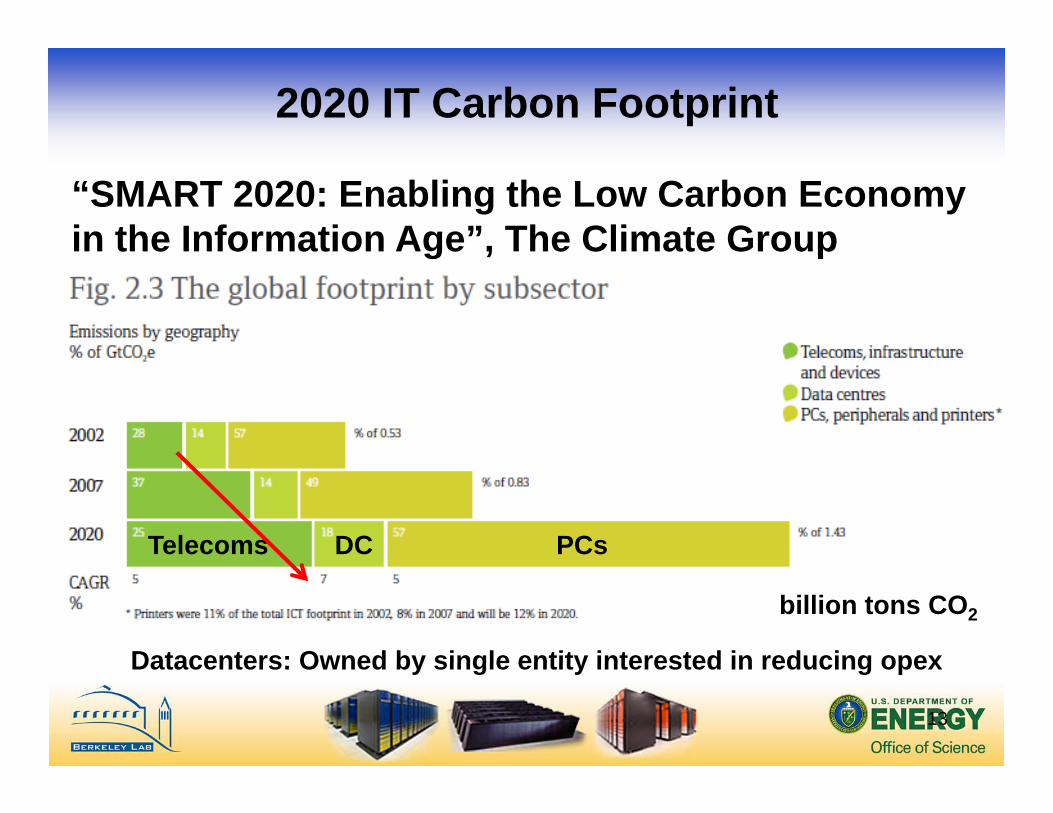
2020 IT Carbon Footprint
“SMART 2020: Enabling the Low Carbon Economy in the Information Age”, The Climate Groupg , p
USAChinaTelecoms DC PCs
Datacenters: Owned by single entity interested in reducing opex
billion tons CO2
13
Datacenters: Owned by single entity interested in reducing opex
Power has become an industry-wide issue for computingp g
Two interrelated issues: Building and infrastructure
problem -- continued increaseproblem continued increase in demand for computing (“buildings”)
Computer technology problem -- no more power density
li (“bit ”)scaling (“bits”)
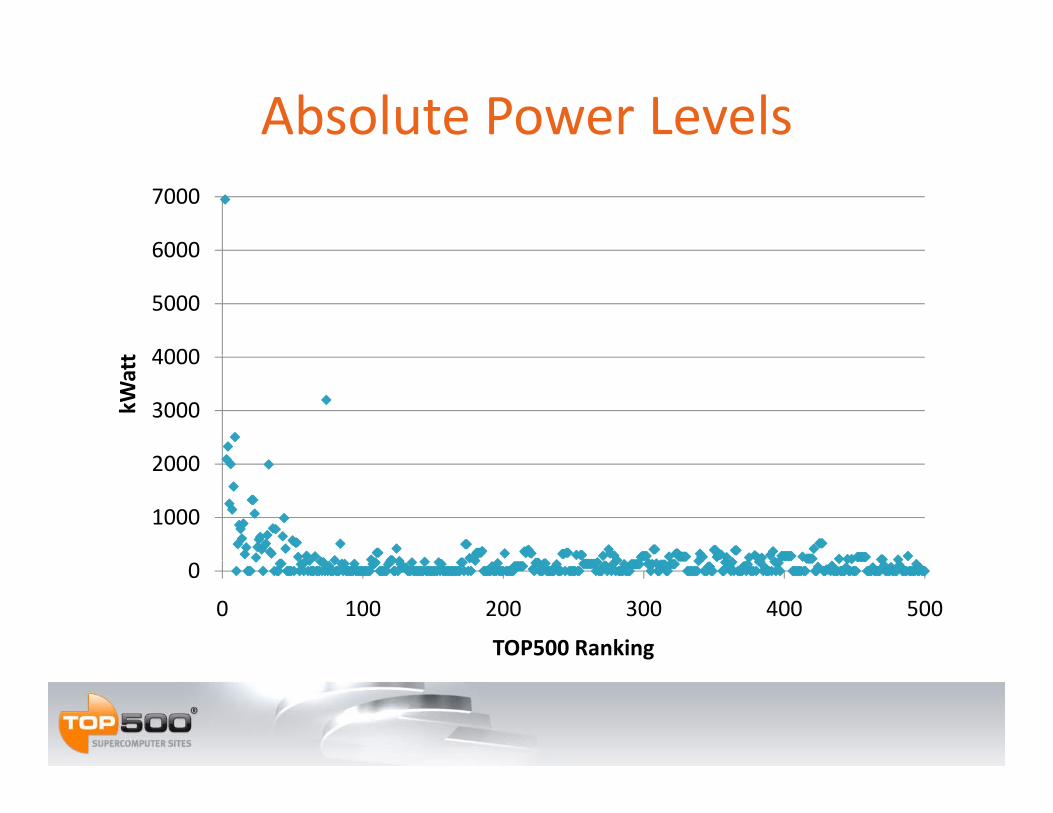
Absolute Power Levels
6000
7000
4000
5000
6000
t
2000
3000
4000
kWatt
1000
2000
0
0 100 200 300 400 500
TOP500 Ranking
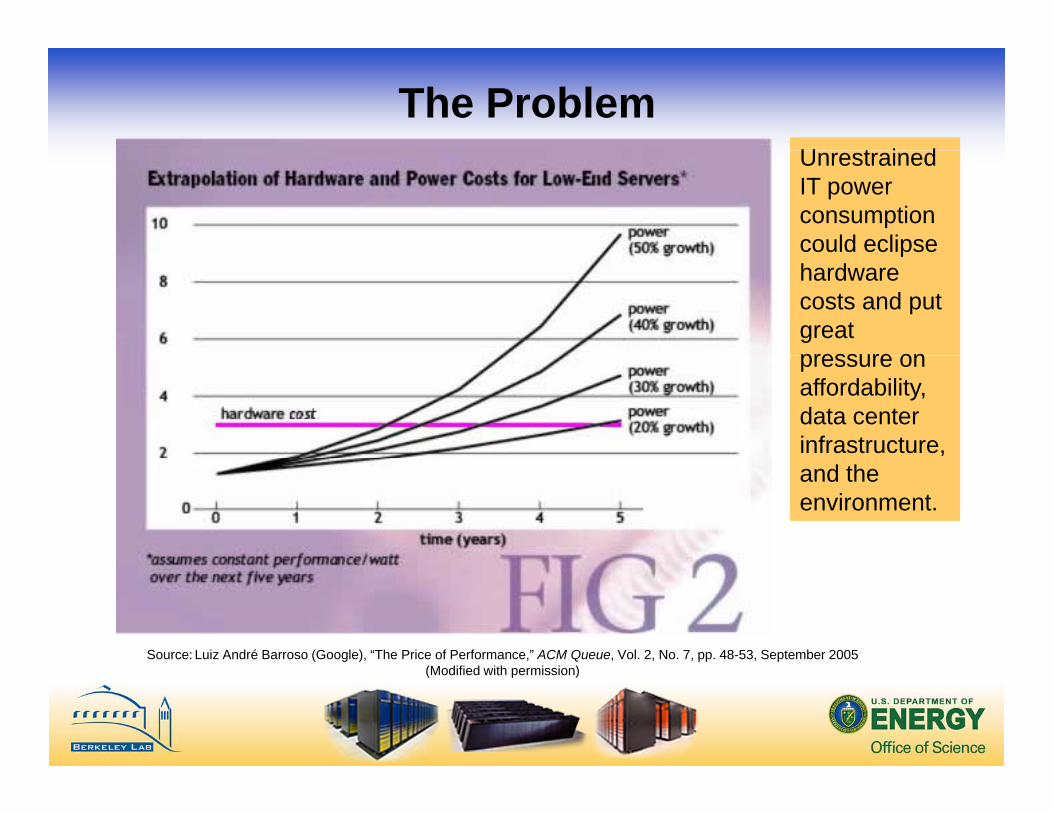
The ProblemU t i dUnrestrained IT power consumption could eclipse phardware costs and put great pressure onpressure on affordability, data center infrastructure, and the environment.
Source: Luiz André Barroso (Google), “The Price of Performance,” ACM Queue, Vol. 2, No. 7, pp. 48-53, September 2005 (Modified with permission)
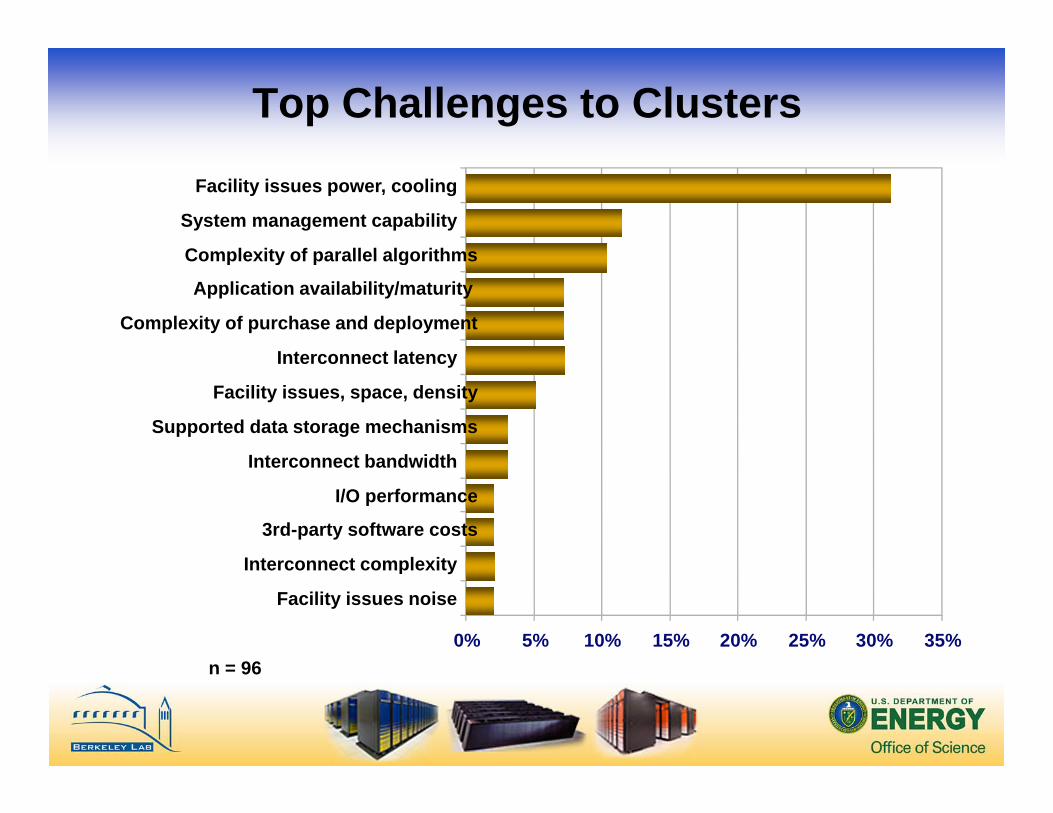
Top Challenges to Clusters
Complexity of parallel algorithms
System management capability
Facility issues power, cooling
Interconnect latency
Complexity of purchase and deployment
Application availability/maturity
Complexity of parallel algorithms
Interconnect bandwidth
Supported data storage mechanisms
Facility issues, space, density
Interconnect latency
Interconnect comple it
3rd-party software costs
I/O performance
Interconnect bandwidth
960% 5% 10% 15% 20% 25% 30% 35%
Facility issues noise
Interconnect complexity
n = 96
Responses
• Cloud• Containerized data centers• Large scale data “factories”Large scale data factories• Increased emphasis on computer
room and building efficiencyroom and building efficiency
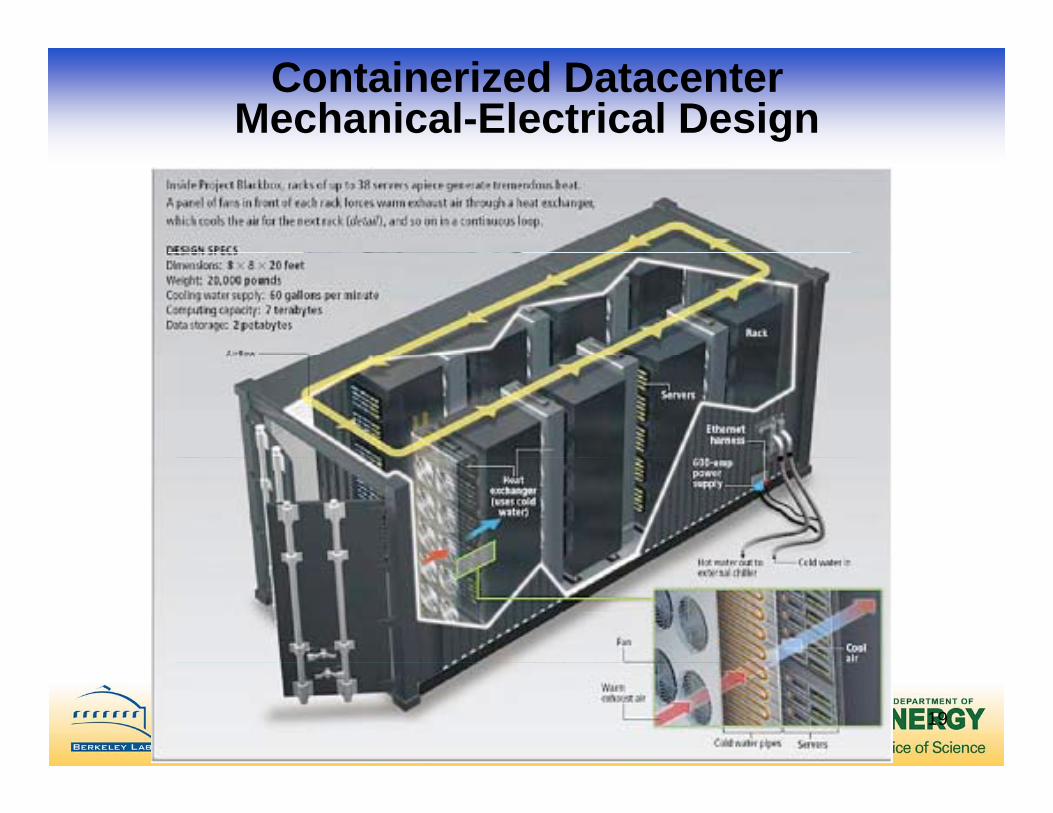
Containerized DatacenterMechanical-Electrical Design
19
Data Center Economic Reality (2006)• June 2006 - Google begins building a new data
center near the Columbia River on the border between Washington and Oregong g
– Because the location is “at the intersection of cheap electricity and readily accessible data networking”
“Hiding in Plain Sight, Google Seeks More Power”
• Microsoft and Yahoo are building big data centers
by John Markoff, NYT, June 14, 2006
Microsoft and Yahoo are building big data centers upstream in Wenatchee and Quincy, Wash.
– To keep up with Google, which means they need cheap electricity and readily accessible data networkingelectricity and readily accessible data networking
Source: New York Times, June 14, 2006
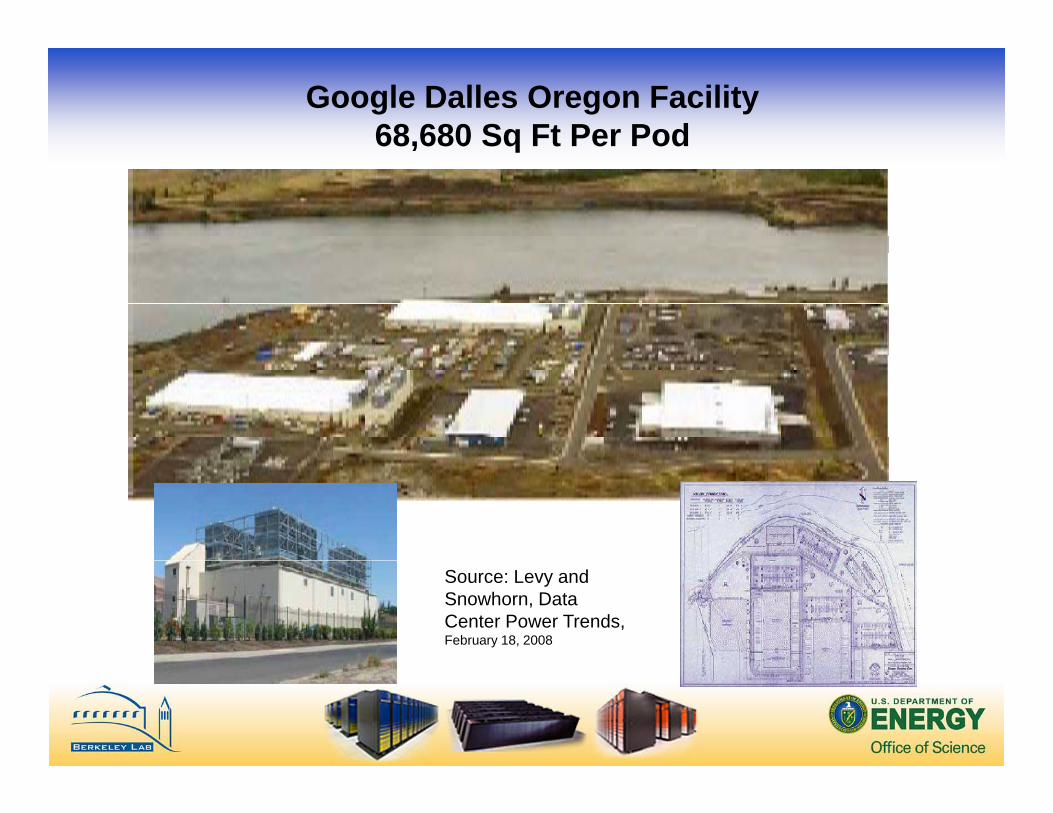
Google Dalles Oregon Facility68,680 Sq Ft Per Pod, q
Source: Levy and Snowhorn, Data Center Power Trends, February 18, 2008
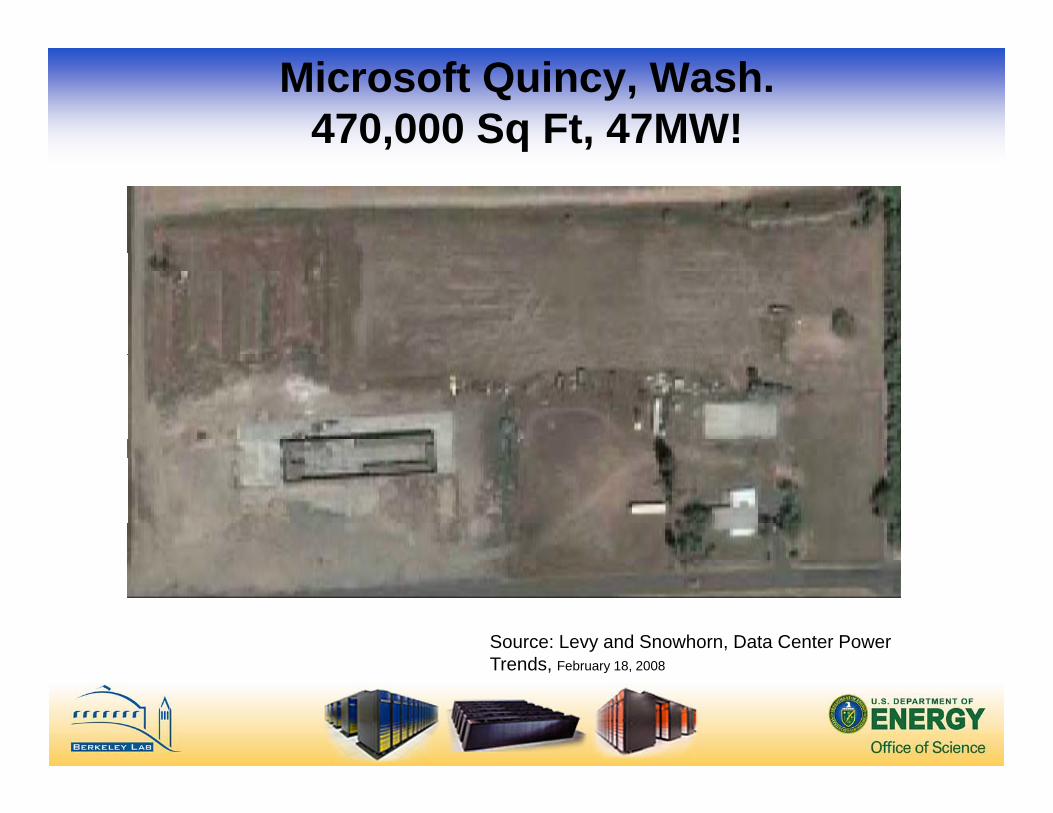
Microsoft Quincy, Wash.470,000 Sq Ft, 47MW!q
Source: Levy and Snowhorn, Data Center Power Trends F b 18 2008Trends, February 18, 2008
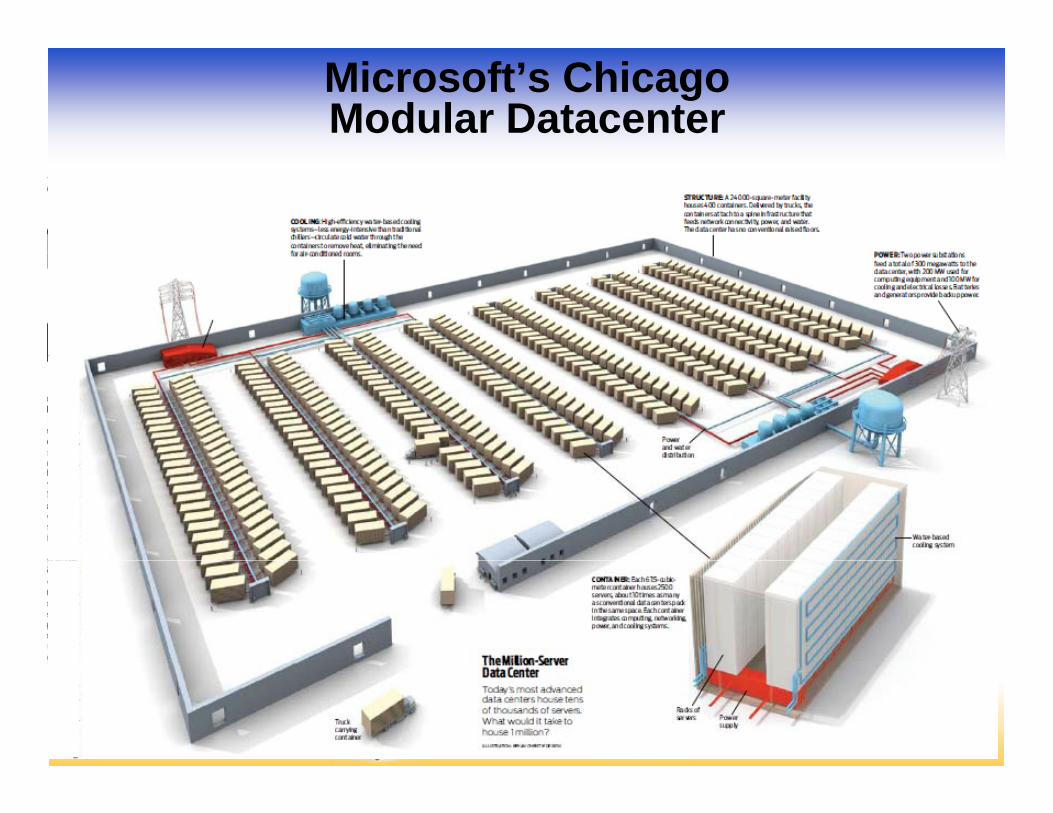
Microsoft’s ChicagoModular Datacenter
23
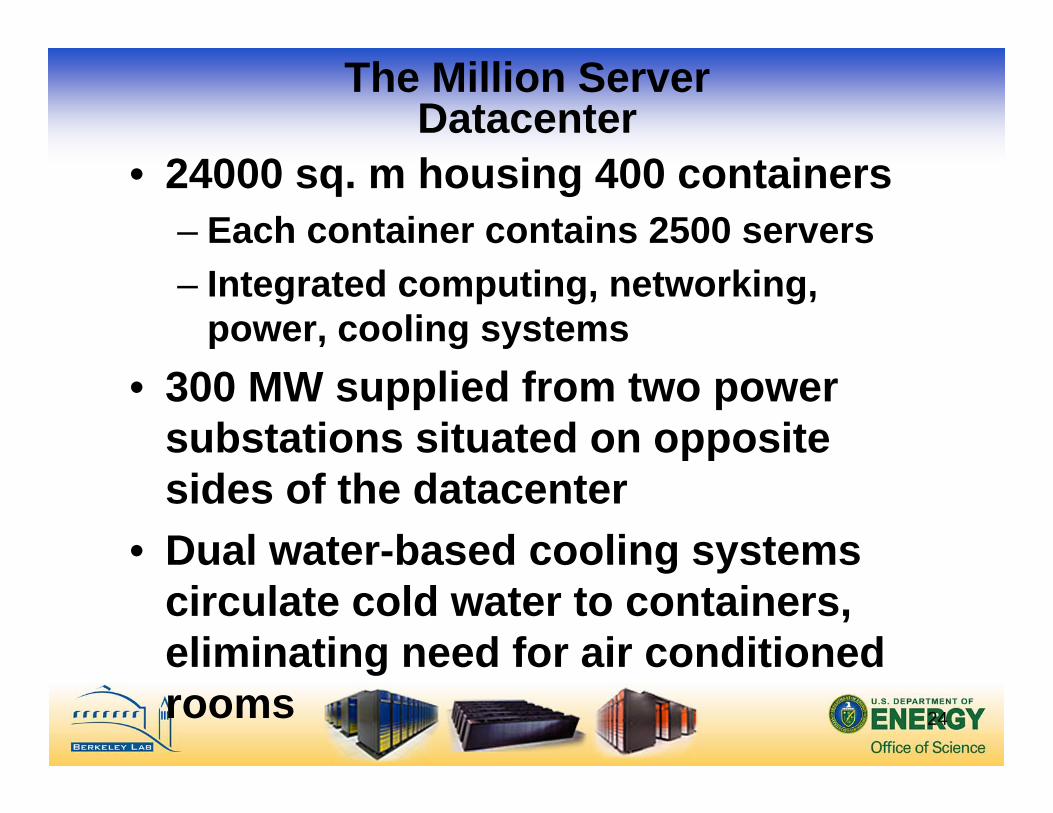
The Million Server Datacenter
• 24000 sq. m housing 400 containers– Each container contains 2500 servers– Integrated computing, networking,
power, cooling systems• 300 MW supplied from two power
substations situated on opposite ppsides of the datacenter
• Dual water-based cooling systemsDual water based cooling systems circulate cold water to containers, eliminating need for air conditionedeliminating need for air conditioned rooms 24
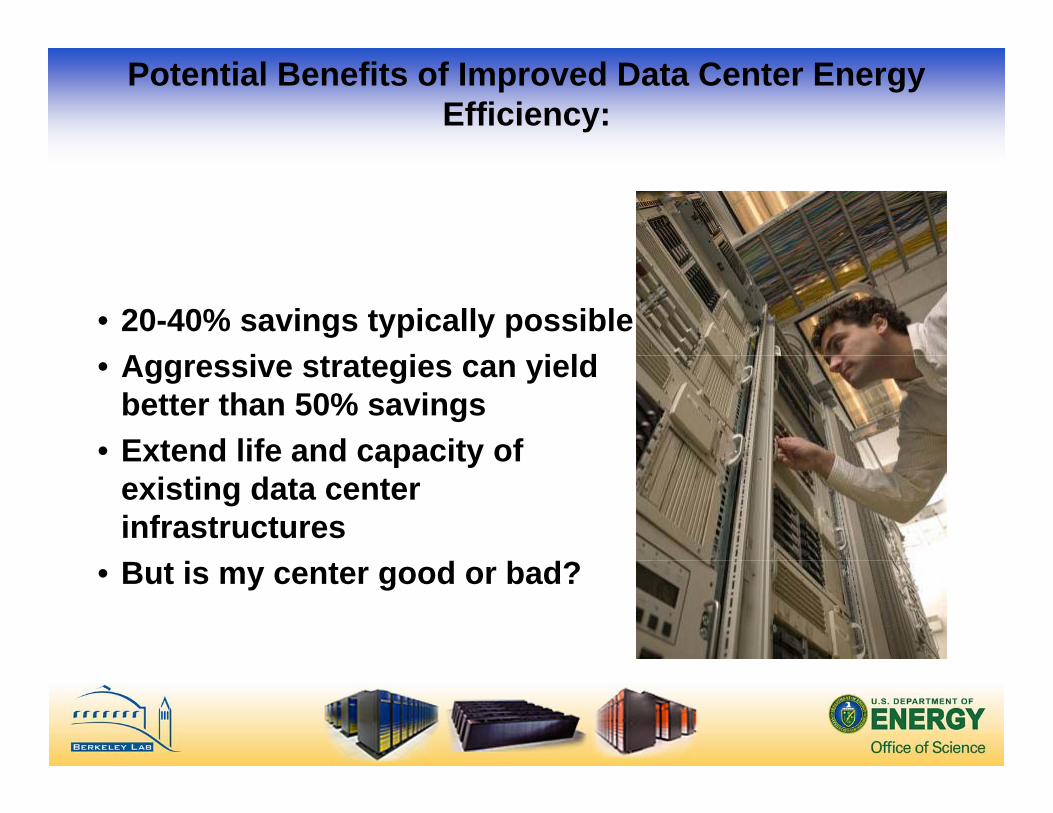
Potential Benefits of Improved Data Center Energy Efficiency:
• 20-40% savings typically possibleA i t t i i ld• Aggressive strategies can yield better than 50% savings
• Extend life and capacity ofExtend life and capacity of existing data center infrastructures
• But is my center good or bad?
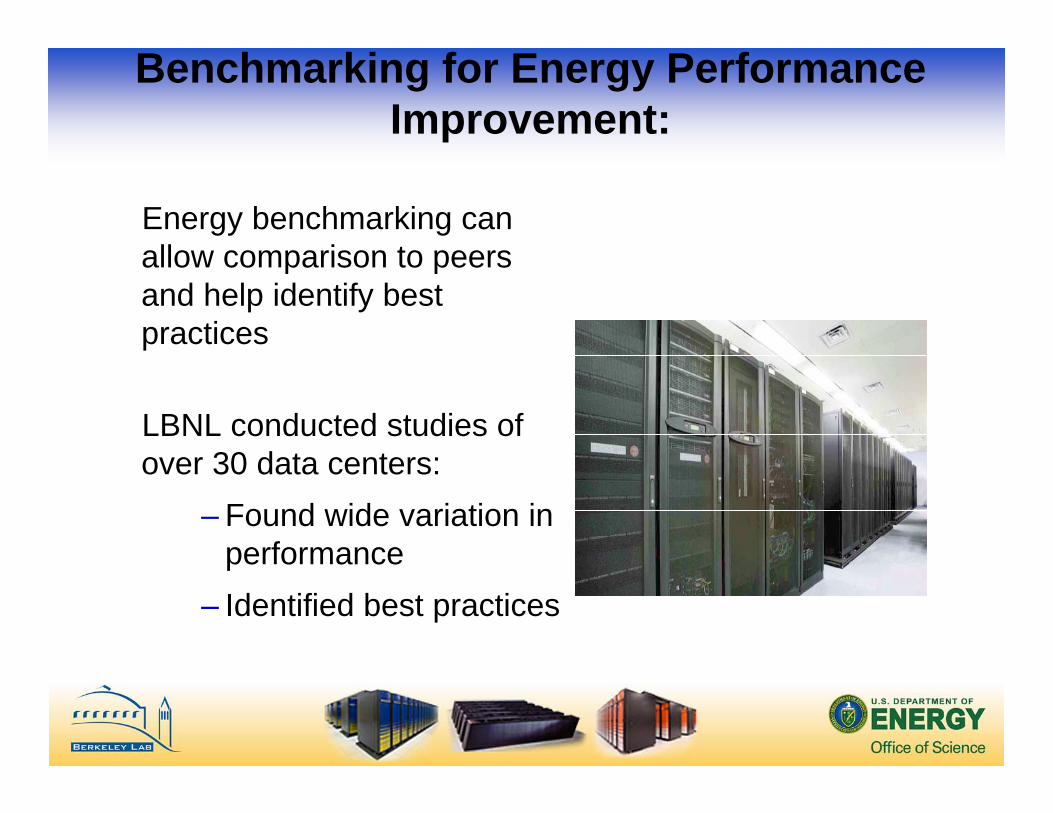
Benchmarking for Energy Performance Improvement:
Energy benchmarking can allow comparison to peersallow comparison to peers and help identify best practices
LBNL conducted studies of over 30 data centers:over 30 data centers:
– Found wide variation in performanceperformance
– Identified best practices
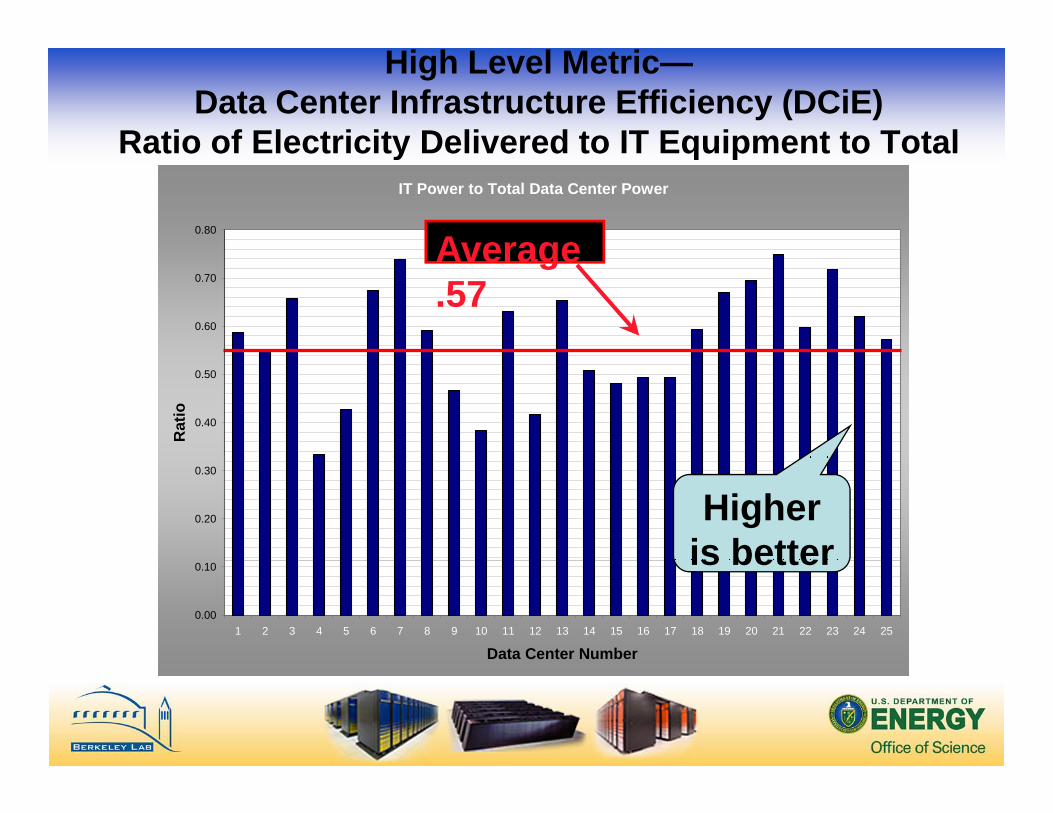
High Level Metric—Data Center Infrastructure Efficiency (DCiE)
Ratio of Electricity Delivered to IT Equipment to TotalRatio of Electricity Delivered to IT Equipment to TotalIT Power to Total Data Center Power
0.80
Average
0.60
0.70
Average .57
0.40
0.50
Rat
io
0.20
0.30
Higher is better
0.00
0.10
1 2 3 4 5 6 7 8 9 10 11 12 13 14 15 16 17 18 19 20 21 22 23 24 25
Data Center Number
is better
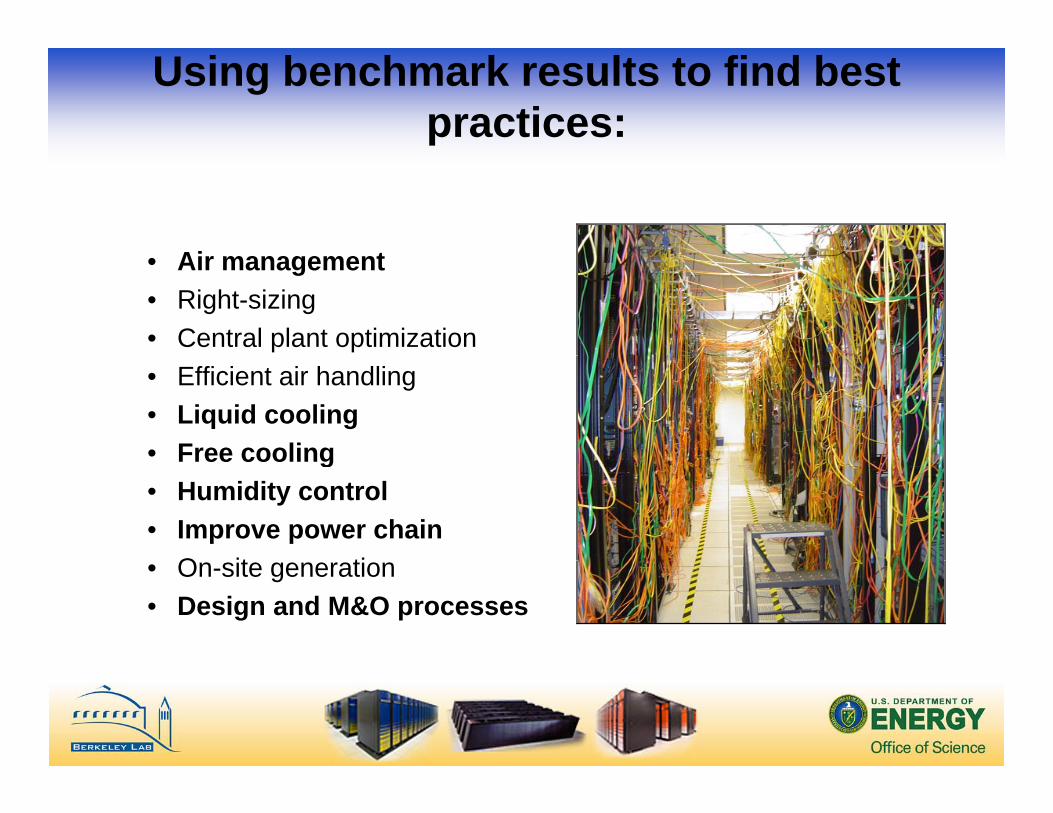
Using benchmark results to find best practices:
Ai t• Air management• Right-sizing• Central plant optimization• Efficient air handling• Liquid cooling • Free coolingFree cooling• Humidity control• Improve power chain
O it ti• On-site generation• Design and M&O processes
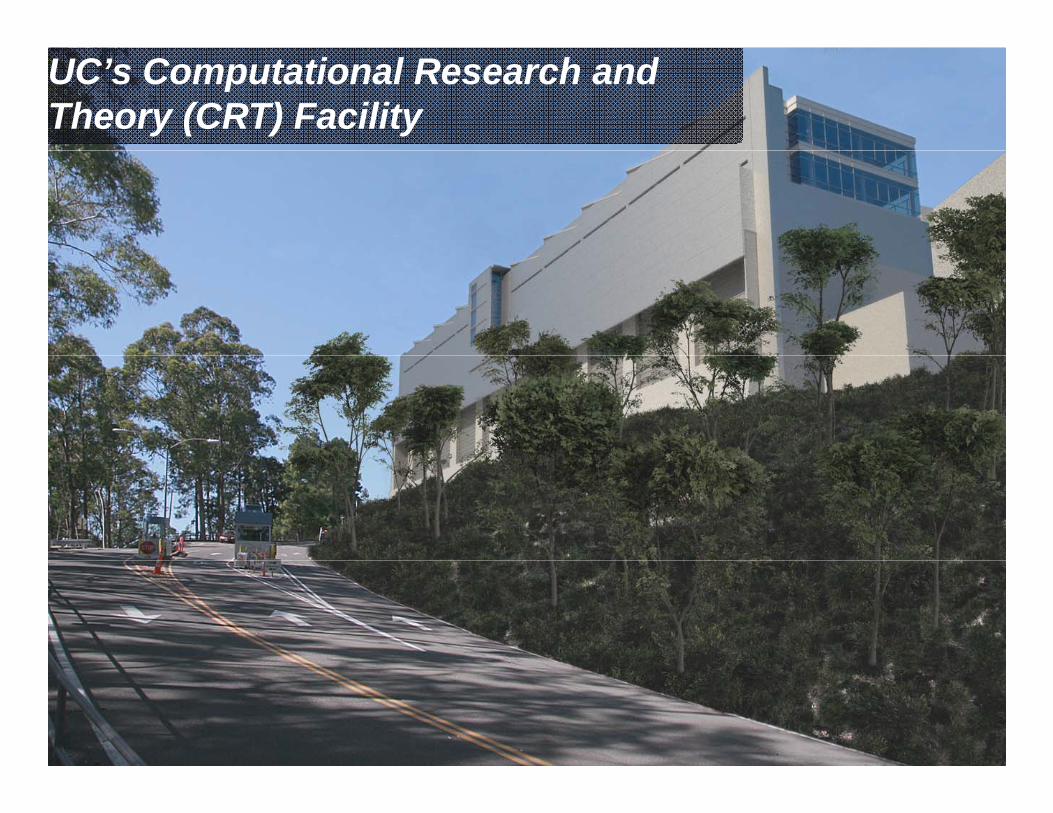
UC’s Computational Research and Theory (CRT) Facility
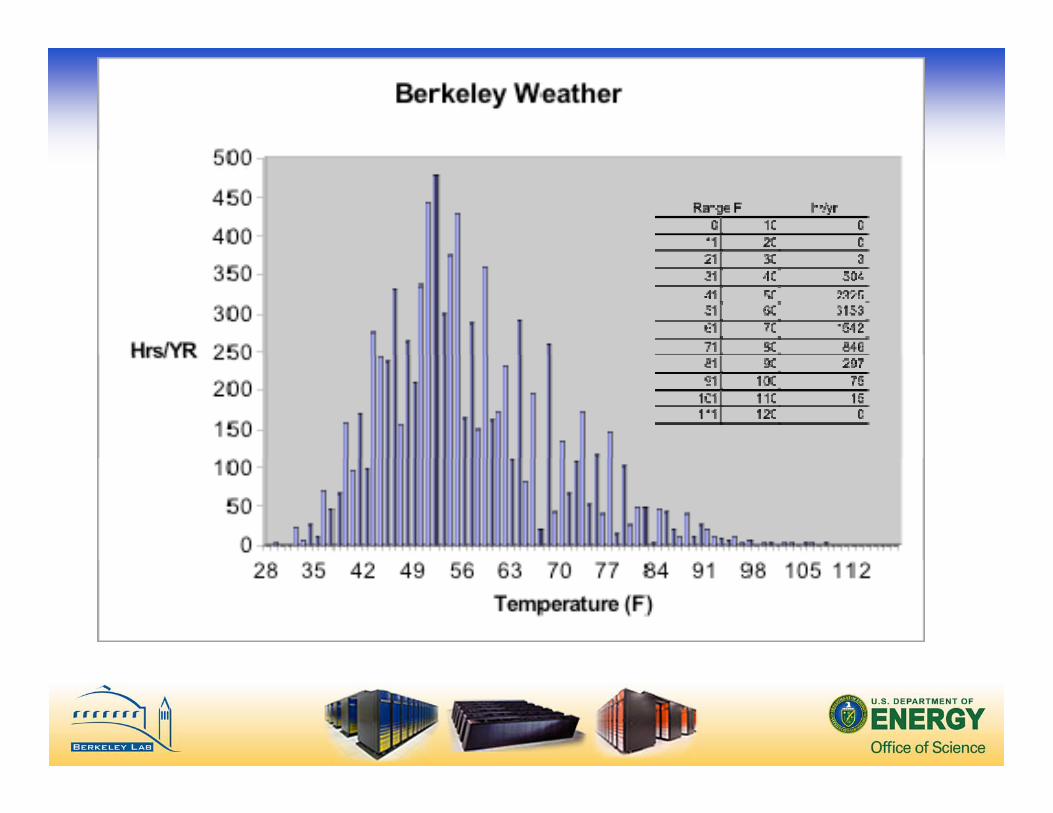
Use Free Cooling:
• Water-side Economizers– No contamination question– No contamination question– Can be in series with chiller
• Outside Air Economizers• Outside-Air Economizers – Can be very effective (24/7 load)
M t id h idit– Must consider humidity
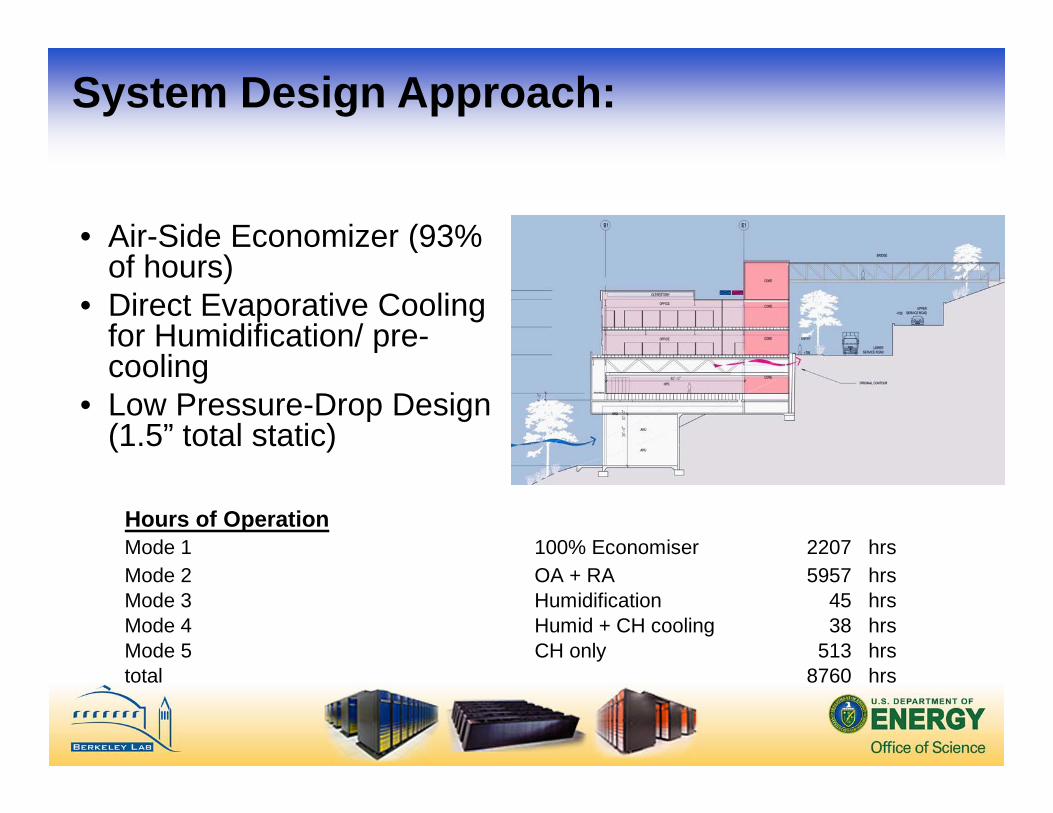
System Design Approach:
• Air-Side Economizer (93% (of hours)
• Direct Evaporative Cooling for Humidification/ pre-
licooling• Low Pressure-Drop Design
(1.5” total static)
Hours of OperationMode 1 100% Economiser 2207 hrsMode 2 OA + RA 5957 hrsMode 3 Humidification 45 hrsMode 4 Humid + CH cooling 38 hrsMode 5 CH only 513 hrstotal 8760 hrs
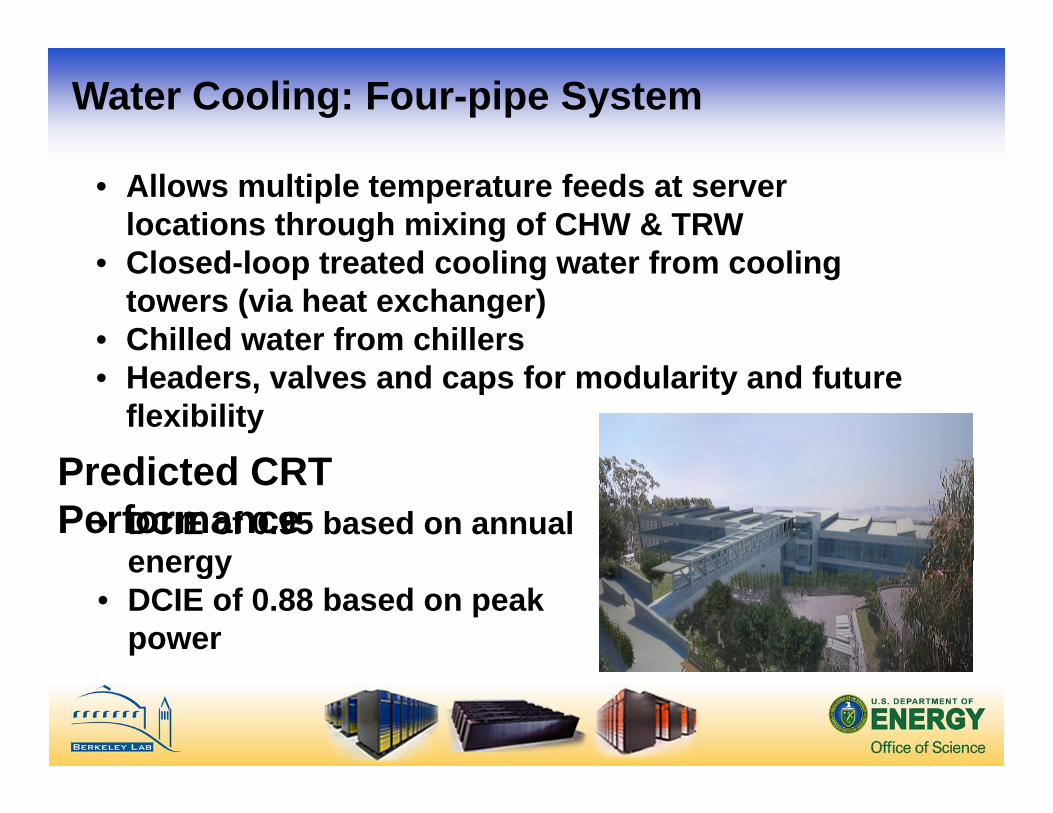
Water Cooling: Four-pipe System
• Allows multiple temperature feeds at server locations through mixing of CHW & TRWCl d l t t d li t f li• Closed-loop treated cooling water from cooling towers (via heat exchanger)
• Chilled water from chillers• Headers, valves and caps for modularity and future
flexibility
P di t d CRTPredicted CRT Performance• DCIE of 0.95 based on annual
energyenergy• DCIE of 0.88 based on peak
power
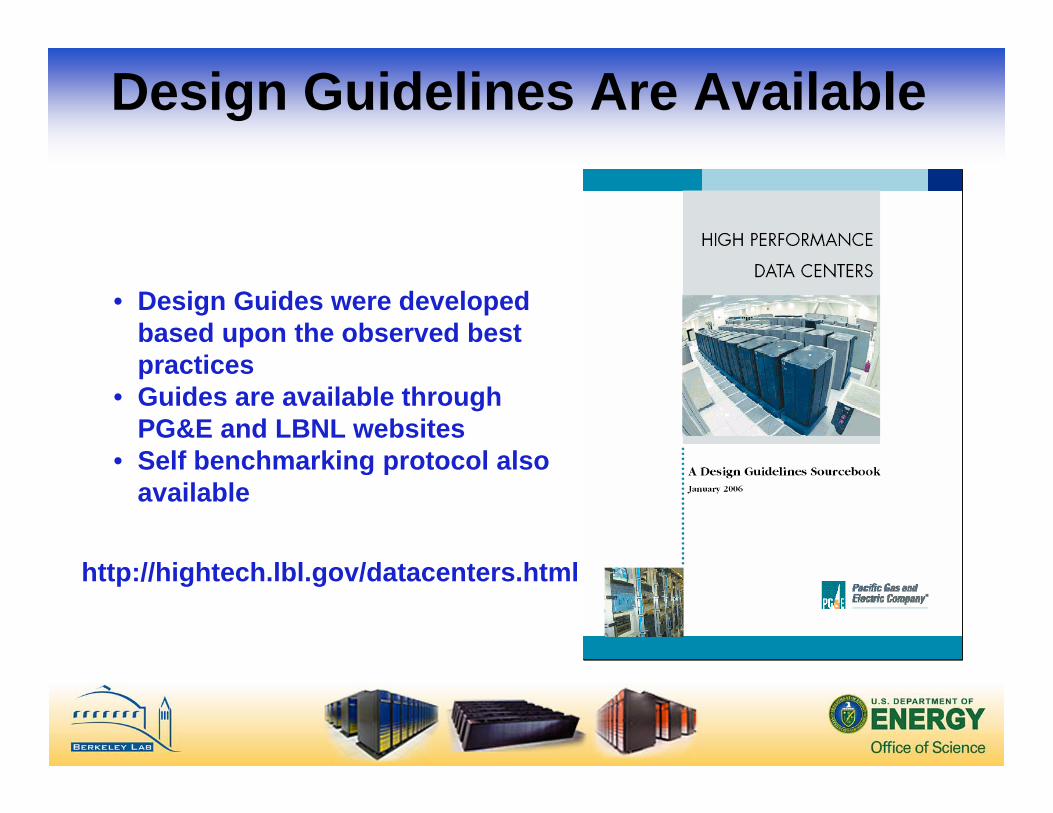
Design Guidelines Are Available
• Design Guides were developed based upon the observed best
tipractices• Guides are available through
PG&E and LBNL websites• Self benchmarking protocol also• Self benchmarking protocol also
available
http://hightech.lbl.gov/datacenters.html
Links to Get StartedDOE Website: Sign up to stay up to date on new developmentswww.eere.energy.gov/datacenters
Lawrence Berkeley National Laboratory (LBNL)Lawrence Berkeley National Laboratory (LBNL)http://hightech.lbl.gov/datacenters.html
LBNL Best Practices Guidelines (cooling, power, IT systems)http://hightech lbl gov/datacenters bpg htmlhttp://hightech.lbl.gov/datacenters-bpg.html
ASHRAE Data Center technical guidebooks http://tc99.ashraetcs.org/
The Green Grid Association – White papers on metrics http://www.thegreengrid.org/gg_content/
Energy Star® Programhttp://www.energystar.gov/index.cfm?c=prod_development.server_efficiency
Uptime Institute white papers www.uptimeinstitute.org

TALK TO DALE: Join his network to share information and Pull market towards higher efficiency products
Contact Information:Dale Sartor P EDale Sartor, P.E.Lawrence Berkeley National LaboratoryApplications TeamMS 90-3111MS 90 3111University of CaliforniaBerkeley, CA 94720
[email protected](510) 486-5988http://Ateam LBL govhttp://Ateam.LBL.gov
Power consumption has become an industry-wide issue for computingy p g
Two interrelated issues: Building and infrastructure
problem -- continued increaseproblem continued increase in demand for computing
Computer technology problem Computer technology problem -- no more power density scaling (“bits”)
An Early Warning
• Presented by Shekhar Borkar in Berkeley in November 2000y
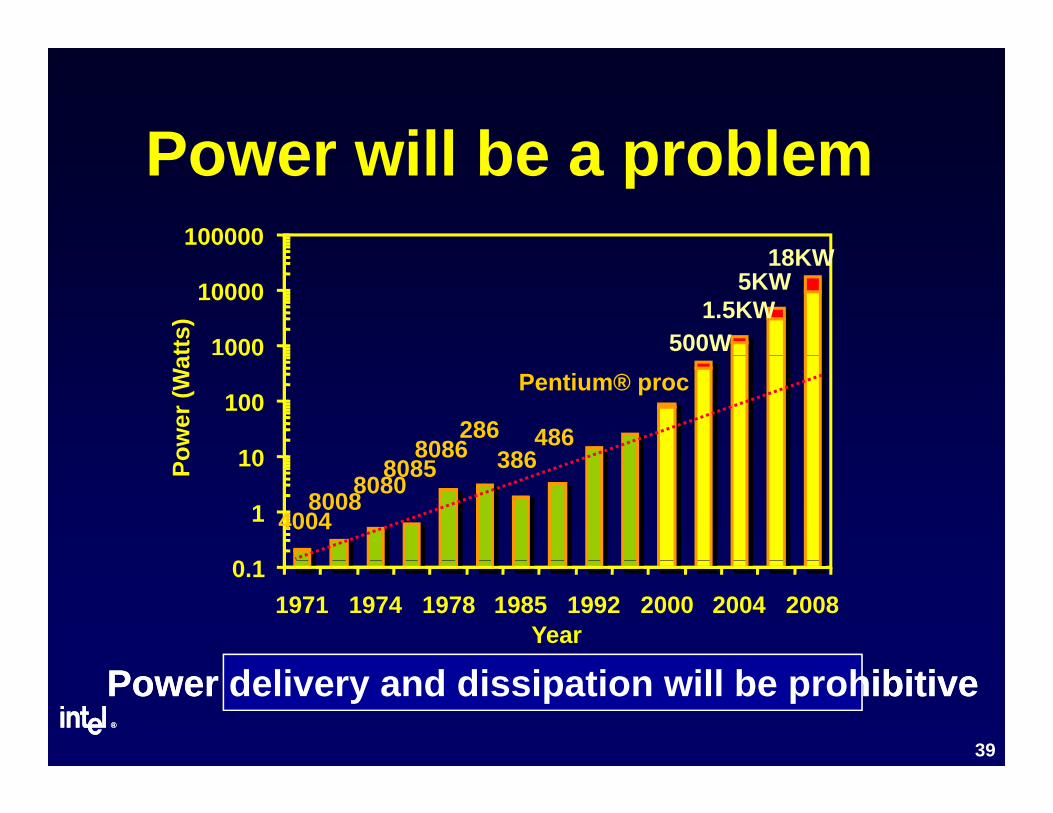
Power will be a problemPower will be a problem18KW
100000
5KW 18KW
1.5KW 500W 1000
10000
tts)
8086286
386486
Pentium® proc
10
100
000
ower
(Wa
4004800880808085 386
0 1
1
10Po
0.11971 1974 1978 1985 1992 2000 2004 2008
Year
®®
39
Power delivery and dissipation will be prohibitivePower delivery and dissipation will be prohibitive
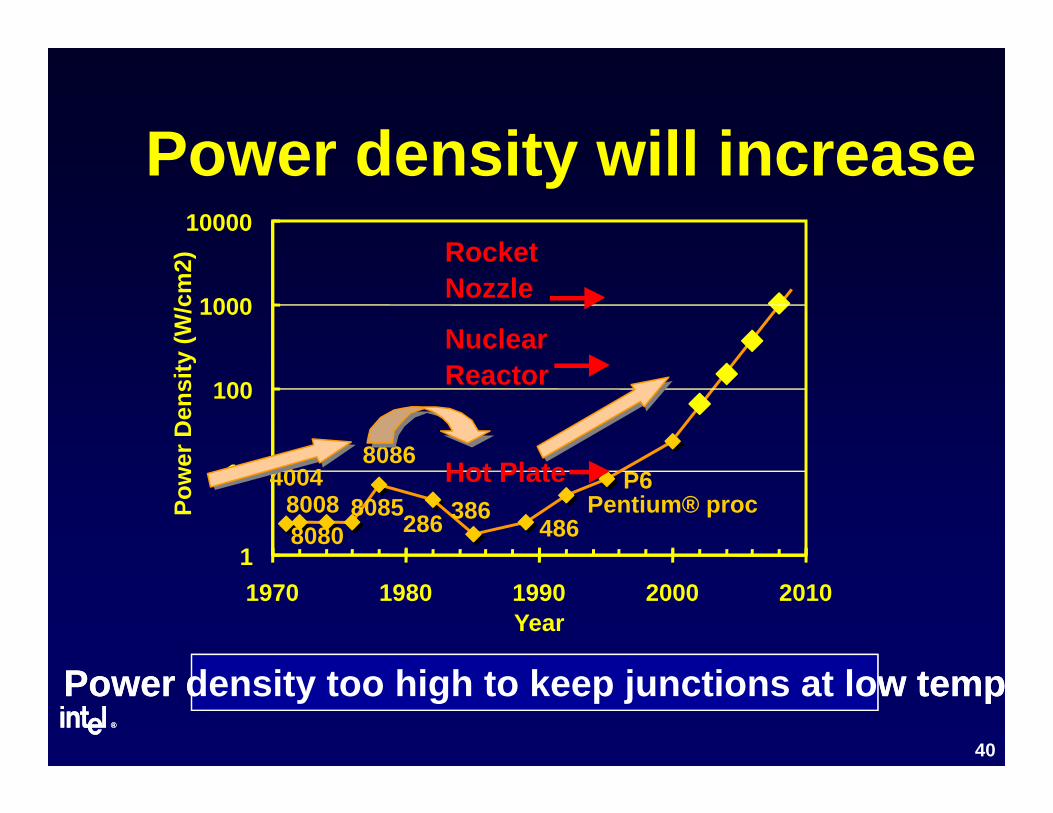
Power density will increasePower density will increase10000
) Rocket
1000
y (W
/cm
2)
Nuclear
RocketNozzle
8086
100
er D
ensi
ty Reactor
400480088080
8085
8086
286 386486
Pentium® procP6
1
10
Pow
e Hot Plate
11970 1980 1990 2000 2010
Year
®®
40
Power density too high to keep junctions at low tempPower density too high to keep junctions at low temp
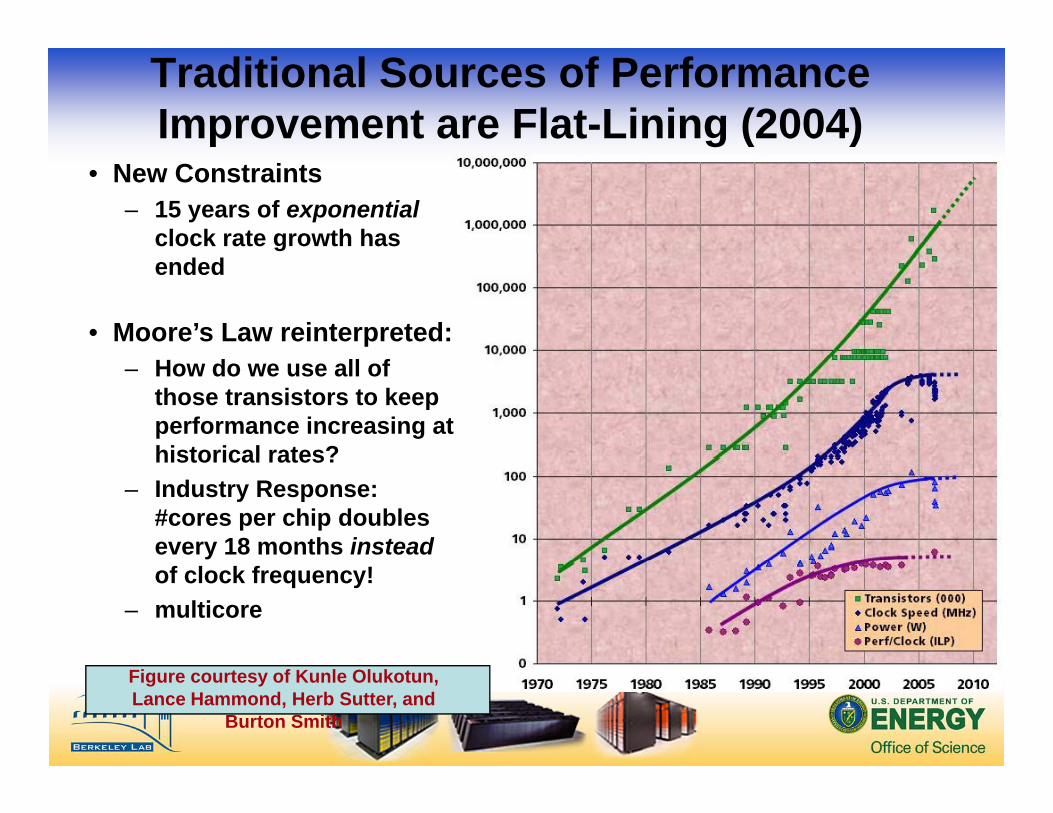
Traditional Sources of Performance Improvement are Flat-Lining (2004)
• New Constraints– 15 years of exponential
clock rate growth has ended
• Moore’s Law reinterpreted:– How do we use all of
those transistors to keep performance increasing at historical rates?historical rates?
– Industry Response: #cores per chip doubles every 18 months insteadof clock frequency!
– multicore
Figure courtesy of Kunle Olukotun, Lance Hammond, Herb Sutter, and
Burton Smith
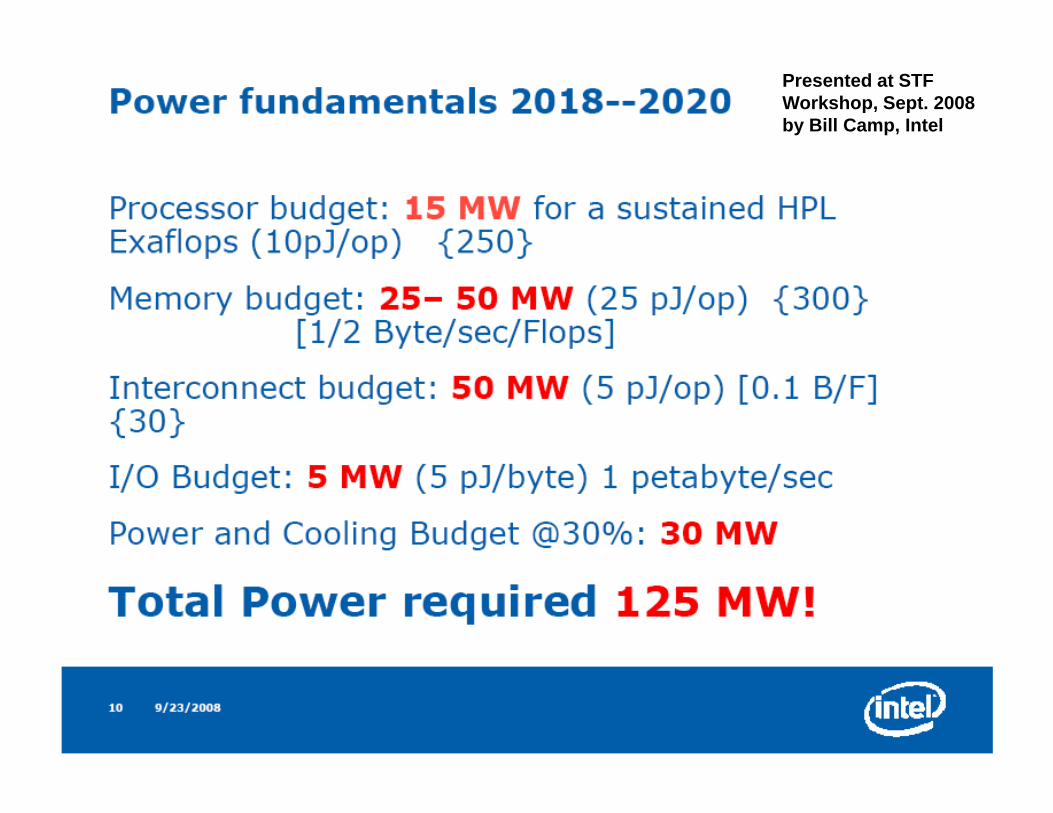
Estimated Exascale Power Requirementsq
• LBNL IJHPCA Study for ~1/5 Exaflop for Climate Science– Extrapolation of Blue Gene and AMD design trendsExtrapolation of Blue Gene and AMD design trends– Estimate: 20 MW for BG and 179 MW for AMD
• DOE E3 Report– Extrapolation of existing design trends to exascale in 2016– Estimate: 130 MW
DARPA St d• DARPA Study– More detailed assessment of component technologies for
exascale systemE ti t th 120 MW– Estimate: more than 120 MW
• The current approach is not sustainable!
DARPA Exascale Study
• Commissioned by DARPA to explore the challenges for Exaflop computingchallenges for Exaflop computing
• Two model for future performance growthSimplistic: ITRS roadmap; power for memory– Simplistic: ITRS roadmap; power for memory grows linear with #of chips; power for interconnect stays constant
– Fully scaled: same as simplistic, but memory and router power grow with peak flops per chip
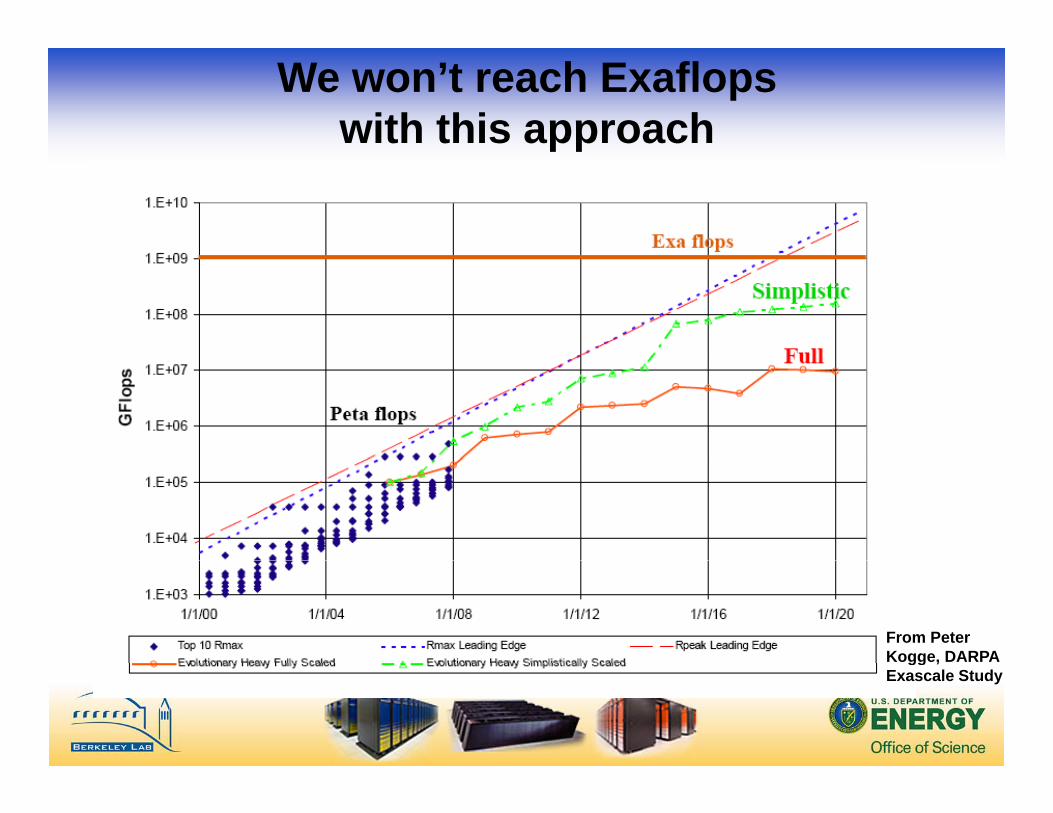
We won’t reach Exaflops with this approachpp
From Peter Kogge, DARPA gg ,Exascale Study
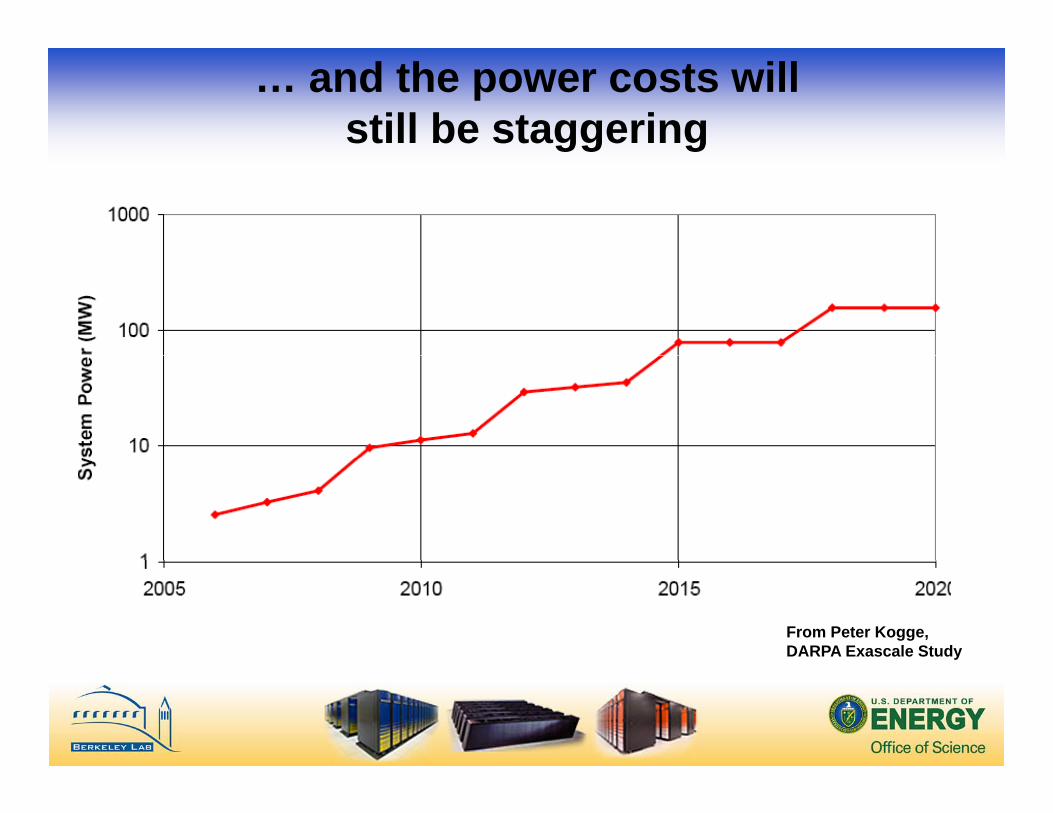
… and the power costs will still be staggeringgg g
From Peter Kogge, DARPA Exascale Study
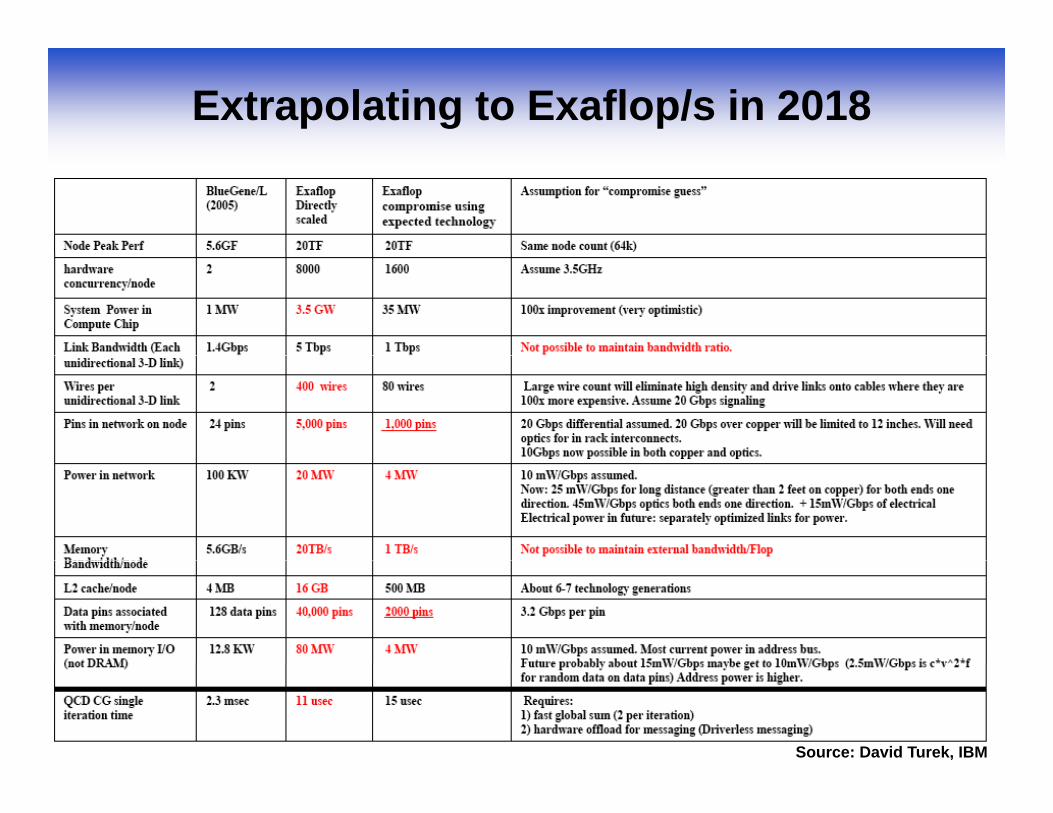
Extrapolating to Exaflop/s in 2018
Source: David Turek, IBM

Power Efficiency related to Processors
600t]
(8+1) core
QC embedded
300
400
500
600
[MFlop
s/Watt QC embedded
Quadcore
DC embedded
Dualcore
0
100
200
wer Efficiency [
Pow
Green Flash:Ultra-Efficient Climate Modeling
• Project by Shalf, Oliker, Wehner and others at j yLBNL
• An alternative route to exascale computing• An alternative route to exascale computing– Target specific machine designs to answer a
scientific questionq– Use of new technologies driven by the consumer
market.
Ultra-Efficient “Green Flash” Computing at NERSC: 100x over Business as Usual
Radically change HPC system development via application-driven hardware/software co-designpp g– Achieve 100x power efficiency and 100x
capability of mainstream HPC approach for targeted high impact applicationstargeted high-impact applications
– Accelerate development cycle for exascale HPC systemsy
– Approach is applicable to numerous scientific applications
– Proposed pilot application: Ultra-high resolution climate change simulation
Path to Power EfficiencyReducing Waste in Computingg p g
• Examine methodology of low-power embedded computing market– optimized for low power, low cost and high computational
efficiency
“Years of research in low-power embedded computing have shown only one design technique to reduce power: reducewaste.”
Mark Horowitz Stanford University & Rambus Inc Mark Horowitz, Stanford University & Rambus Inc.
• Sources of wasteWasted transistors (surface area)– Wasted transistors (surface area)
– Wasted computation (useless work/speculation/stalls)– Wasted bandwidth (data movement)
D i i f i l f– Designing for serial performance
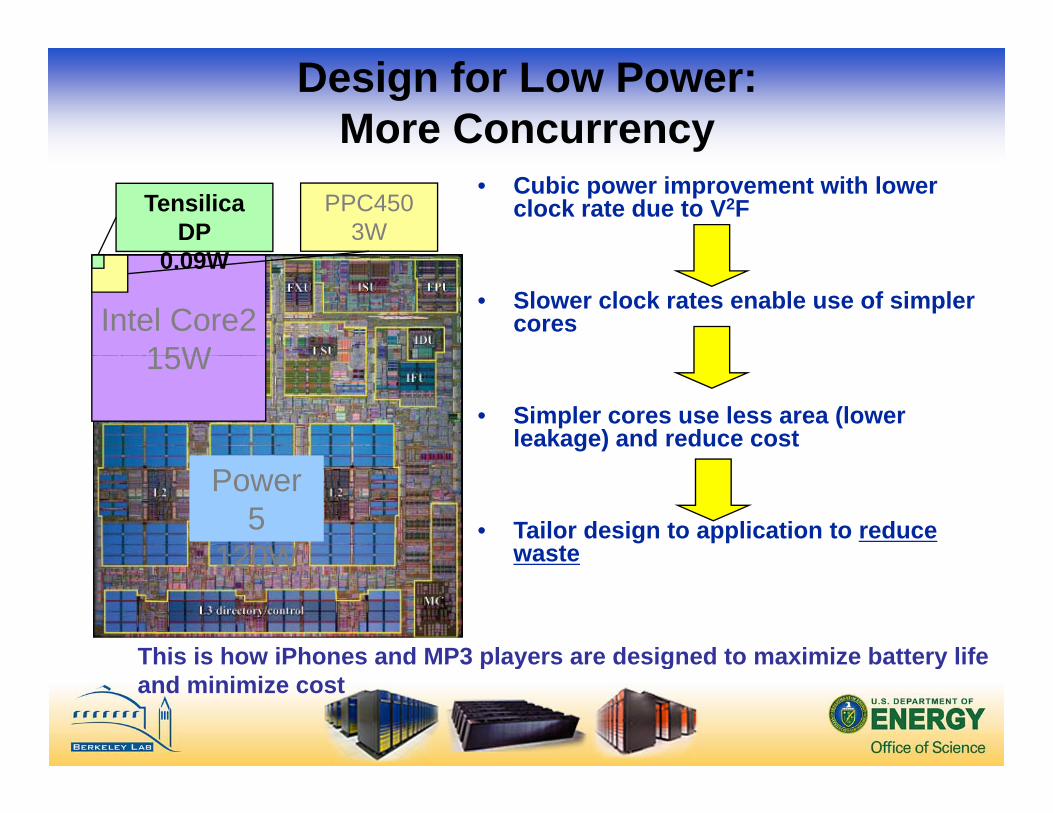
Design for Low Power: More Concurrencyy
PPC4503W
Tensilica DP
0 09W
• Cubic power improvement with lower clock rate due to V2F
Intel Core215W
0.09W • Slower clock rates enable use of simpler
cores15W
• Simpler cores use less area (lower leakage) and reduce cost
Power 5
120W• Tailor design to application to reduce
waste120W
This is how iPhones and MP3 players are designed to maximize battery life
waste
This is how iPhones and MP3 players are designed to maximize battery life and minimize cost
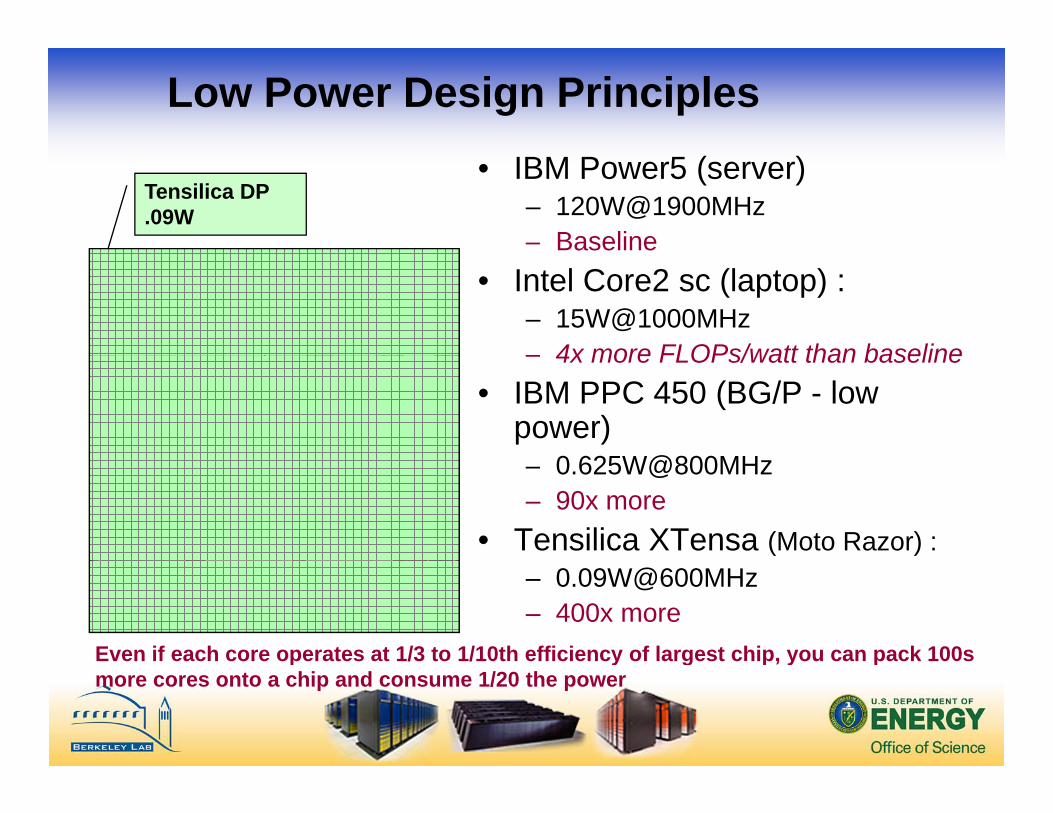
Low Power Design Principles• IBM Power5 (server)
– 120W@1900MHz– Baseline
Tensilica DP.09W
• Intel Core2 sc (laptop) :– 15W@1000MHz– 4x more FLOPs/watt than baseline
Intel Core2– 4x more FLOPs/watt than baseline
• IBM PPC 450 (BG/P - low power)
0 625W@800MH– 0.625W@800MHz– 90x more
• Tensilica XTensa (Moto Razor) : Power 5
– 0.09W@600MHz– 400x more
Even if each core operates at 1/3 to 1/10th efficiency of largest chip, you can pack 100s p y g p, y pmore cores onto a chip and consume 1/20 the power
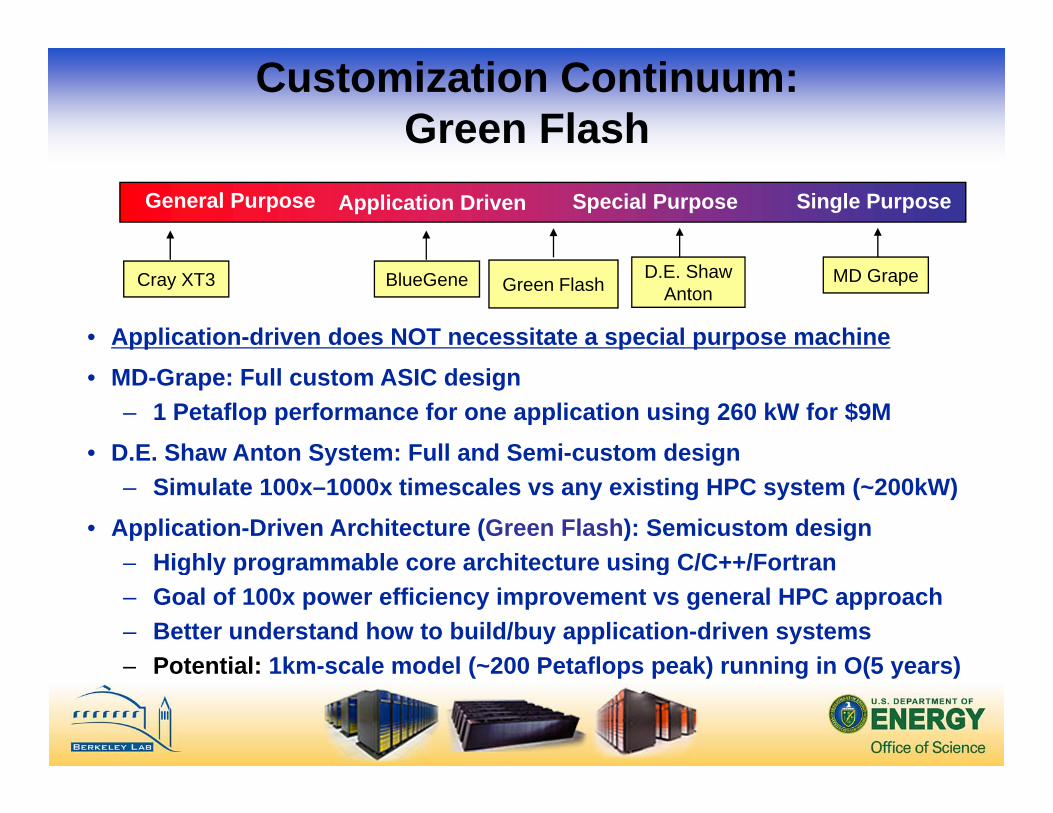
Customization Continuum:Green Flash
General Purpose Special Purpose Single PurposeApplication Driven
Cray XT3 D.E. ShawAnton
MD GrapeBlueGene Green Flash
• Application-driven does NOT necessitate a special purpose machine• MD-Grape: Full custom ASIC design
– 1 Petaflop performance for one application using 260 kW for $9M• D.E. Shaw Anton System: Full and Semi-custom designD.E. Shaw Anton System: Full and Semi custom design
– Simulate 100x–1000x timescales vs any existing HPC system (~200kW) • Application-Driven Architecture (Green Flash): Semicustom design
Highly programmable core architecture using C/C++/Fortran– Highly programmable core architecture using C/C++/Fortran– Goal of 100x power efficiency improvement vs general HPC approach– Better understand how to build/buy application-driven systems
Potential: 1km scale model (~200 Petaflops peak) running in O(5 years)– Potential: 1km-scale model (~200 Petaflops peak) running in O(5 years)
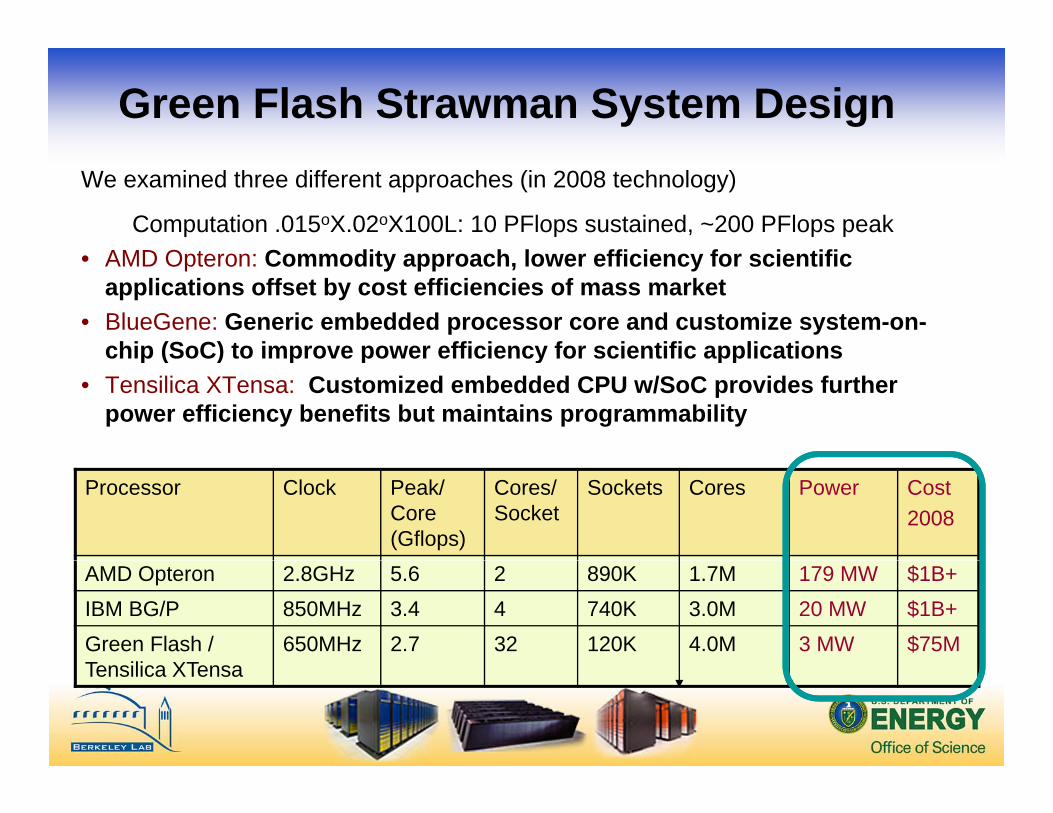
Green Flash Strawman System DesignWe examined three different approaches (in 2008 technology)
Computation .015oX.02oX100L: 10 PFlops sustained, ~200 PFlops peakAMD O t C dit h l ffi i f i tifi• AMD Opteron: Commodity approach, lower efficiency for scientific applications offset by cost efficiencies of mass market
• BlueGene: Generic embedded processor core and customize system-on-chip (SoC) to improve power efficiency for scientific applicationschip (SoC) to improve power efficiency for scientific applications
• Tensilica XTensa: Customized embedded CPU w/SoC provides further power efficiency benefits but maintains programmability
Processor Clock Peak/Core(Gflops)
Cores/Socket
Sockets Cores Power Cost2008
AMD Opteron 2.8GHz 5.6 2 890K 1.7M 179 MW $1B+IBM BG/P 850MHz 3.4 4 740K 3.0M 20 MW $1B+Green Flash / T ili XT
650MHz 2.7 32 120K 4.0M 3 MW $75MTensilica XTensa
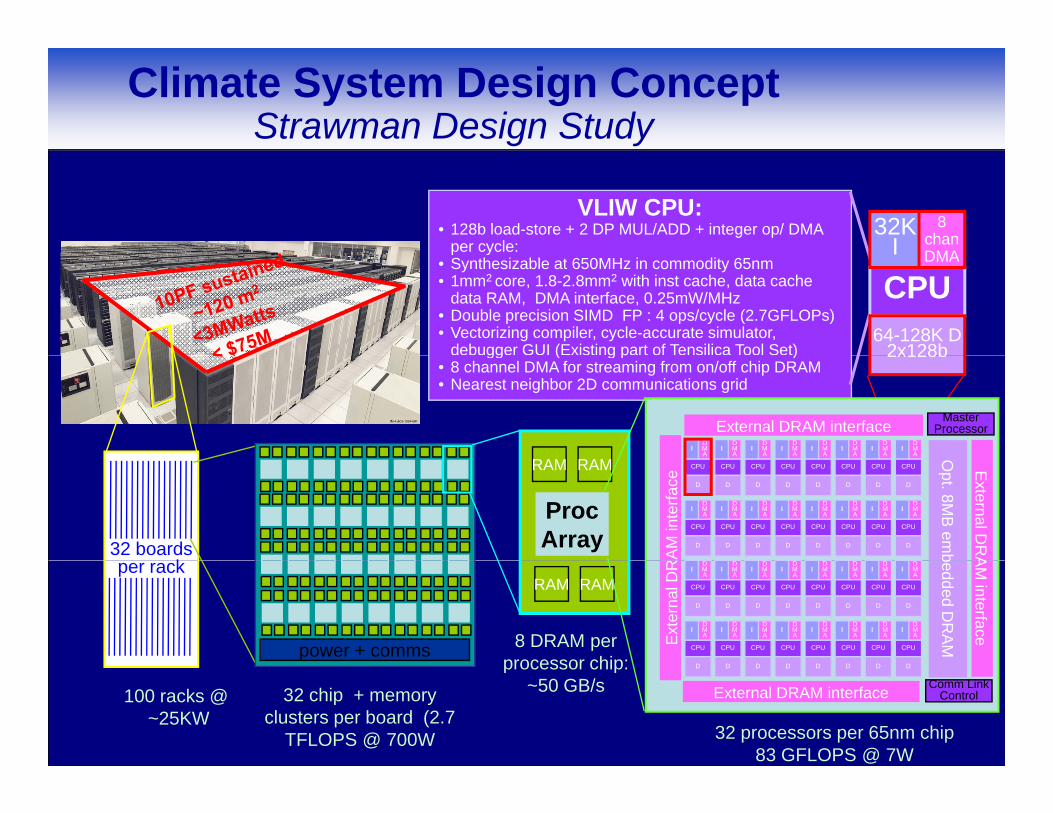
Climate System Design ConceptStrawman Design Study
VLIW CPU: • 128b load-store + 2 DP MUL/ADD + integer op/ DMA
per cycle:32K
I8
chanDMAp y
• Synthesizable at 650MHz in commodity 65nm • 1mm2 core, 1.8-2.8mm2 with inst cache, data cache
data RAM, DMA interface, 0.25mW/MHz• Double precision SIMD FP : 4 ops/cycle (2.7GFLOPs)• Vectorizing compiler, cycle-accurate simulator,
debugger GUI (Existing part of Tensilica Tool Set)
CPU64-128K D
2x128b
I DMA
gg ( g p )• 8 channel DMA for streaming from on/off chip DRAM• Nearest neighbor 2D communications grid
2x128b
IDM A
IDM A
IDM A
IDM A
IDM A
IDM A
IDM A
IDM A
External DRAM interface MasterProcessor
32 boards k
ProcArray
RAM RAM CPU
D
CPU
D
CPU
D
CPU
D
CPU
D
CPU
D
CPU
D
CPU
D
CPU
D
IDM A
CPU
D
IDM A
CPU
D
IDM A
CPU
D
IDM A
CPU
D
IDM A
CPU
D
IDM A
CPU
D
IDM A
CPU
D
IDM A
Opt. 8M
B em
b
External D
RA
RA
M in
terfa
ce
per rack
power + comms
RAM RAM
8 DRAM perprocessor chip:
CPU
IDM A
CPU
IDM A
CPU
IDM A
CPU
IDM A
CPU
IDM A
CPU
IDM A
CPU
IDM A
CPU
IDM A
CPU
D
IDM A
CPU
D
IDM A
CPU
D
IDM A
CPU
D
IDM A
CPU
D
IDM A
CPU
D
IDM A
CPU
D
IDM A
CPU
D
IDM A
bedded DR
AM
AM interfaceE
xter
nal D
R100 racks @
~25KW32 chip + memory
clusters per board (2.7 TFLOPS @ 700W
processor chip: ~50 GB/s
D D D D D D D D
External DRAM interface Comm LinkControl
32 processors per 65nm chip83 GFLOPS @ 7W
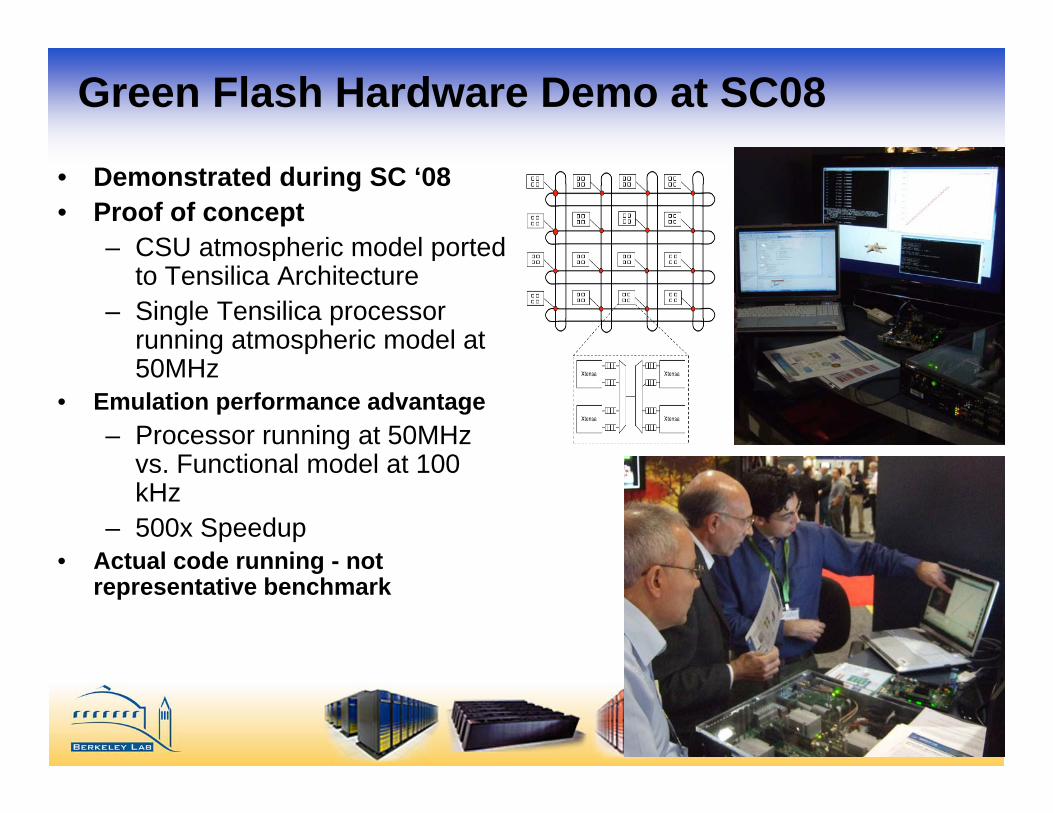
Green Flash Hardware Demo at SC08
• Demonstrated during SC ‘08• Proof of concept
– CSU atmospheric model portedCSU atmospheric model ported to Tensilica Architecture
– Single Tensilica processor running atmospheric model at 50MHz
• Emulation performance advantage– Processor running at 50MHz
F ti l d l t 100vs. Functional model at 100 kHz
– 500x Speedup• Actual code running not• Actual code running - not
representative benchmark
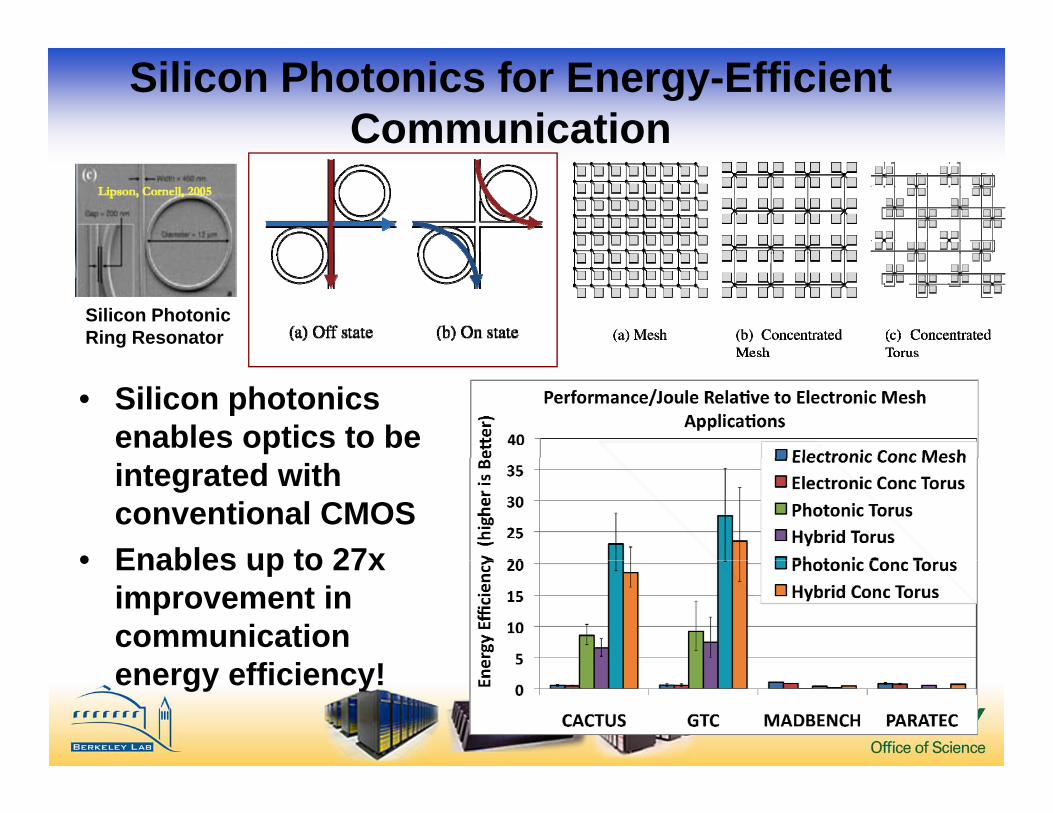
Silicon Photonics for Energy-Efficient Communication
Silicon PhotonicRing Resonator
• Silicon photonics enables optics to be integrated with conventional CMOS
• Enables up to 27x• Enables up to 27x improvement in communication
ffi i !energy efficiency!
Summary
• Power consumption is a huge p gproblem in HPC– “Bits”: we may not be able to scale to y
Exaflops without new technologies– “Buildings”: we may have to spend
more $$ on infrastructure and less on computing
Extra Slides
Outline
1. Power consumption has become an industry wide issue for computingindustry-wide issue for computing
2. Building and computer room energy g p gyefficiency
3 Computer architecture for energy3. Computer architecture for energy efficiency- the Green Flash project
4. Future
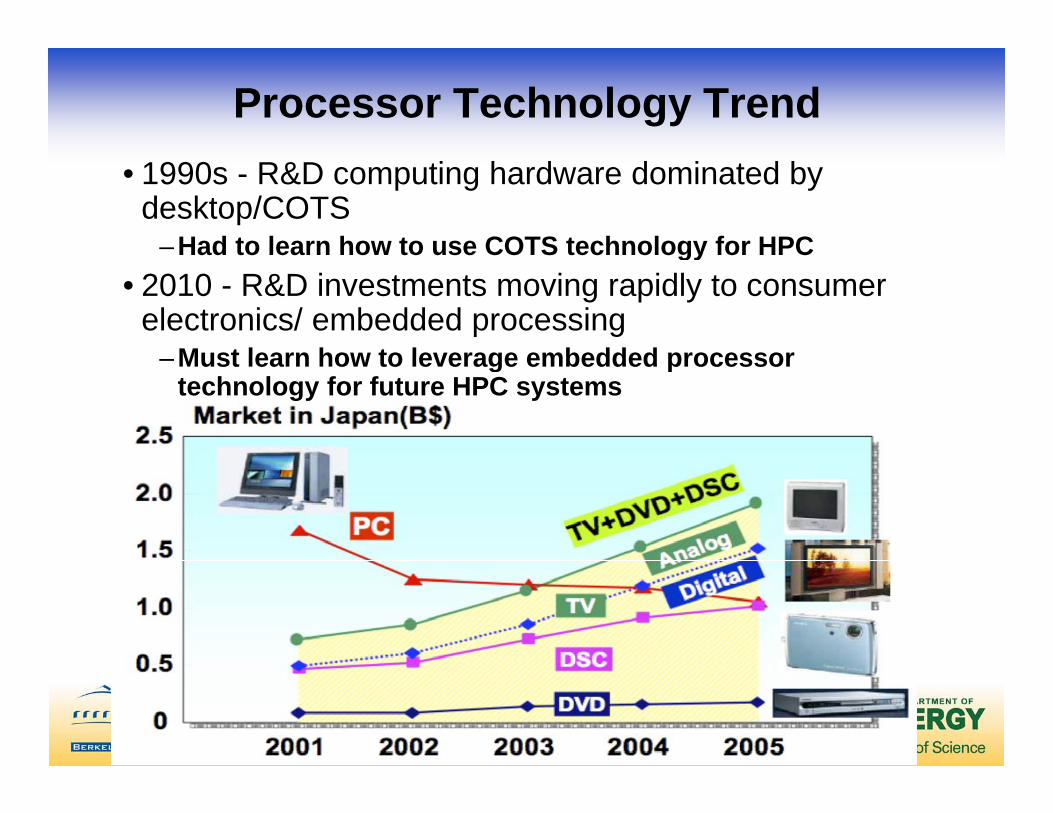
Processor Technology Trend • 1990s - R&D computing hardware dominated by
desktop/COTS–Had to learn how to use COTS technology for HPCHad to learn how to use COTS technology for HPC
• 2010 - R&D investments moving rapidly to consumer electronics/ embedded processing
Must learn how to leverage embedded processor–Must learn how to leverage embedded processor technology for future HPC systems
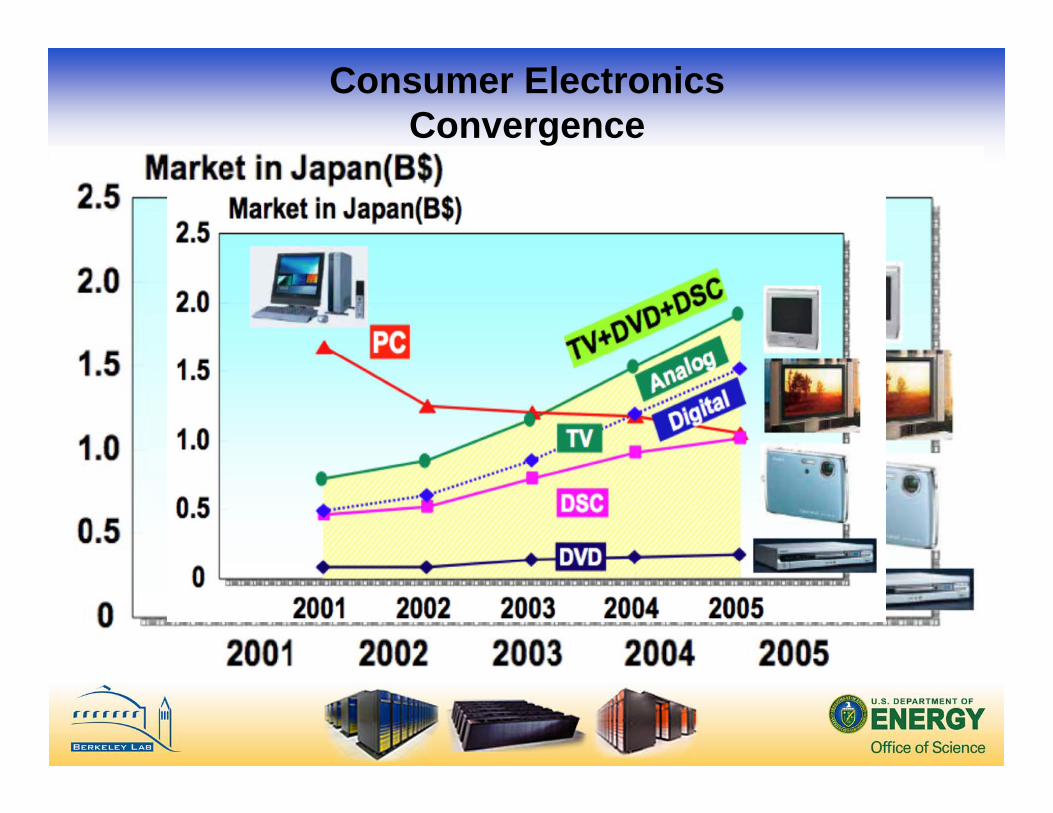
Consumer Electronics Convergence
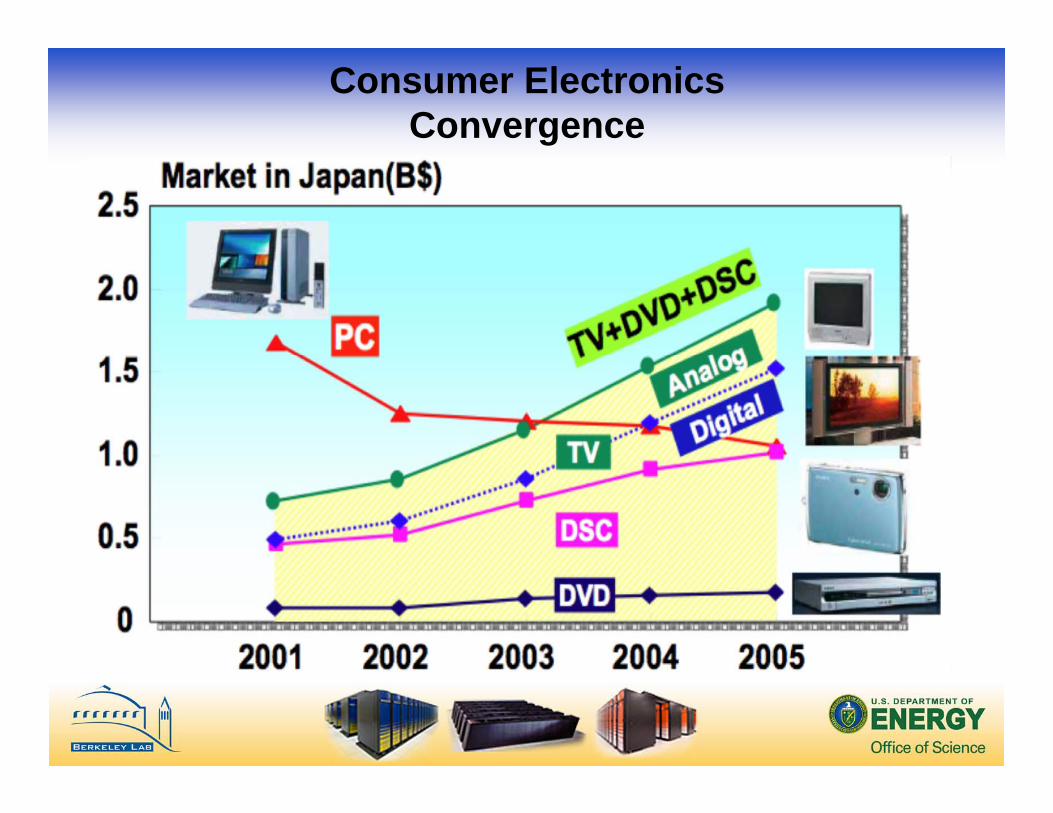
Consumer Electronics Convergence
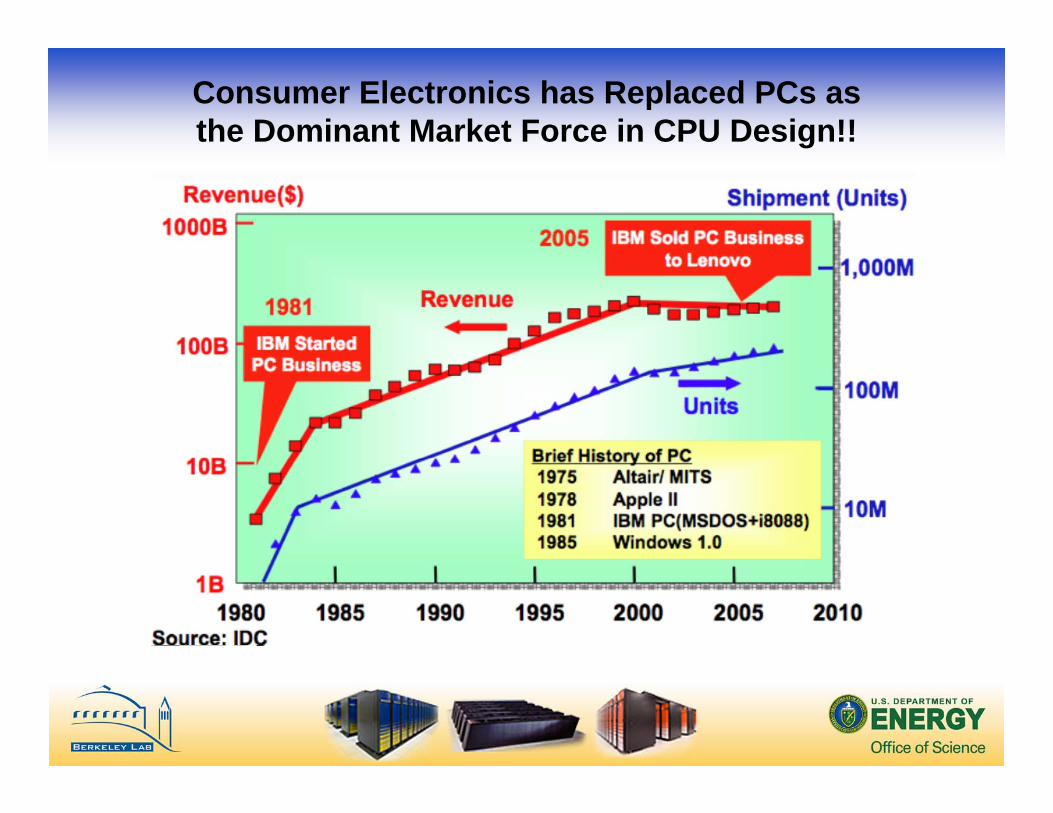
Consumer Electronics has Replaced PCs as the Dominant Market Force in CPU Design!!
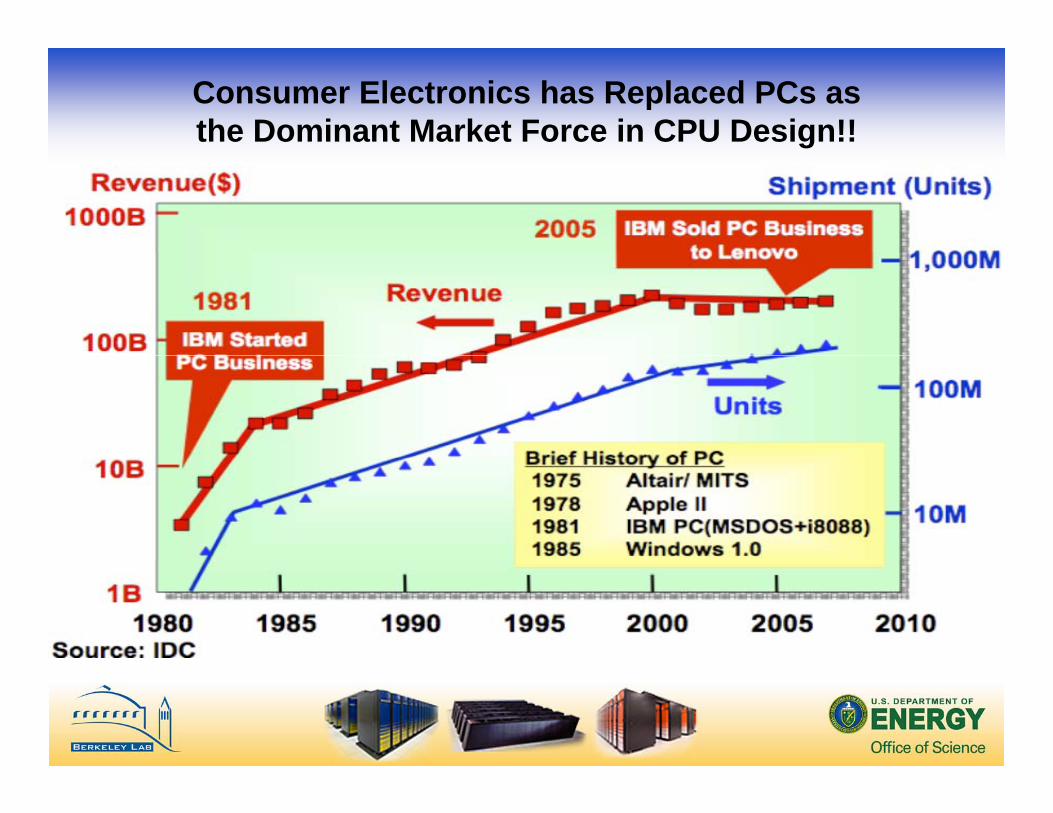
Consumer Electronics has Replaced PCs as the Dominant Market Force in CPU Design!!
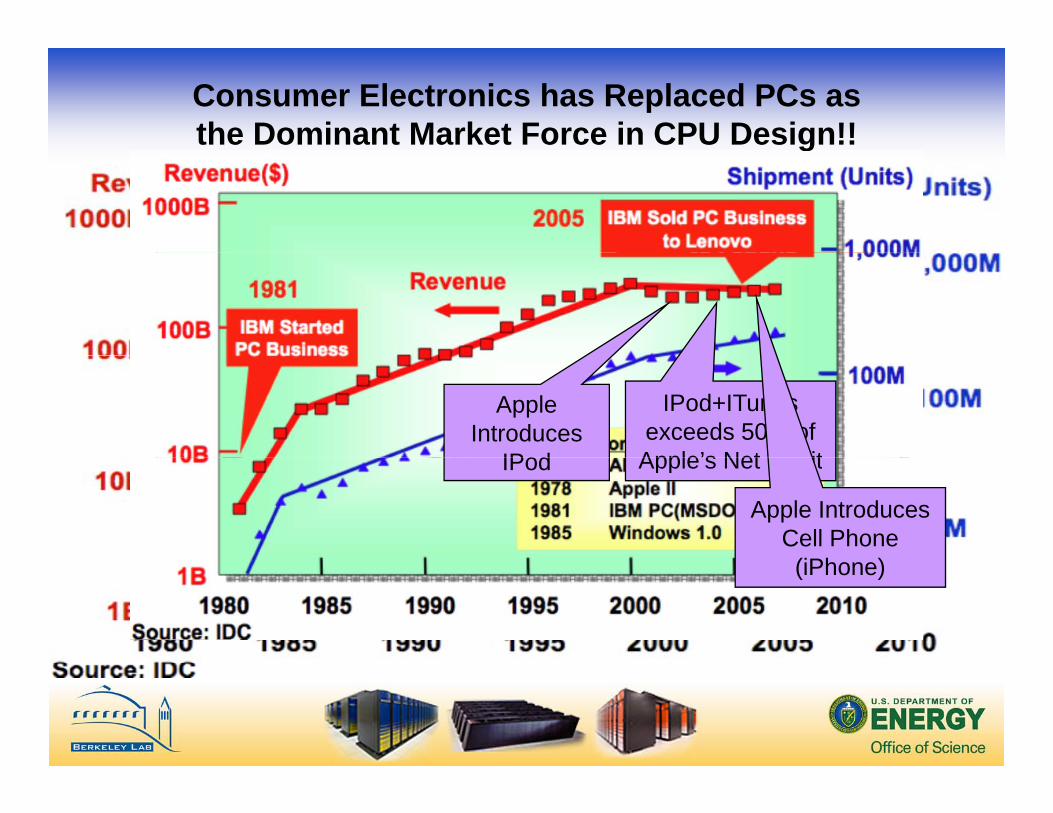
Consumer Electronics has Replaced PCs as the Dominant Market Force in CPU Design!!g
Apple Introduces
IPod
IPod+ITunes exceeds 50% of
Apple’s Net ProfitIPod Apple s Net Profit
Apple Introduces Cell Phone (iPh )(iPhone)
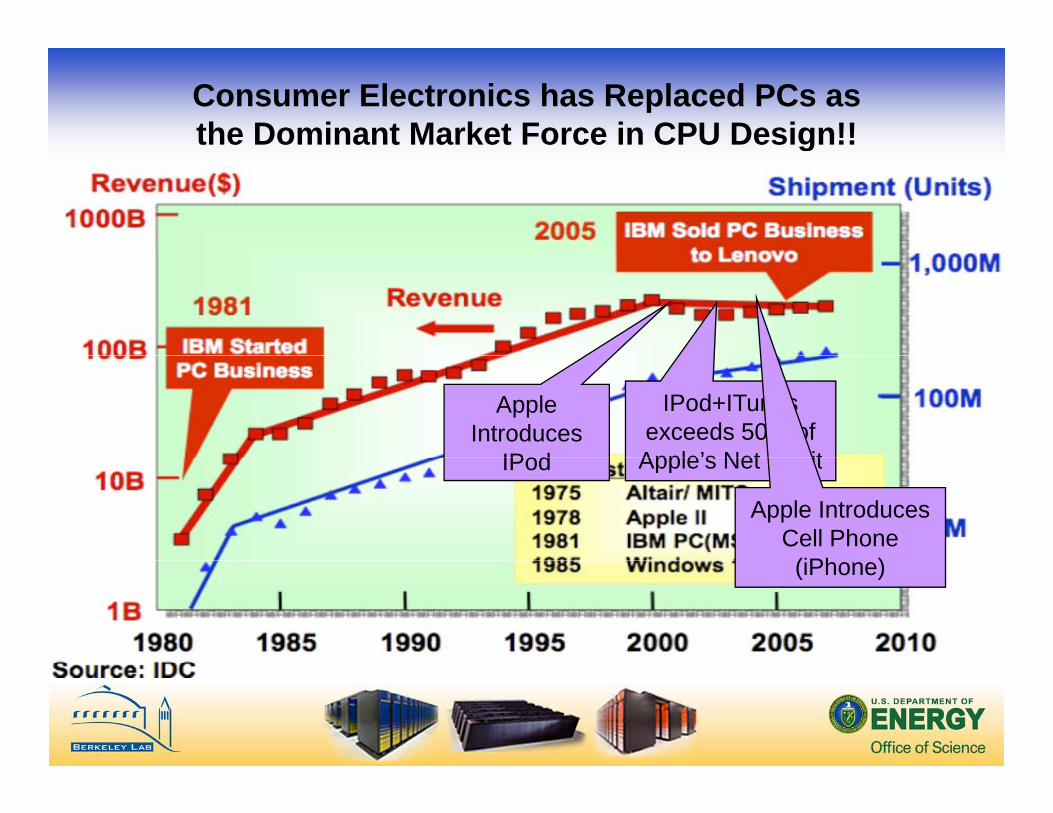
Consumer Electronics has Replaced PCs as the Dominant Market Force in CPU Design!!g
Apple Introduces
IPod
IPod+ITunes exceeds 50% of
Apple’s Net ProfitIPod Apple s Net Profit
Apple Introduces Cell Phone (iPh )(iPhone)
Presented at STF Workshop, Sept. 2008 by Bill Camp, Intel
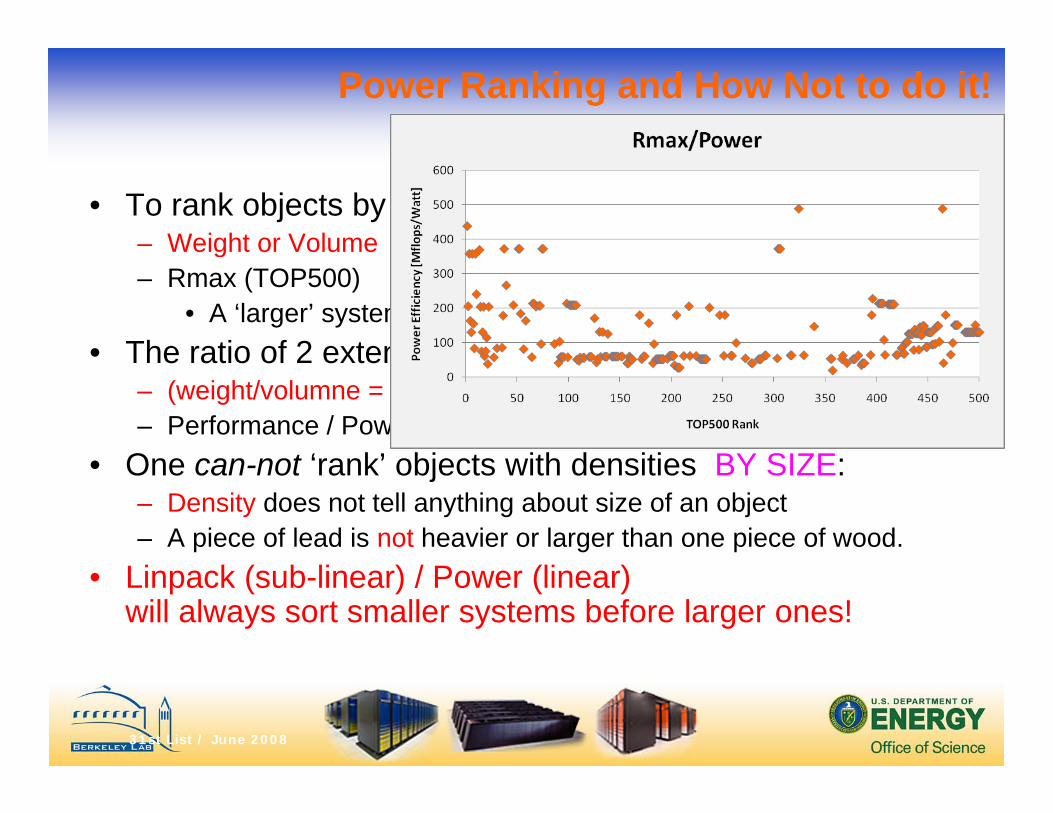
Power Ranking and How Not to do it!
• To rank objects by “size” one needs extensive properties:– Weight or Volumeg– Rmax (TOP500)
• A ‘larger’ system should have a larger Rmax.• The ratio of 2 extensive properties is an intensive one:• The ratio of 2 extensive properties is an intensive one:
– (weight/volumne = density)– Performance / Power Consumption = Power_efficiency
O t ‘ k’ bj t ith d iti BY SIZE• One can-not ‘rank’ objects with densities BY SIZE:– Density does not tell anything about size of an object – A piece of lead is not heavier or larger than one piece of wood.
• Linpack (sub-linear) / Power (linear) will always sort smaller systems before larger ones!
31st List / June 2008
The Transition to Low-Power Technology is Inevitable
Does it make sense to build systems that require the electric power equivalent of an aluminum smelter?
• Information “factories” are only affordable for a few government labs and large commercial companies (Google, MSN, Yahoo …)
electric power equivalent of an aluminum smelter?
– Midrange installations will soon hit the 1 - 2 MW wall, requiring costly new installations
Economics will change if operating expenses of a server– Economics will change if operating expenses of a server exceed acquisition cost
• The industry will switch to low-power technology within 2 - 3 years
• Embedded processors or game processors will be the next step (BG, Cell, Nvidia, SiCortex, Tensilica)
– Example RR, first Petaflops systemp , p y
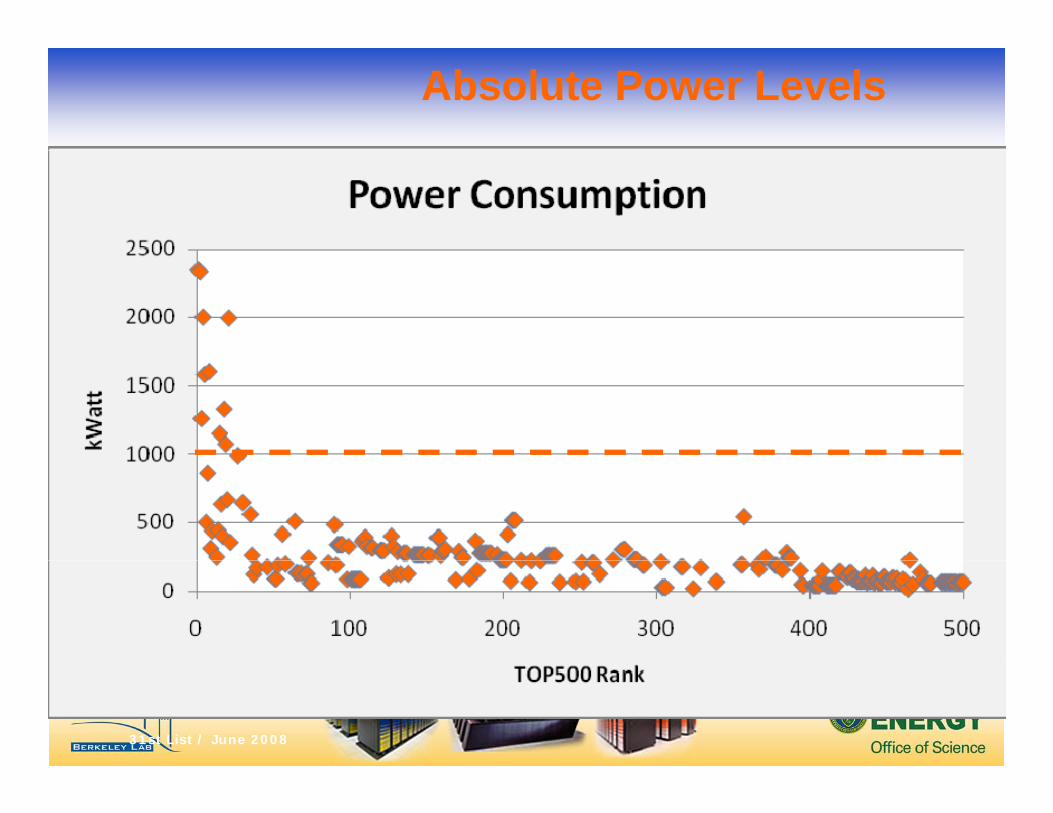
Absolute Power Levels
31st List / June 2008
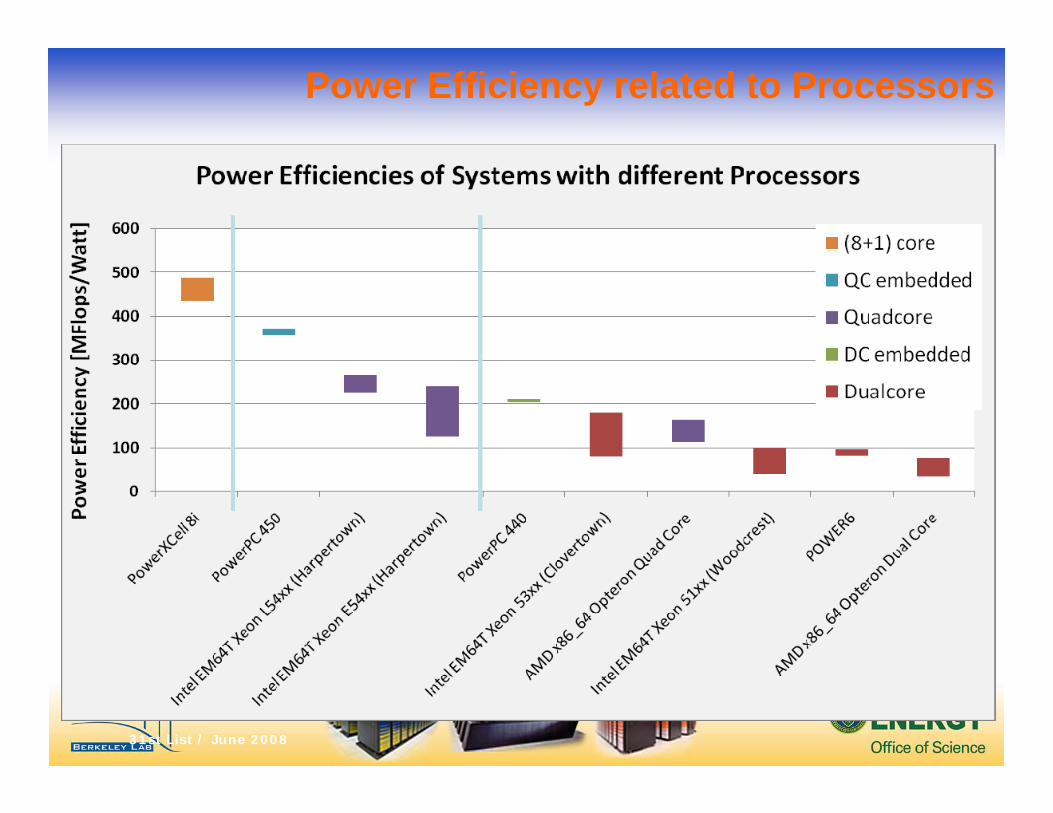
Power Efficiency related to Processors
31st List / June 2008
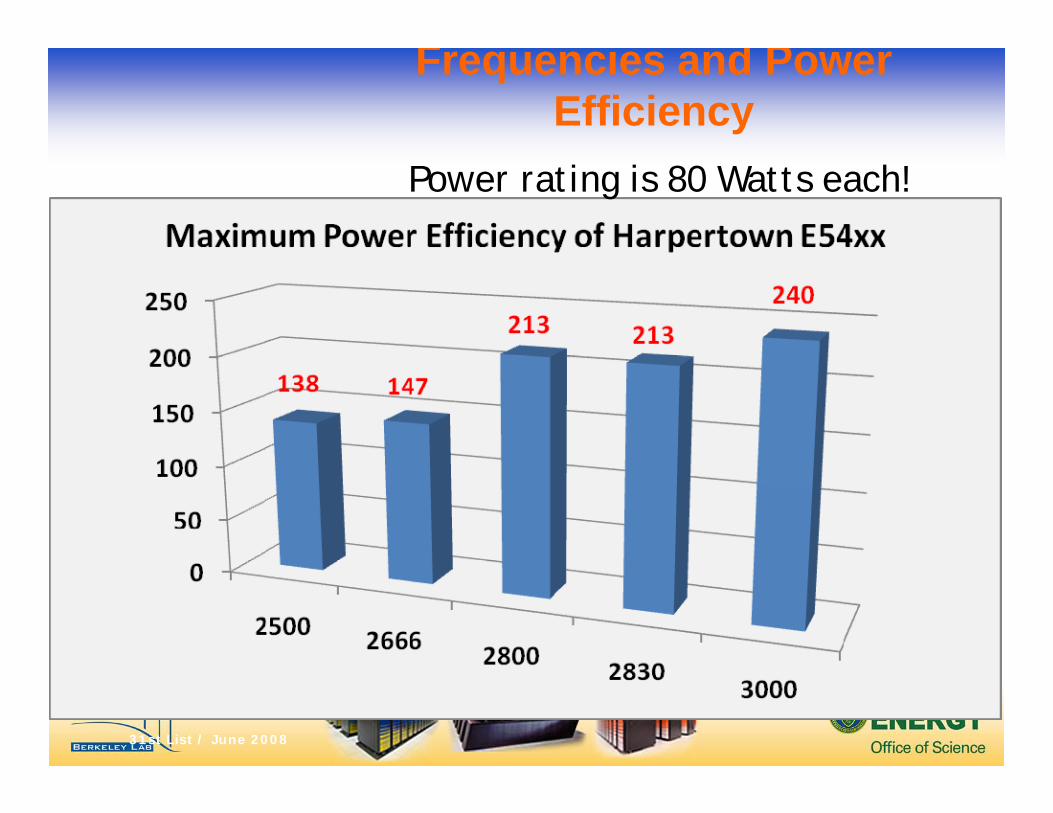
Frequencies and Power Efficiency
Power rating is 80 Watts each!
31st List / June 2008
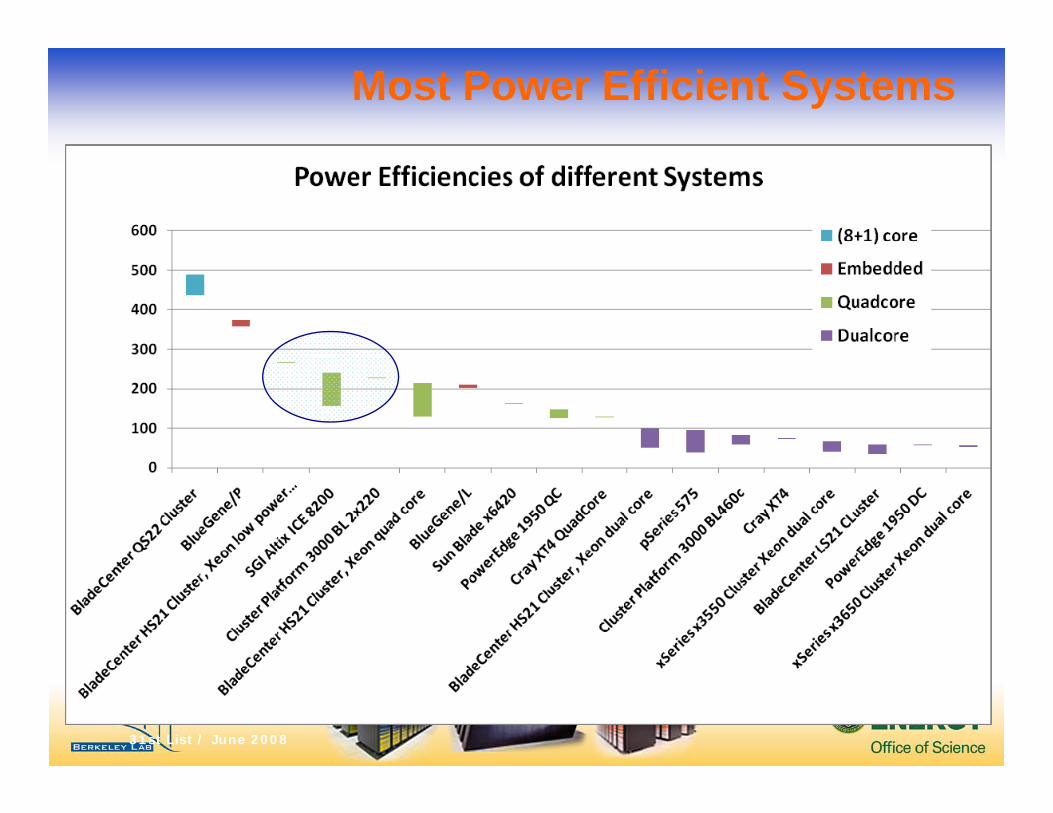
Most Power Efficient Systems
31st List / June 2008
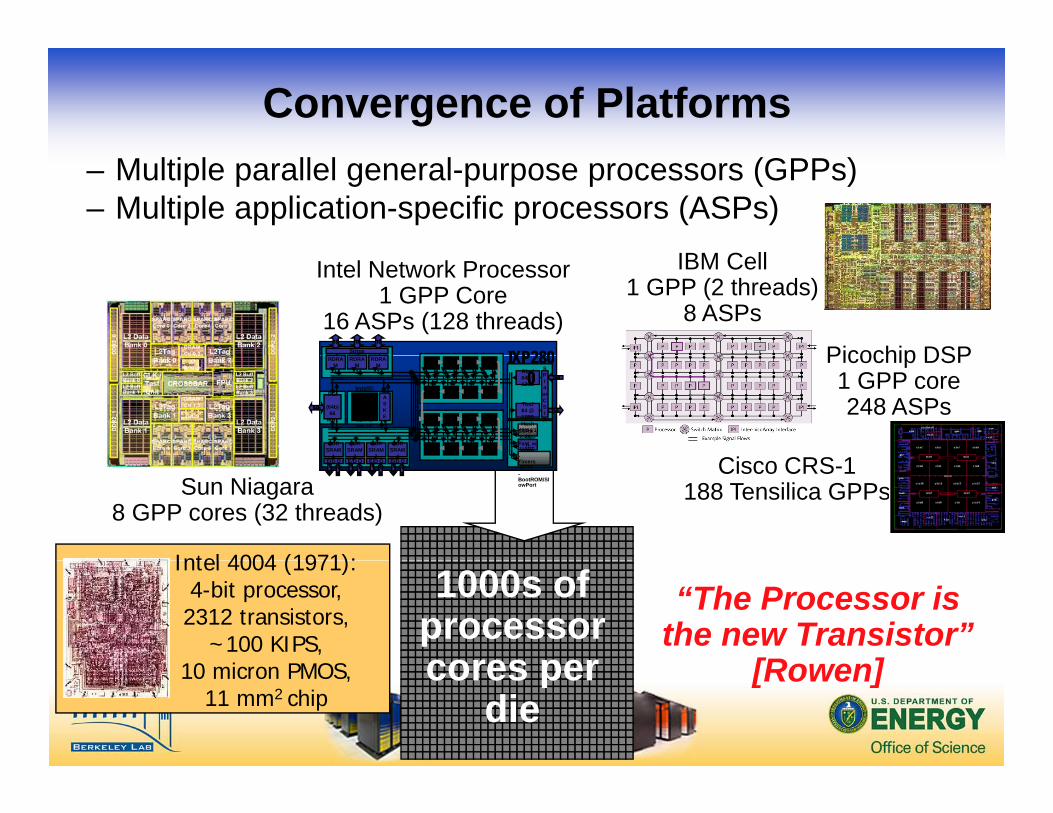
Convergence of Platforms– Multiple parallel general-purpose processors (GPPs)– Multiple application-specific processors (ASPs)
IBM C ll
IXP280IXP2801818 1818 1818
Stripe
Intel Network Processor1 GPP Core
16 ASPs (128 threads)
IBM Cell1 GPP (2 threads)
8 ASPs
Picochip DSPIntel®XScale
™Core
32K IC32K DC
MEv210
MEv211
MEv212
MEv215
MEv214
MEv213
Rbuf64 @ 128B
Tbuf64 @ 128BHash
48/64/128Scratch
16KBQDR
SRAM2
QDRSRAM
1
RDRAM1
RDRAM3
RDRAM2
GASKET
PCI
(64b)66
MHz
IXP280IXP28000 16b16b
16b16b64b64b
SPI4orCSIX
QDRSRAM
3
MEv29
MEv216
MEv22
MEv23
MEv24
MEv27
MEv26
MEv25
MEv21
MEv28
CSRs -Fast_wr-UART-
QDRSRAM
4
Picochip DSP1 GPP core248 ASPs
Ci CRS 1
Intel 4004 (1971):
Sun Niagara8 GPP cores (32 threads)
211188
1188
1188
1188
E/D Q E/D Q3
E/D Q1188
1188
Timers-GPIO-BootROM/SlowPort
4E/D Q1188
1188 Cisco CRS-1
188 Tensilica GPPs
“The Processor is the new Transistor”
[R ]
Intel 4004 (1971): 4-bit processor,2312 transistors,
~100 KIPS, 10 i PMOS
1000s of processor cores per [Rowen]10 micron PMOS,
11 mm2 chip cores per
die
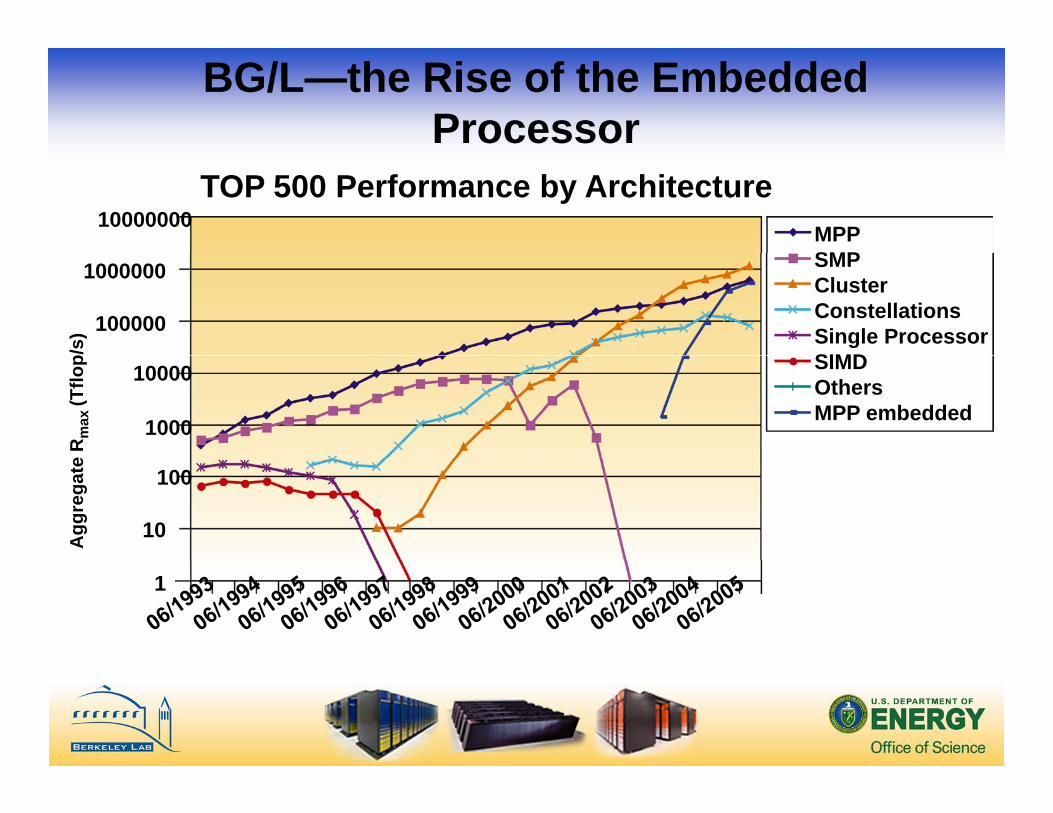
BG/L—the Rise of the Embedded Processor
TOP 500 Performance by Architecture10000000 MPP
SMP
100000
1000000 SMPClusterConstellationsSingle ProcessorSIMDp/
s)
1000
10000 SIMDOthersMPP embedded
e R
max
(Tflo
p
10
100
Agg
rega
te
1
Summary (1)
• LBNL has taken a comprehensive approach to the i ti blpower in computing problem
– Component level (investigate use of low-power components and build new system)
– System level (measuring and understanding energy consumption of system
– Computer Room level (understand airflow and cooling p ( gtechnology)
– Building Level (enforce rigorous energy standards in new computer building and use of innovative energy p g gysavings technology)
Summary (2)
• Economic factors are driving us galready to more energy efficient solutions in computingp g
• Incremental improvements are well on track, but we may ultimately needon track, but we may ultimately need revolutionary new technology to reach the Exaflop/s level and beyondreach the Exaflop/s level and beyond
Outline
1. Power consumption has become an industry-wide issue for computingy p g
2. Building and computer room energy efficiencyefficiency
3. Computer architecture for energy efficiency- the Green Flash project
4 Towards a better understanding of4. Towards a better understanding of “green computing”
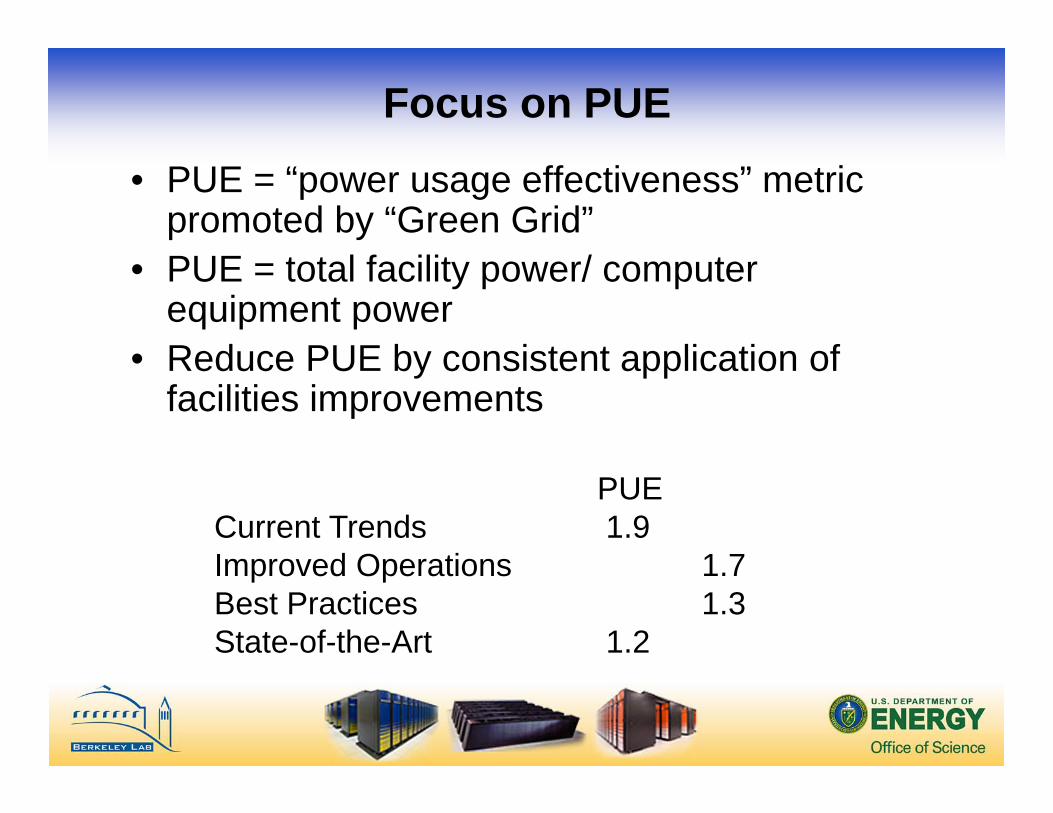
Focus on PUE
• PUE = “power usage effectiveness” metric promoted by “Green Grid”
• PUE = total facility power/ computer equipment power
• Reduce PUE by consistent application of• Reduce PUE by consistent application of facilities improvements
PUECurrent Trends 1.9Improved Operations 1 7Improved Operations 1.7Best Practices 1.3State-of-the-Art 1.2