Embed Size (px)
Citation preview
h o n Valdez Oil Spill Restoration Project Annual Report
Kenai River Sockeye Salmon Restoration
Restoration Project 94255 Annual Report
This annual report has been prepared for peer review as part of the &on Valdez Oil Spill Trustee Council restoration program for the purpose of assessing project progress. Peer review comments have not been addressed in this annual report.
Kenneth E. Tarbox Randall Z. Davis
Linda K. Brannian Steven M. Fried
Alaska Department of Fish and Game Commercial Fisheries Management and Development Division
34828 Kalifornsky Beach Road Soldotna, Alaska 99669
March 1995
Kenai River Sockeye Salmon Restoration
Restoration Project 94255 Annual Report
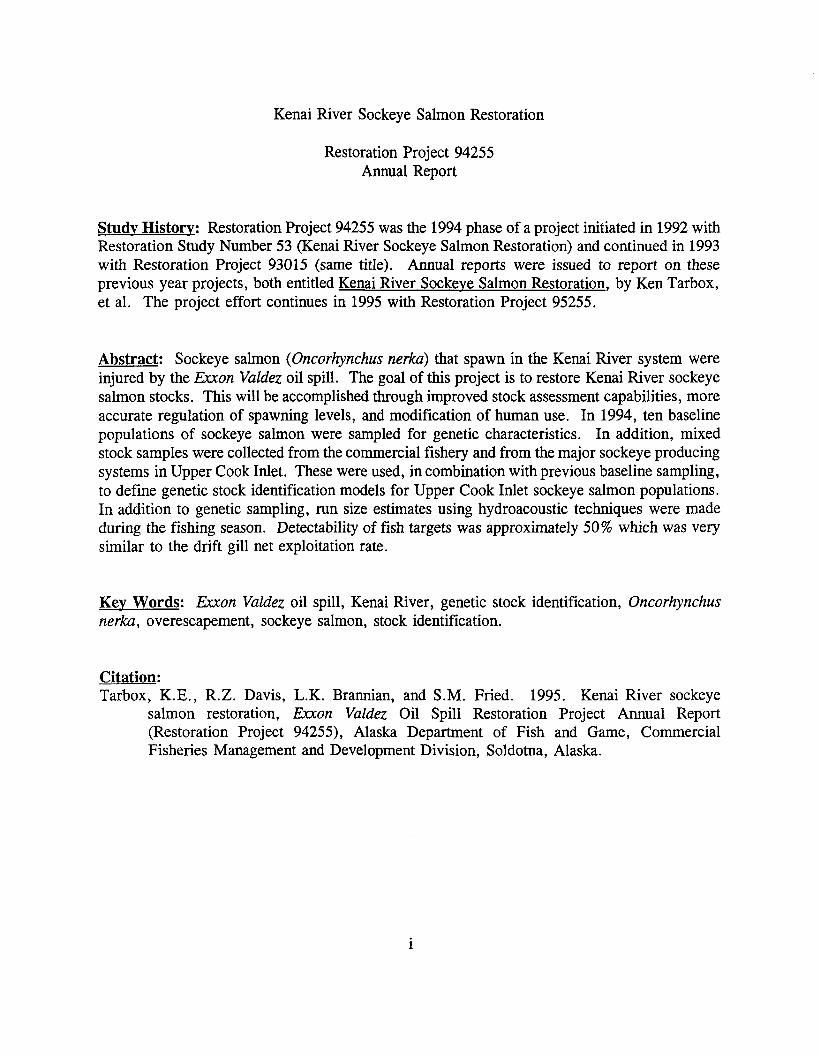
Studv Historv: Restoration Project 94255 was the 1994 phase of a project initiated in 1992 with Restoration Study Number 53 (Kenai River Sockeye Salmon Restoration) and continued in 1993 with Restoration Project 93015 (same title). Annual reports were issued to report on these previous year projects, both entitled Kenai River Sockeve Salmon Restoration, by Ken Tarbox, et al. The project effort continues in 1995 with Restoration Project 95255.
Abstract: Sockeye salmon (Oncorhynchus nerka) that spawn in the Kenai River system were injured by the Exxon Valdez oil spill. The goal of this project is to restore Kenai River sockeye salmon stocks. This will be accomplished through improved stock assessment capabilities, more accurate regulation of spawning levels, and modification of human use. In 1994, ten baseline populations of sockeye salmon were sampled for genetic characteristics. In addition, mixed stock samples were collected from the commercial fishery and from the major sockeye producing systems in Upper Cook Inlet. These were used, in combination with previous baseline sampling, to define genetic stock identification models for Upper Cook Inlet sockeye salmon populations. In addition to genetic sampling, run size estimates using hydroacoustic techniques were made during the fishing season. Detectability of fish targets was approximately 50% which was very similar to the drift gill net exploitation rate.
Kev Words: Exxon Valdez oil spill, Kenai River, genetic stock identification, Oncorhynchus nerka, overescapement, sockeye salmon, stock identification.
Citation: Tarbox, K.E., R.Z. Davis, L.K. Brannian, and S.M. Fried. 1995. Kenai River sockeye
salmon restoration, Exxon Valdez Oil Spill Restoration Project Annual Report (Restoration Project 94255), Alaska Department of Fish and Game, Commercial Fisheries Management and Development Division, Soldotna, Alaska.
REPORT NOTE: This is a report of studies that are in progress. All data and analyses provided are incomplete and preliminary. This report, as well as the data and analyses contained in the report should note be cited without an express statement of the incomplete and preliminary nature of the information.
TABLE OF CONTENTS
Pag.e
. . . . . . . . . . . . . . . . . . STUDY HISTORYIABSTRACTIKEY WORDS/CITATION i
LISTOFTABLES . . . . . . . . . . . . . . . . . . . . . . . . . . . . . . . . . . . . . . . . . . . iv
. . . . . . . . . . . . . . . . . . . . . . . . . . . . . . . . . . . . . . . . . . . LIST OF FIGURES v
. . . . . . . . . . . . . . . . . . . . . . . . . . . . . . . . . . . . . . . . LIST OF APPENDICES vi
INTRODUCTION . . . . . . . . . . . . . . . . . . . . . . . . . . . . . . . . . . . . . . . . . . . . 1
OBJECTIVES . . . . . . . . . . . . . . . . . . . . . . . . . . . . . . . . . . . . . . . . . . . . . . 1
METHODS . . . . . . . . . . . . . . . . . . . . . . . . . . . . . . . . . . . . . . . . . . . . . . . . 2
. . . . . . . . . . . . . . . . . . . . . . . . . . . . . . . . . . . . . . . Stock Identification 2
. . . . . . . . . . . . . . . . . . . . . . . . . . . . . . . . . Offshore Test Fish Program 2
RESULTS . . . . . . . . . . . . . . . . . . . . . . . . . . . . . . . . . . . . . . . . . . . . . . . . . 3
. . . . . . . . . . . . . . . . . . . . . . . . . . . . . . . . . . . . . . . Stock Identification 3
. . . . . . . . . . . . . . . . . . . . . . . . . . . . . . . . . . . . . . . Offshore Test Fish 3
DISCUSSION . . . . . . . . . . . . . . . . . . . . . . . . . . . . . . . . . . . . . . . . . . . . . . 4
. . . . . . . . . . . . . . . . . . . . . . . . . . . . . . . . . . . . . . . Stock Identification 4
. . . . . . . . . . . . . . . . . . . . . . . . . . . . . . . . . . . . . . . Offshore Test Fish 4
LITERATURECITED . . . . . . . . . . . . . . . . . . . . . . . . . . . . . . . . . . . . . . . . . 5
TABLES . . . . . . . . . . . . . . . . . . . . . . . . . . . . . . . . . . . . . . . . . . . . . . . . . 6
FIGURES . . . . . . . . . . . . . . . . . . . . . . . . . . . . . . . . . . . . . . . . . . . . . . . . . 7
APPENDICES . . . . . . . . . . . . . . . . . . . . . . . . . . . . . . . . . . . . . . . . . . . . . . 8
iii

LIST OF TABLES
Table
1. Genetic samples collected and the presence of the nematode Philonema in sockeye salmon of Upper Cook Inlet river systems, 1994 . . . . . . . . . . . . . . . . . . . . . . . . . . . . . . . . . . . . . . . . . . 6

LIST OF FIGURES
Figure
1. Map of the Kenai River drainage . . . . . . . . . . . . . . . . .
LIST OF APPENDICES
A. 1. Feasibility Study of Acoustic Techniques for Adult Salmon Assessment in Upper Cook Inlet: Preliminary Report 1994, by Richard E. Thorne, Biosonics, Inc. . . . . . . . . . . . . . . . . . . 8
A.2. Assessment of Adult Salmon in the Near-Surface Waters of Cook Inlet, Alaska, by K. Tarbox and R. Thorne . . . . . . . . . . . . . . . . . . 28
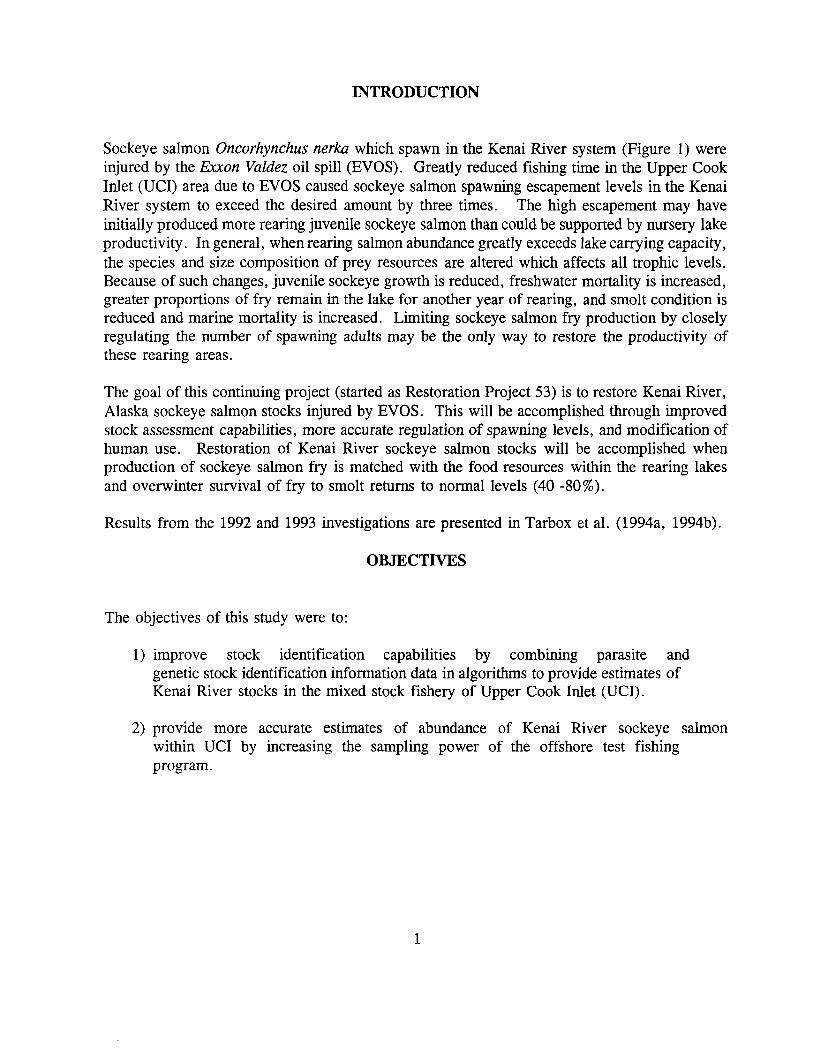
INTRODUCTION
Sockeye salmon Oncorhynchus nerka which spawn in the Kenai River system (Figure 1) were injured by the &on Valdez oil spill (EVOS). Greatly reduced fishing time in the Upper Cook Inlet (UCI) area due to EVOS caused sockeye salmon spawning escapement levels in the Kenai River system to exceed the desired amount by three times. The high escapement may have initially produced more rearing juvenile sockeye salmon than could be supported by nursery lake productivity. In general, when rearing salmon abundance greatly exceeds lake carrying capacity, the species and size composition of prey resources are altered which affects all trophic levels. Because of such changes, juvenile sockeye growth is reduced, freshwater mortality is increased, greater proportions of fry remain in the lake for another year of rearing, and smolt condition is reduced and marine mortality is increased. Limiting sockeye salmon fry production by closely regulating the number of spawning adults may be the only way to restore the productivity of these rearing areas.
The goal of this continuing project (started as Restoration Project 53) is to restore Kenai River, Alaska sockeye salmon stocks injured by EVOS. This will be accomplished through improved stock assessment capabilities, more accurate regulation of spawning levels, and modification of human use. Restoration of Kenai River sockeye salmon stocks will be accomplished when production of sockeye salmon fry is matched with the food resources within the rearing lakes and overwinter survival of fry to smolt returns to normal levels (40 -80%).
Results from the 1992 and 1993 investigations are presented in Tarbox et al. (1994a, 1994b).
OBJECTIVES
The objectives of this study were to:
1) improve stock identification capabilities by combining parasite and genetic stock identification information data in algorithms to provide estimates of Kenai River stocks in the mixed stock fishery of Upper Cook Inlet (UCI).
2) provide more accurate estimates of abundance of Kenai hve r sockeye salmon within UCI by increasing the sampling power of the offshore test fishing program.
METHODS
During the development of this project it was apparent that the most efficient way to handle data collection and reporting was to contract the offshore hydroacoustic work including report preparation. Therefore, attached as Appendix A. 1 is the contract report prepared for this phase of the project. A brief summary of methods and results are presented in this status report for overview purposes.
This report also details only the collection phase of the genetic stock identification program. Laboratory analysis and reporting of separation methods and results are covered under the status report prepared for Restoration Project 94504 (L. Seeb, personal communication, ADF&G, Anchorage).
Stock Identification
Sockeye salmon entering the major drainages of UCI were sampled for genetic and parasite characteristics in 1994. Ten baseline populations were sampled for genetic characteristics (Table 1). In addition, mixed stock samples were collected from one drift gill net fishing period and from the Kenai, Kasilof, and Yentna Rivers. Sample sizes for allozyme baseline collections were set at 100 (Allendorf and Phelps 1981, Waples 1990). Mixed stock sample sizes were set at 350 for the fisheries sample and 200 for the main river samples (L. Seeb, personal communication, ADF&G, Anchorage).
Muscle, liver, eye, and heart were dissected from recently killed sockeye salmon. Samples of these tissues were placed in labeled cryovials stored in liquid nitrogen until transferred to -80°C storage freezers located at ADF&G offices in Soldotna or Anchorage. Soldotna samples were shipped to the ADF&G Anchorage laboratory on dry ice or liquid nitrogen and again placed in - 80°C storage until processed.
The body cavity of each sockeye salmon was examined for the presence of the nematode Philonema oncorhynchi (Tarbox et al. 1991; Waltemyer et al. 1993).
Offshore Test Fish Program
In 1992 and 1993 hydroacoustic equipment and techniques were tested in UCI offshore waters. Results of this work indicated that hydroacoustic techniques could detect salmon and provide a population index for "in season" management use (Thorne and Salomone 1993). However, the primary limitation identified in the study was vessel speed relative to limitations (signallnoise ratio) of the hydroacoustic gear. Examination of the data set indicated that a minimum of 12 random orthogonal transects within UCI would be needed to provide a useable estimate of adult salmon abundance. Therefore, in 1994 an increase of vessel speed was attempted while
completing 12 randomly selected transects during two 48 hour periods. These started on 13 and 19 July (see Figures 1 and 2 in Appendix A. 1). Estimates of hydroacoustic derived salmon abundance were compared to the abundance estimates generated from the commercial harvest (method detailed in Appendix A.2).
A Model 102 Dual-Beam Scientific Echosounder with 1201420 dual frequency was used to collect data to echograms and DAT tape. The 120 and 420 kHz transducer had nominal beam widths of 7 and 6 degrees respectively. The BioFin towing vehicle was towed behind the vessel at a depth of approximately 3m. The transducers were oriented in the side-looking mode. Echogram range was 100m, and the acoustic threshold was -47 dB.
RESULTS
Stock Identification
A total of 3,391 sockeye salmon were sampled for genetic characteristics and parasites (Table 1). Sockeye salmon for baseline genetic samples were successfully collected in 10 spawning sites. A total of 7 spawning populations were sampled for a second or third year and 3 new populations were sampled. Genetic samples were transferred to the Anchorage laboratory and are currently being processed. Preliminary results indicated significant differences between stocks within the Kenai and Susitna river drainages (L. Seeb, personal communication, ADF&G, Anchorage). A complete report detailing the results of these efforts will be prepared as part of Restoration Study 94504.
The parasite Philonema was present in all systems sampled (Table 1). Infestation rates were variable ranging from 11 % to 100%. As in previous years the Central District rivers of UCI had infestation rates of greater than 95 % while Northern District systems had more variable rates (Table 1).
Offshore Test Fish
A complete report detailing results, prepared by the contractor, is attached as Appendix A. 1. In addition, a draft copy of a technical paper accepted for presentation at the ICES international symposium on fisheries and plankton acoustics is attached as Appendix A.2. The technical paper is a summary of the developmental history of this project and results to date. In addition, a slight modification in the calculation of variance is presented and should replace previous reported variance estimates. Also, techniques of run reconstruction estimates are presented.
The 1994 estimates of abundance of salmon in the fishing district was 630,000 f 187,000 and 300,000 + 100,000 fish on 13 and 19 July, respectively. Run reconstruction estimates were greater than the acoustic survey in both cases. Run reconstruction estimates were 1,220,000 and
733,000. The acoustic estimates were 52% and 41 % of the run reconstruction estimates.
DISCUSSION
Stock Identification
The number of systems sampled in 1994 exceeded the original plan and was the result of favorable weather conditions which minimized transportation delays and increased efficiency from having experienced sampling crews. All program objectives were met with the exception of sampling the commercial fishery.
Our original plan was to sample the drift gill net fleet more frequently. However, because of uncertainty in the stock separation results in the 1993 proof test we took a calculated approach in 1994. Our intent was to sample the Kenai and Kasilof rivers early in the season, run the GSI models, evaluate the results, and proceed if everything looked reasonable. What we found in the first sample was relatively poor classification of Kenai river stocks. Therefore, the drift gill net fishery samples were not collected. Instead, our efforts concentrated on improving the GSI model by collecting additional baseline samples. Results to date (reported under project 94504) indicate that this approach was successful and the GSI model will be available for the 1995 field season.
No major technical issues were evident in the sampling phase of this project. Evaluation and use of this program for management in 1995-1996 should proceed.
Offshore Test Fish
Useful management information could be obtained from acoustic estimates without 100% detection or absolute population estimates. At issue is the need for an index to substitute for commercial catch data. At detection rates of about 50% the acoustic estimate could replace the drift gill net fleet harvest in the run reconstruction models (assumes average exploitation rate of 40%). However, the factors which affect acoustic detectability need to be understood. These factors are discussed in detail in Appendix A.2.
This component of the study has met its' project objectives and ADF&G has assumed responsibility for implementation during the 1995 season. In addition, the reporting of these results at the ICES conference will aid other researchers in identifying acoustic detectability parameters.
LITERATURE CITED
Allendorf, F. W. and S. R. Phelps. 1981. Use of allelic frequencies to describe population structure. Can. J. Fish. Aquat. Sci. 38: 1507 - 1514.
Tarbox, K.E. and 5 others. 1994a. Kenai River Sockeye salmon restoration study # 53 - StatelFederal Restoration Science studies preliminary status report. Alaska Department of Fish and Game, Commercial Fisheries Management and Development Division, Regional Information Report 2A94-01, Anchorage.
Tarbox, K.E. and 5 others. 1994b. Kenai River Sockeye salmon restoration study # 93015- StatelFederal Restoration Science studies preliminary status report. Alaska Department of Fish and Game, Commercial Fisheries Management and Development Division, Anchorage.
Tarbox, K. E., A. Moles, and D. L. Waltemyer. 199 1. Presence of parasites in sockeye salmon of Upper Cook Inlet, Alaska. Alaska Department of Fish and Game, Commercial Fisheries Division, Regional Information Report 2S91-5. Anchorage.
Thorne, D. and P. Salomone. 1993. Feasibility study of acoustic techniques for adult salmon assessment in Upper Cook Inlet. Prepared for the Alaska Department of Fish and Game by BioSonics, Inc. 3670 Stoneway North, Seattle, Washington.
Waples, R. S . 1990. Temporal changes of allele frequency in Pacific salmon: implications for mixed stock fishery analysis. Can. J. Fish. Aquat. Sci. 47:968-976
Waltemyer, D.L., K. Tarbox, and L. Brannian. 1993. Presence of the parasite Philonema oncorhynchi in sockeye salmon returning to Upper Cook Inlet, Alaska in 1991. Alaska Department of Fish and Game, Commercial Fisheries and Management Division, Regional Information Report 2A93-24. Anchorage.
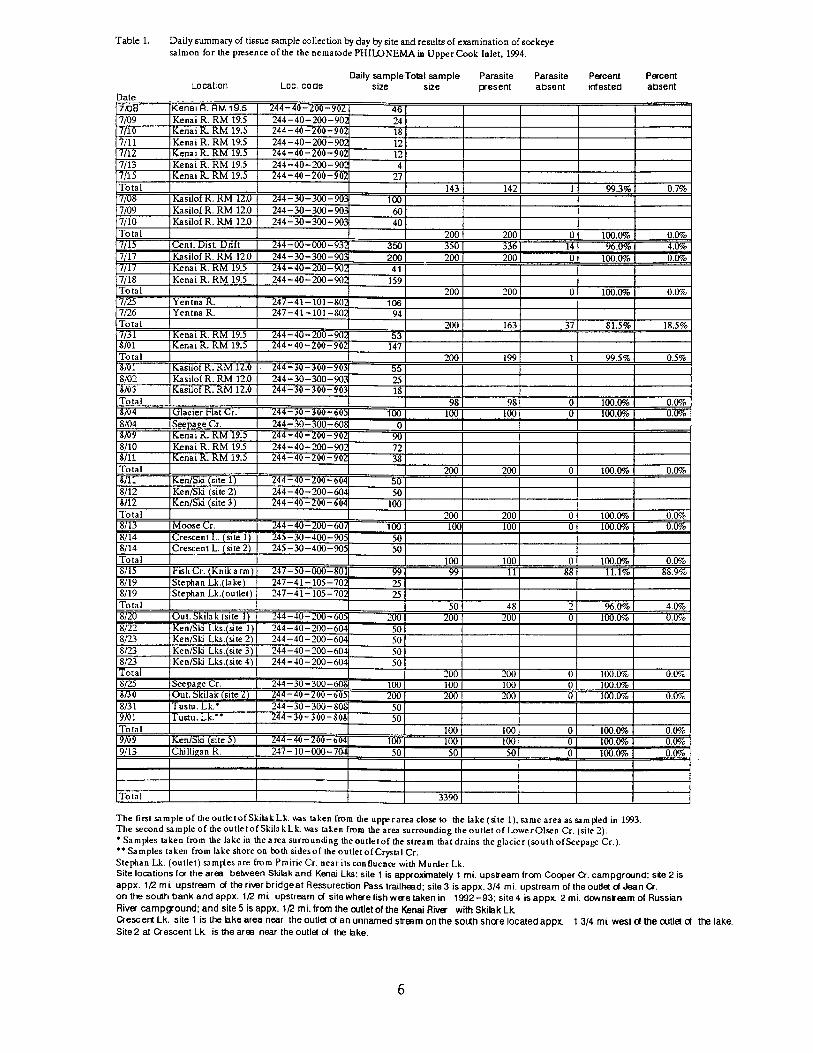
Tablc 1. Daily summary of tissue ~ m p l c collection by day by site and results of examination of sockeye salmon for the presence of the the nematode PHILONEMA in Upper Cook Inlet, 1994.
Daily sampleTotal sample Parasite Parasite Percent Percent ~ocat lon Loc. code size sue present absent lntested absent
Date
The t in t sample o f the outletofSkilakLk. was taken fmm the upperarea close to the lake (site l) , same area assampled in 1993. The second sample of theoutletofSkilakLk. was taken from the area surrounding theoutlet ofLowerOlsen Cr. (site 7). * Samples taken from the lake in the area surrounding the outlet of the stream that drains the glacier (south ofSeepag Cr.). **Samples taken from lake shore on both sidesol the outlet of Crystal Cr. Stephan Lk. (outlet) sam$es are f rom Pnirie Cr. near itsconlluenae with Murder Lk. Site locations f a the area beween Skihk and Kenai Lks: site 1 is appoxinately 1 mi. upsream from Cooper Cr. campgramd; site 2 is appx. 112 m i upstream d the river bridgeat Ressurection Pass trailhead; site3 is appx. 314 mi. upstream of the outlet d Jean Cr. on the south bank and appx. 1R m i upstream d site where fish were taken in 1992-93: site 4 is appx 2 mi. dwns team of Russian River campground: and site 5 is appx. 1R mi. from the outlet of the Kenai Rive. with Skihk Lk Crescent Lk. site 1 is the $he area near the outlet d an unnamed stream on the south shae located appx 1 314 m i west d the outlet d the lake Site2 at Crescent Lk is the area near the outlet d the Bke.
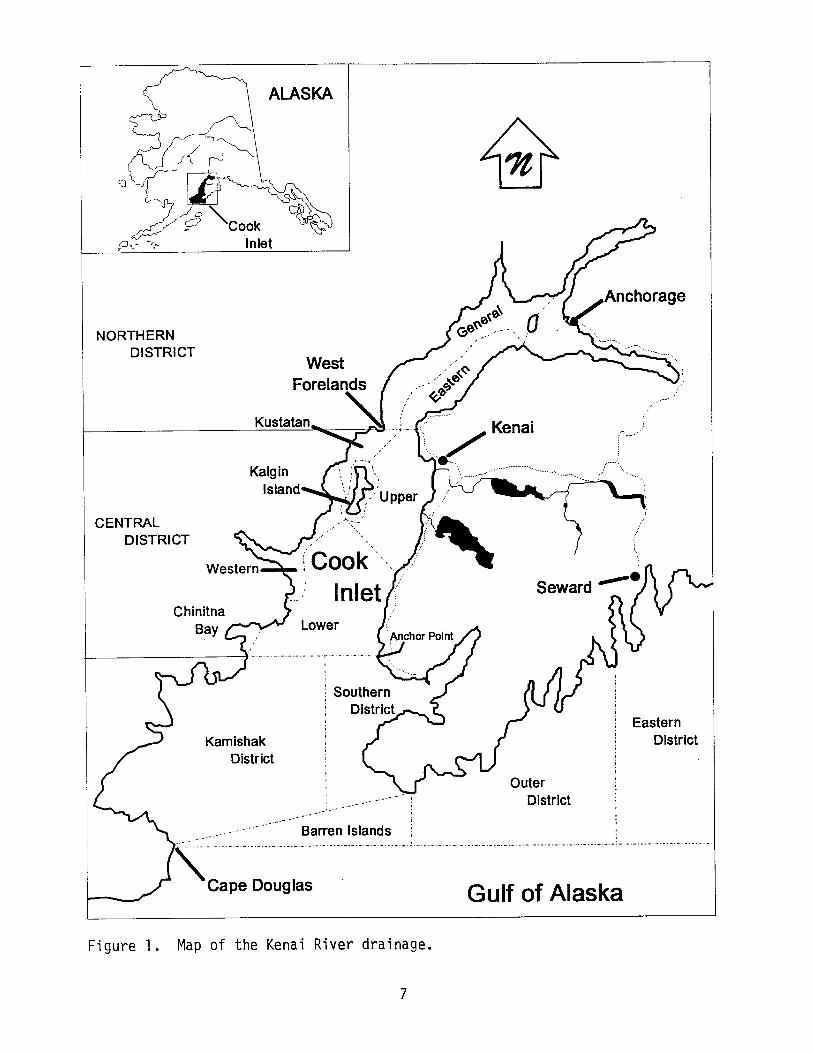
F i g u r e 1 . Map of the Kenai R i v e r d r a i n a g e .
7

Appendix A. 1
Feasibility Study of Acoustic Techniques for Adult Salmon Assessment in Upper Cook Inlet:
Preliminary Report, by Richard E. Thorne, Biosonics, Inc.
FEASIBILITY STUDY OF ACOUSTIC TECHNIQUES FOR ADULT SALMON
ASSESSMENT IN UPPER COOK INLET
PRELIMINARY REPORT - 1994-
Prepared by
Richard E. Thorne BioSonics, Inc.
October 3,1994
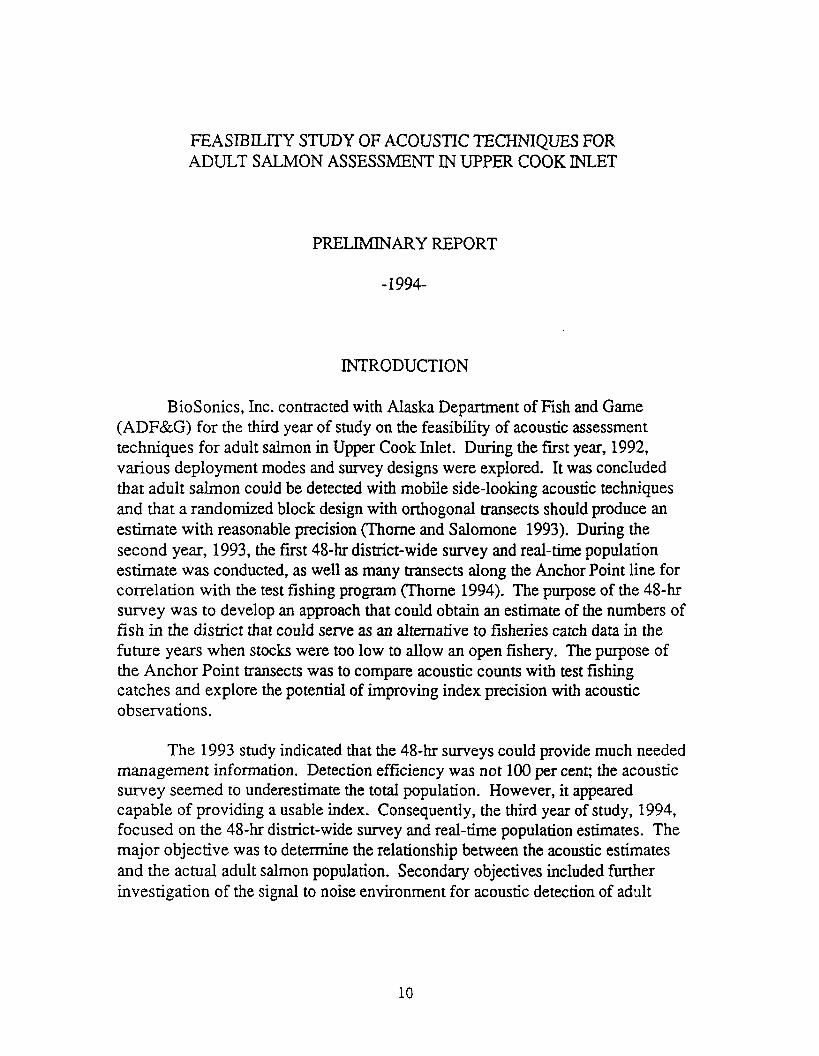
FEASIBILITY STUDY OF ACOUSTIC TECHNIQUES FOR ADULT SALMON ASSESSMENT IN UPPER COOK INLET
PRELIMINARY REPORT
INTRODUCTION
BioSonics, Inc. contracted with Alaska Department of Fish and Game (ADF&G) for the third year of study on the feasibility of acoustic assessment techniques for adult salmon in Upper Cook Inlet. During the first year, 1992, various deployment modes and survey designs were explored. It was concluded that adult salmon could be detected with mobile side-looking acoustic techniques and that a randomized block design with orthogonal transeck should producean estimate with reasonable precision (Thorne and Salomone 1993). During the second year, 1993, the first 48-hr district-wide survey and real-time population estimate was conducted, as well as many transects along the Anchor Point line for correlation with the test fishing program (Thorne 1994). The purpose of the 4 8 4 . survey was to develop an approach that could obtain an estimate of the numbers of fish in the district that could serve as an alternative to fisheries catch data in the future years when stocks were too low to allow an open fishery. The purpose of the Anchor Point transects was to compare acoustic counts with test fishing catches and explore the potential of improving index precision with acoustic observations.
The 1993 study indicated that the 48-hr surveys could provide much needed management information. Detection efficiency was not 100 per cent; the acoustic survey seemed to underestimate the total population. However, it appeared capable of providing a usable index. Consequently, the third year of study, 1994, focused on the 48-hr district-wide survey and real-time population estimates. The major objective was to determine the relationship between the acoustic estimates and the actual adult salmon population. Secondary objectives included further investigation of the signal to noise environment for acoustic detection of adult
salmon and measurement of the target strength characteristics of the adult salmon. These factors clearly affected the detection efficiency of the acoustic surveys.
This report provides preliminary results of the 1994 surveys. Specifically, it details the results of the two 48-hr surveys that were conducted and the relationship of the results of these surveys to other information about the populations of salmon that were present at the time of the surveys. It also examines the detection efficiency as a function of range and its relationship to population estimation. This preliminary report does not include the resuits of the target strength measurements conducted in 1994 as that work is yet to be completed.
Two 48-hrs surveys were conducted: the first during July 13 and 14, and the second during July 19 and 20. The acoustic equipment consisted of a dual- frequency (120 and 420 kHz) dual-beam BioSonics Model 102 Scientific Echo sounder, a BioSonics Model 11 1 Thermal Chart Recorder, a BioSonics Model 171 tape recording interface, a Sony Walkman Digital Analog Tape Recorder (DAT), and associated test equipment, cables, dual-beam transducers and a BioSonics BioFin towing vehicle. Primary settings and connections of the equipment are listed in Table 1. The survey was conducted with the charter vessel, Angeline.
Both 48-hr area wide surveys consisted of twelve transects. The frrst survey used the identical transects as in 1993 (Fig. 1). The second series altered the location of one transect to improve the statistical characteristics of the data (Fig. 2).
The two acoustic transducers, one at 120 lcHz and one at 420 kHz, were mounted on the BioFin towing vehicle in a side-looking mode. The nominal beam widths were 7 degrees for the 120 and 6 degrees for the 420. During 1993, the towing vehicle was towed behind the boat at a depth of about 3 m and the two acoustic beams were oriented perpendicular to the vessel track, one looking starboard and the other port. In 1994, following recommendations of the 1993 study, the towing vehicle was towed dong the starboard side of the boat, at a depth of about 2 m, and both transducers were aimed in the same direction, perpendicular to the vessel track pointing starboard. Both frequencies were operated simultaneously. All data were recorded on the DAT. Echograms were produced in real-time on only one frequency at a time. Initially, the frequencies were alternated at 15 min periods, but later on the 120 kHz frequency was primarily used because of better propagation conditions. Echograms were produced for both frequencies for all sampling periods in post processing. Echogram range was 100 m. For the initial survey, July 13 and 14, the same marking threshold was used as in 1993. It corresponded to a -47 dB acoustic target strength based on the calibration data for the 1993 survey.
Data for the real-time population estimate were obtained from the echograms in a same fashion as in 1993. For each transect, the number of fish were counted within 20 m wide range intervals from 0 to 100 m. Based on protocols developed previously, the highest interval count was used for the estimate unless two or more were similar, in which case the average was used. Sampled area was calculated as 20 m times the length of the transect. Fish de~lsj 111
was estimated as the number of detected fish along the transect divided by the sampled area. The fish population estimate for each transect was the fish density for the transect extrapolated over the total area represented by the transect.
The total surface area of the survey, 3,295 million square meters, was divided into three regions, south, central and north. For the first survey, four orthogonal transects were run within each of the three areas. Means and variances were obtained for each area, then summed for the total population estimate as in the 1992 study (Scheaffer, Mendenhall and Ott, 1979; Thorne and Salomone, 1993). For the second survey, five transects were run in the south area, where the largest numbers of fish were typically observed, four transects were run in the central area, and three in the north area.
During post survey analysis, the DAT tapes were used to produce echograms for all transects at both frequencies. These echograms were then examined to obtain echo counts in 20-m range intervals to 100 m and to compare frequencies. These data were used to investigate detectability as a function of range and noise conditions. Also, portions of the taped data were processed with a BioSonics Model 281 Dual-Beam Signal Processor to investigate target strength characteristics of the adult salmon.. Finally, target characteristics were evaluated to examine the spatial characteristics of the salmon, especially schooling tendencies that would result in multiple target echoes, as well as sources of false targets that could result in error.
RESULTS
Real-Time Po~ulation Estimates
The number of fish detected during the first series, July 13-14, based on the 1993 threshold, was much lower than expected. The series was reanalysed with a 2 dB lower threshold to evaluate the possibility that the system gains had changed in the intervening year. Noise levels were still very reasonable at the lower threshold, and there was a substantial increase in the number of targets that were detected. The population estimate fkom the lower threshold was 630,000 fish with a confidence interval of plus or minus 166,000 fish (Table 2).
The lower threshold was maintained for the second series, July 19-20. The resulting population estimate was 300,000 fish with a confidence interval of plus or minus 89,000 fish (Table 3).
The number of fish detected by 20 m range interval for various sections of transects for both series, based on the revised threshold, are given in Appendix 1.
There was a district wide fishery opening immediately after the first series. Total salmonid catch was 471,000 fish. Assuming a 40% exploitation rate, the estimated number of fish in the district was about 1,175,000 fish, or almost twice as many as were detected by the acoustic survey.
A district wide fishery was open the day before the second acoustic series. The total salmonid catch was 354,000 fish. Assuming a 40% exploitation rate, the estimated fish population at the time of the fishery was 885,000 fish. The number at the time of the survey would have been reduced by the amount of catch and would have had some immigration, which would suggest a population on the order of 550,000 to 600,000 fish at the time of the survey, again, almost twice as many as were detected by the acoustic survey.
Evaluation of Factors Affecting Fish Detections
The 1993 study showed that several factors can affect the capability of the acoustic system to detect fish. These factors can be categorized as range dependent factors, and range independent factors. Range dependent factors include winds which affect the smoothness of the water surface boundary, and reflections off the bottom from peripheral portions of the acoustic beam at
shallower depths. Range independent factors include echoes from rips, kelp and other non-fish objects.
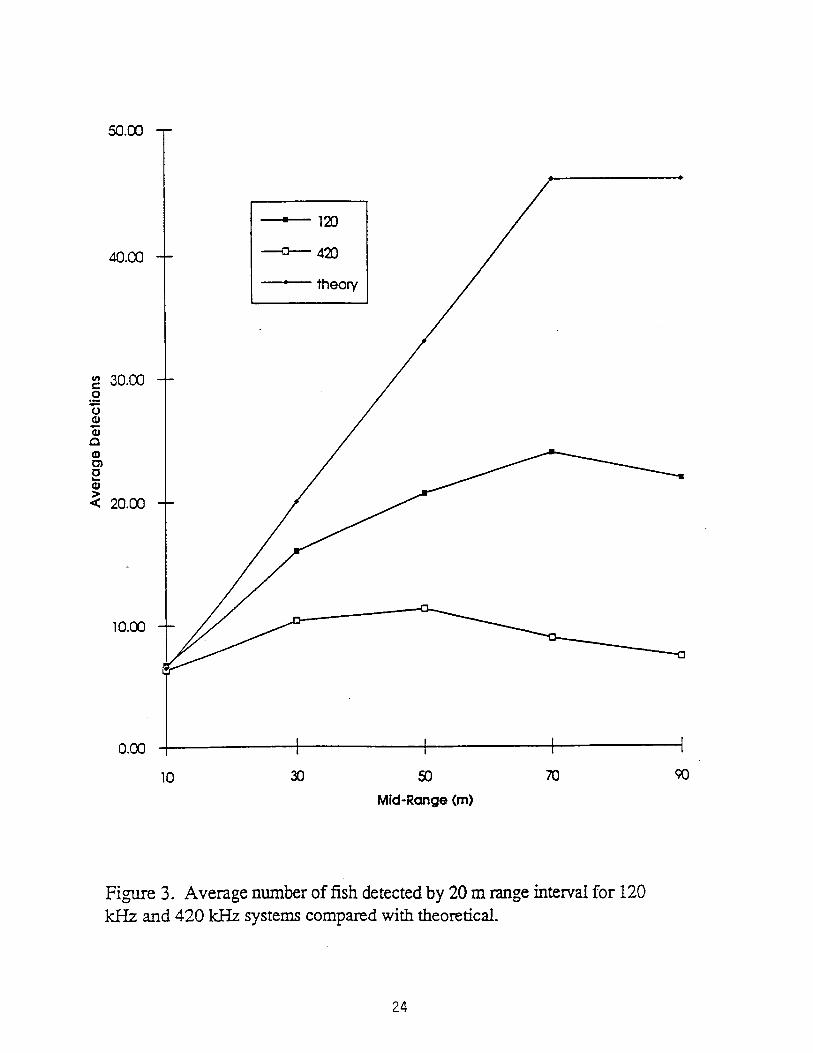
Under perfect conditions, the number of fish that are detected should increase with range until the depth extent of the fish is encompassed. The average number of fish that were detected during the July 13-14 series as a function of range is shown in Fig. 3. Both frequencies had very similar detections in the frrst 20 m, as would be expected since both have similar beam widths, and range effects would be minimal. Detections on the 120 kHz systems increase with range to a peak in the 60 to 80 m interval, then decline. The decline after 80 m may represent a combination of noise effects and expansion of the beam to below the depth range of the adult salmon. At 80 m, the 120 kHz beam would have about 12 m vertical coverage. Detections at 420 kHz fall off more rapidly.. The frequency difference most likely represents the increased attenuation loss at 420 kHz which makes it more vulnerable to increasing noise at range.
If the detections in the 0 to 20 m range represent the true fish density, then, in the absence of range losses, we would expect detections to increase Iinearly with range as long as the beam is within the depth range of the fish. Based on the 1992 study, the depth extent of the adult salmon is about 12 m, so detections would theoretically level off at that point. Fig. 3 shows that even the 120 lcHz system does not increase with range as rapidly as would be expected. If the theoretically derived value at 70 m represents the true detections under ideal conditions, then actual detections are about 35% of true in the 20-40 m range interval, about 45% of true in the 40-60 m range interval, and about 52% of true in the 60-80 m ranges. Since the 48-hr estimates are based principally on the 40-60 m and 60-80 intervals, this indication of detection efficiency is in very good agreement with the observed relationship between the acoustic estimates and those derived from the fishery, which suggest detection efficiency slightly over 50%.
Range independent factors do not appear to be a major problem in the surveys. Kelp does return echoes that are often similar in magnitude to those from fish, but kelp are not widespread and can be visually noted. There were occasions where both fish sign (jumpers) and kelp were in proximity, but the occurrence was rare. Fish were clearly associated with rips, and entrained air and debris can either return echoes that are similar to fish, or mask the presence of fish targets. However, fish appeared to be near the rips, but not actually in the rips, so separation appeared to be possible in most cases.
Spatial Considerations
In the majority of cases, the echoes appeared to represent individual fish. However, there were exceptions, particularly during the first series and in the southern area. Fish clearly became more dispersed as they moved north, and as the season progressed.
Although targets were distributed over a wide area, there were clearly concentrations associated with rips.
DISCUSSION AND CONCLUSIONS
The two 48-hr real-time estimates obtained during this study indicated that the acoustic survey detected slightly better than half the fish. If this efficiency is consistent, it would provide a usable management tool. The numbers appeared to track the true population for the two surveys, and the precision obtainable in 48 hrs was reasonable.
The major source of underestimation appears to be deterioration of signal to noise conditions with range. For accurate estimation it would be necessary to detect all fish over the entire depth extent of the adult salmon. It is clear from the results of the 1993 and 1994 studies that detection losses occur with range before the beam can fully encompass the complete depth extent. Detection loss occurs because of noise that results from surface, and occasionally bottom reverberation.
The problem is compounded by the target characteristics of the fish. Side- aspect target strength is highly variable because of the potential of head or tail aspects, which have low returns. Thus while adult salmon represent large acoustic targets under most conditions and can be readily detected, lower target returns from less favorable aspect orientations are often masked by the noise sources.
There are several avenues to increase detection efficiency. However, as confidence intervals appear to be reasonable at the current level of detection efficiency, it is more important for management purposes for detection efficiency to be as consistent as possible. This means consistency in transducer orientation, corrections for range effects, and consistent target threshold criteria The latter is simply a matter of timely system calibration information, and should not be a serious problem. Sufficient information has been obtained during the past two years of study to make reasonable adjustments for range effects. However, reasonable weather conditions for most of the 48-hr period is critical for quality data since surface reverberation from rough water conditions is the major source of noise.
Consistent orientation could most readily be insured by overlapping the orientation of the two transducers by a few degrees, then selecting the transducer with the best near-surface coverage, or combining the results to achieve better overall coverage (and higher detection efficiency). After three years of 120 kHz and 420 kHz, it is clear that the 120 kHz provides better detection, as expected with the slightly wider beam and lower attenuation. Conversion to two 120 kHz
transducers that were slightly overlapped would be an improvement over the current configuration.
Analysis of the 48-hr survey data was rapid. Using a simple calculator, it was possible to complete the population estimate and variance within 20 mins of the completion of the survey.
REFERENCES
Scheaffer, R.L., W. Mendenhall and L. Ott 1979. Elementary survey sampling Duxbury Press, Belmont, CA 278 p.
Thorne, R.E. 1994. Feasibility study of acoustic techniques for adult salmon assessment in Upper Cook Inlet, 1993. F i a l Contract Report to Alaska Dept. of Fish and Game, BioSonics, Inc. Seattle.
Thorne, R.E. and E.S. Kuehl 1989. Impacts of noise on the estimation of downriver migrating salmonids. Proc. Inst. of Acoustics, VII (3), 8 p.
Thorne, R.E. and P. Salomone 1993. Feasibility study of acoustic techniques for adult salmon assessment in Upper Cook Inlet. Final Contract Report to Alaska Dept. of Fish and Game, BioSonics, Inc. Seattle.
ACKNOWLEDGMENTS
I would like to acknowledge the cooperation of the crew of the Anseline in the survey effort.
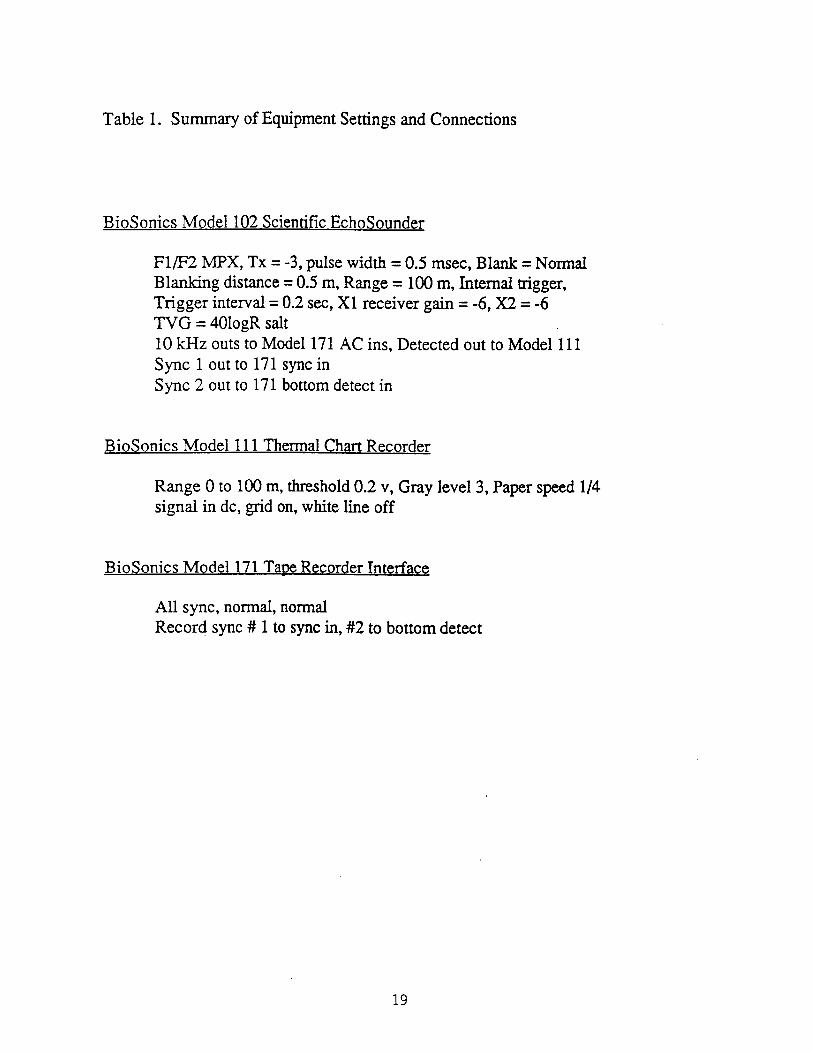
Table 1. Summary of Equipment Settings and Connections
BioSonics Model 102 Scientific Echosounder
Fl/F2 MPX, Tx = -3, pulse width = 0.5 msec, Blank = Normal Blanking distance = 0.5 m, Range = 100 m, Internal trigger, Trigger interval = 0.2 see, X1 receiver gain = -6, X2 = -6 TVG = 401ogR salt 10 kHz outs to Model 171 AC ins, Detected out to Model 111 Sync 1 out to 171 sync in Sync 2 out to 171 bottom detect in
BioSonics Model 11 1 Thermal Chart Recorder
Range 0 to 100 m, threshold 0.2 v, Gray level 3, Paper speed 114 signal in dc, grid on, white line off
BioSonics Model 171 T a ~ e Recorder Interface
All sync, normal, normal Record sync # 1 to sync in, #2 to bottom detect
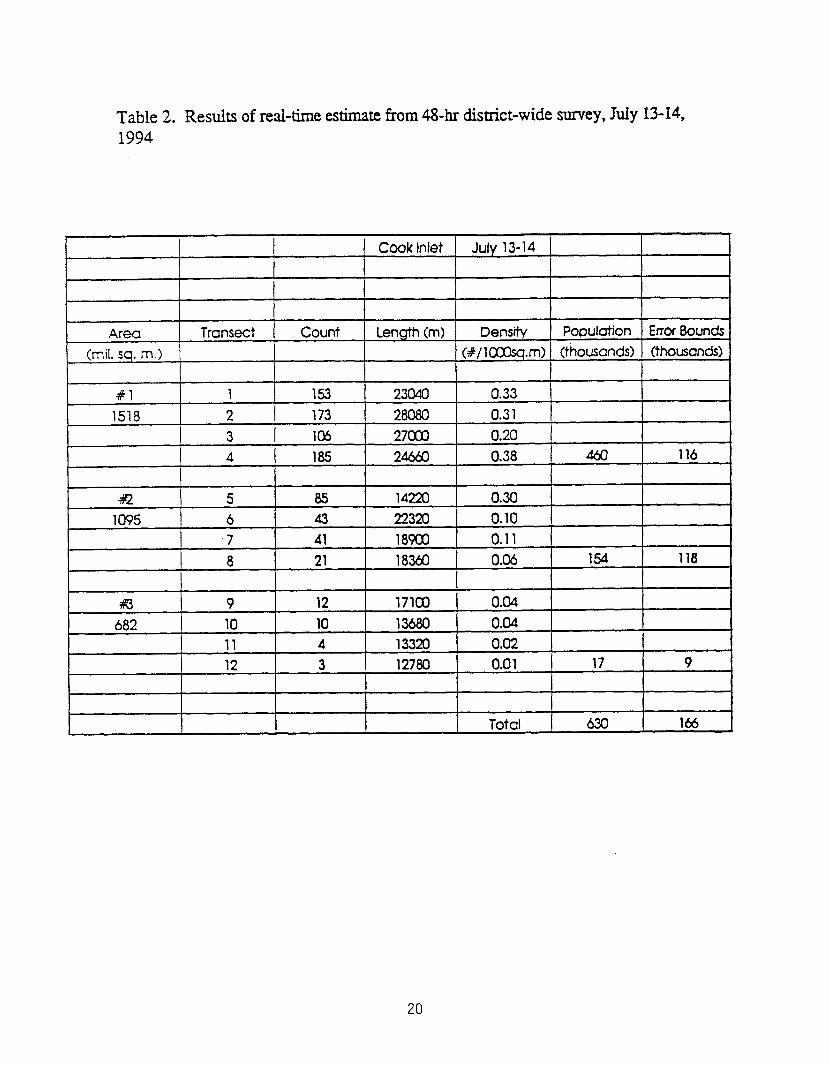
Table 2. Results of real-time estimate from 48-hr district-wide survey, July 13-14, 1994
I
Enar Bounds
July 13-14
Densrty
I
Population Count Area (#/I 0Xsq.m)
0.33 0.3 1 0.20 0.38
Cook Inlet
Length (m) Transect (mil. sq. rn.)
# 1 1518
1 53 173 la5 1 85
1 2 3 4
23040 28080 2 7 W 24660
(fhousands) , (thousands)
460 116
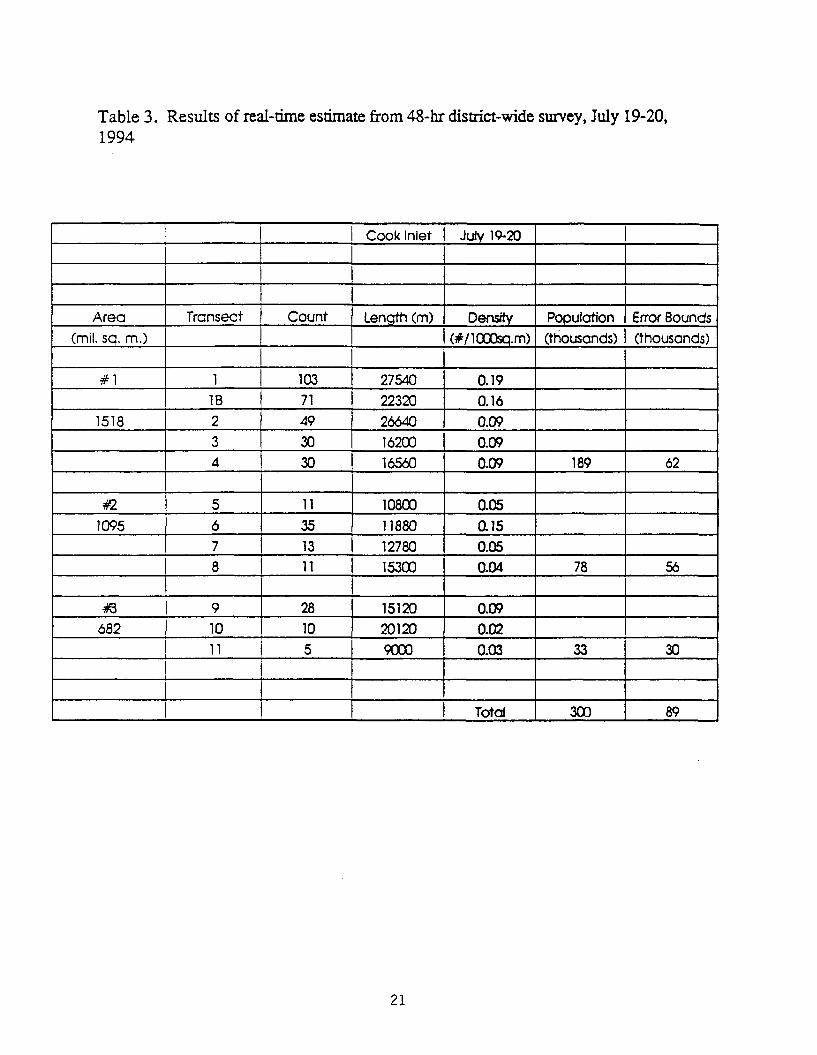
Table 3. Results of real-time estimate from 48-hr district-wide survey, July 19-20, 1994
Area (mil. sq. m.)
Cook Inlet
Length (m)
27540 22320 26640 162a3 16560
1
43 682
July 19-20
Density (#I 1 a30sq.m)
0.19 0.16 0.09 0.09 0.09
Transect Count
103 7 1 49
30 30
% 1 I 1
9 10 1 1
I
1518
Population (thousands)
189
1 B 2 3 4
28 10 5
Error Bounds (thousands)
62 I
15120 20120 9000
O.W 0.02 0.03
Total
33
300
30
89
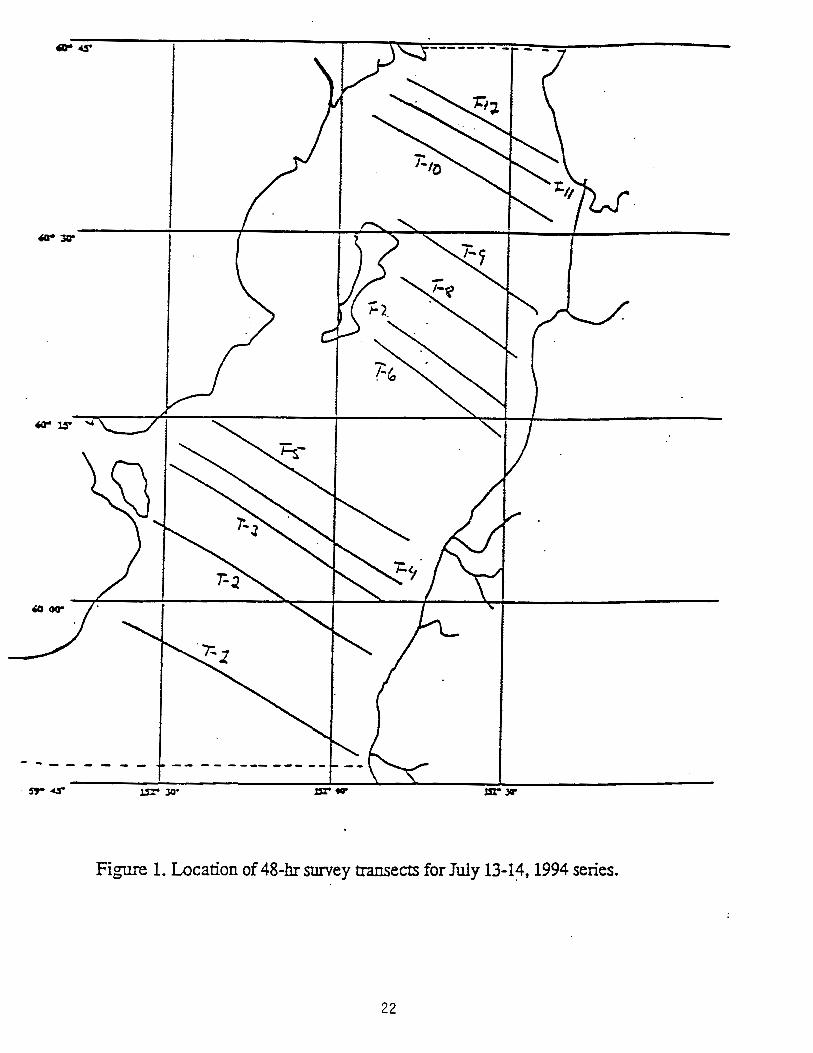
Fi,- 1. Location of 48-hr swey for July 13-14,1994 series.
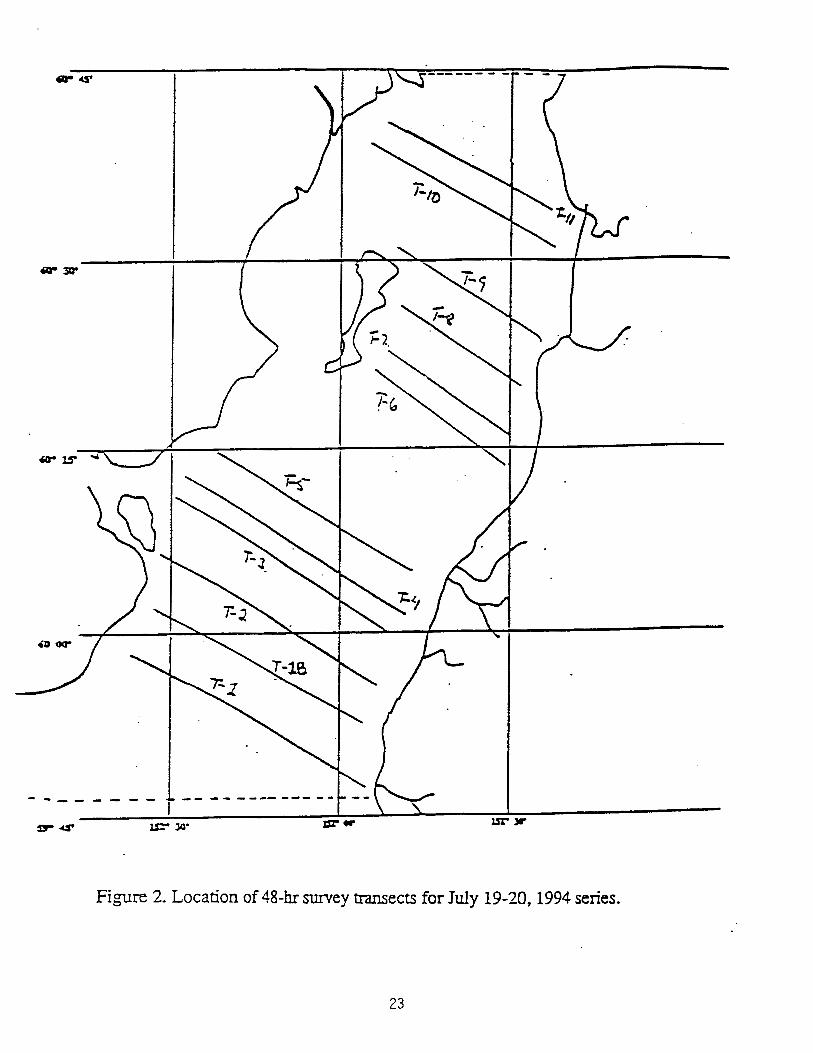
Fi,- 2. Location of 48-hr survey transects for July 19-20, 1994 series.
50
Mid-Range (m)
Figure 3. Average number of fish detected by 20 m range interval for 120 lcHz and 420 kHz systems compared with theoretical.
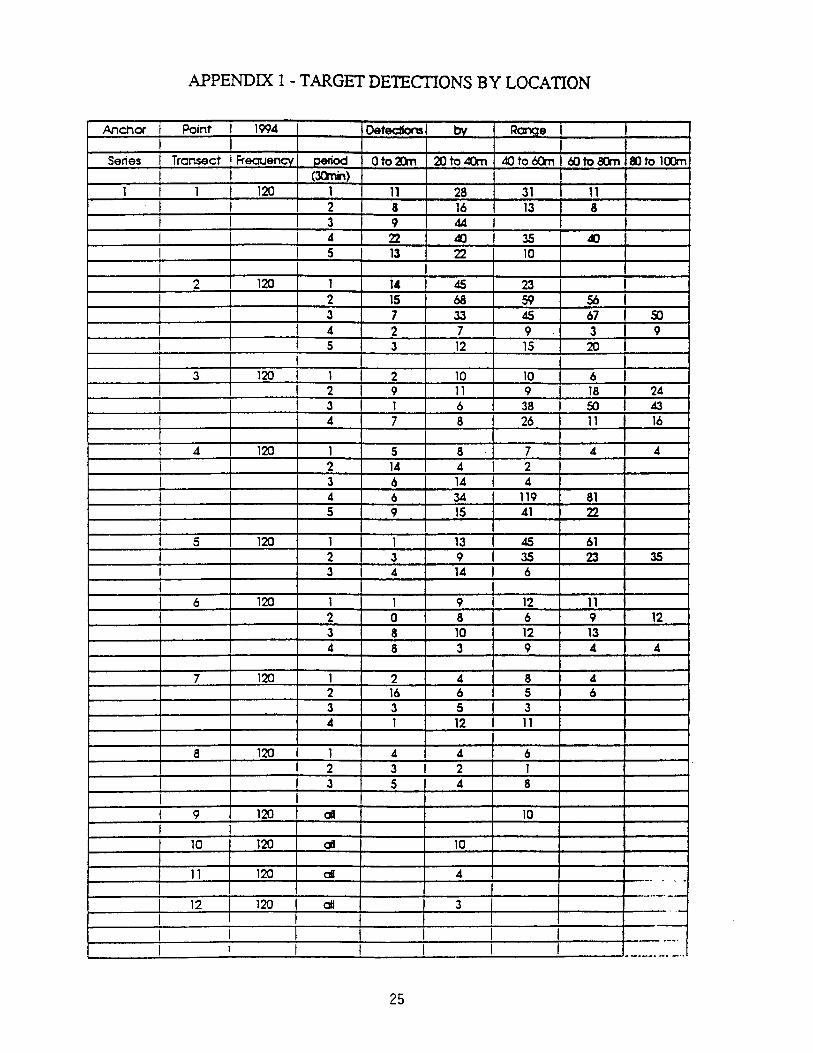
APPENDIX 1 - TARGET DETECTIONS BY LOCATION
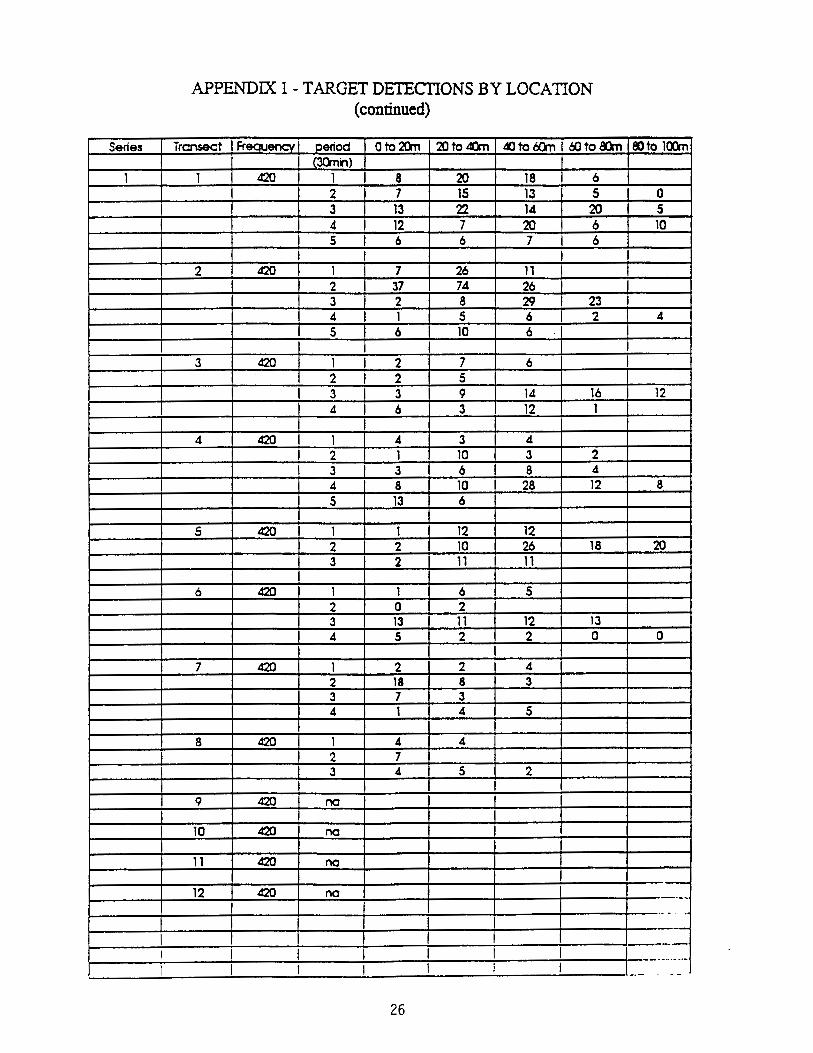
APPENDIX 1 - TARGET DETECI'IONS BY LOCATION (continued)
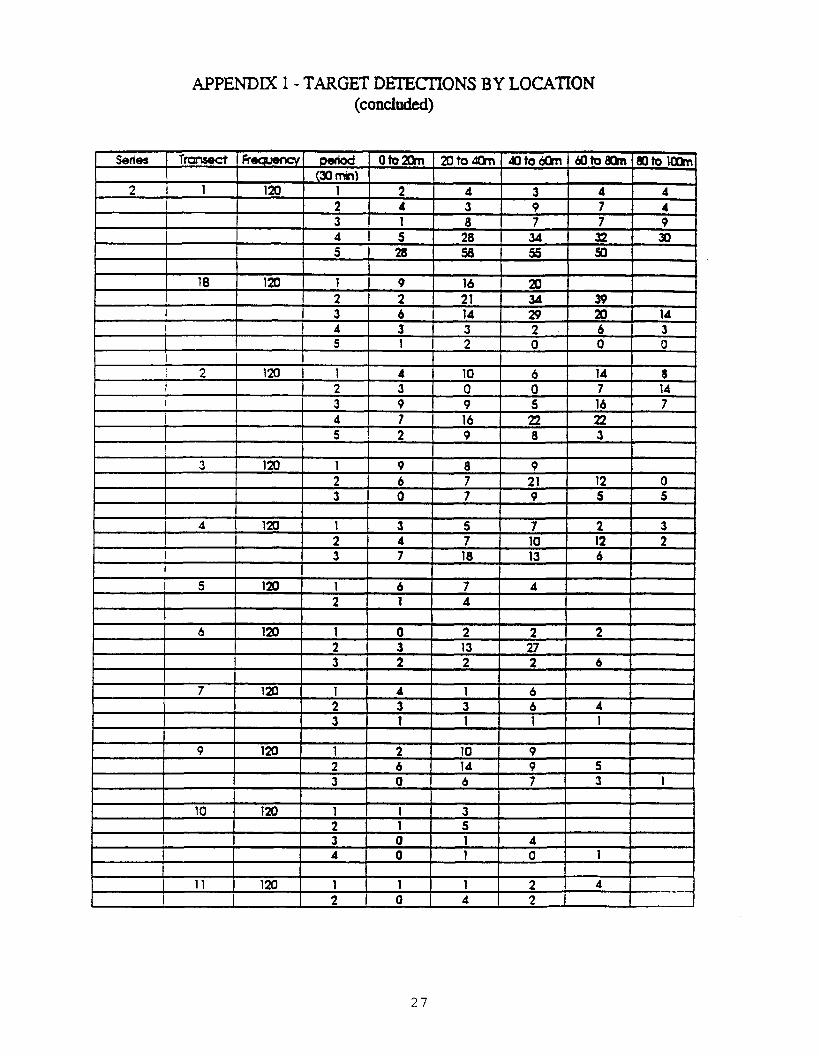
APPENDIX 1 - TARGET DETECTIONS BY LOCATION (concluded)

Appendix A. 2
Assessment of Adult Salmon in Near-Surface Waters of Cook Inlet, Alaska by K. Tarbox and R. Thorne
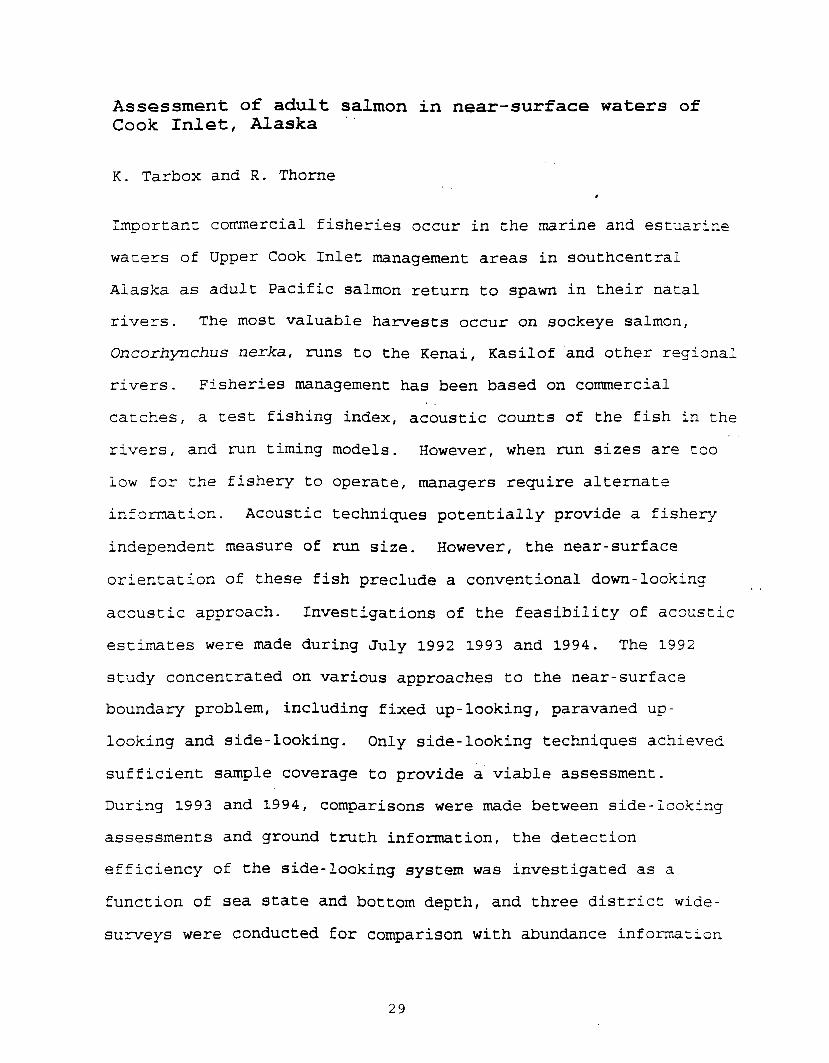
Assessment of adult salmon . . in near-surface waters of Cook Inlet, Alaska
K. Tarbox and R. Thorne *
Important commercial fisheries occur in the marine and estuarine
waters of Upper Cook Inlet management areas in southcentral
Alaska as adult Pacific salmon return to spawn in their natal
rivers. The most valuable harvests occur on sockeye salmon,
Oncorhynchus nerka. runs to the Kenai, Kasilof and other regional
rivers. Fisheries management has been based on commercial , .
catches, a test fishing index, acoustic counts of the fish in the
rivers, and run timing models. However, when run sizes are too
low for the fishery to operate, managers require alternate
information. Acoustic techniques potentially provide a fishery
independent measure of run size. However, the near-surface
orientation of these fish preclude a conventional down-looking , ,
acoustic approach. Investigations of the feasibility of acoustic
estimates were made during July 1992 1993 and 1994. The 1992
study concentrated on various approaches to the near-surface
boundary problem, including fixed up-looking, paravaned up-
looking and side-looking. Only side-looking techniques achieved
sufficient sample coverage to provide a viable assessment.
During 1993 and 1994, Comparisons were made between side-looking
assessments and ground truth information, the detection
efficiency of the side-looking system was investigated as a
function of sea state and bottom depth, and three district wide-
surveys were conducted for comparison with abundance information
frcm the fisheries data. The results of the three surveys
indicated that the acoustic techniques are a viable alternative
to the traditional fisheries-based management approach.
Key words: acoustic survey, salmon, Alaska
Keraeth E. Tarbox, Alaska Dept. of Fish and Game, 34828
Kaiifornsky Beach Rd, Soldo tna, Alaska, USA 99669
Richard E. Thorne, BioSonics, Inc, , 3670 Stone Way North,
Seattle, Washington, USA 98103
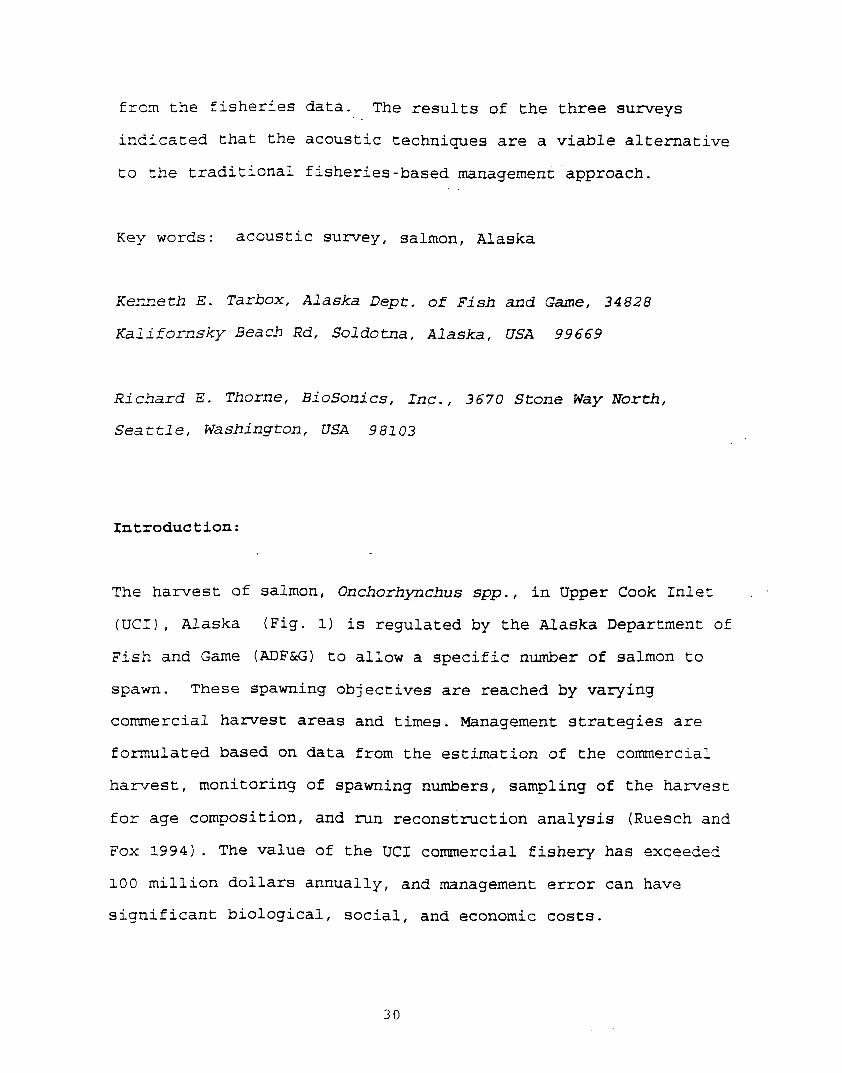
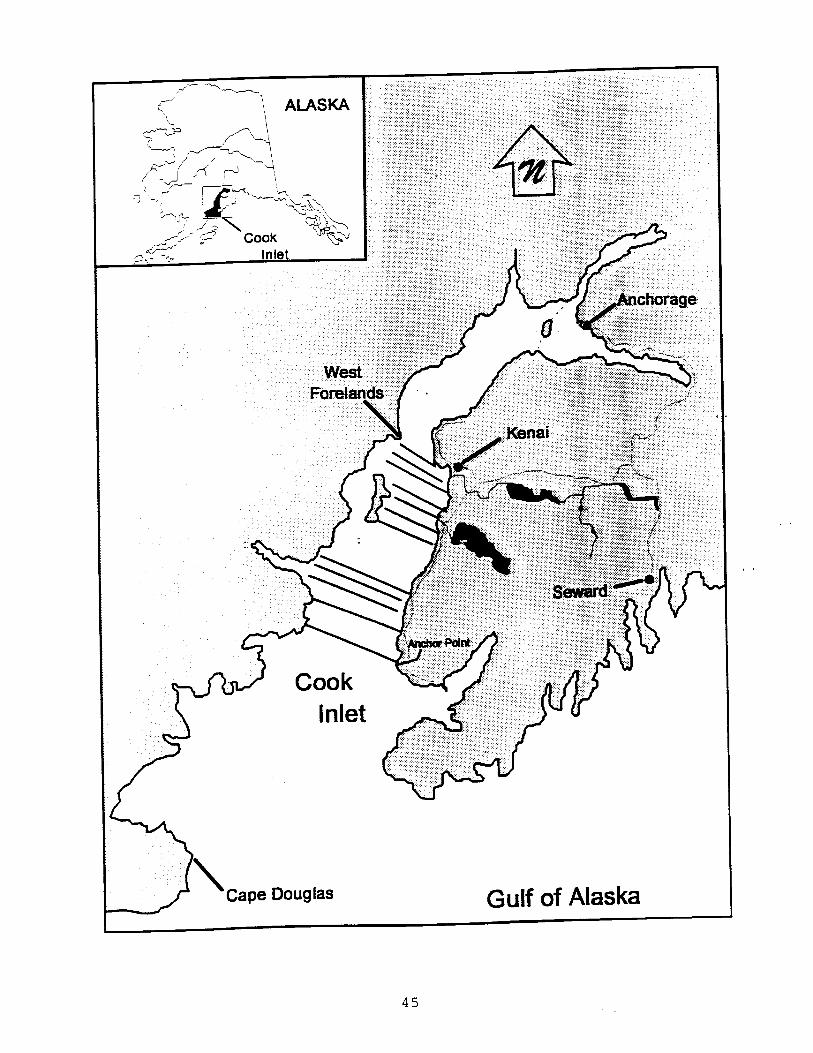
Introduction:
The harvest of salmon, Onchorhynchus s p p . , in Upper Cook Inlet
(UCI) , Alaska (Fig. 1) is regulated by the Alaska Department of
Fish and Game (ADFM;) to allow a specific number of salmon to
spawn. These spawning objectives are reached by varying
commercial harvest areas and times. Management strategies are
formulated based on data from the estimation of the commercial
harvest, monitoring of spawning numbers, sampling of the harvest
for age composition, and run reconstruction analysis (Ruesch and
Fox 1994). The value of the UCI commercial fishery has exceeded
100 million dollars annually, and management error can have
significant biological, social, and economic costs.
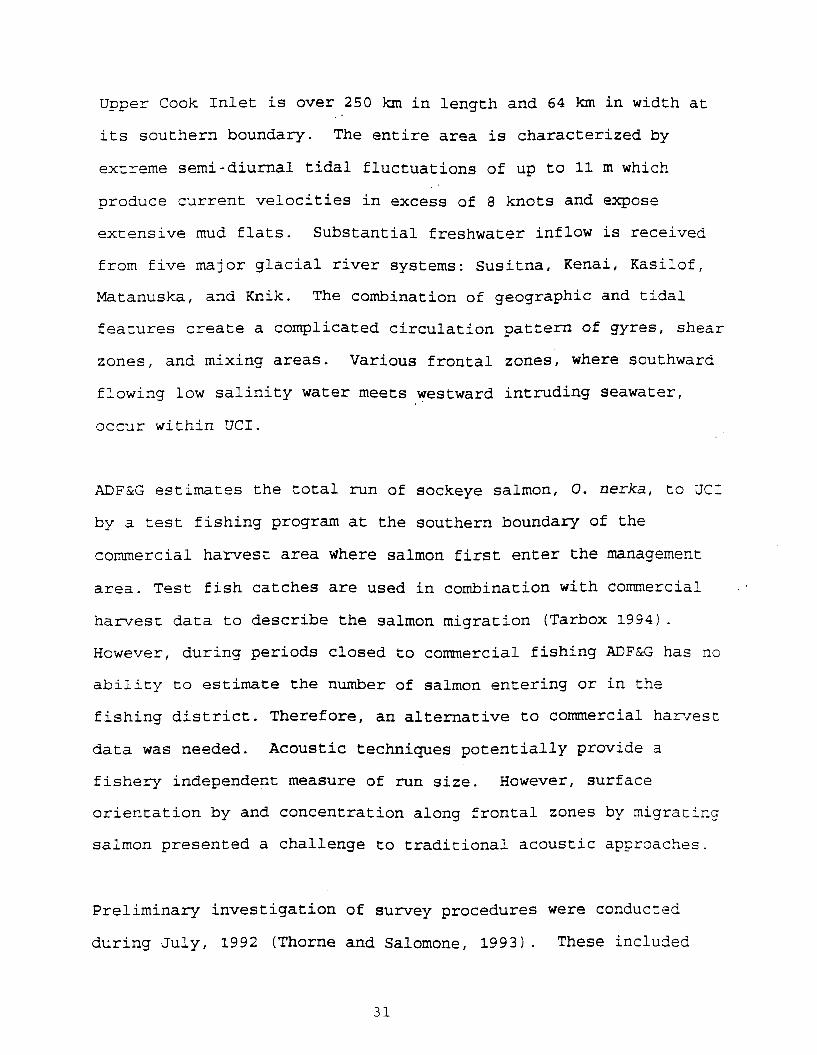
Upper Cook Inlet is over 250 km in length and 64 irm in width at
its southern boundary. The entire area is characterized by
extreme semi-diurnal tidal fluctuations of up to 11 m which
produce current velocities in excess of 8 knots and expose
extensive mud flats. Substantial freshwater inflow is received
from five major glacial river systems: Susitna, Kenai, Kasilof.
Matanuska, and Knik. The combination of geographic and tidal
features create a complicated circulation pattern of gyres, shear
zones, and mixing areas. Various frontal zones, where southward
flowing low salinity water meets westward intruding seawater,
occur within UCI.
ADF&G estimates the total run of sockeye salmon, 0. nerka. to UCI
by a test fishing program at the southern boundary of the
commercial harvest area Where salmon first enter the management
area. Test fish catches are used in combination with commercial
harvest data to describe the salmon migration (Tarbox 1994).
However, during periods closed to commercial fishing ADF&G has no
ability to estimate the number of salmon entering or in the
fishing district. Therefore, an alternative to comercial haruest
data was needed. Acoustic techniques potentially provide a
fishery independent measure of run size. However, surface
orientation by and concentration along frontal zones by migrating
salmon presented a challenge to traditional acoustic approaches.
Preliminary investigation of survey procedures were conducted
during July, 1992 (Thorne and Salomone, 1993). These included
fixed-location uplooking, paravaned up-looking and towed side-
looking transducer orientations. Side-looking orientation gave
the best detectability and was selected for the surveys This
paper presents the results of the implementation of side-looking
ac~ustic surveys to estimate the adult salmon run in UCI.
Methods :
A stratified random sampling design was selected following the
recommendation of Jolly and Hampton (1990). The total surface
area of the Survey, 3,295 x 10%~~ was divided into three
regions. Three to five orthogonal transects were randomly
selected within each region. Transect lengths varied from 8.8 to
27 km. At the ' survey sped of about 3 m s-l, each survey was
completed within 48 h. Surveys were conducted starting on 14 July
1993 and 13 and 19 July 1994 (Fig. 1).
The acoustic equipment consisted of a dual frequency (120 and 420
kHz) dual beam BioSonics Inc. Model 102 Scientific Echo sounder,
a Model 111 Thermal Chart Recorder, a Model 171 tape recording
interface, a SOny Walkman Digital Analog Tape Recorder (DAT), and
associated test equipment, cables, dual-beam transducers and a
towing vehicle. The acoustic system was calibrated before and
after the study.
The two acoustic transducers were mounted on the towing vehicle
in a side-looking mode (Thorne . . and Salomone. 1993). The nominal
beam widths were 7" for the 120 kHz and 6' for the 420 kHz. All
data were recorded on DAT. Echogram range was 100 rn, and the
marking threshold corresponded to a -47 dB acoustic target
strength.
Numbers of fish were counted from the echograms in 20 m range
strata. The area Swept by the sonar along each transect was
calculated by multiplying each 20-m range strata by the length of
the transect. Densities of fish . per , unit surface area were
calculated for each 20-m range and for both frequencies from the
echogram counts- Range strata were used to evaluate the
detection characteristics as a function of range. The count from
the range Strata and frequency with the best detection
characteristics Was used for the population estimates.
Population estimates and variances were determined from the nean
densities along each transect according to standard procedures
for a stratified random sample (Scheaffer et al. 1986. Thompson
Estimator of the mean population density for stratum j is
where yl is
- C Yi j - 1 x 1
Y j - n
the observed density (number of fish/m2) , - + for the r - .
transect .
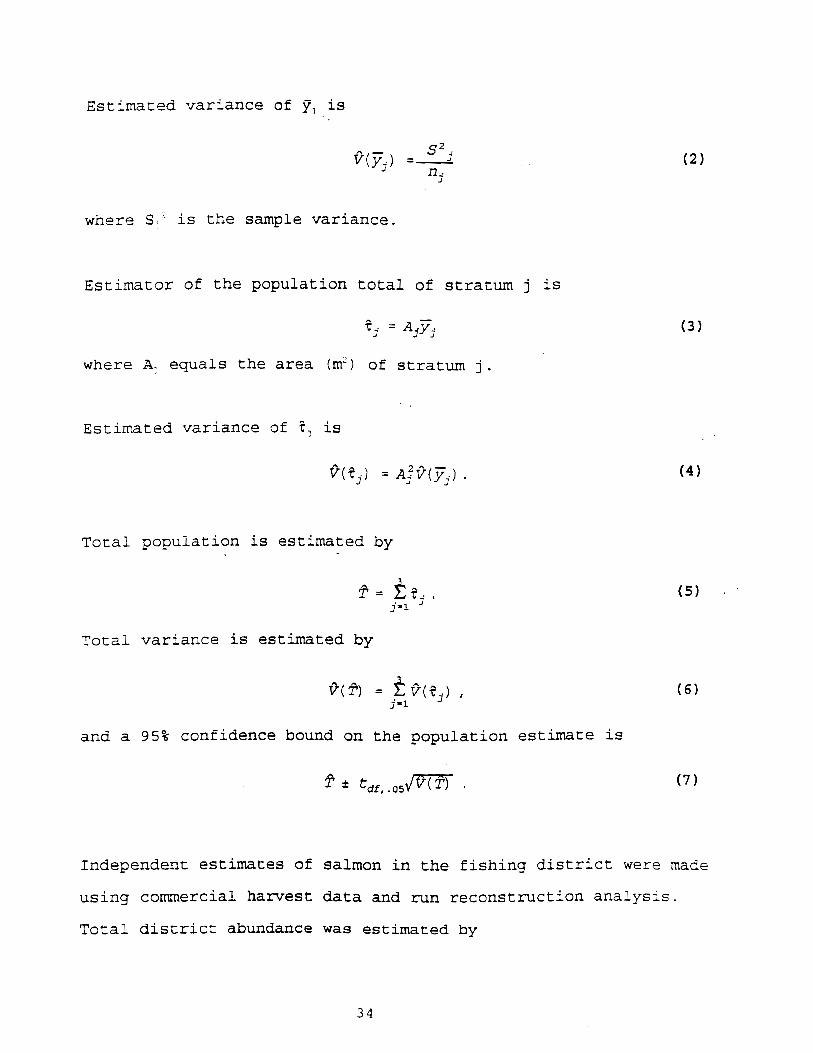
Estimated variance of 7, is
where S-I is the sample variance.
Estimator of the population total of stratum j is
t j = A j 6
where A- equals the area (m') of stratum j.
Estimated variance of i. is
B ( t j ) = n;P(y,) .
Total population is estimated by
Total variance is estimated by
and a 959; confidence bound on the population estimate is
Independent estimates of salmon in the fishing district were made
using commercial harvest data and run reconstruction analysis.
Total district abundance was estimated by
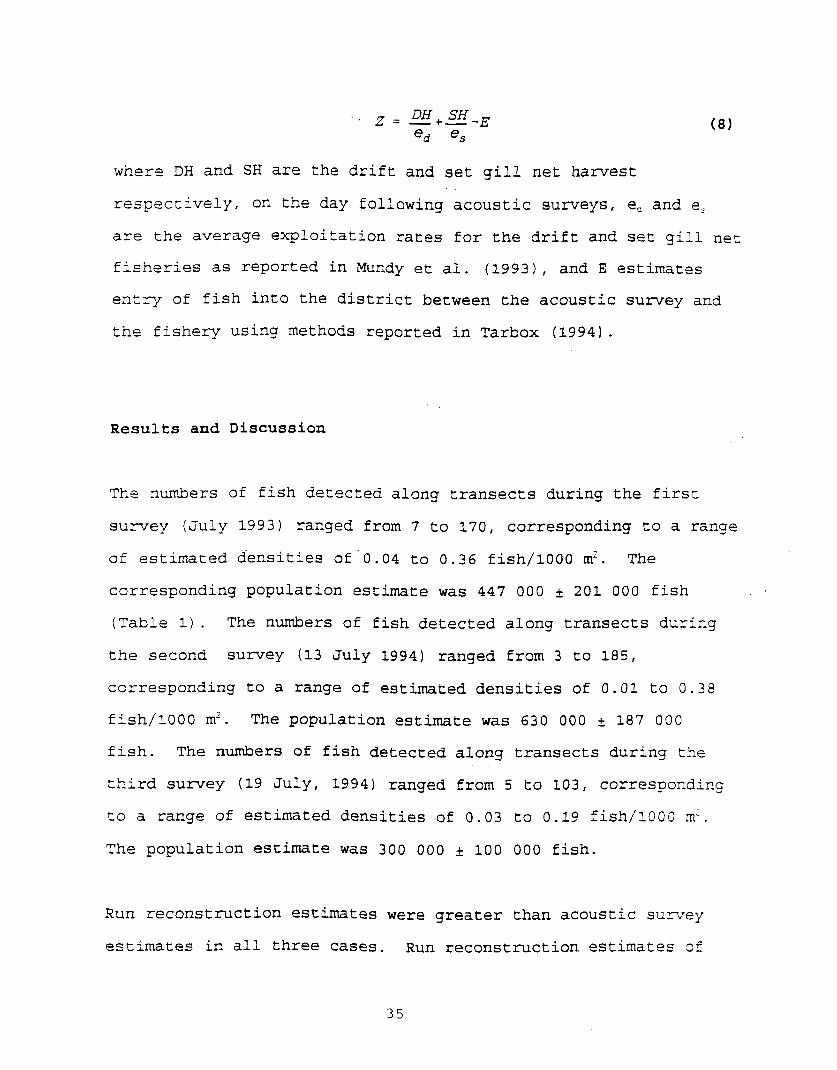
where DH and SH are the drift and set gill net hamest
respectively, on the day following acoustic surveys, e, and e,
are the average exploitation rates for the drift and set gill net
fisheries as reported in Mundy et al. (1993), and E estimates
entry of fish into the district between the acoustic survey and
the fishery using methods reported in Tarbox (1994).
Results and Discussion
The numbers of fish detected along transects during the first
suney (July 1993) ranged from 7 to 170, corresponding to a range
of estimated densities of -0.04 to 0.36 fish/1000 m'. The
corresponding population estimate was 447 000 201 000 fish
(Table 1). The numbers of fish detected along transects during
the second survey (13 July 1994) ranged from 3 to 185,
corresponding to a range of estimated densities of 0.01 to 0.38
fish/l000 m'. The population estimate was 630 000 + 187 000 fish. The numbers of fish detected along transects during the
third survey (19 July, 1994) ranged from 5 to 103, corresponding
to a range of estimated densities of 0.03 to 0.19 fish/1000 m'.
The population estimate was 300 000 100 000 fish.
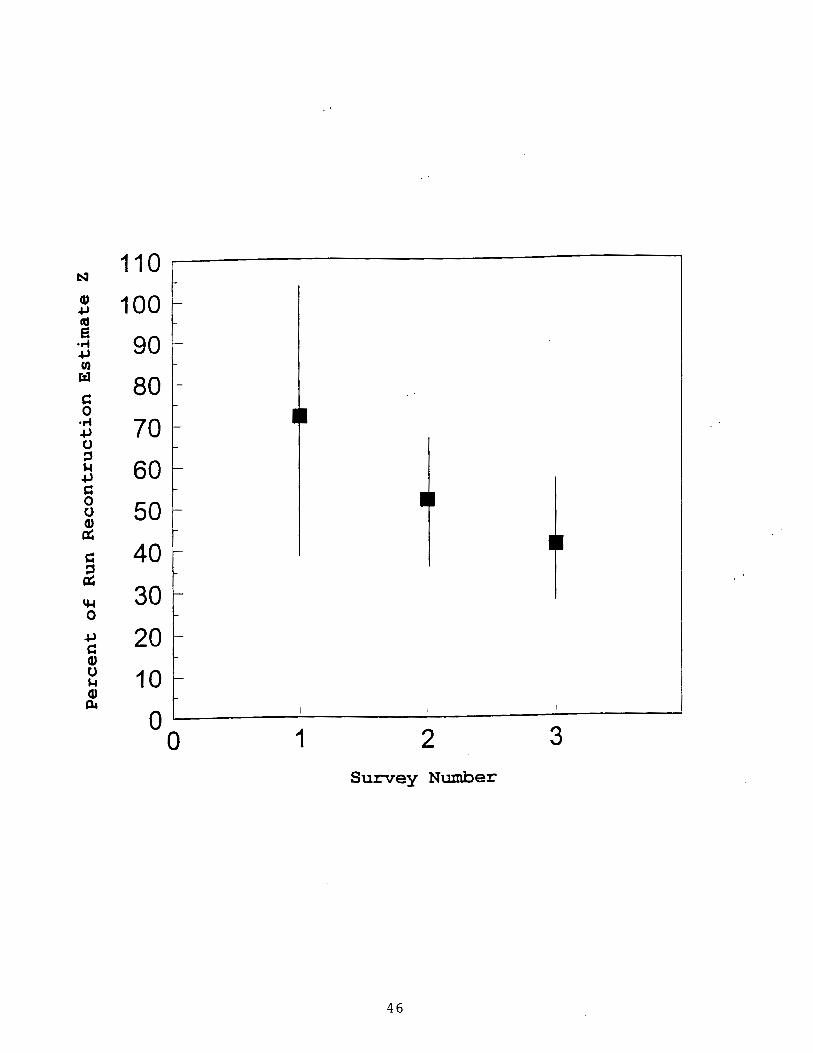
Run reconstruction estimates were greater than acoustic survey
estimates in all three cases. Run reconstruction estimates of
the number of salmon in the district were 617 000, 1220 000, and
733 000 for the three acoustic survey periods. The acoustic
estimates for the three surveys were 73%, 52%, and 41% of the
three run reconstruction estimates (Fig. 2) . These results
suggested that the acoustic techniques detected only about half
of the fish in the district.
Useful management information could be obtained from acoustic
estimates without 100% detection or absolute population
estimates. At issue is the need . for . an index to substitute for
commercial catch data. At detection rates of about 50% the
acoustic estimate could replace the drift gill net fleet harvest
in the run reconstruction model (assumes average exploitation
rate of 40%). However, the factors which affect acoustic
detectability need to be understood.
The capability of the acoustic system to detect fish is affected
by both range dependent factors and range independent factors.
Range dependent factors include winds which affect the smoothness
of the water surface boundary, and reflections off the bottom
from peripheral portions of the acoustic beam at shallower
depths. Range independent factors include echoes from frontal
zones, kelp and other non-fish objects.
Under perfect conditions, the number of fish that are detected
should increase with range until the depth extent of the fish is
encompassed. Based on the initial studies (Thorne and Salomone,
1993), migrating adult salmon occupy the upper 12 m of the water . .
column. This depth extent was covered at about 70 m range for
the 120 kHz system and 80 m range for the 420 kHz.
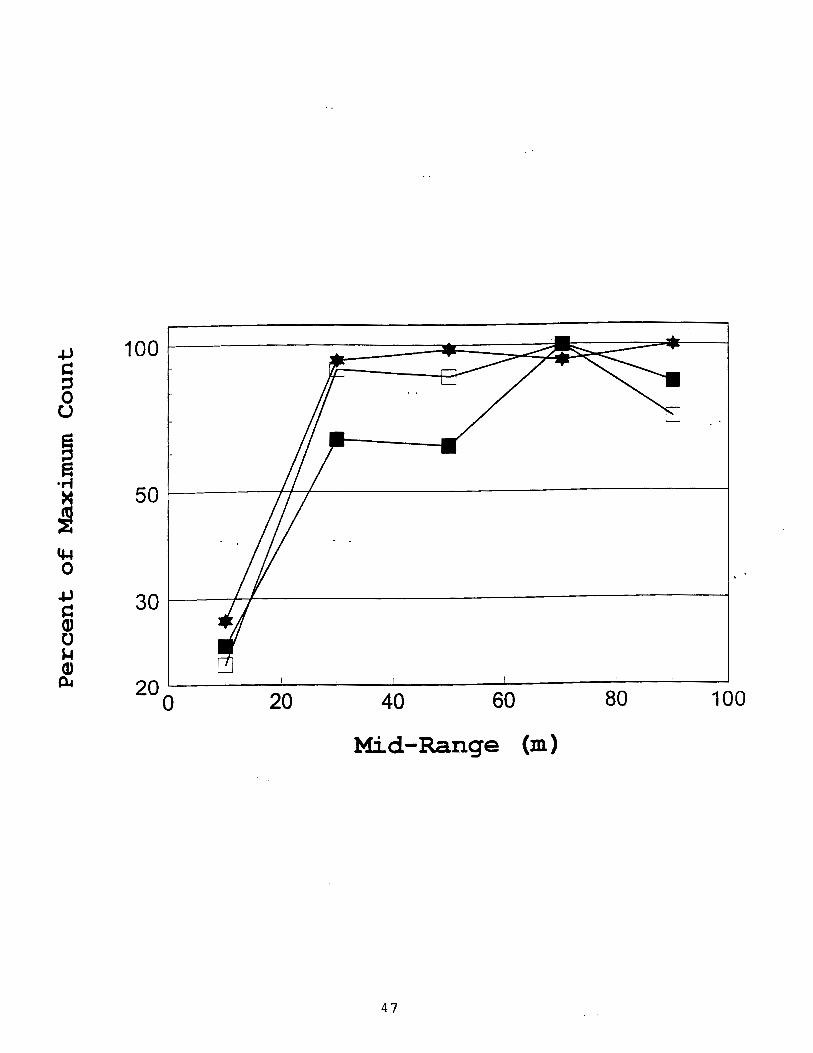
Examination of the acoustic data shows that detections were
limited by surface reverberation from moderate to rough water
conditions at much shorter ranges. Under calm conditions,
maximum detections were achieved as expected in the 60-80 m
stratum (Fig. 3) . However, under moderate sea conditions
(Beaufort sea states 3 to 4) detections . . increased rapidly over
the first 30 rn, improved slightly from 30-70 m, then rapidly
declined. Under rough conditions (Beaufort sea states 5 and
greater) detections did not improve after 30 m.
The overall effect of range limitations can be seen in the
results of the 13 July 1994 survey (Fig. 4) . Weather conditions . ,
varied from calm to moderate during this survey. Both
frequencies detected similar numbers of targets in the first 20
m. This would be expected since both have similar beam widths,
and range effects are minimal. Detections increased with range,
but not as rapidly as expected by the increased depth coverage.
Detections at 120 kHz increased with range to a peak in the 60-80
rn strata, then declined. Detections at 420 kHz fell off more
rapidly. The frequency difference most likely represents the
increased attenuation loss at 420 kHz which makes it more
vulnerable to increasing noise at range.
If detections in the 0-20 m range strata represent the true fish
density, and fish distribution is uniform in the upper 12 m, then
detections should increase in direct proportion to the range out
to 70-80 m. Results suggest that the 120 kHz system during the
13 July 1994 survey detected about 35% of fish in the 20-40 rn
range strata, about 45% in the 40-60 m range strata, and about
52% in the 60-80 m Strata (Fig. 4). The population estimates
were based principally on 120 kHz data from the 40-60 m and 60-80
m strata. This indication of detection efficiency is in
agreement with the observed relationship . . between the acoustic
estimates and those derived from the fishery, which suggest
average detection efficiency slightly over 50%.
Range independent factors do not appear to be a major source of
error in making the acoustic estimates. Kelp did return echoes
that were often similar in magnitude to those from fish, but kelp
was not widespread and could be visually noted. Occasions in
which fish and kelp were in close proximity were rare. Fish were
clearly associated with frontal zones, and entrained air and
debris can either return echoes that are similar to fish, or mask
the presence of fish targets. However, fish appeared to be near
these zones, but not actually in the them, so separation appeared
to be possible in most cases.
Most echoes appeared to represent individual fish. However,
there were exceptions, particularly during the first and third
series and in the southern region. Fish clearly became more
dispersed as they moved north, and as the season progressed. This . .
was not unexpected since pink salmon, 0. gorbuscha, which tend to
travel in large S C ~ O O ~ S , were not abundant in UCI during 1993 and
1994. In addition, sockeye salmon probably begin to disperse and
move towards their natal rivers soon after entering the district
(Tarbox 1988).
The inability to adequately survey nearshore areas may also have
affected the accuracy of acoustic estimates. For example, run
reconstruction analysis indicated . . that 22% of the salmon
population may have been in these areas during the 13 July 1994
sumey. Within UCI a combination of relatively shallow (c 10 m)
and extensive nearshore set gill net fishing gear limited
transect lengths. Set net fishing gear in some areas extend - -
off shore over '3' km.
All fish detected during acoustic surveys were assumed to be
adult salmon, Since few fish of other species appear to occur
within the upper 12 m of the water column. Few non-salmon
species have been reported from drift gill net harvests which are
made with nets extending 10 m in depth. In addition, Tarbox
(1988) conducted numerous seine hauls in UCI and reports no other
species of fish captured except salmon in the surface waters.
While, Moulton (1994) captured 18 fish species in the northern
portion of UCI Surface waters these fishes were predominantly
juvenile herring and salmon and should generally be below the -47
dB detection threshold.
The objective of these studies was to determine whether acoustic
surveys could provide a viable method with which to estimate UCI
salmon abundance when commercial catch data was not available.
The acoustic detection rate of about 50% is comparable to the
commercial exploitation rate. The major factor in the
detectability appears to be range dependent factors. A useful
management index should be obtainable from acoustic suweys by
accounting for these factors.
References
Jolly, G.M., and Hampton, I. 1990. A stratified random transect
design for acoustic surveys of fish stocks. Canadian Journal of
Fisheries and Aquatic Sciences, 47: 1282-1291.
Moulton, L. 1994. 1993 Northern Cook Inlet smolt studies.
Report to ARC0 Alaska Inc. , Anchorage, 10lpp.
Mundy, P.R., English, K.K., Gazey, W.J., and Tarbox, K. 1993.
Evaluation of the harvest management strategies applied to
sockeye salmon populations of Upper Cook Inlet, Alaska, using run
reconstruction analysis. In Proceedings of the international
symposium on management strategies for exploited fish
populations. Ed. by G. Kruse, D.M. Eggers, R.J. Marasco, C.
Pautzke, and T.J. Quinn 11. Alaska Sea Grant College Program AK-
Ruesch, P., and Fox, J. 1994. Upper Cook Inlet commercial
fisheries annual management report, 1993. Alaska Department of
Fish and Game, Regional Information Report 2A94-22, Anchorage,
61PP.
Tarbox, K. 1988. Migratory rate and behavior of salmon in Upper
Cook Inlet, Alaska 1983-1984. Alaska Department of Fish and
Game, Fishery Research Bulletin 88-05, Anchorage, 56pp.
Tarbox, K. 1994. An estimate of the migratory timing and . .
abundance of sockeye salmon into Upper Cook Inlet, Alaska, in
1993. Alaska Department of Fish and Game, Regional Information
Report No. 2A94-13, Anchorage, 32pp.
Thorne, R., and Salomone, P. 1993. Feasibility study of acoustic
techniques for adult salmon assessment in Upper Cook Inlet.
Report to the Alaska Department of Fish and Game, Anchorage,
Scheaffer, R.L., Mendenhall,W., and Ott, L. 1986. Elementary
Survey Sampling. Duxbury Press, Boston, 324 pp.
Thompson, S.K. 1992. Sampling. John Wiley & Sons, Inc. New York.
343pp.
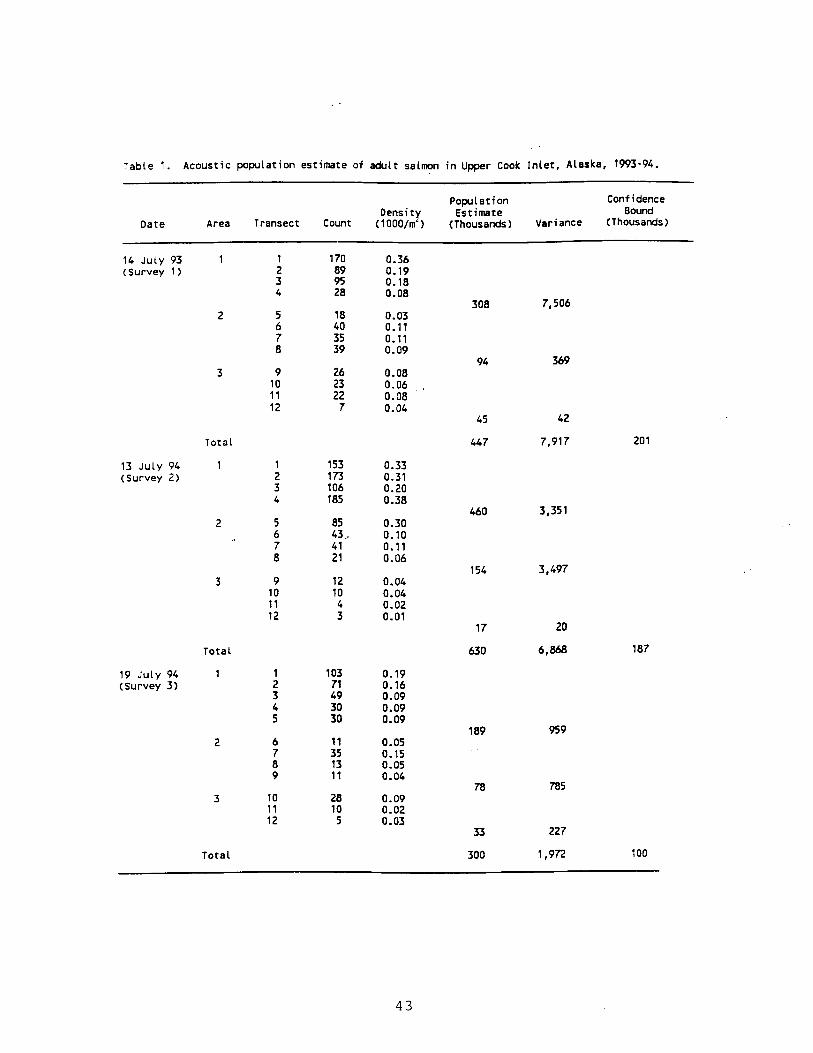
Table 1 . Acoustic population estimate of adult salmon i n Upper Cook I n l e t , Alaska, 1993-94.
Population Confidence Density Estimate Bound
Date Area Transect Count (1000/m ) (Thousands) Variance (Thousands)
14 July 93 1 1 170 0.36 (Survey 1) 2 89 0.19
3 95 0.18 4 28 0.08
308 7,506 2 5 18 0.03
6 40 0.11
Total
13 J U L Y 94 1 1 153 0.33 (Survey 2) 2 1 73 0.31
3 106 0.20 4 185 0.38
460 2 5 85 0.30
Total 63 0
19 July 94 1 1 (Survey 3) 2
3
Total 300 1,972 100
LIST OF FIGURES
Fio. 1. Map of Cook Inlet. Alaska with acoustic survey transects
used on 19 July 1994. Transect 1 starts at the southern
boundary.
Fig. 2. ~coustic estimates of salmon abundance in Upper Cook
Inlet. Alaska as a percentage of run reconstruction estimate ( z ) .
Confidence bounds are 95%.
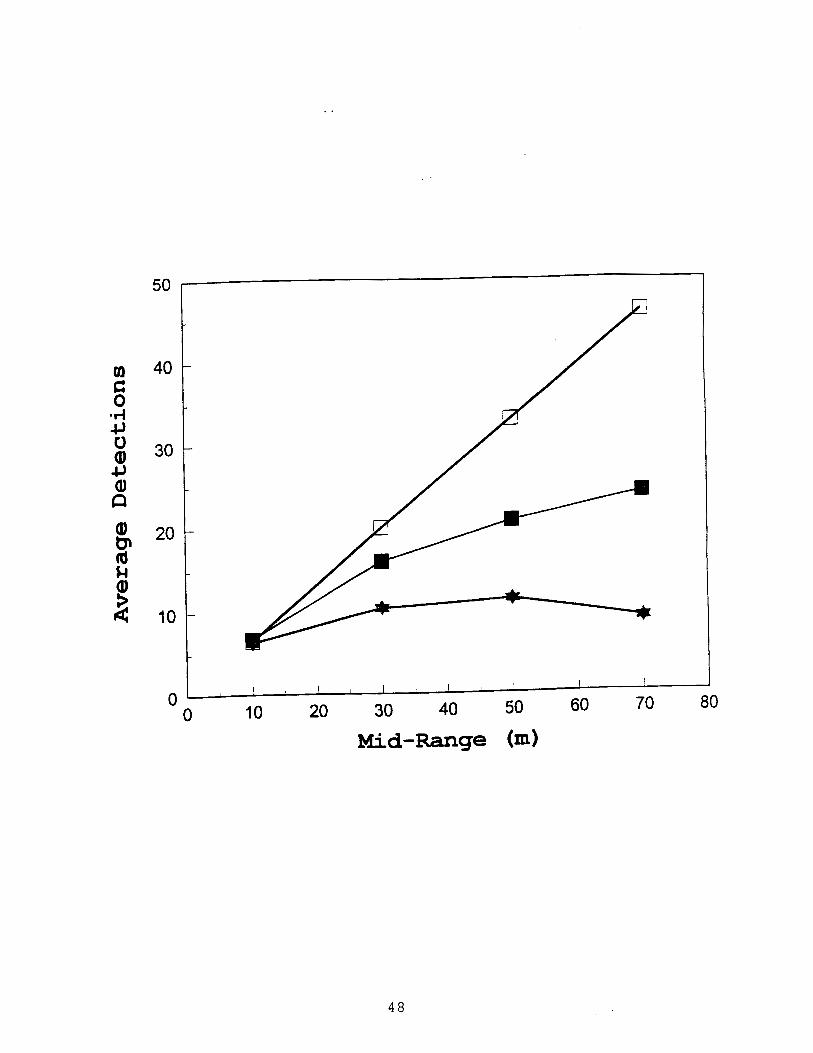
Fig. 3. Fish detections as a function of range under three sea
states (solid box is calm, open box is moderate, and star is
rough). Note that the maximum count refers only to that sea
state.
Fig. 4. Average number of fish detected by 20 m range interval
for 120 kHz and 420 kHz systems compared with theoretical (open
box is theoretical, solid is 120 kHz, and star is 420 kHz).
Survey Number
Mid-Range (m)
Mid-Range (m)