Embed Size (px)
Citation preview

U.S. Fish & Wildlife Service
Estimation of Sockeye Salmon Escapement into McLees Lake, Unalaska Island, Alaska, 2011
Alaska Fisheries Data Series Number 2013–2
Anchorage Fish and Wildlife Field Office Anchorage, Alaska May 2013

Disclaimer: The use of trade names of commercial products in this report does not constitute endorsement or recommendation for use by the federal government.
The Alaska Region Fisheries Program of the U.S. Fish and Wildlife Service conducts fisheries monitoring and population assessment studies throughout many areas of Alaska. Dedicated professional staff located in Anchorage, Juneau, Fairbanks and Kenai Fish and Wildlife Offices and the Anchorage Conservation Genetics Laboratory serve as the core of the Program’s fisheries management study efforts. Administrative and technical support is provided by staff in the Anchorage Regional Office. Our program works closely with the Alaska Department of Fish and Game and other partners to conserve and restore Alaska’s fish populations and aquatic habitats. Additional information about the Fisheries Program and work conducted by our field offices can be obtained at:
http://alaska.fws.gov/fisheries/index.htm
The Alaska Region Fisheries Program reports its study findings through the Alaska Fisheries Data Series (AFDS) or in recognized peer-reviewed journals. The AFDS was established to provide timely dissemination of data to fishery managers and other technically oriented professionals, for inclusion into agency databases, and to archive detailed study designs and results for the benefit of future investigations. Publication in the AFDS does not preclude further reporting of study results through recognized peer-reviewed journals.
Alaska Fisheries Data Series Number 2013-2, May 2013 U. S. Fish and Wildlife Service
Authors: ¹U. S. Fish and Wildlife Service, Anchorage Fish and Wildlife Field Office, 605 W. 4th, Room G61, Anchorage, AK 99501; or [email protected]. ²Alaska Department of Fish and Game, Division of Commercial Fisheries, 211 Mission Road, Kodiak, Alaska 99615; or [email protected].
EstimationofSockeyeSalmonEscapementintoMcLeesLake,UnalaskaIsland,Alaska,2011
DerekR.Hildreth¹andHeatherFinkle²
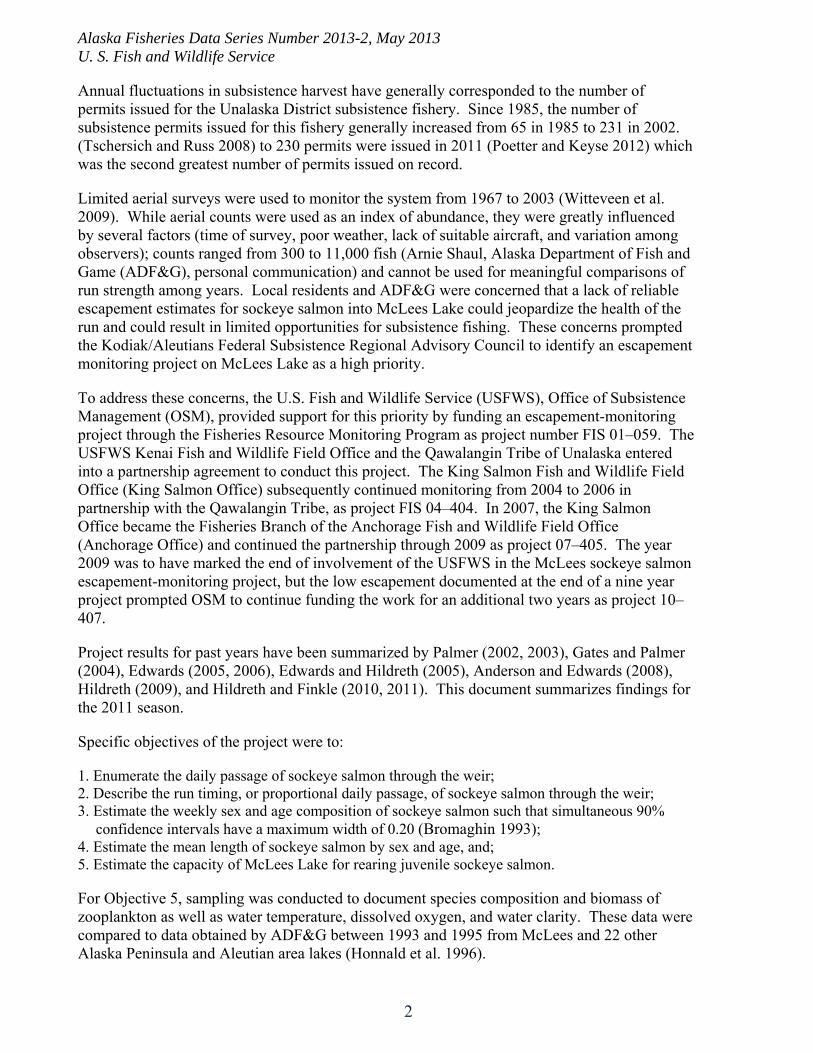
AbstractThe Anchorage Fish and Wildlife Field Office operated a fixed picket weir at the outlet of McLees Lake on Unalaska Island from 10 June to 17 July 2011 to provide an accurate estimate of the sockeye salmon Oncorhynchus nerka escapement and to assist in the in-season management of the local subsistence fishery. Final estimate of sockeye salmon was 36,602. Peak daily passage occurred on 25 June when 2,208 sockeye salmon were counted through the weir. There were 723 sockeye salmon sampled consisting primarily of age 1.3 (87.2%) fish and equal numbers of males (49.9%) and females (49.4%). The return of over 36,000 sockeye salmon in 2011 was within the escapement goal of 10,000-60,000 set by the Alaska Department of Fish and Game. The subsistence fishery was open in 2011 and an estimated 4,681 sockeye salmon were harvested in the Reese Bay subsistence fishery. Water level at the weir peaked on 17 June at 1.38 ft and was at its lowest on 17 July at 1.08 ft. Water temperature ranged from a low of 8.6 °C on 11 June to a high of 11.7 °C on 15 July. Sampling for zooplankton to assess freshwater rearing conditions for juvenile sockeye salmon in McLees Lake was conducted for the third year. The low zooplankton densities and species diversity were similar to those seen in 2009 and 2010, suggesting that food for rearing sockeye salmon may be a limiting factor
IntroductionUnalaska Village lies approximately 1,270 km southwest of Anchorage on Unalaska Island, about 200 km southwest of the Alaska Peninsula. The remote nature of the area encourages a subsistence life-style and sockeye salmon Oncorhynchus nerka is one of the primary resources available for subsistence use. Subsistence harvests of sockeye salmon for Unalaska Village historically came primarily from Unalaska Lake, which is encompassed by the village. However, due to declining returns throughout the 1990s, approximately 100 m of the ocean waters surrounding the outlet of Unalaska Lake have been closed to subsistence fishing in an attempt to protect this stock and increase spawning escapement. In 2011, the subsistence harvest of sockeye salmon in the Unalaska Lake drainage was estimated at 179 fish and comprised only 3% of the total subsistence harvest of sockeye salmon in the Unalaska District (Poetter and Keyse 2012).
With the decline of the Unalaska Lake sockeye salmon run, Unalaska Village residents shifted their subsistence fishing efforts to sockeye salmon returning to McLees Lake. This drainage is important spawning and rearing habitat for sockeye salmon, and Reese Bay, where the system empties into the Bering Sea, provides a relatively protected fishing area. Subsistence harvests of sockeye salmon returning to McLees Lake have been monitored since 1985 and have ranged from 897 to 5,267 sockeye salmon (Poetter and Keyse 2012). In 2011, an estimated 4,681 sockeye salmon (87% of the Unalaska District subsistence sockeye salmon harvest) were taken from the Reese Bay fishery (Poetter and Keyse 2012).
Alaska Fisheries Data Series Number 2013-2, May 2013 U. S. Fish and Wildlife Service
2
Annual fluctuations in subsistence harvest have generally corresponded to the number of permits issued for the Unalaska District subsistence fishery. Since 1985, the number of subsistence permits issued for this fishery generally increased from 65 in 1985 to 231 in 2002. (Tschersich and Russ 2008) to 230 permits were issued in 2011 (Poetter and Keyse 2012) which was the second greatest number of permits issued on record.
Limited aerial surveys were used to monitor the system from 1967 to 2003 (Witteveen et al. 2009). While aerial counts were used as an index of abundance, they were greatly influenced by several factors (time of survey, poor weather, lack of suitable aircraft, and variation among observers); counts ranged from 300 to 11,000 fish (Arnie Shaul, Alaska Department of Fish and Game (ADF&G), personal communication) and cannot be used for meaningful comparisons of run strength among years. Local residents and ADF&G were concerned that a lack of reliable escapement estimates for sockeye salmon into McLees Lake could jeopardize the health of the run and could result in limited opportunities for subsistence fishing. These concerns prompted the Kodiak/Aleutians Federal Subsistence Regional Advisory Council to identify an escapement monitoring project on McLees Lake as a high priority.
To address these concerns, the U.S. Fish and Wildlife Service (USFWS), Office of Subsistence Management (OSM), provided support for this priority by funding an escapement-monitoring project through the Fisheries Resource Monitoring Program as project number FIS 01–059. The USFWS Kenai Fish and Wildlife Field Office and the Qawalangin Tribe of Unalaska entered into a partnership agreement to conduct this project. The King Salmon Fish and Wildlife Field Office (King Salmon Office) subsequently continued monitoring from 2004 to 2006 in partnership with the Qawalangin Tribe, as project FIS 04–404. In 2007, the King Salmon Office became the Fisheries Branch of the Anchorage Fish and Wildlife Field Office (Anchorage Office) and continued the partnership through 2009 as project 07–405. The year 2009 was to have marked the end of involvement of the USFWS in the McLees sockeye salmon escapement-monitoring project, but the low escapement documented at the end of a nine year project prompted OSM to continue funding the work for an additional two years as project 10–407.
Project results for past years have been summarized by Palmer (2002, 2003), Gates and Palmer (2004), Edwards (2005, 2006), Edwards and Hildreth (2005), Anderson and Edwards (2008), Hildreth (2009), and Hildreth and Finkle (2010, 2011). This document summarizes findings for the 2011 season.
Specific objectives of the project were to:
1. Enumerate the daily passage of sockeye salmon through the weir; 2. Describe the run timing, or proportional daily passage, of sockeye salmon through the weir; 3. Estimate the weekly sex and age composition of sockeye salmon such that simultaneous 90%
confidence intervals have a maximum width of 0.20 (Bromaghin 1993); 4. Estimate the mean length of sockeye salmon by sex and age, and; 5. Estimate the capacity of McLees Lake for rearing juvenile sockeye salmon.
For Objective 5, sampling was conducted to document species composition and biomass of zooplankton as well as water temperature, dissolved oxygen, and water clarity. These data were compared to data obtained by ADF&G between 1993 and 1995 from McLees and 22 other Alaska Peninsula and Aleutian area lakes (Honnald et al. 1996).

Alaska Fisheries Data Series Number 2013-2, May 2013 U. S. Fish and Wildlife Service
3
StudyAreaMcLees Lake is located on the north side of Unalaska Island, approximately 19 km northwest of the village of Unalaska (latitude 54.0006°; longitude –166.7280°: WGS84; Figure 1). The
Figure 1. Map of Unalaska Island, Southwest Alaska, showing proximity of Unalaska Village to the McLees Lake study area.
McLees Lake drainage spans an area of approximately 40 km2 and consists of a 4 km2 lake fed by several small streams. The McLees Lake outlet stream is a fast moving high gradient stream that flows about 100 m before entering Reese Bay. The subsistence fishery targets salmon that are staging in Reese Bay prior to entering the McLees Lake system when migration conditions are favorable.
Unalaska Island
UNALASKA ISLAND
McLees Lake
0 10 20 30 40
N
Kilometers
0 1 2 3 4
Kilometers
Village of Unalaska

Alaska Fisheries Data Series Number 2013-2, May 2013 U. S. Fish and Wildlife Service
4
The McLees Lake drainage supports substantial spawning populations of sockeye salmon and an undetermined number of Chinook salmon O. tshawytscha, chum salmon O. keta, coho salmon O. kisutch, pink salmon O. gorbuscha, and steelhead O. mykiss. Whether these species represent viable spawning populations within this drainage is unknown. McLees Lake also supports resident fishes such as Dolly Varden Salvelinus malma, sculpins, and sticklebacks.
Estimated annual escapements of sockeye salmon into McLees Lake abruptly declined after the first four years of weir operation (Table 1). While the 10-year mean average was about 41,000 sockeye salmon, the 2001–2004 escapements averaged about 75,000, ranging from approximately 44,000 to 106,000. The 2005–2009 escapements only averaged about 15,000, ranging from approximately 10,000 to 23,000 sockeye salmon. The lowest recorded escapements through the weir occurred in 2008 and 2009; estimated at 9,788 and 11,457 sockeye salmon, respectively. Average subsistence harvests during 2005–2009 were 23% lower and exploitation rates were about four-fold greater than those during 2001–2004. In order to provide for increased escapement into the lake, ADF&G closed the Reese Bay subsistence fishery annually during the first week of July. In 2008 and 2009, due to the low escapement numbers, the fishery never re-opened.
Table 1. Yearly escapement, subsistence harvest, and exploitation rate for McLees Lake, 2001–2010.
* harvest as % of total escapement. † data from Hartill and Keyse(2011).
The limnology of McLees Lake was evaluated as part of a 1993–1995 assessment to estimate the potential for increasing sockeye salmon production from 23 Alaska Peninsula and Aleutian area lakes through artificial fertilization (Honnald et al. 1996). Results indicated that McLees Lake had the capacity to support an escapement of approximately 22,000 sockeye salmon. Although the cause for the sockeye salmon decline during 2005–2009 is unknown, it may be the result of the extremely large spawning escapements during 2001–2004, which could have resulted in large numbers of juvenile sockeye salmon placing a heavy burden on food resources. Once restructured by heavy predation, zooplankton communities can be slow to respond to decreased grazing pressure when the predator population declines and this can result in a prolonged period of reduced growth and survival of succeeding brood years of juvenile sockeye salmon (Kyle et al. 1988). Other factors that may have contributed to the decline of sockeye salmon abundance include poor marine rearing conditions and inter-species competition for resources by stickleback and juvenile coho salmon (Edmundson et al. 1994) as well as predation by Dolly Varden (Honnald et al. 1996; Keonings and Kyle 1997).
Year(s) Total Escapement McLees Lake Escapement Subsistence Harvest* Exploitation rate†
2001 49,255 45,866 3,389 6.9
2002 102,474 97,780 4,694 4.6
2003 106,181 101,793 4,388 4.1
2004 44,099 40,328 3,771 8.6
2005 15,451 12,088 3,363 21.8
2006 14,387 12,936 1,451 10.1
2007 23,033 21,428 1,605 7.0
2008 9,788 8,661 1,127 11.5
2009 11,457 10,120 1,337 11.7
2010 36,425 32,842 3,583 9.8

Alaska Fisheries Data Series Number 2013-2, May 2013 U. S. Fish and Wildlife Service
5
MethodsEscapement Monitoring
A rigid-frame aluminum picket weir (Figure 2) spanning 23 m was installed at the outlet of McLees Lake and operated from 10 June through 17 July 2011. The weir was comprised of panels of two lengths: 1.8 m for use at the chute as the entry point to the trap-box, and 3.6 m for the remaining panels; two on the east side, and four on the west side. Panels were constructed from picket frames of a “saw-horse” nature comprised of angle-aluminum 64 mm x 64 mm x 5 mm fashioned into bi-pods (sets of two legs) that were 1.5 m in length held in an inverted-V shape by cross-members 1 m in length. Picket rails were two, 64 mm x 64 mm x 5 mm angle-aluminum, panel length, set in tandem on the upstream side of the bi-pods. These rails had 28 mm diameter holes spaced approximately 30 mm apart along the length of the rails with which to affix the pickets. Panel-length support rails on the downstream (north) side were affixed at the top and the middle of the downstream legs of the bi-pods.
Based on experience gained from weir operations in 2010, we altered the configuration of the weir by moving the trap-box chute to one side by approximately 7 m in order to place the chute outside of the thalwag. This enabled sockeye salmon to pass through the chute to the trap-box without having to battle the high velocity waters found in the thalwag. We also canted the rigid-panels on both the left and right of the chute to shape the weir into a chevron with the trap-box chute passing through the inner portion of the apex of the panels, to help guide fish to the trap-box chute and subsequently, the trap-box.
The 1.8 m set of rails were used to construct the mid-section of the weir. This section had approximately 30 pickets per panel. This section was used as the platform for the chute leading through the weir panels to the trap-box. The remaining panels were 3.6 m sections with approximately 60 pickets per panel. Panels were connected by an overlap of approximately 5 cm at the ends of each picket rail, as well as by an overlap of the downstream support rails. Pickets were made of aluminum pipe with a 25 mm outside diameter and were either 1.0 m or 1.5 m long. These were affixed by sliding each picket through the two picket rails mounted on the picket frames. Because pickets were not attached firmly to the rails, they were free to slide up and down so that the bottom of the weir conformed to the contour of the uneven, rocky substrate. The longer pickets were used for regular picket expanses, while the shorter pickets were used in and around the trap-box. With pickets installed, the weir was about 1.5 m high.
The first step in weir installation was to extend a 6 mm diameter-cable spanning the outflow of the stream about 25 cm above the surface of the water. This cable was secured on each bank using duckbill anchors and then pulled tight using turnbuckles at each end. The weir panels were wired to the cable using 2 mm aircraft cable at several locations along the weir. The weir was further secured by two wooden tripods, spaced evenly across the channel, and by fence posts angled at approximately 30 degrees, spaced approximately every 3.6 m on the downstream side, and driven into the substrate.

Alaska Fisheries Data Series Number 2013-2, May 2013 U. S. Fish and Wildlife Service
6
Figure 2. McLees weir, 2011.
The trap-box was constructed on the upstream side of the weir to facilitate fish sampling. Two duck-bill anchors were driven into the substrate on either side and slightly upstream of the fish-trap to help secure it in place. Passage of adult salmon through the weir generally involved passage through the opened trap-box, but as the water level of the lake steadily dropped over the course of the season we switched to passing fish through 1 m weir panel openings located on either side of the trap-box created by removing pickets. The weir and trap-box were inspected at least daily and maintained as needed to ensure integrity. Fish were passed and counted intermittently throughout each day. The duration of each counting session varied depending on the number of fish arriving at the weir. Escapement counts were relayed via satellite phone to the office in Anchorage, which then reported the information to ADF&G managers and other interested parties via e-mail to support in-season management of the Reese Bay subsistence salmon fishery.
A staff gauge placed in the trap-box at the chute entrance provided a relative measure of water depth. This was measured daily at 0800 hours and again at 2000 hours. Temperature data were collected hourly using a temperature data logger (Onset Computer Corporation, model 4541/9716 HOBO® Temp).
Age, Sex, and Length Data
We collected sockeye salmon age, sex, and length (ASL) data using a temporally stratified sampling design (Cochran 1977) with strata defined as a 7-day week (Table 2). Samples were collected early in the week to enhance the likelihood of detecting any differences in ASL characteristics of fish through time.

Alaska Fisheries Data Series Number 2013-2, May 2013 U. S. Fish and Wildlife Service
7
Minimum weekly sample size goal for sockeye salmon were based on a multinomial sampling model (Bromaghin 1993). The weekly sample size determined from the model was 121, based on the assumption that four major age/sex classes would be encountered (k = 4; age 1.2 males, age 1.2 females, age 1.3 males, and age 1.3 females). This sample size satisfied the criteria that, within a stratum, there was a 90% probability that the estimated proportion of each age/sex category was within ≤0.2 of its true age/sex proportion in the population. This sample size goal was increased to 135 (about 10%) to allow for the occurrence of fish with unreadable scales. We sampled using six weekly strata for the season, but because the sixth stratum sample consisted of only 47 fish, the last two strata were combined to give us a total of five strata.
Table 2. Strata, date, and number of fish sampled for analysis of sockeye salmon biological data, McLees Lake, 2011.
Adult salmon lengths were measured to the nearest mm from mid eye to tail fork (METF) and their sex was determined from secondary characteristics. One scale from each sockeye salmon was removed from the preferred area on the left side of the fish (Devries and Frie 1996). Each scale was cleaned and then mounted on a gummed scale card. Ages were later determined by Kodiak ADF&G staff by examining scale patterns as described by Mosher (1969). Salmon ages were reported according to the European method described by Jearld (1983) and Mosher (1969, where the number of winters the fish spent in fresh water and the number of winters spent in the ocean are separated by a decimal.
Within a given stratum k the proportion of sockeye salmon passing the weir that are of sex i and age j (pijk) was estimated as (Cochran 1977):
ki
ijkijk n
np
ˆ,
where nijk denotes the number of sockeye salmon of sex i and age j sampled during stratum k and a subscript of "+" represents summation over all possible values of the corresponding variable, (e.g., ni++k denotes the total number of sockeye salmon sampled in stratum k). The variance of ijkp̂ was estimated as:
1
ˆ1ˆ1)ˆ(ˆ
ki
ijkijk
ki
kiijk n
pp
N
npv
,
where Ni++k denotes the total number of sockeye salmon passing the weir in stratum k.
Strata Date Sampled
1 June 10–June 16 135
2 June 17–June 23 135
3 June 24–June 30 135
4 July 01–July 07 135
5 July 08–July 18 183
Total Sampled: 723

Alaska Fisheries Data Series Number 2013-2, May 2013 U. S. Fish and Wildlife Service
8
The estimated number of sockeye salmon of sex j and age k passing the weir in stratum k ( ijkN̂ )
was:
ijkkiijk pNN ˆˆ
,
with estimated variance:
)ˆ(ˆ)ˆ(ˆ 2ijkkiijk pvNNv
.
Estimates of proportions for the entire period of weir operation were computed as weighted sums of the stratum estimates:
kijk
i
kiij p
N
Np ˆˆ
,
with estimated variance:
ijkk i
kiij pv
N
Npv ˆˆˆˆ
2
.
The total number of sockeye salmon in a sex and age category passing the weir during the entire period of operation was estimated as:
k
ijkij NN ˆˆ
,
with estimated variance:
k
ijkij NvNv ˆˆˆˆ.
The sample mean length of sockeye salmon of sex i and age j within stratum k was calculated as:
ijk
ijkijk n
xx
,
where xijk, denotes the length of sockeye salmon of sex i and age j sampled in stratum k. The corresponding sample variance 2
ijks was calculated as:
1ˆ
12
2
ijk
ijkijk
ijk
ijkijk n
xx
N
ns
.
The mean length of all sockeye salmon of sex i and age j ( ijx̂ ) was estimated as a weighted sum
of the stratum means:

Alaska Fisheries Data Series Number 2013-2, May 2013 U. S. Fish and Wildlife Service
9
kijk
ij
ijkij x
N
Nx
ˆ
ˆˆ
.
An approximate estimator of the variance of ijx̂ was obtained using the delta method (Seber
1982):
kijk
xijx
ijk
yijy
xijx
ijy
xijx
ijkijkij s
N
Nx
N
N
N
xNvxv .
ˆ
ˆ
ˆ
ˆ
ˆˆˆˆˆ 2
2
2
2
.
Limnological Sampling
Limnological sampling was conducted in accordance with established procedures (Thomsen et al. 2002). The weir crew conducted sample and data collection.
Station Placement and Sample Collection
Two limnology stations were established in McLees Lake. One, near the center and in the deepest portion of McLees Lake, was established at WGS84 global positioning system (GPS) waypoint 53.98371W; −166.73311N (accuracy to 6 m). The other, closer to the lake outlet and in the next deepest portion of the lake, was established at WGS84 GPS waypoint 53.99132W; −166.73010N. The stations were each marked with a buoy to visually locate them. Prior to each sampling session, GPS coordinates were taken to ensure concordance with the recorded GPS site coordinates. Two sampling days were selected, ad hoc, as time and weather permitted. Bottom depth was measured to determine the appropriate depths at which to collect plankton samples. During each sampling day at each station, water clarity was measured and a zooplankton sample was taken. Sample data was recorded on all-weather field notebooks and later transcribed to a computer spreadsheet.
Dissolved Oxygen, Temperature, and Water Clarity
A YSI model 55 water quality meter was used to measure dissolved oxygen and temperature at sampling stations. A handheld thermometer was used to measure the surface temperature, which was then compared to the meter’s integrated thermometer to ensure functionality. The meter was calibrated according to the manufacturer’s instructions prior to use and an incidence reading was taken above the water’s surface. Each probe was then lowered into the water and another reading was taken directly below the water’s surface. A subsequent measurement was taken at a depth of 1 m. Water clarity was measured by lowering a Secchi disk on a line, marked at 1 meter intervals, into the water on the shaded side of the boat. The depth of visibility (m) was recorded as the point at which the Secci disk disappeared from view. Visibility depth was again recorded when the Secci disk became visible again during its retrieval. The depth of the disk when it disappeared and the depth when it reappeared were averaged to estimate water clarity.

Alaska Fisheries Data Series Number 2013-2, May 2013 U. S. Fish and Wildlife Service
10
Zooplankton Sampling
A 0.2 m diameter 153 μm mesh conical net was used to collect zooplankton samples at both stations (Figure 4). Prior to use, the tow-net and attached collection bucket were cleaned of any debris by rinsing with filtered water. The plankton tow-net was lowered at a steady rate to ensure that the weighted cod-end stayed below the opening of the net until it was approximately 1 m from the lake bottom. The net was then manually retrieved at a constant rate of approximately 0.5 m sec-1 until the rim of the net was just above the water’s surface. Using a squirt bottle with filtered water, the contents of the net were then washed into the collection device. This device was then removed from the net and its contents were emptied into a labeled 125 ml bottle. A 95% solution of ethyl alcohol was used to rinse the collection device and flush any remaining contents into the bottle. Ethyl alcohol was added to the bottle until it was approximately half-full. The bottle was capped and sealed with electrical tape to prevent the contents from leaking. Sample bottles were stored at room temperature (20°C) and later sent to the ADF&G Near Island Limnology Lab in Kodiak where macro-zooplankton taxa were identified and enumerated following established protocols (Koenings et al. 1987; Thomsen et al. 2002). Triplicate 1 ml sub-samples from each sample bottle were analyzed. Each sub-sample was taken with a graduated pipette and placed in a Sedgewick-Rafter counting chamber. Within each sub-sample, all zooplankters were identified according to taxonomic keys (Pennak 1989; Thorp and Covich 2001) and enumerated. Fifteen individuals of each species were measured to the nearest 0.01 mm. Mean body lengths were calculated for each taxon, and biomass was estimated from species-specific linear regression equations between length and dry weight (Koenings et al. 1987).
Figure 3. Plankton net used to sample McLees Lake productivity, 2011.

Alaska Fisheries Data Series Number 2013-2, May 2013 U. S. Fish and Wildlife Service
11
Escapement Monitoring
The McLees Lake weir was installed on 10 June and operated every day until the removal of the weir on 17 July 2011. During this period, 36,602 sockeye salmon were counted through the weir (Figure 4; Appendix A). Peak daily passage occurred on 25 June when 2,208 sockeye salmon were counted through the weir. There were 22 sockeye salmon found dead and observed trapped between pickets or being eaten by eagles at the weir site. Other fish species passing the weir were not counted or recorded.
Figure 4. Daily and cumulative escapement of sockeye salmon, McLees Lake, 2001-2011.
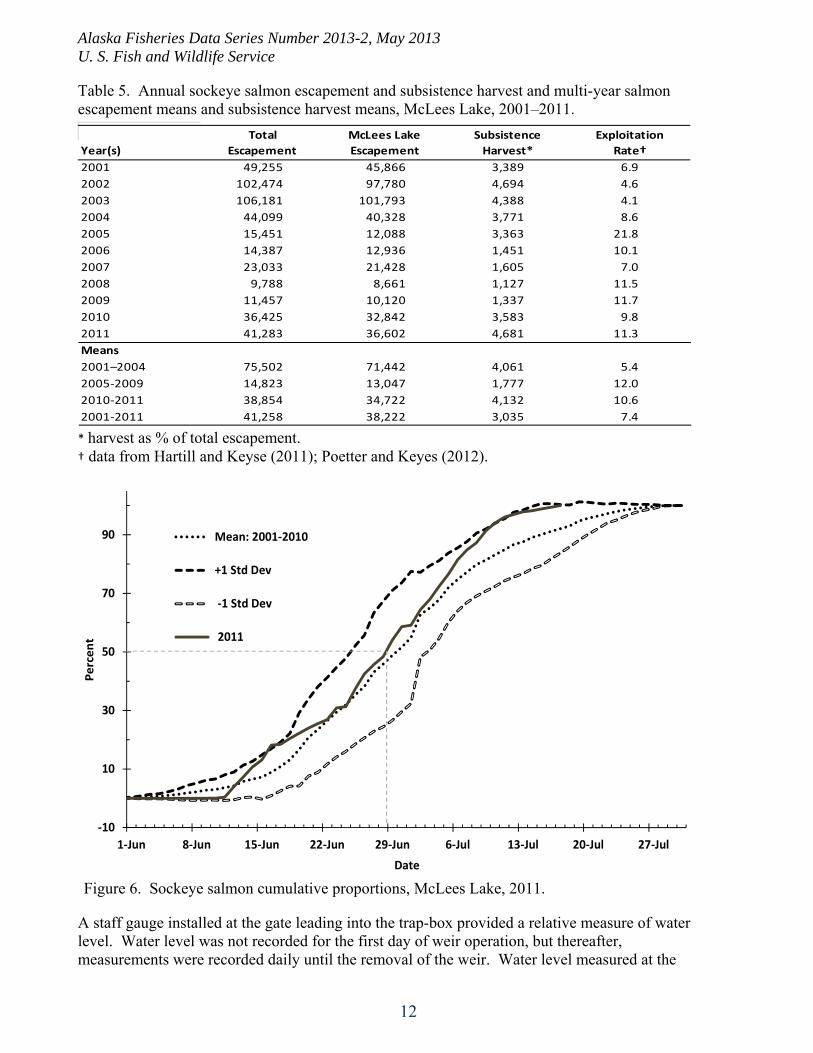
The 2011 McLees Lake sockeye salmon escapement of 36,602 was within 4.6% of the mean of 38,384 for the preceding 10 years (Figure 5). The 2011 run timing was characterized as average because the 2011 run, except for one day in June and one or two days in July, was always within one standard deviation of the mean curve (Figure 6). In addition, run timing, often expressed in relation to the 50% point of the run, was reached at much the same date as the 10-year mean.
Daily Escapement
Cumulative Escapement
Alaska Fisheries Data Series Number 2013-2, May 2013 U. S. Fish and Wildlife Service
12
Table 5. Annual sockeye salmon escapement and subsistence harvest and multi-year salmon escapement means and subsistence harvest means, McLees Lake, 2001–2011.
Year(s)
2001 49,255 45,866 3,389 6.9
2002 102,474 97,780 4,694 4.6
2003 106,181 101,793 4,388 4.1
2004 44,099 40,328 3,771 8.6
2005 15,451 12,088 3,363 21.8
2006 14,387 12,936 1,451 10.1
2007 23,033 21,428 1,605 7.0
2008 9,788 8,661 1,127 11.5
2009 11,457 10,120 1,337 11.7
2010 36,425 32,842 3,583 9.8
2011 41,283 36,602 4,681 11.3
Means
2001–2004 75,502 71,442 4,061 5.4
2005‐2009 14,823 13,047 1,777 12.0
2010‐2011 38,854 34,722 4,132 10.6
2001‐2011 41,258 38,222 3,035 7.4
Total
Escapement
McLees Lake
Escapement
Subsistence
Harvest*
Exploitation
Rate†
*harvest as % of total escapement. † data from Hartill and Keyse (2011); Poetter and Keyes (2012).
Figure 6. Sockeye salmon cumulative proportions, McLees Lake, 2011.
A staff gauge installed at the gate leading into the trap-box provided a relative measure of water level. Water level was not recorded for the first day of weir operation, but thereafter, measurements were recorded daily until the removal of the weir. Water level measured at the
‐10
10
30
50
70
90
1‐Jun 8‐Jun 15‐Jun 22‐Jun 29‐Jun 6‐Jul 13‐Jul 20‐Jul 27‐Jul
Percent
Date
Mean: 2001‐2010
+1 Std Dev
‐1 Std Dev
2011

Alaska Fisheries Data Series Number 2013-2, May 2013 U. S. Fish and Wildlife Service
13
staff gauge peaked on 17 June at 1.38 ft and was at the lowest level on 17 July at 1.08 ft (Figure 7). Beginning 3 July, weir pickets were removed from both sides of the trap-box when counting fish in order to enhance fish passage. The weir was opened in this fashion every day for the remainder of the season. Average daily water temperature was 8.6° C on 11 June, and in general, rose steadily, reaching a peak of 11.7° C on 15 July, and remained at that level until weir removal.
Figure 7. Water temperature and relative water height, McLees Lake, 2011.
Length, Sex, and Age Data
Length measurements (METF) were taken on all 723 sockeye salmon collected. The median METF length was 556 mm and the mode was 560 (n = 26; Figure 8). Measured METF lengths ranged from 446 to 595 mm for females and from 367 to 625 mm for males (Table 3).
Figure 8. Length-frequency (METF) distribution of sampled sockeye salmon, McLees Lake, 2011.
0.5
1.0
1.5
2.0
5
10
15
20
10‐Jun 17‐Jun 24‐Jun 1‐Jul 8‐Jul 15‐Jul
Depth (ft.)
Temperature (C)
Date
Average Daily Temperature
Average Daily Water Depth(relative)
0
25
50
75
100
125
150
175
200
450 470 490 510 530 550 570 590 610 630
Freq
uency
Length (mm)
n = 723

Alaska Fisheries Data Series Number 2013-2, May 2013 U. S. Fish and Wildlife Service
14
Table 3. Sockeye salmon mean METF length (mm), standard error (SE), range, and sample size by sex and age, McLees Lake, 2011.
* includes four sockeye salmon of unknown gender.
Sample size for five of the six weekly strata was sufficient to estimate the composition of gender and major ages of sockeye salmon such that simultaneous 90% confidence intervals had a maximum width of 0.20 (Appendix B.). Due to the small sample size of Stratum 6, it was combined with Stratum 5. Of the 723 sockeye salmon sampled during the season, gender could be determined for 719 (99.4%); 50.3% were comprised of females (Table 4).
Table 4. Estimated sex composition of sockeye salmon by stratum, McLees Lake, 2011.
† estimate. * excludes four fish of unknown sex.
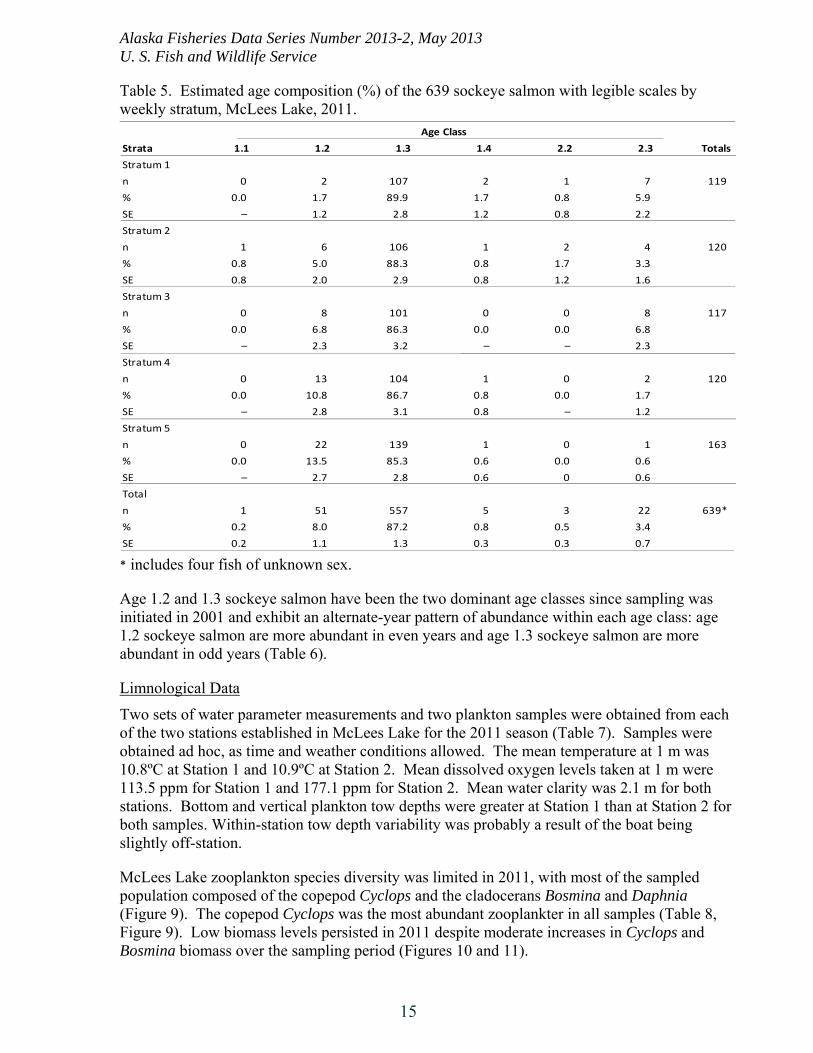
A total of 639 sockeye salmon (88.9 %) could be aged from collected scales (Table 5). Of the six age classes identified, ages 1.2 (8%) and 1.3 (87%) accounted for 95% of all sockeye salmon sampled. Details are not reported for the remaining age groups (ages 1.1, 1.4, 2.2, and 2.3) because collectively they accounted for less than 5% of the run. The weekly proportions of age 1.2 sockeye salmon tended to increase over the course of the run while those for age 1.3 sockeye salmon tended to decrease.
Length 1.1 1.2 1.3 1.4 2.2 2.3 Total n
n – 27 281 – 2 8 318
Mean – 501 543 – 488 547
Min – 464 446 – 470 530
Max – 557 574 – 505 566
SE – 1.4 1.5 – 1.35 1.51
n 1 24 272 5 1 14 317
Mean 367 514 571 595 518 558
Min 367 460 508 575 518 530
Max 367 591 621 625 518 590
SE 1.0 1.4 1.6 1.7 1.5 1.6
n 1 51 557 5 3 22 639*
Mean 367 505 617 595 498 555
Min 367 460 446 575 470 501
Max 367 591 621 625 518 590
SE – 0.7 0.9 0.8 0.7 0.8
Age Class
Female
Male
Total
Count
Stratum n Female (%) Male (%) SE (%) Escapement Female† Male†
1 135 51.1 48.9 4.3 6,625 3,386 3,239
2 134 46.3 53.7 4.3 4,668 2,160 2,508
3 135 57.0 43.0 4.3 10,174 5,803 4,371
4 135 48.9 51.1 4.3 9,586 4,686 4,900
5 180 48.9 51.1 3.7 5,549 2,713 2,836
Total 719* 50.3 49.7 1.9 36,602 18,748 17,854
Alaska Fisheries Data Series Number 2013-2, May 2013 U. S. Fish and Wildlife Service
15
Table 5. Estimated age composition (%) of the 639 sockeye salmon with legible scales by weekly stratum, McLees Lake, 2011.
* includes four fish of unknown sex.
Age 1.2 and 1.3 sockeye salmon have been the two dominant age classes since sampling was initiated in 2001 and exhibit an alternate-year pattern of abundance within each age class: age 1.2 sockeye salmon are more abundant in even years and age 1.3 sockeye salmon are more abundant in odd years (Table 6).
Limnological Data
Two sets of water parameter measurements and two plankton samples were obtained from each of the two stations established in McLees Lake for the 2011 season (Table 7). Samples were obtained ad hoc, as time and weather conditions allowed. The mean temperature at 1 m was 10.8ºC at Station 1 and 10.9ºC at Station 2. Mean dissolved oxygen levels taken at 1 m were 113.5 ppm for Station 1 and 177.1 ppm for Station 2. Mean water clarity was 2.1 m for both stations. Bottom and vertical plankton tow depths were greater at Station 1 than at Station 2 for both samples. Within-station tow depth variability was probably a result of the boat being slightly off-station.
McLees Lake zooplankton species diversity was limited in 2011, with most of the sampled population composed of the copepod Cyclops and the cladocerans Bosmina and Daphnia (Figure 9). The copepod Cyclops was the most abundant zooplankter in all samples (Table 8, Figure 9). Low biomass levels persisted in 2011 despite moderate increases in Cyclops and Bosmina biomass over the sampling period (Figures 10 and 11).
Strata 1.1 1.2 1.3 1.4 2.2 2.3 Totals
Stratum 1
n 0 2 107 2 1 7 119
% 0.0 1.7 89.9 1.7 0.8 5.9
SE – 1.2 2.8 1.2 0.8 2.2
Stratum 2
n 1 6 106 1 2 4 120
% 0.8 5.0 88.3 0.8 1.7 3.3
SE 0.8 2.0 2.9 0.8 1.2 1.6
Stratum 3
n 0 8 101 0 0 8 117
% 0.0 6.8 86.3 0.0 0.0 6.8
SE – 2.3 3.2 – – 2.3
Stratum 4
n 0 13 104 1 0 2 120
% 0.0 10.8 86.7 0.8 0.0 1.7
SE – 2.8 3.1 0.8 – 1.2
Stratum 5
n 0 22 139 1 0 1 163
% 0.0 13.5 85.3 0.6 0.0 0.6
SE – 2.7 2.8 0.6 0 0.6
Total
n 1 51 557 5 3 22 639*
% 0.2 8.0 87.2 0.8 0.5 3.4
SE 0.2 1.1 1.3 0.3 0.3 0.7
Age Class

Alaska Fisheries Data Series Number 2013-2, May 2013 U. S. Fish and Wildlife Service
16
Table 6. Sockeye salmon sex and age composition, McLees Lake, 2001–2010.
* 1.1, 1.4, 2.2, and 2.3 are not reported because collectively they represented <5% of the total aged fish. † standard error not reported for estimates. ǂ estimate.
Table 7. Limnological sampling data collected at two established stations, McLees Lake, 2011.
Year Female % Male % SE₁ 1.2 SE⁹ 1.3 SE⁹
2001⁸ 42 58 – 4 – 94 –
2002⁸ 43 57 – 60 – 32 –
2003⁸ 46 54 – 8 – 78 –
2004 43 57 2.2 54 2.2 32 2.0
2005 38 62 2.2 8 1.3 88 1.5
2006 45 55 2.1 38 2.0 58 2.1
2007 38 62 1.7 1 0.4 87 1.3
2008 54 46 2.1 68 2.0 30 1.9
2009 39 61 4.0 19 2.4 74 2.6
2010 55 45 2.0 35 2.1 63 2.0
2011 50 50 1.9 8 1.1 87 1.3
Gender Age⁷ (%)
Bottom Temperature
Station Sample Date Depth (m) Tow Depth (m) (⁰C @ 1 m) DO (ppm @ 1 m) Visibility (m)
1 1 07/04/11 9.5 7.5 10.2 104.5 2.3
2 2 07/05/11 8.5 6.5 10.3 109.9 2.4
1 1 07/13/11 9.3 7.0 11.4 122.5 1.9
2 2 07/14/11 8.5 6.0 11.5 124.3 1.8
*
†††
ǂ
ǂ
ǂ

Alaska Fisheries Data Series Number 2013-2, May 2013 U. S. Fish and Wildlife Service
17
Figure 9. McLees Lake zooplankton abundance and seasonal mean, 2011.
Figure 10. Biomass of the three most abundant zooplankters by collection date and with seasonal mean, McLees Lake, 2011.
0
4000
8000
12000
16000
20000
4‐Jul 13‐Jul Mean Average
Abundance (number/m
2)
Date
Cyclops
Nauplii
Bosmina
Daphnia longiremis
0
4
8
12
16
4‐Jul 13‐Jul Weighted Mean 2011
Zooplankton biomass (mg/m²)
Date
Cyclops
Bosmina
Daphnia
,
,
,
,
,

Alaska Fisheries Data Series Number 2013-2, May 2013 U. S. Fish and Wildlife Service
18
Figure 11. Mean biomass per m² of copepods and cladocerans in McLees Lake, by sample date, with seasonal mean, 2011.
Ovigerous (egg-bearing) Bosmina were not substantially below, and on occasion were above, the juvenile sockeye salmon feeding threshold size of 0.40 mm (Figure 12). The 2011 McLees Lake zooplankton followed a trend similar to that of 2009 and 2010: limited species diversity, low biomass levels, and Bosmina lengths below the juvenile sockeye salmon feeding threshold size (Figure 12). Average lengths for 2011 Cyclops and Bosmina were similar in comparison to those encountered during the 2009 and 2010 seasons.
Figure 12. Mean lengths (mm) of Cyclops, Bosmina, Ovigerous Bosmina, Daphnia, Ovigerous Daphnia, and community mean, relative to the juvenile sockeye salmon feeding threshold size as determined by Kyle (1992), McLees Lake, 2011.
0
4
8
12
16
4‐Jul 13‐Jul Weighted Mean 2011
Zooplankton biomass (mg/m²)
Date
Cyclops
Bosmina
Daphnia
0.0
0.2
0.4
0.6
0.8
4‐Jul 13‐jul
Length (mm)
Date
Cyclops
Bosmina
Ovigorus Bosmina
Daphnia
Ovigorus Daphnia
Mean
Juvenile sockeyesalmon feedingthreshold

Alaska Fisheries Data Series Number 2013-2, May 2013 U. S. Fish and Wildlife Service
19
DiscussionThe McLees Lake weir was not operational until 10 June due to weather considerations. Some portion of the sockeye salmon run to McLees Lake likely escaped numeration. Fish were seen passing through at the start of operation at the weir on 10 June and by the third day of operation were passing at rates above 1,000/day (Appendix A). Daily passage rates dropped to less than 1% of the total escapement on 12 July. The weir was removed five days later on 17 July. There were sockeye salmon holding in a pool just downstream from the weir-site at that time and no attempt was made to estimate their numbers.
Unalaska residents have not been able to harvest sockeye salmon at the location nearest the community, the outlet of Unalaska Lake, since that area was closed to subsistence fishing in 1997 due to declining run abundance. Since then, the more distant Reese Bay has become a major source of subsistence salmon harvests. Sockeye salmon escapements were substantially lower during 2005–2009 than those recorded during the first four years of the study (Figure 13). This generally resulted in greater exploitation rates, although the actual number of sockeye salmon harvested were much less than those taken during the previous five years (Hartill and Keyse 2011). The average annual harvest declined from about 4,500 sockeye salmon in 2002 to under 1,500 for the four years prior to 2010. The return of over 36,000 sockeye salmon in 2010 and over 40,000 in 2011 resulted in an increase in subsistence harvest (Hartill and Keyse 2011; Poetter and Keyes 2012).
Figure 13. Cumulative escapement of sockeye salmon, 2001–2011, McLees Lake.
Between 1 and 9 July ADF&G typically closes Reese Bay subsistence fishing from an area extending 150 m on either side of the McLees Lake outlet into Reese Bay. However, the poor sockeye salmon runs of 2008 and 2009 led ADF&G to maintain the 150 m closure after 9 July for the remainder of those harvest seasons. As occurred in 2010, the 2011 escapement of
0
10,000
20,000
30,000
40,000
50,000
60,000
70,000
80,000
90,000
100,000
110,000
0
10,000
20,000
30,000
40,000
50,000
60,000
70,000
80,000
90,000
100,000
110,000
30‐May 6‐Jun 13‐Jun 20‐Jun 27‐Jun 4‐Jul 11‐Jul 18‐Jul 25‐Jul
Cumulative escap
ement
Cumulative Escap
ement
Date
2001
2002
2003
2004
2005
2006
2007
2008
2009
2010
2011
* †

Alaska Fisheries Data Series Number 2013-2, May 2013 U. S. Fish and Wildlife Service
20
approximately 40,000 sockeye salmon resulted in ADF&G allowing subsistence fishing to resume within the 150 m area surrounding the outlet after the seasonal July closure.
Causes for the low sockeye salmon runs to McLees Lake during 2005–2009 are unknown. Theories include predation by other species, inter- and intra-specific competition for resources, and insufficient food supplies. The relatively large spawning escapements that occurred during 2001–2004 could have resulted in intra-specific competition for available food and may have depleted the zooplankton population or altered its species composition and size. While zooplankton information is not available prior to 2009, we found overall levels of zooplankton biomass and species diversity to be low in samples taken during 2009–2011. In those years, zooplankton biomass estimates were at or close to reported starvation levels for juvenile sockeye salmon, although average lengths of all zooplankton species, except Bosmina, were above the threshold size for juvenile sockeye salmon feeding (Kyle 1992; Mazumder and Edmundson 2002). This has been observed in other shallow Alaska Peninsula lakes (Finkle and Ruhl 2009) and is not uncommon when top-down or bottom-up pressures, such as over-grazing or reduced water clarity occur (Thorpe and Covich 2001; Wetzel 1983). Evidence of overgrazed zooplankton populations resulting in a reduction in cladoceran body length (Schindler 1992), and the small size of Bosmina in 2011 suggests that grazing pressure was high. However, egg-bearing Bosmina were not below the juvenile sockeye salmon feeding threshold size of 0.40 mm (Kyle 1992), which may indicate that grazing pressure had less influence upon the cladoceran population than other factors such as turbidity or temperature. A moderate increase in Cyclops and Bosmina biomass occurred during the two weeks between 4 July and 13 July 2011, and increased cladoceran abundance has been observed to coincide with algal blooms and increased precipitation or temperature (Thorpe and Covich 2001). Although increased cladoceran abundance could have been the result of increased phytoplankton production that created conditions favorable to foraging zooplankters, it could also have been due to a reduction in grazing pressure when juvenile sockeye salmon smolted and migrated seaward from McLees Lake. More importantly, even with increases in cladoceran biomass between the first and the third weeks of July, the total zooplankton biomass of McLees Lake remained at very low levels for the duration of the 2011 sampling season (9 to 28 mg mֿ²), much lower than the 1993–1994 mean of 291 mg mֿ² (Honnold et al. 1996). Because no data are available between 1994 and 2009, we do not know if the condition of the zooplankton population is a recent occurrence. In addition, because we only sampled two deep-water stations in the lake we do not know whether these stations are representative of the entire basin. Over 41,000 sockeye salmon adults counted at the weir site this year suggests that when these returning adults were juveniles, the feeding conditions in the lake were better than those currently recorded, or there are zooplankton areas in this system that are more productive than the two stations we sampled. It is also possible that sockeye salmon juveniles have adapted their rearing strategies to deal with changes to their forage base or habitat. Because McLees Lake is shallow, aquatic insects may play an important role in the juvenile sockeye salmon forage base and could help offset deficiencies in zooplankton availability. However, the availability of other juvenile sockeye salmon forage has not been studied.
RecommendationsEscapements and subsistence harvests should continue to be monitored. Escapement levels needed to sustain harvests and maintain healthy salmon runs to McLees Lake were recently evaluated by ADF&G and a Sustainable Escapement Goal of 10,000–60,000 sockeye salmon was set, but can only be used for management during years in which a weir is operated

Alaska Fisheries Data Series Number 2013-2, May 2013 U. S. Fish and Wildlife Service
21
(Witteveen et al. 2009). Continued long-term documentation of escapements and harvests would also allow forecasts of future run abundance, evaluation of the escapement goal, and proactive management strategies.
Assessment of freshwater parameters, could help fishery managers better understand effects of freshwater conditions on sockeye salmon production if multi-year, multiple-station sampling were conducted. With more comprehensive data-collection methods, simple, habitat-based limnology models, such as the euphotic volume model (Koenings and Kyle 1997) could help assess current and potential adult production levels and lake rearing capacity. Production could also be used to indicate rearing conditions and rates of return if numbers and weights of smolts during the out-migration could be estimated.
AcknowledgementsWe would like to thank Michael Polchlovek, Crew Leader for the project in 2011. We also thank the Qawalangin Tribe for providing a fisheries technician for the project: Ivan Krukoff, whom we also thank. We also thank Heather Fitch, Alaska Department of Fish and Game, and her staff for their assistance in transporting supplies and personnel from Dutch Harbor to the weir site, providing logistical support, and for providing bunkhouse space for the crew while in Dutch Harbor. From the Alaska Department of Fish and Game in Kodiak, Alaska, we thank Birch Foster for scoring the scale-cards used to produce age data and Darin Ruhl for processing zooplankton samples for the limnological data presented in this report. The U.S. Fish and Wildlife Service Office of Subsistence Management provided funding for this work through the Fisheries Resource Monitoring Program as project number FIS 10–406, and we thank them for their generous assistance.

Alaska Fisheries Data Series Number 2013-2, May 2013 U. S. Fish and Wildlife Service
22
ReferencesAnderson, J. E. and M. R. Edwards. 2008. Estimation of sockeye salmon escapement into
McLees Lake, Unalaska Island, Alaska, 2007. U.S. Fish and Wildlife Service, Alaska Fisheries Data Series. Report Number 2008–9, Anchorage, Alaska.
Bromaghin, J. F. 1993. Sample size determination for interval estimation of multinomial probabilities. The American Statistician, 47:203–206.
Cochran, W. G. 1977. Sampling techniques, 3rd edition. John Wiley and Sons, New York.
Devries, D. R. and R. V. Frie. 1996. Determination of age and growth. [in] Fisheries Techniques. B. Murphy and D. Willis, editors. Bethesda: American Fisheries Society, pp. 483-513.
Edmundson, J. A., L. E. White, S. G. Honnold, and G. B. Kyle. 1994. Assessment of sockeye salmon production in Akalura Lake. Alaska Department of Fish and game, Commercial Fisheries Management and Development Division. Regional Information Report No. 4J94–17, Juneau, Alaska.
Edwards, M. R. 2005. Estimation of sockeye salmon escapement into McLees Lake, Unalaska Island, Alaska, 2004. U.S. Fish and Wildlife Service. Alaska Fisheries Data Series Report Number 2005–4, King Salmon, Alaska.
Edwards, M. R. 2006. Estimation of sockeye salmon escapement into McLees Lake, Unalaska Island, Alaska, 2006. U.S. Fish and Wildlife Service. Alaska Fisheries Data Series Report Number 2006–12, King Salmon, Alaska.
Edwards, M. R. and D. R. Hildreth. 2005. Estimation of sockeye salmon escapement into McLees Lake, Unalaska Island, Alaska, 2005. U.S. Fish and Wildlife Service. Alaska Fisheries Data Series Report Number 2005–16, King Salmon, Alaska.
Finkle, H., and D. C. Ruhl. 2009. Sockeye salmon smolt investigations on the Chignik River, 2008. Alaska Department of Fish and Game, Division of Commercial Fisheries. Fishery Data Series 09–16, Anchorage, Alaska.
Gates, K. S. and D. E. Palmer. 2004. Estimation of the sockeye salmon escapement into McLees Lake, Unalaska Island, Alaska, 2003. U.S. Fish and Wildlife Service. Alaska Fisheries Data Series Report Number 2004–1, Kenai, Alaska.
Hartill, T. G. and M. D. Keyse. 2011. Annual summary of the commercial and subsistence use salmon fisheries and salmon escapements in the Alaska Peninsula, Aleutian Islands, and Atka-Amilia Islands management areas, 2010. Alaska Department of Fish and Game, Division of Sport Fish, Research, and Technical Services. Fishery Management Report No. 11–34. Anchorage, Alaska.
Hildreth, D. R. 2009. Estimation of sockeye salmon escapement into McLees Lake, Unalaska Island, Alaska, 2008. Alaska Fisheries Data Series Report Number 2010–11, Anchorage, Alaska.
Hildreth, D. R. and H. Finkel. 2010. Estimation of sockeye salmon escapement into McLees Lake, Unalaska Island, Alaska, 2009. Alaska Fisheries Data Series Report Number 2009–7, Anchorage, Alaska.

Alaska Fisheries Data Series Number 2013-2, May 2013 U. S. Fish and Wildlife Service
23
Hildreth, D. R. and H. Finkel. 2011. Estimation of sockeye salmon escapement into McLees Lake, Unalaska Island, Alaska, 2010. Alaska Fisheries Data Series Report Number 2011–13, Anchorage, Alaska.
Honnold, S. G., J. A. Edmundson, and S. Schrof. 1996. Limnological and fishery assessment of 23 Alaska Peninsula and Aleutian area lakes, 1993–1995: an evaluation of potential sockeye and coho salmon production. Alaska Department of Fish and Game, Division of Commercial Fisheries. Regional Information Report 4K96–52, Kodiak, Alaska.
Jearld, A. 1983. Age determination. Pages 301–324 in L. A. Nielsen and D. L. Johnson, editors. Fisheries Techniques. American Fisheries Society, Bethesda, Maryland.
Koenings, J. P., J. A. Burkett, and J. M. Edmundson. 1987. Limnology field and laboratory manual; methods for assessing aquatic production. Alaska Department of Fish and Game, FRED Division. Report Series 71, Juneau, Alaska.
Koenings, J. P., and G. B. Kyle. 1997. Consequences to juvenile sockeye salmon and the zooplankton community resulting from intense predation. Alaska Fisheries Research Bulletin, 4(2):120–135.
Kyle, G. B. 1992. Assessment of lacustrine productivity relative to juvenile sockeye salmon (Oncorhynchus nerka) production in Chignik and Black Lakes: results from 1991 surveys. Alaska Department of Fish and Game, FRED Division. Report 119, Juneau, Alaska.
Kyle, G. B., J. P. Koenings, and B. M. Barrett. 1988. Density dependent trophic levels responses to an introduced run of sockeye salmon Oncorhynchus nerka at Frazer Lake, Kodiak Island, Alaska. Canadian Journal of Fisheries and Aquatic Sciences, 45:856–867.
Mazumder, A., and J. A. Edmundson. 2002. Impact of fertilization and stocking on trophic interactions and growth of juvenile sockeye salmon (Oncorhynchus nerka). Canadian Journal of Fisheries and Aquatic Sciences, 59:1361–1373.
Mosher, K. H. 1969. Identification of Pacific salmon and steelhead trout by scale characteristics. USDOI, U.S. Fish and Wildlife Service, Bureau of Commercial Fisheries, XF WC-A 317: 1-17. Palmer, D. E. 2002. Estimation of the sockeye salmon escapement into McLees Lake, Unalaska Island, Alaska, 2001. U.S. Fish and Wildlife Service. Alaska Fisheries Data Series Report Number 2002–2, Kenai, Alaska.
Palmer, D. E. 2003. Estimation of the sockeye salmon escapement into McLees Lake, Unalaska Island, Alaska, 2002. U.S. Fish and Wildlife Service, Alaska Fisheries Data Series Report Number 2003–4, Kenai, Alaska.
Palmer, D. E. 2004. Estimation of the sockeye salmon escapement into McLees Lake, Unalaska Island, Alaska, 2003. U.S. Fish and Wildlife Service, Alaska Fisheries Data Series Report Number 2004–1, Kenai, Alaska.
Pennak, R.W. 1989. Fresh–water invertebrates of the United States, 2nd. John Wiley and Sons. New York.
Poetter, A. D. and M. D. Keyse. 2012. Aleutian Islands and Atka-Amilia Islands management areas salmon annual management report, 2011. Alaska Department of Fish and Game, Divisions of Sport Fish and Commercial Fisheries. Fishery Management Report No. 12–19, Anchorage, Alaska.

Alaska Fisheries Data Series Number 2013-2, May 2013 U. S. Fish and Wildlife Service
24
Schindler, D. E. 1992. Nutrient regeneration of sockeye salmon (Oncorhynchus nerka) fry and subsequent effects on zooplankton and phytoplankton. Canadian Journal of Fisheries and Aquatic Sciences, 49:2498–2506.
Seber, G. A. F. 1982. The Estimation of Animal Abundance and Related Parameters, 2nd edition. Maxmillan, New York.
Thomsen, S.E., S. Honnold, S. Schrof, and K. Spalanger. 2002. Kodiak Island Lake Assessment/Limnology Project Laboratory Analysis Operational Plan. Alaska Department of Fish and Game. Division of Commercial Fisheries, Kodiak, Alaska.
Thorp, J. H. and A. P. Covich. 2001. Ecology and classification of North American freshwater invertebrates. 2nd Ed. Academic Press, San Diego, California.
Tschersich, P. and E. A. Russ. 2008. Annual summary of the commercial, subsistence and personal use salmon fisheries and salmon escapements in the Alaska Peninsula, Aleutian Islands, and Atka-Amlia Islands management areas, 2007. Alaska Department of Fish and Game. Fishery Management Report No. 08–22, Anchorage, Alaska.
Wetzel, R. G. 1983. Limnology. New York, CBS College Publishing.
Witteveen, M. J., H. Finkle, M. B. Foster, and J. W. Erickson. 2009. Review of salmon escapement goals in the Alaska Peninsula and Aleutian Islands management areas; a report to the Alaska Board of Fisheries, 2010. Alaska Department of Fish and Game, Division of Sport Fish, Research, and Technical Services. Fishery Manuscript No. 09–09, Anchorage, Alaska.
Zar, J. H. 1999. Biostatistical analysis. 4th Ed. Prentice-Hall, Inc. Upper Saddle River, New Jersey.

Alaska Fisheries Data Series Number 2013-2, May 2013 U. S. Fish and Wildlife Service
25
Appendix A. Daily and cumulative escapement* of sockeye salmon, McLees Lake, 2011.
*does not include harvested sockeye salmon.
Daily Cumulative % Total
Count Escapement Escapement
10‐Jun 15 15 0.04
11‐Jun 113 128 0.31
12‐Jun 1,333 1,461 3.64
13‐Jun 1,191 2,652 3.25
14‐Jun 1,276 3,928 3.49
15‐Jun 863 4,791 2.36
16‐Jun 1,834 6,625 5.01
17‐Jun 135 6,760 0.37
18‐Jun 714 7,474 1.95
19‐Jun 658 8,132 1.80
20‐Jun 645 8,777 1.76
21‐Jun 554 9,331 1.51
22‐Jun 505 9,836 1.38
23‐Jun 1,457 11,293 3.98
24‐Jun 161 11,454 0.44
25‐Jun 2,208 13,662 6.03
26‐Jun 1,889 15,551 5.16
27‐Jun 1,173 16,724 3.20
28‐Jun 972 17,696 2.66
29‐Jun 2,094 19,790 5.72
30‐Jun 1,677 21,467 4.58
1‐Jul 178 21,645 0.49
2‐Jul 1,927 23,572 5.26
3‐Jul 1,285 24,857 3.51
4‐Jul 1,622 26,479 4.43
5‐Jul 1,533 28,012 4.19
6‐Jul 1,838 29,850 5.02
7‐Jul 1,203 31,053 3.29
8‐Jul 895 31,948 2.45
9‐Jul 1,476 33,424 4.03
10‐Jul 995 34,419 2.72
11‐Jul 724 35,143 1.98
12‐Jul 339 35,482 0.93
13‐Jul 349 35,831 0.95
14‐Jul 125 35,956 0.34
15‐Jul 236 36,192 0.64
16‐Jul 197 36,389 0.54
17‐Jul 213 36,602 0.58
Totals 36,602 36,602 100
Date

Alaska Fisheries Data Series Number 2013-2, May 2013 U. S. Fish and Wildlife Service
26
Appendix B. Standard errors (SE) and estimated confidence intervals (CI) for estimates of sockeye salmon age and sex, McLees Lake, 2011 (from Zar 1999).
Parameter Female Male50 501.9 1.9
318 3171.65 1.65
3.135 3.1354.785 4.785
-1.485 -1.4850.063 0.063
1.2 1.3Gender
% 8 87SE 1.1 1.3n 51 557
Age Class*
Critical value (Zar, 1999 1.676 1.647
Lower CI -0.168 -0.494
CI 1.844 2.141Upper CI 3.520 3.788
Difference (< 0.20) 0.037 0.043 *1.1, 1.4, and 2.2 not reported because they were each <1% of the total.