Embed Size (px)
Citation preview
Gulkana Hatchery Sockeye Salmon Enhancement Project Historical Data Report, 1973-1993
Kenneth Roberson and
Russell R. Holder
Regional Information Report' No. $B3*30
Alaska Department of Fish and Game Division of Commercial Fisheries Management and Development
333 Raspberry Road Anchorage, Alaska 99518-1599
September 1993
The Regional Information Report Series was established in 1987 LO provide an information access system for all unpublished divisional reports. These reports frequently serve diverse ad hoc informational purposes or archive basic 3ninterpreted data. To accommodate timely rapcrting of recently collected information, reports in chis series undergo only limited internal review and may contain preliminary data; this information may be subsequencly finalized and published in the formal literature. Consequently, these reports should not be cited without prior approval of the author or the Division of Comercial i'isheries Management and Development.
AUTHORS
Kenneth Roberson was Upper Copper River Area ~iologist for the Alaska Department of Fish and Game, Division of Fisheries Rehabilitation, Enhancement and Development, P.O. Box 47, Glennallen, Alaska 99588-0047. He retired from duty in 1993.
Russell R. Holder was Project Biologist, 1980-1988, for the Alaska Department of Fish and Game, Division of Fisheries Rehabilitation, Enhancement and Development, P.O. Box 47, Glennallen, Alaska 99588- 0047.
TABLE OF CONTENTS
LISTOFTABLES . . . . . . . . . . . . . . . . . . . . . . . IV
LISTOFFIGURES . . . . . . . . . . . . . . . . . . . . . . . VI
LIST OF APPENDICES . . . . . . . . . . . . . . . . . . . . . IX
ABSTRACT . . . . . . . . . . . . . . . . . . . . . . . . . . . 1
INTRODUCTION . . . . . . . . . . . . . . . . . . . . . . . . . 2 Enhancement Rational . . . . . . . . . . . . . . . . . 2 Geographic Location . . . . . . . . . . . . . . . . . . . 6 ProjectEvolution . . . . . . . . . . . . . . . . . . . 6
PROJECT ACTIVITIES . . . . . . . . . . . . . . . . . . . . . 8 Production . . . . . . . . . . . . . . . . . . . . . . . . 8
Background . . . . . . . . . . . . . . . . . . . . . 8 Materials and Methods . . . . . . . . . . . . . . . 9 Results . . . . . . . . . . . . . . . . . . . . . 18 Discussion . . . . . . . . . . . . . . . . . . . . 22
Research . . . . . . . . . . . . . . . . . . . . . . . 26 Background . . . . . . . . . . . . . . . . . . . . 26 Materials and Methods . . . . . . . . . . . . . . 29 Results . . . . . . . . . . . . . . . . . . . . . . 34 Discussion . . . . . . . . . . . . . . . . . . . 46
Evaluation . . . . . . . . . . . . . . . . . . . . . . . 54 IHNV Investigations . . . . . . . . . . . . . . . . 55
Background . . . . . . . . . . . . . . . . . . 55 Materials and Methods . . . . . . . . . . . . 56 Results . . . . . . . . . . . . . . . . . . . 57 Discussion . . . . . . . . . . . . . . . . . . 62
LimnologicalEvaluations . . . . . . . . . . . . . 64 Background . . . . . . . . . . . . . . . . . . 64 Materials and Methods . . . . . . . . . . . . 65 Results . . . . . . . . . . . . . . . . . . 65 Discussion . . . . . . . . . . . . . . . . . . 65
Summit Lake Smolt Program . . . . . . . . . . . . . 69 Background . . . . . . . . . . . . . . . . . . 69 Materials and Methods . . . . . . . . . . . . 69 Results . . . . . . . . . . . . . . . . . . . 72 Discussion . . . . . . . . . . . . . . . . . . 78
Adult Salmon Investigations . . . . . . . . . . . . 81 Background . . . . . . . . . . . . . . . . . 81 Materials and Methods . . . . . . . . . . . . 82 Results . . . . . . . . . . . . . . . . . . . 83 Discussion . . . . . . . . . . . . . . . . . 90
ACKNOWLEDGEMENTS . . . . . . . . . . . . . . . . . . . . . . 101
REFERENCES . . . . . . . . . . . . . . . . . . . . . . . . . . 1
APPENDICES . . . . . . . . . . . . . . . . . . . . . . . . . . 1
LIST OF TABLES
Table Page
Water quality measurements of the Gulkana Hatchery spring . . . . . . . . . . . . . . . . . . . . . . . . .
Water quality parameters for incubator effluent . . . .
Summary of available incubators, number used, egg take goals, actual eggs taken, fry produced, and egg to fry survival . . . . . . . . . . . . . . . . . .
Infectious hematopoietic necrosis virus (IHNV) history at Gulkana Hatchery . . . . . . . . . . . . . .
Tabulation of incubator type, substrates, and egg density used in this reseach with subsequent fry survival and timing also listed . . . . . . . . . . . .
The mean lengths, weights, and condition of development (with standard deviations) for emergent fry at 25% and 50% emergence from hatchery incubators and natural study area . . . . . . . . . . . . . . . . . . . . . . .
The mean lengths, weights, and condition of development for emergent fry at 25% and 50% emergence from hatchery incubators standardized to the same condition of development as natural fry . . . . . . . . . . . . . . .
Comparison of egg densities and water flow rates per incubator substrate volume used in this study and by otherauthors . . . . . . . . . . . . . . . . . . . .
Prevalence of IHNV in adult sockeye salmon from the Gulkana Hatchery broodstock . . . . . . . . . . . .
Results of IHNV screening of emergent fry from the GulkanaHatchery, 1978-1988 . . . . . . . . . . . . . .
Summary of Summit Lake emigrant smolt numbers, valid coded wire tagged smolt released, and probable fry to smolt (FTS) survival . . . . . . . . . . . . . . . .
Summit Lake emigrant sockeye salmon smolt age, weight, and length samples . . . . . . . . . . . . . . . . . . .
Estimated total adult return of Gulkana Hatchery fish based on a fry to adult survival of 1% . . . . . . . . .
14. Summary of Gunn Creek spawning ground recovery of coded wire tagged sockeye salmon . . . . . . . . . . . . 86
15. Age class composition of commercial and spawning groundCWTrecoveries . . . . . . . . . . . . . . . . . 87
16. Reconstructed Summit Lake adult returns estimated from expanded commercial catch coded wire tag recovery and tagged-untagged spawning ground ratio . . . 88
17. Gunn Creek and Crosswind Lake estimated spawning escapement compared to actual peak aerial survey data. Estimated spawning escapement was based on a fry to adult survival of 0.74% and corrected for commercial, personal use, subsistence, and sportharvests. . . . . . . . . . . . . . . . . . . . . 89
18. Aerial survey data for Gunn Creek, and inlet tributary to Summit Lake on the upper Copper River. Numbers include those schooled at the mouth of Gunn Creek and fish in Gunn Lake Creek tributary . . . . . . . . . . . 95
19. Benefit to cost ratio for the Gulkana Hatchery program as estimated for program costs and commercial fishery revenue . . . . . . . . . . . . . . . . . . . . . . 99

LIST OF FIGURES
Figures Page
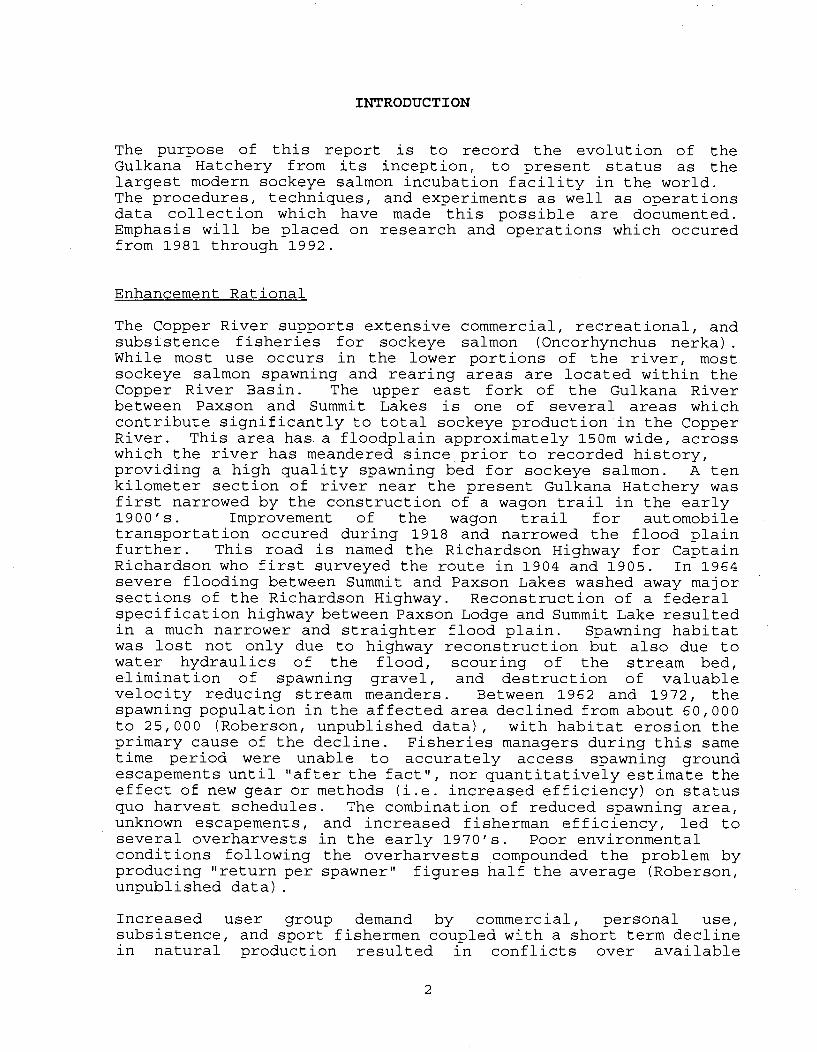
1. Summary of Gulkana spring water temperature data (mean and +2SD), collected by Ryan recording thermograph since 1973 . . . . . . . . . . . . . . . . . . . . . . . . 4
2. Location of Gulkana Hatchery in relation to lakes and major geographic features in the Copper River watershed . . . . . . . . . . . . . . . . . . . . . . . 7
3 . Diagram of plywood-reinforced upwelling production incubator used at the Gulkana Hatchery, showing general construction and configuration of rearing material. . . . . . . . . . . . . . . . . . . . . . . . 11
4. Gulkana Hatchery in relation to the Richardson Highway, Gulkana River, and upper and lower egg collection locations, identified by commonly used names . . . . . . . . . . . . . . . . . . . . . . .
5. GulkanaHatchery. . . . . . . . . . . . . . . . . . . 14
6. Diagram of egg take process at the Gulkana Hatchery . . 15
7. Comparison of incubator gravel types with natural redd gravel by particle size distribution, based on sieveretention . . . . . . . . . . . . . . . . . . . . 31
8. Daily emergence of fry from the hatchery incubators and natural fry site, smoothed by a moving average of equal weight having a function order of three . 36
9. Mean cumulative emergent timing of incubator fry from the three incubator substrates and fry from the natural studysite. . . . . . . . . . . . . . . . . . . 37
10. Mean lengths of incubator fry samples designated by substrate type and graphed relative to the percent emergence of the sampled unit at the time the sample wascollected (P=0.47) . . . . . . . . . . . . . . . . . 39
11. Mean weights of incubator fry samples designated by substrate type and graphed relative to the percent emergence of the sampled unit at the time the sample was collected (P=0.15 . . . . . . . . . . . . . . . . 40
Condition of development of incubator fry samples designated by substrate type and graphed relative to the percent emergence of the sampled unit at the time the sample was collected (P=0.05 . . . . 41
Plot of weight against cumulative degree-days for incubator fry samples and natural study site fry. The resultant regression equations are shown far each source. . . . . . . . . . . . . . . . . . . . . . . . . 42
Plot of condition of development against cumulative degree- days for incubator fry samples and natural study site fry. The resultant regression equations are shown for each source . . . . . . . . . . . . . . . 4 3
Plot of lenght against cumulative degree-days for incubator fry samples and natural study site fry. The resultant regression equations are shown for eachsource . . . . . . . . . . . . . . . . . . . . . . 44
Male IHNV titer distribution from 60 sockeye salmon collected on October 13 and 14, 1987 . . . . . . . . . . 60
IHNV outbreaks in Gulkana Hatchery incubators, relative to when the eggs were collected within each egg-take season. The calendar range of beginning and ending date 28 to October 15 . 63
Paxson Lake limnological sampling stations . 66
Summit Lake limnological sampling stations . 67
Crosswind Lake limnological sampling stations . 68
Gulkana Hatchery in relation to Summit Lake, Richardson Highway, Gulkana River, and Gunn Creek . 70
Location and design of net, live trap, and tagging shelter for capture of emigrant Summit Lake sockeye salmonsmolt . . . . . . . . . . . . . . . . . . . . . . 71
Estimated daily percent sockeye salmon smolt emigration from Summit Lake, based on 1984 capture data, smoothed by a moving average having a function order of one .
Summit Lake sockey salmon smolt length (cm) and weight (g) relationship over time for the 1986 emigrant season . . . . . . . . . . . . . . . . . . . . 79
Annual Summit Lake smolt length and standard deviation (+I) for emigrant sockeye salmon samples collected +fourdaysof19June. . . . . . . . . . . . . . . . 80
75
26. Total recovery of coded wire tags from the Copper River Commercial fishery (1984-1988). Raw tag data was adjusted to reflect nearest open fishing period (No weighting for sample size or number of tags applied) . . . . . . . . . . . . . . . . . . . . . . . . 91
27. Copper River commercial fishery coded wire tag recovery data adjusted by expanding the percent. of catch which was sampled (e.g. one tag recovered by a 33% sampling effort equals 3 tags expanded) for 1984-1988. Tag recoveries were extrapolated for a 10 day period in 1985 where no commercial fishery occurred . . . . . . . . . . . . . . . . . . .
28. Adjusted coded wire tag recoveries, smoothed by a moving average having an equal weight of five (1984-1988) . . . . . . . . . . . . . . . . . . . . . . 93
29. Estimated modal date, range (80%), and presence (100%) of upper Copper River stock (70 stocks) migration catch data for the commercial, personal use, subsistence, and sport fishery zones, compared to the enhanced Gulkana Hatchery stock . . . . 94
30. Predicted weekly catch increments of sockeye salmon by commercial fishermen, partitioned by natural and enhanced stock timing information, for 1989. Commercial catch data based on cumulative percentage catch by day for 1969 to 1988. Hatchery data based on five years (1984-88) coded wire tag recovery percentages, smoothed by a moving average of five, having equal weight .
31. Predicted 1989 weekly percent return timing of sockeye salmon in the commercial fishery for all natural stocks, compared to the Gulkana Hatchery enhanced stock (Appendix G ) . . . . . . . . . . . . . . 98
VIII
LIST OF APPENDICIES
Appendix Page
. . .Current egg take procedures at the Gulkana Hatchery 1
Polypropylene Intalox plastic saddle diagram and specifications. One cubic meter of saddles delivered by the manufacturer occupies approximately 1.28 m3 of space in the incubator unit . . . . . . . . . . . . . . 4
Conversion of female sockeye salmon carcass lengths (from mid-eye-hypural plate to tip of snout-fork of tail) in order to estimate total eggs deposited at the natural study site . . . . . . . . . . . . . . . . . . 5
Mean lengths, weights, and condition of development for the samples of incubator fry obtained at 25%, 50% and75%emergence . . . . . . . . . . . . . . . . . . . . 6
Upper Gulkana River sockeye salmon age composition 1969 - 1975 . . . . . . . . . . . . . . . . . . . . . . . 7
Actual and expanded (by sampling percentage) commercial fishery coded wire tag recoveries for 1984 through 1988. All tag data was adjusted to reflect nearest open fishing period. The smoothed (moving average of equal weight, function order of five) five year daily percentages of commercial tag recoveries are shown at the far right . 8
Expected weekly catch and upriver escapement, CopperRiver, 1989. . . . . . . . . . . . . . . . . . . 12
ABSTRACT
Evolution of the Gulkana Hatchery from a small research facility to the largest sockeye salmon incubation facility in the world is described. Facility expansion was consistent with brood stock returns. Areas of research which were explored include incubator design, incubator egg capacity, alevin substrate material, iodophor treatment of equipment and eggs, and fungal control treatments. Infectious hematopoietic necrosis virus (IHNV) is the single most important factor which determined incubator design and aquacultural techniques. Evaluation of the contributribution which the Gulkana Hatchery enhancement program provides to the commercial, subsistence, personal use, sport and other harvest groups is based partially on nine years of coded wire tag recovery in both the commercial fishery and on the spawning grounds. Enhanced adult returns should continue to surpass 200,000 as long as fry releases remain above 20 million. The annual value to the commercial fishery is approximately 2.0 million dollars (at $2/lb.), making the cost to benefit ratio for the Gulkana facility better than 1 : 5 .
INTRODUCTION
The purpose of this report is to record the evolution of the Gulkana Hatchery from its inception, to present status as the largest modern sockeye salmon incubation facility in the world. The procedures, techniques, and experiments as well as operations data collection which have made this possible are documented. Emphasis will be placed on research and operations which occured from 1981 through 1992.
Enhancement Rational
The Copper River supports extensive commercial, recreational, and subsistence fisheries for sockeye salmon (Oncorhynchus nerka) . While most use occurs in the lower portions of the river, most sockeye salmon spawning and rearing areas are located within the Copper River Basin. The upper east fork of the Gulkana River between Paxson and Summit Lakes is one of several areas which contribute significantly to total sockeye production in the Copper River. This area has a floodplain approximately 150m wide, across which the river has meandered since prior to recorded history, providing a high quality spawning bed for sockeye salmon. A ten kilometer section of river near the present Gulkana Hatchery was first narrowed by the construction of a wagon trail in the early 1900's. Improvement of the wagon trail for automobile transportation occured during 1918 and narrowed the flood plain further. This road is named the Richardson Highway for Captain Richardson who first surveyed the route in 1904 and 1905. In 1964 severe flooding between Summit and Paxson Lakes washed away major sections of the Richardson Highway. Reconstruction of a federal specification highway between Paxson Lodge and Summit Lake resulted in a much narrower and straighter flood plain. Spawning habitat was lost not only due to highway reconstruction but also due to water hydraulics of the flood, scouring of the stream bed, elimination of spawning gravel, and destruction of valuable velocity reducing stream meanders. Between 1962 and 1972, the spawning population in the affected area declined from about 60,000 to 25,000 (Roberson, unpublished data), with habitat erosion the primary cause of the decline. Fisheries managers during this same time period were unable to accurately access spawning ground escapements until "after the factu, nor quantitatively estimate the effect of new gear or methods (i.e. increased efficiency) on status quo harvest schedules. The combination of reduced spawning area, unknown escapements, and increased fisherman efficiency, led to several overharvests in the early 1970's. Poor environmental conditions following the overharvests compounded the problem by producing "return per spawneru figures half the average (Roberson, unpublished data).
Increased user group demand by commercial, personal use, subsistence, and sport fishermen coupled with a short term decline in natural production resulted in conflicts over available
resources. Since the early 1970's the commercial catches declined with low escapements precipitating partial season closures of sockeye fisheries in 1978 and 1979. In 1980, the sockeye fishery remained closed to commercial gill net fishermen, but all other user groups were allowed limited fishing. A logical partial solution to the problem of declining resources and increassed demand was an enhancement program designed to increase natural stocks, thereby increasing fish available to all user groups.
Discovery of several warm water springs on the upper east fork of the Gulkana River by Ken Roberson in 1971 sparked the idea that this was a promising site for a hatchery. After a year of baseline water quality and quantity monitoring (1971 to 1972), the exceptional water quality and temperature parameters of the Gulkana Springs were documented. The high quality water source is a result of the approximately one kilometer of remnant glacial moraine from the nearby Gulkana Glacier which filters Summit Lake water as hydraulic head forces the water through porous zones in the moraine. Temperature records indicate that 3.9 C (maximum density) waters are flowing through the moraine. Annual flow varies less than ten percent and mean temperature range is 2.5 to 5.0 C, influenced primarily by wind and air temperature (Figure 1) . Water temperature measurements conducted during the winter of 1972 and 1973, when the air temperature was minus 51 C were in the above mentioned range even with 15-25km wind prevailing. Later measurement of other spring water qualities confirmed the suitability of this water source for fish enhancement (Table 1).
Budget constraints dictated that a low cost, relatively maintenance-free system was the only possible way of initiating the project. After examining some of the more traditional techniques, the staff suggested the fairly unique concept of streamside incubation units, first published by Bams in 1967 and 1970. This concept is based on providing an optimal incubation environment, while simulating the redd. Studies comparing fry raised in gravel subtrate stream-side incubators versus wild fry support the concept that gravel substrate rearing increases the percent survival from egg to fry with little loss (if any) of fry quality (Bams 1970, 1972, 1974; Bailey and Heard 1973; Bailey and Taylor 1974; Blackett 1974; Bailey et al. 1976; Poon 1977) . The stream-side incubation concept was imported to Prince William Sound, Alaska, by Mr. J. David Solf, Commercial Fishery Biologist for the Alaska Department of Fish and Game (ADF&G), after visiting a Canadian incubation facility which utilized units constructed by Mr. George Wilson, an International North Pacific Fisheries Commission (INPFC) engineer. Mr. Solf built and installed several incubation units near Cordova and successfully incubated pink salmon eggs to fry with excellent survival ratios. After staff communication with Dr. Bill McNeil and Mr. Jack Bailey of the Auke Bay National Marine Fisheries Service (NMFS) Laboratory and Mr. Robert S. Roys, Director, FRED Division, ADF&G, it was agreed that the upper Gulkana River spring area was an excellent candidate for an enhancement project using stream-side incubation units.
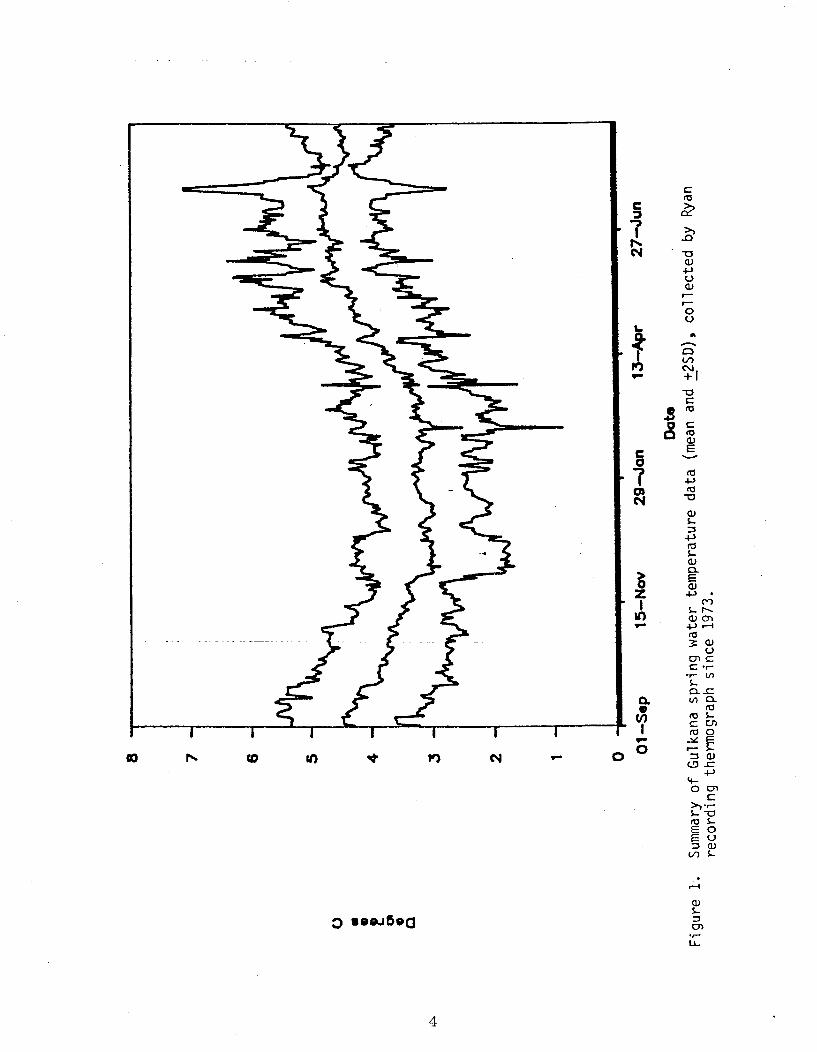
Table 1. Water quality measurements of t h e Gulkana Hatchery spring.
Alkalinity 86 PPm
Dissolved Oxygen 8 - 12 ppm
Total Hardness - . .~ -. . ...
Conductivity 112 micro ohna/cn
Flow 11.9 cfa

A Project Proposal was written which documented the Copper River sockeye salmon decline and outlined the following initial goals for a streamside incubation program at the Gulkana River spring area.
1) Enhance present sockeye salmon stocks in the Copper River, with particular emphasis placed on upper east fork Gulkana River stocks.
2) Evaluate incubation units as an enhancement technique using upper east fork Gulkana River spring water (Gulkana Springs) and stocks indigenous to the springs.
3) Establish sockeye salmon brood stock at the Gulkana Springs for eventual use in a production hatchery facility.
After consulting with ADF&G staff engineers, Mr. Gil Ziemer and Mr. George Cunningham, the first Gulkana incubation unit was constructed and installed in the fall of 1973. This pilot unit was loaded with approximately 225,000 green eggs obtained from spawning salmon in adjacent spring areas. The first year estimated green egg to fry survival of 79% demonstrated the efficacy of the technique. In 1974, an additional four units of identical design were installed in a nearby spring spawning area which is the site of the present facility. In 1975, because of poor water flows, the original unit was moved to the site of the newer units. Water flows at the new site are not a limiting factor, as there is a signficant volume of stable flow year-round. Additional incubation units were added intermittently until a maximum of 71 units were available for egg incubation in 1988. Total hatchery egg capacity for 71 units is 35.5 million eggs. Since 1988, experimentation with "toteM incubators has resulted in replacement of 11 of the 71 wooden incubators. Along with this progression in egg and fry numbers came the neccessity to streamline operations, which resulted in a gradual shift in emphasis from research to production.
Geoqra~hic Location
The Gulkana Hatchery is located on the west bank of the Gulkana River in the north-central portion of the Copper River Basin (Figure 21, adjacent to the largest spring aquifer of the Gulkana Springs area. The site has a vertical elevation of 921m and a horizontal distance from the sea of 416km. The facility is 4.8km north of Paxson, at milepost 188 of the Richardson Highway, 3km downstream from Summit Lake and lies at the following coordinate: 630 04' north latitude and 1450 30' longitude.
Proiect Evolution
Documentation of facility development was first reported in the form of Completion Report prepared by the Alaska Department of Fish and Game staff for the National Oceanic and Atmospheric Administration in agreement for receiving Federal Aid matching funds. The four year feasibility phase (July 1, 1974 to June 30,

Fiqure 2. Lacation o f t h e Gulkana Hatchery in re la t ion to lakes and m a j o r geoqraonic f e z t u r e c i n t h e Coooer R i v e r w a t e l - shed.
1977) of the Gulkana Hatchery was reported by Roberson et a1 in 1978. Five production incubators were used throughout this time period. Even though egg to fry survivals during this period were higher than natural survivals reported in the literature, the steady decline in egg to fry survivals observed over this time period were cause for concern (79.4% to 48.8%). Expansion of the facility depended upon a cost effective program which would be able to consistently produce egg to fry survivals of a.t least 70%. ~rastic changes in egg take techniques and the implementation of a prophylactic treatment program were implemented after the lowest egg to fry survival in the history of the program (42.9%) occurred during the spring of 1978. These changes were successful in producing an egg to fry survival of 78.8% for the 1978 brood year.
Following the successful increase in survival of the 1978 brood, the Gulkana Hatchery expanded to ten units during the fall of 1979. After another successful season from 1979 - 1980 the hatchery expanded in the fall of 1980 to a total of 20 units. A cursory summary of the results of research for July 1, 1977 to June 30, 1981 was included in the 1982 Completion Report by Roberson et al. A shift in emphasis from research to production occured with a shift in funding from Federal Aid/Division of Commercial Fisheries to Fisheries Rehabilitation, Enhancement, and Development (FRED) Division during the Fiscal Year (FY) 1981. Even though research continued to be an integral part of the program, the primary responsibility and goal of the hatchery program evolved into producing large numbers of high quality fry with a minimum level of funding. The first published FRED report came out in 1983 and covered the time period from July 1, 1980 to June 30, 1981 (Roberson and Holder, 1983). This report is an attempt to update and compile the available data which has been collected at the Gulkana Hatchery from its inception to 1993.
PROJECT ACTIVITIES
The project began in the summer of 1972 with the selection and initial monitoring of Gulkana Springs as a possible water source for a hatchery. Enhancement activity began in the fall of 1973 with the installation and loading of a pilot stream-side incubation unit. The following sections will review and document the evolution of the Gulkana Hatchery from a small research research facility to the largest sockeye incubation facility in the world.
Production
In order to place present egg production into perspective the developmental process which Gulkana Hatchery has undergone will be reviewed.
Background:
From 1973 until 1977 egg take procedures followed the published procedures of the day. Milt of a recently killed male was expressed into the bottom of a bucket into which ova from two or three recently killed females were released by abdominal pressure. Milt from a male was expressed onto the ova and the contents gently mixed by hand. Ova from two or three more females were added, milt from one male, and the lot mixed again. The process was repeated until the bucket was about one-half full, when the "washingu and "hardening" began. Eggs were allowed to water harden at least one hour before transport to the incubators (less than one half kilometer). Before the eggs were seeded into each incubator, egg numbers were estimated by proportion, counting subsamples of known volume and measuring the total volume of eggs per bucket. Eggs were then loaded directly into incubators.
The steady and regular decline of egg to fry survivals from 1973 to 1977 (79.4% - 48.8%) were cause for concern and the basic reason new culture procedures were investigated. Lack of prophylactic fungal treatment was identified as a possible contributor to lower survivals. Treatment of the eggs with Malachite Green was implemented beginning in September of 1977. Unfortunately this was not the sole solution to declining egg to fry survivals. In the spring of 1978 the lowest egg to fry survival since project inception occurred (42.9%). Use of Malachite Green has been discontinued due to regulatory contraints. Dead eggs, unbuttoned fry, and incubator debris samples were sent to the Department of Fish and Game pathology laboratory for analysis. Yolk coagulation in the dead eggs was noted as an indication of rough handling. It was also suggested by a Fish and Game technician that egg take methods be used which stressed the importance of care which the brood stock received directly effected survival of the progeny. In the fall of 1978 egg take procedures which closely followed those published by McNeil and Bailey (1975) were implemented. The egg to fry survival from this careful egg take was a successful 78.8%. Egg take procedures have continued to follow the same basic guidelines with changes due to pathology staff recommendations, time - motion considerations, and comfort. Even though these new procedures are more labor intensive and expensive, the results in terms of adult fish returns far outweigh the costs.
Materials and Methods:
The fish culture materials and methods used at the Gulkana Hatchery are based on providing eggs and/or alevins with an optimum environment for development and survival while in the hatchery. Gulkana incubators are based on the Canadian Bams box with improvements based on our experience. The foundation of Gulkanals current egg take methods, which were instituted beginning in 1978, are based on the egg take methods published by McNeil and Bailey (1975). Egg take procedures have evolved on an annual basis due to continuing research and policy changes.
The basic principle on which the incubators work is that water entering the bottom of the incubator wells up through substrate and
eggs, providing oxygen, removing waste products, and providing protection. At swim-up, the fish volitionally leave the incubator for the instream phase of their life cycle.
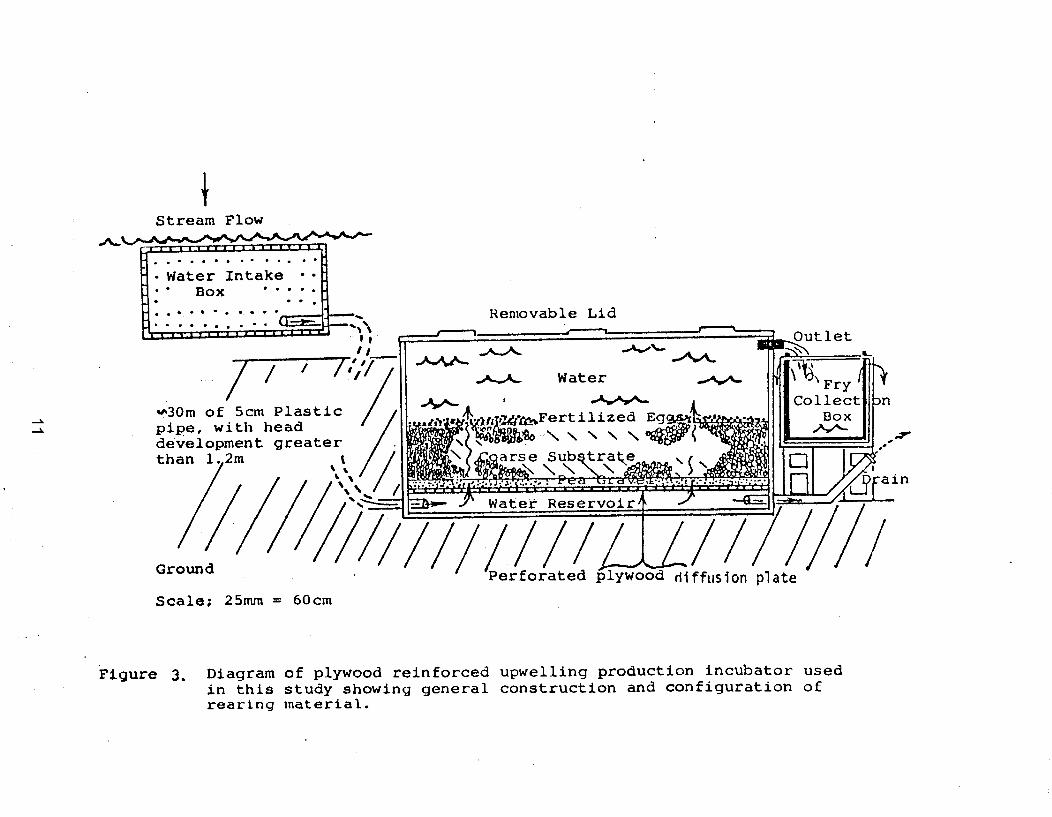
Two types of stream-side incubator design were used in the early development of Gulkana Hatchery: production and experimental. Production (Figure 3) and experimental incubation units were of similar design but differed in size. Production incubators measured 1.2x2.4x1.2mt and were constructed of 19mm AC plywood. Experimental incubators measured 0.56x0.60x0.83m and were also constructed of 19mm AC plywood. Due to the smaller thermal mass of the experimental units, they were housed in a protective building, while the production incubators were partially buried beside the spring water source. Water was supplied from perforated plywood headboxes buried in the spring gravel sufficiently far upstream to achieve at least 1.2m of true head. The headboxes were connected to each production unit via a 5.lcm diameter polyethylene pipe, and each experimental unit via a 3.2cm diameter polyethylene pipe. Upwelling flow in the production units averaged 75+/-15 Lpm while the flow in the experimental units averaged 45+/-10 Lpm. Each incubator had a perforated plywood diffusion plate located 14cm above the bottom in the production units and 8.9cm in the experimental units. Each incubator had a 7.6cm layer of pea gravel (approximately 1.3cm in size) over the false plate, to prevent downward migration of alevins through the plate, function as a filter, and aid in water diffusion. Alevins were able to migrate below the diffusion plate and fine gravel often plugged the holes, thus beginning in 1986 nylon screen was used on top of the diffusion plate. On top of the pea gravel was approximately 30.5 of coarse substrate upon which eggs were loaded and into which the alevins moved. Beginning in 1988, the cleaning and reloading of substrate was simplified by using a 30.5cm mixture of coarse and fine material. A lid of 19mm AC plywood fit on top of each incubator. After the eggs were loaded into each incubator, the lid was put in place and not removed until fry emergence was completed.
In recent years, several significant modifications have occured which are operationally more efficient; however, they do not alter the basic principle of streamside incubation. The intake system has been modified to consolidate over 70 separate intake lines into two 12" perforated PVC lines covered with coarse gravel. A distribution building with aluminum equalizing/settling tanks provides stable flow to all incubation units. In addition, incubators which were partially buried in the past are now aligned in parallel rows on a concrete pad to allow vehicle access to each unit. Development of a "tote" incubator prototype which is essentially half the size of a Bams incubator, allows better control of disease losses plus easier disinfection and longer lifespan of incubators (Figure xx). Use of nylon screen has been discontinued with smaller holes in diffusion plates being used to prevent fry from getting under the plates. l iff us ion plates previously made of plywood are being replaced with polyethylene sheet. Use of fine gravel has also been discontinued. Replacement and modification of units is being conducted as the
Stream Flow
. . . . . a . . - . . .# Water Intake
..... . . . . . . Removable Lid
*30rn o f 5 c m P l a s t i c Fertilized pipe, w i t h head
\ \ \ \ \rnent greater
Scale: 25mm = 60cm
Figure 3, Diagram of plywood re in forced upwel l ing production incubator used i n this s tudy showing genera l cons t ruc t ion and conf igura t ion o f rear ing material.
wooden Bams units deteriorate.
Prior to loading green eggs each fall, each unit is disinfected twice by treating with 100 ppm of Chlorox for 24 hours. The chlorine solution is allowed to neutralize within the incubator for 48 hours then flushed with spring water. After chemical disinfection, physical cleaning of each unit involved shoveling substrate from the unit and rotating substrate through a cement mixer with a water flush. The gravel was rotated until the waste water was clean and free of dead eggs, fungus and detritus. Emptyincubators were scrubbed down with brushes and 100 ppm Chlorox and any needed repairs were performed at this time. Following disinfection, cleaning, and repair, diffusion plate and nylon screen were reinstalled, and the incubators loaded with clean substrate.
Egg take locations have been determined by aquifer springs where sockeye salmon return in large numbers to spawn. The hatchery is located on the largest of these aquifers (Figure 4 ) . Downstream from the hatchery is a large pool (named the Egg Box Pool) which is the main egg take location (Figure 5). A 3.7x3.7m spawning shed was used from 1981 to 1986. Prior to the 1987 egg take season a new egg take building was constructed, measuring 3.7x7.4m. The stream channel portion of Egg Box Pool is named the Egg Box Spring (Figure 5). Fish collected for eggs from the Egg Box Spring are carried via a stretcher from where they are killed, to the Egg Box Pool spawning shed. Two llremoten aquifer spring locations have been utilized as sources of eggs for the hatchery. The aquifers are located approximately 400m north and 400m south of the hatchery and are labeled the Upper and Lower Springs, respectively. Each remote egg take site had a frame canvas shelter approximately mid- way along its length to which fish were transported for spawning. Currently, fish are all transported to the primary egg take building using highway vehicles on primative roads adjacent to the spring areas. In addition, fish returning to Gunn Creek, Summit Lake from hatchery production are weired off and seined up when brood stock is limited at the hatchery site. Fish are collected using short handled salmon dip nets. Several weirs are erected each season at the egg take site to help segregate fish into workable units and to minimize walking distances.
During egg-take season, the Egg Box Pool contains three weirs and a green female holding pen. The upper weir prevents fish from entering the incubator water supply while the lower weir traps the fish within the Egg Box Pool. Fish are crowded through a middle weir into the upper half of the pool where they are dip-netted. Females are usually dip-netted one at a time to avoid injuries to the eggs by other fish flopping and beating into each other in the net. Appendix A provides a narrative evolution of the current egg take methods at the Gulkana Hatchery while Figure 6 is an outline diagram of the process.
Af ter eggs are loaded and before the fry begin to emerge, incubator outlets are monitored monthly for flow, dissolved oxygen, and ph.
Gul kana Hatchery i n r e l a t i o n t o the Richardson Highway , Gul kana River, and upper and lower egg coll e c t i on locat ions , iden t i f ied by commonly used names. 13

Weir )&&!bY$?
Weir
Water Flow
Wal kway f
Storage 81 dg
I
Egg Tak 81dg
-
8:[i0-4
6
1. Betadine t a n k f o r d i s i n f e c t i n g personal gear .
2. Pool a rea where f i s h a r e d ipne t ted . 3a. Male s o r t i n g tank. 3$. Female s o r t i n g t ank . 4a. Male rack. 46. Female bleeding rack. 5. Spawning t a b l e . 6. Carcass d i s ~ o s a l a r e a .
Egg r ins ing ' t a b l e . Water t ab l e . Water hardened eggs t o incuba tors .
Gul kana Hatchery.
These papameters vary little during the winter incubation period (Table 2). Beginning in 1977 each unit was treated monthly with Malachite Green prophylactic treatment until approximately one month before hatching, unless noted otherwise in the Research section of this report. Use of Malachite Green has been discontinued due for regulatory reasons. Temperature accumulations per day were recorded as degree-days (one degree-day would be recorded if the mean temperature for a 24h period was one degree centigrade). Degree-days for the incubators were recorded by Ryan continuous recording thermographs.
Evaluation of egg take techniques and incubation variables required collection of emerging fry until they could be counted so that egg to fry survivals could be calculated. Emergent fry swam from the incubator through an outlet pipe and into aluminum collection boxes. Collection boxes were made of perforated sheet aluminum measuring 5lx51x84cm. The boxes were assembled with 900 aluminum angle and rivets, and the box corners sealed with silicone caulking.
Prior to 1985 fry were enumerated using three separate methods depending on the number of fry to be counted. When 500 or less fry were involved, fish were counted individually using a "tally whacker" and a small net. When numbers of fish ranged between 500 and 12,000, fry were counted volumetrically. The number of fry which displaced 60ml of water in a lOOml graduate was used as a sample. Estimation of the total number of fry was obtained by multiplying the number of fry in the sample by the total volume of fry (ml) per collection box. A proportional weight method was used for estimating fry numbers when the number of fry in a single collection box was greater than 12,000. The weight of approximately 0.5L of water was determined by using an Ohaus triple-beam balance scale. Emergent fry, drained of exess water, were added to the water on the scale and the total weight noted. A subsample count of approximately lOOg of fry was hand counted to estimate the number of fry per gram. Total fry per collection box was estimated by multiplying the number of fry per gram by the total weight of fry.
The process of fry enumeration required a large investment in manpower. With ever increasing fry numbers, a less labor intensive estimator was needed. In the spring of 1984 a Northwest Marine Technology (NWMT) fry counter was obtained. The counting head was submerged in a flowing water trough and fry passing through one of the sixteen holes were counted electronically. During the first season of use (1984) the electronic counter was used primarily to count sample numbers of fry. In 1985, a second NWMT fry counter was obtained. Using two counters, all fry were processed through counting heads, but not without problems. The trough (119~13~9cm+15crnscreen) in which the counting head was mounted caused an undercount when large numbers of fry were involved due to screens becoming plugged and causing either the trough to overflow or two fry to pass through the same counting hole. After the 1985 season we concluded that the documented 71.0% survival was

Table 2 . Water quality p a r a n e t e r e for i n c u b a t o r effluent.
Production Experimental .................... .................... Parameter Nean end Range Mean and Range_____-------------------------------------------------------------
Flow 75 (60 - 90) Lpm 45 (35 - 55) Lpn
Dfsaalved Oxygen 1 0 (9 .5 - 10 .5 ) ppm 10 (9 .5 - 10.5) ppn
approximately 10% low due to the above problems. In 1986 a plastic tote (102x71x61cm) was installed as an intermediate holding area before the fry passed through to a plastic box (6lx41x36cm) into which the counter head was mounted. Large numbers of fry were dispersed and slowed down in the large tote so that when the fry reached the counter head they tended to pass through individually. During 1987, after duplicating counts of large numbers of fry at fast and slow processing speeds, it was evident fry numbers in excess of 1000/min were low by about 4%. Fry counts for 1987 were adjusted accordingly. Continuing to use the intermediate fish tote, a redesigned trough (244x23x25cm) with baffles was fabricated and found to count fry accurately up to 4000/min. Additional counters, providing three counting units operating at the same time have increased accurate counting capacity further.
After enumeration, fry were either released on-site or transported to a rearing area. Fry released on-site were released into the spring below the furthest downstream incubation units. From 1974 to 1979 approximately 100,000 fry per year were released into Ten Mile Lake on the Denali Highway (no indigenous sockeye salmon) to evaluate whether the incubation program was producing adult fish. Fry were loaded into 19L buckets and transported by truck l9.3km to the release site. Beginning in 1980 fry were transported to a northern tributary of Summit Lake, Gunn Creek, based on estimation that the fry rearing capacity of Paxson Lake (15 million) had been reached. Since Paxson Lake receives natural fry production of approximately 6 million fry annually, the enhanced on-site release was capped at 10 million fry each year. Fry to be transported from the incubation site were transferred from their holding boxes to a transport tank in 19L buckets. The transport tank (6lx76x61cm) was set in the bed of a pickup and half filled with water before fry were added. Oxygen was added at a rate of 10L per minute. The stepwise increments of fry introduction into Summit Lake were based on the recommendations of the F.R.E.D. Limnology Lab in Soldotna. Beginning in 1985 fry were also transported to Crosswind Lake via f ixed-wing aircraft in oxygenated 45 liter rrcarboyslr. This program was temporarily discontinued in 1986 and 1987 due to high cost and loss of over 3.0 million fry to IHNV. A 2.5 million fry transport to Crosswind Lake during 1988 was accomplished in one day using a modified agricultural "crop dusteru airplane (Cessna C-188 Ag- Truck) with a 250 gallon oxygen supported tank. Since 1991, a larger aircraft ("Thrush") with a 500 gallon oxygen supported tank has been used to transport up to 1.0 million fry per trip. Through use of short term, radio controlled road closures, the aircraft operate off of the highway adjacent to the hatchery site.
Results :
Success of an enhancement program can be evaluated by both short and long term measurements. Short term evaluation for any hatchery is generally delineated from the time eggs are introduced until fish are released. For Gulkana Hatchery this time span is approximately eight months, eggs to emergent fry. The four basic factors against which short term success is measured are; 1) number
of eggs seeded in the fall compared to a goal set prior to egg take, 2 ) egg to fry survival the following spring, 3 ) quality of the emergent fry in terms of length, weight, and condition of development as compared to natural fry, and 4) number of fry lost to IHNV. The single most important measurement of the biological success or failure of any enhancement program is the long term survival of the enhanced fish i .e. how many adult fish did the program produce and were they available for harvest by the user groups? Economic success is readily determined from the value of fish produced as compared to the cost of producing them.
The annual egg take goal for the Gulkana Hatchery has depended on a combination of two factors, hatchery egg capacity and broodstock availability. Hatchery egg capacity was determined by both incubator number and egg density per incubator. Addition of incubators depended primarily upon available funding. Optimal incubator egg capacity was determined by research conducted primarily during the years 1979 to 1981, these studies are reviewed in the Research section of this paper.
Even though the methods for enumeration of eggs and fry have improved through the year, the numbers representing the egg to fry survival are comparible over time. Successful survival from egg to fry has been defined as at least 70 percent. Egg take methods used prior to 1978 have been assumed to be the cause for the declining egg to fry survivals from 1973 to 1978. Improvements in egg take methods provided egg to fry survivals equal to or in excess of 70% for all years between 1979 and 1992, except for 1988 when the fry survival was 63% due to a equipment failure. Table 3 summarizes the two short term measurements of egg take goals and egg to fry survival.
Study of enhanced fry quality as compared to natural fry has been conducted and is covered in the Research section of this report. The basic findings were that enhanced fry quality is slightly less than natural fry in terms of length, weight, and condition of development. Median emergence timing was longer for enhanced fry than natural fry, but enhanced fry survived from egg to fry at least four times that of natural fry.
Despite continued improvements in egg take techniques, the first documented case of IHNV occured in 1983. The number of fry lost to IHNV annually increased, until 1987 when the trend was reversed. It appears that with current culture methods and compartmentalization, sockeye salmon can be propogated at a significant production level with less than 10% loss to IHNV (Table 4). The production release of healthy fry has exceeded 74% in spite of losses from 2.5% to 9.6% to IHNV.
Estimation of the numbers of adult sockeye salmon that have been contributed to the commercial, sport, personal use and subsistence fisheries of the Copper River system are reviewed in the Evaluation portion of this report.
------------------------------------------------------------------------
Table2ISunmry of available incubstore, number used, egg take goala, actuai egg8 taken, fry produced, aod egg t o f r y r u r v i v a l .
Avai l - Incuba- Egg able tors Take Eggs Percent fry
Incuba- w i t h Coal Seeded of Produced Percent Year tore egga ( ~ i l ~ i o n a ) ( l ! l l l i o n e )Goal (millions) Survival
1973-74 1 1 0.25 0.23 92.0 0.18 79.4
1 A 10% corz-ection factor usa u d due to undercounting by electronic fry counter.
2/ A 4% correction factor vas used uhen fry numbera exceeded 400,000 per day.
31 Low survival uas due t o approximate 10% lose of fry to low flow, estiaated 1% losa of egga counted through electronic egg counter, and 5% loso of fry to IHNV.

Table -4. Infectious hematopofetic necrosis virus (IHNV) history .at Gulkana Hatchery.
1/ Based on an estimated e u k i v a l of 80% from egg to f ry .
Discussion:
The concept of simulating the natural redd by providing the egg and alevin with an optimal developmental environment requires protecting the fish from outside predators and/or unfavorable environmental conditions. This is done at the Gulkana Hatchery with large deep matrix Bams type incubators without the aid of a large hatchery building. The size of the incubator is large enough to retain the thermal heat of the water mass which keeps the eggs from freezing. This approach also compartmentalizes the young fish into incubators which only threatens approximately 1.5% of the hatchery production in the event of a disease outbreak. The incubators are cost effective to build (standard plywood sheeting) and maintain. Selection and use of wood incubators is not without problems. The drawbacks of wooden incubators include inability to completely disinfect units, relatively short life span (8-10 years), labor costs for construction, and leaking. Recent use of a nail gun for assembly of plywood incubators has decreased both construction costs and leaks. Silicone sealant is also used during contruction to minimize leakage. The uneven gravel surface upon which the incubators sat contributed to leakage and difficulty in replacement. A small concrete pad was poured during the fall of 1987 which 13 incubators were placed to decrease leakage while greatly facilitating replacement. In 1990, a 36x150 ft. concrete pad for the entire set of incubators was poured with sufficient space and strength for heavy vehicles to access each incubator which significantly improved ease of operations.
Research has been conducted into other incubator materials which would be disinfectable and have a longer life span (i.e. aluminum, laminated fiberglass, and polyethylene totes). Aluminum and laminated fiberglass incubators are too expensive to be seriously considered. The conductivity of aluminum would require these incubators to be insulated from cold weather. During the 1987-88 field season polyethylene totes were tested with a shallow matrix design. After a second season (1988-89) improvements to the false plate design and installing leak free inlet and outlet connections, polyethylene totes became the most likely canidate for replacement of wooden incubators. Several additional modifications have occured to the l1tote" prototype and will probably continue to occur in the future (Figure x) . Entire facility replacement in a single season is impractial due to cost factors; however, gradual replacement over a five to ten year period is being undertaken.
One of the most important resources for a fish hatchery is the water supply. Prior to 1988 a system of perforated plywood boxes buried in the spring supplied water to the incubators. Water flow to the incubators was regularly reduced by air entrainment, sedimentation, growth of algae and stream debris. Treatment of the units with chemicals involved entering the intake water supply thus exposing the entire hatchery supply to possible contamination. Single 5cm water supply lines connected plywood intake boxes to an incubator. Water lines were buried for approximately 30m of their total length, which meant inaccessability and egg loss if water
flow was interrupted for a period of time. Addition of incubators involved buring 30m of water supply line for each incubator. During the fall of 1988, the maze of 5cm intake lines with two 3O.Scm (12in) PVC plastic perforated water supply lines from the spring to a vertical distribution culvert located just upstream from the incubators. Two 30.5cm (12in) pipes supply water from the culvert to two distribution headboxes from which individual 5cm supply lines connect each incubator to the water .supply. The distribution system is housed in a small insulated building and has eliminated the individual incubator flow problems while allowing for easy expansion.
In addition to providing a container with a water supply for the developing fish, a substrate must be provided in order for the fish to satisfy its innate righting response which alevins strive to satisfy until neutral bouyancy is achieved (Bams 1969). Approximately one cubic yard of gravel substrate is currently shoveled from each incubator, thus researching a cost effective means of incubator gravel removal is a major focus. A rotating fork lift which could turn over plastic tote incubators to empty the substrate appears promising. An alternative method is development of a hydraulic suction system to remove the substrate and a trailer mounted rotating drum to clean the substrate and return it to cleaned and disinfected incubators.
Demonstrated during the egg takes of 1975 to 1977, rough handling of the broodstock and eggs caused low egg to fry survival percentages. Gentle handling of broodstock and eggs has increased the egg to fry survival percentages above the desired minumum of 70 percent. Part of the increased care the eggs received was due to use of "base camp" spawning areas. A mobile spawning approach (spawn takers following the capture crew) was used for many years, but the procedure became smoother, faster, with less dead eggs, when a stationary egg take location was employed (the capture crew brought fish to be spawned to a "base campll). The "base camp" at the Egg Box Pool evolved from a small table with a sunscreen (1978 to l98O), to a 3.6 x 3.6 m spawning shed (1981 to l986), to the present 3.6 x 7.3 m building (since 1987) . Base camps at each remote spring evolved from a table and sunscreen (1978 to 1981) , to temporary 2.4 x 3.6m canvas shelters which can be erected if needed. Since the development of primative vehicle trails, all broodstock fish are transported to the "base campu spawning location.
Broodstock females checked for ripeness at the Egg Box Pcol are either killed because they are ripe or put into a holding pen when they are not ripe (green) . When held in pens at Gulkana few of the green females are ripe the next day; however, if green females are released after each days egg take and recaptured the next day, most are ripe enough to be spawned.
Egg take procedures at Gulkana Hatchery have changed considerably and will continue to change as new information and improved techniques become available or are recommended. Improved egg take

procedures are intended to increase the egg to fry survival percentage and decrease the possibility of an IHNV outbreak. In 1987, instead of using two females eggs per container, the procedure was changed to using a single females eggs per container, to minimize the potential cross-contamination of IHNV between individual females eggs. A second change which occurred during the 1987 egg take was treating the eggs with iodophor for one hour during water hardening instead of a 15 minute treatment. This did two things; 1) longer iodophor treatment should decrease total virus particles entering an incubator and 2) eggs were not disturbed while water hardening and still vulnerable to shock.
One of the basic issues which impacts operational procedures is that eggs loaded into stream-side incubators cannot be processed in any way during incubation, thus eggs going into the incubators need to be clean and free of any organic matter which fungus or bacteria might situate on. Prior to 1986, the egg rinsing procedure consisted of running enough water into a freezette containing eggs to wash out milt and debris. This was definitely a Ifweak linkf1 in the egg take process due to: 1) number of eggs washed over the rim and lost, 2) being the slowest part of the egg take process, and 3 ) rinsed eggs were not as clean as desired. Tupperware colanders were the first attempt to improve the speed and efficiency of the rinsing process. Rinsing the eggs using colanders was a vast improvement in terms of labor saved and cleanliness of the eggs. A problem with Tupperware colanders used during 1986 was that the drain holes were square and small enough to be plugged by eggs. In 1987, new 4.7 liter (5 quart) colanders with rectanqular slots were acquired. The rectangular slots did not plus with eggs thus water and debris drained more rapidly, and was large enough so that eggs did not wash over the rim during rinsing. In 1987, the rinse process was no longer an efficiency block and egg cleanliness was at the desired level.
Disinfection is for the control of disease organisms. The disease organism of concern at Gulkana Hatchery is IHNV. Two different methods for disinfecting fish prior to spawning. The first method tried was dipping fish into an iodophor bath. The bath method was discontinued after one year because it was felt that the accumulation of slime and blood within the bath made the treatment ineffective. The second method, still in use, is to brush each fish with iodophor prior to spawning. Egg disinfection techniques have changed with the theories of how IHNV is transmitted to the hatchery incubators. Even though the eggs were disinfected with a 10 or 15 minute soak in iodophor, outbreaks still occured. The possibility that the virus was harbored inside the egg and was not harmed by tlexteriorlf treatments is the most recent theory in virus control. Extending the iodophor treatment to one full hour increases the possibility of not only killing exterior virus particles but also allows iodophor to enter the egg while water hardening and possibly kill virus particles within the egg as well.
During extreme cold weather eggs have frozen to the sides of freezettes and buckets, and during warm weather, buckets containing

eggs were noticeably warmer when only a portion of the bucket was immersed in spring water. Due to the wide range of air temperatures occurring during the egg take two methods are used to avoid temperature shock to the eggs. Freezettes containing the fertilized eggs are placed on a water bath table during and after water hardening then before being seeded into the incubators eggs are poured into 19L buckets which are submerged in fry holding boxes receiving incubator outlet flow.
A more rigorous counting of green eggs being seeded into incubators is required at Gulkana than at most hatcheries, since there is no other opportunity to count them. Most hatcheries count for precision at the eyed stage. Basic egg enumeration techniques have not changed significantly. The changes that have occured are due to technological advances in egg counting equipment. Prior to and including the 1985 egg take, fertilized eggs in buckets were not seeded into the incubators until all the eggs for that day were spawned, thus the first water hardened eggs each day could remain in a bucket for up to 4 hours. Eggs were estimated by proportion, counting subsamples (two-2 liter subsamples from five buckets of eggs) of known volume (2 liter) and measuring the total volume of eggs per bucket. Since 1986, egg enumeration has begun as soon as the first bucket of fertilized eggs finished water hardening. This was made possible in part by being able to process subsamples through an electronic counter, which significantly decreased manpower needs for counting of subsamples. Pathology laboratory staff suggested counting the water hardened eggs as soon as possible to minimize the time eggs spent within buckets in close contact with no water circulation. The theory being that enumeration of eggs as soon as possible after water hardening decreases the possibility of cross contamination by IHNV in a closed environment. The current method of egg enumeration requires only one person to conduct the volume measurement of eggs, thus ensuring standardization of volumes and samples throughout the egg take.
Winter monitoring of the hatchery, which in early years occurred only monthly, and now occurs weekly due to the high water quality of the spring, the consistent volume of flow, and maintenance free design of the water intakes and incubators. The greatest problem is that holes of the water intake box can become filled with moss and debris and result in decreased water flow to the incubator(s) . Another problem, accumulation of air in the 2 inch intake lines, decreases water flow to the incubator. Both of these issues were resolved by installing two large intake lines which supply a 33,000 liter settling tank and two 1300 liter headboxes which in turn supply individual incubators.
Accquisition of electronic counting equipment has revolutionized the process of fry enumeration. The largest remaining problem is finding a method to ensure a counting rate of less than 1,000 fry/min per counting head (machine accuracy declines beyond this rate). Since a short trough (used initially) and plastic boxes had problems insuring accurate counts of large numbers of fry, an

experiment replacing plastic boxs with an 8 foot long trough fitted with baffles (to mix the water and seperate fry) with a counting head mounted at the end has been developed and tested. Significantly improved results have been achieved.
A major concern in hatchery enhancement is that the fry will be able to compete and survive after being released into the wild. Short term evaluation of this fitness for survival is measured for hatchery fry in terms of length, weight, condition of development, and release timing against that of fry produced naturally. The long term measure of fry release fitness is the return of adult fish from hatchery releases. Hatchery and natural fry quality is documented in the Research section of this report, while enhanced adult returns are covered in the Evaluation section.
Research
Reseach investigations have been conducted in an effort to improve fry survival and quality, decrease manpower requirements, and improve cost effectiveness.
Background:
Prior to the 1979 egg take, Gulkana incubation units had been loaded with four or five seqential layers of eggs and gravel similar to the reports by Bailey and Heard (1973) and Bailey and Taylor (1974). The layering technique required storing approximately one cubic yard of gravel per incubator for at least a month between the time the incubator was cleaned and the time eggs were ready to be seeded. Layering presented problems in terms of storage space, keeping the gravel free of leaves and debris during the storage period, and additional handling of the gravel during egg seeding. These problems were addressed during the 1979 egg take and 1980 fry survival by an experiment seeding eggs directly upon the rearing substrate. Eggs seeded per incubator was 250,000. Survival percentages from eggs in two layered gravel incubators (80.7% and 61.8%) and from two incubators with eggs seeded on top of the previously loaded gravel (92.4% and 77.6%) were judged to be similar, and if anything, the nonlayered gravel appeared to provide some benefit. Testing was conducted at the same time plastic Intalox saddles were being used for the first time at Gulkana. It was impossible to layer the plastic saddles and eggs due to the greater than 90 percent void space of the saddles. Eggs seeded on top of the saddles immediately settled through the substrate with some reaching the false plate. It was concluded that green eggs could be seeded on the surface of the substrate media. Labor could be reallocated from loading the incubators with gravel in layers during the egg take to taking more eggs, increasing the efficiency of both incubator cleaning and reloading and the egg take process.
Another question which needed addressing, was the egg capacity of incubator units. Using an egg loading capacity of less than
optimum would result in under utilization of incubator space while incubating more than the optimum number of eggs/alevins per incubator could result in decreased fry quality and/or lower survivals. During the egg take of 1979 two gravel substrate incubators were loaded with approximately 500,000 eggs rather than the normal loading density of 250,000 eggs. No noticeable differences were observed in the emmigrant fry and the egg to fry survival was similar to those units loaded with 250,000 eggs. This test was repeated in 1980 with six incubators; two loaded with greater than 600,000 eggs, two with approximately 375,000 eggs, and two with a standard 250,000 eggs. Even though the egg to fry survival in the high density units was not significantly different from the other units, it was observed that the emmigrating fry from the high density units were primarily yolk sak fry while fry from the lower density units were buttoned up. Results suggested that loading incubators with 600,000 eggs caused stressful conditions for the surviving alevins. During 1981 seven incubators were seeded with between 400,000 and 500,000 eggs and nine incubators were loaded with between 500,000 and 545,000 eggs. Fry survival and quality in 1982 were judged to be similar to four units loaded with less than 378,000 eggs each during the previous years test. Egg loading optimum for the Gulkana incubation units was set at 500,000 based on results from 1979, 1980 and 1981.
Several state hatcheries experienced outbreaks of IHNV in 1980. The F.R.E.D Division, in response to the significant loss, developed and instituted a Sockeye Salmon Culture Policy in May 1981. The policy required disinfecting green eggs with an iodophor treatment. Since Gulkana Hatchery had not experienced outbreaks of IHNV and the effects of Betadine were not well established, a field test was conducted before adopting the treatment as standard practice. In 1981, half the eggs taken were treated with Betadine at lOOppm for 10 minutes (4.4 million eggs) and half without (4.5 million eggs) . There were no obvious differences in fry quality or survival percentages. Beginning in 1982, Betadine disinfection of eggs became standard procedure at Gulkana Hatchery.
One of the larger problems facing hatchery personnel is the treatment and control of fungal and bacterial growth on eggs. Nearly all facilities use some type of chemical treatment to control fungal growth on eggs, Gulkana is no exception. In fact, at Gulkana eggs are not shocked or picked thus control of fungal growth is extremely important. Use of Malachite Green began in September of 1977. Treatment consisted of 11.2g per incubator (one per month) until one month before hatching when the treatments were discontinued. Due to a Federal ban prohibiting the use of Malachite Green for treatment of food fish, an experiment was conducted to document the importance of Malachite Green as a fungal control agent. During 1984 to 1985 half the incubators were treated with Malachite Green and half without. Test results indicated that the earlier eggs were taken in September, the more critical fungal treatments became, presumably due to warmer water temperatures. Malachite Green treatments for fungal contol continued through 1991 since instream head boxes and weather

conditions encountered at Gulkana Hatchery prohibit the use of any other chemical. Installation of two 3O.5cm (12in) intake lines and distribution building during 1988 allows consideration of other chemicals for fungal and bacterial control.
Another ongoing area of research is development of a more functional incubator. Desirable traits include low initial cost, ease of construction and/or adaptation, water tightness, ease of disinfection, long service life, and uniform water flow. Basic configuration of Bams type boxes has not changed. Improvements have included using a pneumatic staple gun and silicone sealant during construction to improve water tightness. Another improvement is use of polyethylene false plates. Several sheets were tested in 1987-1988. Testing was successful, and conversion to 12.7mm polyethylene sheet occurs as budgets allow. Polyethylene sheet has a higher initial cost (5 times that of plywood) but an unlimited lifespan and can be disinfected and reused (including after an IHNV outbreak). These advantages outweigh the lower initial cost of plywood because of limited lifespan (about 7 years), coupled with high labor costs for drilling new holes, and the requirement for destruction after a viral outbreak. Substitution of 19mm stainless steel banding for rough cut 5x20cm spruce as the exterior bracing for incubators, began evaluation as another cost and labor saving improvement in 1988.
A second approach to egg incubation at Gulkana is being tested, using aluminum Kitoi incubators. Two major initial considerations are; first, the small size (0.9x0.6x0.6m) which limits egg capacity to a maximum of l50,OOO and secondly, the danger of freezing due to transmission of heat or cold which makes some type of building or insulation layer essential.
A third incubator prototype being tested involves conversion of plastic totes (Magnum 2000, manufactured by Xytec, Inc. of Tacoma, Washington). Inside incubator measurements are 1.2xl.lx0.6m which allows incubation of 250,000 eggs. The current prototype uses threaded inlet and outlet polyethylene bung fittings (distributed by United States Plastic Corp., Lima, Ohio) which have eliminated leaks associated with the 1987 model. A second improvement involves a one piece heat welded polyethylene false plate with attached supports which drops into place. The 1987 prototype had false plate supports bolted through the outside walls which compromised strength, water tightness and ease of disinfection. Polyethylene has less heat/cold conductivity than aluminum and therefore needs less protection from freezing temperatures.
Research described in this section was conceived after preliminary investigations raised questions concerning the survival, timing, length, weight, and condition of development for fry emerging from stream-side incubators containing rounded river gravel and PVC Intalox saddles (Norton Co., Ohio [Roberson and Holder 19831). Because gravel is heavy and awkward to handle, most hatchery managers have not used it as an incubation or rearing substrate. Artificial substrate such as llplastic saddles", "bio-rings",
Nastro-turf",and plastic grids are being used in many hatcheries as a rearing substrate. Advantages include light weight, relative ease of cleaning (entirely due to lighter weight), ease in handling, and higher potential alevin loading densities due to increased void space and greater surface area. More importantly, any of the artificial substrates mentioned produce higher quality fry than those reared in smooth troughs (Emadi 1973; Leon 1975, Leon and Bonney 1979; Fuss and Johnson 1982; Hansen and Moller 1985). While Gulkana hatchery used rounded river gravel as a rearing substrate, other researchers have primarily used crushed gravel (Bams 1970, 1972, 1974, 1982; Poon 1977) . In response to questions raised about fry quality from rounded gravel versus plastic substrate, and the lack of research comparing different types of substrates within one hatchery, it became important to compare survival, timing, length, weight, and condition of development for fry emerging from rounded gravel, fractured and crushed river gravel and Intalox saddles. In addition, the quality of fry produced in the hatchery was compared to fry emerging from natural redds in an adjacent weired spring area in terms of survival, timing, length, weight, and condition of development to evaluate the effects of the hatchery environment on emergent fry quality.
Materials and Methods:
Study data was collected during the 1983 egg take and 1984 fry emigration. Male and female adult sockeye salmon were collected and spawned between 20 September and 14 October 1983. Females were killed instantly by cutting the head through the vertebral column just behind the eye. Males were killed by a blow to the head. Spawning procedures followed those of McNeil and Bailey (1975) . After the fertilized eggs had water hardened for approximately one hour, they were treated for 10 minutes with a prophylactic solution of lOOppm Betadine to prevent infectious hematopoietic necrosis virus (IHNV), then rinsed in fresh spring water.
Eggs were transported to the incubators in 19 liter buckets. Total egg numbers were estimated by proportion, counting subsamples of known volume and measuring the total volume of eggs per bucket. Eggs were then loaded directly into incubators. Two types of stream-side incubator design were used in this research; production and experimental. The primary reason for employing experimental incubators was to increase sample replicates. The production units were loaded with approximately 580 eggs/l of coarse substrate. The experimental units were loaded with 478 eggs/l of course substrate.
Three types of substrate were used in the hatchery incubators: 12.5mm to 38mm naturally rounded igneous river gravel, 2.24g Intalox plastic saddles (Appendix B), and 12.5mm to 38mm fractured and crushed igneous river gravel. Two 18.9 liter subsamples of each gravel substrate type were processed according to Test-7, Sieve Analysis of Fine and Coarse Aggregates in the manual "Alaska Test Methods - material section" (Alaska Department of Transportation and Public Facilities 1980), including two samples
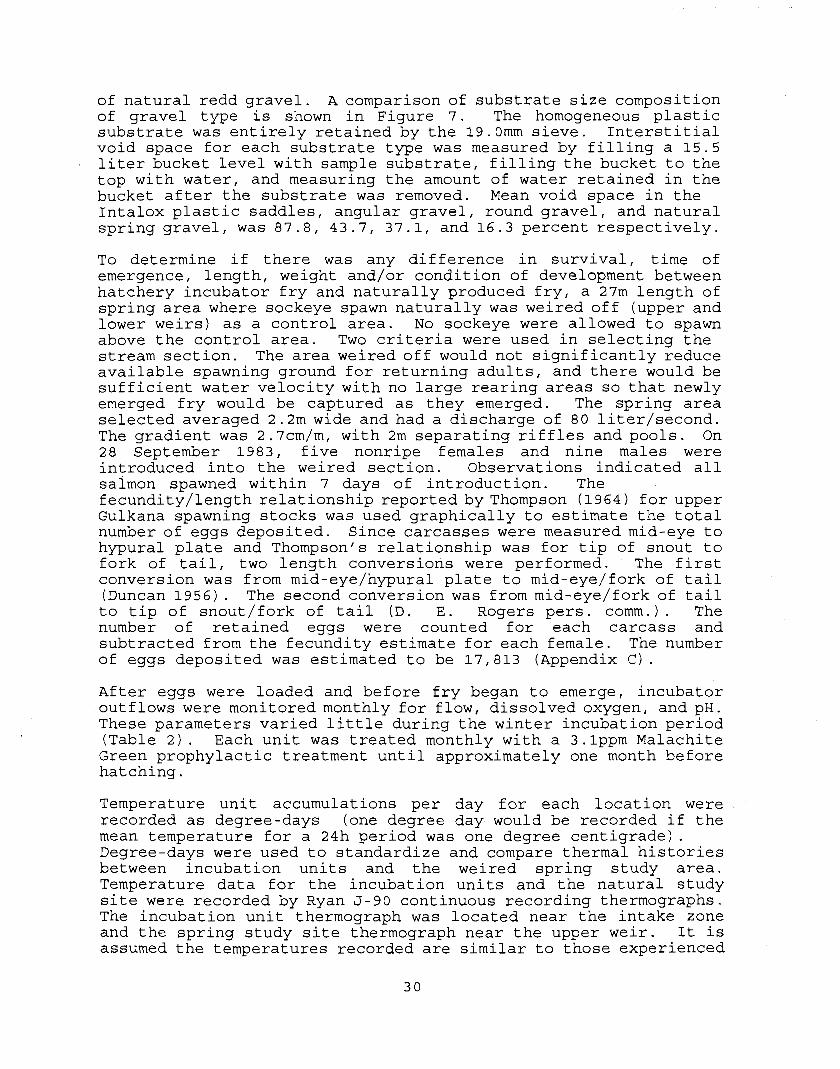
of natural redd gravel. A comparison of substrate size composition of gravel type is shown in Figure 7. The homogeneous plastic substrate was entirely retained by the 19.0mm sieve. Interstitial void space for each substrate type was measured by filling a 15.5
, liter bucket level with sample substrate, filling the bucket to the top with water, and measuring the amount of water retained in the bucket after the substrate was removed. Mean void space in the Intalox plastic saddles, angular gravel, round gravel, and natural spring gravel, was 87.8, 43.7, 37.1, and 16.3 percent respectively.
To determine if there was any difference in survival, time of emergence, length, weight and/or condition of development between hatchery incubator fry and naturally produced fry, a 27m length of spring area where sockeye spawn naturally was weired off (upper and lower weirs) as a control area. No sockeye were allowed to spawn above the control area. Two criteria were used in selecting the stream section. The area weired off would not significantly reduce available spawning ground for returning adults, and there would be sufficient water velocity with no large rearing areas so that newly emerged fry would be captured as they emerged. The spring area selected averaged 2.2m wide and had a discharge of 80 liter/second. The gradient was 2.7cm/m1 with 2m separating riffles and pools. On 28 September 1983, five nonripe females and nine males were introduced into the weired section. Observations indicated all salmon spawned within 7 days of introduction. The fecundity/length relationship reported by Thompson (1964)for upper Gulkana spawning stocks was used graphically to estimate the total number of eggs deposited. Since carcasses were measured mid-eye to hypural plate and Thompson's relationship was for tip of snout to fork of tail, two length conversions were performed. The first conversion was from mid-eye/hypural plate to mid-eye/fork of tail (Duncan 1956) . The second conversion was from mid-eye/fork of tail to tip of snout/fork of tail (D. E. Rogers pers. comm.) . The number of retained eggs were counted for each carcass and subtracted fromthe fecundity estimate for each female. The number of eggs deposited was estimated to be 17,813 (Appendix C ) .
After eggs were loaded and before fry began to emerge, incubator out£ lows were monitored monthly for flow, dissolved oxygen, and pH. These parameters varied little during the winter incubation period (Table 2). Each unit was treated monthly with a 3.lppm Malachite Green prophylactic treatment until approximately one month before hatching.
Temperature unit accumulations per day for each location were recorded as degree-days (one degree day would be recorded if the mean temperature for a 24h period was one degree centigrade). Degree-days were used to standardize and compare thermal histories between incubation units and the weired spring study area. Temperature data for the incubation units and the natural study site were recorded by Ryan J-90 continuous recording thermographs. The incubation unit thermograph was located near the intake zone and the spring study site thermograph near the upper weir. It is assumed the temperatures recorded are similar to those experienced

SO csY ANGULAR
ROUND 40
NATURAL
30
20
10
0 237.5 25.4 19.0 12.5 9.5 s4.75
Sieve Sizes (mm) Figure 7. Comparison of incubator gravel types with natural redd gravel by
p a r t i c l e s i z e d i s t r i b u t i o n , based on sieve re tent ion .
by the developing fish in the hatchery incubators and natural redd due to the high rate of exchange. This assumption may not be entirely correct since small differences did exist between the recorded water temperatures of the hatchery and natural site on almost all days; however, the differences may be partially explained by thermograph calibration. Hatchery water gained degree-days when compared to the natural spring site until the end of November. The maximum cumulative mid-winter difference was 10.9 degree days on 5 February. The difference declined to zero by early March, after which the hatchery gained at a greater rate until a cumulative difference of 23.7 degree-days was reached by the end of May. The cumulative heat regimes of the incubator spring and natural test site were not statistiscally different (P~0.05) as analyzed by the Kolmogorov-Smirnov two-sample D statistic (Sokal and Rohlf 1981).
Fry from each incubator were collected daily in perforated sheet aluminum boxes located below the outlet from 12 April to 10 July 1984. Only fry emerging of their own volition were counted and sampled. Small numbers of fry were individually counted. As fry numbers increased, proportional volume and weight estimates were used to estimate total fry numbers. In order to estimate length, weight, and condition of development relationships, samples of 50 fry were randomly selected from the incubator holding boxes at approximately 25%, 5 0 % , and 75% of the expected emergence.
Fry from the weired section of stream emerged from 19 April to 10 July 1984. They were collected daily during their downstream migration in a perforated sheet aluminum weir which flowed into a catch box. The fry trap was checked at least once per day, and during peak emigration, twice per day. Fry were individually counted and samples collected at approximately 25% and 50% of those numbers expected to survive. The fry sample at 75% emergence was not obtained due to water velocity in the holding box which killed and deformed fry making them unsuitable for comparison. Samples of fry from both sources were preserved in a 5% formaldehyde solution. Preservation for six weeks or more elapsed before the fish were processed, allowing shrinkage to a constant length and weight. Fish were individually processed for fork length (+O.2Smm), and wet weight (+lmg) after blotting. Fry lengths and weights were not adjusted back to "liveu values.
Bams (1970) proposed a size-independent proportionality index of relative yolk content which he called a condition of development (kD). The index was calculated for each fish using:
10 (weight in mg) l/3/ (length in mm) .
This index is not a condition factor, but an indicator of the stage of development. A high kD value (e.g., 2.06) indicates a fish with considerable yolk reserves, whereas a low value (e.g., 1.94) indicates that the yolk is nearly absorbed. Different mean kD '
values indicate different stages of development when the alevins are from a single population, incubated in common temperature
conditions, and are of the same absolute age.
Survival was determined by dividing the number of emergent fry by the number of eggs seeded into each incubator. Timing differences were tested by comparing accumulated degree-days at the point in time when half of the total number of fry had emerged.
TO compare the effects of three sample substrates upon emergent fry quality, six production and six experimental incubators were randomly selected for a total of twelve incubators (two units and two experimental units per substrate type). Incubator fry were grouped according to substrate type in the analysis of survival and timing. Nonparametric statistics were used for the incubator survival and timing analysis due to the small sample sizes. To determine if there were significant differences (P=0.05) in survival and emergent timing between fry from different substrate types from the hatchery incubators, a Kruskal-Wallis nonparametric H test (Hollander and Wolfe 1973) was used.
The parametric two-tailed special case Student t-statistic (Sokal and Rohlf 1981) was used to test differences (P=0.05) between the single 50-percent emergence value of natural fry, and the four 50-percent values of fry from each of three incubator substrate types. To uncover differences in location, dispersion, scale, kurtosis, and skewness in cumulative emergent fry distribution from incubators and the natural site, a nonparametric Kolmogorov-Smirnov two-tailed, two-sample test was used (Sokal and Rohlf 1981).
To determine if there were significant differences (P=0.05) in length, weight, and condition of development among fry reared in the different incubator substrates, a two-way analysis of variance (ANOVA) with two covariates and three repeated measures was used (Neter and Wasserman, 1974). The two grouping factors were incubator type and substrate. Covariates were incubator egg density and degree-days of the fry sample. The 25, 50, and 75 percent emergent samples were the repeated measures. This analysis was conducted using a BMDP program package (Dixon 1985) . There was an indication that production and experimental incubators differed slightly in their effects on fry length, weight, and condition of development. The difference was not statistically significant (P>0.05) thus emergent fry samples from the production and experimental incubators were grouped according to substrate type. Reference to "incubatorI1 throughout the remainder of this section includes both production and experimental units. Natural site fry were compared to incubator fry in one of two ways. If the fry from different incubator substrates were significantly different, then analysis would proceed by comparing incubator fry from each substrate type (round, angular or plastic) separately, to natural fry. If they were similar among substrates, incubator fry were grouped for comparison with natural site fry. Regardless of the result, incubator fry and the natural site fry were tested for significant (P=0.05) differences in terms of length, weight and kD, at both 25% and 50% sampling periods, using a two-tailed one-way ANOVA (Sokal and Rohlf 1981) .
Results :
Survival of fry from incubation units varied from 73% to 96% (84% mean), in contrast to 20% survival from the natural spring (Table 5 ) , a four-fold difference. Median fry survival from the round gravel, angular gravel, and Intalox saddles (84.5% 77.6%, and 83.9% respectively), were not significantly different (P>0.05, Kruskal- Wallis H) .
Fry began to emerge from both incubators and the natural spring after attaining 650 degree-days. Emerging incubator fry numbers did not rise above 1% per day until attaining nearly 800 degree- days, then the emergence pattern assumed a normal curve. Peak emergence varied from about 830 to 870 degree-days. In contrast, the pattern formed by the emergent natural spring fry was bimodal, a small 4 day peak of 3.5%/day occured at 750 degree-days, with the main peak of 25% of total natural fry emigation occurring at 802 degree-days (Figure 8). The degree-days of median fry emergence for round gravel, angular gravel, and Intalox saddles was significantly different (P=0.04, Kruskal-Wallis H); 842, 851, and 857 degree-days respectively. The emergence pattern and timing of experimental incubators loaded on the same day and receiving the same degree-days, show similar calendar day differences in emergence timing between round gravel, angular gravel, and Intalox saddles (June 4,5; June 6/10; June 7; respectively, Table 5). The degree-days to 50% emergence of natural spring fry (802 degree- days) was significantly different (P<0.05, Student t-test) from the mean 50% emergence timing of fry from round gravel, angular gravel, and Intalox saddle incubators (841, 853, and 858 degree-days respectively, Table 5). Fry emerging from plastic Intalox saddles varied the most from natural fry timing in terms of mean degree- days to 50% emergence of the three incubator substrates tested (56 degree-days which is equal to 13.5 calender days) while rounded gravel fry differed the least (39 degree-days which is equal to 9 calender days) . Cumulative percent of incubator fry emergence with time (Figure 9) was not significantly different (P>0.05, Kolmogorov-Smirnov D) between the round gravel and angular gravel, or angular gravel versus Intalox saddles. However, there was a significant difference (P<0.05, Kolmogorov-Smirnov D) between the cumulative percent of fry emergence between the round gravel and the Intalox saddles. The Kolmogorow-Smirnov D statistic also showed that there was a significant difference (Pc0.05) between the mean cumulative percent emergent timing of all three incubator substrates and fry from the natural test site, with Intalox plastic saddles showing the greatest difference (Figure 9). Significant differences in fry median and cumulative percent emergence timing indicated that environmental and/or behavioral conditions differed between incubator fry within the tested substrates. Significant median and cumulative percent emergence timing differences between incubator fry and natural spring fry also indicated that environmental and/or behavioral conditions differed between fry reared in incubators and the natural redd.
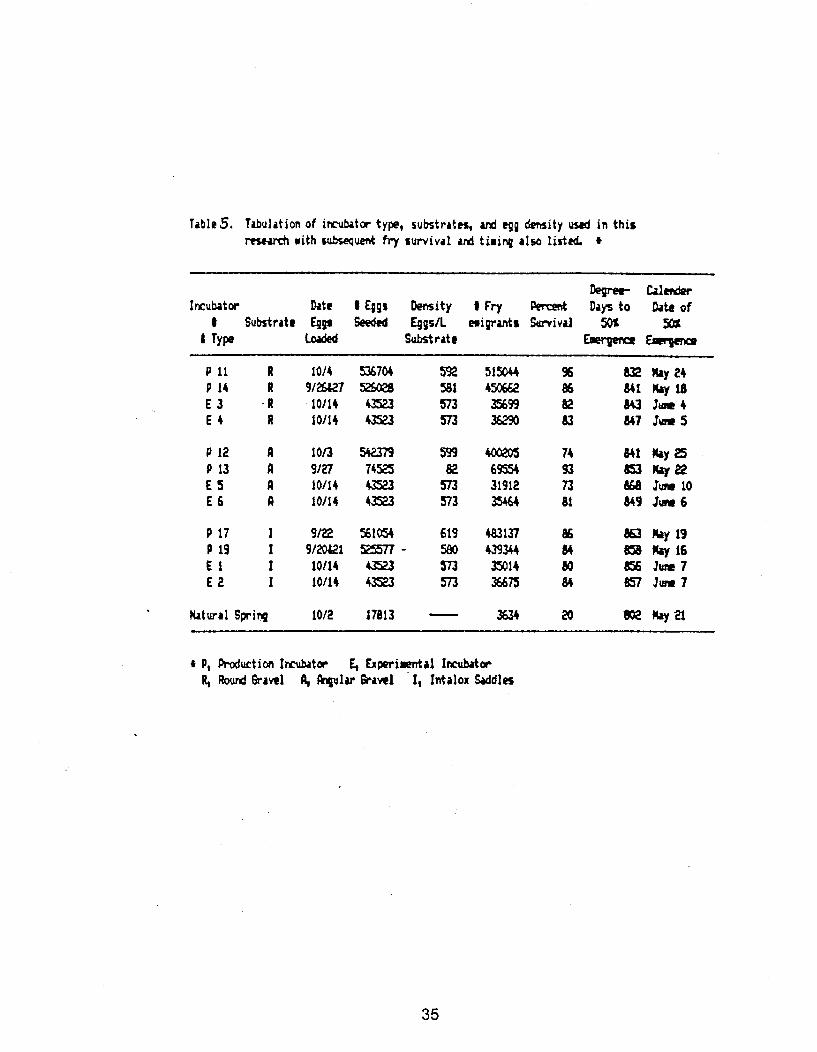
Tables. Tdxilation of i M t a type, suktrhs , ud e g p density usad in this rCICUdl with subsequent f ry survival a d tirirq also listed. 4
ion sru79 sin 7 4 s 10114 4&?3 10114 43523
Natural Spring
r P, Production Irmbrtw E, Expori#ntrl Irmbrtor R, Rourd Brave1 ll, fhgular &awl I, Intolox Wdles

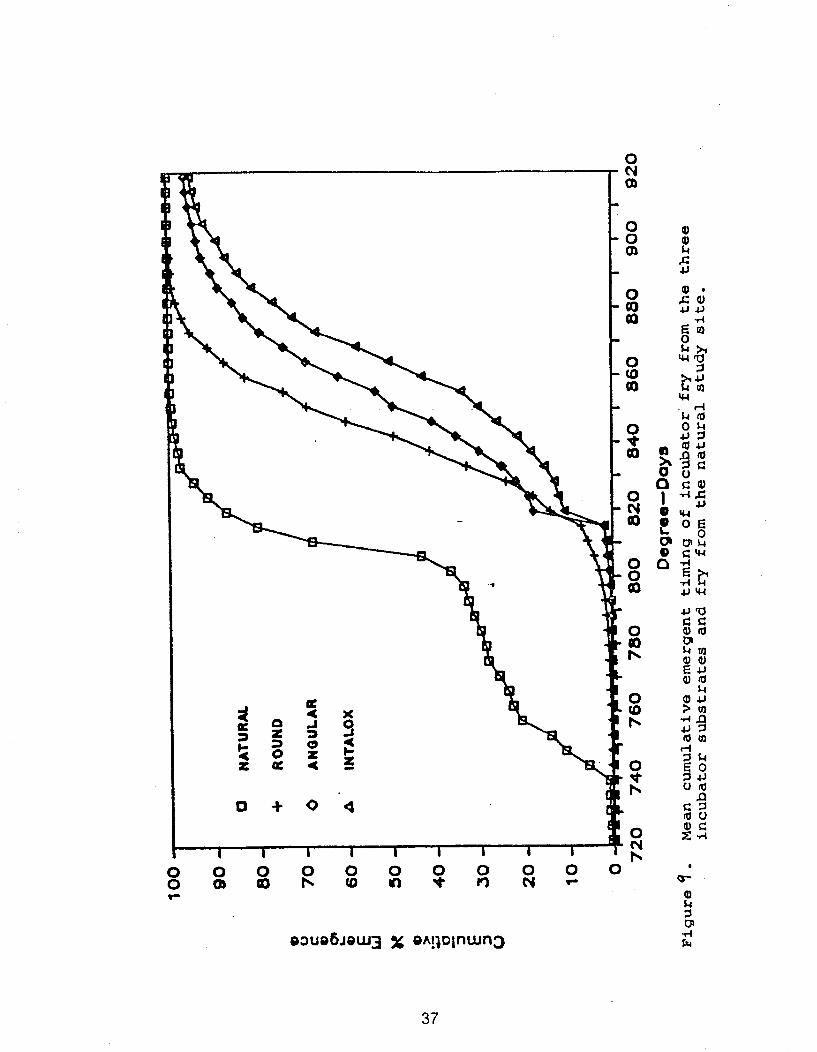
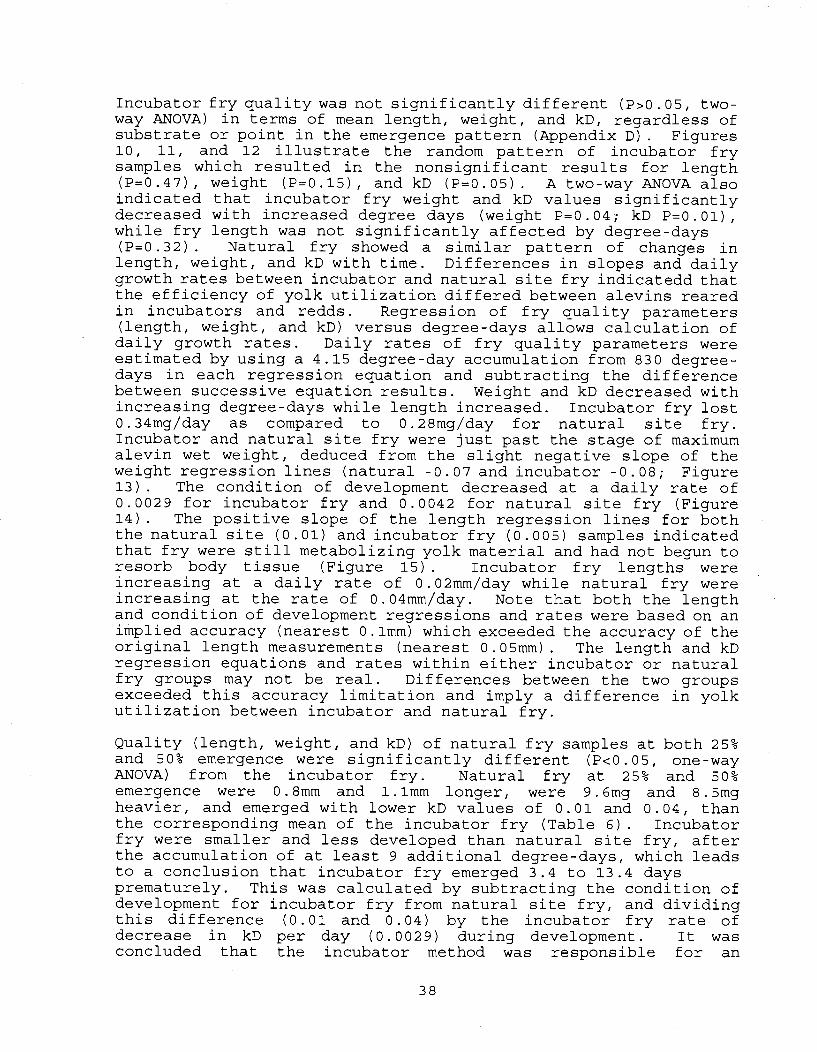
Incubator fry quality was not significantly different (P>0.05, two- way ANOVA) in terms of mean length, weight, and kD, regardless of substrate or point in the emergence pattern (Appendix Dl. Figures 10, 11, and 12 illustrate the random pattern of incubator fry samples which resulted in the nonsignificant results for length (P=0.47), weight (P=O. IS), and kD (P=O. 05) . A two-way ANOVA also indicated that incubator fry weight and kD values significantly decreased with increased degree days (weight P=0.04; kD P=0.01), while fry length was not significantly affected by degree-days (P=0.32). Natural fry showed a similar pattern of changes in length, weight, and kD with time. Differences in slopes and daily growth rates between incubator and natural site fry indicatedd that the efficiency of yolk utilization differed between alevins reared in incubators and redds. Regression of fry quality parameters (length, weight, and kD) versus degree-days allows calculation of daily growth rates. Daily rates of fry quality parameters were estimated by using a 4.15 degree-day accumulation from 830 degree- days in each regression equation and subtracting the difference between successive equation results. Weight and kD decreased with increasing degree-days while length increased. Incubator fry lost 0.34mg/day as compared to 0.28mg/day for natural site fry. Incubator and natural site fry were just past the stage of maximum alevin wet weight, deduced from the slight negative slope of the weight regression lines (natural -0.07 and incubator -0.08; Figure 13). The condition of development decreased at a daily rate of 0.0029 for incubator fry and 0.0042 for natural site fry (Figure 14). The positive slope of the length regression lines for both the natural site (0.01) and incubator fry (0.005) samples indicated that fry were still metabolizing yolk material and had not begun to resorb body tissue (Figure 15) . Incubator fry lengths were increasing at a daily rate of 0.02mm/day while natural fry were increasing at the rate of 0.04mm/day. Note that both the length and condition of development regressions and rates were based on an implied accuracy (nearest 0. lmm) which exceeded the accuracy of the original length measurements (nearest 0.05mm). The length and kD regression equations and rates within either incubator or natural fry groups may not be real. Differences between the two groups exceeded this accuracy limitation and imply a difference in yolk utilization between incubator and natural fry.
Quality (length, weight, and kD) of natural fry samples at both 25% and 50% emergence were significantly different (Pc0.05, one-way ANOVA) from the incubator fry. Natural fry at 25% and 50% emergence were 0.8mm and l.lmm longer, were 9.6mg and 8.5mg heavier, and emerged with lower kD values of 0.01 and 0.04, than the corresponding mean of the incubator fry (Table 6 ) . Incubator fry were smaller and less developed than natural site fry, after the accumulation of at least 9 additional degree-days, which leads to a conclusion that incubator fry emerged 3.4 to 13.4 days prematurely. This was calculated by subtracting the condition of development for incubator fry from natural site fry, and dividing this difference (0.01 and 0.04) by the incubator fry rate of decrease in kD per day (0.0029) during development. It was concluded that the incubator method was responsible for an
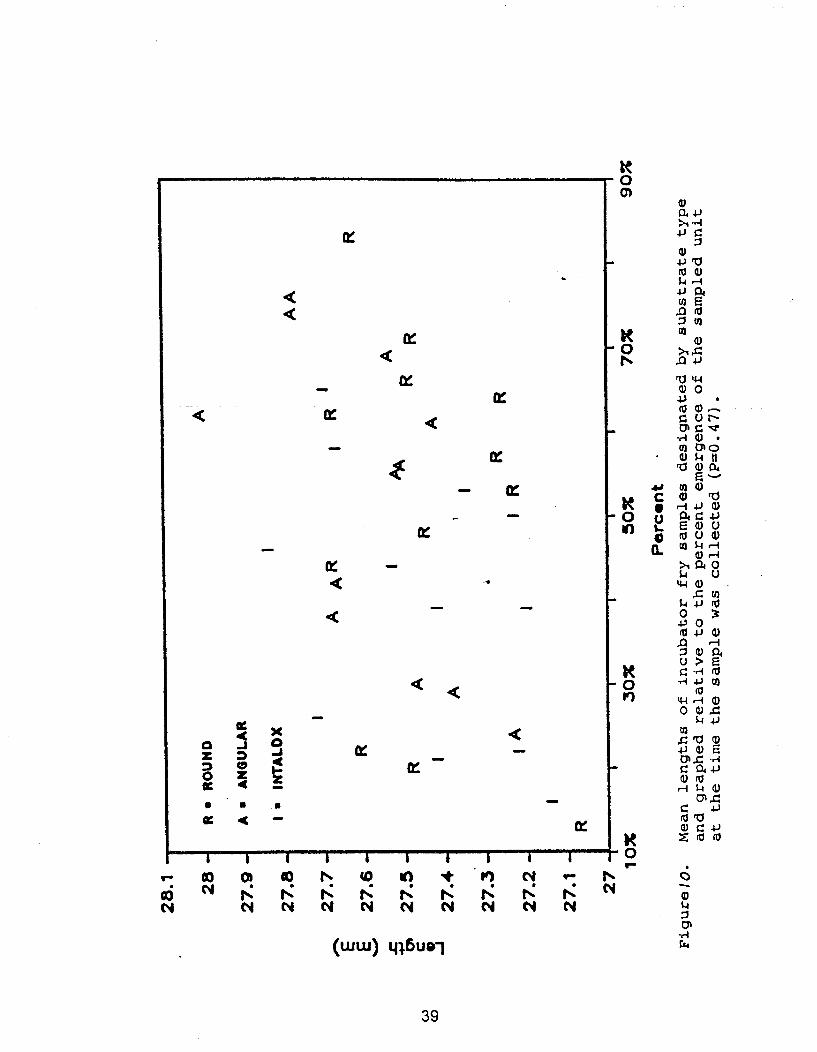
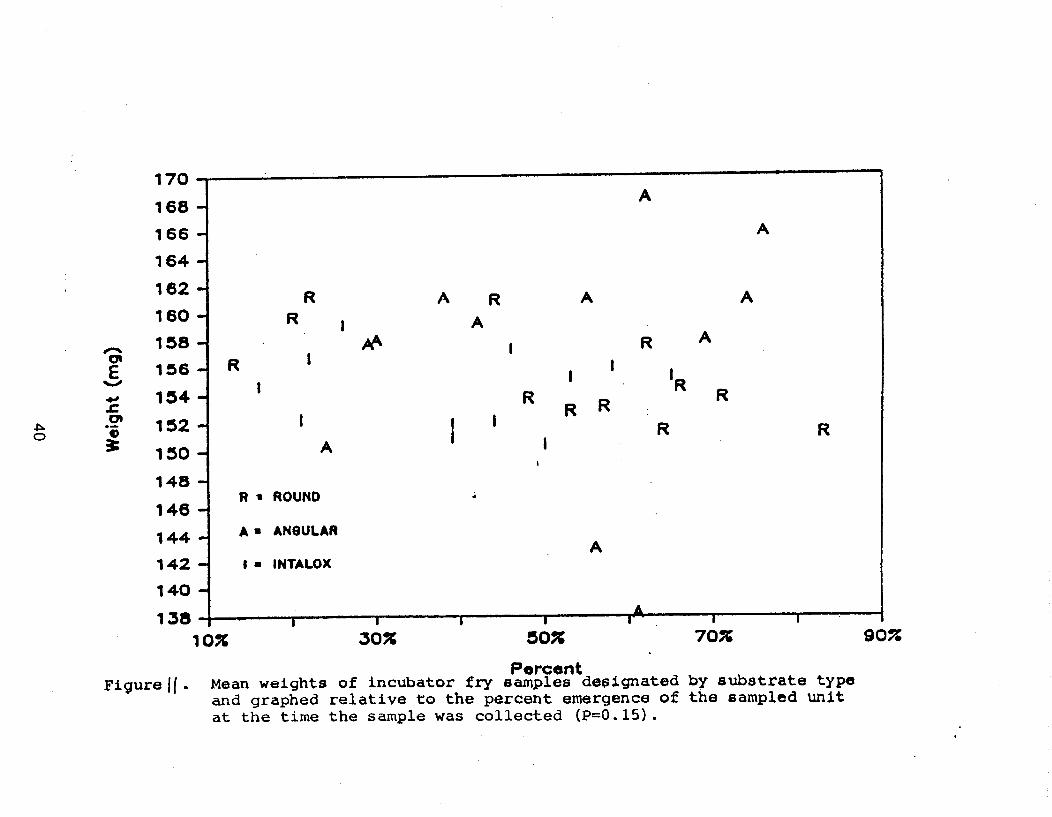

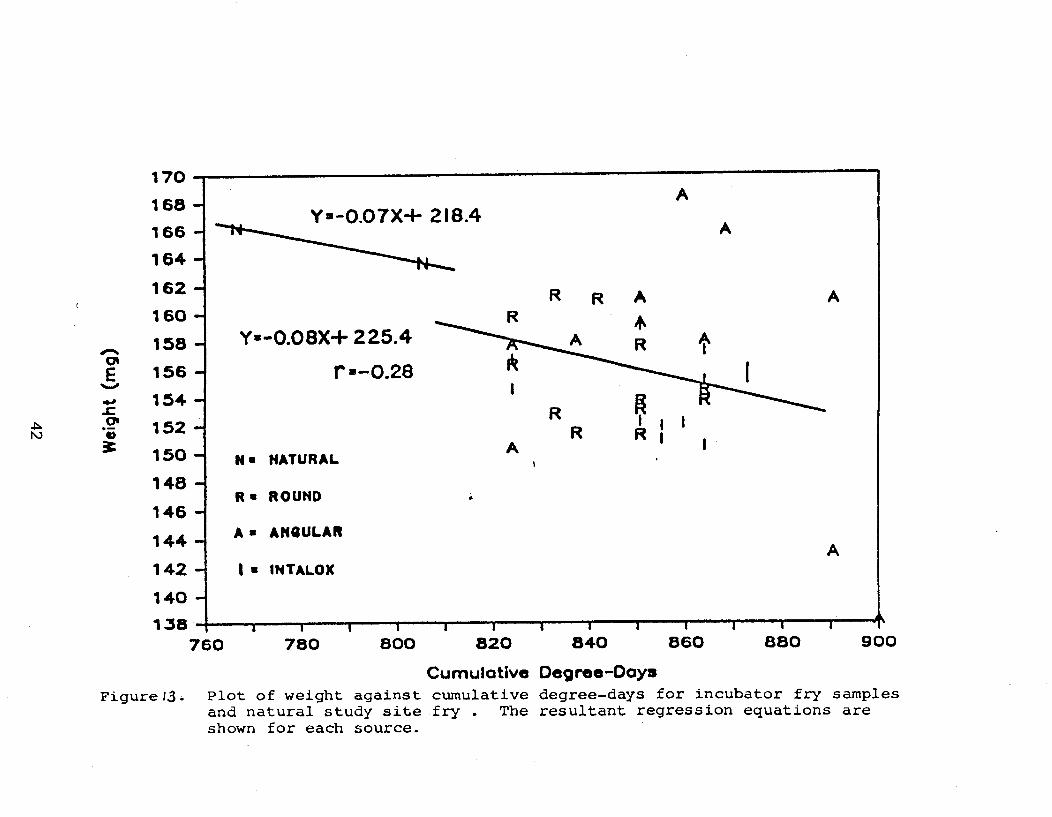
Nm HATURAL
R m ROUND
A = ANOULAR
I' INTALOX
Cumulative Degree-Day8 Figurel3. P l o t of weight against cumulative degree-days for incubator fry samples
and natural study site fry . The resu l tant regress ion equations are shown f o r each source.

R
1 ROUND
A 8 ANBULAR
Cumulative Degree Day8 F i g u r e ( + . P l o t of c o n d i t i o n of development agai~stcumulat ive degree-days for
i n c u b a t o r f r y samples and n a t u r a l s t u d y s i te fry. The r e s u l t a n t r e g r e s s i o n e q u a t i o n s ace shown f o r each s o u r c e .
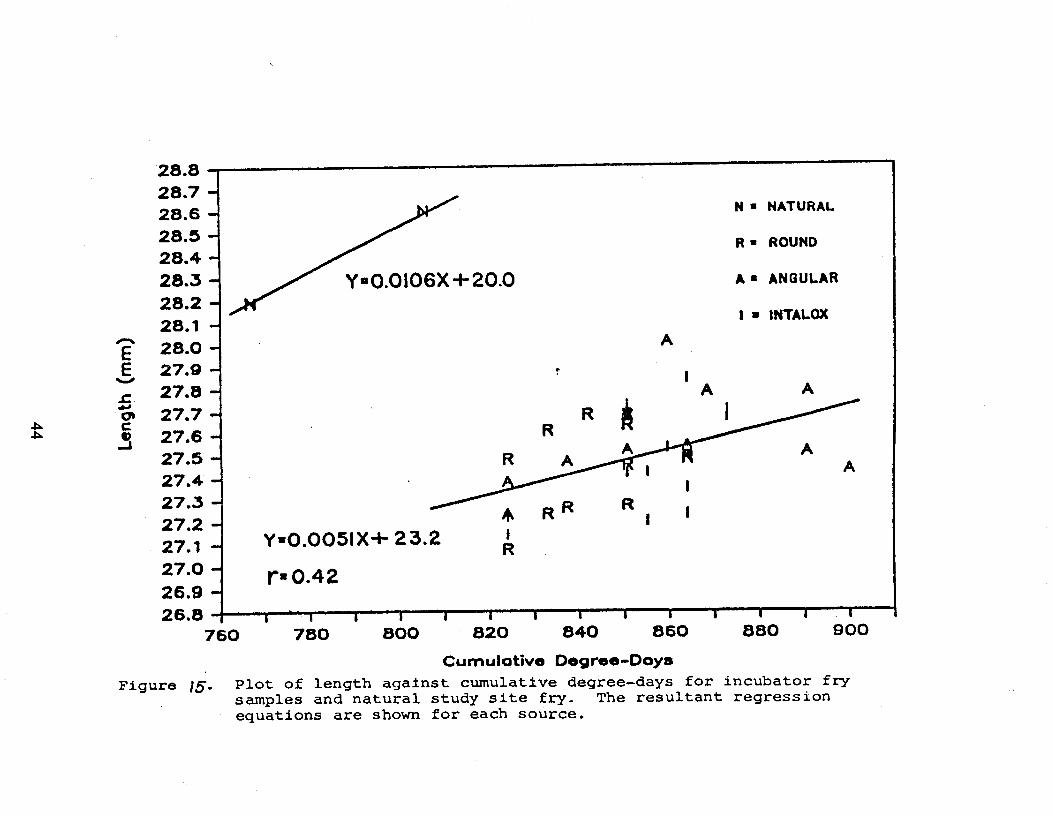
N 8 NATURAL
R = ROUND
A 8 ANGULAR
I = INTALOX
A
I A A
27.0 -26.9 - ~ 0 . 4 2
26.8 I I I I I I I I I I 1 I I I
760 780 800 820 840 860 880 BOO
Cumulatlvs Degree-Days Figure 15. P l o t of l ength aga2nst cumulative degree-days f o r incubator fry
samples and natural study s i te fry. The resu l tant regress ion equations are shown f o r each source,
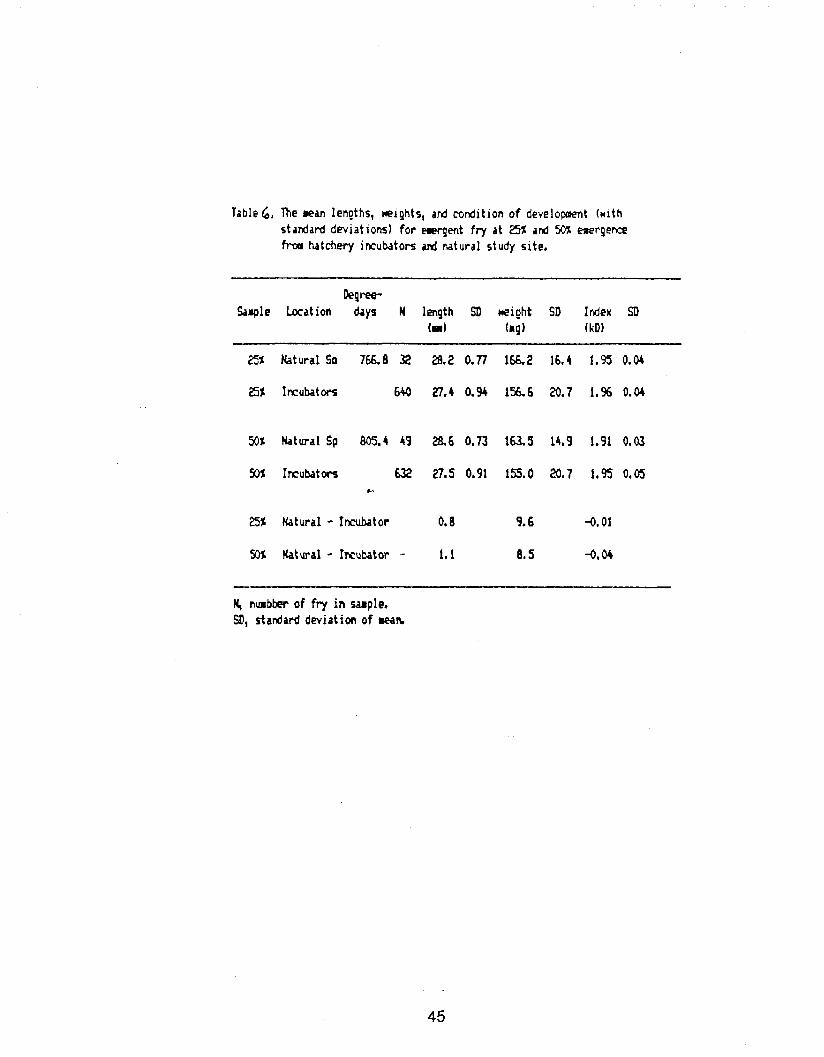
Table 6 , The mean lengths, weights, and condition o f development (with standard deviations) for ewqwlt fry at 25%and 50% erwrgence frm hatchery incubators ard natural study site,
w--Sarple Location days N length SD weioht SD Index SD
(ml (@$ (kD)
% Hatwal So 765.8 32 20.2 0.77 1&2 16.4 1.95 0.04
25% Incubators 640 27.4 0.94 1&6 29.7 1.96 0.04
50% Natural Sp 805.4 49 2&6 0.73 163.5 14.9 1.91 0.03
Incubators 6 2 27.5 0.91 155.0 20.7 1,s 0.05 b-
% Natural - Incubator 6.8 9.6 4 .01
33% Katwal - Incubator - 1 .1 6.5 4.M
H, nlabber of frj in wple . 9,standard dwiation o f meah
appreciable loss in potential size of emergent fry and that the average growth rate was decreased in relation to that of natural stocks. This conclusion was reached after comparing the standardized incubator fry lengths and weights. Standardization to the same condition of development was required in order to use lengths and weights as growth indices. Emergent fry size is dependent upon the amount of yolk originally available and the growth rate experienced during development (Gray 1928). Correction of the 25% and 50% mean weights for the 3.4 and 13.4 day premature emergence resulted in 155.4mg as compared to 156.6mg and 150.5mg compared to 155.0mg. Subtraction of the standardized incubator fry weight from the natural site fry showed there was a potential weight loss of 10.8mg at 25% emergence and l3.Omg at 50% emergence. This is a 6.3% loss at 25% emergence and 7.3% loss at 50% emergence. The 25% and 50% mean length corrections for the 3.4 and 13.4 day premature emergence resulted in 27.5mm compared to 27.4mm and 27.8mm compared to 27.5mm. Thus the potential length loss was 0.7mm at 25% and 0.8mm at 50% emergence (Table 7).
Discussion:
Physical and chemical differences in the incubation environment can cause differences in survival, timing, and size of fry emerging from either incubators or natural redds. In this study, eggs and alevins in both the stream and incubator were incubated under as similar conditions as possible in origin of eggs, spawning date, egg density, water supply, and thermal regime. The only variable in the hatchery environment was the type of substrate in which alevins developed. Incubation in the stream was under good quality conditions which included: a low spawner density, a spring water source with constant flows, and a stable thermal regime.
The major difference between incubator substrates and natural spawning gravel was the high percentage of fines (34.5%) in the natural redd passing through or retained by a 4.75mm sieve. There is an inverse relationship between the amount of fine sediment (c3.0mm) in the microenvironment and survival of the developing embryo (McNeil and Ahnell 1964; Cooper 1965; Bjornn 1969; Koski 1972; Phillips et al. 1975; Tappel and Bjornn 1983; Witzel and MacCrimmon 1983). Most of the above studies have attributed low embryo survival, in substrates with a large percentage of fines, to entrapment and or decreased gravel permeability. Decreased permeability results in reduced water flows around the embryo causing a decreased oxygen supply and accumulation of toxic metabolic wastes. Cooper (1965) suggested that gravels finer than 3.36mm may create lethal pressures due to compression. Gravel incubators containing large amounts of fine sediment (41.3% retained by a 4.7mm sieve and 5.4% retained by a 2.3mm sieve) have produced low percent survival from egg to fry (18.1%, Ginetz 1976) . The results of this study demonstrate that none of the three rearing media used in the hatchery incubators deleteriously affected the egg to fry survival. Survival four times (84% versus 20%) that of the naturally spawned eggs was achieved consistently due to the combination of constant water supply and elimination of
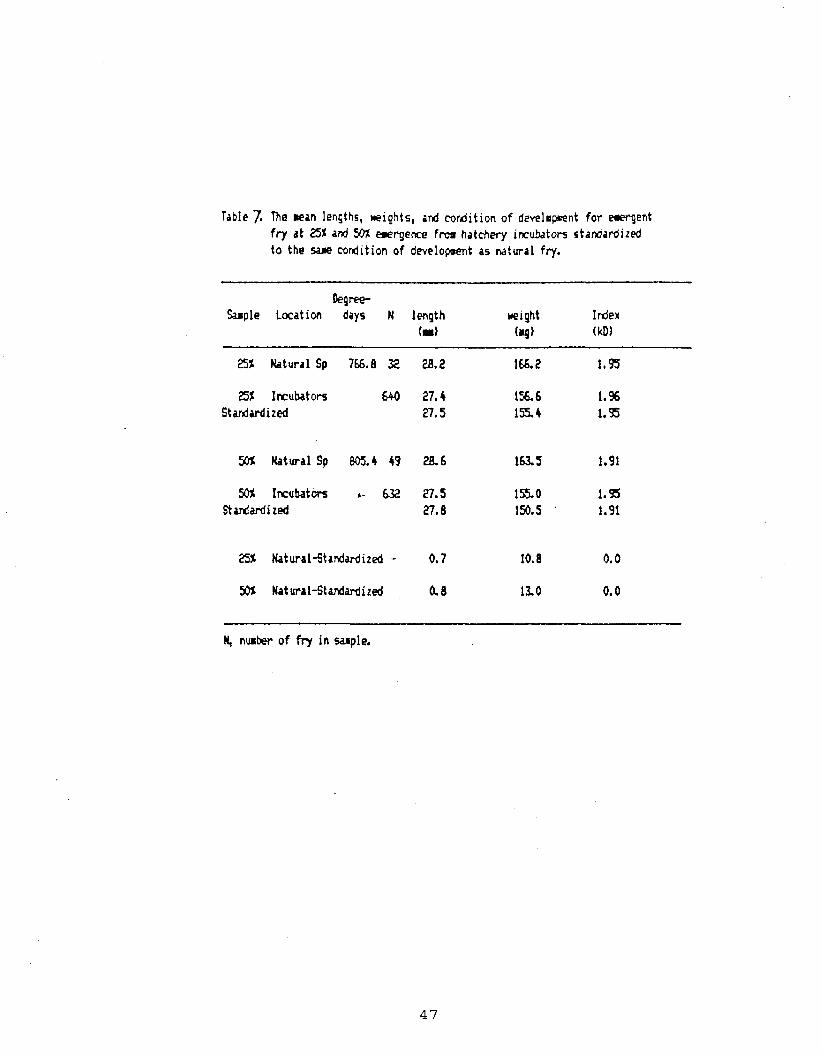
----
Table 7. The w a n lengths, weights, and cordit ion o f developsent f o r eaerjent fry a t 2% and 5.0%eaergence f rw hatchery incubators s ta~ard ized to the sare condition of developsent as natural fry.
Degree-Sarple Location days N length weight Index
Id (4) (0)
25% Katural Sp 7 6 . 8 22 28.2
251r Incubators 640 27.4 S t a r d d i zed 27.5
M, nun& of fry in sarple.
fines which occur in natural redds. Other authors have reported similar egg to fry survival ratios with gravel incubators over naturally spawned eggs (Bams 1972, 1974; Bailey et al. 1976).
Timing of the natural fry emergence has been determined by years of natural selection balancing the two opposite pressures of early lake entry and late lake entry for optimal survival in the nursery area. Early lake entry is advantageous when sufficient food is available because it increases the length of time for feeding, resulting in a larger fish, which has a survival advantage over smaller fry entering the lake later (Bams 1969). Early lake entry fish may not survive if the spring plankton blooms have not begun. Late lake entry balances 1) decreased survival potential if food is available early, due to a shorter growing season, versus 2 ) increased probability of survival by entering the lake when a food supply is assured (Bams 1969). These two circumstances act to increase the likelihood of fry emergence coinciding with first food availability (Bams 1969). Because alevins reared in a stressful environment retain their natural emergence timing while sacrificing growth in size, Bams (1969) theorized that retention of natural emergence timing was less likely to subtract from the fishes survival potential than any other combination of adaptive responses. Evidence by Gray (1928) supports this theory - normal but smaller fry were formed at the normal time, after removal of part of the yolk at an early stage. Such relationships indicate that any propagation program must not alter the natural optimal average release date or decreased survivals must be expected. Even though time of fertilization and temperature regimes were accounted for in all treatments, it is important to compare the physiological parameters of rate of development, growth rate, and stage of development at emergence, for meaningful interpretations of timing, length, weight, and kD differences.
Rate of development is determined primarily by temperature (Kinne and Kinne 1962; Garside 1966; Peterson et al. 1977; Heming et al. 1982). When temperatures are within normal range, higher temperatures result in faster fish development. Temperature regimes of individual incubators were assumed to be similar, due to the thermal mass of each production incubator (3.6m3), and a protective building over the experimental incubators. Reduced developmental rates of alevins are caused by low to intermediate levels of oxygen concentrations (Alderdice et a1 1958; Garside 1959, 1966; Silver et al. 1963; Shumway et al. 1964; Brannon 1965; Hamor and Garside 1977), and high concentrations of ammonia (Fedorov and Smirnova 1978). If temperature regimes are similar and rates of development are different in the hatchery and/or the redd, then chemical factors are considered the most probable cause. In this study, degree days for median emergence timing were different between the three incubator substrates. Fry emerged two and four days later from the angular and plastic saddle substrates than round gravel substrate. Taylor (1984) found that fully developed fry emerged three days later from plastic substrates than from river gravel. If the developing embryo had been using energy in response to a stress, a significant difference in fry size would
be expected. Since this was not the case, and the fish emerged at similar stages of development (i .e. fry from angular and plastic saddles took a longer time to develop than fry from round gravel) , it was concluded that differential rates of development must have occured within the three tested substrates.
There were statistical differences (Pc0.05) between natural and incubator fry in terms of length, weight, condition of development, and median time of emergence. A possible explanation involves the fry capture date. Fry from the incubators were allowed to emerge volitionally. This is in contrast to Bams (1970) who llscoopedu the fry from the incubators. Large numbers of incubator fry were observed swimming in the water column above the coarse substrate, with no directed swimming toward the outlet. It appeared that fry were content to swim in the unit until caught in the outlet current. Additional time within hatchery incubators would change the time of emergence but does not account for differential timing from the three incubator substrates, nor does it explain loss of potential size, since incubator fry had not begun to resorb body tissue. Differential emergence timing between natural fry and hatchery fry may be partly attributed to natural fry having little opportunity to re-enter the gravel after entering flowing spring water, due to gradient and lack of rearing pools. It does not explain why naturally reared fry were consistently larger, heavier and had a lower condition of development with less accumulated degree-days. It was calculated that incubator fry emerged about 3.4 to 13.4 days prematurely. Research by Bams stated that deep gravel substrate incubators inherently causes premature emergence of hatchery fry, an average of 10 days less than that of natural fry (Bams 1970, 1972, 1974). Adding premature emergence days (kD) of 3.4 and 13.4 days to the actual difference in median degree-days (round 9.6, angular 11.7, and Intalox 13.3 days), the total degree day difference between naturally reared fry and incubator fry expanded to between 13 and 23 days for round gravel fry, 15 and 25 days for angular gravel fry, and 17 to 27 days for fry reared in plastic saddles. A conclusion was reached that developmental rates between hatchery and natural environment fry were significantly different. This implies that combinations of water flow, fish densities or other unknown factors associated with this test were not adaquate for preventing stressful conditions, as revealed by the differential developmental rates.
Size of fry upon emergence depends upon on the microenvironment in which the egg and alevin develop. A fixed quantity of yolk is the only energy source available during development to meet maintenance, activity, and growth needs. Any diversion of yolk energy from normal development due to a stress response will reduce the emergent fry size (Brannon 1965; Bams 1969). If a newly hatched alevin in a natural redd does not encounter unfavorable conditions, it will remain in the crevice where it hatched until it is ready to emerge (Bams 1969) . If the conditions are unfavorable, alevin behavior is negative phototactic and positively geotatic until emergence (Bams 1969), which means the alevin swims down if it leaves the crevice where it hatched. The Gulkana Hatchery
procedure is to load eggs on top of coarse substrate, thus upon hatching, alevins must swim down in order to find a crevice to develop in. In this situation energy is expended for movement rather than growth. Where no substrate (hatchery tray or trough) or minimal substrate is present, alevins have been documented to exibit uclumping" behavior (Leon 1975, Bams 1982, Hansen and Moller 1985). This clumping behavior may cause localized oxygen depressions and/or metabolic waste accumulation (Leon 1975; Hansen and Moller 1985; ) . Bams (1969) presented evidence which suggested that the primary stimulus for greatly increased activity was caused by increasing carbon dioxide levels. Growth of larval fishes has also been shown to be reduced when fish are reared in a low to intermediate supply of oxygen (Silver et al. 1963; Shumway et al. 1964; Brannon 1965) i.e. a smaller emergent fry at an earlier stage of development.
General causes of localized oxygen depressions and or accumulated metabolites are directly related to alevin behavior within a substrate. The large void space of plastic saddle substrate offers little resistance to alevin downward movement, tending toward mass clumping at the bottom of incubators. The lesser void space of the gravel substrates offers smaller crevices, which separates the alevins, allows less alevin interaction, and decreases clumping opportunity. Effluent oxygen levels do not express oxygen availability to the developing egg or alevin. Bams (1982) showed that chemical conditions within a substrate can be more extreme than those in the water layer above the substrate or in the effluent flow. Bams (1982) found that dissolved oxygen along the bottom of deep gravel incubators was consistently 1.1 to 1.78 mg/L lower than the oxygen level in the upper water layer. This difference depended upon flow rate, fish density, and developmental stage. Bailey et al. (1980) documented that as alevin density increased, reduced fry size and early emergence were a result and suggested that limited metabolism due to decreased oxygen concentrations, and increased total ammonia production within the incubators was the cause. Even though oxygen measurements of the hatchery water effluent were at saturation throughout the developmental period, it would appear that alevins absorbed their yolk at different efficiences within the different substrates due to localized depressions of oxygen and or accumulations of metabolites. Brannon (1965) suggested that the often reported accelerated development among hatchery versus natural alevins was most likely caused by nonsaturated oxygen levels in natural redds as compared to a saturated environment in the hatchery. The reverse may be true in this case. Saturated hatchery water becomes oxygen depleted and metabolites increase in the alevin microenvironment in direct relation to the void space of the rearing substrate. The situation is more acute in larger void space substrates due to the larger numbers of fry which can inhabit a single void. Increased numbers of fry inhabiting a single void would tend to cause lower oxygen and higher metabolite levels in that particular void which would in turn cause decreased rates of development, evidenced by lengthened median emergence dates. A significant wall effect (personal observation) may explain why
there was no significant decrease in oxygen levels in the effluent flow from the incubators. Oxygen saturated water passing along the incubator wall and out the outlet would not be a true representation of the oxygen levels experienced by the eggs and alevins within the substrate. The high quality water available to the naturally spawned eggs and alevins, combined with very low embyro densities, would work additively in increasing the developmental rate and allowing the most efficient yolk utilization.
Chemical parameters within the rearing substrate were tested during the winter of 1985-86. Two incubators were fitted with five 122cm (48in) perforated flexible tubes (Tygon Plastic B-44-3, 6.4mm I.D., 3.2mm wall thickness) . Placement was; one in the middle (15cm) and one three quarters (23cm) within the 30.5cm of coarse substrate, one at the junction of the pea gravel and coarse substrate, one in the middle of the 8cm layer of pea gravel, and a control tube placed underneath the false plate. Parameters tested were dissolved oxygen (YSI meter Model 57), pH (Hach Model 17-F) , carbon dioxide (Hach Model CA-23), and ammonia (Hach low range Cat#22669-00). Testing occured one per month during the regular hatchery inspection. Chemical parameters within the substrate did not significantly differ from either the control tube or the incubator outflow. It was concluded that meaningful testing of chemical parameters within the incubation environment was probably beyond the capacity of the test kits used.
Table 8 compares Gulkana egg seeding densities and water flow rates with other studies which present information on the quality of emergent fry from stream-side incubators. In order to compare these studies by a standard number (eliminate incubator size effects), egg densities and water flow rates have been standardized by volume of substrate material used in each study. These two numbers were then divided to attain a nonvolume density estimate of eggs/L/min. Even though other authors were not using sockeye, and some of the results may be attributed to the species and stock used, these studies present useful guideline information. Bams (1974, 1972) used eggs/L/min numbers one-third the density of the Gulkana production units and reported no difference between growth rates and yolk conversion efficiency between fry from gravel incubators and wild emergent fry stocks. Bams (1982) reported fry sizes were consistently larger from high flow units than low flow units, even though the egg density and flow rates convert to the same number of eggs/L/min. Bailey and Taylor (1974) used rounded river gravel substrate, and produced incubator fry which were smaller, emerged three days prematurely, and had decreased rates of development and growth when compared to natural fry, even when eggs/L/min were similar to Bams (1972, 1974) . Bailey et al. (1976) produced incubator fry which emigrated seaward two weeks earlier than creek fry, were three days premature in terms of kD, and were shorter but heavier than creek fry. Bailey et al. (1980) presented data for pink salmon which indicated that reduction in fry size and early emergence was caused by depletion of oxygen levels to less than 6 m g / ~ resulting from high loading densities (greater than
16,000 eggs/L/min) . Gulkana production incubators have the highest egg density per L/min of water flow per volume of substrate when compared to other authors, but the experimental incubators have the lowest (Table 8). Due to high flows available in the experimental units, it would not be expected that a loss of size and altered developmental rates would occur. Fry from the experimental incubators are similar in all aspects to the fry from the production units in terms of increased survival, altered timing, reduced size, and delayed rates of development and growth, even though they were at one sixth the egg density and flow of the production units. This supports a hypothesis that alevins migrated to the bottom of the coarse substrate after hatching and that actual alevin densities and flow rates within the substrate were dependent on void space. Densities and flows within production incubator substrates are probably contributing to the problems of premature emergence, and decreased developmental and growth rates, but based on the available data, unless sockeye salmon rates of development and growth are influenced to a much greater degree by decreased oxygen, and increased carbon dioxide and ammonia than pink salmon, there are other contributing factors. The ultimate test of any hatchery method is the adult returns. If the gain in survival during egg and alevin stages carries through to the adults, the hatchery method is fulfilling the desired goal. Since adult returns can not be compared from these treatments, evaluation of the potential hatchery contributions are based on what other authors have reported as adult survival ratios for similar experiments. The method of comparison involves a concept termed "gain ratiou. The survival of hatchery fish (SH) is divided by survival of wild fish (SW) at both the fry stage and for returning adult, thus there are two separate gain ratios (fry and adult) for each release. A small decrease in the gain ratio from fry to adult means the hatchery method was successful in producing viable fish, while a large decrease (greater than 50%) means that hatchery fish did not survive at the same rate as wild fish. Bams (1972) reported a decrease of only 1.16% between the gain ratios of fry (6.04) and adult (5.97) stages, even though hatchery fry at emergence were 2.17% shorter, 2.19% lighter and less advanced than wild fry by six days growth. Bams (1974) documented a 4.6% decrease in gain ratio of fry (3.63) and adult (3.46) stages, even though hatchery fry were 2.16% shorter, had similar weights, and fry emerged eleven days prematurely. Bailey et al. (1976) reported a 94% loss between the fry gain ratio of 9.4, and the adult ratio of 0.79. Fry were only 0 .l6% shorter, 2.8% heavier, and only three days earlier in development, but they emigrated two weeks earlier than creek fry. The hatchery gain ratio of 4.2 at the fry stage will likely be reduced at the adult stage due to hatchery emergent fry being 7% lighter, 2.8% shorter, emerging 3.4 to 13.4 days prematurely, and delayed emigration of at least nine days compared to natural fry. It is not expected that as severe a reduction will occur in adult survival as Bailey et al. (1976) reported, because their fry emerged too early and probably were limited by food availability. It is possible that a larger reduction in gain ratio may occur than what Bams (1972; 1974) reported due to loss of potential size, and decreased rates of growth and development, none

- -
Tablea. Gmaarison of egg densities and wdtw flow rates per imhtor substrate voluae u d in this study and by othw authon
Irrubator Substrate No. Eggd Water Flow No. Eggs I k r t b Species Size Substrate Volw No. 3 o f Flow (Lhin (eggsper
(11 (a31 Epgs substrate ( U ~ i n ) per dl Uain)
Present sockeye 1.2~2.4~1.2Round 6r 0.86 SOOaK) 5813% 75 87 6667 grdy (production) RquIar 6r
Plastic
(experi.ental1 hgular 6r Plastic
b i l q pink .3x.3x.3 .pave1 0.015 1600 1 W 0.8 53 2000 ct all380 0.015 MOO 0.8 53 8000
0.015 12800 853333 0.8 53 16000 0.015 25600 1 7 M 0.8 53 32oCO
-Sum pi* l.hl.81.2 gravel 1.25 150004 1W 75 6.0 XlOO d al 1976
Etule/ ad pink 1.2xO.91r0.91 Round Er 0.57 112200 196842 56 98 2004 Taylor 1974 0.51 !3600 %Q3S 20 49 1914
0.76 56100 73816 28 37 2001 0.76 112100 l47W 56 74 2GC2
Sms pink l.ZxZ4wl.2 Rngular 6 2 3 80000 34783 35 15 22B6 1 . 4
PYE pink 1.2xZ4x1.2 hgular 6 2.3 75000 32€G¶ 35 15 2143 m
of which appeared in Bams research. A reduction in the gain ratio of between 10% to 30% at the adult stage is probable (adult gain ratio of 3 to 4).
The rearing media for sockeye alevins must take into account biological effects, initial cost, availability, ease of cleaning, and ease of handling. The continued use of a heterogenious mix of igneous rounded river gravel in the size range of 12.5mm to 37. 5mm, is recommended. Three substrates were tested; round gravel gave a median emergence date most similar to that of fry reared in natural substrate. Initial cost at the factory for plastic saddle substrate is 30 times that of gravel substrate delivered on site. Even though gravel is heavy and awkward to handle, the amount of time necessary to clean a plastic saddle substrate incubator is usually longer due to dead egg material which adheres to small holes and edges of saddles. Mechanized methods for cleaning gravel are being be be developed which would be economical, practical, and less labor intensive. Bams and Crabtree (1976) did not recommend round river gravel in the single 19mm size because alevins tend to fall through the smooth passages and accumulate in high densities at the bottom of the incubator. They suggested, as did Bams and Simpson (1977) , homogeneous sized crushed gravel (19mm-38mm) for ease of sorting and maximum void space. They suggested the flat surfaces and exposed ridges would aid the alevins in retaining their preferred upright position. Bams and Crabtree (1976) did suggest that rounded gravels might be used if finer material were added to fill the larger interstitial spaces. The increase in void space of 6.6% from rounded gravel to crushed gravel influenced fry behavior enough to cause a two day delay in median emergence time from that of fry reared in rounded gravel. Smaller crushed gravel could be added to fill in interstitial spaces of the crushed gravel used in this study to reduce the amount of void space. Shumway et al. (1964) found that a mixture of large and small glass beads (porosity0.3) produced the largest fry when compared to fry reared separately in cylinders containing homogeneous large or small beads (porosity 0.4). Their explanation was that increased mean velocities around the embryo magnify the decreasing porosity, providing a more favorable growth environment. Additional reseach needs to be done to determine if low oxygen levels and/or metabolites are indeed the causes of the decreased developmental rates observed in the Gulkana Hatchery incubators. Immediate concerns are to decrease the possible wall affect within incubators, and determine the proper combination of fish density and water flow which will not significantly effect the rates of development and growth.
Evaluation
The ultimate proof of any hatchery method is the adult return. If the gain in survival during egg and alevin stages carries through to returning adults, the hatchery method is fulfilling the desired goal. Evaluation of hatchery contributions to mixed stock fisheries requires application, recovery and evaluation of "markedM
hatchery fish.
One of the first questions to be answered in an enhancement program is whether or not the project is producing adult returns commensurate with fry releases. Separation and identification of the stock in question is necessary for adequate evaluation. Due to the large number of natural spawners at the hatchery springs this was not possible. The question was addressed and answered by the introduction of 100,000 fry annually into Ten Mile Lake on the Denali Highway, from 1974 to 1979. Ten Mile Lake is a tributary lake to the Gulkana River system. Tenmile Lake and Hungry Hollow Creek are biologically, geographically, and climatologically similar to Paxson Lake, the natural rearing area, yet contained no sockeye salmon. A ground survey in 1978 documented at least 284 adult sockeye salmon within the Hungry Hollow drainage of Ten Mile Lake. This represented an actual spawning ground return of 0.3% of fry released into Ten Mile Lake in 1974 (Roberson et a1 . 1980). This confirmed expectations that enhanced fry to adult survival was probably near 1% when accounting for fry transport loss, adult straying, and commercial, subsistence, and sport harvests. In addition, aerial surveys documented sockeye salmon returns to Hungry Hollow drainage between 1978 and 1982, the counts were 232, 500, 250, 25, and 440 (Copper River Stream Survey Catalog, unpublished data) . The Ten Mile Lake study provided a positive answer to whether or not Gulkana Hatchery fry were surviving to return as adults.
One of the next questions which had to be answered for Gulkana Hatchery was llCould sockeye salmon be cultured on a production scale in the face of IHNV1l? Washington, Oregon, and California had tried intensive sockeye culture but had given up as a direct result of disease problems. Canadian researchers in British Columbia worked almost exclusively with spawning channels to enhance sockeye salmon production.
IHNV Investiqations
Background:
Although it was well known by the early 1970's (and long before) that diseases were a serious threat to salmon culture, the magnitude of potential disaster that IHNV presented to the culture of sockeye salmon was as yet undefined. The first known problems that Alaskan culturists had with IHNV occured at Kitoi Bay Hatchery in 1973 and 1974 when both years of sockeye salmon production were eliminated due to the disease (20k and 950k respectively) . In 1979, Big Lake Hatchery lost its entire years production of 10.4 million fry to IHNV. Tragedy struck statewide in 1980 when Kitoi Bay, Big Lake, and East Creek Hatcheries lost a combined total of 10.4 million fry. Based upon current, at the time, (1980-81) knowledge of IHNV disease control research a Sockeye Salmon Culture Policy was instituted statewide in May of 1981. The culture methods contained in the policy have contributed to controlling
outbreaks of IHNV in Alaskan sockeye salmon to acceptable levels of loss (i.e. 10% or less) with few exceptions. A paper by Saft and Pratt (1986) reviews and summarizes the effects of IHNV both before and after institution of the Sockeye Salmon Culture Policy.
Beginning in 1976, disease history samples for Gulkana Hatchery sockeye salmon stocks were collected annually from both broodstock and emergent fry until 19xx. Broodstock sampling was done not only to monitor the prevalence of IHNV in the population but also to answer fundamental background questions. Was there a relationship between broodstock IHNV prevalence and the number of IHNV outbreaks each spring? Was there an increase of IHNV in broodstock fish later in the season, i.e. does horizontal transmission increase with time of exposure to the virus?
Given that IHNV could be detected and quantified in the ovarian fluid, the question of the male role in vertical and/or horizontal virus transmission remained. Male involvement in virus transmission became a greater question when the facility continued to have viral outbreaks while the best disinfecting techniques were followed. It was theorized that perhaps male sperm carried virus particles inside the egg where they were not effected by external measures. A reliable, cost effective, quantitative measurement, of the viral content of the seminal fluid was needed.
A second component of disease evaluation is documentation of outbreaks. Havinq had IHNV outbreaks all but one year since 1983, considerable effort has been spent attempting to correlate broodstock screening data and/or other information, in order to prevent or reduce future outbreaks.
Materials and Methods:
In nearly all cases, 60 ovarian fluid samples were collected to document annual variation and/or address specific research questions. Depending on the year, female fish were either sampled when "ripeu (eggs expressible and ready to spawn) or "post" (having a flacid abdomen with eggs already spawned or few remaining). Males were sampled when "riper1 (sperm expressible and ready to spawn). Post-spawner samples were collected from fish other than those used in the egg-take. "Ripen fish samples were collected from fish used in the Gulkana Hatchery production egg take, where their eggs and sperm went into the incubators (unless noted otherwise) .
On sample days, gonadal fluid was collected by stripping about 60ml of eggs/ovarian fluid or 5ml of milt into a paper cup. Ovarian fluid was decanted off the eggs into centrifuge tubes. Milt was poured directly into the tubes. Samples were stored with ice and transported to the F.R.E.D. Division fish pathology laboratory in Anchorage. Fish pathology staff performed all assay work. All samples were either refrigerated and assayed within one week of the sample date or frozen at -80C for less than two months prior to thawing and assaying. In 1976, virus samples were sent to the
National Fisheries Research Center, U.S. Fish and Wildlife Service, Seattle laboratory for inoculation of cell cultures. Virus presence was determined by plaque assay from 1977 through 1979. From 1980 on, virus titers were determined by the plaque-quantitative assay. Inoculation, incubation, and staining procedures followed those published by Burke and Mulcahy (1980) and Burke and Grischkowsky (1984). Male tissue (liver and spleen) assay was performed as reported by Fried (1984). In 1986, seminal fluid was either untreated or sonicated, then centrifuged and assayed for virus. Seminal fluid in 1987 was either centrifuged to remove spermatozoa and the supernatant titrated, or after centrifuging, the spermatazoa pellet was washed with deionized water, then centrifuged and the second wash titrated. In both years virus was evaluated by the plaque-quantitative assay on EPC cells at 15C.
To quantify the probable horizontal virus transfer from water to fish, two water samples were collected and assayed, one each from the male and female static water holding tanks (approximately 0.9x0.9x0.3m). The water was of poor quality, being contaminated with slime, blood and milt or eggs. The water had been in use for at least 1.5 hours, holding fish prior to being checked for ripeness.
Prior to 1981, hatchery fry were assayed only when fry from an individual incubator exhibited abnormal signs of behavior or survival. From 1981 through 1984, fry were sampled randomly from incubators prior to release from the hatchery. Due to an IHNV outbreak occurring during 1984, after pre-release samples had cleared hatchery fry for release, it was conceded that random pre- release inspections were of little benefit in detecting IHNV. Since 1985, only fry exhibiting abnormal behavior or those in question, were sent in for viral assay. Fry for viral testing were selected randomly from an incubator and bagged separately in groups of at least five. If fry from an incubator were exhibiting disease symptoms, samples usually consisted of at least five moribund fish and five live fish bagged separately. The sample fry were transported with ice to the F.R.E.D. Division fish pathology lab in Anchorage. Whole fish samples were homogenized, centrifuged and antibiotics added to counter microbial contamination, then processed either by traditional viral assay or viral plaque assay.
Results:
Ovarian samples from 1976 through 1982 showed an increase in virus incidence. Both the 1981 and 1982 samplings were acquired late in the egg take season and contained the highest incidence levels recorded for Gulkana broodstock. This information, plus the fact that the first viral outbreak at Gulkana occured in eggs taken late during brood year 1982, led to a hypothesis that viral incidence increases with time in the run. Secondly, to determine if horizontal transmission of the virus was greater in a population which had the ripe adults removed consistently, or in a population in which the adults spawned and died naturally, both the incubator
spring and the upper spring were sampled on three occasions; designated early, middle and late. Based on t-test statistics there were no significant differences between the two locations. The t-test did indicate a significantly higher incidence (Pe0.01) at the upper spring for the early versus late sample and the incubator spring for the early versus middle sample.
In 1984, viral samples were collected from post spawners while in 1985, samples were collected from ripe fish. Both years produced similar results, in that mid-run sample incidence (68% and 49%) was significantly lower than late sample incidence (98% and 83%, Table 9). The four viral samples collected (middle to late egg take timing) for brood year 1986 did not show any empirical significant differences in the incidence or titer distributions between any of the sample dates (Table 9). In 1987, four ovarian samples collected from early through late broodstock timing, indicated no apparent run timing or IHNV incidence level relationship existed (Table 9).
In 1986, a relatively high prevalence of IHNV was detected in the tissues of the male fish but was not detected in either the untreated or sonicated seminal fluid from the same fish (Table 9). The results from 1987 (10/13 and 10/14 were grouped) were dis- similar, the prevalence of IHN virus detected in the tissues and supernatant were similar (15% and 13% respectively), while that of the sperm wash was considerably higher (35%) . The results from corresponding tissue and milt (supernatant or sperm wash) were not always the same for individual fish. Of the 27 positive fish, three were positive in the tissues only, 17 were positive in the milt only, and only six were positive in both the tissues and milt. The minumum level of detectability was lower in the seminal fluid (1x10' P F U / ~ ~ ) therefore it isthan the tissues (1x10~ P F U / ~ ~ ) , expected that more positives would be detected in the milt than the tissue, if similar quanities of virus were present in each. Even though this does account for some of the difference in prevalence it does not account for fish with high titer milt and no virus detected in the tissue. Of the 23 positive milt samples, six were positive for both the supernatant and sperm wash, while two were positive in the supernatant and 15 were positive in the sperm wash only. Viral titers were generally higher in the sperm than in the superanatant (Figure 16). This implies that the wash method is successful in separating IHN virus from the sperm. The viral titers found in the static water holding boxes were low and identical 1.1~10~.
Despite institution of the Sockeye Salmon Culture Policy, the first documented case of IHNV in Gulkana emmigrant fry occured in 1983. Table 10 documents fry samples and results from the Gulkana Hatchery. The number of fry lost to IHNV annually increased, until 1987 when the trend was reversed (Table 4). Despite estimated fry losses of between 2.5% and 9.6% to IHNV, the release of healthy fry has exceeded 74% in all years that an outbreak has occured (excluding 1988 when survivals were compromised by low water flows). Empirical detection of a viral outbreak in an individual

mar;in C V i T 1XI
w.ir;in
G V ~ ;UI
war :in
07x:irl
m a r i a
ovirian 0Sil.l iQ ov2i u; m z i a
E x i yn;,cde Late
-!C€o*cr - - - -
mariXI wxian
ovaria.. war:an
ovarim Kiddie o w l a n war1an maria
La:e,EiddleEaAy,Late
b t e
o w ian ovar~a
k r l yWdle
war1 an Late, hiddle ovaria Late
war1an o v a r i a
Earlyhdd le
cv3i at; CYar:an
Lite, WiCe k t e
Rip 22 1
2 E + H 2 'E'H
l.=Edl 8.$!+a
76.7 3.3
13 1 .
X.5 S # t
1 2 . 2 ~ ~ 4e . w a 3.2 m.e Ripe 1
3 3
9 . 3 . 1 -l.bE+M 1.3E+P 1,844 !.3i+d
76.8 1P.8 18.0
1;3 3
76.2 :Wb [email protected]
EE3R
82377
1C113/87
18/14/87
38 livw,spleen T i m e s ~ i n a l Superratant ~ ~ ; l r d l c.asR
58 likrr,splfen Tissce s a 1na1 S~cematant sssiral S3em u a h
Rip
Rip
2 5 7 7 2
14
3.4Etd5 l.E-ed
1 . 3 0 4 2.:~+94
2 . 9 E a 9.@E+El
3.EEtN 4 .9~b l
6.7 16.7 8 . 3 23.31e.e 45. 7
2 0 1 5 Q 0
1W.0 e.2
14.2 71.4 e.8 & a
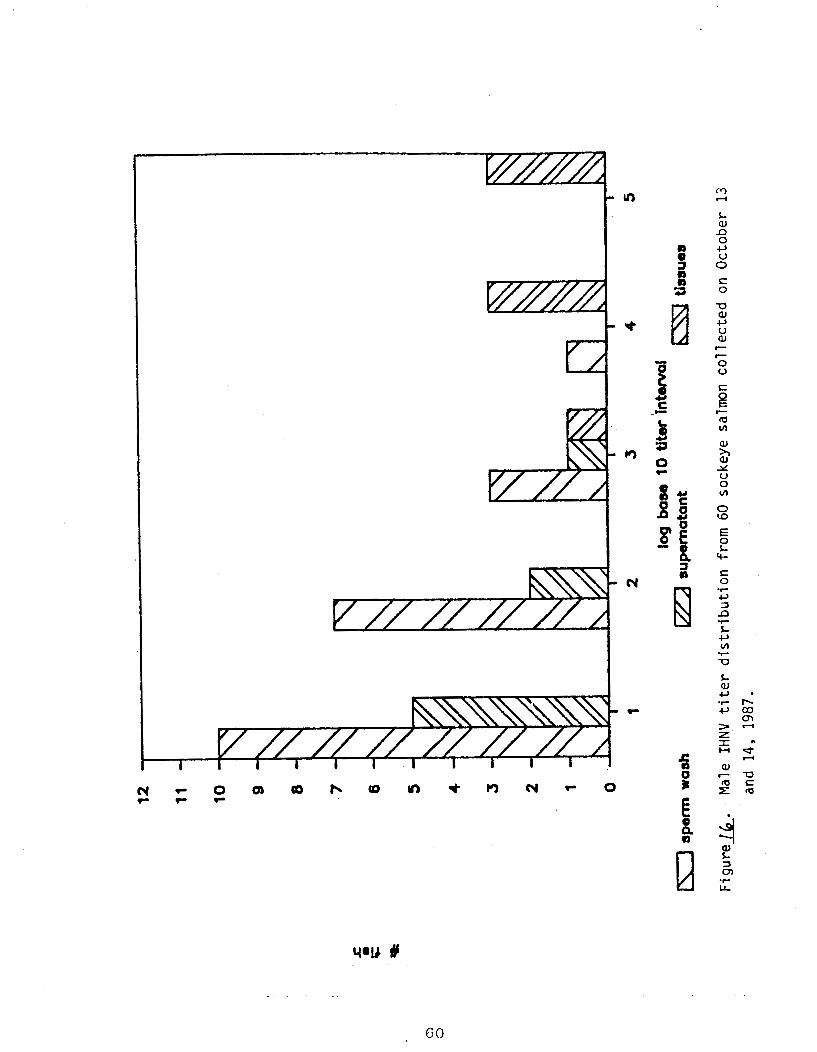
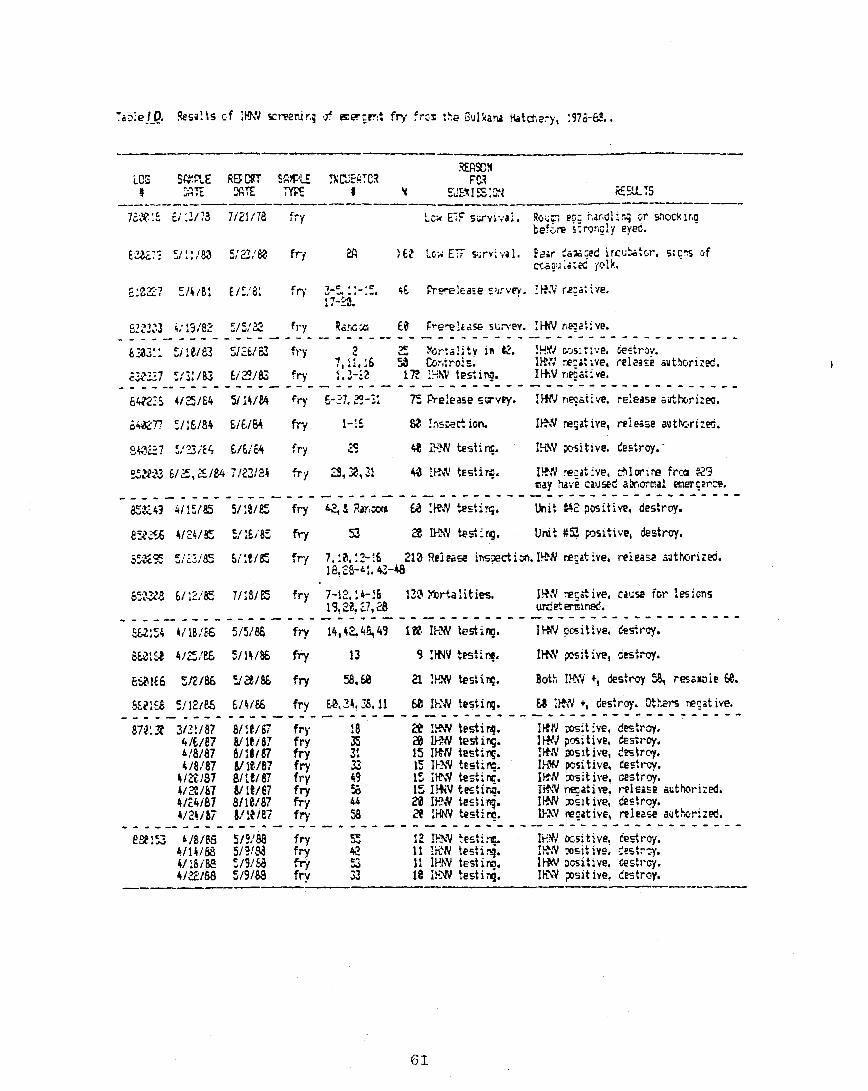
:;::/a5 5iW& fry 7, :a, :?16 213 !?eip;lse imzct in. IEN wqzt ive, reiea2 ;;lthm:w.18,Eb-t:. 42-48
incubator has improved each year. Signs which indicate an outbreak may be occuring include; early emergence (both in time and in numbers), emmigrants are underdeveloped (yolk sac fry) , swimming behavior is abnormal (includes clumping at the bottom of the collection box, floating with head up and tail down, swim or react sluggishly), a 1% to 10% daily mortality, a dead fish smell around the incubator, and hemmorrhaging of anal vent or peduncle.
Attempts to find a clear causal relationship for IHNV outbreaks in emergent fry have failed. Issues examined have been; incubator substrate, egg take location, Iodophore treatments, and egg loading density. The only relationship which seemed to imply cause and effect was that outbreaks occurred only in units where eggs were taken in the last half of the season. This relationship has been weakened considerably since 1987 when outbreaks have occured in units loaded during the first half of the egg take season (Figure 17).
Discussion:
The viral research conducted on post spawning fish (1976 to 1984), had two major flaws. First, the definition of post spawners was not sufficiently specific, a wide range of fish conditions from just spawned-out to barely alive could span up to eight days for any given fish. Secondly, the incidence reported from post spawners was not representative of the virus levels present during the egg take or what was entering the hatchery via the "ripelf gametes. Beginning in 1985, virus samples were collected from "ripe" fish, preferrably those whose gametes were entering the hatchery because the viral results were less variable (narrowed sampling time span, maximum two day period), and representative of the viral incidence within the hatchery (prior to disinfection procedures) .
Two hypotheses addressed at Gulkana were; 1) did incubator spring broodstock have a lower incidence of IHNV than a broodstock which did not have ripe individuals removed (i.e. exposed to more virus from the dead and decaying carcasses) , 2) did broodstock used later in the egg take season have a higher incidence and/or titers of IHNV. Ovarian samples collected during the fall of 1983 represented the first attempt to address these hypotheses. Carcasses were continually culled from the Egg Box Spring while carcasses were allowed to accumulate in the Upper Spring. Ovarian samples were collected three times, representing early, middle, and late run timing. Lack of significant variation between the two locations over time indicates that the amount of horizontal transmission, even in streams loaded with carcasses, is not detectable. Additional evidence that horizontal transmission of the virus is probably not significant, was the low titer levels found in the static water holding containers. As the evidence does not support the hypothesis that removal of ripe fish and/or carcasses decreases viral incidence in the remaining broodstock, remote locations can be used for broodstock collection without undue fear of higher IHNV contamination than already present in the
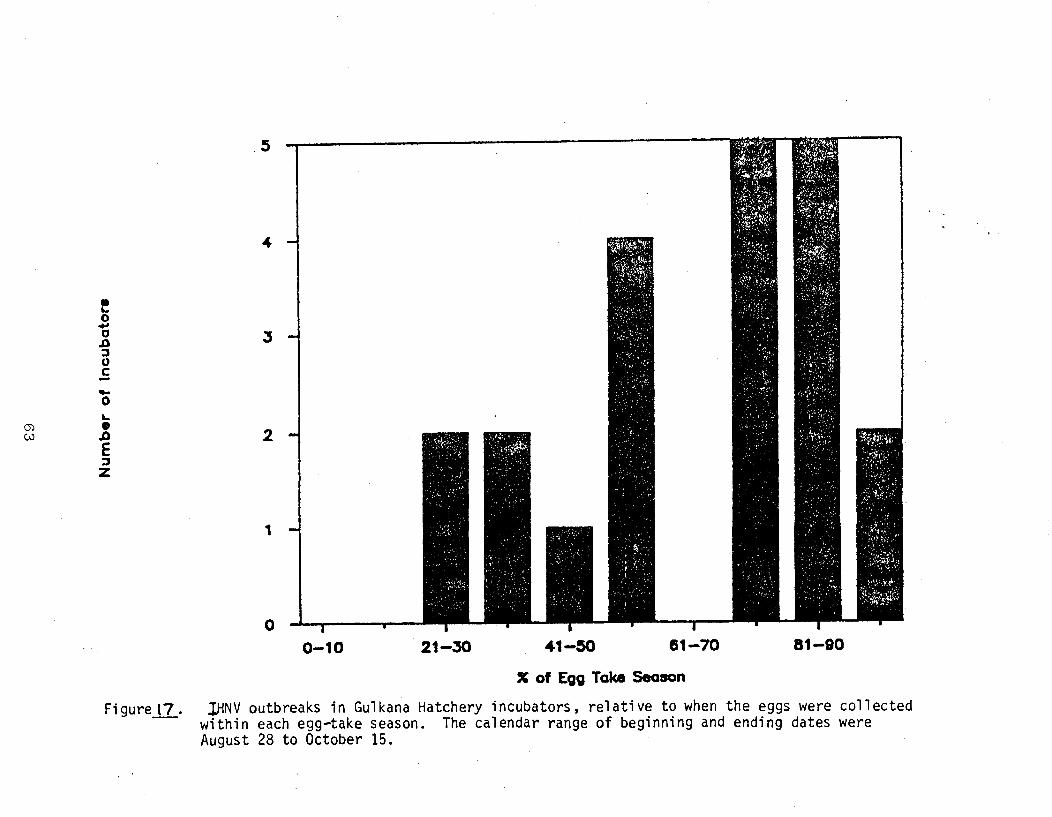
0-10 21-30 41-50 61-770 81-90
X of Egg Taka Soason
Figure=. P N V outbreaks in Gul kana Hatchery incubators, relative to when the eggs were collected within each egg-take season. The calendar range of beginning and ending dates were August 28 t o October 15.
hatchery broodstock.
The 1983 non-significant relationship between virus and time was later questioned due to sample collection occuring from post spawners - which did not represent viral exposure in the hatchery (ripe fish). The non-significance between locations was probably valid due to post spawner incidence and titers being maximal in post spawners. Subsequent sampling of ovarian f1ui.d~ from ripe females during 1986, 1987, and 1988 did not support the hypothesis that viral incidence or titers increased with time. Based on IHNV outbreaks in emergent fry, there is some evidence that eggs taken later in the egg take season have a higher probability of experiencing an outbreak, yet no relationship between viral incidence or titers has been established.
The role male gametes play in exposure of green eggs to virus particles is presently being developed. One possible explanation for the difference in viral detectability for the male tissue and seminal fluid samples could be that the virus bound itself to the sperm cells making it undetectable. The 1986 milt samples were frozen prior to processing while the tissue samples were frozen in 1987. Even though freezing can reduce viral titers (approximately one log), the variations in prevalence were large enough that differences in handling are an unlikely cause. Based upon two years of sampling, it appears that there can be large variability in IHNV detection in either tissue or milt, between years. The detection of IHNV in the sperm wash appears to be significant enough so that it is the sample of choice when evaluating the viral contribution of the male. The sample can be collected and processed easily, and apparently a fair representatioin of the amount of virus to which the progeny are exposed from the male parent.
Controlling the vertical and/or horizontal transmission of IHNV has been addressed in a variety of ways. One theory is that the virus is "set off" by some sort of stress to the eggs/alevins. This theory has been examined but no likely canidates have been identified. It is possible that a viral outbreak depends on a "combination" of a high titer female and high titer male, which may explain the random case history to date. Currently no one knows what causes an outbreak of IHNV. It appears clear that using careful egg take techniques, iodophor disinfection, and compartmentalization, IHNV can be contained to a production loss of less than 10%.
Limnolosical Evaluation
Background:
One of the reasons that early hatcheries (1891 - 1935) failed with sockeye salmon culture in Alaska, was the lack of understanding of the fishes life cycle, specifically the typical one year freshwater residency. Since lake ecosystems are complex mosaics of physical, biological and chemical pathways, it is irresponsible not to
monitor the changes which a production enhancement effort will cause. It is imperative to consider and evaluate the rearing capacity of the nursery lakes as an extension of the hatchery program.
Between 1983 and 1985 Prince William Sound Aquaculture Corporation conducted extensive baseline Copper River lake investigations under contract with the Alaska Department of Fish and Game (Barto et al. 1984; Barto et al. 1985; Pellissier et al. 1985; Pellissier and Sommerville 1987). These studies reported inventories and identified lake candidates for possible stocking and/or enhancement projects.
Materials and Methods:
In 1980, permanent limnological station locations were chosen for Paxson Lake (Figure 18), Summit Lake (Figure 191, and Crosswind Lake (Figure 20), based on bathymetric profiles. Annual sampling varied per lake but was scheduled for spring overturn, summer stratification, fall turnover and mid-winter. Summit Lake has received the greatest sampling effort, as it was under consideration as a fertilization candidate. Paxson Lake received less sampling effort as it was being monitored for baseline limnological changes and was not a fertilization candidate. As production has increased, identification of additional rearing area has become a necessity. Crosswind Lake has been chosen to fill this role thus baseline limnological data was collected on a sporatic basis (due to access cost). Routine field-sampling techniques conducted at each lake involved collection of water samples, profile measurements of temperature, dissolved oxygen, light penetration, Secchi-disk depth and vertical zooplankton tows. Field and laboratory methods followed those published by Koenings et al. (1987) .
Results :
At present, the complete sample analysis has not been finished by the F.R.E.D. Division Limnology Laboratory in Soldotna. Preliminary results of Paxson and Summit and Crosswind Lake limnological investigatons were prepared by Kyle et al. (1992).
Discussion:
Based on the results from intensive limnological sampling during 1981 and 1982 for Summit Lake, the best estimate of probabl rearing capacity was at least 12 million fry annually, with a maximum of 16 million (Koenings personal communication). The incremental increase of annual fry introductions into Summit Lake and the corresponding estimated survivals and smolt age, length and weight data have lead to the determination that optimum rearing capacity of Summit Lake (without fertilization) is significantly lower than first estimated and that annual stocking levels should be reduced even with the nutrient input resulting from returning adult carcass decay.
Sta t i on Depth (m)
Figure 18. Paxson Lake 1 imno log ica l sampling s t a t i o n s .
Figure 19. Summit Lake 1imnologica l sampl ing s t a t i o n s .
Figure 20. Crosswind Lake 1 imnological sampl i n g s ta t i ons .

Summit Lake Smolt Prosram
A second phase of evaluation of enhancement projects is estimation of the enhanced stock contribution to various user groups. In a mixed stock fishery it is imperative that not only the number of fish be estimated but also the run timing be established. Application of some type of mark prior to the fish entering a mixed stock environment is neccessary in order to achieve this goal.
Background:
Summit Lake (Gulkana River) was selected as the study site for the second phase of hatchery evaluation. This decision was based upon aerial surveys, limnological data and transportation costs. Aerial surveys of Summit Lake and tributary stream, Gunn Creek, confirmed that only a very small indigenous stock of spawning sockeye salmon, which would produce negligible numbers of smolt. Limnological studies beginning in September of 1980, estimated fry to smolt rearing capacity of Summit Lake to be in excess of 12 million fry (Koenings, personal communication). As the rearing capacity of Paxson Lake was reached from on-site fry releases, hatchery fry production could continue to expand with releases into Summit Lake. Summit Lake is located 4.8km north of the hatchery and accessible from the Richardson Highway, thus fry, smolt, and adult escapement program costs are associated with primarily with highway vehicles rather than aircraft (Figure 21) . Marking 27.5mm emergent fry at the hatchery with half-length coded wire tags was not an option at the time the marking program began. The technology was available for marking emigrant, thus began the mixed stock evaluation. Fry were transported from the hatchery to Summit Lake during 1980 and capture of emigrants began the following spring (1981). Smolt were marked with full-length coded wire tags. An intermediate goal of the Summit Lake stocking program was to determine fry to smolt (FTS) survival. It was hoped that documentation of FTS survival, in conjuction with emigrant size information, would produce a database for enhancement projects in other large interior Alaskan oligotrophic lakes.
Materials and Methods:
Prior to each seasons smolt activity, a temporary 3.6x3.6m building was erected to shelter crew and equipment during the season. Smolt were captured for enumeration and marking using a fyke-type tunnel net with attached live box and tapered wing sections, deployed at the outlet of Summit Lake. Net spectifications and configuration of the deployed capture net in relation to the lake outlet and temporary building are shown in Figure 22.
It was hoped that it would be possible to evaluate FTS survival in conjunction with the CWT program. The survival estimate would be calculated from the known number of fry transplanted and from counting emigrating smolt from Summit Lake. The capture trap was manned prior to smolt movement in the evening and ended after smolt

Figure 21. Gulkana Hatchery in relation to Sumit Lake, Richardson Highway, Gulkana River, and Gunn Creek.
- 7 0
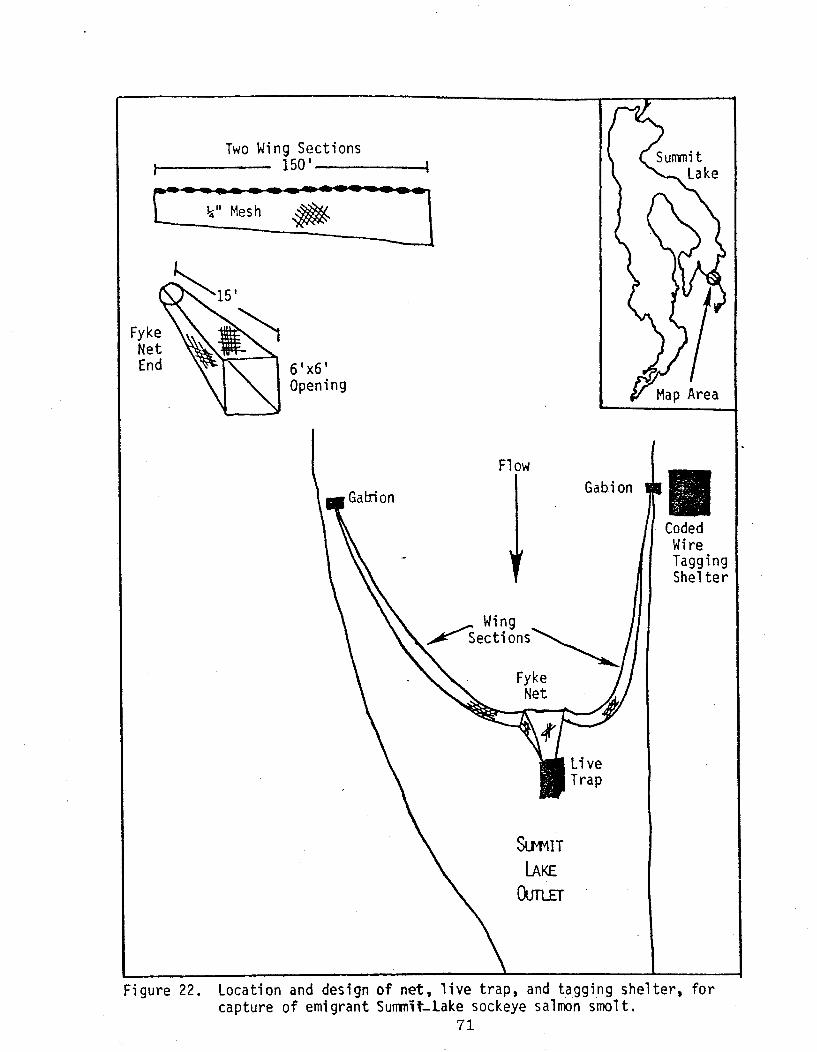
150'-1
r
ITwo Wing Sections r-
&I1 Mesh&
6 ' x 6 ' Opening
C
- -
Coded Wire Tagging She1 t e r
Figure 22. Location and design o f net, l ive trap, and tagging she1 ter , for capture of emigrant Sumnit-Lake sockeye salmon s.ml t.
71
emigration stopped, usually between 2200h and 0400h. The evening crew counted emigrants and collected smolt for coded wire tagging the following day. Smolt were counted individually or volumetrically using a graduated 19L bucket and counting subsamples. Smolt to be tagged were transferred to a net pen, while smolt in excess of daily tagging needs were released downstream after being counted. Discontinuation of the seasonal count program after 1985 allowed shifting of effort. to increased tag application, and expansion of baseline AWL sampling.
Coded wire tags were applied from 1981 through 1986, suspended during 1987 and 1988 due to budget cuts and resumed in 1989. Marking of smolts with coded wire tags followed the standardized procedures authored by Northwest Marine Technology, Inc., Moberly et al. (1977) and Koerner (1977). Tagged smolts were transferred to a second holding pen and held until 2200h. Before tagged fish were released, mortalities were counted and removed. During the first three years of tagging, tag retention samples were not collected. Tag retention was assumed to be 100% for 1981, 1982 and 1983. Tag retention samples collected from 1984 through 1993, with the exception of years when no tagging occured, ranged from 83 to 100 percent. Fish were released lOOm downstream from the capture net in order to minimize the potential for recaptures.
Prior to the 1986 field season, smolt age, weight, and length (AWL) data was collected from fish mortalities due to trapping and tagging operations. To improve the sampling procedure, since 1986 samples were collected from separate days throughout the field season for AWL in£ ormat ion. At 30, and more recently 100, randomly selected smolt from the daily tag lot were sampled. Condition factor for each smolt was calculated using the following formula:
Budget cutbacks which eliminated application of CWT1s in 1987 and 1988, did not prevent collection of smolt AWL samples.
Results:
Operations were only partially successful the first season in which smolt capture and tagging was attempted. The smolt net was operated from June 15 to July 9th during the 1981 field season, capturing 2,421 smolt and applying 1,301 valid CWTts.
During the 1982 field season, greater success both in capturing and tagging was achieved. The net was operated from June 15 through June 28, capturing a total of 67,496 and tagging 18,432 smolt.
In 1983, a total count of emigrant smolt was attempted. The net was deployed earlier than previous seasons, beginning June 3 and operated until July 1. Unfortunately, the net was not placed early enough to capture the first emigrants and there was a four day period from June 18 to June 21 in which the net was tied up and not

fished. Total smolt capture was 80,372 with 18,360 valid tags applied.
During the 1984 field season, the most complete capture of smolt was accomplished due to a later spring which allowed capture of the largest number of smolt emigrants since the CWT program was initiated. The net was installed May 31 and removed July 6. Capture totaled 381,340 smolt and of those 19,208 were tagged with valid CWT1s. Smolt emigrants appeared to follow a bimodal pattern with the first peak related to water temperature reaching 40C and the second peak possibly related to water temperatures increasing to 80C. A single dye marking experiment to determine net efficiency was conducted between June 25 and July 4. A total of 830 smolt were dyed with Bismark Brown Dye and released 0.8km upstream from the net on June 25. A total of 101 dyed smolt were recaptured between June 26 and July 4, for a net efficiency of 12%. It is unlikely that the net efficiency was that low. Possible explanations are; that dyed smolt were released too far upstream and returned to the lake and/or delayed until the dye had faded to migrate, they may have experienced a high mortality due to predation or other dye related causes. Handling and transport may have caused undetected mortalities as well. Personal observation of net capture efficiency (when the net was fishing properly) appeared to approach 85 percent.
Installation of the smolt net in 1985 very likely missed a large percentage of early and late emigrants as indicated by the dates of deployment from June 10 to June 25 and water temperatures between 2.5oC and 4.50C. Smolt counted through the trap numbered 231,302 with 19,223 valid CWTrs applied.
Due to the large amount of time and effort expended for a smolt count and the limited success achieved, and also due to limited CWT recoveries in the commercial fishery from the 1981 and 1982 CWT releases, it was decided to shift resources from enumeration to application of a larger number of CWT1s. During the 1986 field season, the net was deployed from May 30 to July 1. During the 1986 smolt emigration 52,361 valid CWT1s were applied and relative smolt abundance noted. This was the first year in which the net was deployed before smolt emigration began. May 31 through June 3 had water temperatures of 0.5oC and no smolt were captured. As soon as the water temperature reached loC (June 4) smolt emigration began and appeared to follow the bimodal emigrigration pattern of the 1984 smolt data throughout the remainder of the season.
Smolt operations during the 1989 to 1993 seasons were similar to the 1986 season with 50-60,000 CWT1s applied each season and appropriate AWL data collected.
The goal of enumerating an entire smolt emigration was never attained due to budget induced manpower deficiencies, continual battles with water level and currents, net location, beavers, debris, and huge ice floes destroying equipment. The closest to achieving a complete count occurred during the 1984 season when
sampling occured 36 of the estimated 52 emigrant days and counted 94% of the extrapolated total of 404,624. In order to estimate FTS survival in years which only had limited daily samples, the 1984 emigration was smoothed by a moving average having a function order of one. The 1984 smoothed curve was used as the baseline emigrant curve having been partitioned into daily emigrant percentages (Figure 23) . Based on an 85% net efficiency, the total smolt emigration for 1984 would have been 466,520 for an estimated FTS survival of 10.8%. Other years smolt data were compared and expanded in order to estimate each years FTS survival. The year in question was shifted on the smoothed baseline using seasonal knowledge. For example, in 1985 the net was operated from June 10 to June 26, which translated into a sampling of 43.78% of the total run based on the 1984 smoothed curve dates of June 5 and June 19. Since 43.8% equaled 231,302 smolt for 1985 the total estimated run would have been addition of the remaining percent of the run, 56.2% ( 1 . 2 8 ~ ) ~ plus the number of smolt lost to net inefficiency. Based on expansion of the proportion of the seasonal catch according to the 1984 smolt emigrant smoothed curve and correcting for a net efficiency of 80% for 1981 and 85% for later years, led to the conclusion that smolt survival from Summit Lake has been between 8% and 14% for the years 1982 through 1986, while FTS survival was less than 2% for 1981. Table 11 summarizes emigrant smolt numbers, valid coded wire tags released, tag codes and estimated emigrants (based on bimodal curve model or fall fry hydroacoustic sampling) .
An important method for monitoring a rearing area is by documenting emigrant age compposition, length, weight, and condition. Table 12 summarizes the available AWL data for Summit Lake smolt samples >13, for 1981 through 1992. During 1981, the first year of coded wire tagging, smolt were collected for weight and length samples on a limited basis. On June 19 a large smolt mortality of 100 fish occured which provided the only reasonable sample for that season. Smolt were collected for samples much more intensively during the 1982 field season, with two large random samples (>go) collected on June 16 and June 17. Smolt samples collected during 1983 and 1984 did not have large samples because there were no mass mortalities. Fish for samples were collected from trap mortalities, fish sacrificed to check CWT placement, and CWT mortalities. Four smolt samples were collected during the 1983 smolt season with fish numbers ranging from 16 to 26. During the 1984 smolt emigration, four samples contained fish numbers greater than 13. In years prior to 1984 small numbers of large fish which were suspected age 2 smolt were noted but not retained for age analysis. In 1984, all fish retained for weight and length analysis were aged. A number of large smolt were retained for out-of-sample AWL sampling in order to develop age-length data.
In 1985, a mass mortality occured from which 185 fish were randomly sampled for length and weight. Also collected were three AWL samples with fish numbers greater than 13. In 1986, a revised sampling scheme was instituted so that fish were sampled randomly throughout the season. Smolt emigrant size roughly followed a concave pattern, with the first emigrates of the season being the
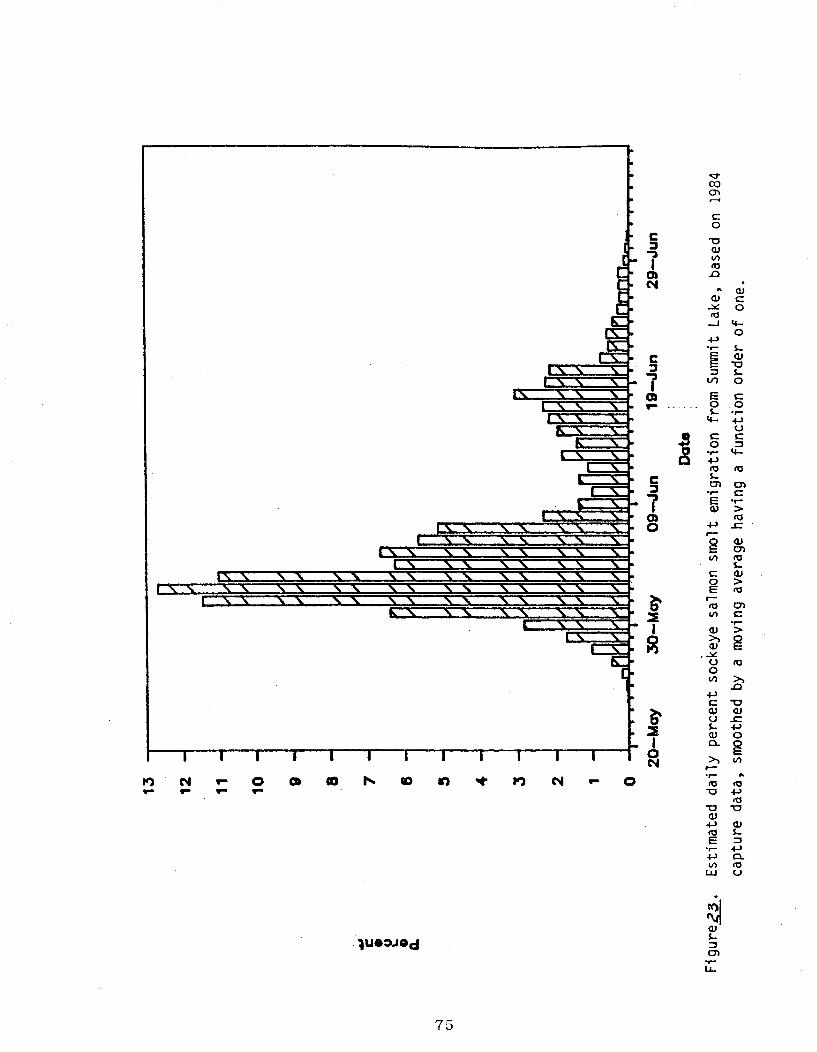
IJ See text fa birmdal est i~at icareths.
T a b l e 12. Sumnit Lake emigrant sockeye salmon enolt age, weight, and length ranples.
D A T E N Length (am) SD
Velght (g) SD K SD
X
Age .
1 X
Age 2
1987 Data Lost

largest, middle season emigrants the smallest, and later emigrants increasing in size (Figure 24) . Smolt size has been decreasing with increasing fry stocking levels (Figure 25). This observation is based upon the best available annual sample taken within four days of June 19, a period where samples are available for seven of eight years. An annual sample date of plus or minus four (4) days from June 19 would place the sample within the second peak of migration (according the the 1984 outmigrant model), and would place smolt emigrant size between the initial large size smolt and prior to significant size gain due to within year growth (based on Figure 24).
Discussion:
The extremely low FTS survival for 1980 fry is reasonable considering that it was the result of the first year of fry transport from the Gulkana Hatchery to Gunn Creek. Fish were transported in buckets from the hatchery to a stainless steel transport tank placed in the bed of a pickup truck. It is probable that transported fish underwent some degree of temperature shock due to filling the tank with water from Fish Creek which was colder than hatchery water, and a rise in temperature due to solar gain on the stainless steel tank. Tank water was oxygenated during the l4.3km transport. Fish were released from the tank 4.2m above Gunn Creek, with no temperature acclimation. This being the smallest of the Summit Lake fry releases (1.3 million), it was probably below the threshold level of predator efficiency, that is to say the lake trout (major fish predator) were probably very effective. Individually these items should not have decreased FTS survival significantly; however, together they appear to have been effective.
Consistency in transport methods from 1981 to 1984 appears to be reflected in the corresponding 1982 to 1985 FTS survivals ranging from 8% to 14%. Beginning in 1982, fry were transported in a smaller (0.28m2) plywood tank surfaced with fiberglass and gelcoat. The smaller 'tank size allowed usage of hatchery water to transport the fry because the smaller volume could be filled by carrying water from the hatchery to the highway in 19L buckets. This controlled the problem of water temperatures being either warmer or colder due to being from a non-uniform source. The wooden construction ofthe transport tank had better thermal characteristics than the larger stainless steel tank. Fry were still transported from the hatchery to the tank via buckets. Oxygen was added to the tank water via micropore tubing at a rate of 10~/min. Transport water was equilibrated to within 20C of Gunn Creek temperature before release. Instead of releasing the fish directly downward off the Gunn Creek highway bridge, the release of water and fish was directed horizontally over the surface of Gunn Creek, which separated the fish and water thus lessening the impact from the 4.2m drop. A fairly stable lake trout population is assumed thus the same number of fry mortalities can probably be attributed to lake trout each year but with increasing fry
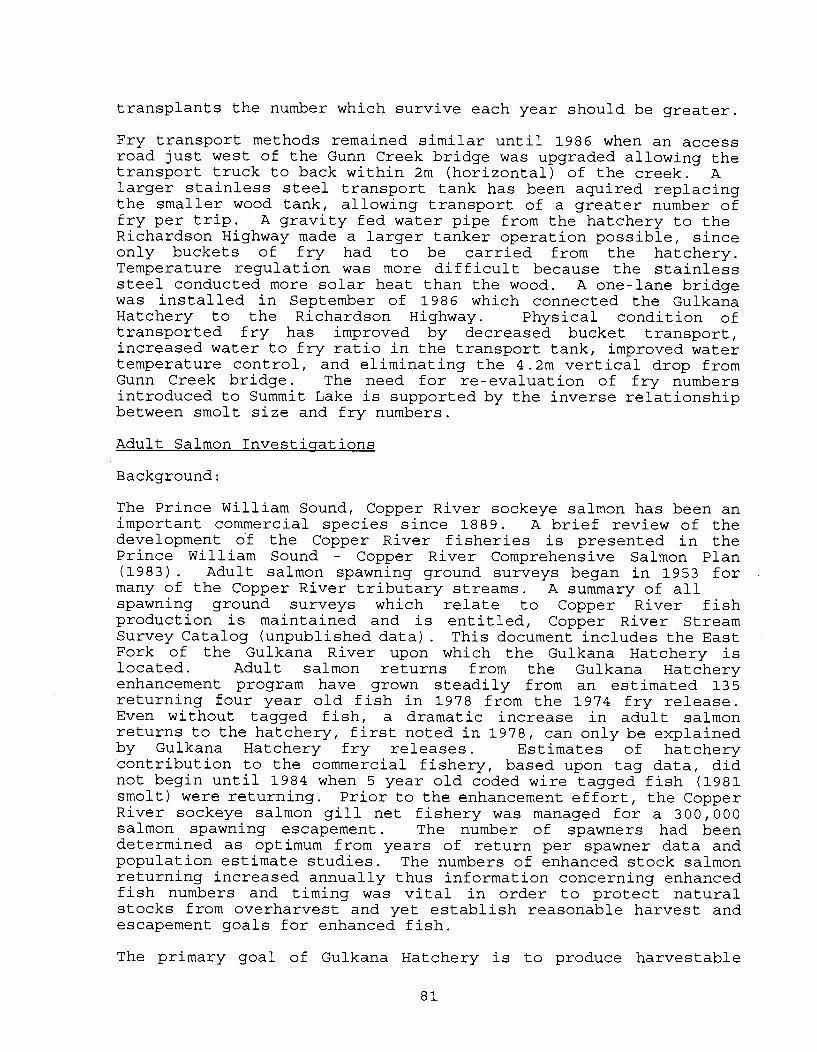
transplants the number which survive each year should be greater.
Fry transport methods remained similar until 1986 when an access road just west of the Gunn Creek bridge was upgraded allowing the transport truck to back within 2m (horizontal) of the creek. A larger stainless steel transport tank has been aquired replacing the smaller wood tank, allowing transport of a greater number of fry per trip. A gravity fed water pipe from the hatchery to the Richardson Highway made a larger tanker operation possible, since only buckets of fry had to be carried from the hatchery. Temperature regulation was more difficult because the stainless steel conducted more solar heat than the wood. A one-lane bridge was installed in September of 1986 which connected the Gulkana Hatchery to the Richardson Highway. Physical condition of transported fry has improved by decreased bucket transport, increased water to fry ratio in the transport tank, improved water temperature control, and eliminating the 4.2m vertical drop from Gunn Creek bridge. The need for re-evaluation of fry numbers introduced to Summit Lake is supported by the inverse relationship between smolt size and fry numbers.
Adult Salmon Investisations
Background:
The Prince William Sound, Copper River sockeye salmon has been an important commercial species since 1889. A brief review of the development of the Copper River fisheries is presented in the Prince William Sound - Copper River Comprehensive Salmon Plan (1983). Adult salmon spawning ground surveys began in 1953 for many of the Copper River tributary streams. A summary of all spawning ground surveys which relate to Copper River fish production is maintained and is entitled, Copper River Stream Survey Catalog (unpublished data) . This document includes the East Fork of the Gulkana River upon which the Gulkana Hatchery is located. Adult salmon returns from the Gulkana Hatchery enhancement program have grown steadily from an estimated 135 returning four year old fish in 1978 from the 1974 fry release. Even without tagged fish, a dramatic increase in adult salmon returns to the hatchery, first noted in 1978, can only be explained by Gulkana Hatchery fry releases. Estimates of hatchery contribution to the commercial fishery, based upon tag data, did not begin until 1984 when 5 year old coded wire tagged fish (1981 smolt) were returning. Prior to the enhancement effort, the Copper River sockeye salmon gill net fishery was managed for a 300,000 salmon spawning escapement. The number of spawners had been determined as optimum from years of return per spawner data and population estimate studies. The numbers of enhanced stock salmon returning increased annually thus information concerning enhanced fish numbers and timing was vital in order to protect natural stocks from overharvest and yet establish reasonable harvest and escapement goals for enhanced fish.
The primary goal of Gulkana Hatchery is to produce harvestable

adult sockeye salmon for various user groups. Estimation of the contribution to various user groups is based on recovery of coded wire tags in both the commercial fishery and on the spawning ground. A fishery manager can estimate hatchery contribution to mixed stock fisheries if total catch can be calculated for the individual fisheries and if for one fishery the percent of hatchery contribution can be estimated. Catch sampling is required in order to estimate hatchery contribution to a user group fishery. The commercial fishery user group harvest is the least complicated and least expensive to sample due to the large percentage of salmon harvested during a contracted time span and processed through a limited number of sites. Thus, the commercial catch is sampled in order to estimate hatchery contribution to the commerical, subsistence, personal use, and sport fisheries. In addition to commercial catch sampling, spawning ground recoveries of marked fish allow estimation of enhanced salmon contributions to various user groups as well as providing estimates of survival.
Materials and Methods:
The classic approach to estimating adult returns from hatchery production in a mixed stock fishery (when no mark recapture data is available) is assumption of a survival rate consistent with published literature. Studies documented by Foerster (1968) were used as the basis for assuming a freshwater survival rate of 10% from fry to smolt and an ocean survival rate of 10% from smolt to adult (1% from fry to adult). Returning adults were proportioned into the appropriate age class based on historical fish age class information from the Copper River (Appendix E).
When mark-recapture data is available, such as coded wire tag recoveries, calculation of survival rates, and fishery contributions are based on state-of-the-art data. Recovery of coded wire tagged fish from the commercial fishery occurred at canneries in Cordova and Valdez, Alaska. A random sample of the total catch was observed (averaging approximately 30%), and those fish with missing adipose fins were sampled for coded wire tags by cutting off the head and sending it to the F.R.E.D. Division Coded Wire Tag Laboratory in Juneau. A season summary from the tag lab allowed determination of the exact number of Summit Lake tags in the sample, the year the fish was tagged, date the fish was sold, and the number of fish sampled. Tagging at Crosswind Lake commenced in 1990 with the first return of 2-ocean adult sockeye in 1992.
Spawning ground recoveries of coded wire tagged fish were used to determine the tagged-untagged ratio estimation of the enhancement contribution to the fisheries resource. A weir at the outlet of Summit Lake was used to collect fish during spawning ground CWT recovery in 1984, while recoveries from 1985 through 1992 were ground surveys using dipnets. In all years the ratio of tagged fish to the number of fish examined was calculated. his ratio (i.e. tagged:untagged fish) was used as a multiplier to estimate total fish numbers when total tagged fish were calculated.

Aerial surveys were flown each fall with fixed-wing aircraft to record the number of spawners that were enroute to, or already on the spawning grounds. Aerial surveys were used an indicator of presence or absence and to record relative abundance as compared to prior years surveys.
Segregation of adult returns by category of harvest (commercial, subsistence, personal use and sport) was based on enhanced run timing data and the proportion of harvest occuring while the enhanced stock was present in the fishery. Commercial exploitation from 1984 through 1992 was based on the proportion of known commercial catch to total returns. In 1985, this relationship could not be used, without adjustment, because the commercial fishery did not fish during a two week period (July 3-16) when an estimated 38% (mean of four years in which fishing occured during this time) of the enhanced stock passed through the commercial fishing zone. Data for the time period was interpolated by distributing 96 "estimatedI1 tags between July 3 and July 16 (153 expanded recoveries for 62% of the season and 96 tags for 38%, see Appendix F) . Later years data support the interpolation effort.
Results :
Table 13 estimates total enhanced production from Gulkana Hatchery based on survival rates published in the literature.
In 1984, three adult fish from the 1982 tag lot were recovered bearing coded wire tags in the commercial fishery. In 1985, a total of 46 fish from the 1982 (95.7% age 5) and 1983 (4.3% age 4) tag lots were recovered in the commercial fishery. This recovery was lower than expected due partially to a 13 day commercial fishery closure in July, a time when approximately 38% of the enhanced stock was estimated to be migrating through the commercial harvest zone. The commercial exploitation rate can be corrected but the timing information must be interpreted realizing that the non-recovery of coded wire tag returns is a result of no fishing and not absence of tagged fish. In 1986, a fishery without extensive closures, saw the recapture of 76 tags from the 1983 (73.7% age 5) and 1984 (26.3% age 4) tag lots. In 1987, total of 85 coded wire tagged fish were recovered in the commercial fishery (3.5% age 4, and 96.5% age 5). For 1988, 54 coded wire tags were recovered, with 66.7% age 4 and 33.3% age 5. Due to increased sampling levels and larger numbers of tags applied, the commercial fishery recovery of coded wire tags was over 300 in 1992. Tag loss was addressed by using the tagged-untagged ratio obtained from Gunn Creek recovery surveys. The Gunn Creek tagged-untagged ratio was representative of the commercial fishery contribution because tag loss occured prior to the fish returning to spawn thus impacting both recovery locations equally. Tags lost from fish would result in an increase in fish represented by those tagged fish recovered i.e. increase the tagged-untagged ratio requiring a tag loss estimate; however, using the Gunn Creek spawning population tagged- untagged ratio corrects for any loss while the fish were juveniles.
:231e E;;;-:a:= ! o b i a::::f retv? of Guimd P d t e e r - f ; ~ ;k n c :n/a, a try tr, aa:t surdival of 1%.
F R e l e a ~ dand h o d %cck R2ttwrs ~ S a a~ ~ t d w y - - - ------pep-
B ~ m d FryYear Yex
FryRlease
1% &it
Surviva! Year
8.17 4 Year Fish Yeir
P. &? 5 Ye;r
F i g Year
H a t h e r yRetcrns
Fry Released and hzd St& buns Crxsuird Lake
H e. 17 L8? Ctwsuir;d E r c d Fry Fry Wt 4 Year 5 Year Year Retarns r Year Re1mr;e S w k l Year Fish Year Fis?
Table 14 summarizes Gunn Creek spawning ground recovery of coded wire tags from adult sockeye salmon from both the weir, which was operated in 1984, and subsequent year foot surveys. Table 15 shows the age class composition of the commerial fishery and spawning ground CWT recoveries. The similarity of age class percentages within years versus the highly variable between year percentages is an indication that individual brood years experience dissimilar survival rates. The sampling effort appears to be adequate due to the within year age class similarity found in the commercial fishery and on the spawning grounds.
Based upon twelve years of commercial fishery and spawning ground tag recovery sampling (including 1990 when no tags were expected) , the mean fry to adult survival for fry transplanted to Gunn Creek, the inlet tributary of Summit Lake, was estimated to be 0.74% (Table 16). This survival estimate is only representative of Summit Lake enhancement and can not be applied to on-site releases. Knowing that the Gunn Creek population is entirely enhanced stock fish during September and October, the spawning ground sample of tagged to untagged fish allows multiplication of the estimated total tags in the fishery to estimate total enhanced fish returns. Since actual coded wire tag recoveries were obtained from a portion of the run sampled, estimation of the number of enhanced fish returning was obtained by expansion. The first expansion was multiplication by the portion of the run not sampled and the second expansion factor was the spawning ground tagged-untagged ratio. These expansions reconstruct enhanced adult returns prior to entering the commercial fishery.
A second appoach was used to evaluate estimated fry to adult survival of transported fry. Actual peak aerial escapement survey data were compared to estimated adult spawners that would be in Gunn Creek and Crosswind Lake after using a fry to adult survival rate of 0.74% and subjecting those fish to harvests of 60% in the commercial fishery, 2.0% in the personal use/subsistence fishery and 0.5% in the sport fishery. The result was that total estimated escapement was greater than the actual number of fish counted during aerial surveys for all five years (Table 17). Assuming that peak aerial surveys (at the subject locations) account for approximately 50 to 75 percent of the fish which actually spawn, depending on survey conditions, if a 50% correction was used, three of the last five years would have escapements greater than the 0.74% survival rate. It appears that the average Summit Lake survival rate of transported fry is probably greater than 0.74%. Preliminary data from Crosswind Lake suggest that survivals may exceed 1.5% or double that of Summit Lake.
The estimated harvest and escapement of Summit Lake enhanced fish was based not only CWT numbers but also on when those fish were present in the fishery. To correct the twelve seasons of daily CWT recovery data, two adjustments were made. First, the tag numbers were expanded by the percent of the catch which was sampled, and secondly the calendar date was decreased by one day (i.e. June 12 information was transferred to June 11) so that the tag recovery
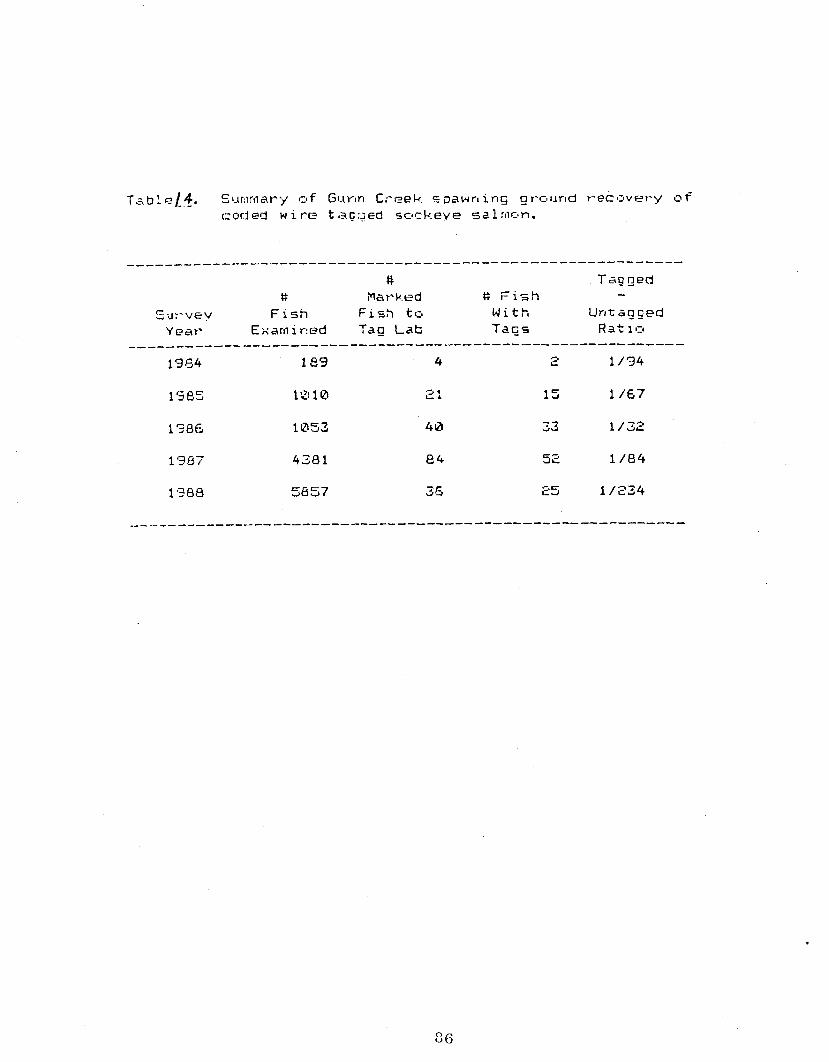
# ? l a r k e d ++ F i s h
T a g g e d-CG:JYVEV Frsh F i s h tc, W i t h U n t d g ~ e d
Year Exar11ir:ed Tag L a b Tags-------R3t 113
------------_ _ _ _ _ _ _ __ _ _ _ _ __--_--________________________________________---------________________________________________------ ________________________________________
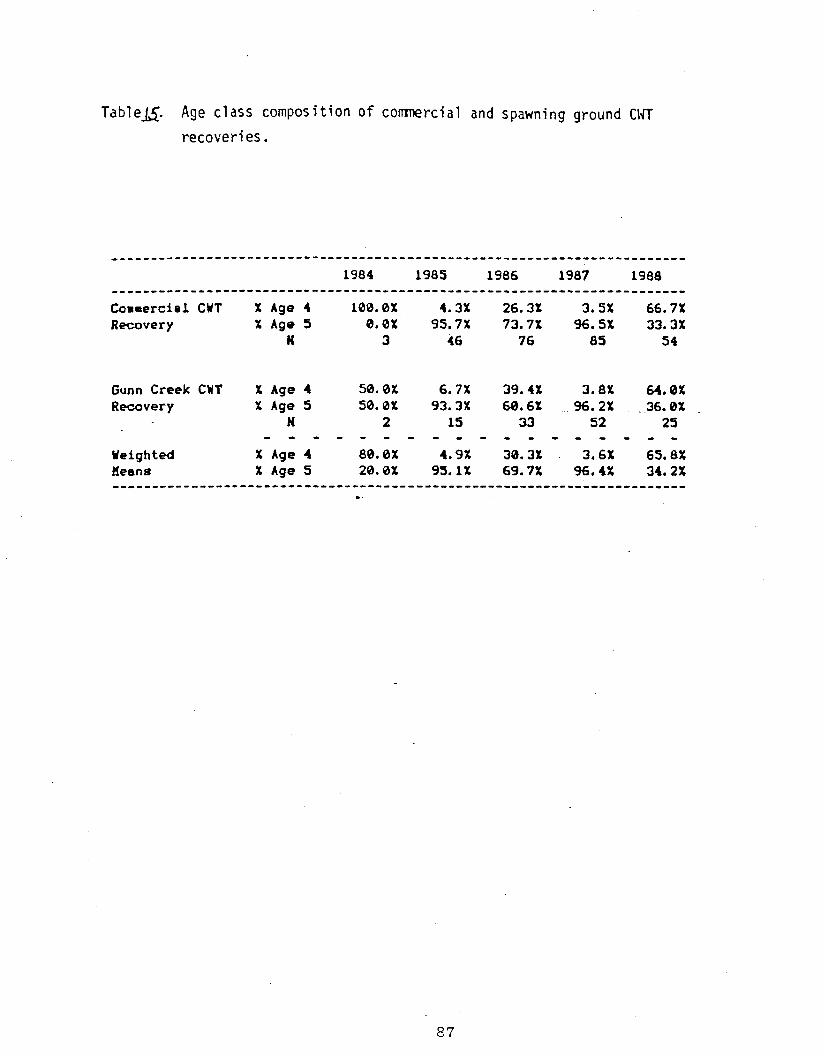
Tab les . Age class composition of comnercial and spawning ground CIfl
recoveries .
GunnCreekCWT % A g e 4 50.0% 6 .7% 39.4% 3.8% 64.8% Recovery X Age 5 50.0% 93.3% 68.6% 96.2% . 36.0%
N 2 15 33 52 25- - - - - - - - - - - - - - - - - -U e ighted X Age 4 80.0% 4.9% 38.3% 3.6% 65.8% Keane % Age 5 20.0% 95.1% 69.7% %. 4% 34.2% ..........................................................................

Table /& Remnstructed Sur,tl t Labe adult retut'ns est hated frm exoartded comwrcial catch mded wire t a ~recovery ard tapqed-untagged suawr~lr~qground ratio.
0.00%f r y t o adult survival
1935 18584 13765 34415 676U
for the l % l taq year uas not unexpetd due t o the tag numberj released (1,3011.
0.10% 0.99% 0.59% 0.80% 0. %% 0.74%
d
a This ~urvival average does mt include d.bN o f 1981 taqging.
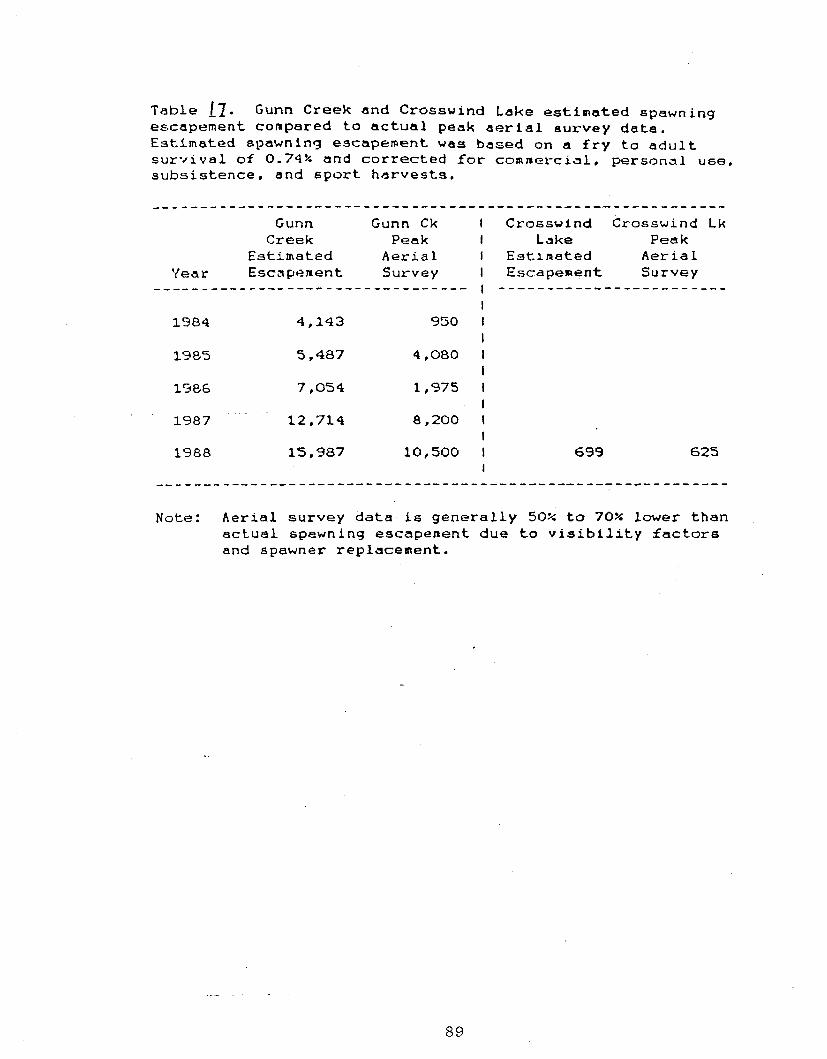
Table [ I . Gunn Creek and Crosswind Lake estimated spawning escapement conpared to actual peak aerial aurvey d a t a . E s t i m a t e d spawning escapement was based on a f r y to adult s u r - f i v a l of 0.74% a n d corrected f o r commercial, personal use, subsistence, and sport harvests.
___--_-- - - - - - - - - - - - - - - - - - - - - - - - - - - - - - - - - - - - - - - - - - - - - - - - - - - - -G u n n Gunn Ck I Crosswind Crosswind Lk
C r e e k Peak I Lake Peak Estimated Aerial I Est~mated Aerial
Year Escsy a n e n t Survey I Escapement Survey 1 - - - - - - - - - - - - - - - - - - - - - - - -I
1984 4,143 950 1 I
1985 5,487 4 , 0 8 0 1 I
1586 7,054 1,975 1 I
Note: Aerial survey data is g e n e r a l l y 50% to 70% lower than actual spawning escapenent due to visibility factors a n d spawner replacement.

information reflected actual fishery timing rather than recovery date timing. Figure 26 is the actual tag data corrected by calender date but uncorrected for sampled catch percentage. Figure 27 is corrected for both calender date and sampling percentage. A distinctly bimodal pattern of return is apparent for the tagged fish emigrating from Summit Lake. To be useful in forecasting, the corrected tag data was smoothed by a moving average of equal weight having a function order of five (Figure 28). Using the migratory timing data published by Merritt and Roberson (1986) the presence of hatchery fish was estimated for the Copper River fisheries (Figure 29). Presence of enhanced stock salmon in the commercial fishery through out the entire season allows use of the same exploitation rate as that of wild stocks, typically near 60%. The subsistence and personal use fisheries typically harvest approximately 10% of the total escapement; however, enhanced fish travel through the fishery primarily during the latter half of the fishery season and the harvest effort is weighted toward the early portion of the season. The subsistence and personal use fisheries are estimated to harvest approximately 5% of the enhanced adult escapement. The sport fishery typically harvests approximately 1% of the total escapement but due to enhanced fish primarily traveling through the fishery zone after late July, when the sport fishery effort is typically reduced, the exploitation of enhanced stock escapement is probably closer to 0.25%.
In addition to the coded wire tag recovery effort on the spawning grounds, aerial surveys have been flown each fall during the spawing season. These surveys have continued to document a small natural Gunn Creek population with a mean peak escapement of 173 fish, occuring between mid July and mid August. The natural population spawns near Gunn Lakes in a small creek connecting the lakes to the main channel of Gunn Creek. Fry transplanted to Gunn Creek were expected to retain similar return timing to those released from the hatchery but were expected to spawn primarily in the lower portion of Gunn Creek where they were released. Weir and aerial survey efforts for sockeye salmon in Gunn Creek confirmed both timing and spawning locations - almost exclusively in the main channel of Gunn Creek and rarely in the Gunn Lake tributary. Surveys flown each succeeding year have documented the increasingly large numbers of late season enhanced stock spawning in Gunn Creek. Table 18 presents the aerial survey data for Gunn Creek.
Discussion:
Using the spawning ground recovery ratio of tagged to untagged fish to expand the estimated total CWT returns, the mortality effects of smolt handling are bypassed by the fact that each CWT bearing adult recovered on the spawning grounds represents "XMnumber of untagged fish, thus the survival of fry to adult can be estimated. The calculated survival from fry to adult for Summit Lake transplanted fish of 0.74% (four year average, Table 16) is still 1.3 times lower than the survival assumption of 1% (Table 13) and yet as supported by aerial survey data the actual survival is probably higher than 0.74%. Lower survival figures for transplanted fish
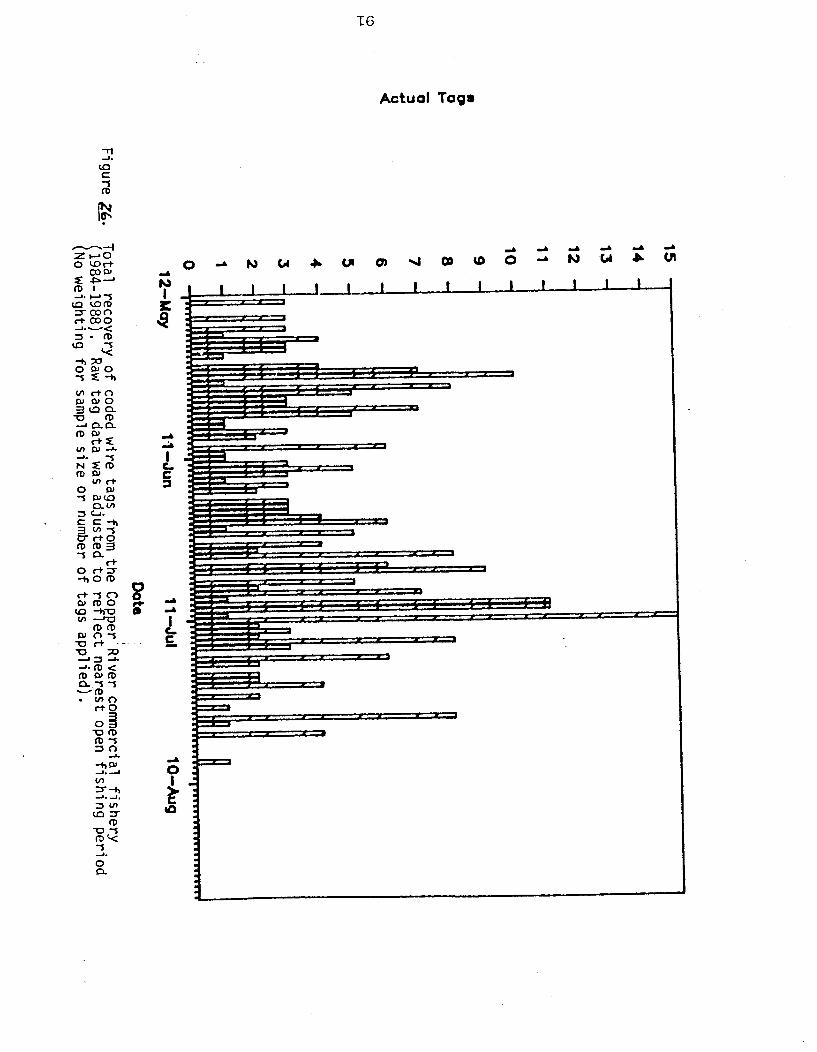
Actual Tag*
+ & . T) -XI 4 3 A-'. ID < ID W I D
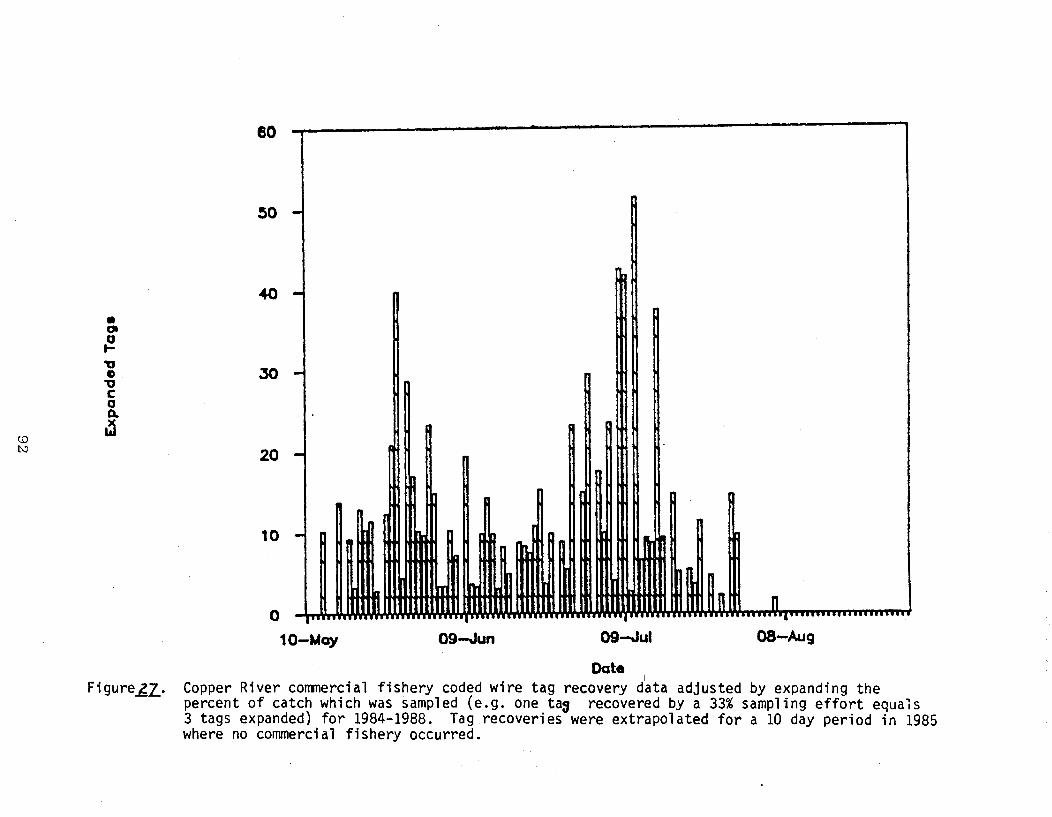
F i g u r e a . Copper River corrmercial fishery coded wire t a g recovery data adjusted by expanding the percent of catch which was sampled (e.g. one tag recovered by a 33% sarnpl i n g ef for t equals 3 tags expanded) for 1984-1988. Tag recoveries were extrapolated for a 10 day period i n 1985 where no commerci a1 fishery occurred.
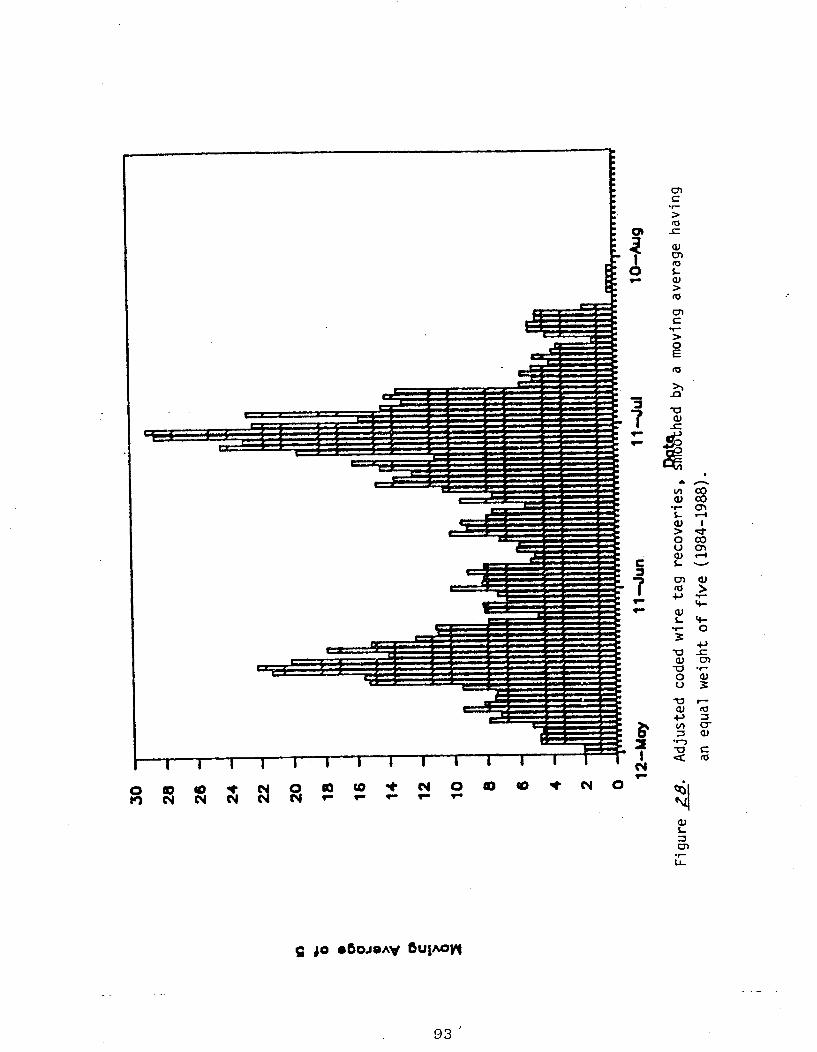
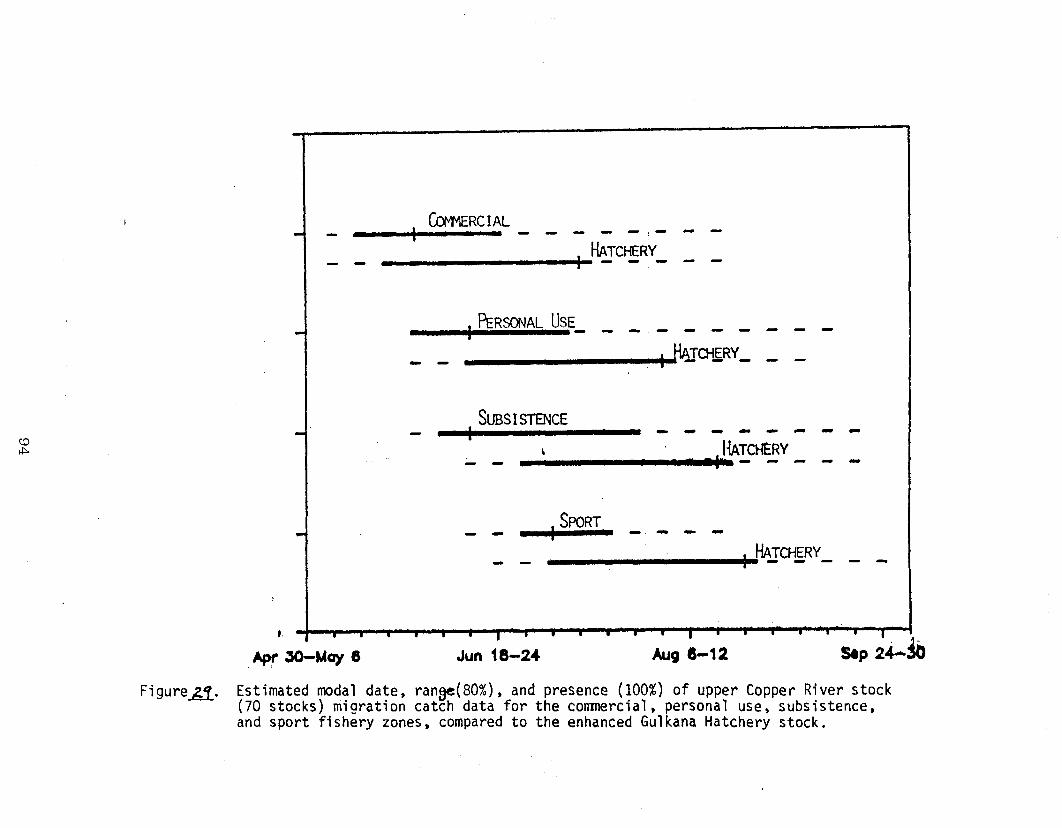
Jun 18-24 Aug 8-12 SOP26jb
F i g u r e a . Estimated modal date, ran&80%), and presence (100%) of upper Copper River stock (70 stocks) migration catch d a t a for the corrmercial, personal use, subsistence, and sport fishery zones, compared to the enhanced Gulkana Hatchery stock.
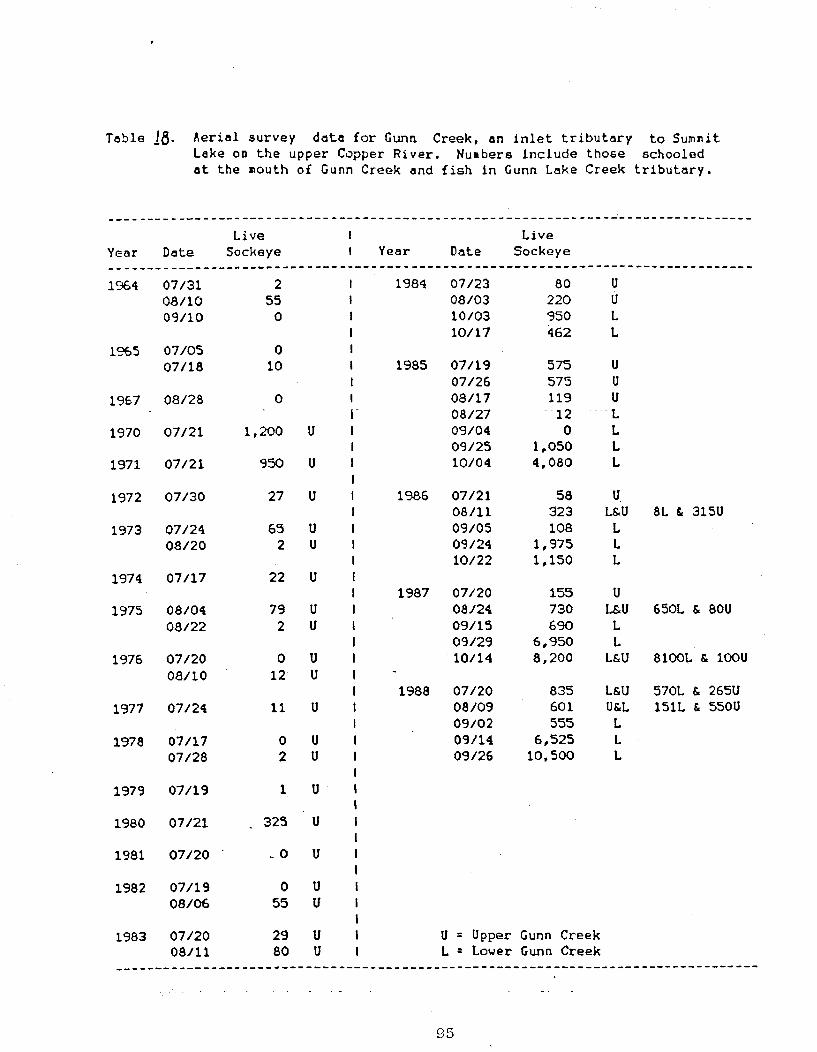
Table 18. Aerial survey data for Gunn Creek, an inlet tributary to Summit Lake on the upper Copper River. Nunbere include those schooled at the mouth of Gunn Creek and f i s h i n Gunn Lake Creek tributary.
Live I Year Date Sockeye I Year Date
Live Sockeye
U U L L
U U u
- L L L L
U L6u L L L
U Lsu L L
LSU
LSU U&L L L L
U = Upper Gunn Creek L = Lover Gunn Creek
are expected when transportation mortality, sea gull (Larus philadelphia and Larus argentatus) and lake trout (Salvelinus namaycush) predation, lower food availability and straying are taken into consideration. Fry released on-site from the hatchery do not experience transportation mortality. Tern, gull and lake trout predation effects (being density dependent) are diluted due to the high number of natural fry emigrating at the same time, plus the fact that Paxson lake is organically stained and has high food availability (unpublished limnological data). The value of 1% will be used in forecasting adult returns of both transported and on- site fry releases until further evaluation supports another figure. A 1% survival estimate is optimistic for transported fry yet conservative for fry released from the hatchery. Overall, 1% is a good approximation of fry to adult survival because releases have been divided equally between on-site and off-site locations and therefore should balance each other.
During pro j ect development it was anticipated that adult fish would return during the latter half of the commercial season due to their late spawning time. It was also expected that the pattern of return would resemble a normal curve. Coded wire tag data indicates that enhanced stock fish are present in the commercial fishery very early in the season and that the returns form a bimodal timing distribution. There may be some relationship between adult pattern of return and emigrant smolt as both appear to follow bimodal curves. The modal return timing of enhanced stock fish is after the major portion of the commercial harvest. This pattern was the impetus for beginning (1987) a sockeye salmon broodstock with an earlier return timing.
Responsible management of the Copper River mixed stock fishery was made possible by a large historic data base and predictable population dynamics. Addition of a large enhanced component into an already complex harvest program was considered unmanageable by some biologists. The basic management premise is that returning numbers of wild and enhanced fish are predictable. Harvest predictions are still governed by providing adequate escapment to the approximately 125 wild sockeye salmon stocks which comprise the Copper River spawning population. Identified Copper River stocks are ordered into six logical time spans, providing a mechanism whereby groups of stocks can be managed for adaquate escapement (Merritt and Roberson, 1986) . Over harvesting of one or several natural stocks is possible but the probability is minimized by calculating the desired escapement goal of natural stocks by day or by week and adding to this the estimated hatchery escapement during the same time window, thus a total desired escapement for a period of time is established (Figure 30). The combined desired escapement for wild and enhanced stocks is verified within season by side scanning sonar counters located at Miles Lake. Figure 31 illustrates the current return timing information (by weekly percentages), partitioned for natural and enhanced stocks.
One of the concerns with any enhancement program is whether or not the program has a positive benefit to cost ratio. Table 19

May 7-13 Jun 11-17 Jul 16-22
b-1 Natuml 844,900 6Hatchery 126,900
r i g u r e a . Predicted weekly catch increments of sockeye salmon by commercial fishermen, partitioned bynatural a n d enhanced stock timing information, for 1989. Comnercial catch d a t a based on cumulative per- centage catch by day for 1969 t o 1988. Hatchery da ta based on five years (1984-88) coded wire t a g recovery " percentages, smoothed by a moving average of five, having equal weight.
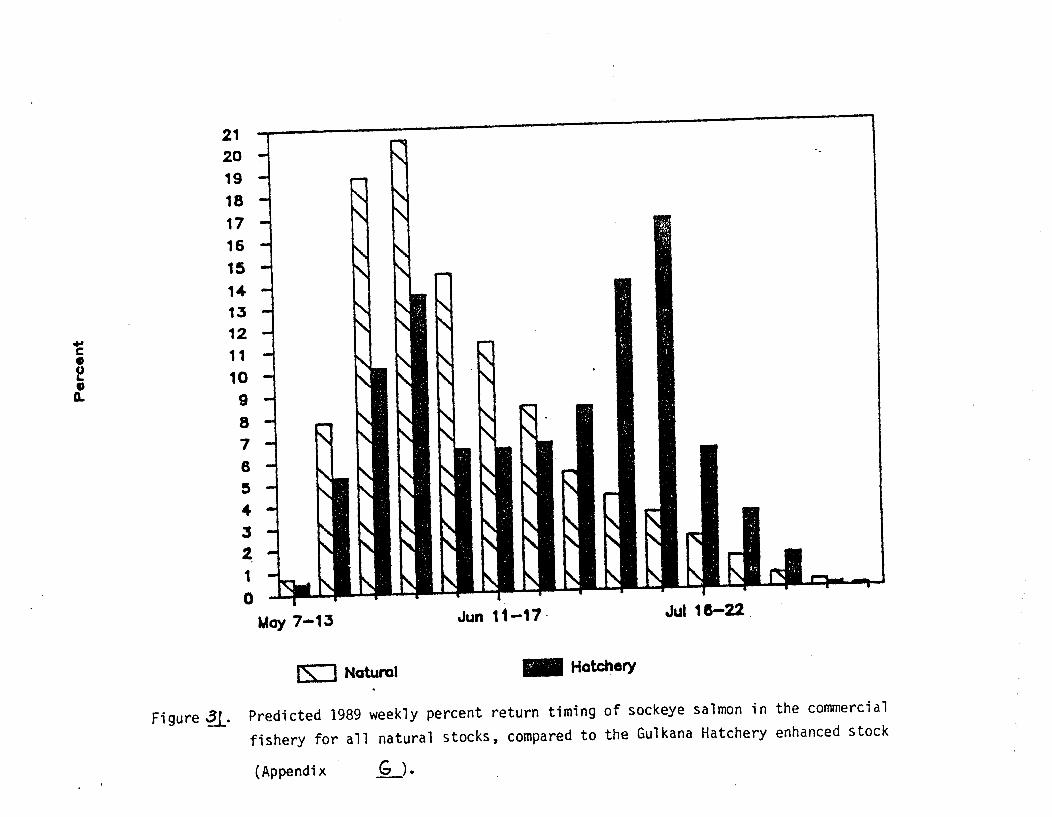
b-j Natural Hatchery
Figure 31. Predicted 1989 weekly percent return timing of sockeye salmon i n the comercial fishery for a l l natural stocks, compared to the Gulkana Hatchery enhanced stock
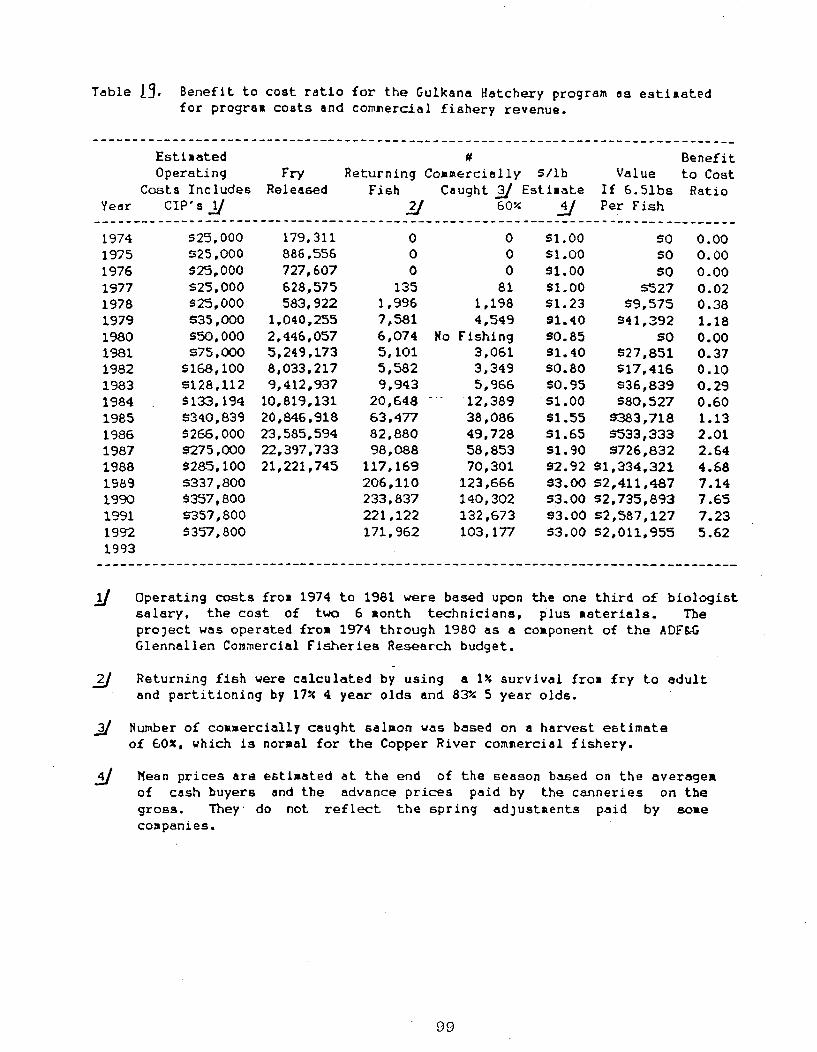
Table 19. Benefit to coat ratio for the Gulkana Hatchery program a s estiaated for program costs and commercial fiahery revenue.
Estimated # Benefit
Year
Operating FW Ccrsta Includes Released
CIP's y
Returning Commercially S / l b Fish Caught a Eatlrnte
2/ 60%
Value If 6.51bs Per Fish
to Cost Ratio
0 51.00 0 $1.OO 0 31.00 81 51.00
1,198 51.23 4,549 Sl.40
Ho Fishing SO. 85 3,061 Sl.40 3,349 50.80 5,966 SO.95 12,389 51.00 38,086 S1.55 49,728 51.65 58,853 Sl.90 70,301 123,666 140,302 132,673 103,177
Operating costs fr o ~1974 to 1981 were based upon t h e one third of biologist salary, the cost of two 6 month technicians, plus raterials. Tbe prolect was operated from 1974 through 1980 as a conponent of the ADFhC Glennellen Commercial Fisheries Research budget.
Returning fish were calculated by using a 1% survival fro8 fry to adult2/ and partitioning by 17% 4 year olds and 83%5 year olds.
Number of commercially caught salmon was based on a harvest estimate of COX, which is nornal for the Copper River commercial fishery.
Mean prices are estimated a t the end of the season based on the averagem of cash buyers and the advance prices paid by the canneries on t h e gross. They do not reflect the spring adjustnents paid by sane companies.
summarizes estimated program costs and commercial fishery revenue from inception to the present. These cost figures include all construction and evaluation (CWT, limnology, and pathology) activities, which for most hatcheries are included in other budgets (i.e. capital improvement projects or area/regional biologists programs). Due to the five year (83%) life cycle of the Copper River sockeye salmon, benefits are slow to be realized. The facility has reached a profitable production plateau, in which commercial fishery benefits are approximately five times those of cost. Additional benefits not reflected in the revenue table include; fish harvested in subsistence, personal use and sport fisheries, a newly established terminal sport fishery at Summit Lake, dog food provided to local dog mushers from egg-take carcasses and tourist activity while viewing spawning salmon.
The Alaska Department of Fish and Game conducts all programs and activities free from discrimination on the basis of sex, color, race, religion, national origin, age, marital status, pregnancy, parenthood or disability. For information on alternative formats available for this and other department publications, please contact the department ADA Coordinator at (voice) 907-465-4120, (TDD) 1=800-478-3648 or (fax) 907-586-6596. Any person who believes s/he has been discriminated against should write to: ADF&G, PO Box 25526, Juneau, AK 99802-5526; or O.E.O., U.S. Department of the Interior, Washington, DC 20240.
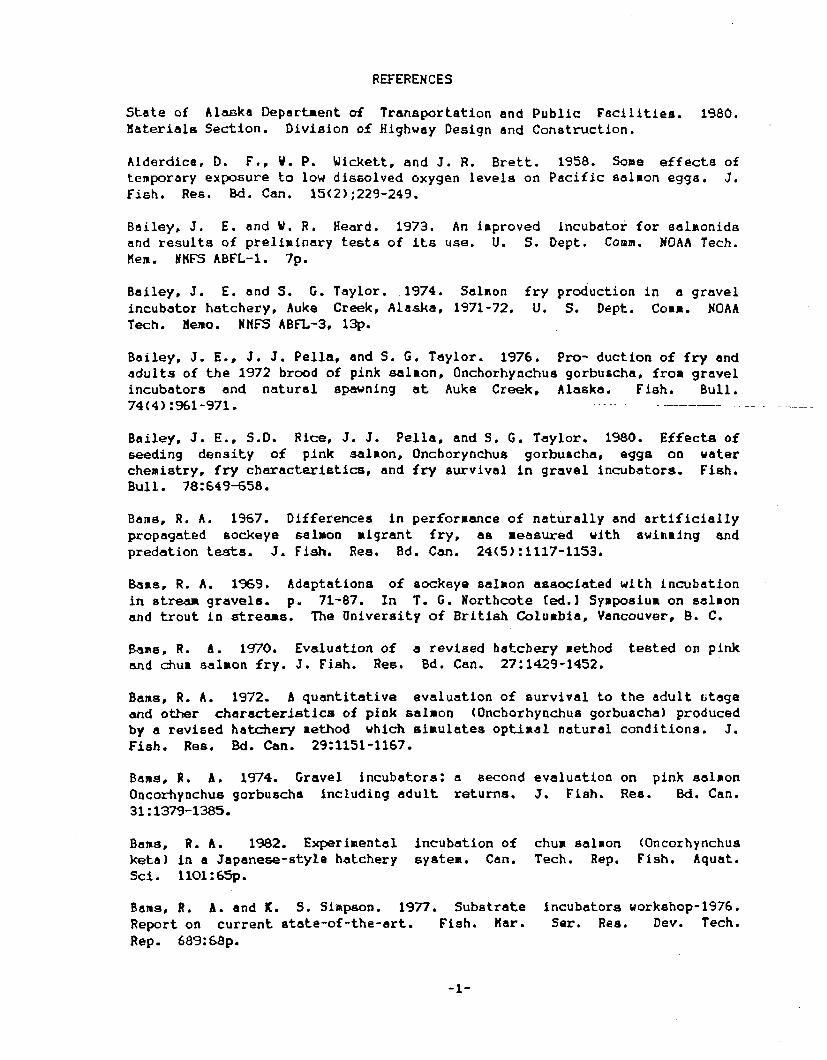
REFERENCES
State of Alaska Departaent of Transportation and Public Facilitiee. 1980. Baterials Section. Division of Highway Design and Construction.
Alderdice, D. F., Y . P. Wickett, and J. R. Brett. 1958. Sone affects of temporary exposure to low dissolved oxygen levels on Pacific salmon eggs. J. Fish. Res. Bd. Can. 15(2);229-249.
Bailey, J. E. and W . R, Heard. 1973. An improved incubator for salnonide and results of preliminary testa of its use. U. S. Dept . Comm. HOAA Tech. Ken. NHFS ABFL-1. 7p.
Bailey, J. E. and 3. G. Taylor. 1974. Salmon fry production in a gravel incubator hatchery, Auke Creek, Alaska, 1971-72. U. S. Dept. Corn. NOAA Tech. Hemo. NNFS ABR-3, 13p.
Bailey, J. E., J. J. Pella, and S. G. Taylor. 1976. Pm-duction of fry and adults of the 1972 brood of pink salron, Onchorhynchus gorbuscha, from gravel incubators and natural spawning at Auke Creek, Alaska. Fish. Bull.
. - - - - - - - - . _ _ .74(4) :%l-971.
Bailey, J. E., S.D. Rice, J. J. Pella, and S. G. Taylor. 1980. Effects of seeding density of pink salmon, Onchorynchus gorbuacha, eggs on water chemistry, fry characteristics, and fry survival in gravel incubators. Fish. Bull. 78:649-658.
Bane, R. A. 1%7. Differences in perforrance of naturally and artificially propagated sockeye salroa migrant fry, a8 neaaured with swimring and predation tests. J. Fish. Ree. Bd. Can. 24(5):1117-1153.
Bnns, R. A. 1969. Adaptations of sockeye salmon associated w i t h incubation in st- gravels. p. 71-87. In T. G. Northcote kd.1 Synpoeiur on salron and trout in streams. The University of Brftfah Coloabia, Vancouver, 0 . C.
Bana, R. A. 1970. Evaluation of a revised hatchery rethod tested on pink and d u n salmon fry. J. Fish. Res. Bd. Can. 27:1429-1452.
Bans, R. A. 1972. A quantitative evaluation of survival to the adult iitage and other characteristics of pink sairon (Oncborhynchus gorbuscha) produced by a revised hatchery rethod which simulates optimal natural conditions. J. Fish. Res. Bd. Can. 29:1151-1167.
Baas, R. A. 1974. Gravel incubators: a second evaluation on pink salmon Oncorhynchus gorbuscha including adult returns. J. Fleh. Res. EM. Can. 31:1379-1385.
Bana, R. A. 1982. Experiaental incubation of chum salmon (Oncorhynchus keta) in a Japanese-style hatchery eyatem. Can. Tech. Rep. Fish. Aquat. Sci. 1101:65p.
Bans, R. A. and K. S. Sinpson. 1977. Substrate incubators workshop-1976. Report on current state-of-the-art. Fish. Har. Ser. Res. Dev. Tech. Rep. 689368~.

B u m , 8 . A . , and D. G . Crabtree. 1976. 4 method for pink salmon propagation: the Headquarters Creek experiaental hatchery, 1968-1974. Fish. Mar. Ser. Res. Dev. Tech. Rep. 627:70p.
B a r b , D.L., Yelaon, V.L. and R.F. Pelliseier. 1984. Field data sumary for Copper River end Prince William Sound lake investigations, 1983 - ADFGG Contract No. 83-0526. Prince Williaa Sound Aquaculture Corporation. 213p.
Barto, D.L., Pelliseier, R., Sonerville, X.A. and J.C. Woodruff. 1985. Field data auBlary for Copper River and Prince William Sound lake investigations, 1984 - ADFGG Contract No. 84-035. Prince William Sound Aquaculture Corporation. 248p.
Blackett, R.F. 1974. Preliminary evaluation of pink (Oncorhynchus gorbuscha) and sockeye (0. aerka) salnon incubation and rearing in gravel incubators and troughs. Alaska Dept. Fiah Cane Tech Data Rep. No. 17:32p.
Bjornn, 7. C. 1969. Embryo survival and emergence studies, Job, No. 5. Salmon and Steelhead Invest. Prolect No. F-49-R-7. Ann. Corpl. Rep., Idaho Fish Game Dept. 1lp.
Brannon, E. L. 1965. The influence of physical factors on the developaent and weight of sockeye sahon e~bryora n d alevfns. Int. Pac. Salmon Fieh. Coan., Prog. Rep. No. 12. 26p.
Burke, J. and D. Hulcaby. 1980. Plaquing procedure for infectious heaatopoietic necrwis virus. Applied and Environmental ~icrobiology 39:872-876.
Burke, J. and R. Crischkowaky. 1984. An tpizootic caused by infectious haeaatopoietic necrosis virua in an enbanced population of aodteye sahon, Oncorhynchus nerka (Walbaun), snolts at Hidden Creek, Alaska. Journal of Fish Diseases 7:421-429.
Cooper, A. C. 1 s . The effect of transported etrealr sediments on the survival of sockeye and pink salmon eggs and alevin. Int. Pac. Sal. Fish. Corn. Bullc l8:71p.
Dixon, W. J., editor. 1985. BHOP Statistical Software. University of California Press. Berkeley, California. 733p.
Duncan, R. E. 1956. Two measures of the length of red salmon, Oncorhynchus nerka (Wnlbaw), their relation and application in the study of the catch and escapement in Briatol Bay; Alaska. S . Thesis Univ. Washington. 92pp.
Emadi, H. 1973. Yolk-sac aalfornatioa in Pacific salaoo in relation to substrate, temperature, and water velocity. J . Fiah. Rea. Bd. Can. 30:1249-1250.
Fedorov, K. Y., and 2. Y. Snirnova. 1978. Dynamics of araonia accu~ulation m d its effects on the develop- rent of the pink salmon, Oncorhynchus gorbuscha, in closed circuit incubation systers- J . Ichthyol. 18:288-295.
Foersbx, R . E. 1968. The sockeye salmon. Oncorhyncbua nerka. Fish. Rea. Bd. Can. Bull. 162. 422p.
Fried, H.P. 1984. Laboratory techniques in virology. Alaska Departnent of Fish and Game, Division of Fisheries Rehabilitation, Enhancelent and Development, Report No. 29:40p.
Fuss, H. J. and C , Johnson. 1982. Quality of chun salnon fry improved by incubation over artificial substrates. Prog. Fish-Cult. 44(4):170-172.
Garei.de, E. T. 1 9 . Some effects of oxygen in relation to hperature on the development of lake trout e~bryoa. Can. J. Zoo. 37:689-698.
Garaide, E. T. 1966. Effects of oxygen in relation to temperature on the developrent of enbryoa of brook trout a n d rainbow trout. J. Fish. Res. Bd. Can. 23:1121-1134.
Ginetz, R. I!. 1976. Fulton River upwelling gravel incubator for sockeye salmon. Fish. Har. Serv. Tech. Rep. PAC/T-76-10:45p.
.~ - . .
Gray, J . 1928. The growth of fish. 11. The growth-rate of the embryo of Salmo fario. Br. J. Exp. Biol., 6:110-124.
Hanor, T . and E. T. Garaide. 1977. Size relations and yolk utilization in embryonated ova and alevine of Atlantic salmon, S a h o ealar L. in various combin- ations of temperature and dissolved oxygen. Can. J. 2001. 55:1892-1898.
Hansen, T. J., and D. Holler. 1985. Yolk absorption, yolk sac constrictions, rortality, and growth during first feeding of Atlantic salmon(Sa1no ealar) incubated on astro-turf. Can. J. fiah. Aquat. Sci. 42:1073-1078.
Heaing, T. A*, J. E, XcInerney, and D. f. Alderdice. 1982. Effect of temperature on initial feeding in alevins of chinook salmon (Oncorhynchus tshawytscha). Can J. Fish. Aquat. Sci. 39:1554-1%2.
Hollander, H. and D. A. Yolfe. 1973. Non paraaetric statistical methods. John Viley & Sons, New York.
Kinne, O., and E. X. Kinne. 1%2. Ratea of developaient in cyprinodont fiah exposed to different temperature- salinity-oxygen combinations. Can. J. 2001. 40:23l-Z53.
Koenings, J.P., Kyle G.B., Edmundaon, J.A. and J.H. Ednundson. 1987. Limnology field and laboratory manual: aetboda for assessing aquatic production. Alaska Department of fiah and Game, Division of Fisheries Rehabilitation, Enhancement, and Development. No. 71:212p.
Koerner, J.F. 1977. The use of the coded vire tag injector under remote field conditions. Alaska Departrent of Fish and Game, Division of Couercfal Fisheries. Informational Leaflet No. 172:24p.
Koski, K. V. 1972. A summary of the spawning channel research by F.R.I. as related to the effects of gravel coupoaitlon and spavner density succees, eRergence survival, and fry quality. p. 84-90. In J. E. Bailey Ced.1 Proceedings of the 1972 northeast pacific pink salmon vorkshop. Alaska Dept. Fish Gane Inf. Leafl. 161.
Leon, K. A. 1975. Improved gmwth and aurvival of juvenile Atlantic salaon (Salk0 aalar) hatched in drums packed with a labyrinthine plaatlc substrate. Prog. Fish-Cult. 37(3):158-163.
Leon, K. A. and W . A. Bonney. 1979. Atlantic aalaon embryos and fry: Effects of various incubation and rearing aethoda on hatchery aurvival and growth. Prog. Fish-Cult. 41(1):20-25.
Hcffeil,W . 3 . and W. H. Ahnell. 1%4. Success of pink salron sqpawning relative to size of spawning bed aaterials. U. S. fish Wildl. Serv. Spec. Sci. Rep. Fish. KO. 469. 15p.
HcNeil, W. J., and J. E. Bailey. 1975. Salmon Ranchers Uanual. Northweat Fish. Center, Auke Bay Fieh. Lab. . .- ... - . -- ---- . . .-.SSP* __ ... . . .- . _- .. - ._.--- -.- - -.- . . . .. .
Hoberly, S.A., Hiller, R., Crandall, K. and S. Batee. 1977. Hark-tag ranual for salaon. Alaeka Department of Fieh and Gane, Division of Fisheriea Rehabilitation and Development. 56p.
Neter, J. and W. Wasserman. 1974. Applied linear atatistical models. Irwin-Dorsey limited. Georgetown, Ontario. 842p.
Northwest Uarine Technology Inc. No date. Instruction manual for tagging unit. Shaw Island, Washington. 19p.
Pellissier, R.F., Barto, D.L., Somerville, H.A., Voodruff, J.C. and J.B. Todd. 1985. Field data sumnary for Copper River and Prince William Sound lake investigations, 1984 - ADFGG Contract No. 84-035, Addendur I: Stream Surveys. Prince William Sound Aquaculture Corporation. 98p.
Pellisaier, R.F. and H.A. Somerville. 1987. Field data sunnary for Copper River and Prince William Sound lake investigations, 1985 - ADFGD Contract No. 85-0159. Prince William Sound Aquaculture Corporation. 149p.
Peterson, R. H., 0. C. E. Spinney, and A. Sreedharen. 1977. Development of Atlantic salmon (Salmo solar) eggs and alevins under varied temperature regimes. J. Fish. Res. Bd. Can. 34:31-45.
Phillips, R. W., R. L. Lantx, E. O. Claire, and 3. R. Horing. 1975. Some effeda of gravel mixtures on energence of coho salaon and ateelhead trout fry. Tram. . Fish. Soc. 104(3):461-466.
Poon, D. C. 1977. Some preliminary observations on possible indices of pink and chua salnon fry quality. p. 81-83. In J . E. Bailey fed.] Proceedings of the 1972 northeast pacific pink salnon workshop. Alaska Dep. fish Game Inf. Leafl. 161.
Prince William Sound Regional Fisheries Planning Tean. 1983. Prince William
Sound - Copper River Comprehensive Salmon Plan, Phase I - 20 Year Plan (1983-2002). Alaaka Department of Fish and Came. 176p.
Roberaon, R. and P.J . Fridgen. 1974. Identification and enuaeration of Copper River sockeye salmon stocks, Completion Report for Period July 1, 1970 to June 30, 1973. Alaska Department of Ffah and Cane, Anadro~ousFish Project, AFC-32:76p.
Roberaon, K., R.G. Zorich and P.J. Fridgen. 1974. Copper River Commercial Fisheries Uanagement Investigations. Alaska Departrent of Fish and Came, Completion Report for Period July 1, 1973 to June 30, 1974. Prolect No. AFC-46:49pp.
Roberson, K., R.G. Zorich and P.J. Fridgen. 1976. Copper River - Prfnce Williar Sound sockeye salmon inventory and assessaent. Alaska Departrent of Fish and Came, Technical Report for Period July 1, 1974 to June 30, 1975. Project No. AFC-52-1:70p.
Robereon, K., Zorlch, R.G., Fridgen, P.J. and F.H. Bird. 1977. Copper River - Prince Uilliaa Sound sockeye salmon inventory and assessaent. Alaska Department of Fish and Game, Technical Report for Period July 1,-197Yto June--------- 30, 1976. Project No. AFC-52-2:69p.
Roberaon, K., Bird, F.H., Fridgen, P.J. and R.G. Zorich. 1978. Copper River - Prfnce William Sound sockeye salron inventory and assessaent. Alaska Department of F i d and Came, Completion Report for Period July 1, 1974 to June 30, 1977. Project No. hFC-52:Wp.
Roberson, R., Bird, F.H., Webater, K.A., and P.J. Fridgen. 1980. Copper River - Prince Uilliaa Sound sockeye salson catalog and inventory. Alaska Department of Fish and Game, Technical Report for Period July 1, 1978 to June 30, 1979. Pro~ectNO. AFC-61-2:Ssp.
Roberaon, K., lerritt. H.F., and P.J. Fridgen. 1982. Copper River-Prince William Sound sockeye salmon catelog and inventory. Alaska Department of Fish and Game, Completion Report for Period July 1, 1977 to June 30, 1981. Prolect No. AFC-61:39p.
Roberaon K. and R. R. Holder. 1984. Gulkana River sockeye enhancerent July 1, 1980 - June 30, 1981. Alaska Departrent of Fish and Game, Division of Fisheries Rehabilitation, Enhancement, and Development. Progress Report PWS 011. 3spp.
Saft. R.R. and K . M . Pratt. 1986. Effect of infectious hematopoietic necrosis on sodreye salaron culture in Alaska. Alaska Departsent of Fish and Gane, Division of Fisheries Rehabilitation, Enhanceaent and Developrent. Rept. No. . 33p.
Shunway, D. L., C. E. Warren, and P. Doudoroff. 1964. Influence of oxygen concentration and water movement on the growth of steelhead trout and coho salmon esbryos. Trans. Am. Fish. Soc. 93:342-356.
Silver, S. J., C. E. Warren, and P. Doudoroff. 1963. Dissolved oxygen requirements of developing steel- bead trout and chinook salmon embryos at
different water velocities. Trans. &a. Fish. Soc. 92(4):327-343.
Sokal, R. R. and F. J. Rohlf. 1981. Bionetry. V . H. freeran and Co. Wev York. 859p.
Tappel, P. D. , and T. C. Bjornn. 1983. A new rethod of relating aize of spawning gravel to salronld embryo aurvival. N. An. J. Fish. Hanagenent 3~103-122.
Taylor, S. G. 1984. Quality of pink salmon (Oncorhynchua gorbuscha) fry incubated fror eggs in river gravel or plastic substrates. Aquaculture, 42: 359-365.
Thompson, S. H. 1964. The red s a h n (Oncorhynchus nerka) of Copper River Alaska. USFUS Bureau of CORD. Fish. Hanuscript Report 1964. IR 64-12 huke Bay, Alaaka p.57.
Witzel, L. D. and H. R . Hadrimrcsn. 1983. Embryo survival and alevin emergence of brook charr, Salvelinus fontinalia, and brown trout, Salno
. . . .trutta, relative to redd gravel corpoaition. Can. J. 2001. 611783-1792. . . --. -

APPENICIES
Rppendix R. Cut-rent egg t a k e p r o c e d u r e s at t h e Gul kana Hatchery .
Ripe f e r m l e s are k . i l l ed and b l e d i n o n e s i m p l e process. 0 l a r g e b u t c h e r k n ~ f eis used t o c u t , j u s t b e h i n d the rear e d g e o f t h e preclperculum t o a dep th e q u a l t o t h e bottom edge o f t h e e y e , s e v e r i n g t h e s p i n a l co rd , d o r s a l a r t e r y , and an te r - io r c a r d i n a l ve in . P r i o r t o September 18, 1981 fernales had been k i l l e d wi th a blow t o t h e head b u t i t was de termined c u l l e c t i v e l y by t h e s t a f f t h a t t h i s Has an u r ~ n e c e s s a r y s h o c k tcj t h e e g g s which c o u l d b e avoided by c u t t i n g . Cut fernales are p l a c e d i n a b l e e d i n g rack i n t h e o r d e r i n which ';hey a r e k i l l ed . The r a c k i s t i l t e d s o t h e f i s h ' s head i s lower t h a n t h e ta l ! , h e l p i n g t h e b l r e d ~ r ~ qp r o c e s s a n d p r e v e n t i n g t h e l o s s o f e g g s a s t h e abdcniinal rnllscles r e l a x . R t r o u g h col lects t h e d r a i n i n g b lood, slime, and Be tad ine , ? r even t i ng on o f t;h e Egg Box Pool, Nonr ipec o n t a r ~ ~ i n a t i g reen feroales a r e p l aced I n t o a h o l d i n g p e n t o a v o i d hand l ing more t h a n once p e r day. Green f ema les are released f t -om the pen a t the end o f each day. Males are a l s o c a p t u r e d with d i p n e t s , k i l l e d w i t h a t r a d i t i o n a l blow t o t h e head, and l a i d on a r a c k i n t h e o r d e r o f c o l l e c t i o n .
F i s h a t remote egg t a k e s and f m a t h e Egg box S p r i n g are a l so c o l l e c t e d us ing d i p n e t s bu t nclst ly wi thout. _ t h e - a i d -of .-yeirs o r ho ld ing pens . C r e ~members. .--
s t a r t a t t h e ri~outh o f each s p r l n g a n d work ups t ream, c a p t u r i n g , k i l l i n g , and l a y i n g f ema les or1 a s t r e t c h e r f o r t r a n s p o r t . Two crew members c a r r y f ema les t o t h e s p a n n i n g s i t e he re t h e y are t r a n s f e r r e d t o a b l eed ing r a c k . fl s i n g l e crew member works i n t h e s p r i n g n e a r t h e spawning site c a p t u r i n g , k i l l i n q , and l a y i n g males on a r a c k f o r spawning.
TKOcrew menibers worked t o g e t h e r a s a spawning team. U s u a l l y two spawninq teals work e a d day. The p e r s o n who t r a n s p o r t s f i s h from the r a c k t o t h e spawning t a b l e is termed t h e " c a r r i e r " w h i l e t h e person who a c t u a l l y spawns t h e f i s h i s termed t h e "spawner'. The carrier g rasps a f e m a l e s a l m n s ' c a u d a l p e d u n c l e wi th clne hand and a s t h e f e m a l e is p u l l e d f r o m t h e r a c k -hooks t h e f o r e f i n g e r and m i d d l e f i n g e r o f t h e o t h e r hand unde r t h e operculum and c a r r y s t h e f i s h to t h e spawning t a b l e h o t - i t o n t a l l y ( p r e v e n t i n g t h e loss of any e g g s ) . The spawner s t a n d s on t h e o p p o s i t e s i d e of t h e spawning t a b l e and w i p e s t h e f i s h w i t h a p a p e r t o w e l to remove blood, wa te r , B e t a d i n e , and s l ime. The c a r r i e r t h e n t u r n s t h e f i s h f m n h o r i z o n t a l to v e r t i c a l - be1 l y tov;at-d spawner u i t h a n a l f i n d r a p e d over t h e r i m o f a spawning c o n t a i n e r . The ~pawr r ing c c l n t a i r ~ e r used i s a p l a s t i c 1 . 8 9 l i t e r r e c t a n g u l a r " f r e e z e t t e " , The spawner u s e s a "Zak" k n i f e t o c u t t h e female from v e n t to t h r o a t going around t h e p e l v i c f i n s . From 1978 u n t i l 1386 two females were spawned i n t o a n i n d i v i d u a l f r e e z e t te and two m a l e s e r e s p a ~ n e d on to t h e ova. Beginning i n 1997 a s i n g l e female was spawned i n t o a f r e e z e t t e with t h e m i l t o f t h r e e males and i n 1989 a s i n g l e f ema le was spawned wi th two males. Males are cat-r-ied by t h e c a u d a l p e d u n c l e t o t h e s p a w n i n g t a b l e where t h e spawner wipes t h e be1 ly with a pape r t w e l , d i s z a r d s t h e ' first sho t of milt , and m i l k s t h e r e -aa in ing mllt on to the eggs. Flpproxirnately ldlZlrnl of water is added and the eggs are s t i r r - e d w i t h a min i Rutbermaid s p a t u l a . Primary f e a t h e r s f r a n g u l l u i q r were used from 1978 t o 1986 to st ir t h e gametes. The f e a t h e r was e f f e c t i v e i n mixing qarnetes a t f i r s t b u t d u r i n g u s e would b r e a k and t h e s h a r p p i n t s wot~ld darnage eggs. Thoroughly mixed e g g s a r d sperm are a l l o w e d t o sit for a t l e a s t 3 seconds b e f o r e r i n s i n g . Spawning procedures d o n o t d i f f e r between t h e Egg Box P o ~ land remote sites. F i s h c a r c a s s e s a r e e i t h e r g iven say, l e f t i n p i l e s on t h e r i v e r bank, dumped i n t o t h e Gulkana River , o r t r a n s p o r t e d to Summit Lake.
- . .. .
kppend ix n. Page -1-
- - - - - - - - -
P e r s o n s r i n s i n g t h e e g g s s t a n d f a c i n g a 5. lm p o l y e t h y l e n e p i p e f lowing wi th u r ~ c o n t a m i n a t e d spt-ing wa te r . P r i o r t o 1386 e g g s were r i n s e d w i t h i n t h e f r e e z e t t e i n t o which t h e y had been spawned. S t a r t i n g i n 1386, eggs were t r a n s f e r r e d from a f r e e z e t t e t o a Tupperware c o l a n d e r w i th s q u a r e ho le s , tS insed , and t h e c l e a n eggs r e t u r n e d t o a d i s i n f e c t e d f r e e z e t t e . Using c~:ar!dersi n c r e a s e d r i n s i n g s p e e d d u e t o t h e l a r g e r volume o f water t h a t c o ~ ~ l d used wi thou t e g g s o v e r t h e s i d e of t h e r i n s i n g c o n t a i n e r . be washing I n 1'397 we began use of a 5 q t c o l a n d e r w i th r e c t a n g u l a r h o l e s due t o t h e i t i p r ~ v e dr i n s i n g speed which t h e s e h o l e s provided .
Due t o p rob lems o t h e r Rlaskan h a t c h e r i e s have had i n f e c t i o u s hema topo ie t i c r t e c r o s i s v i r u s (IKNV), a Scckeye Salmon Cult 11re Fol i c y S ta t emen t became e f f e c t i v e May 26, 1981. T h i s po l i c y r ev iewed c u r r e n t v i r u s i n fo rma t ion and r e s e a r c h , and set f o r t h a p o l i c y st a ternent which h o p e f u l l y would reduce t h e a n n u a l f i s h rnclrtal it ies from IHNV. The most s i g n i f i c a n t c h a n g e s f o r t h e Gu lkana egg t a k e n e r e added d i s i n f e c t i o n wquir-ernents. D i s i n f e c t i o n of equipwent , f i s h , eg g s and pet-sonnel i nvo lved i n c o r p o r a t i o n o f a n iodophor t r e a t k s e n t i n al l p h a s e s of t h e o p e r a t i o n . The i o d o p h o r s o l u t i o n we use is a v a i l a b l e a s B e t a d i n e (Purdue F r e d e r i c k Co;,-N6Fwa1k~-Cd~n;-~~~856)~--fil1 p e r s o r ~ n e l e n t e r i n g o r l e a v i n g t h e Egg Box Poo l egg t a k e l o c a t i o n are r e q u i r e d t o s t e p i n t o a l a r g e t a n k of E e t a d i n e s o l u t i o n and d i s i n f e c t t h e i r h i p b o o t s 2nd r a i n g e a r . Female and male f i s h are brushed w i t h a t least a 188pprn P e t a d i n e s o l u t i o n w h i l e o n r a c k s p r i o r t o spawning. Zak knives, f e a t h e r s / s p a t u l a ~ , f r e e z e t t e s , ccglanders, and e g g count i n q equipment are d i s i n f e c t e d b e f o r e and a f t e r usage.
Egg d i s i n f e c t ion procedur-es have changed o v e r t me. During 1981, 1982, 1983, and 1984 e g g s t a k e n a t t h e Egg Pox Pool or S p r i n g were w a t e r hardened i n f r - e e z e t t e s c o n t a i n i n g wa te r f o r one hour . The f r e e z e t t e s were placed i n a water ba th t a b l e which contr-01 l e d egg t e s p e r a t u r e d u r i n g t h e "wa te r h a r d e n i n g " p rocess . Each f r e e z e t t e c o n t a i n e d t h e e g g s f r o m two females. R t the e n d of t h e h a r d e n i n g p r o c e s s t h e w a t e r was d r a i n e d from t h e f r e e z e t t e s and a s u l u t i o n of lB0pprr1 b u f f e r e d Betad i n e was poured o n t o t h e e g g s and a l l o w e d t o r ema in f o r lld minutes . R g r o u p iodophor t r e a t m e n t method was used on r e n c ~ t e egg t a k e s d u r i n g 1983 and 1984. Eggs were r i m e d and poured i n t o a 5 g a l bucket which c o n t a i n e d 108ppm b u f f e r e d iodophor . The b u c k e t was f i l l e d with t h e e g g s o f 32 f ema les , a l l o w e d to s i t f o r 10 m i n u t e s and t h e n t h e i o d o p h o r r e p l a c e d w i t h water . Duvinq t h e 1385 eqq t a k e both t h e h a t c h e r y and t-ernotc e g p s were p r o c e s s e d t h e same way. Eggs were t a k e n w i t h t n o females per. f r e e z e r e t te, r i n s e d , d r a i n e d , and t r e a t e d f o r 15 minu te s w i t h bu f fe red iodclphor o n a w a t e r t a b l e . a f t e r - t h e 15 minute iodophor t r e a t m e n t , eggs nere p c t r e d i n t o a 5 g a l bucket . D u r i n g t h e 1986 egg tab.e, f e r t i l i z e d eggs were rinsed in a c o l a n d e r , drained o f excess wate r , and imrnediately t r e a t e d w i t h a 1BCppm b u f f e r e d B e t a d i n e s o l u t i o n f o r 15niin i n t h e f w e i e t t e t h e y had been spawned in. F r e e z e t t e s c o n t a i n i n g e g g s and B e t a d i n e were t h e n p laced o n t o th2 water* ba th t a b l e . after t h e 15min t r e a t m e n t i n B e t a d i n e o n t h e water t a b l e , t h e d i s i n f e c t e d eggs and E e t a d i n e were t h e n poured from t h e f r - e e x e r e t t e s i n t o a 19L bucke t f i t t e d w i t h u p w e l l i n g wa te r which r i n s e d o f f the E e t a d i n e . Buckets were l o a d e d a p p r o x i m a t e l y t h r e e q u a r t e r s f u l l of eggs to a 1 low f o r e gq expans ion d u r i n g t h e r e m a i n d e r o f w a t e r hardening . The most d r a r ~ l a tic changes in egg t a k e and i o d o p h o r t t - ea tnen t occut-ed d u r i n g 1987. Not o n l y wet-e t h e number of f e m a l e s per f r e e z e t t e r educed from two t o one, but w a t e r ba th t a b l e c a p a c i t y was e x p a n e d so t h a t i odophor t r e a t m e n t of each
Rppendi x R. Paqe -2-

fernales eggs c o u l d occur f o r one hour on t h e w a t e r t a b l e .
Dur-irtg a1 1 year-, traffipclt-tation of t h e e g g s from t h e e g g t a k e site t o the i n c u b a t o r s invnlved t o p p i n g o f f t h e 1% bucket of e g g s with water t o prevent sl.-.shlrtg whi le t h e eqqs w?re being t r a n s p o r t e d . The buckets were immediately carsr:ed fr-or11the egg take shed t o t h e i n c u b a t o r s and s u h e r q e d in a flowing h a t e r hold ing box f o r t e m p e r a t u r e control.
R f t E; water h a r d e m d i n g a crew member vo l umetr- ica l ly e n u r e r a t e s t h e eggs kefor-e s e e d i n g then1 into an incubator. F r i o r t o 1905 subsarnples were counted by 5and. Begirming i n 1985 subsamples were counted w i t h a Northwest Marine Techr~ology f r y c o u n t e r adapted for* coun t ing eggs. Incuba tors a r e loaded with 5etweer. 45@,888 and 550,880 e g g s with a t a r g e t o f S88,8a8. R f t e r t h e i r c c b a t o r s a r e loaded w i t h eggs, 1 i d s a r e p laced o n and marked.
Rppendix F1. Page -3-
Rctual Size
Too V i e w
Side View End V i e w
Specific gravity
Ueiqht of one s a d d l e
Volume of one s a d d l e
Void space
Dry weight of 1 m3 of saddles
Polypropylene Intalox plastic saddleAppendix B. diagram and specifications. One cubic meter of saddles delivered by the manufacturer occupies approximately 1-28 ra3 of space in the incubator unit,

--------------------------------
-------------------------------
C O ~ I V ~ ~ S ~ O ~o f f e rna l e s o c k e y e sa lmon c a r c a s s Appendix C. l e n g t h s ( f rom mid-eye - h y p u r a l p l a t e t o t i p o f s n o u t - f o r k of t a i l ) i n o r d e r t o estimate t o t a l e g g s d e p o s i t e d a t t h e n a t u r a l s t u d y site.
O r i g i n a l f e m a l e l e n g t h measu remen t s (mm) * ME -HP
449 483 508 529 527
F i r s t (ME - HP) 1.039 + 5.364 = (ME - FT) C o n v e r s i o n
499 Duncan, 1956 535 563 *-607 584
Second (ME - F T ) 1.0794 + (-4.089) = ( T 5 - F T ) Conve r s i o n
534 Roger s , Donald E., 1974 573 ( p e r s o n a l con~municat ion 604 to K. Roberson, 65I K. Roberson t o 626 R. Holder 1985).
F e c u n d i t y est irnated g r a p h i c a l l y as p e r Thompson, 1964.
# Eggs Eggs E s t i m a t e ( m m ) # Eggs R e t a i n e d Depos i t ed from graph 534 3530 7 3523
573 3710 22 3688 604 3860 1239 2621 651 4000 1 3399 626 3985 3 3982
T o t a l Eggs D e p o s i t e d 17813
u ME mid-eye, HP h y p u r a l p l a t e , FT f o r k of t a i l , TS t i p o f snou t .
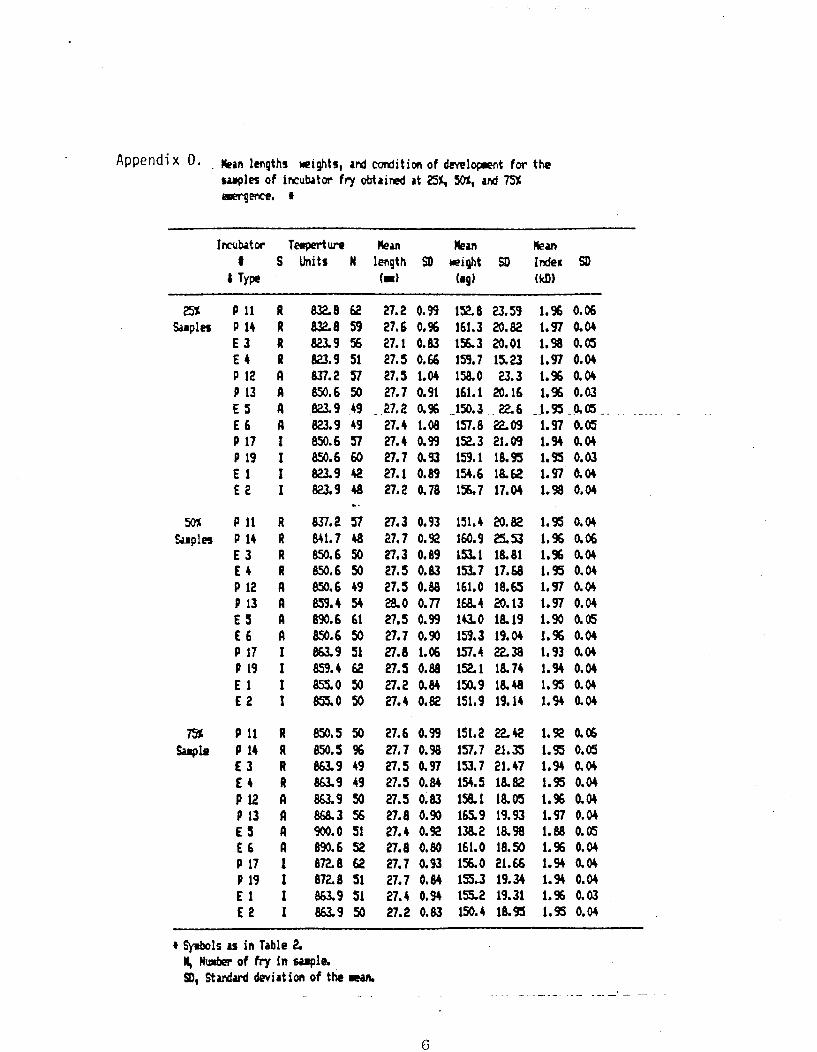
- -
Appendi x D - . Mean lengths weights, and condition of dewlopent for the samples of incubtor fry obtained at 25% XK, and 7% ewqem. t
i -1s rs in Table 2, N, Ikirks of fry in wple. a,Stardard deviation of the ran

Appendix E, Upper Gulkana River a o c k e y e ealmon age composition 1969-1975.
A g e Spawning Area Year 1.2 1.3 1.4 2.2 2.3
Gulkena River 1/ 1969 62.6 35.4 2 (Paxaon taka) 1970 17.5 81.7 0.3 0.5
1971 0.5 99.5 1972 9.3 90.5 0.3
Gulkana River 2/ 1973 5.5 91.5 3 (Upper)
Gulkana River 3/ 1974 16.8 83.2 (Upper> . . . . . .. ... . - .-
Gulkana River 4/ 1975 9.9 89.3 (Upper)
For Reporting Uee 17% 83%
Robereon, K. and p. Fridgen. 1974. Identification and Enuaeratfon of Copper River Sockeye Salmon Stocks. ADFU; Corpletion Report for Period July 1, 1974 to June 30, 1973. Project No. AFC-32. 76pp.
Roberson, K., R. Zorich, -and R. Fridgen. 1974. Copper River Conrnercial Fisheries Hanagement Investigations. ADFfC Completion Report for Period July 1, 1973 to June 30, 1974. Project No. AFC-46. 49pp.
R a b e r a o a , K., R.G. Zorich and P.J. Fridgen. 1976. Copper River - Prince William Sound ~ c k e y e aalnon inventory and assea~nent. Alaska Departnent of Fish and Game, Technical Report for Period J u l y 1, 1974 t o ' J u n e 30, 1975. Project No. AFC-52-1: 70p.
Roberson, K., Zorich, R.G., P.J. Fridgen and F.H. Bird. 1977. Copper River - Prince W i l l f a m Sound eockey sahwr Anventory and assessment. A l a s k a Departnent of Fish and Game, Technical Report for Period July 1, 1975 to June 30, 1976. Project No. AFC-52-2: 69p.
. .. .--~
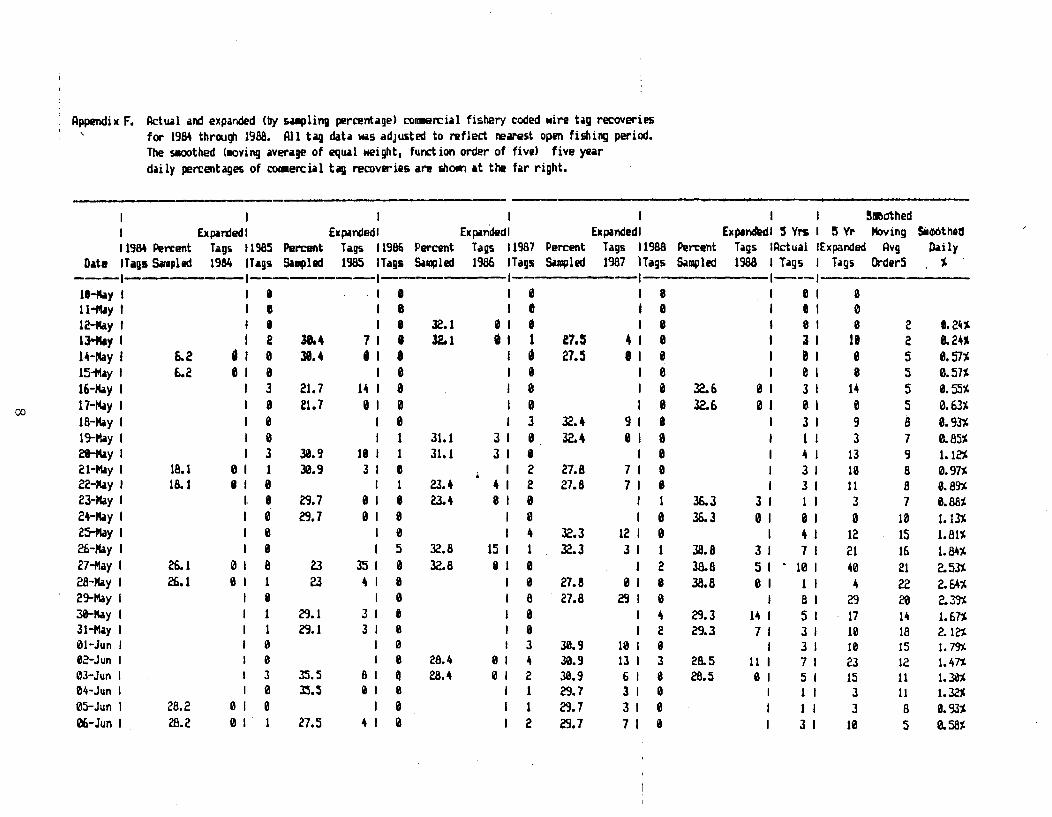
' ilppendix F. .. ktuai and expanded (by sarplinp percentage) cornercia1 fishery coded nire tag recoveries
f a 1984 through 1988. 011 t 4 data ws adjusted to reflect nearest open fiding period. The sloothed (loving average of equal wight, function order of five) five year daily petrentages of coorercial tag recoveries am drm at the far right.
7-
Date
I I I 1984 Percent ITags Sapled
I I ExprrdedI Expanded1
Tags 11985 Percent Tags 1 1986 1984 1Tags Sunplod 19EU
Percent
I ENpandedI
Tags 1 1987 Percent
I Expandedl
Tags 11988 Percent
I I Sbathed ErplnWl S Y r s I 5 Yr h i n g
Tags IRctual Expanded Rvg Tags M e r S
Sp&3tlled Dai 1y . #
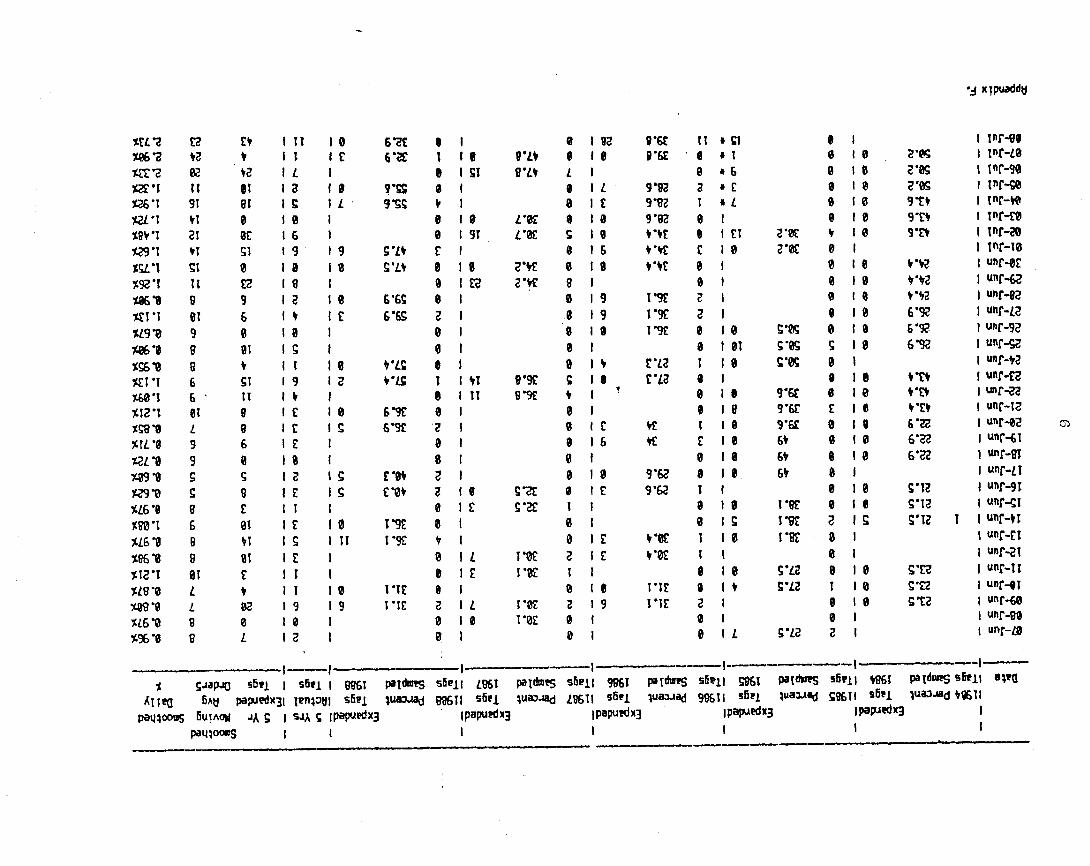
62t 6'X
9-s 9 rs
S'f) S 'Lf
6 '6s 6%
4r0LI; f 'LE
6-6'9E
foe+ E -0)
I YE 1'9E
I 'If I 'IC
a *a a*@
s*sr S'K S'8E
9-a 9.a 9'K 6+ 6 t 6 t
I*@ f*BE I'BE
S'Lt E'LZ
5'LZ
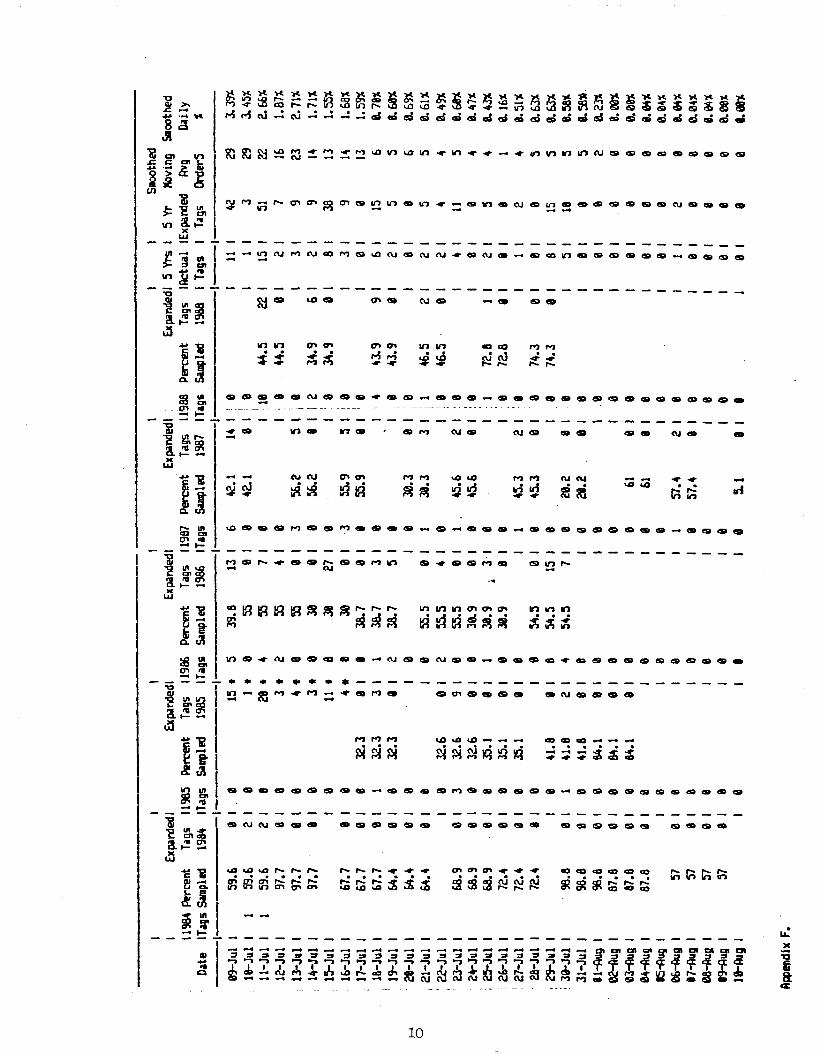
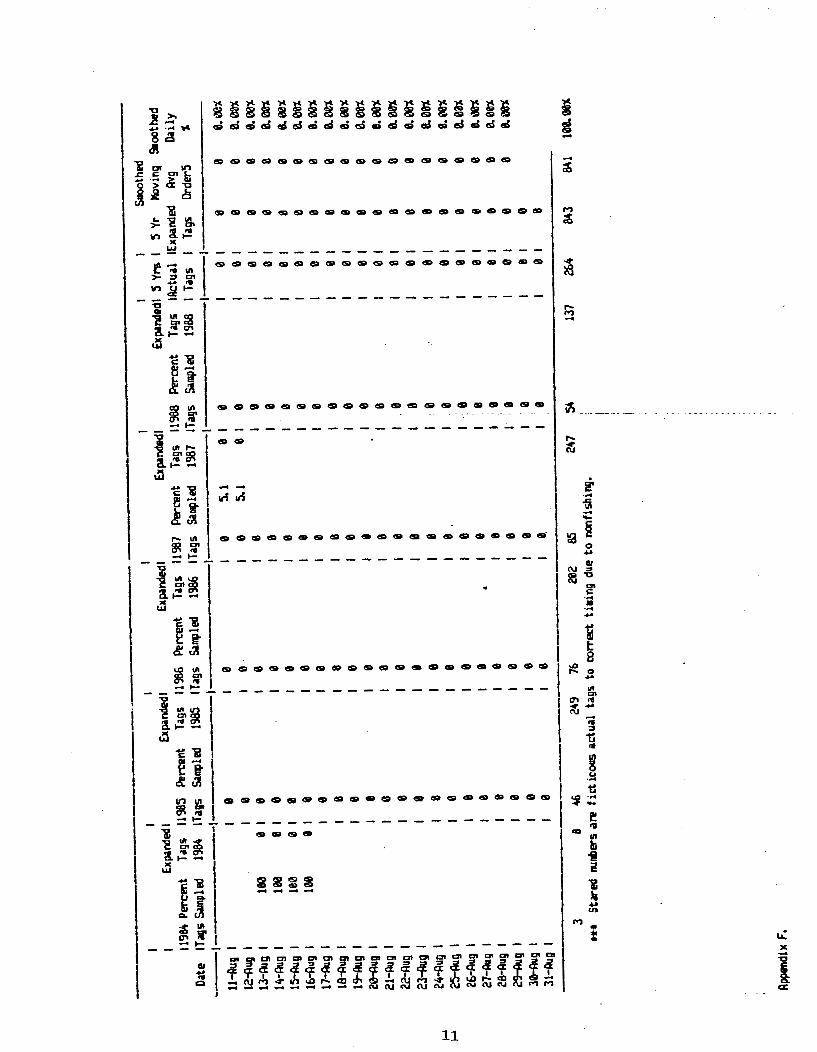
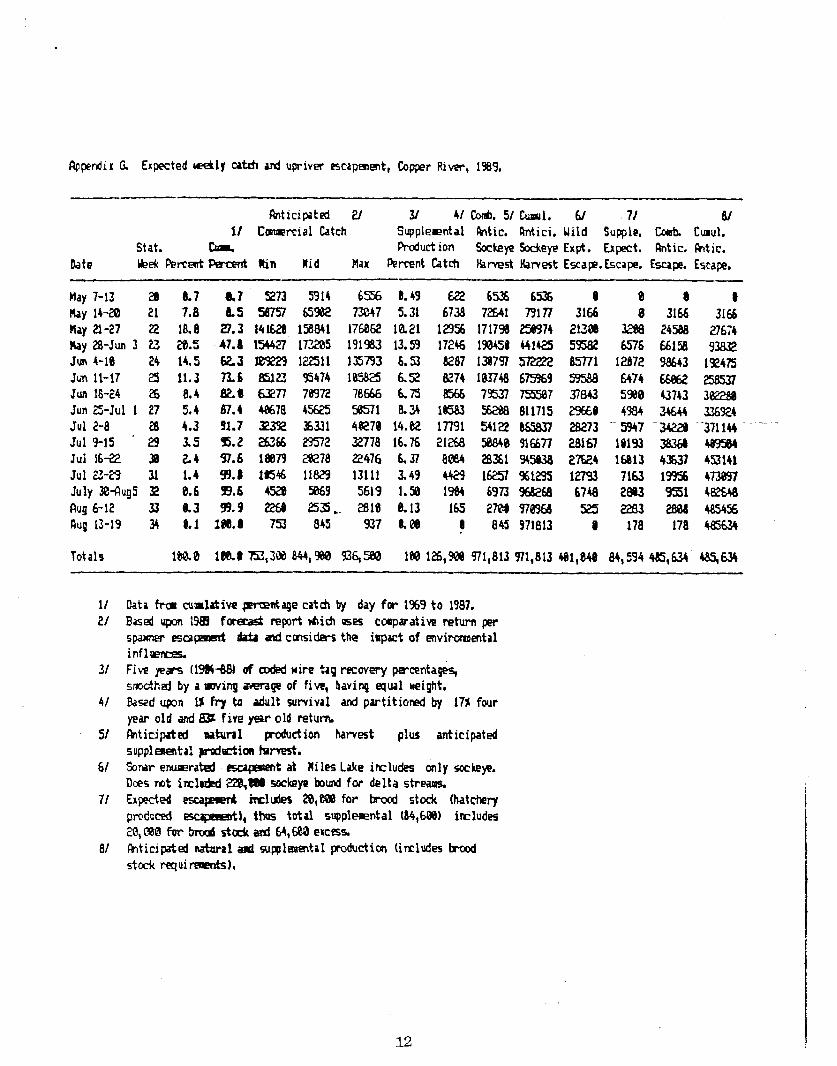
Rppemjir G. Expected &ly utdr a d upriver escapment, Coppet Riw, 1989.
hticipated 2/ 3 4 / C o l a b . 5 / ~ 1 . 6/ 7/ B/ 11 C c m r c i a l Catch Supple~ntal Pntic. Rntici. Uild Supple. Ccrsh Caul.
Stat. bn. Product ion Sockye W e y e Expt. Expect. htic. (htic. Date Ye& Percent &rant rtin Ifid Max Percent Catch Harvest Harvest Escap.Escape. b p e . Escape.
May 7-13 lrky 14-20 May 2l-27 Ray 2B-Jun 3 Jun 4-16 Jm 11-17 Jun 16-24 Jun 25-Jul 1 Jul 2-8 Jul 9-15 Jul 16-22 Jul 2x7 J U ~ Y3edugs CIug 6-12 Ru! 12-19
Totals 1M.8
Data fia cuslatiw pcrtentage catch by day f a 1969 t o 1987. Based lqron 1989 f k report hid uses colp~ativereturn per
esapad krk ad cmsides the impact of eovi~~mental i n f l a x e s Five pas (~~ of oxhi wire k g recovery percentapg s d h e d by a wig mge of five, having equal wight. Baxd upon U f q to adult survival and partitiored by 17% four year old and BS five year old re turn Ibrticiprted a;lhral pwfuction harvest plus anticipated supplesent8 praktion h;lrrest.
Sonar emrated ewpera?t at Niles Lake ircludes only sockeye. Dces mt ilclsad Zf!,S4 sockeye bound for delta strea9rs. G@ed inclules 20,- for h c d stock (hatchery pmdcced empmt),$has total supplemntal (84,686) ircludes 3,W for bmoQ rtcek ard M,W excess Gnticipafed -1 arf suglaemtal production (inclndes brood stock r e q U i M ) .
5-