Embed Size (px)
Citation preview
Histone H1 Depletion in Mammals AltersGlobal Chromatin Structure but CausesSpecific Changes in Gene RegulationYuhong Fan,1 Tatiana Nikitina,2 Jie Zhao,1 Tomara J. Fleury,3 Riddhi Bhattacharyya,1 Eric E. Bouhassira,1
Arnold Stein,3 Christopher L. Woodcock,2 and Arthur I. Skoultchi1,*1Department of Cell Biology, Albert Einstein College of Medicine, Bronx, NY 10461, USA2Department of Biology, University of Massachusetts, Amherst, MA 01003, USA3Department of Biological Sciences, Purdue University, West Lafayette, IN 47907, USA*Contact: [email protected] 10.1016/j.cell.2005.10.028
SUMMARY
Linker histone H1 plays an important role inchromatin folding in vitro. To study the roleof H1 in vivo, mouse embryonic stem cellsnull for three H1 genes were derived andwere found to have 50% of the normal levelof H1. H1 depletion caused dramatic chro-matin structure changes, including de-creased global nucleosome spacing, re-duced local chromatin compaction, anddecreases in certain core histone modifica-tions. Surprisingly, however, microarrayanalysis revealed that expression of onlya small number of genes is affected. Manyof the affected genes are imprinted or areon the X chromosome and are thereforenormally regulated by DNA methylation. Al-though global DNA methylation is notchanged, methylation of specific CpGswithin the regulatory regions of some ofthe H1 regulated genes is reduced. Theseresults indicate that linker histones can par-ticipate in epigenetic regulation of gene ex-pression by contributing to the mainte-nance or establishment of specific DNAmethylation patterns.
INTRODUCTION
The DNA of all eukaryotes is packaged into chromatin
through its association with histone proteins (van Holde,
1989; Wolffe, 1998). There are five major classes of histo-
nes: the core histones H2A, H2B, H3, and H4 that consti-
tute the protein components of nucleosome core particles
and the linker histone H1. In higher eukaryotes, the stoichi-
Cell 1Cell 1
ometry of nucleosome core particles and the linker histone
is usually considered to be about equimolar, suggesting that
H1 plays an important structural and/or functional role in
chromatin. In vitro studies indicate that linker histones can
influence chromatin structure and gene regulation (Thomas,
1999; Vignali and Workman, 1998). H1 binds to nucleo-
some core particles near the entry/exit sites of linker DNA
(van Holde, 1989) and facilitates the folding of chromatin
into a �30 nm fiber (Bednar et al., 1998; Thoma et al.,
1979). The presence of bound histone H1 also has a strong
inhibitory effect in vitro on nucleosome mobility (Pennings
et al., 1994) and transcription (Laybourn and Kadonaga,
1991; Shimamura et al., 1989). Although linker histones
are not required for assembly of nuclei under certain exper-
imental conditions in vitro (Dasso et al., 1994), they do ap-
pear to be important for the structural and functional integ-
rity of mitotic chromosomes (Maresca et al., 2005).
However, most of the functions attributed to H1 have not
been tested in vivo. In addition, it is now clear that H1 is
not essential for growth and cell division in several unicellu-
lar eukaryotes (Patterton et al., 1998; Ramon et al., 2000;
Shen et al., 1995; Ushinsky et al., 1997). Thus, the precise
in vivo roles of linker histones remain elusive (Thomas, 1999;
Vignali and Workman, 1998).
To determine the in vivo functions of H1 in higher eukar-
yotes, an experimental system is needed in which the cellular
level of H1 is reduced. This has been difficult to achieve in
mammals because mice contain at least eight H1 subtypes
that differ in amino acid sequences and expression during
development. Our previous studies showed that mice null
for one or even two of the six different somatic H1 genes
develop normally (Fan et al., 2001; Sirotkin et al., 1995). Ap-
parently, the synthetic capacity of the single-copy genes en-
coding the different subtypes is sufficiently flexible to com-
pensate for the lost contributions of the inactivated genes
and to maintain a normal H1-to-nucleosome stoichiometry.
However, we recently described a strategy for generating
compound mutants in which three H1 genes have been in-
activated. Embryos lacking the H1c, H1d, and H1e subtypes
have about 50% the normal amount of H1, and they die by
E11.5 with a very broad range of defects (Fan et al., 2003).
23, 1199–1212, December 29, 2005 ª2005 Elsevier Inc. 119923, 1199–1212, December 29, 2005 ª2005 Elsevier Inc. 1199
Therefore, in contrast to results in unicellular eukaryotes, H1
is essential for mouse development.
To begin to dissect the mechanisms by which H1 affects
chromatin structure and gene transcription in vivo, we de-
rived H1c, H1d, H1e triple null mouse embryonic stem cells
(ES cells). The triple-H1 null ES cells also have a nearly 50%
reduction in H1 content. We find that the marked reduction in
H1 amount in these cells leads to profound changes in chro-
matin structure, but surprisingly, despite the global changes
in chromatin structure in these cells, the expression of only
a small number of genes is affected. Interestingly, a shared
feature of some of these genes is that they are normally reg-
ulated by DNA methylation. The regulatory DNA regions of
some of these loci are indeed hypomethylated in cells with
reduced H1, even though global DNA methylation is not
changed. These results indicate that, in mammals, linker his-
tones can participate in regulating gene expression through
an effect on DNA methylation.
RESULTS
Triple-H1 Null ES Cells Have Reduced
Linker-Histone Content
To generate sources of chromatin that are depleted of H1 in
vivo, we inactivated the linked genes for three H1 subtypes
(H1c, H1d, and H1e) by three sequential gene targetings in
mouse ES cells, as described previously (Fan et al., 2003).
Homozygous triple-H1 null embryos die prior to E11.5, but
since many embryos survive to E7.5–E9.5, we were able to
derive homozygous triple null ES cells. A total of 40 blasto-
cysts from intercrosses of heterozygotes were cultured,
from which four H1c, H1d, H1e triple null ES cell lines were
established. Four wild-type and three heterozygous ES cell
lines were obtained and served as controls. HPLC and
TOF-MS analyses of histone proteins from wild-type and tri-
ple-H1 null ES cells showed that the mutant cells have about
50% of the amount of H1 present in the wild-type ES cells
(Figures 1A and 1B), similar to the reduction in H1 histone
content observed in triple-H1 null embryos at later stages
(Fan et al., 2003). This is equivalent to a molar ratio of only
1 H1 molecule per 4 nucleosome cores in the triple knockout
ES lines (Figure 1B). Thus, these cells offer an opportunity to
examine the properties of mammalian nuclei and chromatin
in the presence of very low levels of linker histones.
Properties of H1-Depleted ES Cells
The four triple-H1 null ES cell lines were indistinguishable in
appearance from the wild-type lines established at the same
time, most of the cells appearing morphologically undifferen-
tiated. Examination of chromosome spreads showed that
most cells in these cultures have 40 chromosomes.
Growth-rate measurements performed in parallel cultures in-
dicate that, on average, the cell growth rates of triple-H1 null
ES cells were similar to those of the wild-type cell lines. We
also did not observe any difference in size or morphology be-
tween wild-type and triple null ES nuclei. Wild-type and mu-
tant ES cells were reacted with an antibody that recognizes
1200 Cell 123, 1199–1212, December 29, 2005 ª2005 Elsevier In
all H1 subtypes and counterstained with Hoechst dye to
identify centromeric and pericentromeric heterochromatin.
H1-depleted ES cells showed no changes in differential ac-
cumulation of H1 in centromeric chromatin or any other sub-
nuclear compartment, and there was also no difference in
H1 distribution along mitotic chromosomes (data not
shown). Immunofluorescence examination of the intranu-
clear distribution of the key histone modifications
H4K12Ac; H3K9Me(2); H3K27Me(3); and nonhistone pro-
teins known to be associated with heterochromatin, such
as HP1a, HP1b, and MeCP2, also revealed no significant dif-
ferences in intranuclear distribution between the wild-type
and H1-depleted ES cells (data not shown).
Reducing Linker-Histone Content Leads
to Decreases in Nucleosome Repeat Length
Carefully controlled micrococcal nuclease digests of isolated
wild-type and H1-depleted nuclei revealed that H1 depletion
was accompanied by a striking �15 bp reduction in the
spacing between nucleosomes (nucleosome repeat length,
NRL) from�189 bp to�174 bp (Figures 1C and 1D, left pan-
els). Digestion and release conditions were selected to min-
imize nucleosome sliding and exchange, and the use of sev-
eral time points of digestion for each batch of nuclei showed
that the measured NRL changes were not an artifact due to
differences in the extent of digestion. Further, the clear linear
relationship between nucleosome number and DNA length
permits confidence in the calculated NRL values. As dis-
cussed below, the strong correlation between NRL and total
H1 per nucleosome applies both to adult mouse tissues and
ES cells over a wide range of H1 content, suggesting that
linker-histone availability is a primary determinant of nucleo-
some spacing.
Since the vast majority of the genome consists of noncod-
ing sequences, it was possible that the observed changes in
NRL were confined to this portion of the genome. We there-
fore examined the adenosine deaminase (ADA) ‘‘house-
keeping’’ gene, which is transcribed at a similarly low level
in both wild-type and H1-depleted cells (as determined
from cDNA microarray analysis; see below). The ADA-
specific NRL values for wild-type and H1 depleted cells (Fig-
ures 1C and 1D, middle panels) were not significantly dif-
ferent from the respective nucleus-wide averages. This
indicates that the reduction in NRL is not confined to the
noncoding portion of the genome or to heterochromatin.
As discussed below, some genes are significantly upregu-
lated in the H1-depleted ES cells, and it was of interest to de-
termine whether these genes exhibit similar changes in NRL.
We chose to analyze the imprinting control region (ICR) of the
H19 gene because H19 RNA is significantly increased in the
triple-H1 null ES cells (see below). Surprisingly, the H19 ICR
has a NRL of only 171 ± 5 bp in wild-type ES cells, signifi-
cantly lower than the bulk and ADA-specific NRL values in
these cells (Figures 1C and 1D, right panels). Furthermore,
in triple-H1 null cells, in which H19 gene expression is upreg-
ulated 7-fold, the NRL was 165 ± 5 bp, a value comparable
to the NRL of yeast that lacks a canonical H1. We also noted
that the H19 ICR signal on the blots showed fewer clearly
c.
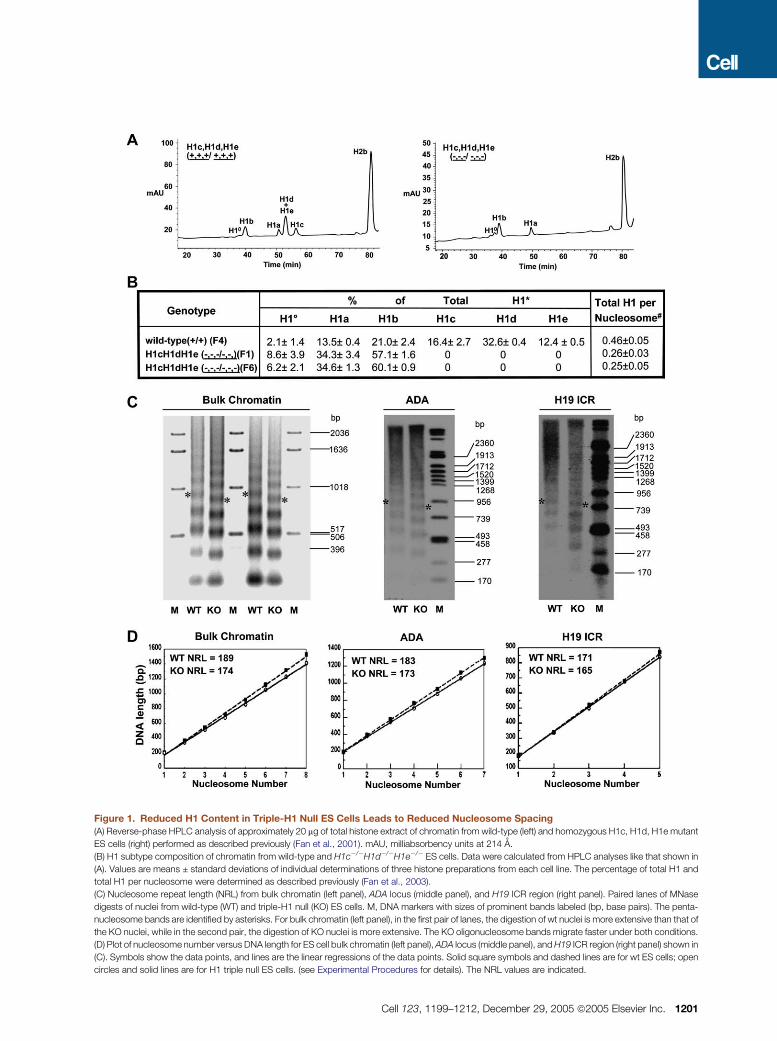
Figure 1. Reduced H1 Content in Triple-H1 Null ES Cells Leads to Reduced Nucleosome Spacing
(A) Reverse-phase HPLC analysis of approximately 20 mg of total histone extract of chromatin from wild-type (left) and homozygous H1c, H1d, H1e mutant
ES cells (right) performed as described previously (Fan et al., 2001). mAU, milliabsorbency units at 214 A.
(B) H1 subtype composition of chromatin from wild-type and H1c�/�H1d�/�H1e�/� ES cells. Data were calculated from HPLC analyses like that shown in
(A). Values are means ± standard deviations of individual determinations of three histone preparations from each cell line. The percentage of total H1 and
total H1 per nucleosome were determined as described previously (Fan et al., 2003).
(C) Nucleosome repeat length (NRL) from bulk chromatin (left panel), ADA locus (middle panel), and H19 ICR region (right panel). Paired lanes of MNase
digests of nuclei from wild-type (WT) and triple-H1 null (KO) ES cells. M, DNA markers with sizes of prominent bands labeled (bp, base pairs). The penta-
nucleosome bands are identified by asterisks. For bulk chromatin (left panel), in the first pair of lanes, the digestion of wt nuclei is more extensive than that of
the KO nuclei, while in the second pair, the digestion of KO nuclei is more extensive. The KO oligonucleosome bands migrate faster under both conditions.
(D) Plot of nucleosome number versus DNA length for ES cell bulk chromatin (left panel), ADA locus (middle panel), and H19 ICR region (right panel) shown in
(C). Symbols show the data points, and lines are the linear regressions of the data points. Solid square symbols and dashed lines are for wt ES cells; open
circles and solid lines are for H1 triple null ES cells. (see Experimental Procedures for details). The NRL values are indicated.
Cell 123, 1199–1212, December 29, 2005 ª2005 Elsevier Inc. 1201
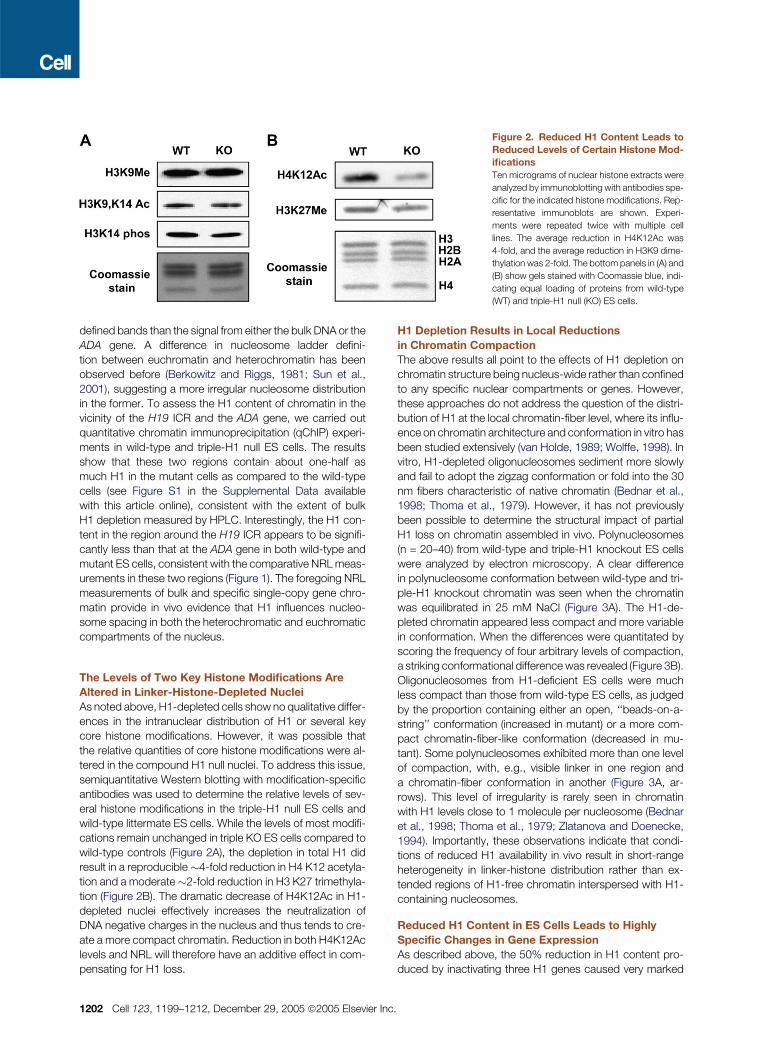
Figure 2. Reduced H1 Content Leads to
Reduced Levels of Certain Histone Mod-
ifications
Ten micrograms of nuclear histone extracts were
analyzed by immunoblotting with antibodies spe-
cific for the indicated histone modifications. Rep-
resentative immunoblots are shown. Experi-
ments were repeated twice with multiple cell
lines. The average reduction in H4K12Ac was
4-fold, and the average reduction in H3K9 dime-
thylation was 2-fold. The bottom panels in (A) and
(B) show gels stained with Coomassie blue, indi-
cating equal loading of proteins from wild-type
(WT) and triple-H1 null (KO) ES cells.
defined bands than the signal from either the bulk DNA or the
ADA gene. A difference in nucleosome ladder defini-
tion between euchromatin and heterochromatin has been
observed before (Berkowitz and Riggs, 1981; Sun et al.,
2001), suggesting a more irregular nucleosome distribution
in the former. To assess the H1 content of chromatin in the
vicinity of the H19 ICR and the ADA gene, we carried out
quantitative chromatin immunoprecipitation (qChIP) experi-
ments in wild-type and triple-H1 null ES cells. The results
show that these two regions contain about one-half as
much H1 in the mutant cells as compared to the wild-type
cells (see Figure S1 in the Supplemental Data available
with this article online), consistent with the extent of bulk
H1 depletion measured by HPLC. Interestingly, the H1 con-
tent in the region around the H19 ICR appears to be signifi-
cantly less than that at the ADA gene in both wild-type and
mutant ES cells, consistent with the comparative NRL meas-
urements in these two regions (Figure 1). The foregoing NRL
measurements of bulk and specific single-copy gene chro-
matin provide in vivo evidence that H1 influences nucleo-
some spacing in both the heterochromatic and euchromatic
compartments of the nucleus.
The Levels of Two Key Histone Modifications Are
Altered in Linker-Histone-Depleted Nuclei
As noted above, H1-depleted cells show no qualitative differ-
ences in the intranuclear distribution of H1 or several key
core histone modifications. However, it was possible that
the relative quantities of core histone modifications were al-
tered in the compound H1 null nuclei. To address this issue,
semiquantitative Western blotting with modification-specific
antibodies was used to determine the relative levels of sev-
eral histone modifications in the triple-H1 null ES cells and
wild-type littermate ES cells. While the levels of most modifi-
cations remain unchanged in triple KO ES cells compared to
wild-type controls (Figure 2A), the depletion in total H1 did
result in a reproducible �4-fold reduction in H4 K12 acetyla-
tion and a moderate�2-fold reduction in H3 K27 trimethyla-
tion (Figure 2B). The dramatic decrease of H4K12Ac in H1-
depleted nuclei effectively increases the neutralization of
DNA negative charges in the nucleus and thus tends to cre-
ate a more compact chromatin. Reduction in both H4K12Ac
levels and NRL will therefore have an additive effect in com-
pensating for H1 loss.
1202 Cell 123, 1199–1212, December 29, 2005 ª2005 Elsevier In
H1 Depletion Results in Local Reductions
in Chromatin Compaction
The above results all point to the effects of H1 depletion on
chromatin structure being nucleus-wide rather than confined
to any specific nuclear compartments or genes. However,
these approaches do not address the question of the distri-
bution of H1 at the local chromatin-fiber level, where its influ-
ence on chromatin architecture and conformation in vitro has
been studied extensively (van Holde, 1989; Wolffe, 1998). In
vitro, H1-depleted oligonucleosomes sediment more slowly
and fail to adopt the zigzag conformation or fold into the 30
nm fibers characteristic of native chromatin (Bednar et al.,
1998; Thoma et al., 1979). However, it has not previously
been possible to determine the structural impact of partial
H1 loss on chromatin assembled in vivo. Polynucleosomes
(n = 20–40) from wild-type and triple-H1 knockout ES cells
were analyzed by electron microscopy. A clear difference
in polynucleosome conformation between wild-type and tri-
ple-H1 knockout chromatin was seen when the chromatin
was equilibrated in 25 mM NaCl (Figure 3A). The H1-de-
pleted chromatin appeared less compact and more variable
in conformation. When the differences were quantitated by
scoring the frequency of four arbitrary levels of compaction,
a striking conformational difference was revealed (Figure 3B).
Oligonucleosomes from H1-deficient ES cells were much
less compact than those from wild-type ES cells, as judged
by the proportion containing either an open, ‘‘beads-on-a-
string’’ conformation (increased in mutant) or a more com-
pact chromatin-fiber-like conformation (decreased in mu-
tant). Some polynucleosomes exhibited more than one level
of compaction, with, e.g., visible linker in one region and
a chromatin-fiber conformation in another (Figure 3A, ar-
rows). This level of irregularity is rarely seen in chromatin
with H1 levels close to 1 molecule per nucleosome (Bednar
et al., 1998; Thoma et al., 1979; Zlatanova and Doenecke,
1994). Importantly, these observations indicate that condi-
tions of reduced H1 availability in vivo result in short-range
heterogeneity in linker-histone distribution rather than ex-
tended regions of H1-free chromatin interspersed with H1-
containing nucleosomes.
Reduced H1 Content in ES Cells Leads to Highly
Specific Changes in Gene Expression
As described above, the 50% reduction in H1 content pro-
duced by inactivating three H1 genes caused very marked
c.
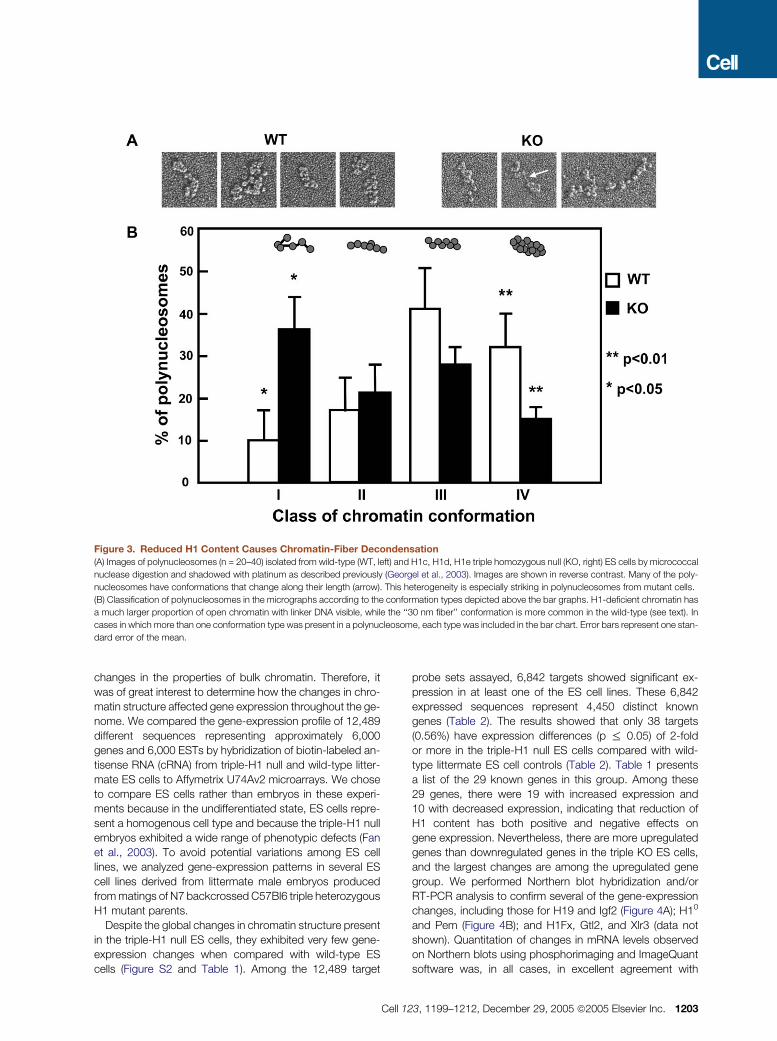
Figure 3. Reduced H1 Content Causes Chromatin-Fiber Decondensation
(A) Images of polynucleosomes (n = 20–40) isolated from wild-type (WT, left) and H1c, H1d, H1e triple homozygous null (KO, right) ES cells by micrococcal
nuclease digestion and shadowed with platinum as described previously (Georgel et al., 2003). Images are shown in reverse contrast. Many of the poly-
nucleosomes have conformations that change along their length (arrow). This heterogeneity is especially striking in polynucleosomes from mutant cells.
(B) Classification of polynucleosomes in the micrographs according to the conformation types depicted above the bar graphs. H1-deficient chromatin has
a much larger proportion of open chromatin with linker DNA visible, while the ‘‘30 nm fiber’’ conformation is more common in the wild-type (see text). In
cases in which more than one conformation type was present in a polynucleosome, each type was included in the bar chart. Error bars represent one stan-
dard error of the mean.
changes in the properties of bulk chromatin. Therefore, it
was of great interest to determine how the changes in chro-
matin structure affected gene expression throughout the ge-
nome. We compared the gene-expression profile of 12,489
different sequences representing approximately 6,000
genes and 6,000 ESTs by hybridization of biotin-labeled an-
tisense RNA (cRNA) from triple-H1 null and wild-type litter-
mate ES cells to Affymetrix U74Av2 microarrays. We chose
to compare ES cells rather than embryos in these experi-
ments because in the undifferentiated state, ES cells repre-
sent a homogenous cell type and because the triple-H1 null
embryos exhibited a wide range of phenotypic defects (Fan
et al., 2003). To avoid potential variations among ES cell
lines, we analyzed gene-expression patterns in several ES
cell lines derived from littermate male embryos produced
from matings of N7 backcrossed C57Bl6 triple heterozygous
H1 mutant parents.
Despite the global changes in chromatin structure present
in the triple-H1 null ES cells, they exhibited very few gene-
expression changes when compared with wild-type ES
cells (Figure S2 and Table 1). Among the 12,489 target
Cell 1
probe sets assayed, 6,842 targets showed significant ex-
pression in at least one of the ES cell lines. These 6,842
expressed sequences represent 4,450 distinct known
genes (Table 2). The results showed that only 38 targets
(0.56%) have expression differences (p % 0.05) of 2-fold
or more in the triple-H1 null ES cells compared with wild-
type littermate ES cell controls (Table 2). Table 1 presents
a list of the 29 known genes in this group. Among these
29 genes, there were 19 with increased expression and
10 with decreased expression, indicating that reduction of
H1 content has both positive and negative effects on
gene expression. Nevertheless, there are more upregulated
genes than downregulated genes in the triple KO ES cells,
and the largest changes are among the upregulated gene
group. We performed Northern blot hybridization and/or
RT-PCR analysis to confirm several of the gene-expression
changes, including those for H19 and Igf2 (Figure 4A); H10
and Pem (Figure 4B); and H1Fx, Gtl2, and Xlr3 (data not
shown). Quantitation of changes in mRNA levels observed
on Northern blots using phosphorimaging and ImageQuant
software was, in all cases, in excellent agreement with
23, 1199–1212, December 29, 2005 ª2005 Elsevier Inc. 1203
Table 1. Genes with Altered Expression in Triple-H1 Null ES Cells
AccessionNumber Entrez Definition
Average FoldChangea
ChromosomalLocation
Genes with Increased Expression in Triple-H1 Null ES Cellsa
L22977 Mus musculus A12 gene, two nearly identical genes, XLR3a andXlr3b (X-linked lymphocyte regulated)
10.3 X
Y13832 Mus musculus mRNA for GT12 protein 9.1 12
X58196 Mus musculus H19 mRNA 7.1 7
AJ006584 Mus musculus mRNA for translation initiation factor eIF2
gamma Y-linked
6.4 Y
M32484 Mus musculus placenta and embryonic expression early gene
(pem) mRNA, complete cds
4.6 X
M80631 Mouse G protein alpha subunit (GNA-14) mRNA, complete cds 4.4 19
M29260 Mouse histone 1-0 gene, 50 end, and promoter region 4.0 15
M55413 Mus musculus vitamin D-binding protein (GC) mRNA, partial cds 3.2 5
M20625 Mouse testis-specific cytochrome c mRNA 2.9 2
AJ007376 Mus musculus mRNA for DBY RNA helicase 2.8 Y
X05546 Murine (DBA/2) mRNA fragment for gag related peptide 2.8 b
X03505 Mouse gene exon 2 for serum amyloid A (SAA) 3 protein 2.7 7
AF017453 Mus musculus homeobox protein PSX mRNA, complete cds 2.6 X
NM019703 Mus musculus phosphofructokinase, platelet (Pfkp), mRNA 2.6 13
AI851599 ESTs, weakly similar to H1.4_MOUSE histone H1.4 (H1 VAR.2)(H1E) [Mus musculus] (putative ortholog H1x)
2.5 6
D88539 Mus musculus mRNA for synaptonemal complex protein 1,
partial cds
2.4 3
AF068182 Mus musculus B cell linker protein BLNK mRNA, complete cds 2.1 19
X69832 Mus musculus mRNA for serine protease inhibitor 2.4 2.1 12
X04120 Mus musculus intracisternal A-particle IAP-IL3 genome deleted
type I element inserted 50 to the interleukin-3 gene
2.0 b
Genes with Decreased Expression in Triple-H1 Null ES Cellsa
X71922 Mus musculus gene for IGF-II, exon 6 3.1 7
AF090738 Mus musculus insulin receptor substrate-2 (Irs2) gene, partial cds 2.5 8
NM 023422 Mus musculus H2B histone family, member S (H2bfs), mRNA 2.4 13
M12481 Mouse cytoplasmic beta-actin mRNA 2.2 5
X95504 Mus musculus zinc finger protein regulator of apoptosis and cell
cycle arrest (Zac1), mRNA
2.2 10
K02245 Mouse proliferin mRNA, complete cds 2.2 13
AF009366 Mus musculus neural precursor cell expressed developmentally
downregulated Nedd9 (Nedd9) mRNA, complete cds
2.1 13
AJ132098 Mus musculus mRNA for Vanin-1 2.1 10
U41465 Mus musculus BCL-6 mRNA, complete cds 2.0 16
L33779 Mus musculus desmocollin type 2 (DSC2) mRNA, complete cds,alternatively spliced
2.0 18
a Genes listed have increased or decreased expression R2-fold in triple-H1 null ES cells versus wild-type ES cells (p % 0.05).b Target sequences are present at multiple chromosomal locations.
1204 Cell 123, 1199–1212, December 29, 2005 ª2005 Elsevier Inc.
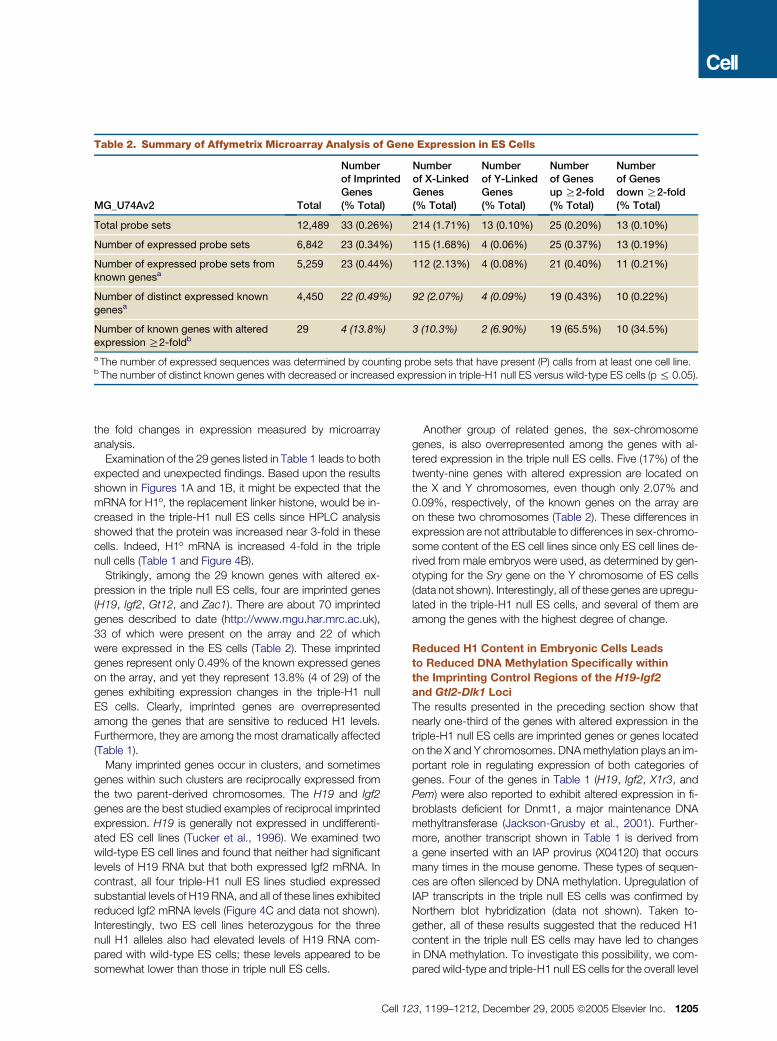
Table 2. Summary of Affymetrix Microarray Analysis of Gene Expression in ES Cells
MG_U74Av2 Total
Numberof ImprintedGenes(% Total)
Numberof X-LinkedGenes(% Total)
Numberof Y-LinkedGenes(% Total)
Numberof Genesup R2-fold(% Total)
Numberof Genesdown R2-fold(% Total)
Total probe sets 12,489 33 (0.26%) 214 (1.71%) 13 (0.10%) 25 (0.20%) 13 (0.10%)
Number of expressed probe sets 6,842 23 (0.34%) 115 (1.68%) 4 (0.06%) 25 (0.37%) 13 (0.19%)
Number of expressed probe sets fromknown genesa
5,259 23 (0.44%) 112 (2.13%) 4 (0.08%) 21 (0.40%) 11 (0.21%)
Number of distinct expressed known
genesa4,450 22 (0.49%) 92 (2.07%) 4 (0.09%) 19 (0.43%) 10 (0.22%)
Number of known genes with altered
expression R2-foldb29 4 (13.8%) 3 (10.3%) 2 (6.90%) 19 (65.5%) 10 (34.5%)
a The number of expressed sequences was determined by counting probe sets that have present (P) calls from at least one cell line.b The number of distinct known genes with decreased or increased expression in triple-H1 null ES versus wild-type ES cells (p % 0.05).
the fold changes in expression measured by microarray
analysis.
Examination of the 29 genes listed in Table 1 leads to both
expected and unexpected findings. Based upon the results
shown in Figures 1A and 1B, it might be expected that the
mRNA for H1º, the replacement linker histone, would be in-
creased in the triple-H1 null ES cells since HPLC analysis
showed that the protein was increased near 3-fold in these
cells. Indeed, H1º mRNA is increased 4-fold in the triple
null cells (Table 1 and Figure 4B).
Strikingly, among the 29 known genes with altered ex-
pression in the triple null ES cells, four are imprinted genes
(H19, Igf2, Gt12, and Zac1). There are about 70 imprinted
genes described to date (http://www.mgu.har.mrc.ac.uk),
33 of which were present on the array and 22 of which
were expressed in the ES cells (Table 2). These imprinted
genes represent only 0.49% of the known expressed genes
on the array, and yet they represent 13.8% (4 of 29) of the
genes exhibiting expression changes in the triple-H1 null
ES cells. Clearly, imprinted genes are overrepresented
among the genes that are sensitive to reduced H1 levels.
Furthermore, they are among the most dramatically affected
(Table 1).
Many imprinted genes occur in clusters, and sometimes
genes within such clusters are reciprocally expressed from
the two parent-derived chromosomes. The H19 and Igf2
genes are the best studied examples of reciprocal imprinted
expression. H19 is generally not expressed in undifferenti-
ated ES cell lines (Tucker et al., 1996). We examined two
wild-type ES cell lines and found that neither had significant
levels of H19 RNA but that both expressed Igf2 mRNA. In
contrast, all four triple-H1 null ES lines studied expressed
substantial levels of H19 RNA, and all of these lines exhibited
reduced Igf2 mRNA levels (Figure 4C and data not shown).
Interestingly, two ES cell lines heterozygous for the three
null H1 alleles also had elevated levels of H19 RNA com-
pared with wild-type ES cells; these levels appeared to be
somewhat lower than those in triple null ES cells.
Cell 1
Another group of related genes, the sex-chromosome
genes, is also overrepresented among the genes with al-
tered expression in the triple null ES cells. Five (17%) of the
twenty-nine genes with altered expression are located on
the X and Y chromosomes, even though only 2.07% and
0.09%, respectively, of the known genes on the array are
on these two chromosomes (Table 2). These differences in
expression are not attributable to differences in sex-chromo-
some content of the ES cell lines since only ES cell lines de-
rived from male embryos were used, as determined by gen-
otyping for the Sry gene on the Y chromosome of ES cells
(data not shown). Interestingly, all of these genes are upregu-
lated in the triple-H1 null ES cells, and several of them are
among the genes with the highest degree of change.
Reduced H1 Content in Embryonic Cells Leads
to Reduced DNA Methylation Specifically within
the Imprinting Control Regions of the H19-Igf2
and Gtl2-Dlk1 Loci
The results presented in the preceding section show that
nearly one-third of the genes with altered expression in the
triple-H1 null ES cells are imprinted genes or genes located
on the X and Y chromosomes. DNA methylation plays an im-
portant role in regulating expression of both categories of
genes. Four of the genes in Table 1 (H19, Igf2, X1r3, and
Pem) were also reported to exhibit altered expression in fi-
broblasts deficient for Dnmt1, a major maintenance DNA
methyltransferase (Jackson-Grusby et al., 2001). Further-
more, another transcript shown in Table 1 is derived from
a gene inserted with an IAP provirus (X04120) that occurs
many times in the mouse genome. These types of sequen-
ces are often silenced by DNA methylation. Upregulation of
IAP transcripts in the triple null ES cells was confirmed by
Northern blot hybridization (data not shown). Taken to-
gether, all of these results suggested that the reduced H1
content in the triple null ES cells may have led to changes
in DNA methylation. To investigate this possibility, we com-
pared wild-type and triple-H1 null ES cells for the overall level
23, 1199–1212, December 29, 2005 ª2005 Elsevier Inc. 1205
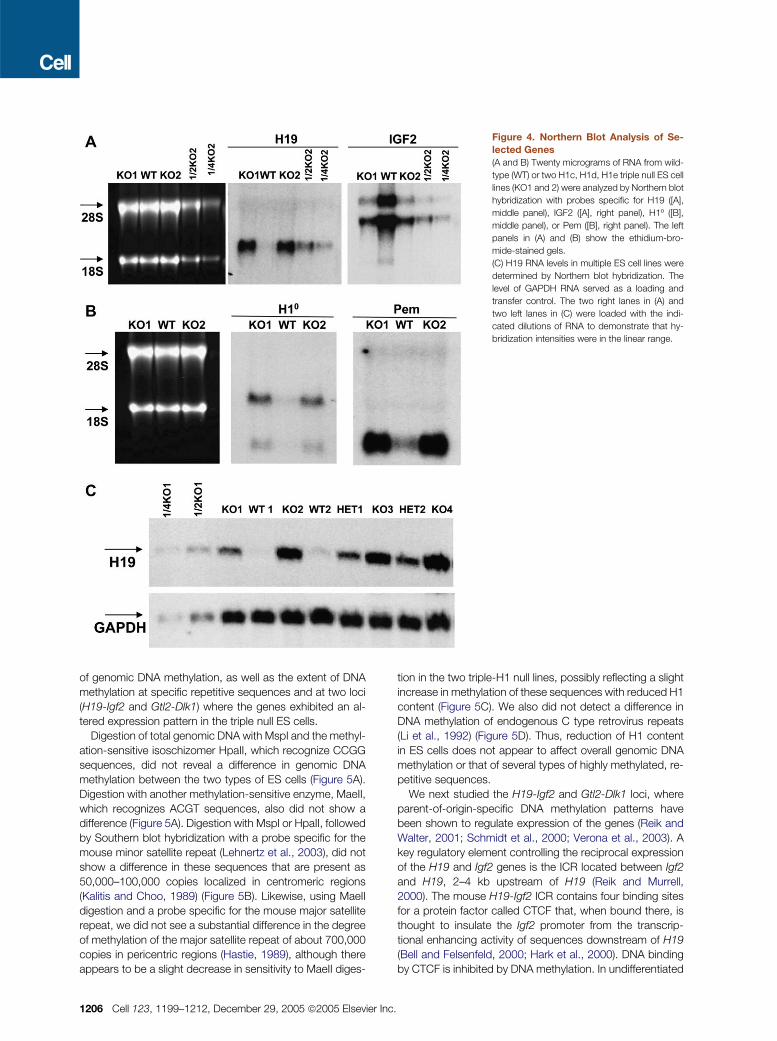
Figure 4. Northern Blot Analysis of Se-
lected Genes
(A and B) Twenty micrograms of RNA from wild-
type (WT) or two H1c, H1d, H1e triple null ES cell
lines (KO1 and 2) were analyzed by Northern blot
hybridization with probes specific for H19 ([A],
middle panel), IGF2 ([A], right panel), H1º ([B],
middle panel), or Pem ([B], right panel). The left
panels in (A) and (B) show the ethidium-bro-
mide-stained gels.
(C) H19 RNA levels in multiple ES cell lines were
determined by Northern blot hybridization. The
level of GAPDH RNA served as a loading and
transfer control. The two right lanes in (A) and
two left lanes in (C) were loaded with the indi-
cated dilutions of RNA to demonstrate that hy-
bridization intensities were in the linear range.
of genomic DNA methylation, as well as the extent of DNA
methylation at specific repetitive sequences and at two loci
(H19-Igf2 and Gtl2-Dlk1) where the genes exhibited an al-
tered expression pattern in the triple null ES cells.
Digestion of total genomic DNA with MspI and the methyl-
ation-sensitive isoschizomer HpaII, which recognize CCGG
sequences, did not reveal a difference in genomic DNA
methylation between the two types of ES cells (Figure 5A).
Digestion with another methylation-sensitive enzyme, MaeII,
which recognizes ACGT sequences, also did not show a
difference (Figure 5A). Digestion with MspI or HpaII, followed
by Southern blot hybridization with a probe specific for the
mouse minor satellite repeat (Lehnertz et al., 2003), did not
show a difference in these sequences that are present as
50,000–100,000 copies localized in centromeric regions
(Kalitis and Choo, 1989) (Figure 5B). Likewise, using MaeII
digestion and a probe specific for the mouse major satellite
repeat, we did not see a substantial difference in the degree
of methylation of the major satellite repeat of about 700,000
copies in pericentric regions (Hastie, 1989), although there
appears to be a slight decrease in sensitivity to MaeII diges-
1206 Cell 123, 1199–1212, December 29, 2005 ª2005 Elsevier In
tion in the two triple-H1 null lines, possibly reflecting a slight
increase in methylation of these sequences with reduced H1
content (Figure 5C). We also did not detect a difference in
DNA methylation of endogenous C type retrovirus repeats
(Li et al., 1992) (Figure 5D). Thus, reduction of H1 content
in ES cells does not appear to affect overall genomic DNA
methylation or that of several types of highly methylated, re-
petitive sequences.
We next studied the H19-Igf2 and Gtl2-Dlk1 loci, where
parent-of-origin-specific DNA methylation patterns have
been shown to regulate expression of the genes (Reik and
Walter, 2001; Schmidt et al., 2000; Verona et al., 2003). A
key regulatory element controlling the reciprocal expression
of the H19 and Igf2 genes is the ICR located between Igf2
and H19, 2–4 kb upstream of H19 (Reik and Murrell,
2000). The mouse H19-Igf2 ICR contains four binding sites
for a protein factor called CTCF that, when bound there, is
thought to insulate the Igf2 promoter from the transcrip-
tional enhancing activity of sequences downstream of H19
(Bell and Felsenfeld, 2000; Hark et al., 2000). DNA binding
by CTCF is inhibited by DNA methylation. In undifferentiated
c.
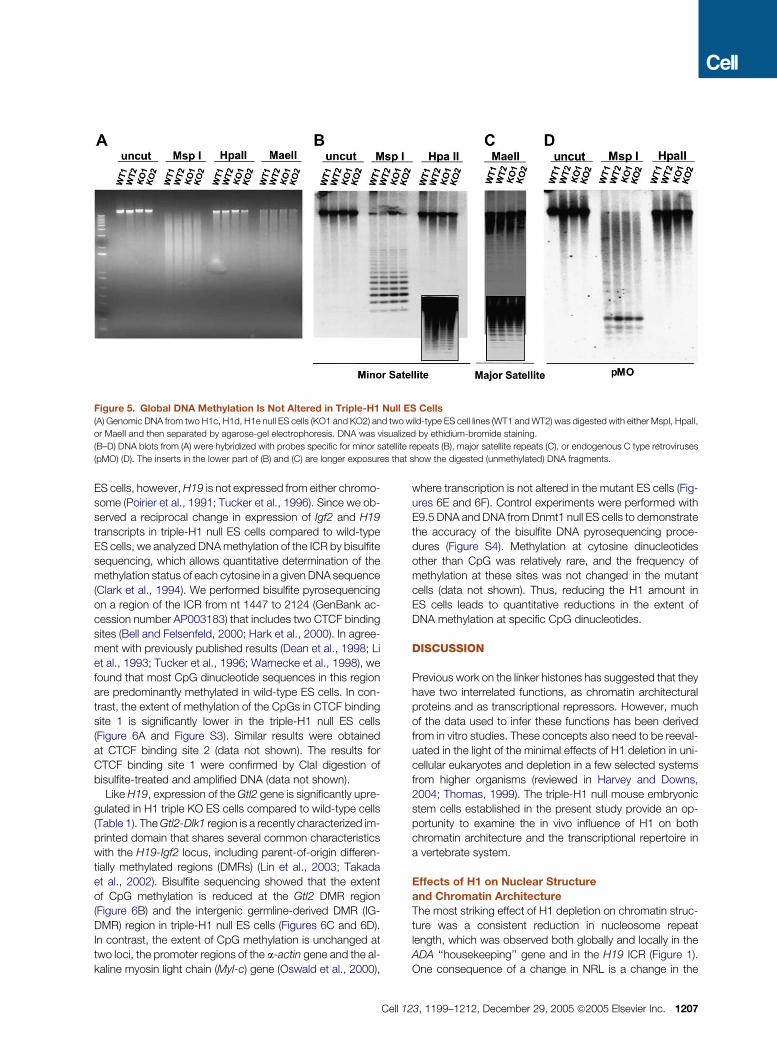
Figure 5. Global DNA Methylation Is Not Altered in Triple-H1 Null ES Cells
(A) Genomic DNA from two H1c, H1d, H1e null ES cells (KO1 and KO2) and two wild-type ES cell lines (WT1 and WT2) was digested with either MspI, HpaII,
or MaeII and then separated by agarose-gel electrophoresis. DNA was visualized by ethidium-bromide staining.
(B–D) DNA blots from (A) were hybridized with probes specific for minor satellite repeats (B), major satellite repeats (C), or endogenous C type retroviruses
(pMO) (D). The inserts in the lower part of (B) and (C) are longer exposures that show the digested (unmethylated) DNA fragments.
ES cells, however, H19 is not expressed from either chromo-
some (Poirier et al., 1991; Tucker et al., 1996). Since we ob-
served a reciprocal change in expression of Igf2 and H19
transcripts in triple-H1 null ES cells compared to wild-type
ES cells, we analyzed DNA methylation of the ICR by bisulfite
sequencing, which allows quantitative determination of the
methylation status of each cytosine in a given DNA sequence
(Clark et al., 1994). We performed bisulfite pyrosequencing
on a region of the ICR from nt 1447 to 2124 (GenBank ac-
cession number AP003183) that includes two CTCF binding
sites (Bell and Felsenfeld, 2000; Hark et al., 2000). In agree-
ment with previously published results (Dean et al., 1998; Li
et al., 1993; Tucker et al., 1996; Warnecke et al., 1998), we
found that most CpG dinucleotide sequences in this region
are predominantly methylated in wild-type ES cells. In con-
trast, the extent of methylation of the CpGs in CTCF binding
site 1 is significantly lower in the triple-H1 null ES cells
(Figure 6A and Figure S3). Similar results were obtained
at CTCF binding site 2 (data not shown). The results for
CTCF binding site 1 were confirmed by ClaI digestion of
bisulfite-treated and amplified DNA (data not shown).
Like H19, expression of the Gtl2 gene is significantly upre-
gulated in H1 triple KO ES cells compared to wild-type cells
(Table 1). The Gtl2-Dlk1 region is a recently characterized im-
printed domain that shares several common characteristics
with the H19-Igf2 locus, including parent-of-origin differen-
tially methylated regions (DMRs) (Lin et al., 2003; Takada
et al., 2002). Bisulfite sequencing showed that the extent
of CpG methylation is reduced at the Gtl2 DMR region
(Figure 6B) and the intergenic germline-derived DMR (IG-
DMR) region in triple-H1 null ES cells (Figures 6C and 6D).
In contrast, the extent of CpG methylation is unchanged at
two loci, the promoter regions of the a-actin gene and the al-
kaline myosin light chain (Myl-c) gene (Oswald et al., 2000),
Cell
where transcription is not altered in the mutant ES cells (Fig-
ures 6E and 6F). Control experiments were performed with
E9.5 DNA and DNA from Dnmt1 null ES cells to demonstrate
the accuracy of the bisulfite DNA pyrosequencing proce-
dures (Figure S4). Methylation at cytosine dinucleotides
other than CpG was relatively rare, and the frequency of
methylation at these sites was not changed in the mutant
cells (data not shown). Thus, reducing the H1 amount in
ES cells leads to quantitative reductions in the extent of
DNA methylation at specific CpG dinucleotides.
DISCUSSION
Previous work on the linker histones has suggested that they
have two interrelated functions, as chromatin architectural
proteins and as transcriptional repressors. However, much
of the data used to infer these functions has been derived
from in vitro studies. These concepts also need to be reeval-
uated in the light of the minimal effects of H1 deletion in uni-
cellular eukaryotes and depletion in a few selected systems
from higher organisms (reviewed in Harvey and Downs,
2004; Thomas, 1999). The triple-H1 null mouse embryonic
stem cells established in the present study provide an op-
portunity to examine the in vivo influence of H1 on both
chromatin architecture and the transcriptional repertoire in
a vertebrate system.
Effects of H1 on Nuclear Structure
and Chromatin Architecture
The most striking effect of H1 depletion on chromatin struc-
ture was a consistent reduction in nucleosome repeat
length, which was observed both globally and locally in the
ADA ‘‘housekeeping’’ gene and in the H19 ICR (Figure 1).
One consequence of a change in NRL is a change in the
123, 1199–1212, December 29, 2005 ª2005 Elsevier Inc. 1207
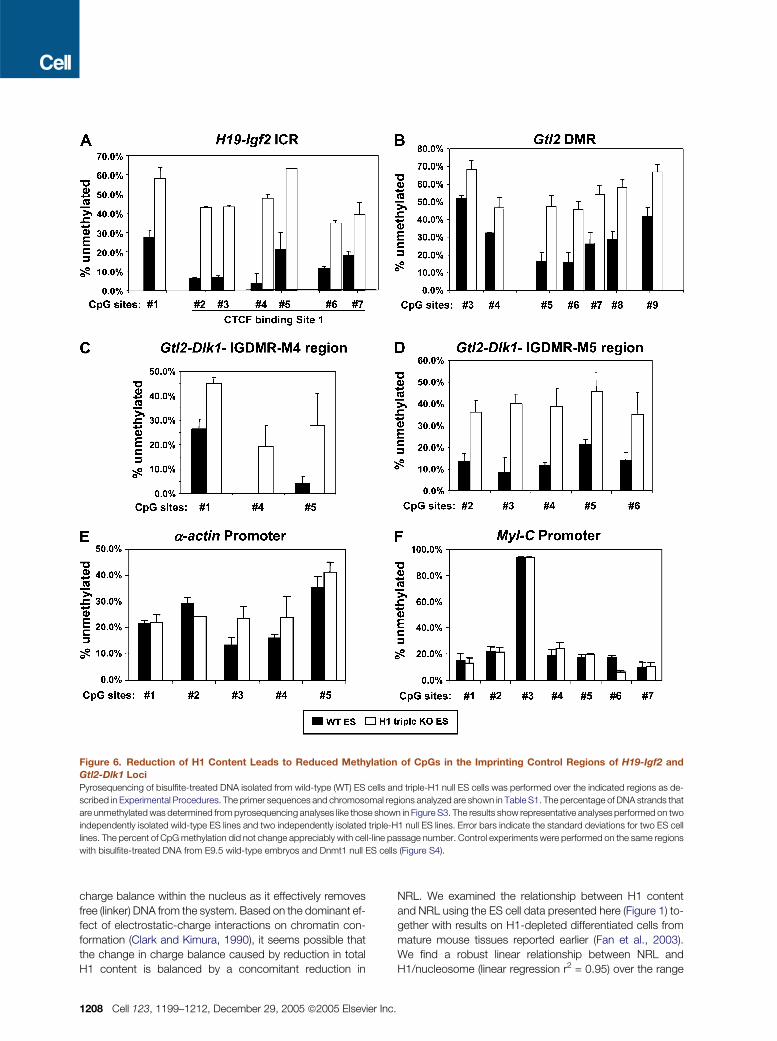
Figure 6. Reduction of H1 Content Leads to Reduced Methylation of CpGs in the Imprinting Control Regions of H19-Igf2 and
Gtl2-Dlk1 Loci
Pyrosequencing of bisulfite-treated DNA isolated from wild-type (WT) ES cells and triple-H1 null ES cells was performed over the indicated regions as de-
scribed in Experimental Procedures. The primer sequences and chromosomal regions analyzed are shown in Table S1. The percentage of DNA strands that
are unmethylated was determined from pyrosequencing analyses like those shown in Figure S3. The results show representative analyses performed on two
independently isolated wild-type ES lines and two independently isolated triple-H1 null ES lines. Error bars indicate the standard deviations for two ES cell
lines. The percent of CpG methylation did not change appreciably with cell-line passage number. Control experiments were performed on the same regions
with bisulfite-treated DNA from E9.5 wild-type embryos and Dnmt1 null ES cells (Figure S4).
charge balance within the nucleus as it effectively removes
free (linker) DNA from the system. Based on the dominant ef-
fect of electrostatic-charge interactions on chromatin con-
formation (Clark and Kimura, 1990), it seems possible that
the change in charge balance caused by reduction in total
H1 content is balanced by a concomitant reduction in
1208 Cell 123, 1199–1212, December 29, 2005 ª2005 Elsevier In
NRL. We examined the relationship between H1 content
and NRL using the ES cell data presented here (Figure 1) to-
gether with results on H1-depleted differentiated cells from
mature mouse tissues reported earlier (Fan et al., 2003).
We find a robust linear relationship between NRL and
H1/nucleosome (linear regression r2 = 0.95) over the range
c.
from 0.25 to 0.80 H1 per nucleosome (Woodcock et al.,
2006). The slope of the line indicates that, for example, the
nucleus-wide addition of 1 H1 molecule/nucleosome would,
on average, result in an increase of�37 bp in NRL. Viewed in
terms of charge balance, 37 bp of double-stranded DNA
represents 74 negative charges, while vertebrate H1s typi-
cally have �60 K+R positively charged residues, indicating
a fairly close correspondence between these two parame-
ters. The 4-fold reduction of acetylated lysine 12 on H4
that we observed in the H1-depleted nuclei will also effec-
tively contribute to the restoration of charge balance.
Our detailed measurements of H1 stoichiometry in both
ES cells and mature differentiated cells also prompt a recon-
sideration of the generalization that there is ‘‘about’’ 1 H1 per
nucleosome in most eukaryotic nuclei. In fact, in the wild-
type mouse cells where this has been examined, the stoichi-
ometry varies from tissue to tissue but is consistently less
than 1 per nucleosome (Fan et al., 2003). This has important
implications since, at any given moment, a significant pro-
portion of nucleosomes will lack H1, exposing sites for the
binding of other proteins to the linker DNA and the linker
entry/exit region of the nucleosome. Even in the case of
quiescent mouse splenocytes, with �0.8 H1 molecules per
nucleosome (Fan et al., 2003), individual nucleosomes will
be H1-free 20% of the time, the only exceptions being in
the small portion of the genome that may have firmly bound
H1 (Misteli et al., 2000). It is also apparent that linker-histone
stoichiometry is generally correlated with the extent of cell
differentiation, with quiescent splenocytes having the high-
est H1 stoichiometry and pluripotent ES cells the lowest
among the wild-type mouse cells we examined.
In light of the viability of cells with low H1-per-nucleosome
ratios, how should the extensive body of data on H1 as
a chromatin architectural protein be viewed? Clearly, in nu-
clei with 1 H1 per 4 nucleosomes, H1-directed zigzag struc-
tures (Thoma et al., 1979) must play a more minor role in the
overall conformation of chromatin than in systems with close
to 1 H1 per nucleosome, and this would be predicted to re-
sult in less regular chromatin fibers (Bednar et al., 1998; Car-
ruthers et al., 1998). In fact, isolated oligonucleosomes from
ES cells (Figure 3) are more irregular in diameter and overall
conformation than those observed in chicken erythrocytes
and other chromatins with higher H1 content (e.g., Williams
et al., 1986; Woodcock et al., 1991). Moreover, the degree of
compaction in ES oligonucleosomes, while locally highly var-
iable, on average shows a decrease at lower H1 levels (Fig-
ure 3B). It is well established in vitro that, in the absence of
H1, chromatin compacts in response to the electrostatic in-
teractions induced by mono- and divalent cations (Schwarz
and Hansen, 1994). Compaction in the absence of H1 is de-
pendent on the N termini of the core histones (Allan et al.,
1982; Dorigo et al., 2003; Fletcher and Hansen, 1996). In
this respect, the decreased acetylation of H4 at lysine 12
that we observe in H1-depleted ES cells would tend to fur-
ther counteract the loss of H1 and restore charge homeosta-
sis, a conclusion supported by the finding that core histone
acetylation inhibits H1-mediated chromatin compaction in
vitro (Ridsdale et al., 1990).
Cell 1
Effects of H1 on Gene Expression
Linker histone H1 has long been regarded as a general re-
pressor of transcription. This view is consistent with the
properties of H1, especially its ability to stabilize higher-
order chromatin structure (Thomas, 1999; Wolffe, 1998),
which is expected to limit access of transcriptional activa-
tors to DNA. Various types of studies have shown that tran-
scriptionally active chromatin contains less H1 than tran-
scriptionally inactive regions (reviewed in Zlatanova and
Van Holde, 1992). However, these correlative observations
do not establish whether removal of H1 is a prerequisite for
gene activation.
To begin to investigate the role of H1 in regulating gene
transcription in vivo, we and others have developed methods
for manipulating the level of H1 in cells. Elimination of H1 in
Tetrahymena did not cause changes in the total amounts
of the several categories of cellular RNAs, suggesting that
loss of H1 does not cause increases in transcription by the
three types of RNA polymerases (Shen and Gorovsky,
1996). Deletion of the yeast HHO1 gene encoding the puta-
tive linker histone also did not lead to significant (>50%) in-
creases in gene expression (Hellauer et al., 2001). Instead,
a modest decrease in expression of a very small number of
genes was seen. Thus, studies in these unicellular eukar-
yotes do not support the view that H1 is a repressor of global
transcriptional activity. However, H1 is not essential for via-
bility in either of these organisms, and both H1 proteins
have a structural organization rather different from those of
metazoan linker histones. Therefore, it was of great interest
to determine how a reduction in linker histone H1 affects
the gene-expression pattern in mammalian cells.
Despite the striking changes in chromatin structure in the
triple KO ES cells, we found very few genes that differed in
expression level by 2-fold or more. Unlike the results ob-
tained in yeast, examples of both increased and decreased
expression were seen in the H1-depleted ES cells. However,
as in yeast, the magnitude of decreased expression changes
was rather modest, whereas in the triple-H1 null cells, sev-
eral genes were strongly upregulated. Thus, H1 is clearly
not a repressor of global transcriptional activity in mamma-
lian cells, and, in general, our results agree with the analyses
in Tetrahymena and yeast. Instead, H1 appears to be in-
volved in regulating the expression of specific genes, even
though our other results clearly show that its depletion af-
fects fundamental aspects of chromatin structure through-
out the genome.
In contrast to the studies in yeast, in which no common
features of the H1-sensitive genes were found, our results
identify a category of genes whose expression is especially
sensitive to H1 content. Nearly one-third of the genes with
altered expression in the H1-depleted cells are thought to
be normally regulated by DNA methylation. Importantly, 4
of the 29 known genes (Xlr3, Pem, H19, and Igf2) identified
in our study have an altered expression in mouse embryonic
fibroblasts deficient for Dnmt1, the major maintenance DNA
methyltransferase in mammalian cells (Jackson-Grusby
et al., 2001). We measured the level of DNA methylation
within the H19-Igf2 imprinting control region (ICR) that
23, 1199–1212, December 29, 2005 ª2005 Elsevier Inc. 1209
regulates the reciprocal expression of the two genes at this
locus. The analysis showed that many of the CpG dinucleo-
tides in this region were undermethylated in H1-depleted ES
cells compared with control ES cells. This observation, along
with our finding that expression of H19 is upregulated and
that of Igf2 is downregulated in the H1-depleted cells, is en-
tirely consistent with the current model for control of the two
genes by the ICR (Reik and Murrell, 2000). We also found
reduced CpG methylation within several DMRs at the
Gtl2-Dlk1 imprinted locus, and the expression of Gtl2, like
H19, is significantly upregulated in H1-depleted cells. The
effect of H1 depletion on DNA methylation within the im-
printing control regions of these two loci is specific as we
found that the level of CpG methylation in bulk DNA, within
the major and minor satellite DNA sequences and within en-
dogenous C type retrovirus repeats, is not altered in the tri-
ple-H1 null ES cells. CpG methylation levels also were not
altered in the promoter regions of the a-actin and the
Myl-c genes, whose expression was not affected by H1 de-
pletion. We suggest that the effect of H1 on DNA methyla-
tion in the two imprinting control regions is direct because
H1 is indeed reduced by about one-half in these regions
in the triple-H1 null ES cells (Figure S1 and data not shown).
These results point to a previously unrecognized contribu-
tion of H1 to the control of gene expression in mammalian
cells, namely through an effect on DNA methylation. In con-
trast, elimination of an H1-like gene in the filamentous fun-
gus Ascobolus immerses was reported to have no effect on
methylation-associated gene silencing, although it did lead
to global hypermethylation (Barra et al., 2000), an effect
we did not observe in mammalian cells. Recently, downre-
gulation of H1 levels in Arabidopsis thaliana was reported to
lead to both minor increases and decreases in the methyl-
ation patterns of certain repetitive and single-copy DNA se-
quences (Wierzbicki and Jerzmanowski, 2005). Therefore,
H1 may play a role in regulating specific patterns of DNA
methylation in both plants and animals.
Although changes in DNA methylation patterns at specific
loci likely account for a substantial number of the gene-
expression changes we observed in H1-depleted cells, it
seems likely that other mechanisms are also involved. For
example, our finding that 2 of the 19 genes that were upre-
gulated encode H1 linker histones themselves suggests
the existence of a feedback mechanism within the H1
gene family. The development of a cell-culture system in
which highly specific changes in gene expression occur in
response to H1 levels should allow a deeper understanding
of the mechanisms by which linker histones participate in
control of gene expression and possibly other aspects of
chromatin regulation. The reintroduction of H1 genes into
these cells also should make possible studies of linker-
histone structure-function relationships in gene regulation.
EXPERIMENTAL PROCEDURES
Preparation and Analysis of ES Cell Nuclei and Histones
Cultured ES cells were trypsinized, washed once with PBS, resuspended
in 0.5% NP-40 in RSB (10 mM NaCl, 3 mM MgCl2, 10 mM Tris-HCl [pH
1210 Cell 123, 1199–1212, December 29, 2005 ª2005 Elsevier In
7.5]) with 1 mM phenylmethylsulfonyl fluoride (PMSF) at 4ºC, and homog-
enized by 10–15 strokes of pestle A in a Dounce homogenizer over a 20
min period. Released nuclei were centrifuged for 6 min at 1000 � g, and
the nuclear pellets were resuspended in RSB containing 0.5 mM PMSF.
Immunofluorescence microscopy and semiquantitative Western blotting
of ES cells, nuclei, and nuclear proteins were carried out as described
(Grigoryev et al., 2004). Histone proteins from ES cells were prepared
by extraction of chromatin with 0.2N sulfuric acid as described previously
(Fan et al., 2003).
Chromatin
For NRL analysis, nuclei were digested with 7–9 units of micrococcal
nuclease (MNase) (Boehringer Mannheim) per 100 mg DNA for 5 min at
37ºC in RSB containing 1 mM CaCl2 or with 15–30 units of enzyme per
100 mg of DNA for 5 min at 15ºC. For polynucleosomes, 2–3 units enzyme
was used for 5 min at 15ºC. Reactions were terminated by adding 5 mM
Na-EDTA. Nuclei were pelleted and resuspended in TE (pH 7.5). DNA
electrophoresis was carried out as described previously (Fan et al.,
2003). Psi-Plot (Poly Software International) was used for data analysis
and graphing. For NRL analysis of specific gene loci, DNA fragments
were transferred after electrophoresis to charged nylon membranes
(GeneScreen Plus, PerkinElmer) by standard capillary blot conditions,
and Southern blot analyses were carried out as described (Feinberg
and Vogelstein, 1983). The ADA probe was a 820 bp HindIII/PstI fragment
from middle of the gene. The H19/Igf2 ICR-adjacent probe was a 484 bp
BtsI-SfcI fragment prepared from construct pH19ICR (AP003183 Gen-
Bank accession number, nucleotide numbers 1433–1917).
Polynucleosomes were fractionated on 12 ml linear sucrose gradients
(5%–40% w/v) containing 10 mM Tris-HCl (pH 7.5), 1 mM EDTA, and 5
mM NaCl in a Beckman SW41 rotor at 4ºC for 12 hr at 35,000 rpm. Frac-
tions with chromatin longer than �15 nucleosomes were combined, dia-
lyzed against 10 mM HEPES, 1 mM EDTA, 5mM NaCl and concentrated
in 100,000 MW cutoff Centricon filter devices (Millipore Inc., Bedford, MA;
100,000 MWCO). Samples were fixed by dialysis in 0.1% glutaraldehyde,
10 mM HEPES, 1 mM EDTA, 5 mM NaCl for 4 hr and then overnight in
buffer alone.
Samples were prepared for electron microscopy as described (Wood-
cock and Horowitz, 1998; Georgel et al., 2003) and examined in a Tecnai
12 electron microscope at 100 kV or 80 kV, and images were recorded on
a Temscan 2K CCD camera (TVIPS GmBH, Germany).
Oligonucleotide Microarrays
Exponentially growing ES cells were harvested after subculturing for 2
days at passage 9. Total RNA was extracted from ES cells using Trizol (In-
vitrogen) according to the manufacturer’s protocol. One hundred micro-
grams of total RNA was purified with the RNeasy Mini Kit (QIAGEN). Fif-
teen micrograms of purified total RNA was used to synthesize cDNA
with a T7-(dT)24 primer and the SuperScript double-stranded cDNA syn-
thesis kit (Life Technologies). cRNA labeling, hybridization to murine
U74Av2 oligonucleotide array (Affymetrix, CA), washing, and staining
were performed as recommended by Affymetrix. Fluorescent intensities
were measured with a laser confocal scanner (HP Agilent 2200 confocal
scanner), and data were analyzed with Affymetrix Microarray Software
Suite (v5.0). Duplicate array hybridizations were performed with cRNA
from two triple-H1 null ES cell lines and a wild-type littermate cell line.
Bisulfite Modification, PCR Amplification,
and Pyrosequencing Analysis
One microgram of purified genomic DNA was treated with the Bisulfite
Conversion Kit (CpG Genome) according to the manufacturer’s manual.
PCR conditions were the same as reported previously (Warnecke et al.,
1998). The PCR primers for pyrosequencing were designed using PSQ
Assay design software (Biotage AB, Uppsala). One of the PCR primers
was biotinylated, and the biotinylated strands were purified and se-
quenced using PSQ HS 96 (Biotage AB). The data were processed and
analyzed with PSQ HS 96A software (Biotage AB). The primer sequences
and chromosomal regions analyzed are listed in Table S1.
c.
Supplemental Data
Supplemental Data include Supplemental Experimental Procedures,
Supplemental References, four figures, and one table and can be found
with this article online at http://www.cell.com/cgi/content/full/123/7/
1199/DC1/.
ACKNOWLEDGMENTS
This work was supported by NIH grants CA79057 (A.I.S.), GM43786
(C.L.W.), and GM62857 (A.S.). The authors wish to thank the AECOM Mi-
croarray Facility, the AECOM Laboratory of Macromolecular Analysis, and
Christina Lowes at the AECOM Pyrosequencing Facility. We thank Dr. En
Li for generously providing the pMO probe and Dnmt1�/� ES cell DNA
and Dr. Michael Bustin for the generous gift of the affinity-purified anti-
H1 antiserum. We thank Yamini Dalal for contributions toward the NRL
determinations at the ADA locus, and we also thank Xing Han for technical
assistance and Kevin Choe for helpful discussion. We also gratefully ac-
knowledge technical advice from Dr. Winfried Edelmann, Elena Avdievich,
and Diana Lin on ES cell-line derivation.
Received: January 20, 2005
Revised: August 5, 2005
Accepted: October 6, 2005
Published: December 28, 2005
REFERENCES
Allan, J., Harborne, N., Rau, D.C., and Gould, H. (1982). Participation of
core histone ‘‘tails’’ in the stabilization of the chromatin solenoid. J. Cell
Biol. 93, 285–297.
Barra, J.L., Rhounim, L., Rossignol, J.L., and Faugeron, G. (2000). His-
tone H1 is dispensable for methylation-associated gene silencing in As-
cobolus immersus and essential for long life span. Mol. Cell. Biol. 20,
61–69.
Bednar, J., Horowitz, R.A., Grigoryev, S.A., Carruthers, L.M., Hansen,
J.C., Koster, A.J., and Woodcock, C.L. (1998). Nucleosomes, linker
DNA, and linker histone form a unique structural motif that directs the
higher-order folding and compaction of chromatin. Proc. Natl. Acad.
Sci. USA 95, 14173–14178.
Bell, A.C., and Felsenfeld, G. (2000). Methylation of a CTCF-dependent
boundary controls imprinted expression of the Igf2 gene. Nature 405,
482–485.
Berkowitz, E.M., and Riggs, E.A. (1981). Characterization of rat liver oligo-
nucleosomes enriched in transcriptionally active genes: evidence for al-
tered base composition and a shortened nucleosome repeat. Biochem-
istry 20, 7284–7290.
Carruthers, L.M., Bednar, J., Woodcock, C.L., and Hansen, J.C. (1998).
Linker histones stabilize the intrinsic salt-dependent folding of nucleoso-
mal arrays: mechanistic ramifications for higher-order chromatin folding.
Biochemistry 37, 14776–14787.
Clark, D.J., and Kimura, T. (1990). Electrostatic mechanism of chromatin
folding. J. Mol. Biol. 211, 883–896.
Clark, S.J., Harrison, J., Paul, C.L., and Frommer, M. (1994). High sensi-
tivity mapping of methylated cytosines. Nucleic Acids Res. 22, 2990–
2997.
Dasso, M., Dimitrov, S., and Wolffe, A.P. (1994). Nuclear assembly is in-
dependent of linker histones. Proc. Natl. Acad. Sci. USA 91, 12477–
12481.
Dean, W., Bowden, L., Aitchison, A., Klose, J., Moore, T., Meneses, J.J.,
Reik, W., and Feil, R. (1998). Altered imprinted gene methylation and ex-
pression in completely ES cell-derived mouse fetuses: association with
aberrant phenotypes. Development 125, 2273–2282.
Dorigo, B., Schalch, T., Bystricky, K., and Richmond, T.J. (2003). Chro-
matin fiber folding: requirement for the histone H4 N-terminal tail. J.
Mol. Biol. 327, 85–96.
Cell
Fan, Y., Sirotkin, A., Russell, R.G., Ayala, J., and Skoultchi, A.I. (2001). In-
dividual somatic H1 subtypes are dispensable for mouse development
even in mice lacking the H1(0) replacement subtype. Mol. Cell. Biol. 21,
7933–7943.
Fan, Y., Nikitina, T., Morin-Kensicki, E.M., Zhao, J., Magnuson, T.R.,
Woodcock, C.L., and Skoultchi, A.I. (2003). H1 linker histones are essen-
tial for mouse development and affect nucleosome spacing in vivo. Mol.
Cell. Biol. 23, 4559–4572.
Feinberg, A.P., and Vogelstein, B. (1983). A technique for radiolabeling
DNA restriction endonuclease fragments to high specific activity. Anal. Bi-
ochem. 132, 6–13.
Fletcher, T.M., and Hansen, J.C. (1996). The nucleosomal array: struc-
ture/function relationships. Crit. Rev. Eukaryot. Gene Expr. 6, 149–188.
Georgel, P.T., Horowitz-Scherer, R.A., Adkins, N., Woodcock, C.L.,
Wade, P.A., and Hansen, J.C. (2003). Chromatin compaction by human
MeCP2. Assembly of novel secondary chromatin structures in the ab-
sence of DNA methylation. J. Biol. Chem. 278, 32181–32188.
Grigoryev, S.A., Nikitina, T., Pehrson, J.R., Singh, P.B., and Woodcock,
C.L. (2004). Dynamic relocation of epigenetic chromatin markers reveals
an active role of constitutive heterochromatin in the transition from prolif-
eration to quiescence. J. Cell Sci. 117, 6153–6162.
Hark, A.T., Schoenherr, C.J., Katz, D.J., Ingram, R.S., Levorse, J.M., and
Tilghman, S.M. (2000). CTCF mediates methylation-sensitive enhancer-
blocking activity at the H19/Igf2 locus. Nature 405, 486–489.
Harvey, A.C., and Downs, J.A. (2004). What functions do linker histones
provide? Mol. Microbiol. 53, 771–775.
Hastie, N.D. (1989). Highly repeated DNA families in the genome of Mus
musculus. In Genetic Variants and Strains of the Laboratory Mouse,
Second Edition, M.F. Lyon and A.G. Searle, eds. (Oxford: Oxford Univer-
sity Press).
Hellauer, K., Sirard, E., and Turcotte, B. (2001). Decreased expression of
specific genes in yeast cells lacking histone H1. J. Biol. Chem. 276,
13587–13592.
Jackson-Grusby, L., Beard, C., Possemato, R., Tudor, M., Fambrough,
D., Csankovszki, G., Dausman, J., Lee, P., Wilson, C., Lander, E., and
Jaenisch, R. (2001). Loss of genomic methylation causes p53-dependent
apoptosis and epigenetic deregulation. Nat. Genet. 27, 31–39.
Kalitis, P., and Choo, K.H.A. (1989). Centromere DNA of higher eukar-
yotes. In The Centromere, K.H.A. Choo, ed. (New York: Oxford University
Press).
Laybourn, P.J., and Kadonaga, J.T. (1991). Role of nucleosomal cores
and histone H1 in regulation of transcription by RNA polymerase II. Sci-
ence 254, 238–245.
Lehnertz, B., Ueda, Y., Derijck, A.A., Braunschweig, U., Perez-Burgos,
L., Kubicek, S., Chen, T., Li, E., Jenuwein, T., and Peters, A.H. (2003).
Suv39h-mediated histone H3 lysine 9 methylation directs DNA methyla-
tion to major satellite repeats at pericentric heterochromatin. Curr. Biol.
13, 1192–1200.
Li, E., Bestor, T.H., and Jaenisch, R. (1992). Targeted mutation of the
DNA methyltransferase gene results in embryonic lethality. Cell 69,
915–926.
Li, E., Beard, C., and Jaenisch, R. (1993). Role for DNA methylation in
genomic imprinting. Nature 366, 362–365.
Lin, S.P., Youngson, N., Takada, S., Seitz, H., Reik, W., Paulsen, M., Cav-
aille, J., and Ferguson-Smith, A.C. (2003). Asymmetric regulation of im-
printing on the maternal and paternal chromosomes at the Dlk1-Gtl2 im-
printed cluster on mouse chromosome 12. Nat. Genet. 35, 97–102.
Maresca, T.J., Freedman, B.S., and Heald, R. (2005). Histone H1 is es-
sential for mitotic chromosome architecture and segregation in Xenopus
laevis egg extracts. J. Cell Biol. 169, 859–869.
Misteli, T., Gunjan, A., Hock, R., Bustin, M., and Brown, D.T. (2000). Dy-
namic binding of histone H1 to chromatin in living cells. Nature 408, 877–
881.
123, 1199–1212, December 29, 2005 ª2005 Elsevier Inc. 1211
Oswald, J., Engemann, S., Lane, N., Mayer, W., Olek, A., Fundele, R.,
Dean, W., Reik, W., and Walter, J. (2000). Active demethylation of the pa-
ternal genome in the mouse zygote. Curr. Biol. 10, 475–478.
Patterton, H.G., Landel, C.C., Landsman, D., Peterson, C.L., and Simp-
son, R.T. (1998). The biochemical and phenotypic characterization of
Hho1p, the putative linker histone H1 of Saccharomyces cerevisiae. J.
Biol. Chem. 273, 7268–7276.
Pennings, S., Meersseman, G., and Bradbury, E.M. (1994). Linker histo-
nes H1 and H5 prevent the mobility of positioned nucleosomes. Proc.
Natl. Acad. Sci. USA 91, 10275–10279.
Poirier, F., Chan, C.T., Timmons, P.M., Robertson, E.J., Evans, M.J., and
Rigby, P.W. (1991). The murine H19 gene is activated during embryonic
stem cell differentiation in vitro and at the time of implantation in the de-
veloping embryo. Development 113, 1105–1114.
Ramon, A., Muro-Pastor, M.I., Scazzocchio, C., and Gonzalez, R. (2000).
Deletion of the unique gene encoding a typical histone H1 has no appar-
ent phenotype in Aspergillus nidulans. Mol. Microbiol. 35, 223–233.
Reik, W., and Murrell, A. (2000). Genomic imprinting. Silence across the
border. Nature 405, 408–409.
Reik, W., and Walter, J. (2001). Genomic imprinting: parental influence on
the genome. Nat. Rev. Genet. 2, 21–32.
Ridsdale, J.A., Hendzel, M.J., Delcuve, G.P., and Davie, J.R. (1990). His-
tone acetylation alters the capacity of the H1 histones to condense tran-
scriptionally active/competent chromatin. J. Biol. Chem. 265, 5150–
5156.
Schmidt, J.V., Matteson, P.G., Jones, B.K., Guan, X.J., and Tilghman,
S.M. (2000). The Dlk1 and Gtl2 genes are linked and reciprocally im-
printed. Genes Dev. 14, 1997–2002.
Schwarz, P.M., and Hansen, J.C. (1994). Formation and stability of higher
order chromatin structures. Contributions of the histone octamer. J. Biol.
Chem. 269, 16284–16289.
Shen, X., and Gorovsky, M.A. (1996). Linker histone H1 regulates specific
gene expression but not global transcription in vivo. Cell 86, 475–483.
Shen, X., Yu, L., Weir, J.W., and Gorovsky, M.A. (1995). Linker histones
are not essential and affect chromatin condensation in vivo. Cell 82, 47–
56.
Shimamura, A., Sapp, M., Rodriguez-Campos, A., and Worcel, A. (1989).
Histone H1 represses transcription from minichromosomes assembled in
vitro. Mol. Cell. Biol. 9, 5573–5584.
Sirotkin, A.M., Edelmann, W., Cheng, G., Klein-Szanto, A., Kucherlapati,
R., and Skoultchi, A.I. (1995). Mice develop normally without the H1(0)
linker histone. Proc. Natl. Acad. Sci. USA 92, 6434–6438.
Sun, F.L., Cuaycong, M.H., and Elgin, S.C. (2001). Long-range nucleo-
some ordering is associated with gene silencing in Drosophila mela-
nogaster pericentric heterochromatin. Mol. Cell. Biol. 21, 2867–2879.
Takada, S., Paulsen, M., Tevendale, M., Tsai, C.E., Kelsey, G., Catta-
nach, B.M., and Ferguson-Smith, A.C. (2002). Epigenetic analysis of
the Dlk1-Gtl2 imprinted domain on mouse chromosome 12: implications
for imprinting control from comparison with Igf2–H19. Hum. Mol. Genet.
11, 77–86.
1212 Cell 123, 1199–1212, December 29, 2005 ª2005 Elsevier In
Thoma, F., Koller, T., and Klug, A. (1979). Involvement of histone H1 in the
organization of the nucleosome and of the salt-dependent superstruc-
tures of chromatin. J. Cell Biol. 83, 403–427.
Thomas, J.O. (1999). Histone H1: location and role. Curr. Opin. Cell Biol.
11, 312–317.
Tucker, K.L., Beard, C., Dausmann, J., Jackson-Grusby, L., Laird, P.W.,
Lei, H., Li, E., and Jaenisch, R. (1996). Germ-line passage is required for
establishment of methylation and expression patterns of imprinted but not
of nonimprinted genes. Genes Dev. 10, 1008–1020.
Ushinsky, S.C., Bussey, H., Ahmed, A.A., Wang, Y., Friesen, J., Williams,
B.A., and Storms, R.K. (1997). Histone H1 in Saccharomyces cerevisiae.
Yeast 13, 151–161.
van Holde, K.E. (1989). Chromatin (New York: Springer-Verlag).
Verona, R.I., Mann, M.R., and Bartolomei, M.S. (2003). Genomic imprint-
ing: intricacies of epigenetic regulation in clusters. Annu. Rev. Cell Dev.
Biol. 19, 237–259.
Vignali, M., and Workman, J.L. (1998). Location and function of linker his-
tones. Nat. Struct. Biol. 5, 1025–1028.
Warnecke, P.M., Biniszkiewicz, D., Jaenisch, R., Frommer, M., and Clark,
S.J. (1998). Sequence-specific methylation of the mouse H19 gene in
embryonic cells deficient in the Dnmt-1 gene. Dev. Genet. 22, 111–121.
Wierzbicki, A.T., and Jerzmanowski, A. (2005). Suppression of histone H1
genes in Arabidopsis results in heritable developmental defects and sto-
chastic changes in DNA methylation. Genetics 169, 997–1008. Published
online October 16, 2004. 10.1534/genetics.104.031997.
Williams, S.P., Athey, B.D., Muglia, L.J., Schappe, R.S., Gough, A.H.,
and Langmore, J.P. (1986). Chromatin fibers are left-handed double he-
lices with diameter and mass per unit length that depend on linker length.
Biophys. J. 49, 233–248.
Wolffe, A.P. (1998). Chromatin: Structure and Function (San Diego, CA:
Academic Press).
Woodcock, C.L., and Horowitz, R.A. (1998). Electron microscopic imag-
ing of chromatin with nucleosome resolution. Methods Cell Biol. 53, 167–
186.
Woodcock, C.L., Woodcock, H., and Horowitz, R.A. (1991). Ultrastruc-
ture of chromatin. I. Negative staining of isolated fibers. J. Cell Sci. 99,
99–106.
Woodcock, C.L., Skoultchi, A.I., and Fan, Y. (2006). Role of linker histone
in chromatin structure and function: H1 stoichiometry and nucleosome
repeat length. Chromosome Res., in press.
Zlatanova, J., and Doenecke, D. (1994). Histone H1 zero: a major player in
cell differentiation? FASEB J. 8, 1260–1268.
Zlatanova, J., and Van Holde, K. (1992). Histone H1 and transcription: still
an enigma? J. Cell Sci. 103, 889–895.
Accession Numbers
Microarray data have been submitted to the Gene Expression Omnibus
(GEO) under accession number GSE3714.
c.


![Histone deacetylases 1 and 2 maintain S-phase chromatin ......SMARCA5, an ISWI family chromatin remodeler [15,16]. In this study, we further show that SMARCA5 is present on nascent](https://img.pdfslide.us/doc/110x75/60bfe10deacc383f2122a636/histone-deacetylases-1-and-2-maintain-s-phase-chromatin-smarca5-an-iswi.jpg)