Embed Size (px)
Citation preview
DNA Replication, Chromatin Structure, and Histone
Phosphorylation Altered by Theophylline in Synchronized
HeLa S3 cells
ABSTRACT
The onset of DNA replication normally is coincident with an increase in histone 1phosphorylation and a relaxation in chromatin structure. In this paper we show that 5 mMtheophylline, added 2 h after selective detachment to synchronized HeLa-S-3 cells, delays theonset and reduces the rate of DNA synthesis while theophylline treatment beginning at 8 h hasno effect on subsequent DNA synthesis. These actions of theophylline are accompanied by aninhibition of histone 1 phosphorylation and a prevention of the normal relaxation in chromatinstructure between G1 and S phases as revealed by image analysis of Feulgen-stained nuclei .The time courses of intracellular cyclic AMP levels, nonhistone protein phosphorylation, and[3H]lysine incorporation are also compared in the same treated and untreated synchronizedHeLa cells. Comparison with experiments using 1-a-D-arabinofuranosylcytosine (Ara-C) showsthat the above phenomena are not a direct result of inhibition of DNA synthesis. We interpretour results as evidence that the associations between histone 1 phosphorylation, chromatinrelaxation, and the onset of DNA synthesis are temporally and causally related .
Variations in chromatin structure during the cell cycle havebeen well documented using a variety of biochemical andbiophysical probes. In the past several years these studies havebeen extended to chromatin in the intact cell using techniquessuch as flow microfluorimetry or image analysis of Feulgen-stained nuclei. This capability not only has the potential ofcircumventing certain of the artifacts introduced by isolationby bulk chromatin but also allows observations of the proper-ties of chromatin from individual cells. Interestingly, it wasfound that changes in nuclear-DNA morphology during theHeLa cell cycle (1), as well as in diploid fibroblasts afterstimulation (2) or virus transformation (3), correlate well withalterations in isolated chromatin structure and its functionalstate as measured by template activity, circular dichroism, andthe number of primary binding sites of intercalating dyes (4) .Specifically, increases in average optical density (AOD) orform factor (FF) (area/[perimeter] 2) or nuclear-stained DNAin situ were associated with decreases in template activity,circular dichroism at 272 nm, and the number of primary dyebinding sites all measured in vitro .
Moreover, image analysis of single cell nuclear chromatinrevealed that the modulation ofstructure during the HeLa cell
78
THOMAS W. DOLBY, ANDREW BELMONT, THADDEUS W. BORUN, andCLAUDIO NICOLINIThe Wistar Institute of Anatomy and Biology, Philadelphia, Pennsylvania 19104, and Department ofPhysiology-Biophysics, Temple University, Philadelphia, Pennsylvania 19122
cycle was much more pronounced than suggested by the aver-age properties of isolated chromatin from synchronized popu-lations . In particular, image analysis ofindividual cells coupledwith autoradiography indicated that what had appeared as agradual and continuous transition from a maximally condensedchromatin at 5 h after mitosis ("middle Gi") to a maximallyrelaxed chromatin at 12 h after mitosis ("middle-S") (5, 6) wasactually most likely a more abrupt transition from a maximallycondensed late Gl nucleus with high AOD and high FF to amaximally relaxed early S nucleus with low average opticaldensity and low form factor (7) . Exposure of synchronized cellsto 1-,8-D-arabinofuranosylcytosine (Ara-C), a drug that blocksDNA synthesis by the inhibition of DNA polymerase andligase enzymes, resulted in cells containing 2c DNA contentarrested at the GI-S border in the relaxed conformation ofearly S nuclei, thus proving that the transition from a con-densed to relaxed morphology was not a result of DNA syn-thesis but perhaps a prerequisite (8) .
Biochemical studies have associated an increase in one typeofhistone 1 phosphorylation with the onset of DNA synthesis(9-18) . (Another type of histone 1 phosphorylation, presum-ably occurring at different sites, has been linked by Rattle et
THE JOURNAL OF CELL BIOLOGY " VOLUME 89 APRIL 1981 78-85©The Rockefeller University Press " 0021-9525/81/04/0078/08$1 .00
on April 10, 2019jcb.rupress.org Downloaded from http://doi.org/10.1083/jcb.89.1.78Published Online: 1 April, 1981 | Supp Info:
al . 1191 to condensation of chromatin from G2 to mitosis .However, as shown experimentally [20], and indicated ongeneral theoretical grounds,' the influence of phosphorylationon histone 1-DNA interactions is strongly site-specific.) Latercircular dichroism measurements coupled with thermal dena-turation studies indicated that changes in the interactions ofhistone 1, DNA, and nonhistone chromosomal proteins wereassociated with the phosphorylation of H1 and appeared to beresponsible for the relaxation of the compact GI chromatininto a more open or relaxed S-phase configuration (5) .
This last conclusion was of great interest in light of theknown influence ofcyclic nucleotide levels on the phosphoryl-ation state of various proteins and the more recent associationsbetween changing cyclicnucleotide levels and cell proliferation.Specifically, increases in cyclic AMPlevels have been observedin many (21-25), but not all (26, 27), types of cells as theyapproach quiescence, while increased intracellular levels incyclic AMP levels produced either by exogenous dibutyrylcyclic AMP(28-31), dibutyryl cyclic AMP in conjunction withphosphodiesterase inhibitors (29-32), or phosphodiesterase in-hibitors alone (33-35), inhibit cell proliferation. Indeed, theaction of certain phosphodiesterase inhibitors, including theo-phylline and caffeine, has been shown to involve a shift ofuntransformed cells from Gl to Go (33, 35) as well as a cellcycle arrest in G2 (33) . Most interestingly, it was found thatcaffeine reduces mitotic delay of cells exposed to ionizingradiation (35) . Both elevated concentrations ofCa" and Mg`salts, as well as hormone treatment, have also been shown toreduce mitotic delay after irradiation, and in both cases thishas been linked to the state of chromatin condensation (35) .Thus, in an attempt to determine whether there actually existeda causal relationship between histone 1 phosphorylation andchromatin structure, we were prompted by the above associa-tions to explore the effect of theophylline on progression ofsynchronized HeLa cells from mitosis to S phase with attentionfocused on possible alterations in the normal modulation ofchromatin structure during Gl and S phases and associatedchanges in histone 1 phosphorylation while also monitoringcyclic AMP levels and nonhistone chromosomal protein phos-phorylation (NHCP) .
MATERIALS AND METHODS
MaterialsJoklik-modified Eagle's minimal essential medium (medium A), Earle's bal-
anced spinner salt solution, calf serum, and fetal calf serum were purchased fromGrand Island Biological Co. (Grand Island, N. Y.) . Thymidine, cytosine arabi-noside-HCI, cycloheximide, thophylline, and amino acids were purchased fromSigma Chemical Co. (St . Louis, Mo .). Carrier-free ["P]orthophosphoric acid, [2-"C]thymidine, and [3H]lysine were obtained fromNew EnglandNuclear (Boston,Mass .) .
MethodsCELL CULTURE AND SYNCHRONIZATION : Logarithmically growing
HeLa S-3 cells were maintained in suspension culture at 37'C at concentrationsof between 2 x 10⁵ and 5 x 10⁵ cells/ml in Joklik-modified Eagle's minimalessential spinner medium supplemented with 3.5% each (vol/vol) fetal calf andcalf serum.
The basic procedure for selective detachment of mitotic cells on a small scalehas been published by Terasima and Tolmach (36) and Robbins and Marcus(37) . The labeling index (LI) and mitotic rate (MR) were determined by autora-
' Belmont, A., and C. Nicolini. Polyelectrolyte theory and chromatin-DNA quaternary structure : Role of ionic strength and H 1 histone . J.Theor. Biol . Manuscript submitted for publication .
diography (6), on aliquots of cells at various time intervals after selectivedetachment: at t = 0 h, -90% of the cells are in mitosis; at t = 3.0 h with LI =5%and MR =3%, --90% of the cells are in "G, phase"; at t = I 1 h, the cells are atthe peak of DNA synthesis with LI = 83% andMR = 1% ("S phase"). At latertimesafter mitosis, the degree ofsynchrony is markedly reduced (6), even thougha large number of cells are in the G2 phase between 14 and 18 h. Large quantitiesof selectively detached synchronized HeLa S-3 cells were prepared as described(38) .
In each experiment the total yield ofM-phase cells was about 3-4 x 10⁵ cells/ml in a final volume of 1,800 ml. 90-95% of the cells were found to be in mitosisby phase-contrast microscopy. The cells were maintained in suspension cultureand harvested as indicated below.
32P LABELING :
To estimate the rate of 32p incorporation into histone 1components, we removed synchronized cells at various times after mitosis,harvested them by centrifugation, andincubated them in phosphate-free mediumA, supplemented with 2% fetal calf serum and `P at concentrations indicated inthe figure legends. Inhibitors were present during labeling at the concentrationsused for pretreatment .
CELL FRACTIONATION AND HISTONE EXTRACTION : Cells were har-vested by centrifugation and fractionated at 3°C. Cell pellets were washed withEarle's spinner salt solution, 80 mM NaCl, 20mM EDTA, 1% Triton X-100, and0.15 MNaCl, as previously described (9, 39). Historieswere isolated by extractingthe resultant nuclear pellets three times with 0.6 ml of 0.25 N H2SO4- Pooledextracts were then dialyzed against 0.9 N acetic acid.
ELECTROPHORESIS :
After dialysis, histories were resolved according to themethod of Balhorn et al. (l4) using 25 cm, 15% polyacrylamide gels containing2 Murea and 0.9 N acetic acid . For total histone mass estimations, gels were runat 190 V for 22 h at room temperature . Total histone mass was determined bycalculatingthe area undercurves corresponding to the five main histone fractionsobtained by scanning stained gels at 630 rim in a Gilford spectrophotometer(Gilford Instrument Laboratories Inc., (Oberlin, Ohio) (12) . To separate phos-phorylated histone I components, we ran duplicate gels at 200 V for68 h at 4°C.Gels were stained with fast green and destained electrically as previously de-scribed (9) . To determine 3'P radioactivity in histone 1 components, we slicedstained gels and digested them in Hz02 and counted as previously described .
CYCLIC AMP DETERMINATION :
At the times indicated in the figure leg-ends, 100 ml (4 x 10' cells) of synchronized cells were harvested at 37°C at 600g. Cell pellets were washed in cold spinner salts, repelleted, and extracted threetimes, 10 vol (I ml) 0.36 N perchloric acid containing a total of 430 cpm [3H]-cyclic AMP to account for sample recovery. Extensive control studies show thatthis tracer cyclic AMPdoes not interferewith endogenous cellular determinations .The extracted supernates were pooled and neutralized with 1 N KOH andcentrifuged at 1,000 g to remove K perchlorate . The supernates were applied to4 x 0.7 cm columns ofAGIX2 resin, washed with distilled H2O followed by 2Mformic acid to elute cyclic AMP. Cyclic AMPwas lyophilized, and aliquots wereassayed in triplicate using the competitive binding protein assay provided byAmersham Corp. (Arlington Heights, Ill .). The assay was calibrated to a range of0.14-16 pmol . The data are expressed as picomoles cyclic AMP/10 6 cells afterrecovery corrections and are a result of three independent experiments .
STAINING : Smears were prepared from the same synchronized cultures,either treated or untreated, at 3, 5, 8, 12, 15, and 18 h after selective detachment.All smears were hydrolyzed with 1 NHCl for 15 min and stained in parallel withSchiff reagent for I h according to the method ofDeCosse and Aiello (40) . Afterstaining, the samples were mounted in Canada balsam.
IMAGE ANALYSIS :
Nuclear images were magnified by a Zeiss Ultraphotmicroscope equipped with ax 100 oil immersion planar achromat of 1.25 NA.Illumination was provided by a condenser of 1.3 NA and a 100-W tungstenhalogen light source equipped with a 540-rim filter with a half-band width of40rim. The image was registered on a plumbicon scanner by means of a Reicherthigh quality magnification changer. Total magnification was 1250. The imageanalyzer was the Quantimet ImageAnalyzingComputer (Cambridge Instrument,Co ., Inc., Ossining, N. Y.) equipped with a 720-D densitometer . The scannerarea is divided into 880 x 588 picture elements whose optical density can bedigitized into 64 grey levels . By means of a stage micrometer (American OpticalCorp., Scientific Instrument Div., Buffalo, N. Y.) the dimensions of each pictureelement was determined as (0.08 x 0.08) llm2. A blank area of each slide wasused to load the shade corrector and to calibrate the densitometer by means ofneutral density filters . A threshold of 0.06 OD was used to define the nuclearborder. Field uniformity measurements on a single nucleus using nine positionsaround the field yielded for all slides, coefficients of variation of <2.5% forintegrated optical density and 1.0% for area. Variation of both parameters was<0.5% for 10 consecutive measurements of a single image in the center of thefield .A number of basic parameters were measured for each nuclear image, and
from these basic parameters several additional derived parameters were com-puted. Basic parameters included integrated optical density (IOD, proportionalto DNAamount), area, perimeter, horizontal and vertical Feret diameters, and
DOLBY ET AL. Histone H 1 Phosphorylation and DNA Replication
79
horizontal and vertical complex projections. The horizontal and vertical Feretdiameters(FD)are defined as theshadow projectionsoftheimageonto horizontaland vertical lines, respectively. The vertical and horizontal complex projections(CP) are defined instead as the sums of the shadow projections of all laggingedges on horizontal and vertical lines, respectively .
As a means of estimating border reentrance, an excess projection (EP) wasdefined as the numerical difference between a CP and its corresponding FD .Thus, EP, = CP (horizontal) - FD (vertical) and EP2 = CP (vertical) - FD(horizontal). Toreduce the influence of an image's orientation with respect to thedirection of scanning, euclidean norms of EP and CP were then used to calculatea derived parameter, the convolution factor, defined as the euclidean norm oftheexcess projection, EP, divided by the euclidean norm ofthe complex projection,CP. Additional derived parameters calculated, which are essentially independentof orientation, were the AOD (1013/area) and a normalized FF (4 J [area]/[perimeterf ) . The convolution factor, again a measure of border reentrance, wasuseful in interpreting the geometric significance of the form factor (which is onlyan index of the circularity and which is less than unity either for features whichare completely nonreentrant but noncircular or approximately circular but whichare also reentrant).
RESULTS
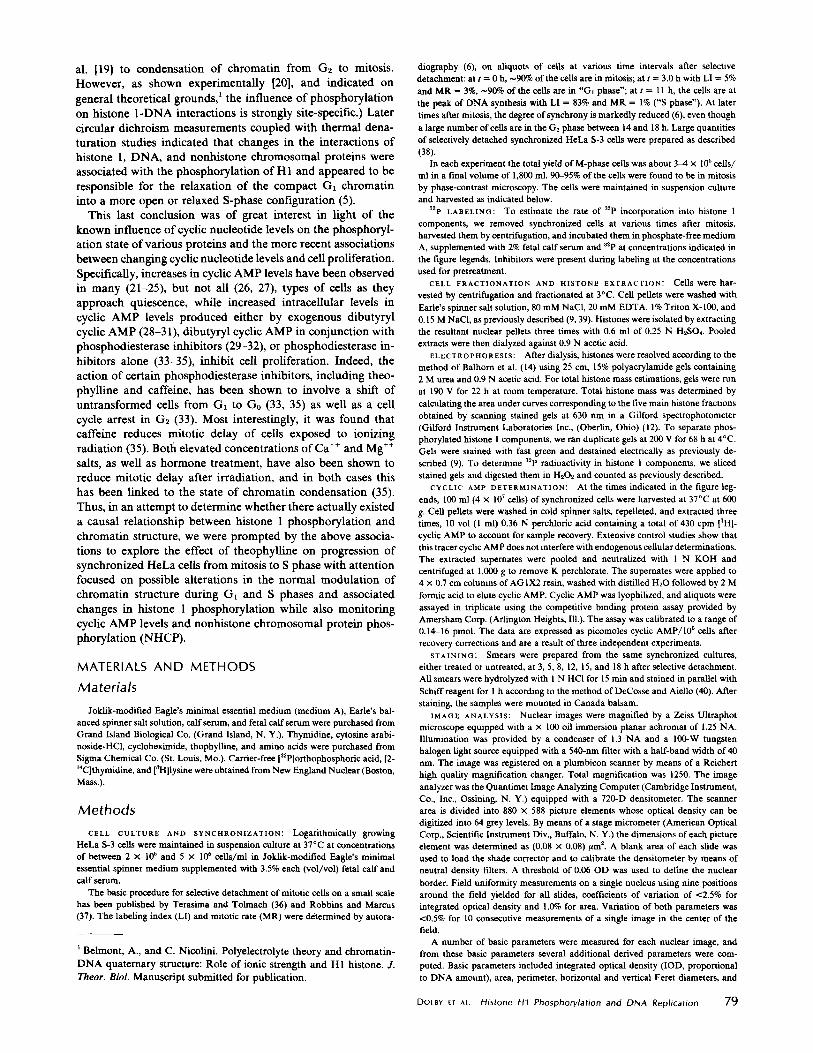
In confirmation of earlier reports, exposure of synchronizedHeLa cells to a 5-mM concentration of theophylline beginning2 h after selective mitoic detachment produced a partial arrestofcells in Gr. As shown in Fig. 1, [ r4 C]thymidine incorporationfor the theophylline-treated cells remains at baseline valuesuntil - 12 h after mitosis at which time detectable DNA syn-thesis begins to occur. In comparison, in the control population,[14 C]thymidine incorporation rises sharply beginning at -5 hafter mitosis, reaching a peak at slightly after 10 h .Examination of the image analysis data further clarifies the
situation. It is apparent from the IOD vs . cell number histo-grams, seen in Fig. 2 as the projection along the x axis of therespective two-parameter histograms, that the slow rise inthymidine incorporation occurring at 12 h in the theophylline-treated population (Fig. 2B, panel d) is caused by a smallfraction (15%) of the cells progressing through early S phase,while the majority of the cells are blocked with 2c DNAcontent . The fraction of cells which manages to pass the blockand progress through S slowly increases with time, reachingroughly 50% at 18 h (Fig. 2B, panel f) . Moreover, a roughestimate of S-phase duration, produced by focusing on thenumber of cells in early S (2.1C-3C) and late S and G2 (3C-4C) vs. time, reveals that those cells that escape the Gt (or Gt -S border) block progress through S phase at a slower rate thannormal. Indeed, whereas at 8 h in the control slide there areonly 61/200 cells in early S (the majority with DNA content inthe range 2.1-2 .5C), at 12 h there are 96/200 in late S and G2 .Yet, for the theophylline-treated cells, while at 12 h there are30/200 cells in early S, at 15 h there are only 16/200 cells inlate S and G2 . Similarly, while at 15 h there are 57/200 cells inearly S and 16/200 cells in late S and G2, at 18 h there are only21/200 cells in late S and G2 .
This action of theophylline cannot be attributed simply to adirect inhibition of the cellular apparatus for DNA synthesisor to a generalized toxic effect . Returning to Fig . 1, we see thatadministration of the same theophylline concentration at 8 hafter mitosis produces no change in [ 14 C]thymidine incorpora-tion relative to the control. Experiments examining the uptakeof media ["C]thymidine in the presence or absence of theo-phylline show no significant alteration of intracellular transportwithin a 1-h treatment up to at least 10 h postmitosis (data notshown) . In addition, not only have other investigators demon-strated the reversibility of theophylline's action (33), but also[3H]lysine incorporation was found to be identical for thecontrol and theophylline-treated cells between 3 and 10 h after
80
THE JOURNAL OF CELL BIOLOGY " VOLUME 89, 1981
W
3
aro C
28 ,
24 ,
20
/6
O12 .
U
42
V, 32
/6
/2
8
4
lheopVlline
1m
t
.~*-V-ro_--a-¢__o-
2468/0l2/4/6e
HOURS AFTER40 70SIS
FIGURE 1
The effects of Ara-C and theophylline on [2-' 4C]thymi-dine incorporation during the HeLa S-3 cell cycle. Upper panel:HeLa S-3 cells were collected in mitosis, resuspended in 300 ml ofmedium A at 3 X 10⁵ cells/ml and incubated at 37°C for 18 h. 100ml of the culture was removed at 2 h after mitosis (G,) and treatedwith 40 Ag/ml Ara-C. 100 ml was removed at 8 h after mitosis (S)and similarly treated. 2-ml samples were removed from the controland Ara-C-treated cultures at the indicated times, pulse-labeledwith 0.2,uCi [2-' °]thymidine for 30 min at 37 °C, and the radioactivityincorporated in 5% TCA-precipitable material was determined aspreviously described (5) .", Control; X, Ara-C added at 8 h; O, Ara-C added at 2 h . Lower panel: A similar experiment using 5 mMtheophylline instead of Ara-C.", Control, O, theophylline added at2 h; x, theophylline added at 8 h.
mitosis (data not shown) . Thus, theophylline does not appearto be affecting the overall protein synthesis rate (in particular,the synthesis of lysine-rich histone would seem to be unaf-fected) .
As anticipated, however, the action of theophylline is asso-ciated with a dramatic change in the pattern of histone 1phosphorylation as shown in Fig. 3 . After pulse-labeling con-trol and drug-treated cells with 32P at 2 and 9.5 h after mitosisas described in the legend to Fig . 3, histone was extracted asdescribed in Materials, and histone 1 components were resolvedby extended electrophoresis on long polyacrylamide gels (14) .It may be seen in the upper left panel of Fig . 3 that histone 1components extracted from control Gr cells migrate in thesegels as two principal peaks (forms I and II) which incorporaterather low amounts of 32P during the 75-min labeling period .As control cells enter S phase, the apparent rate of 32P incor-
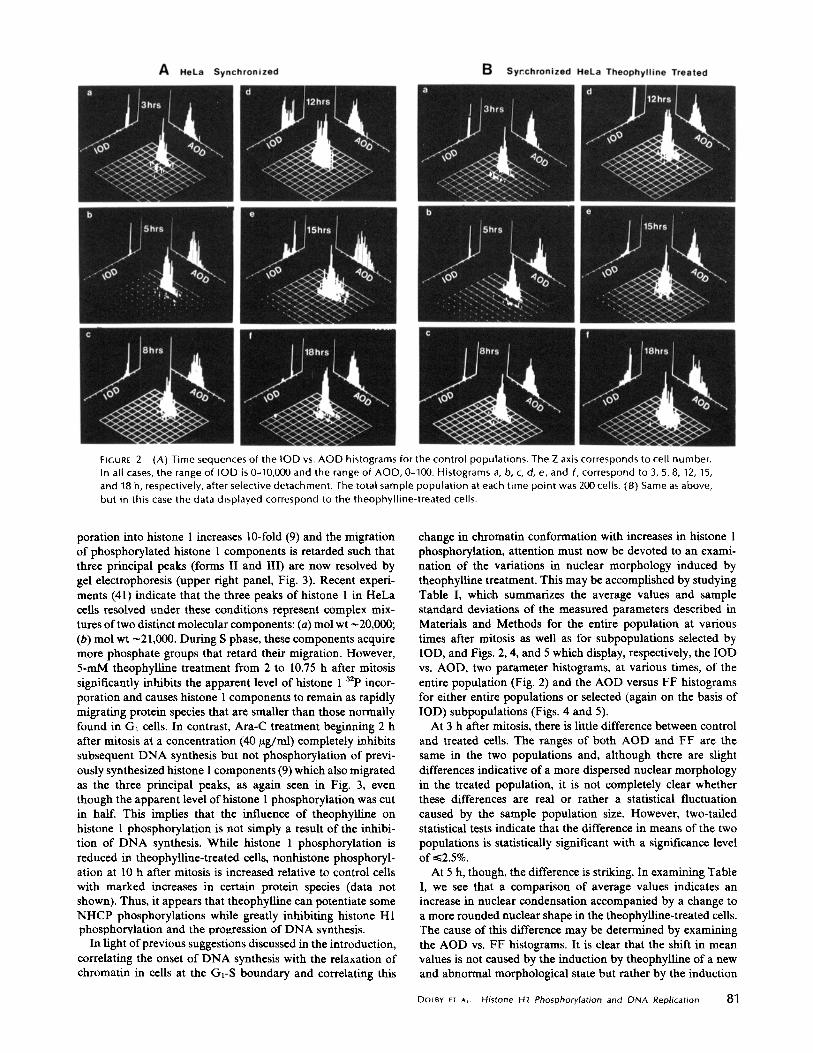
FIGURE 2
(A) Time sequences of the IOD vs . AOD histograms for the control populations . The Z axis corresponds to cell number .In all cases, the range of IOD is 0-10,000 and the range of ACID, 0-100 . Histograms a, b, c, d, e, and f, correspond to 3, 5, 8, 12, 15,
and 18 h, respectively, after selective detachment . The total sample population at each time point was 200 cells . (8) Same as above,but in this case the data displayed correspond to the theophylline-treated cells .
poration into histone 1 increases 10-fold (9) and the migrationof phosphorylated histone 1 components is retarded such thatthree principal peaks (forms II and III) are now resolved bygel electrophoresis (upper right panel, Fig. 3) . Recent experi-ments (41) indicate that the three peaks of histone 1 in HeLacells resolved under these conditions represent complex mix-tures oftwo distinct molecular components : (a) mol wt
20,000 ;(b) mol wt
21,000 . During S phase, these components acquiremore phosphate groups that retard their migration . However,5-mM theophylline treatment from 2 to 10.75 h after mitosissignificantly inhibits the apparent level of histone 132p incor-poration and causes histone 1 components to remain as rapidlymigrating protein species that are smaller than those normallyfound in G l cells . In contrast, Ara-C treatment beginning 2 hafter mitosis at a concentration (40 t-tg/ml) completely inhibitssubsequent DNA synthesis but not phosphorylation of previ-ously synthesized histone 1 components (9) which also migratedas the three principal peaks, as again seen in Fig . 3, eventhough the apparent level ofhistone 1 phosphorylation was cutin half. This implies that the influence of theophylline onhistone 1 phosphorylation is not simply a result of the inhibi-tion of DNA synthesis . While histone 1 phosphorylation isreduced in theophylline-treated cells, nonhistone phosphoryl-ation at 10 h after mitosis is increased relative to control cellswith marked increases in certain protein species (data notshown) . Thus, it appears that theophylline can potentiate someNHCP phosphorylations while greatly inhibiting histone H1phosphorylation and the progression of DNA synthesis .In light of previous suggestions discussed in the introduction,
correlating the onset of DNA synthesis with the relaxation ofchromatin in cells at the GT-S boundary and correlating this
change in chromatin conformation with increases in histone 1phosphorylation, attention must now be devoted to an exami-nation of the variations in nuclear morphology induced bytheophylline treatment . This may be accomplished by studyingTable I, which summarizes the average values and samplestandard deviations of the measured parameters described inMaterials and Methods for the entire population at varioustimes after mitosis as well as for subpopulations selected byIOD, and Figs . 2, 4, and 5 which display, respectively, the IODvs . AOD, two parameter histograms, at various times, of theentire population (Fig . 2) and the AOD versus FF histogramsfor either entire populations or selected (again on the basis ofIOD) subpopulations (Figs . 4 and 5) .At 3 h after mitosis, there is little difference between control
and treated cells. The ranges of both AOD and FF are thesame in the two populations and, although there are slightdifferences indicative of a more dispersed nuclear morphologyin the treated population, it is not completely clear whetherthese differences are real or rather a statistical fluctuationcaused by the sample population size . However, two-tailedstatistical tests indicate that the difference in means of the twopopulations is statistically significant with a significance levelof --2.5% .At 5 h, though, the difference is striking . In examining Table
1, we see that a comparison of average values indicates anincrease in nuclear condensation accompanied by a change toa more rounded nuclear shape in the theophylline-treated cells.The cause of this difference may be determined by examiningthe AOD vs . FF histograms. It is clear that the shift in meanvalues is not caused by the induction by theophylline of a newand abnormal morphological state but rather by the induction
DOLBY ET At . Histone H1 Phosphorylation and DNA Repfication
81
pyb
cm.CM.
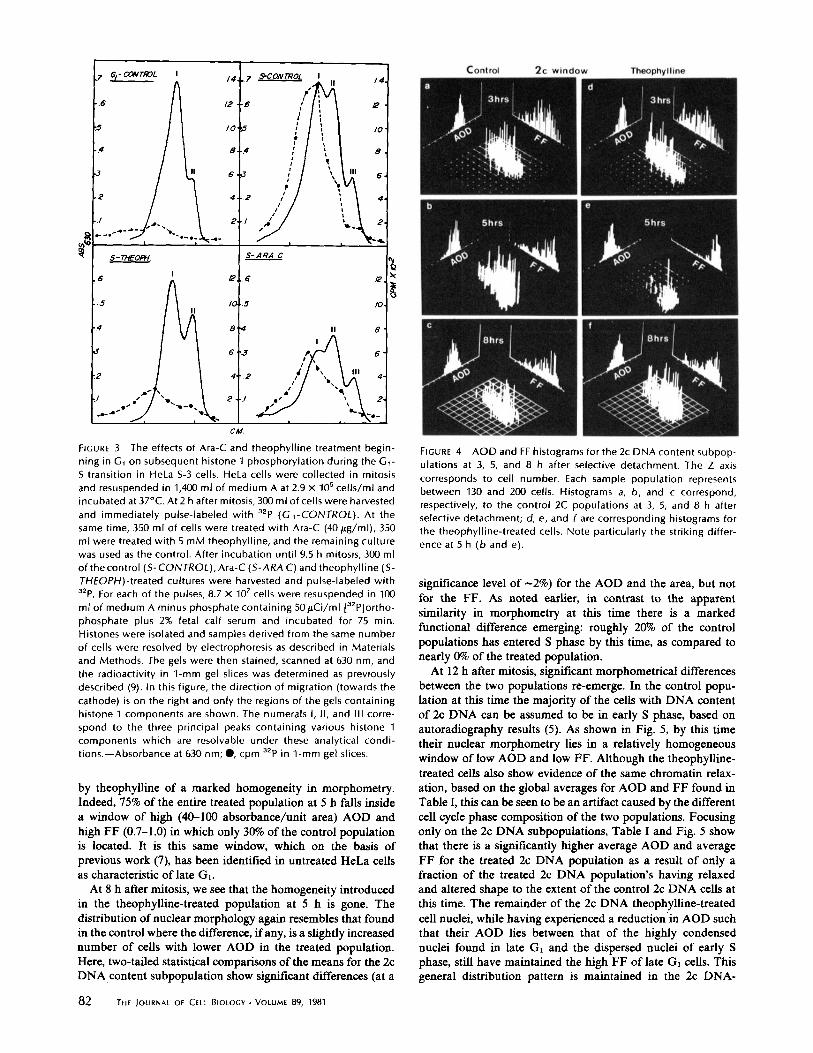
FIGURE 3
The effects of Ara-C and theophylline treatment begin-ning in G, on subsequent histone 1 phosphorylation during the G,-S transition in HeLa S-3 cells. HeLa cells were collected in mitosisand resuspended in 1,400 ml of medium A at 2 .9 x 105 cells/ml andincubated at 37°C . At 2 h after mitosis, 300 ml of cells were harvestedand immediately pulse-labeled with 32p (G,-CONTROL) . At thesame time, 350 ml of cells were treated with Ara-C (40 Wg/ml), 350ml were treated with 5 mM theophylline, and the remaining culturewas used as the control . After incubation until 9 .5 h mitosis, 300 mlofthe control (S- CONTROL), Ara-C (S-ARA C) and theophylline (S-THEOPH)-treated cultures were harvested and pulse-labeled with32p. For each of the pulses, 8 .7 x 107 cells were resuspended in 100ml of medium A minus phosphate containing 50ttCi/ml [ 32 Plortho-phosphate plus 2% fetal calf serum and incubated for 75 min .Histones were isolated and samples derived from the same numberof cells were resolved by electrophoresis as described in Materialsand Methods . The gels were then stained, scanned at 630 nm, andthe radioactivity in 1-mm gel slices was determined as previouslydescribed (9) . In this figure, the direction of migration (towards thecathode) is on the right and only the regions of the gels containinghistone 1 components are shown . The numerals I, 11, and III corre-spond to the three principal peaks containing various histone 1components which are resolvable under these analytical condi-tions.-Absorbance at 630 nm ; ", cpm 32p in 1-mm gel slices .
by theophylline of a marked homogeneity in morphometry.Indeed, 75% of the entire treated population at 5 h falls insidea window of high (40-100 absorbance/unit area) AOD andhigh FF (0.7-1 .0) in which only 30% of the control populationis located. It is this same window, which on the basis ofprevious work (7), has been identified in untreated HeLa cellsas characteristic of late G, .At 8 h after mitosis, we see that the homogeneity introduced
in the theophylline-treated population at 5 h is gone . Thedistribution of nuclear morphology again resembles that foundin the control where the difference, ifany, is a slightly increasednumber of cells with lower AOD in the treated population.Here, two-tailed statistical comparisons of the means for the 2cDNA content subpopulation show significant differences (at a
82
THE JOURNAL OF CELL BIOLOGY " VOLUME 89, 1981
FIGURE 4
AODand FF histograms for the 2c DNA content subpop-ulations at 3, 5, and 8 h after selective detachment . The Z axiscorresponds to cell number . Each sample population representsbetween 130 and 200 cells . Histograms a, b, and c correspond,respectively, to the control 2C populations at 3, 5, and 8 h afterselective detachment ; d, e, and f are corresponding histograms forthe theophylline-treated cells . Note particularly the striking differ-ence at 5 h (b and e) .
significance level of -2%) for the AOD and the area, but notfor the FF . As noted earlier, in contrast to the apparentsimilarity in morphometry at this time there is a markedfunctional difference emerging: roughly 20P/o of the controlpopulations has entered S phase by this time, as compared tonearly 001o of the treated population .
At 12 h after mitosis, significant morphometrical differencesbetween the two populations re-emerge. In the control popu-lation at this time the majority of the cells with DNA contentof 2c DNA can be assumed to be in early S phase, based onautoradiography results (5) . As shown in Fig. 5, by this timetheir nuclear morphometry lies in a relatively homogeneouswindow of low AOD and low FF . Although the theophylline-treated cells also show evidence of the same chromatin relax-ation, based on the global averages for AODandFF found inTable I, this can be seen to be an artifact caused by the differentcell cycle phase composition of the two populations . Focusingonly on the 2c DNA subpopulations, Table I and Fig. 5 showthat there is a significantly higher average AOD and averageFF for the treated 2c DNA population as a result of only afraction of the treated 2c DNA population's having relaxedand altered shape to the extent of the control 2c DNA cells atthis time . The remainder of the 2c DNA theophylline-treatedcell nuclei, while having experienced a reduction in AOD suchthat their AOD lies between that of the highly condensednuclei found in late G, and the dispersed nuclei of early Sphase, still have maintained the high FF of late G, cells. Thisgeneral distribution pattern is maintained in the 2c DNA-
1-G/- CMTfAL 14-7 &CONTROL I /411
6 /2 6 i 2
5 /0e i /0
.4 6 .4 ; B
3 11 6 .13i; "% III 6I
2 4-2 4-i
.l 2_1n n
A~~- 2ma r-
"- a
5-Tl#'OFH. S-ARA C
6 1 2 .6 /Z
5I I
10 .5 /0
4 6 II 6
6 31
A 6
.2 4 .2 " ~ 111 4
i
AAy
~i,-
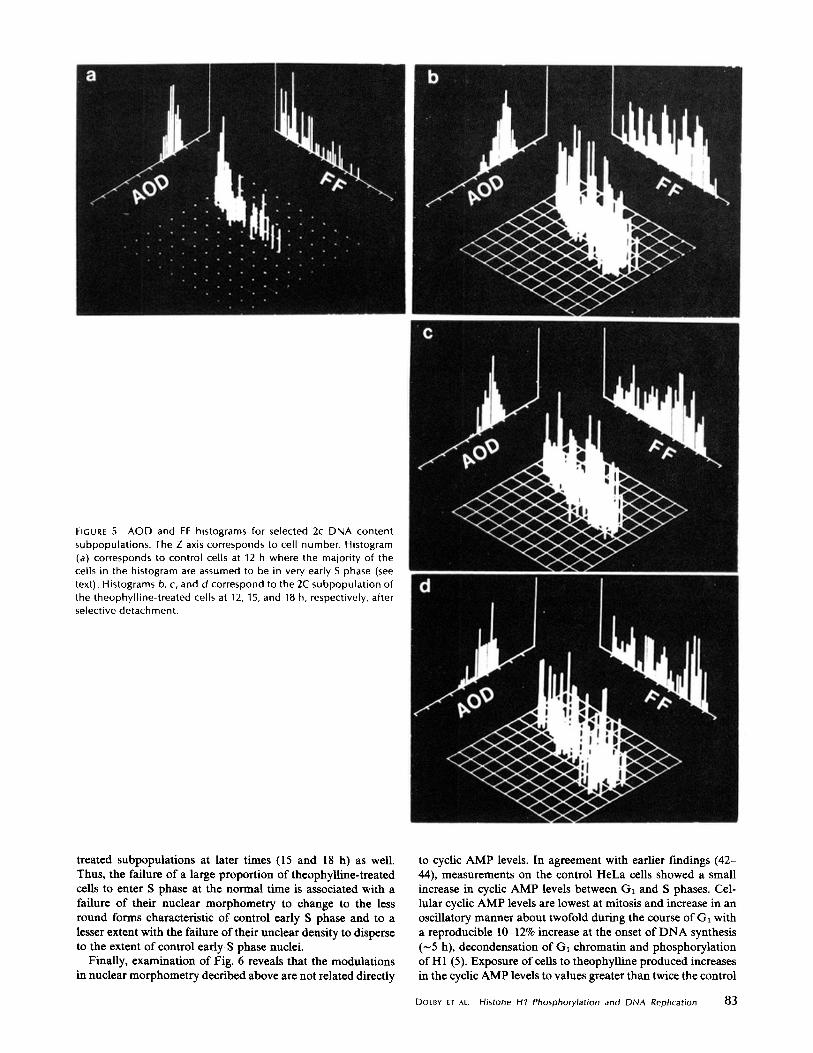
FIGURE 5 AOD and FF histograms for selected 2c DNA contentsubpopulations . The Z axis corresponds to cell number, Histogram(a) corresponds to control cells at 12 h where the majority of thecells in the histogram are assumed to be in very early 5 phase (seetext) . Histograms b, c, and d correspond to the 2C subpopulation ofthe theophylline-treated cells at 12, 15, and 18 h, respectively, afterselective detachment.
treated subpopulations at later times (15 and 18 h) as well .Thus, the failure of a large proportion of theophylline-treatedcells to enter S phase at the normal time is associated with afailure of their nuclear morphometry to change to the lessround forms characteristic of control early S phase and to alesser extent with the failure oftheir unclear density to disperseto the extent of control early S phase nuclei.
Finally, examination of Fig . 6 reveals that the modulationsin nuclear morphometry decribed above are not related directly
to cyclic AMP levels. In agreement with earlier findings (42-44), measurements on the control HeLa cells showed a smallincrease in cyclic AMP levels between G, and S phases . Cel-lular cyclic AMP levels are lowest at mitosis and increase in anoscillatory manner about twofold during the course of G, witha reproducible 1012% increase at the onset of DNA synthesis(-5 h), decondensation of G, chromatin and phosphorylationof H1 (5) . Exposure of cells to theophylline produced increasesin the cyclic AMP levels to values greater than twice the control
DOLBY ET AL . Histone H1 Phosphorylation and DNA Replication
83
84
THE JOURNAL OF CELL BIOLOGY " VOLUME 89, 1981
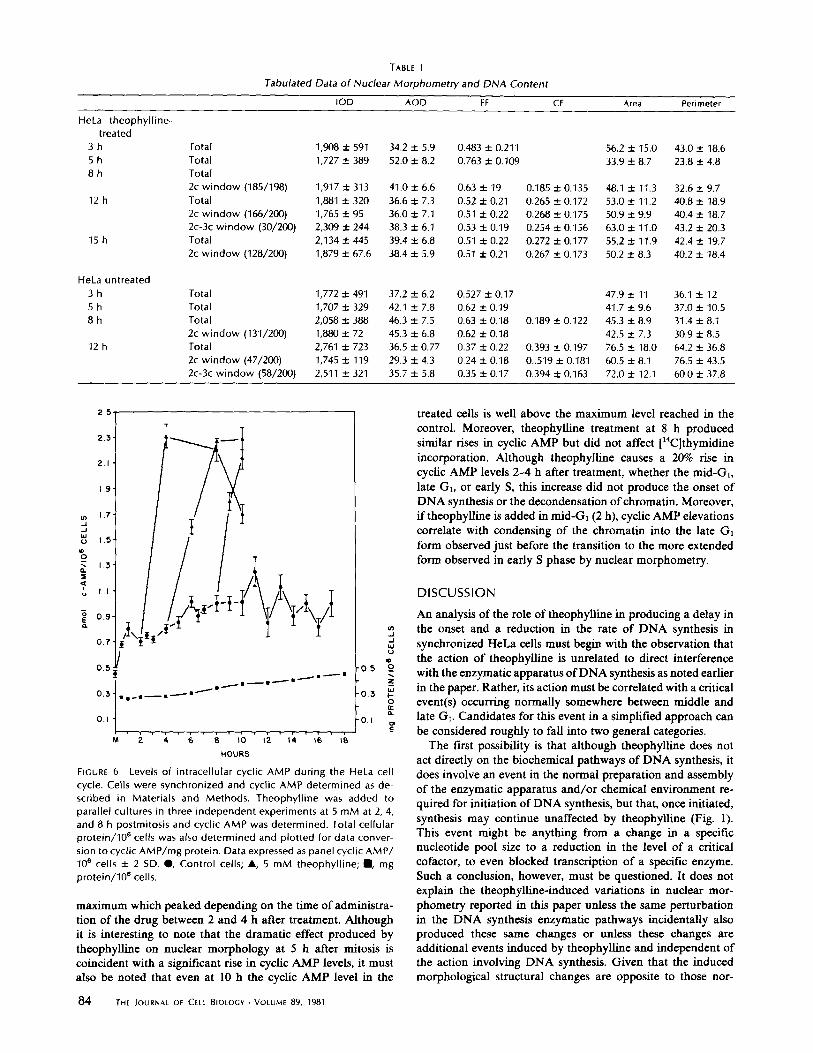
TABLE I
Tabulated Data of Nuclear Morphometry and DNA Content
JJ
0zF0zaaE
FIGURE 6 Levels of intracellular cyclic AMP during the HeLa cellcycle. Cells were synchronized and cyclic AMP determined as de-scribed in Materials and Methods. Theophylline was added toparallel cultures in three independent experiments at 5 mM at 2, 4,and 8 h postmitosis and cyclic AMP was determined . Total cellularprotein/106 cells was also determined and plotted for data conver-sion to cyclic AMP/mg protein. Data expressed as panel cyclic AMP/106 cells ± 2 SD . ", Control cells; A, 5 mM theophylline ; ", mgprotein/106 cells .
maximum which peaked depending on the time of administra-tion of the drug between 2 and 4 h after treatment. Althoughit is interesting to note that the dramatic effect produced bytheophylline on nuclear morphology at 5 h after mitosis iscoincident with a significant rise in cyclic AMP levels, it mustalso be noted that even at 10 h the cyclic AMP level in the
DISCUSSION
treated cells is well above the maximum level reached in thecontrol . Moreover, theophylline treatment at 8 h producedsimilar rises in cyclic AMP but did not affect ['"CJthymidineincorporation . Although theophylline causes a 20% rise incyclic AMP levels 2-4 h after treatment, whether the mid-G,,late G,, or early S, this increase did not produce the onset ofDNA synthesis or the decondensation ofchromatin . Moreover,if theophylline is added in mid-G, (2 h), cyclic AMP elevationscorrelate with condensing of the chromatin into the late G,form observed just before the transition to the more extendedform observed in early S phase by nuclear morphometry .
An analysis of the role of theophylline in producing a delay inthe onset and a reduction in the rate of DNA synthesis insynchronized HeLa cells must begin with the observation thatthe action of theophylline is unrelated to direct interferencewith the enzymatic apparatus ofDNA synthesis as noted earlierin the paper. Rather, its action must be correlated with a criticalevent(s) occurring normally somewhere between middle andlate G, . Candidates for this event in a simplified approach canbe considered roughly to fall into two general categories .The first possibility is that although theophylline does not
act directly on the biochemical pathways of DNA synthesis, itdoes involve an event in the normal preparation and assemblyof the enzymatic apparatus and/or chemical environment re-quired for initiation of DNA synthesis, but that, once initiated,synthesis may continue unaffected by theophylline (Fig. 1) .This event might be anything from a change in a specificnucleotide pool size to a reduction in the level of a criticalcofactor, to even blocked transcription of a specific enzyme.Such a conclusion, however, must be questioned . It does notexplain the theophylline-induced variations in nuclear mor-phometry reported in this paper unless the same perturbationin the DNA synthesis enzymatic pathways incidentally alsoproduced these same changes or unless these changes areadditional events induced by theophylline and independent ofthe action involving DNA synthesis . Given that the inducedmorphological structural changes are opposite to those nor-
HeLa theophylline-
IOD ACID FF CF Area Perimeter
treated3 h Total 1,908 t 591 34.2±5 .9 0.483±0.211 56.2±15.0 43.0±18.65 h Total 1,727 t 389 52.0±8 .2 0.763±0.109 33.9±8 .7 23.8±4 .88 h Total
2c window (185/198) 1,917 ± 313 41 .0 ± 6.6 0.63±19 0.185±0.135 48.1±11 .3 32.6±9.712 h Total 1,881 ± 320 36.6 ± 7.3 0.52±0.21 0.265±0.172 53.0±11 .2 40.8±18.9
2c window (166/200) 1,765 ± 95 36.0 ± 7.1 0.51±0.22 0.268±0.175 50.9±9 .9 40.4t18.72c-3c window (30/200) 2,309 ± 244 38.3 ± 6.1 0.53 t0.19 0.254 t 0.156 63 .0 ± 11 .0 43 .2 ± 20 .3
15 h Total 2,134 t 445 39.4 t 6.8 0.51 ±0.22 0.272 ± 0.177 55.2 ± 11 .9 42 .4 ± 19 .72c window (128/200) 1,879 ± 67.6 38.4 t 5.9 0.51±0.21 0.267±0.173 50.2±8 .3 40.2±18.4
HeLa untreated3 h Total 1,772 ± 491 37.2±6 .2 0.527±0.17 47.9±11 36.1±125 h Total 1,707 ± 329 42.1±7 .8 0.62±0.19 41.7±9 .6 37.0±10.58 h Total 2,058 ± 388 46.3±7 .5 0.63±0.18 0.189±0.122 45.3±8 .9 31 .4±8.1
2c window (131/200) 1,880 ± 72 45.3±6 .8 0.62±0.18 42.5±7 .3 30.9±8.512 h Total 2,761 ± 723 36.5±0.77 0.37±0.22 0.393±0.197 76.5±18.0 64.2±36.8
2c window (47/200) 1,745 ± 119 29.3±4 .3 0.24±0.18 0.319 0.181 60.5±8 .1 76.5±43 .52c-3c window (58/200) 2,511 ± 321 35.7±5 .8 0.35±0.17 0.394±0.163 72.0±12.1 60.0±37.8
mally observed in the transition from G, -* S, both explana-tions would assign such an action of theophylline to the statusof a mere coincidence.The alternative hypothesis is that the critical event involves
modification of the chromatin structure which, in turn, permitsDNA synthesis under those conditions in which the requiredsubstrates and enzymes are present and uninhibited, and thattheophylline interferes with this normal modification . Theobserved variations in nuclear morphometry induced by theo-phylline would now be explained as an expected reflection ofinterference with this modification . With this hypothesis, inter-est in the normal association of S phase with histone 1 phos-phorylation and the possibility that there exists a causal rela-tionship between histone 1 phosphorylation and chromatinstructure is greatly enhanced (5) by the observed inhibition ofhistone I phosphorylation occurring with theophylline treat-ment .
In summary, then, our results show that the theophylline-induced delay and inhibition ofDNAsynthesis in synchronizedHeLa cells is accompanied by both an arrest of nuclear mor-phometry in a morphological state intermediate to that of lateG, and early S and an inhibition of histone 1 phosphorylation .A comparison of data obtained by exposing cells to Ara-C,rather than theophylline, indicates that both the above phe-nomena are nota direct result of inhibition ofDNA synthesis.At present, our best explanation of our results is that theassociations between the inhibition of DNA synthesis, thealtered nuclear morphometry, and the inhibition of histone 1phosphorylation are related causally .
This work was supported by grants CA-20034, CA-11463, CA-17896,and CA-25875 from the National Cancer Institute, and IN-143 fromthe American Cancer Society. C. Nicolini would also like to acknowl-edge support from the Italian National Research Council .
Receivedforpublication 17 October 1980, and in revisedform 1 December1980.
REFERENCES
1 . Kendall, F., R. Swenson, T. Borun, R. Rowinski, and C. Nicohni. 1977 . Morphometryduring the cell cycle . Science (Wash. D . C.) . 196 :1106.
2. Nicohni, C., W. Giaretti, C. Desaire, and F. Kendall. 1977 . The GAG, transition of WI-38 cells . II . Geometric and densitometric texture analysis. Exp . Cell Res. 106:119-125 .
3 . Kendall, F., F . Beltrame, and C. Nicoiini. 1975. Nuclear morphometry in normal and SV-40 transformed human diploid fibroblasts, IEEE . Trans. Biomed. Eng. 26:172-175 .
4. Nicohni, C. 1979. Chromatin structure, from angstrom to micron levels, and its relationshipto mammalian cell proliferation. In Chromatin Structure and Function . C . Nicolini,editor. Plenum Press, New York. 613-666.
5. Dolby, T. W., K. Ajiro, T . W. Borun, R . S . Gilmour, A . Zweidler, L . Cohen, P. Miller,and C . Nicolini. 1979. Physical properties ofDNA and chromatin isolated from G,- andS-phase HeLa S-3 cells . Effects of histone H 1 phosphorylation and stage-specific nonhis-tone chromosomal proteins on the molar ellipticity of native and reconstituted nucleopro-teins during thermal denaturation . Biochemistry 18 :1333-1344.
6. Nicolini, C ., K . Ajiro, T. W . Borun, and R. Baserga. 1975 . Chromatin changes during thecell cycle of HeLa cells. J. Biol. Chem . 250:3381-3385.
7 . Nicolini, C. 1980. Nuclear morphometry, quinternary chromatin structure, and cell growth .J. Submicrosc. Cytol. 12:475-505.
8 . Beltrame, F., F. Kendall, and C . Nicoliru. 1979 . New growth parameters of mammaliancells in suspension and on substrate. In Modeling and Simulation. G. Vogt and M. Mickle,editors. Instrument Society of America. 87-94 .
9 . Marks, D.,W . K. Paik, andT.W . Borun. 1973 . The relationship ofhistone phosphorylationto deoxyribonucleic acid replication and mitosis during the HeLa cell cycle . J. Biol. Chem .248 :5660-5667.
10. Ord, M . G ., and L . A. Stocken . 1968 . Variations in the phosphate content and thiol/disulphide ratio of histones during the cell cycle. Biochem. J. 107:403-410 .
11 . Buckingham, R. H., and L. A. Stocken . 1970. Histone F1, purification and phosphoruscontent. Biochem J. 117 :157-160.
12. Balhorn, R., W. O. Rieke, and R . Chalkley. 1971 . Rapid electrophoretic analysis forhistone phosphorylation. A reinvestigation of phosphorylation of lysine-rich histoneduring rat liver regeneration . Biochemistry. 10 :3952-3959 .
13. Balhorn, R., R . Chalkley, and D . Granner. 1972. A positive correlation with cell replica-tion. Biochemistry. 11 :1094-1098.
14 . Balhorn, R ., 1 . Bordwell, L. Sellers, D. Granner, and R. Chalkley . 1972 . Histone phos-phorylation and DNA synthesis are linked in synchronous cultures ofHTC cells. Biochem.Biophys. Res . Commun. 46 :1326-1333 .
15 . Sherod, D., G. Johnson, and R. Chalkley. 1970 . Phosphorylation of mouse ascites tumorcell lysine-rich histone. Biochemistry. 9:4611-4615 .
16 . Gurley, L. R ., R . A. Walters, and R . A. Tobey . 1973. The metabolism of histone fractions .VI. Differences in the phosphorylation of histone fractions during the cell cycle . Arch .Biochem. Biophys. 154:212-218 .
17 . Gurley, L . R., R. A . Waiters, and R . A. Tobey . 1973. Histone phosphorylation in lateinterphase and mitosis. Biochem. Biophys. Res. Commun . 50:744-749 .
18 . Gurley, L . R ., R. A. Walters, and R. A. Tobey. 1974. The metabolism of histone fractions .Phosphorylation and synthesis of histories in late G, arrest . Arch . Biochem. Biophys . 164 :469-477.
19 . Rattle, H . W . E., G . G . Kneale, J . P . Baldwin, H. R . Matthews, C. Crane-Robinson, P. A .Cary, B . G. Carpenter, P . Suau, and E . M . Bradbury . 1979. Histon e complexes, nucleo-somes, chromatin and cell-cycle dependent modification of histones . In Chromatin Struc-ture and Function. C . Nicolini, editor. Plenum Press, New York . 451-513 .
20 . Matthews, H . R., and E. M. Bradbury. 1978 . The role of HI histone phosphorylation inthe cell cycle-turbidity studies of H I -DNA interaction. Exp. Cell Res. 111 :343 .
21 . Pastan, L, W . B . Anderson, R. A. Carchman, M. C . Willingham, T . R. Russell, and G. S .Johnson. 1974. Cyclic AMP and malignant transformation. In Control of Proliferation inMammalian Cells. B . Clarkson and R . Baserga, editors . Cold Spring Harbor Laboratory,Cold Spring Harbor, New York . 563-570 .
22 . Bannai, S ., and 1 . S. Sheppard. 1974. Cyclic AMP, ATP, and cell contact. Nature (Lond.) .250 :62-64.
23 . Sheppard, J. R . 1972 . Difference in the cyclic adenosine 3', 5' monophosphate levels innormal and transformed cells. Nat . New Biol. 236:14.
24 . Pastan, I., M. Willingham, R . Carchman, and W . B. Anderson . 1978 . Cyclic AMPmetabolism in normal and transformed fibroblasts. In The Role of Cyclic Nucleotides inCarcinogenesis. J . Schultz and B . G . Gratzner, editors . Academic Press, Inc., New York .47-52 .
25 . Often, 1., J. Bader, G. S. Johnson, and I. Pastan. 1972 . A mutation in a Rous sarcomavirus gene that controls adenosine 3', 5' monophosphate levels and transformation. J. Biol.Chem . 247 :1632.
26 . Burstin, S. J ., H . C. Renger, and C . Basilico . 1974. Cyclic AMP levels in temperature-sensitive SV-40-transformed cell lines. J. Cell Physiol . 84 :69-74.
27 . Gey, 1 ., A . Vogel, and R . Pollack . 1974 . Intracellular cyclic AMP concentration respondsspecifically to growth regulation by serum . Proc . Nail. Acad. Set. U. S. A . 71 :694.
28 . Willingham, M. C ., G. S. Johnson, and I. Pastan . 1972. Control of DNA synthesis andmitosis in 3T3 cells by cyclic AMP . Biochem . Biophys. Res . Commun . 48 :743-748.
29 . Sheppard, J. R . 1971 . Restoration of contact-inhibited growth to transformed cells bydibutyryl adenosine 3',5' cyclic monophosphate . Proc . Nail. Acad. Sci. U. S. A . 68 :1316-1320.
30 . Froehlich, J. E ., and M. Rachmeler. 1972. Effect of adenosine 3',5' cyclic monophosphateon cell proliferation. J. Cell Bial. 55 :19-31 .
31 . Froehlich, J . E ., and M. Rachmeler. 1974. Inhibition of cell growth in the G, phase byadenosine 3',5' cyclic monophosphate . J. Cell Biol. 60:249-257 .
32 . Rozengam E., and A . B. Pardee . 1972 . Opposite effects of dibutyryl adenosine 3',5' cyclicmonophosphate and serum on growth of Chinese hamster cells . J. Cell Physiol. 80 :273-280.
33. Chopra, D. 1977 . Effects of theophylline and dibutyryl cyclic AMP on proliferation andkeratinization of human keratinocytes . Br. J. Dermatol. 96:255 .
34 . Pardee, A., and L . James . 1975. Selective killing of transformed baby hamster kidney(BHK) cells . Proc . Nail. Acad. Sci. U. S. A . 72 :4994-4998.
35. Walters, R . A., L. R . Gurley, and R. H . Tobey . 1974 . Effects of caffeine on radiation-induced phenomena associated with cell-cycle traverse of mammalian cells. Biophys . J. 14:99-118.
36. Terasima, T., andL. J . Tolmach. 1963 . Growth and nucleic acid synthesis in synchronouslydividing populations of HeLa cells . Exp. Cell Res . 30 :344-362.
37. Robbins, E., and P . I. Marcus. 1964 . Mitotically synchronized mammalian cells : A singlemethod for obtaining large populations . Science(Wash . D . C.) . 144 :1152-1153.
38. Borun, T . W ., F. Gabrielli, K . Ajiro, A . Zweidler, and C . Baglioni . 1975 . Further evidenceof transcriptional and translational control of histone messengerRNAduring the HeLa S-3 cycle . Cell. 4:59-67 .
39. Stein, G . S., and T. W. Boron. 1972. The synthesis of acidic chromosomal proteins duringthe cell cycle of HeLa S-3 cells. J. Cell Bial. 52 :292-307 .
40. DeCosse, J . J., and N. Aiello . 1966 . Feulgen hydrolysis: Effect of acid and temperature. J.Hislochem. 14 :601 .
41 . Ajiro, K., T. W . Borun., and L . H. Cohen . 1975 . Phosphorylation sites of histone I (F1)in relation to the cell cycle. Fed Proc. No. 2047 (Absir.).
42 . Burger, M. M ., B. M . Bombik, B . M . Breckenridge, and J. R. Sheppard . 1972 . Growthcontrol and cyclic alterations of cyclic AMP in the cell cycle. Nat . New Biol. 239:161-164 .
43 . Sheppard, J . R., andD. M. Prescott . 1972 . CyclicAMP levels in synchronized mammaliancells. Exp. Cell Res. 75 :293-296.
44 . Millis, A . J . T ., G. A. Forrest, and D. A. Pious . 1974 . Cycli c AMP dependent regulationof mitosis in human lymphoid cells. Exp. Cell Res. 83 :335-343.
DOLBY ET AL. Histone H7 Phosphorylation and DNA Replication
85

![Sulforaphane Modifies Histone H3, Unpacks Chromatin, · Sulforaphane Modifies Histone H3, Unpacks Chromatin, and Primes Defense[OPEN] Britta Schillheim,a Irina Jansen,a Stephani](https://img.pdfslide.us/doc/110x75/5ec76439b075612ca66dd92e/sulforaphane-modiies-histone-h3-unpacks-chromatin-sulforaphane-modiies-histone.jpg)


![Histone deacetylases 1 and 2 maintain S-phase chromatin ......SMARCA5, an ISWI family chromatin remodeler [15,16]. In this study, we further show that SMARCA5 is present on nascent](https://img.pdfslide.us/doc/110x75/60bfe10deacc383f2122a636/histone-deacetylases-1-and-2-maintain-s-phase-chromatin-smarca5-an-iswi.jpg)