Embed Size (px)
Citation preview

Recommendation:Buy Chevron and Occidental Petroleum (CVX & OXY)
Integrated: Chevron
• 2nd largest US traded oil company by market cap.
• $198B in 2010 revenue, $19B net income
• 2.763B in net oil equivalent production
• 58,000 employees and 4,000 service station employees

Chevron: Strong Financials
Ticker
Mkt. Cap.
Div.Yield
5Yr. Div.
Growth
FCF Yield
WACC
ROICP/B P/E
3Yr Avg
ROE
FCF Mgn
3Yr Avg
Total Debt/To
tal Equity
Sum(Lower is better)
XOM 360B
4th 4th 4th 1st 7th 6th 1st 1st 2nd 30
CVX 190B
2nd 3rd 3rd 2nd 6th 2nd 2nd 2nd 1st 23
COP 88B 1st 1st 2nd 5th 4th 4th 6th 3rd 8th 34
HES 18B 6th 7th 6th 7th 1st 3rd 5th 6th 6th 47

Chevron: Strong Financials
Measure CVXTop 4 Mkt. Cap.
Avg.Dividend Yield 3.38% 2.73%
5Yr Net Div. Growth 9.11% 7.41%
FCF Yield 7.11% 4.48%
WACC ROIC 14.64% 10.34%
P/B 1.62 1.53
P/E 8.24 8.87
P/E 5yr Avg. minus Current P/E
1.09 2.20
3Yr Avg. ROE 19.53% 13.73%
FCF Mgn. 3Yr Avg. 3.27 2.74
Total Debt/Total Equity 9.89% 20.56%

CVX: Dividend History

CVX: Replacement Ratio

CVX SWOT Analysis
Strengths Very large, well established Moderate Beta of 0.98 Strong financials; good track record in most aspects
Weaknesses 2010 Replacement ratio < 1, but 10 year avg. = 1.01 Price correlated to Brent while Brent-WTI spread at highs
Opportunities Reserve growth through acreage acquisitions Oil consumption increases abroad
Threats Tax increases Environmental concerns Global economic weakness

Prev Close: 94.661y Target
Est:108
52wk Range:
80.41 - 109.94
Avg Vol (3m):
10,954,200
Market Cap:
189.6B
P/E (ttm): 8.33EPS (ttm): 11.45
Div & Yield: 3.12 (3.38%)
Forward P/E:
7.24
CVX Investment Information

E & P: Occidental Petroleum
• Largest US traded E&P by market cap: 61.57B, nearly 2x as large as next largest Anadarko at 32.8B
• Highest dividend yield (2.45%) in top 6 US E&P, 2nd in top 16
• 3.36B barrels of oil equivalent (BOE) proven reserves as of 2010 end.
• 19B in 2010 net sales, 4.53B net income
• Has outperformed S&P last 12 years (though currently trailing S&P YTD)

Occidental: Strong Financials
Measure OXYTop 4 Mkt. Cap.
Avg.Dividend Yield 2.45% 1.24%
5Yr Net Div. Growth 18.29 9.15
FCF Yield 2.52% 0.00%
WACC ROIC 12.63% 9%
P/B 1.75 1.39
P/E 10.49 14.14
P/E 5yr Avg. minus Current P/E
4.98 7.45
3Yr Avg. ROE 15.11% 7.49%
FCF Mgn. 3Yr Avg. 23.47 8.54
Total Debt/Total Equity 12.08% 34.43%

Occidental: Reserve Growth

Occidental: Dividend Growth

Occidental: Sales Growth

Occidental: Correlation to Oil (Timing)

SWOT Analysis
Strengths Largest US E&P Strong reserve, sales, and dividend growth Strong financials compared to peers
Weaknesses New CEO in 2011 (unproven but promoted from COO)
Opportunities May be currently underpriced Continuing oil shale acquisitions and international plays
Threats Tax increases Environmental concerns Global economic weakness

Prev Close: 75.721y Target
Est:113
52wk Range:
66.36 - 117.89
Avg Vol (3m):
5,976,330
Market Cap:
61.54B
P/E (ttm): 10.49EPS (ttm): 7.08
Div & Yield: 1.84 (2.60%)
Forward P/E:
8.47
OXY Investment Information

Investment Theses
• Chevron is a large cap integrated financially outperforming its peers. A respectable dividend with a history of growth protects against the downside while a moderate beta and solid correlation to oil prices should cause it to also do well in an up market.
• Occidental Petroleum is a large cap E&P with international production diversification and is a financial standout among its peers. A beta slightly over one paired with an acceptable dividend give it an upside and downside protection. Now appears to be a good time to buy considering the tight correlation to oil and the discount to said correlation.

Portfolio Placement / Recommendation $/SH. SH. # TOTAL $ WT. BETA WT.
BETASTD. DEV.
WT. STD.
TTM DIV. $
DIV. YIELD
WT. YIELD DESCRIPTION
AMLP 15.3 350 5355 0.1276 0.80 0.10 0.02 0.003 0.99 0.06 0.01 Pipeline ETF
CVX 94.61 100 9461 0.2254 0.77 0.17 0.06 0.013 3.00 0.03 0.01 Oil Integrated
FEN 26.16 200 5232 0.1247 0.92 0.11 0.05 0.006 1.85 0.07 0.01 Pipeline CEF
OXY 78.56 100 7856 0.1872 1.02 0.19 0.11 0.021 1.76 0.02 0.00 Oil E&P
PXJ 17.47 400 6988 0.1665 1.34 0.22 0.10 0.016 0.08 0.00 0.00 Oil Services Fund
VPU 70.74 100 7074 0.1686 0.61 0.10 0.03 0.005 2.69 0.04 0.01 US Utility Fund
TOTAL $41,966 $10.36
WT. AVG. BETA 0.91 STD.
DEV. 0.064 YIELD 3.56%

BUY 100 shares of CVX at Limit Price of $95.00 ($9,500, 2% of portfolio)
Holding Period/Exit Strategy: 2+ years; reassess thesis at least every three months.
BUY 100 shares of OXY at Limit Price of $80.00 ($8,000, 1.75% of portfolio)
Holding Period/Exit Strategy: 2+ years; reassess thesis at least every three months.
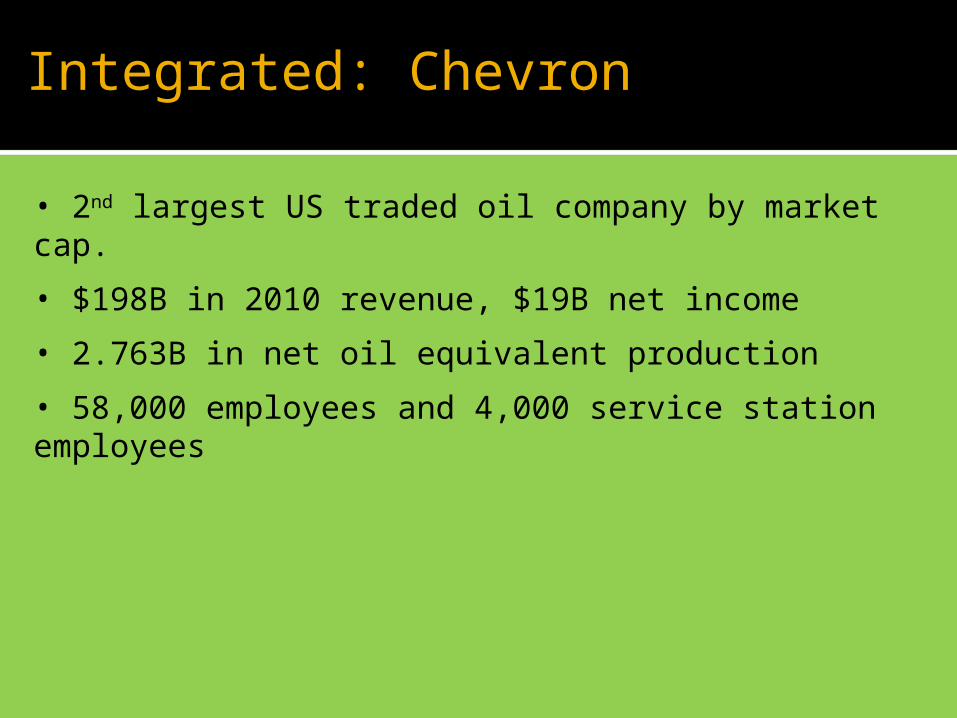
Portfolio Placement / Recommendation
Sector : Energy Projected Holdings: AMLP, FEN, CVX, PXJ, OXY Target Sector Allocation: 8.54%, ~$38,860 Projected Sector Allocation: 7.62% , ~$34,660 Remaining Allocation: 1.92%, $4,200
Portfolio Placement / Recommendation