Embed Size (px)
Citation preview
Hemophilia A and B are associated with abnormal
spatial dynamics of clot growth
Mikhail V. Ovanesov a,*, Julya V. Krasotkina a,1, Ljudmila I. Ul’yanova b, Kema V. Abushinova c,Olga P. Plyushch c, Sergey P. Domogatskii d, Andrey I. Vorob’ev e, Fazly I. Ataullakhanov a
aLaboratory of Physical Biochemistry of Blood, National Research Center for Hematology, Russian Academy of Medical Sciences, Novozykovsii pr. 4a,
Moscow 125167, RussiabDepartment of Genetics and Histology, Institute of Immunology, Ministry of Health, Kashirskoe shosse 24, Moscow 115478, Russia
cHemophilia Center, National Research Center for Hematology, Russian Academy of Medical Sciences, Novozykovsii pr. 4a, Moscow 125167, RussiadDepartment of Engineering Immunology, Cardiology Research Center, Russian Academy of Medical Sciences, 3-ia Cherepovetskaja ul. 15,
Moscow 121552, RussiaeInstitute of Hematology, National Research Center for Hematology, Russian Academy of Medical Sciences, Novozykovsii pr. 4a, Moscow 125167, Russia
Received 17 October 2001; received in revised form 14 May 2002; accepted 30 May 2002
Abstract
To gain greater insight into the nature of the bleeding tendency in hemophilia, we compared the spatial dynamics of clotting in platelet-
free plasma from healthy donors and from patients with severe hemophilia A or B (factor VIII:C or IX:C < 1%). Clotting was initiated via the
intrinsic or extrinsic pathway in a thin layer of nonstirred plasma by bringing it in contact with the glass or fibroblast monolayer surface. The
results suggest that clot growth is a process consisting of two distinct phases, initiation and elongation. The clotting events on the activator
surface and the preceding period free of visible signs of clotting are the initiation phase. In experiments with and without stirring alike, this
phase is prolonged in hemophilic plasma activated by the intrinsic, but not the extrinsic pathway. Strikingly, both hemophilia A and B are
associated with a significant deterioration in the elongation phase (clot thickening), irrespective of the activation pathway. The rate of clot
growth in hemophilic plasma is significantly lower than normal and declines quickly. The resulting clots are thin, which may account for the
bleeding disorder.
D 2002 Elsevier Science B.V. All rights reserved.
Keywords: Blood coagulation; Hemophilia; Spatiotemporal dynamics; Factor VIII; Tissue factor
1. Introduction
Hemophilia is a common hereditary disease characterized
by the uncontrolled and, often, life-threatening bleeding
tendency. Hemophilia A and B are caused by severe defi-
ciencies in plasma factors VIII and IX, respectively [1]. Less
common is hemophilia C (1–3% of all hemophilic patients
[2]), which is associated with a factor XI deficiency. Signifi-
cantly, all the three factors are not involved in the extrinsic
coagulation pathway, which is thought to be central to
thrombin generation [3–5]. Here, we consider two hypoth-
eses explaining this apparent paradox and test them in a novel
experimental system that allows direct examination of the
spatial aspects of clot growth.
The extrinsic (or tissue factor (TF)) pathway is activated
when circulating plasma factor VIIa comes in contact with
TF exposed at the site of injury [3,5]. This complex activates
circulating factor X. Its active form, factor Xa, in a complex
with phospholipids can activate factor VII, thereby boosting
its own production. More importantly, factor Xa activates a
limited amount of prothrombin, which in its active form
cleaves fibrinogen to form a clot. These reactions are
accelerated more than 100000-fold by the prothrombinase
complex, which is formed on a phospholipid membrane via
the assembly of factors Xa and Va in the presence of calcium
ions [6]. Thrombin activates its production even further
through activation of factor V and subsequent formation of
the additional prothrombinase complexes.
0304-4165/02/$ - see front matter D 2002 Elsevier Science B.V. All rights reserved.
PII: S0304 -4165 (02 )00278 -7
Abbreviations: APTT, activated partial thromboplastin time; IT,
initiation time; PTF, polyethylene terephthalate film; PT, prothrombin
time; TF, tissue factor* Corresponding author. Tel.: +7-095-2125531; fax: +7-095-2124252.
E-mail address: [email protected] (M.V. Ovanesov).1 Current address: Department of Pathology, CBS Research and
Development, UBC Room G-130, 2211 Wesbrook Mall, Vancouver, BC,
Canada V6T 2B5.
www.bba-direct.com
Biochimica et Biophysica Acta 1572 (2002) 45–57
Factors VIII, IX, and XI, which are affected in hemophil-
iacs, are involved in the intrinsic (or contact) coagulation
pathway. This pathway is thought to play a marginal role in
activation of blood coagulation [7] because deficiencies in the
factors initiating this pathway, such as factor XII, high-
molecular-weight kininogen, or prekallikrein, are not asso-
ciated with bleeding disorders or thrombosis [8–10]. Follow-
ing their activation in the presence of calcium ions, factors
VIIIa and IXa assemble on a phospholipid membrane to form
a tenase complex. This complex is 50 times more active in
activating factor X than the VIIa–TF complex [6]. Tenase
resembles the prothrombinase complex, both structurally [11]
and functionally [6]. Like cofactor V, cofactor VIII is acti-
vated by thrombin. The tenase proteolytic component, factor
IX, can be activated by three different mechanisms. One of
them, via contact activation, cannot account for bleeding
disorders because of the insignificance of this pathway in
activating coagulation in vivo [4,7]. Clearly, the issue of the
nature of bleeding disorders in hemophilic patients is tightly
linked with identifying the major pathway of factor IX
activation. We will, therefore, consider two hypotheses
explaining the bleeding tendency in hemophilia, which are
based on two different but not mutually exclusive mecha-
nisms of factor IX activation.
The first hypothesis relies upon the cross talk between
factor IX and the extrinsic pathway. The surface-associated
VIIa–TF complex can activate factor IX, in addition to factor
X [12–14]. Only the latter reaction is thought to be physio-
logically relevant in activating the coagulation cascade
[5,15–17]. However, it is conceivable that this activation
loop (VIIa–TF complex–factor IXa–tenase–factor Xa) pro-
vides an important contribution to the blood clotting process.
If so, a deficiency in either factor IX or VIII will lead to a
decrease in the tenase production and thereby to a bleeding
tendency. The VIIa–TF complex is restricted to the activating
surface, and factor IXa produced by this complex (and
thrombin then produced by factor Xa) can spread away from
the site of their formation only by diffusion. This model,
therefore, predicts that the initiation of clotting via the
extrinsic pathway should be prolonged in hemophilic plasma,
and both the clot growth rate and final size would decrease
proportionally to the extent of this prolongation (because of
the proportionality between the concentration and diffusion).
The second hypothesis takes into account slow activation
of factor XI by thrombin [18,19]. This positive feedback
loop leads to self-sustained production of thrombin. The rate
of this reaction is very low, and, against a background of
highly active VIIa–TF, tenase, and prothrombinase com-
plexes, its contribution is almost negligible in stirred in vitro
systems [20,21]. However, as we showed previously using
mathematical modeling, inclusion of this reaction into the
model significantly alters the spatial parameters of simulated
clot growth, e.g., the clot growth rate [22,23]. In the absence
of this reaction, factor Xa and thrombin spread away from
the activating surface only by diffusion. Obviously, a
deficiency in either factor XI, IX, or VIII may disrupt
self-accelerated thrombin production off the activating sur-
face. This model predicts that the initiation of clot growth in
hemophilic plasma via the extrinsic pathway is not very
different from normal, but the clot growth proper (i.e.,
thickening) is severely disrupted.
To discriminate between these two models, we exper-
imentally recorded the dynamics of clot growth on different
activating surfaces in nonstirred hemophilic and normal
plasma and compared the clotting initiation times (IT), the
clot growth rates, and the sizes and the shapes of growing
clots. As in a previous work carried out in the homogeneous
system, we found that the initiation of clot growth in
hemophilic plasma of any type was significantly impaired
when the intrinsic, but not the extrinsic pathway was
activated. Strikingly, we also observed that a deficiency in
either factor VIII or IX dramatically affected the clot
thickening (elongation) phase, irrespective of the activation
pathway. Apparently, the initiation stage of clotting in glass-
or fibroblast-monolayer-activated hemophilic plasma pro-
ceeds normally, but the resulting clots are thin, which
probably accounts for the bleeding tendency. We propose
that, whatever the activation pathway, a weak positive
feedback loop whereby thrombin activates factor XI, and,
hence, factors IX and X, plays an essential role in clot
thickening.
2. Materials and methods
2.1. Subjects
A total of seven pools of normal plasma were prepared,
each containing plasma from three healthy donors with no
history of bleeding. All pools were tested for the activated
partial thromboplastin time (APTT), prothrombin time (PT),
and thrombin time. None of the hemophilic patients had
antibodies against clotting factors. Five of them (aged 19–
21) had hemophilia A, and five (three patients were 18–21,
one 30, and one 61 years old) had hemophilia B with factor
VIII:C or IX:C < 1% of the norm, as was determined by one-
stage clotting assay. All had a history of frequent bleeds and
suffered from arthropathy of large joints (stages II–IV). The
sampling time was chosen according to the ISTH recom-
mendation [24]. Blood samples were taken during bleed-
free periods, not earlier than 4–5 days (hemophilia A) or 7–
10 days (hemophilia B) after the last administration of the
factor VIII- or IX-containing blood products, so that the
factor VIII or IX activity in the samples was < 1%. The
APTTwas 60–111 and 60–86 s in the plasma from patients
with hemophilia A and B, respectively, as compared to 26–
39 s in the normal plasma pools.
2.2. Blood collection and plasma preparation
Donor blood was collected into 3.8% sodium citrate (pH
5.5). Platelet-poor plasma was obtained by centrifuging the
M.V. Ovanesov et al. / Biochimica et Biophysica Acta 1572 (2002) 45–5746
blood at 2400� g for 15 min, followed by 10000� g for 5
min. The pH of supernatant plasma was stabilized at 7.2–
7.6 by lactic acid as described elsewhere [25]. The plasma
contained 10 AM sodium azide to prevent bacterial growth
and was kept overnight sealed in polystyrene 5-ml tubes at
room temperature. The overnight incubation [26] was nec-
essary to minimize the formation of spontaneous clots,
which grow in freshly prepared recalcified plasma presum-
ably activated during collection and fractionation. As we
previously showed, spontaneous clotting begins 15–25 min
(depending on the plasma pool) after recalcification, and the
number of such foci is proportional to the platelet concen-
tration [22]. Storage of plasma at room temperature for up to
24 h does not affect the clotting factor concentrations,
except for factor VIII, which decreases by 10–30%
[27,28]. We determined the APTT and PT in each plasma
pool on the day of its preparation and on the next day
immediately before the experiment. The clotting times
remained essentially constant during plasma storage
(P < 0.01).
2.3. Fibroblast culture
A human fetal lung fibroblast line was from the Ivanov-
skii Research Institute of Virology (Russian Academy of
Medical Sciences, Moscow, Russia). Cells (105/ml) were
grown at 37 jC in 50-ml flasks (Nunk, Denmark) containing
5 ml of a complete 199 medium (Sigma, MO, USA)
supplemented with 10% fetal calf serum (Flow Laborato-
ries, Inc., VA, USA), 10 Ag/ml gentamicin (Flow Labora-
tories), and 300 Ag/ml L-glutamine. Cells were passaged
every 3–4 days (upon reaching confluence). Briefly, after
being incubated for 10 min in 0.125% trypsin and 0.01%
EDTA preheated to 37 jC, cells were resuspended by gentle
shaking in 10 ml of the fresh culture medium. Cell concen-
tration was determined using a hemacytometer. To grow
fibroblast monolayers of different densities, we prepared a
series of dilutions (from 2� 103 to 100� 103 cells/ml) in
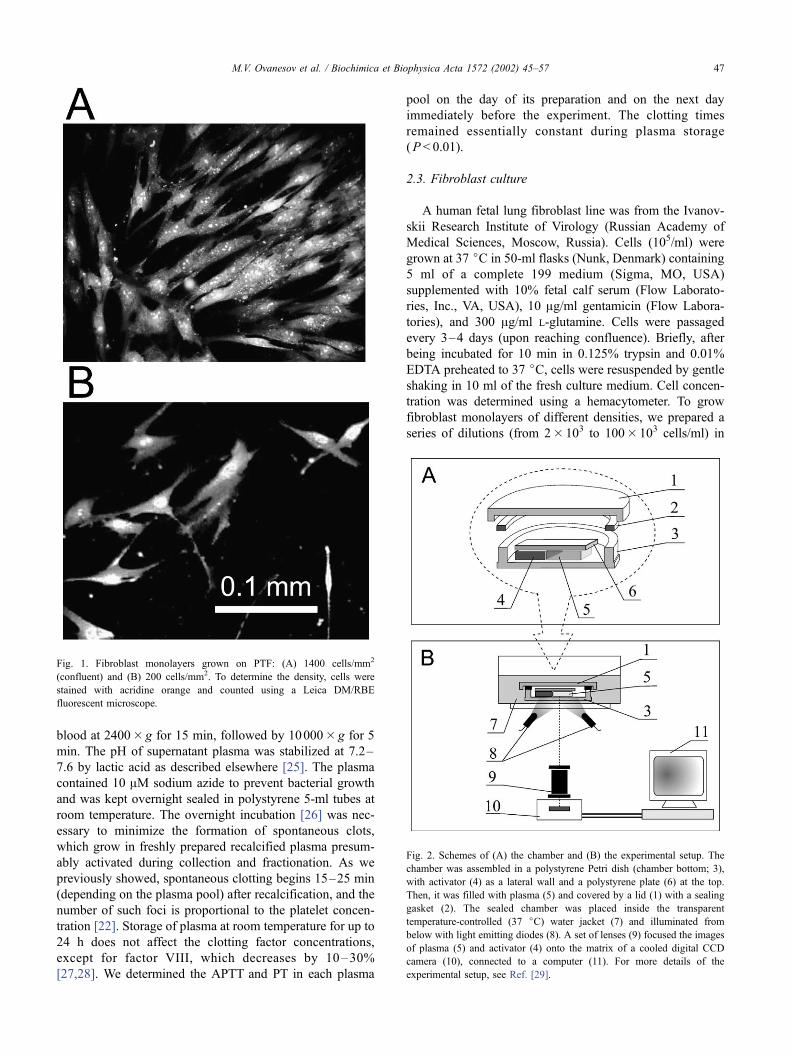
Fig. 1. Fibroblast monolayers grown on PTF: (A) 1400 cells/mm2
(confluent) and (B) 200 cells/mm2. To determine the density, cells were
stained with acridine orange and counted using a Leica DM/RBE
fluorescent microscope.
Fig. 2. Schemes of (A) the chamber and (B) the experimental setup. The
chamber was assembled in a polystyrene Petri dish (chamber bottom; 3),
with activator (4) as a lateral wall and a polystyrene plate (6) at the top.
Then, it was filled with plasma (5) and covered by a lid (1) with a sealing
gasket (2). The sealed chamber was placed inside the transparent
temperature-controlled (37 jC) water jacket (7) and illuminated from
below with light emitting diodes (8). A set of lenses (9) focused the images
of plasma (5) and activator (4) onto the matrix of a cooled digital CCD
camera (10), connected to a computer (11). For more details of the
experimental setup, see Ref. [29].
M.V. Ovanesov et al. / Biochimica et Biophysica Acta 1572 (2002) 45–57 47
HEPES-buffered RPMI (Sigma) supplemented as above.
The dilute suspension was added in 1-ml aliquots into wells
of a 24-well plate (Flow Laboratories) with a 10-Am-thick
polyethylene terephthalate film (PTF, Joint Institute for
Nuclear Research, Dubna, Moscow oblast, Russia) slip 2
cm2 in area on the bottom. The plate was placed in a CO2
incubator at 37 jC for 24 h to allow fibroblasts settled onto
slips to reach confluence. The cell density in monolayers
was determined by counting acridine orange stained cells
using a Leica DM/RBE (Leica Gmbh, Germany) fluores-
cence microscope (see Fig. 1). For example, to grow a
confluent monolayer uniformly covering the entire slip
(1000–1500 cells/mm2), we plated (80–100)� 103 cells/
well (Fig. 1A). At lower seeding concentrations, the cell
density was 1–1000 cells/mm2 (Fig. 1B).
2.4. Experimental chamber
A 1-mm-thick glass slide (Fig. 2A,(4); #48300-25, VWR
Scientific Inc., PA, USA) was fixed with a double-stick
Scotch tape between the bottom of a 40-mm polystyrene
Petri dish ((3); Medpolimer, St. Petersburg, Russia) and a
polystyrene plate (6). The glass slide edge, which formed a
vertical wall of the chamber, was wrapped around with a
cell-coated PTF slip rinsed three times in a Hanks solution.
In control experiments, PTF slips without cells were used or
the glass wall served as an activator of clotting.
The experiment was started by adding 20 Al of 1 M
CaCl2 per 1 ml plasma (final Ca2 + concentration 1.2–2.0
mM) preheated at 37 jC for 30 min. The plasma (0.4 ml)
was rapidly transferred into the preassembled chamber. The
Petri dish with the filled chamber was then hermetically
sealed with a lid (1) and temperature-controlled in a water
jacket (7). First frame could be recorded as early as f 1
min after recalcification. All experiments with plasma from
the same patient or donor pool were usually performed in
duplicate or triplicate on the same day.
2.5. Recording the clot growth
The spatial dynamics of clot growth was optically
monitored using a computer-assisted laboratory setup (Fig.
2B) [29]. The chamber (1–6) in a water-jacketed Petri dish
was illuminated from below with red-light-emitting diodes
((8); kpeak = 660 nm, L-1543-E, Kingbright, Japan) at 135jto the direction of recording by a digital CCD camera ((5);
EDC 1000 D, Electrim Corp., NJ, USA) [30] with a custom-
made cooling system (� 5 jC). We used the software based
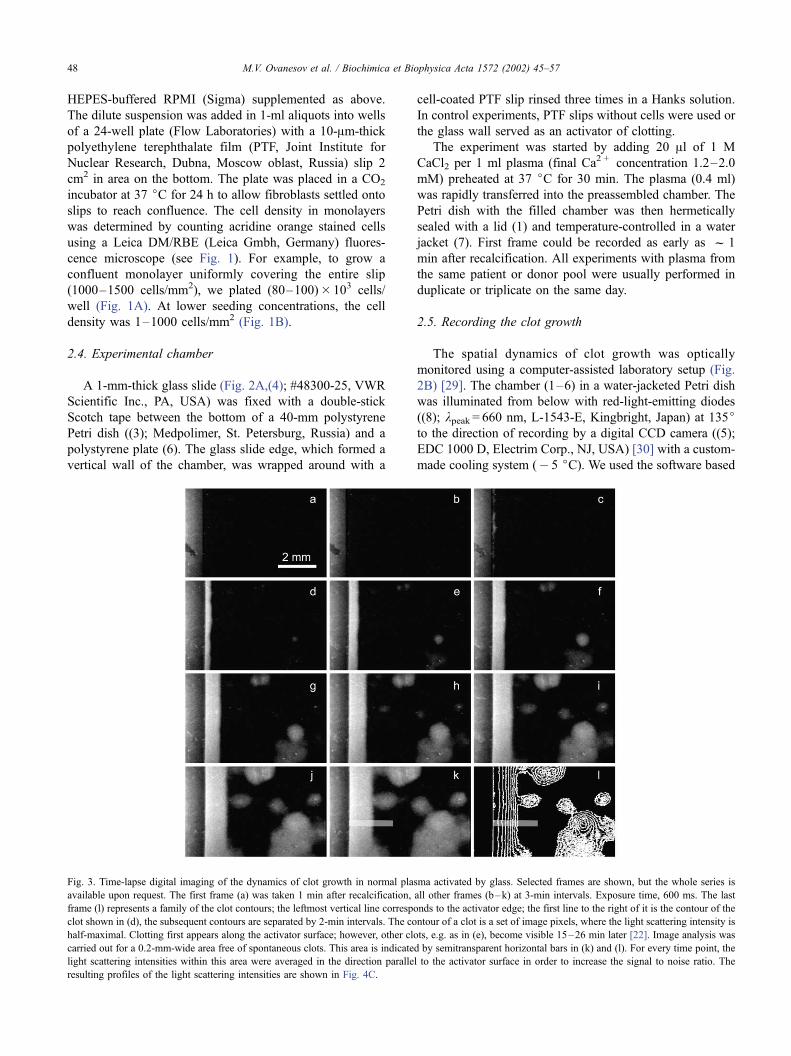
Fig. 3. Time-lapse digital imaging of the dynamics of clot growth in normal plasma activated by glass. Selected frames are shown, but the whole series is
available upon request. The first frame (a) was taken 1 min after recalcification, all other frames (b–k) at 3-min intervals. Exposure time, 600 ms. The last
frame (l) represents a family of the clot contours; the leftmost vertical line corresponds to the activator edge; the first line to the right of it is the contour of the
clot shown in (d), the subsequent contours are separated by 2-min intervals. The contour of a clot is a set of image pixels, where the light scattering intensity is
half-maximal. Clotting first appears along the activator surface; however, other clots, e.g. as in (e), become visible 15–26 min later [22]. Image analysis was
carried out for a 0.2-mm-wide area free of spontaneous clots. This area is indicated by semitransparent horizontal bars in (k) and (l). For every time point, the
light scattering intensities within this area were averaged in the direction parallel to the activator surface in order to increase the signal to noise ratio. The
resulting profiles of the light scattering intensities are shown in Fig. 4C.
M.V. Ovanesov et al. / Biochimica et Biophysica Acta 1572 (2002) 45–5748
on standard drivers supplied by Electrim, which allowed
automated data acquisition and preliminary processing. The
light scattering data from a 7.2� 5.4 mm area were recorded
every 30 s as .TIF files and additionally processed as
described in the legend to Fig. 3.
3. Results
3.1. Activation of clotting via the intrinsic pathway
3.1.1. Clot growth in normal plasma
When plasma is contact activated, the first signs of
clotting are detected after some lag-period, thereafter
called the clotting IT. In plasma from healthy donors
activated by glass, the IT was 7.9F 2.6 min (Fig. 3c).
The wide front of the growing clot propagated parallel to
the activator surface (Fig. 3e–k). Spontaneous clots
began to form 10 to 25 min (depending on the plasma
pool) after recalcification (Fig. 3d–f), and filled the entire
plasma in 40–60 min. The contours of the clots for
different moments can be superimposed in one image,
allowing pictorial visualization of the dynamics of clot
growth (Fig. 3l). More detailed information is obtained
by scanning the area indicated by a horizontal bar in Fig.
3k. The resulting profiles can be presented as plots of the
light scattering intensity versus distance from the glass
surface (Fig. 4). In normal plasma activated by glass,
such profiles have a shape of a step-function: while being
even and maximal within the clot, the light intensity
drops steeply at its interface with liquid plasma (Fig. 4C).
The rate of propagation of the light scattering front was
assessed by monitoring its point at the half-maximal
height (Fig. 4C, dashed line). The distance from the
glass surface to the half-intensity point plotted versus
time is shown in Fig. 5A, filled squares). As estimated
from the slope of this line, the rate of clot growth was
maximal immediately after beginning of clotting, but then
slowly decreased, and 5–7 min later became quasista-
tionary. The average quasistationary rate of clot growth
was 0.040F 0.006 mm/min; the average clot size 40 min
after recalcification was 1.72F 0.25 mm (Table 1).
Similar experiments were carried out to examine the
dynamics of clot growth activated by an PTF. The beginning
of clotting was slightly delayed and usually started after 10–
13 min. All other parameters of clot growth, such as the
maximal light scattering intensity, steepness of the front
(Fig. 4D), and the clot growth rate (Fig. 5B, filled squares),
were very similar to those observed after activation by glass
(Table 1).
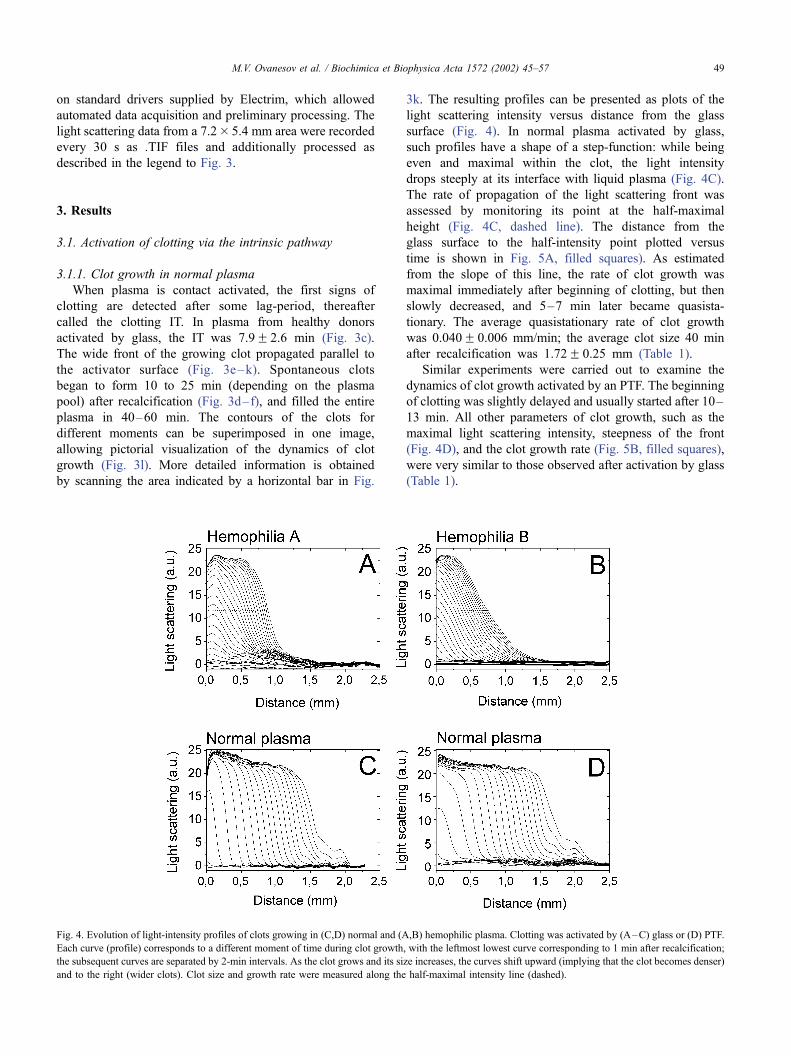
Fig. 4. Evolution of light-intensity profiles of clots growing in (C,D) normal and (A,B) hemophilic plasma. Clotting was activated by (A–C) glass or (D) PTF.
Each curve (profile) corresponds to a different moment of time during clot growth, with the leftmost lowest curve corresponding to 1 min after recalcification;
the subsequent curves are separated by 2-min intervals. As the clot grows and its size increases, the curves shift upward (implying that the clot becomes denser)
and to the right (wider clots). Clot size and growth rate were measured along the half-maximal intensity line (dashed).
M.V. Ovanesov et al. / Biochimica et Biophysica Acta 1572 (2002) 45–57 49
3.1.2. Clot growth in hemophilic plasma
The beginning of clotting on the glass surface was
significantly delayed (up to 20–30 min after recalcification)
in hemophilic plasma. The average IT was 35.4F 2.8 min
for hemophilia A and 20.2F 3.9 min for hemophilia B
(Table 1). The clot grew more slowly than in normal plasma
(see below), and no spontaneous clots were observed
throughout the experiment (40–90 min and longer). In
general, the dynamics of clot formation on the glass surface
were similar in plasma of patients with hemophilia A and B.
However, in two out of five patients with hemophilia A, no
clotting could be detected throughout the experiment (IT>70
min).
To compare the glass and PTF surfaces in the strength of
activation of clotting, we monitored clot growth in hemo-
philic plasma exposed to these two activators simultane-
ously. Part of the glass surface was wrapped with the PTF,
allowing a direct comparison of these activators. Irrespec-
tive of hemophilia type, clots started to form 20–40 min
later on the PTF than on the glass surface (Fig. 5B, open
triangles and circles; Table 1).
In hemophilic plasma, clots grew four to five times more
slowly than in normal plasma. The light scattering profiles
for a clot growing on the glass surface in plasma from a
patient with hemophilia B are shown in Fig. 4B. The clot
edge is fuzzy, and the clot density decreases gradually with
time, so that the respective profiles are less steep than in
normal plasma. It is, therefore, difficult to unambiguously
determine the rate of clot growth. We arbitrary set the scan
line in the same way as for the ‘‘step’’ profiles in normal
plasma, i.e., at the half-maximal height (Fig. 4B, dashed
line). The movement of a representative point along this
line is four times slower than in normal plasma (Table 1).
After 40 min, the maximal clot size in the patient plasma
was < 0.7 mm.
The light scattering profiles in plasma from a patient with
hemophilia A plasma behaved similarly (Fig. 4A). The rate of
glass-activated clot growth was only about 26% of that in
normal plasma (Fig. 5A, open triangles). The PTF-activated
clot growth was even slower: it was about twice slower than
on the glass surface, and about four to seven times slower than
clotting on the PTF surface in normal plasma (Fig. 5B, open
triangles).
The delay in clot growth in nonstirred hemophilic plasma
was correlated well with the prolonged clotting in fully stirred
plasma. To compare the spatial dynamics of clot growth with
the kinetics of clotting in a stirred system, we determined the
APTT in the same plasma that was used in the spatial
experiments (Table 1). This allows direct comparison of the
APTT with the parameters of clot growth. Normal or hemo-
philic plasma was induced to clot by stirring in the presence
of kaolin, a strong activator of the intrinsic pathway. The
APTT in all hemophiliacs was prolonged and correlated well
with the increased IT in hemophilic plasma activated by glass
or PTF. However, in all cases, the APTT was significantly
shorter than the IT, presumably because kaolin is a much
stronger activator of clotting than glass or PTF. If the APTT is
taken as unity, then the ITs for glass and PTF in normal
plasma are 14 and 20.2, respectively (1:14:20.2 ratio, Table
1). The analogous ratio is 1:11.5:15.5 in hemophilia A, and
1:16.6:34 in hemophilia B. It is easy to see that the deficiency
in either factor is not associated with considerable deviations
of this ratio from its value in normal plasma.
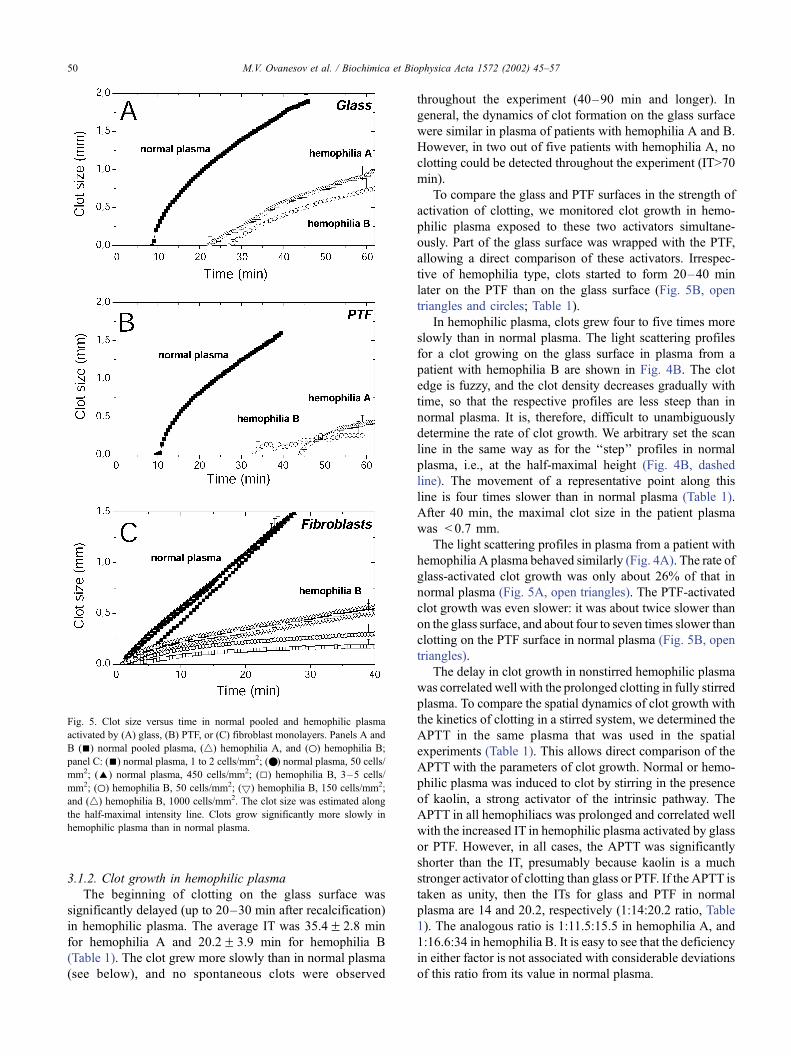
Fig. 5. Clot size versus time in normal pooled and hemophilic plasma
activated by (A) glass, (B) PTF, or (C) fibroblast monolayers. Panels A and
B (n) normal pooled plasma, (4) hemophilia A, and (o) hemophilia B;
panel C: (n) normal plasma, 1 to 2 cells/mm2; (.) normal plasma, 50 cells/
mm2; (E) normal plasma, 450 cells/mm2; (5) hemophilia B, 3–5 cells/
mm2; (o) hemophilia B, 50 cells/mm2; (5) hemophilia B, 150 cells/mm2;
and (4) hemophilia B, 1000 cells/mm2. The clot size was estimated along
the half-maximal intensity line. Clots grow significantly more slowly in
hemophilic plasma than in normal plasma.
M.V. Ovanesov et al. / Biochimica et Biophysica Acta 1572 (2002) 45–5750
3.2. Activation of clotting via the extrinsic pathway
3.2.1. Clot growth in normal plasma
To examine the spatial dynamics of clot growth activated
via the extrinsic pathway, we used fibroblasts grown in
monolayer cultures. These cells constantly express TF, an
activator of the extrinsic pathway, on their surface [31].When
pooled plasma from healthy donors was brought in contact
with a confluent fibroblast monolayer, clotting could be
detected as early as within 1 min after recalcification. We
observed no delays in the initiation of clot growth, which
were typical of the activation by glass or PTF. It, therefore,
appears that such a fast response is characteristic of the
activation via the extrinsic pathway. Other clotting parame-
ters were very similar, implying that the spatial dynamics of
clot growth in normal plasma is largely independent of the
activation pathway. For example, the light scattering profiles
in normal plasma activated by a fibroblast monolayer (Fig.
6C, panel b) and by glass (Fig. 4C) were very similar. Some
differences were detected in the shape of the clot size versus
time plots (Fig. 5). The clot size linearly increased with time,
indicating a constant rate of clot growth. The quasistationary
rate of clot growth activated on a fibroblast monolayer was
0.039F 0.005 mm/min, which did not differ statistically
significantly from the rate of glass-induced clot growth
(Table 1). The average size the clot reached 40 min after
recalcification was 1.74F 0.27 mm.
Clot growth in normal plasma was almost independent of
the fibroblast density. The dynamics of clot growth was
studied as a function of the activator strength by varying the
fibroblast density in monolayers from 1 or 2 to up to 450
cells/mm2. Fig. 7C(a–c) shows the propagation of the light
scattering fronts recorded in normal plasma from the same
pool for three different cell densities. In all three experi-
ments, the clot edge appeared relatively flat and continuous,
the light scattering profiles were similar, and clots grew to
almost the same size (compare panels a and b in Fig. 6C).
No significant differences were detected in the IT, which
was < 1 min in all experiments, except when clotting was
activated by a low-density monolayer (1 or 2 cells/mm2).
Fig. 5C (filled symbols) shows the plots of the clotting front
position versus time: clearly, the clot growth rates were also
similar at all the cell densities used.
3.2.2. Clot growth in hemophilic plasma
The initiation phase of clot growth was unaffected in
hemophilic plasma. In plasma from patients with hemo-
philia A or B activated by a confluent fibroblast mono-
layer, clot growth began almost immediately ( < 1 min
after recalcification), as in normal plasma. The undelayed
activation was observed in a broad range of cell densities
(from 5 to 2000 cells/mm2), suggesting that this response
is largely independent of the strength of the activating
signal. The IT for activation by a fibroblast monolayer
can be directly compared with the PT in stirred system,
because both tests rely on the use of the same activating
agent, i.e., thromboplastin [3,14]. We determined that
normal and hemophilic plasma in our experiments had
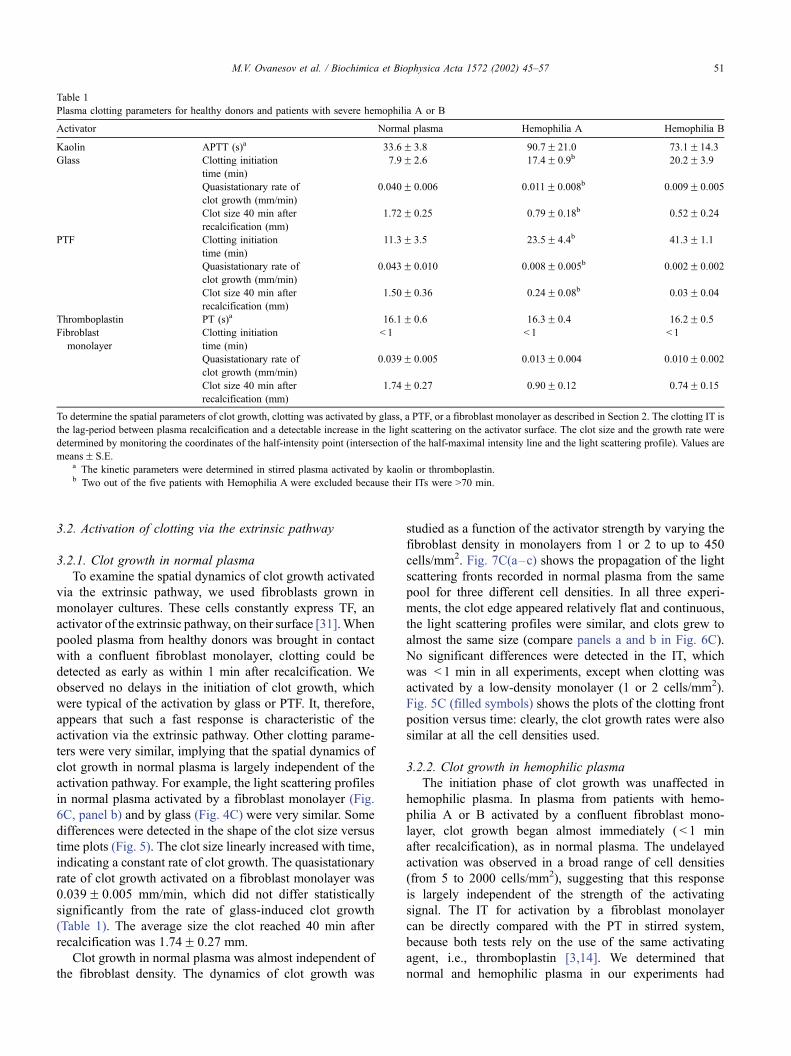
Table 1
Plasma clotting parameters for healthy donors and patients with severe hemophilia A or B
Activator Normal plasma Hemophilia A Hemophilia B
Kaolin APTT (s)a 33.6F 3.8 90.7F 21.0 73.1F14.3
Glass Clotting initiation
time (min)
7.9F 2.6 17.4F 0.9b 20.2F 3.9
Quasistationary rate of
clot growth (mm/min)
0.040F 0.006 0.011F 0.008b 0.009F 0.005
Clot size 40 min after
recalcification (mm)
1.72F 0.25 0.79F 0.18b 0.52F 0.24
PTF Clotting initiation
time (min)
11.3F 3.5 23.5F 4.4b 41.3F 1.1
Quasistationary rate of
clot growth (mm/min)
0.043F 0.010 0.008F 0.005b 0.002F 0.002
Clot size 40 min after
recalcification (mm)
1.50F 0.36 0.24F 0.08b 0.03F 0.04
Thromboplastin PT (s)a 16.1F 0.6 16.3F 0.4 16.2F 0.5
Fibroblast
monolayer
Clotting initiation
time (min)
< 1 < 1 < 1
Quasistationary rate of
clot growth (mm/min)
0.039F 0.005 0.013F 0.004 0.010F 0.002
Clot size 40 min after
recalcification (mm)
1.74F 0.27 0.90F 0.12 0.74F 0.15
To determine the spatial parameters of clot growth, clotting was activated by glass, a PTF, or a fibroblast monolayer as described in Section 2. The clotting IT is
the lag-period between plasma recalcification and a detectable increase in the light scattering on the activator surface. The clot size and the growth rate were
determined by monitoring the coordinates of the half-intensity point (intersection of the half-maximal intensity line and the light scattering profile). Values are
meansF S.E.a The kinetic parameters were determined in stirred plasma activated by kaolin or thromboplastin.b Two out of the five patients with Hemophilia A were excluded because their ITs were >70 min.
M.V. Ovanesov et al. / Biochimica et Biophysica Acta 1572 (2002) 45–57 51
the PT of f 16 s (Table 1), which is shorter than the
time required to begin recordings of clot growth (see
Section 2.4). We, therefore, concluded that the ITs in
hemophilic and normal plasma were comparable, but their
accurate determination was not possible in our experi-
mental system.
It is unlikely that the IT in our experiments might be
influenced by the activation produced by a PTF slip itself.
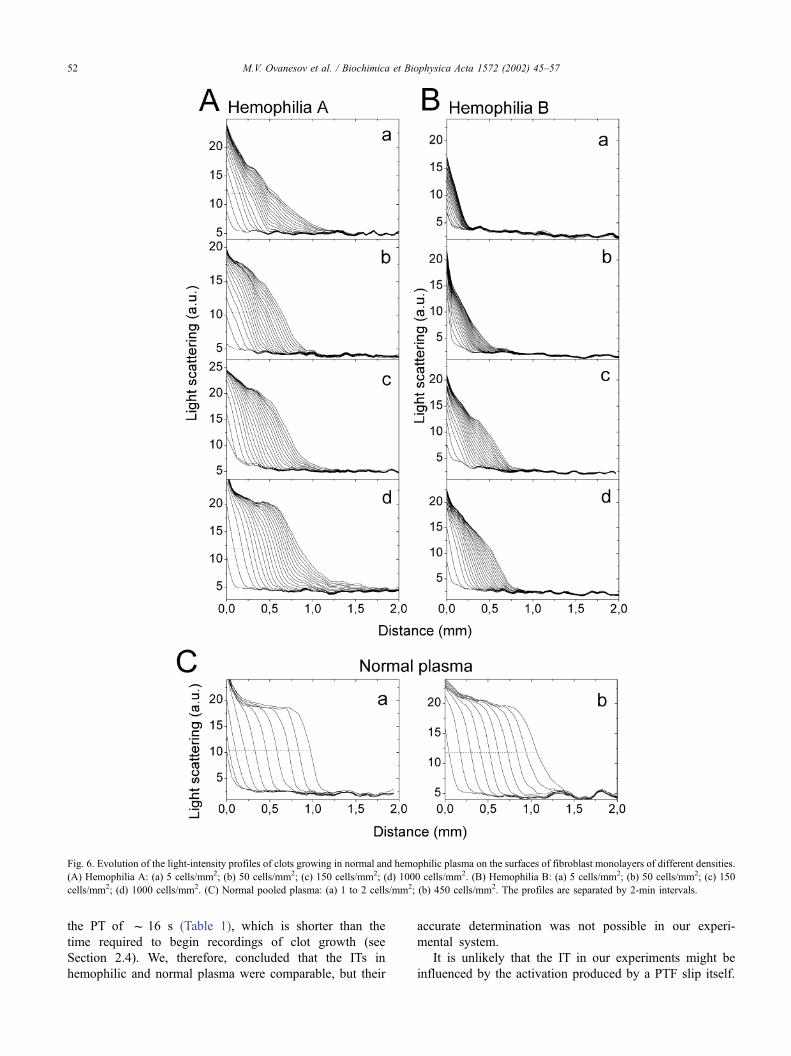
Fig. 6. Evolution of the light-intensity profiles of clots growing in normal and hemophilic plasma on the surfaces of fibroblast monolayers of different densities.
(A) Hemophilia A: (a) 5 cells/mm2; (b) 50 cells/mm2; (c) 150 cells/mm2; (d) 1000 cells/mm2. (B) Hemophilia B: (a) 5 cells/mm2; (b) 50 cells/mm2; (c) 150
cells/mm2; (d) 1000 cells/mm2. (C) Normal pooled plasma: (a) 1 to 2 cells/mm2; (b) 450 cells/mm2. The profiles are separated by 2-min intervals.
M.V. Ovanesov et al. / Biochimica et Biophysica Acta 1572 (2002) 45–5752
As shown above, the PTF is relatively ineffective in
activating the clotting response: when induced by PTF, clot
growth began 11 min after recalcification or even later.
Obviously, the PTF cannot account for the fast response.
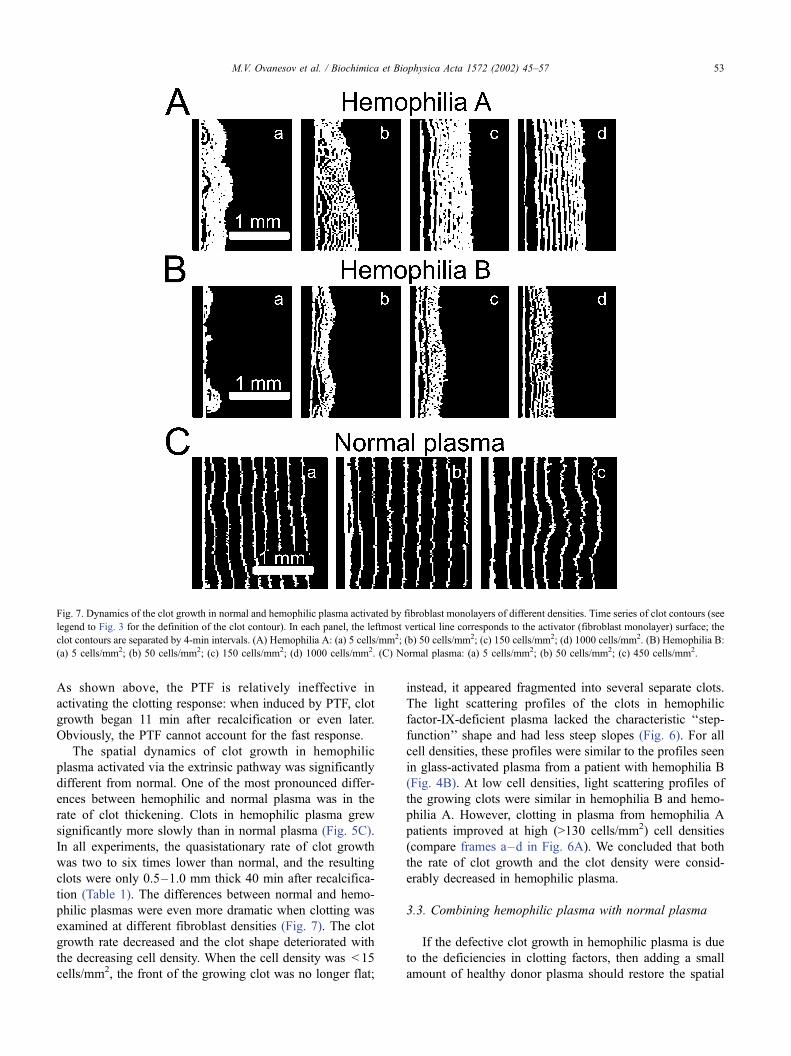
The spatial dynamics of clot growth in hemophilic
plasma activated via the extrinsic pathway was significantly
different from normal. One of the most pronounced differ-
ences between hemophilic and normal plasma was in the
rate of clot thickening. Clots in hemophilic plasma grew
significantly more slowly than in normal plasma (Fig. 5C).
In all experiments, the quasistationary rate of clot growth
was two to six times lower than normal, and the resulting
clots were only 0.5–1.0 mm thick 40 min after recalcifica-
tion (Table 1). The differences between normal and hemo-
philic plasmas were even more dramatic when clotting was
examined at different fibroblast densities (Fig. 7). The clot
growth rate decreased and the clot shape deteriorated with
the decreasing cell density. When the cell density was < 15
cells/mm2, the front of the growing clot was no longer flat;
instead, it appeared fragmented into several separate clots.
The light scattering profiles of the clots in hemophilic
factor-IX-deficient plasma lacked the characteristic ‘‘step-
function’’ shape and had less steep slopes (Fig. 6). For all
cell densities, these profiles were similar to the profiles seen
in glass-activated plasma from a patient with hemophilia B
(Fig. 4B). At low cell densities, light scattering profiles of
the growing clots were similar in hemophilia B and hemo-
philia A. However, clotting in plasma from hemophilia A
patients improved at high (>130 cells/mm2) cell densities
(compare frames a–d in Fig. 6A). We concluded that both
the rate of clot growth and the clot density were consid-
erably decreased in hemophilic plasma.
3.3. Combining hemophilic plasma with normal plasma
If the defective clot growth in hemophilic plasma is due
to the deficiencies in clotting factors, then adding a small
amount of healthy donor plasma should restore the spatial
Fig. 7. Dynamics of the clot growth in normal and hemophilic plasma activated by fibroblast monolayers of different densities. Time series of clot contours (see
legend to Fig. 3 for the definition of the clot contour). In each panel, the leftmost vertical line corresponds to the activator (fibroblast monolayer) surface; the
clot contours are separated by 4-min intervals. (A) Hemophilia A: (a) 5 cells/mm2; (b) 50 cells/mm2; (c) 150 cells/mm2; (d) 1000 cells/mm2. (B) Hemophilia B:
(a) 5 cells/mm2; (b) 50 cells/mm2; (c) 150 cells/mm2; (d) 1000 cells/mm2. (C) Normal plasma: (a) 5 cells/mm2; (b) 50 cells/mm2; (c) 450 cells/mm2.
M.V. Ovanesov et al. / Biochimica et Biophysica Acta 1572 (2002) 45–57 53
characteristics of clotting. To test this suggestion, we
examined how clotting proceeded in hemophilic plasma
supplemented with up to 10% of normal plasma. In the
supplemented plasma, the shape of the light scattering
profiles improved and gained more resemblance to normal.
Spontaneous clots were also seen as in normal plasma. The
average rate of clot growth in the supplemented plasma
became 65% of normal.
4. Discussion
Bleeding disorders in hemophilic patients suggest essen-
tial, yet unidentified roles for plasma factors VIII and IX in
clotting activated by the extrinsic pathway. To dissect their
putative roles in determining the dynamic parameters of clot
growth, we took advantage of the recently developed
experimental system, which allows examination of clot
growth in a thin layer of nonstirred plasma [22,29].
Although this approach provides previously unavailable
information (e.g., the rate of clot growth), some of the
results obtained can be compared with the data provided by
homogeneous (stirred) experimental systems. To this end,
we will consider clot growth to be a process consisting of
two distinct phases, initiation and elongation.
(1) The initiation phase is characterized by the IT, which
is the lag-period between activation of clotting and its first
visible manifestations (fibrin polymerization). By definition,
this phase is also characterized by the kinetics of the
increase in the light scattering intensity in the immediate
vicinity of the activating surface. Since this phase includes
the events occurring virtually on the activating surface, the
role of diffusion is almost negligible. The characteristics of
this phase are, therefore, equivalent to the parameters
determined using the conventional homogeneous system,
in which the activator is evenly distributed throughout the
bulk of plasma. Specifically, an analogy can be drawn
between the IT and the ‘‘initiation phase,’’ and between
the kinetics of an increase in the light scattering and the
‘‘propagation phase,’’ introduced by Mann et al. [5,32,33] to
describe clotting in homogeneous systems.
(2) The elongation phase is characterized by the evolu-
tion of the density of a growing clot (this process can be
visualized by observing changes in the light scattering
intensity [22,29]) and by the rate of clot growth. These
parameters are unique and do not have analogues in tradi-
tional experimental systems.
4.1. The initiation phase
As previously, we find that the IT for normal plasma
activated via the extrinsic pathway is very short ( < 1 min)
and independent of the activity of clotting factors VIII and
IX. Indeed, several studies have shown that activation of
factor IX by TF does not contribute significantly to the
initiation of clotting via the extrinsic pathway [16,17,
20,34,35]. However, contact activation is slower and
depends on the activator strength even in normal plasma;
the more so for hemophilic plasma deficient in either factor
VIII or IX (Table 1). The data are consistent with the well-
established roles for these factors in conveying the activa-
tion signal from factor XIIa. After a lag-period, clotting in
the immediate vicinity of the activator can be detected as an
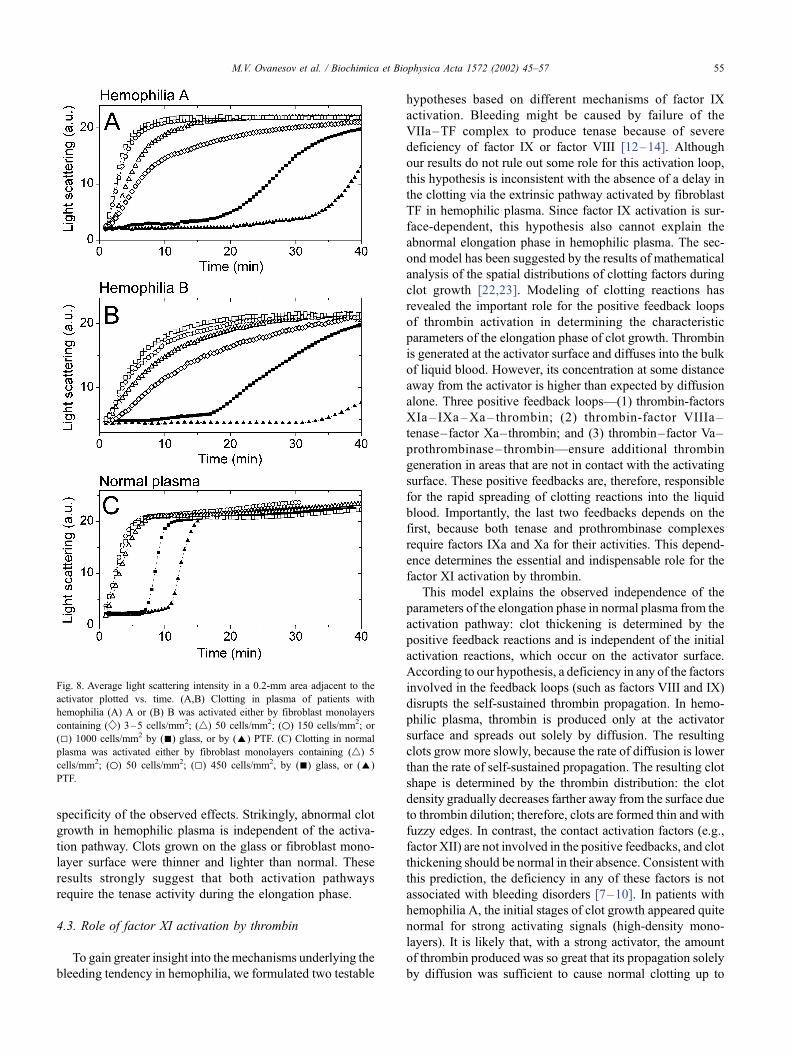
increase in the light scattering intensity. The average light
scattering intensity in a 0.2-mm area adjacent to the activa-
tor can be plotted versus time to reveal the kinetics of an
increase in the clot density in the immediate vicinity of the
activator (Fig. 8). In normal plasma, the density of fibrin
polymer in this area increases rapidly and levels off in about
5 min after beginning of clotting, whatever the activation
pathway. The light-intensity profiles in hemophilic plasma
have gentler slopes (implying lower growth rates) and are
more dependent on the nature of the activator and its
strength (fibroblast density; Fig. 8). These results agree well
with a considerable reduction in the fibrinopeptide produc-
tion in plasma of hemophilia A patients [20].
4.2. The elongation phase
The IT for normal plasma activated via the extrinsic
(versus intrinsic) pathway is >10 times shorter. Strikingly,
despite this significant difference in timing, the parameters
of the elongation phase are remarkably similar for both
pathways. Indeed, the light scattering profiles appear iden-
tical for activation by glass or PTF (Fig. 4C,D) and by a
fibroblast monolayer (Fig. 6C). In normal plasma, a steep
front of the clot area of high density progressively advances
into the bulk. It appears that the density of fibrin polymer
within the clot area is constant. The rate of clot edge
movement is 0.039–0.043 mm/min, irrespective of the
activation pathway (the difference in the rates is within
the experimental error (0.005 mm/min). Moreover, the
characteristics of clot growth, including its rate, are almost
independent of the amplitude of the activating signal: a 200-
fold increase in the fibroblast density does not alter signifi-
cantly either the light scattering profiles (Fig. 6C(a,b)), or
the clot growth rate (Fig. 5C). Together, these data suggest
that the kinetics of the initiation phase of clotting is a highly
variable parameter, but the characteristics of the elongation
phase are fixed. Once initiated, clot growth proceeds by the
same scenario, whatever the strength and the nature of the
activating signal [22].
The elongation phase of clot growth in hemophilia A and
B was significantly abnormal, and the clot grew by a
significantly different scenario. The deficiency in either
factor VIII or IX is associated with the gradually sloping
profiles of light scattering, with the maximum density of
fibrin polymer being at the activator surface. The clot grows
by broadening the polymerized area, but the maximum
density remains at the site of activation and the clot edge
appears fuzzy at any time. Addition of 10% normal plasma
corrects these defects almost completely, indicating the
M.V. Ovanesov et al. / Biochimica et Biophysica Acta 1572 (2002) 45–5754
specificity of the observed effects. Strikingly, abnormal clot
growth in hemophilic plasma is independent of the activa-
tion pathway. Clots grown on the glass or fibroblast mono-
layer surface were thinner and lighter than normal. These
results strongly suggest that both activation pathways
require the tenase activity during the elongation phase.
4.3. Role of factor XI activation by thrombin
To gain greater insight into the mechanisms underlying the
bleeding tendency in hemophilia, we formulated two testable
hypotheses based on different mechanisms of factor IX
activation. Bleeding might be caused by failure of the
VIIa–TF complex to produce tenase because of severe
deficiency of factor IX or factor VIII [12–14]. Although
our results do not rule out some role for this activation loop,
this hypothesis is inconsistent with the absence of a delay in
the clotting via the extrinsic pathway activated by fibroblast
TF in hemophilic plasma. Since factor IX activation is sur-
face-dependent, this hypothesis also cannot explain the
abnormal elongation phase in hemophilic plasma. The sec-
ond model has been suggested by the results of mathematical
analysis of the spatial distributions of clotting factors during
clot growth [22,23]. Modeling of clotting reactions has
revealed the important role for the positive feedback loops
of thrombin activation in determining the characteristic
parameters of the elongation phase of clot growth. Thrombin
is generated at the activator surface and diffuses into the bulk
of liquid blood. However, its concentration at some distance
away from the activator is higher than expected by diffusion
alone. Three positive feedback loops—(1) thrombin-factors
XIa – IXa–Xa– thrombin; (2) thrombin-factor VIIIa –
tenase–factor Xa–thrombin; and (3) thrombin–factor Va–
prothrombinase– thrombin—ensure additional thrombin
generation in areas that are not in contact with the activating
surface. These positive feedbacks are, therefore, responsible
for the rapid spreading of clotting reactions into the liquid
blood. Importantly, the last two feedbacks depends on the
first, because both tenase and prothrombinase complexes
require factors IXa and Xa for their activities. This depend-
ence determines the essential and indispensable role for the
factor XI activation by thrombin.
This model explains the observed independence of the
parameters of the elongation phase in normal plasma from the
activation pathway: clot thickening is determined by the
positive feedback reactions and is independent of the initial
activation reactions, which occur on the activator surface.
According to our hypothesis, a deficiency in any of the factors
involved in the feedback loops (such as factors VIII and IX)
disrupts the self-sustained thrombin propagation. In hemo-
philic plasma, thrombin is produced only at the activator
surface and spreads out solely by diffusion. The resulting
clots grow more slowly, because the rate of diffusion is lower
than the rate of self-sustained propagation. The resulting clot
shape is determined by the thrombin distribution: the clot
density gradually decreases farther away from the surface due
to thrombin dilution; therefore, clots are formed thin and with
fuzzy edges. In contrast, the contact activation factors (e.g.,
factor XII) are not involved in the positive feedbacks, and clot
thickening should be normal in their absence. Consistent with
this prediction, the deficiency in any of these factors is not
associated with bleeding disorders [7–10]. In patients with
hemophilia A, the initial stages of clot growth appeared quite
normal for strong activating signals (high-density mono-
layers). It is likely that, with a strong activator, the amount
of thrombin produced was so great that its propagation solely
by diffusion was sufficient to cause normal clotting up to
Fig. 8. Average light scattering intensity in a 0.2-mm area adjacent to the
activator plotted vs. time. (A,B) Clotting in plasma of patients with
hemophilia (A) A or (B) B was activated either by fibroblast monolayers
containing ( w ) 3–5 cells/mm2; (4) 50 cells/mm2; (o) 150 cells/mm2; or
(5) 1000 cells/mm2 by (n) glass, or by (E) PTF. (C) Clotting in normal
plasma was activated either by fibroblast monolayers containing (4) 5
cells/mm2; (o) 50 cells/mm2; (5) 450 cells/mm2, by (n) glass, or (E)
PTF.
M.V. Ovanesov et al. / Biochimica et Biophysica Acta 1572 (2002) 45–57 55
f 0.8 mm away from the surface (Fig. 6A(c,d)). However, at
longer distances, thrombin dilution became more significant,
so that the respective light scattering profiles became less
steep, and the clot edge fuzzier.
In summary, the hypothesis of self-sustained thrombin
production describes well the presented data on the param-
eters of clot growth in normal and hemophilic plasma.
However, full description of clot growth will certainly be
more detailed and complex. For example, the mechanisms
responsible for the termination of clot growth remain largely
undetermined. Further investigation into the spatial dynamics
of the clotting reactions will be required to solve these
problems.
Acknowledgements
We are grateful to Professor R.I. Ataullakhanov and his
laboratory for help with growing the fibroblast cell cultures,
to Dr. E.I. Sinauridze and Dr. A.V. Pokhilko for useful
discussions, and to Dr. R.I. Volkova and Dr. E.L. Grishchuk
for translating the manuscript.
This work was supported in part by the Russian
Foundation for Basic Research, project No. 00-04-48 855.
References
[1] H.R. Roberts, M.R. Jones, Hemophilia and related conditions—con-
genital deficiencies of prothrombin (factor II), factor V, factors VII to
XII, in: W.J. Williams, E. Beutler, A.J. Erslev, M. Lichtman (Eds.),
Hematology, 4th edn., McGraw-Hill, New York, USA, 1991, pp.
1453–1474.
[2] P.H. Bolton-Maggs, Factor XI deficiency and its management, Hae-
mophilia 6 (2000) 100–109.
[3] Y. Nemerson, Tissue factor and hemostasis, Blood 71 (1988) 1–8.
[4] S.I. Rapaport, L.V.M. Rao, The tissue factor pathway: how it has
become a ‘prima ballerina’, Thromb. Haemost. 74 (1995) 7–17.
[5] K.G. Mann, Biochemistry and physiology of blood coagulation,
Thromb. Haemost. 82 (1999) 165–174.
[6] K.G. Mann, M.E. Nesheim, W.R. Church, P. Haley, S. Krishnaswamy,
Surface-dependent reactions of the vitamin K-dependent enzyme com-
plexes, Blood 76 (1990) 1–16.
[7] R.W. Colman, A.H. Schmaier, Contact system: a vascular biology
modulator with anticoagulant, profibrinolytic, antiadhesive, and proin-
flammatory attributes, Blood 90 (1997) 3819–3843.
[8] J.C. Hoak, L.W. Swanson, E.D. Warner, W.E. Connor, Myocardial
infarction associated with severe factor-XII deficiency, Lancet 2
(1966) 884–886.
[9] R.W. Colman, A. Bagdasarian, R.C. Talamo, C.F. Scott, M. Seavey,
J.A. Guimaraes, J.V. Pierce, A.P. Kaplan, Williams trait. Human kini-
nogen deficiency with diminished levels of plasminogen proactivator
and prekallikrein associated with abnormalities of the Hageman fac-
tor-dependent pathways, J. Clin. Invest. 56 (1975) 1650–1662.
[10] W.E. Hathaway, L.P. Belhasen, H.S. Hathaway, Evidence for a new
plasma thromboplastin factor: I. Case report, coagulation studies and
physicochemical properties, Blood 26 (1965) 521–532.
[11] S.S. Stoylova, P.J. Lenting, G. Kemball-Cook, A. Holzenburg, Elec-
tron crystallography of human blood coagulation factor VIII bound to
phospholipid monolayers, J. Biol. Chem. 274 (1999) 36573–36578.
[12] F. Josso, O. Prou-Wartelle, Interaction of tissue factor and factor VII at
the earliest phase of coagulation, Thromb. Diath. Haemorrh. 17 (1965)
35–44.
[13] B. Osterud, S.I. Rapaport, Activation of factor IX by the reaction
product of tissue factor and factor VII: additional pathway for initiat-
ing blood coagulation, Proc. Natl. Acad. Sci. U. S. A. 74 (1977)
5260–5264.
[14] M. Xi, S. Beguin, H.C. Hemker, Importance of factor-IX-dependent
prothrombinase formation—the Josso pathway—in clotting plasma,
Haemostasis 19 (1989) 301–308.
[15] L.V.M. Rao, T. Robinson, A.D. Hoang, Factor VIIa/tissue factor-cata-
lyzed activation of factors IX and X on a cell surface and in suspen-
sion: a kinetic study, Thromb. Haemost. 67 (1992) 654–659.
[16] D. Kirchhofer, T.B. Tschopp, H.R. Baumgartner, Active site-blocked
factors VIIa and IXa differentially inhibit fibrin formation in a human
ex vivo thrombosis model, Arterioscler. Thromb. Vasc. Biol. 15
(1995) 1098–1106.
[17] A.L. Kuharsky, A.L. Fogelson, Surface-mediated control of blood
coagulation: the role of binding site densities and platelet deposition,
Biophys. J. 80 (2001) 1050–1074.
[18] D. Gailani , G.J. Broze Jr., Factor XI activation in a revised model of
blood coagulation, Science 253 (1991) 909–912.
[19] F.A. Baglia, P.N. Walsh, Thrombin-mediated feedback activation of
factor XI on the activated platelet surface is preferred over contact
activation by factor XIIa or factor XIa, J. Biol. Chem. 275 (2000)
20514–20519.
[20] K.M. Cawthern, C. van ’t Veer, J.B. Lock, M.E. DiLorenzo, R.F.
Branda, K.G. Mann, Blood coagulation in hemophilia A and hemo-
philia C, Blood 91 (1998) 4581–4592.
[21] I.M. Keularts, A. Zivelin, U. Seligsohn, H.C. Hemker, S. Beguin, The
role of factor XI in thrombin generation induced by low concentra-
tions of tissue factor, Thromb. Haemost. 85 (2001) 1060–1065.
[22] F.I. Ataullakhanov, G.T. Guria, V.I. Sarbash, R.I. Volkova, Spatiotem-
poral dynamics of clotting and pattern formation in human blood,
Biochim. Biophys. Acta 1425 (1998) 453–468.
[23] V.I. Zarnitsina, A.V. Pokhilko, F.I. Ataullakhanov, A mathematical
model for the spatiotemporal dynamics of the intrinsic pathway of
blood coagulation: II. Results, Thromb. Res. 84 (1996) 333–344.
[24] M. Morfini, M. Lee, A. Messori, The design and analysis of half-life
and recovery studies for factor VIII and factor IX, Factor VIII/Factor
IX Scientific and Standardization Committee of the International So-
ciety for Thrombosis and Haemostasis, Thromb. Haemost. 66 (1991)
384–386.
[25] E.I. Sinauridze, R.I. Volkova, Y.V. Krasotkina, V.I. Sarbash, F.I.
Ataullakhanov, Dynamics of clot growth induced by thrombin diffus-
ing into nonstirred citrated human plasma, Biochim. Biophys. Acta
1425 (1998) 607–616.
[26] J.A. Oliver, D.M. Monroe, H.R. Roberts, M. Hoffman, Thrombin
activates factor XI on activated platelets in the absence of factor
XII, Arterioscler. Thromb. Vasc. Biol. 19 (1999) 170–177.
[27] W. Heil, R. Grunewald, M. Amend, M. Heins, Influence of time and
temperature on coagulation analytes in stored plasma, Clin. Chem.
Lab. Med. 36 (1998) 459–462.
[28] C. Hughes, K.B. Thomas, P. Schiff, R.W. Herrington, E.E. Polacsek,
K.M. McGrath, Effect of delayed blood processing on the yield of
factor VIII in cryoprecipitate and factor VIII concentrate, Transfusion
28 (1988) 566–570.
[29] Y.V. Krasotkina, E.I. Sinauridze, F.I. Ataullakhanov, Spatiotemporal
dynamics of fibrin formation and spreading of active thrombin enter-
ing nonrecalcified plasma by diffusion, Biochim. Biophys. Acta 1474
(2000) 337–345.
[30] G.G. Olsom, J.N. Walker, Advantages of computer cameras over
video cameras/frame grabbers for high speed vision applications,
SPIE Proc.: Mach. Vis. Appl. 205 (1997) 2–8.
[31] A. Iakhiaev, U.R. Pendurthi, J. Voigt, M. Ezban, L.V.M. Rao, Catab-
olism of factor VIIa bound to tissue factor in fibroblasts in the pres-
ence and absence of tissue factor pathway inhibitor, J. Biol. Chem.
274 (1999) 36703–36995.
M.V. Ovanesov et al. / Biochimica et Biophysica Acta 1572 (2002) 45–5756

[32] J.H. Lawson, M. Kalafatis, S. Stram, K.G. Mann, A model for the
tissue factor pathway to thrombin: I. An empirical study, J. Biol.
Chem. 269 (1994) 23357–23366.
[33] M.D. Rand, J.B. Lock, C. van’t Veer, D.P. Gaffney, K.G. Mann,
Blood clotting in minimally altered whole blood, Blood 88 (1996)
3432–3445.
[34] S. Butenas, C. van ’t Veer, K.G. Mann, Evaluation of the initiation
phase of blood coagulation using ultrasensitive assays for serine pro-
teases, J. Biol. Chem. 272 (1997) 21527–21533.
[35] K.A. Bauer, P.M. Mannucci, A. Gringeri, F. Tradati, S. Barzegar, B.L.
Kass, H. ten Cate, A.S. Kestin, D.P. Brettler, R.D. Rosenberg, Factor
IXa– factor VIIIa– cell surface complex does not contribute to the
basal activation of the coagulation mechanism in vivo, Blood 79
(1992) 2039–2047.
M.V. Ovanesov et al. / Biochimica et Biophysica Acta 1572 (2002) 45–57 57