Embed Size (px)
Citation preview
3 — MODIFIER
HAMON 2016 ANNUAL REPORT
HA
MO
N A
NN
UA
L REP
OR
T 2016
Integrated Solutions for a Clean Environment
our group �e Hamon Group is a global player in the field of engineering and contracting (engineering, construction and project management). Its activities include the design and manufacture of key components, the installation and maintenance of cooling systems, process heat exchangers, air pollution control systems, heat recovery systems (HRSG) and chimneys, intended for the power generation, oil and gas sectors as well as certain other heavy industries such as steel, glassmaking and chemicals.
contentsGENERAL PRESENTATION OF THE GROUP
2 — Key figures
4 — Message from the General Manager and the Chairman
6 — Group profile
10 — Key events 2016
REVIEW PER BUSINESS UNIT
18 — Cooling Systems
24 — Process Heat Exchangers
30 — Air Quality Systems
36 — NAFTA
SUSTAINABLE DEVELOPMENT
42 — Social responsibility
CORPORATE GOVERNANCE
56 — Statement of corporate governance
65 — Internal auditing and risk management systems
68 — Relations with our shareholders and other stakeholders
FINANCIAL STATEMENTS
72 — Table of contents
73 — Consolidated financial data
78 — Notes to the consolidated financial statements
127 — Hamon & Cie (International) SA social accounts
129 — Auditor’s report on the consolidated financial statements
ANNEXES
133 — Parameters of the Corporate Social Responsibility report
138 — GRI and UN Global Compact correspondence grids
141 — Glossary
143 — General information
2 — HAMON ANNUAL REPORT 2016
key �gures
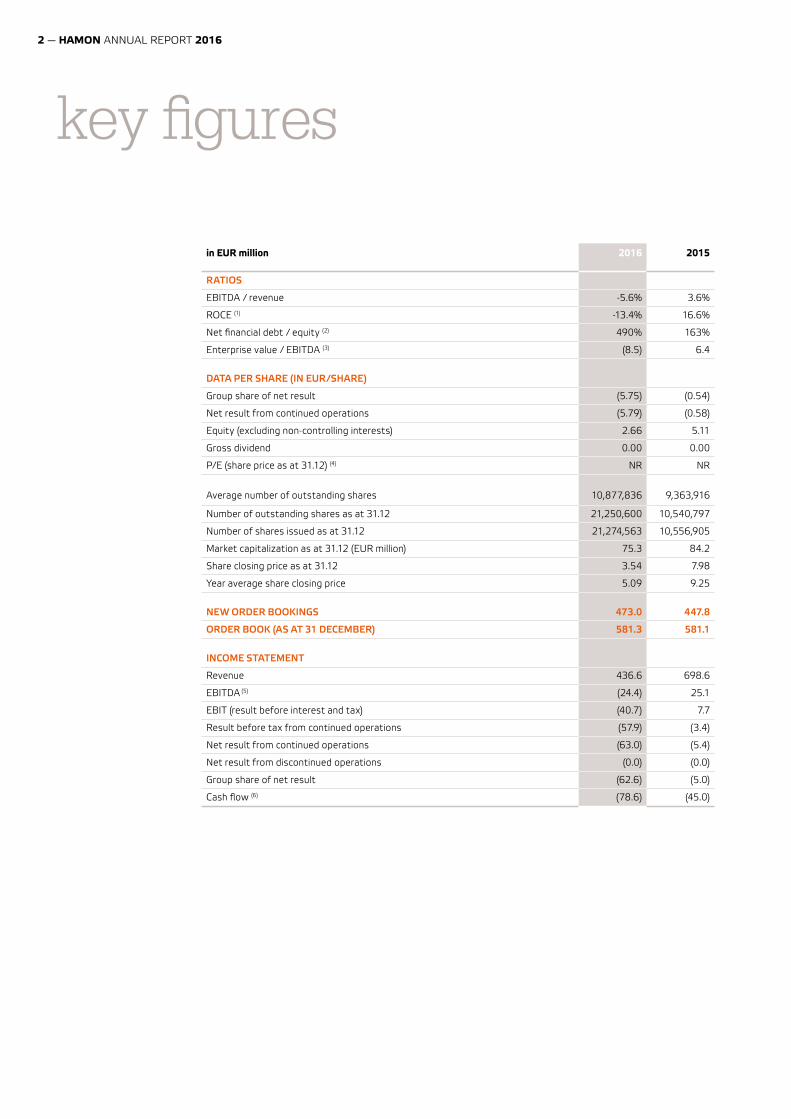
in EUR million 2016 2015
RATIOS
EBITDA / revenue -5.6% 3.6%
ROCE (1) -13.4% 16.6%
Net financial debt / equity (2) 490% 163%
Enterprise value / EBITDA (3) (8.5) 6.4
DATA PER SHARE (IN EUR/SHARE)
Group share of net result (5.75) (0.54)
Net result from continued operations (5.79) (0.58)
Equity (excluding non-controlling interests) 2.66 5.11
Gross dividend 0.00 0.00
P/E (share price as at 31.12) (4) NR NR
Average number of outstanding shares 10,877,836 9,363,916
Number of outstanding shares as at 31.12 21,250,600 10,540,797
Number of shares issued as at 31.12 21,274,563 10,556,905
Market capitalization as at 31.12 (EUR million) 75.3 84.2
Share closing price as at 31.12 3.54 7.98
Year average share closing price 5.09 9.25
NEW ORDER BOOKINGS 473.0 447.8
ORDER BOOK (AS AT 31 DECEMBER) 581.3 581.1
INCOME STATEMENT
Revenue 436.6 698.6
EBITDA (5) (24.4) 25.1
EBIT (result before interest and tax) (40.7) 7.7
Result before tax from continued operations (57.9) (3.4)
Net result from continued operations (63.0) (5.4)
Net result from discontinued operations (0.0) (0.0)
Group share of net result (62.6) (5.0)
Cash flow (6) (78.6) (45.0)
3 — KEY FIGURES
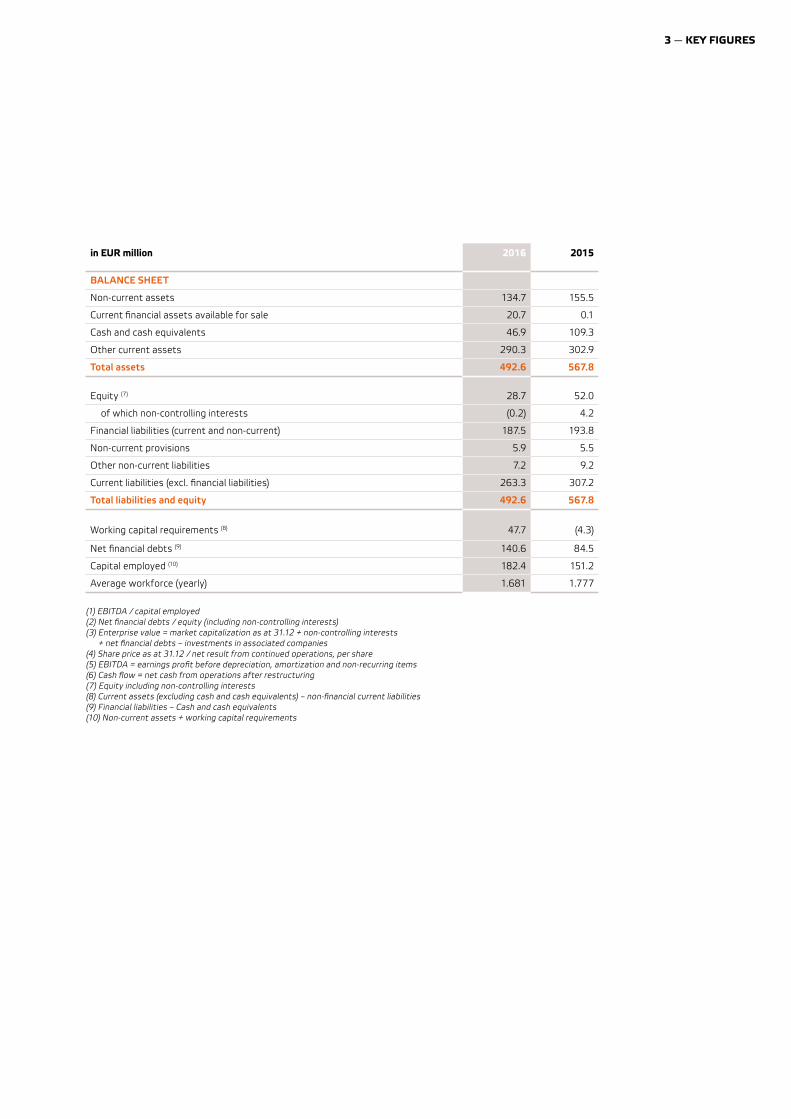
in EUR million 2016 2015
BALANCE SHEET
Non-current assets 134.7 155.5
Current financial assets available for sale 20.7 0.1
Cash and cash equivalents 46.9 109.3
Other current assets 290.3 302.9
Total assets 492.6 567.8
Equity (7) 28.7 52.0
of which non-controlling interests (0.2) 4.2
Financial liabilities (current and non-current) 187.5 193.8
Non-current provisions 5.9 5.5
Other non-current liabilities 7.2 9.2
Current liabilities (excl. financial liabilities) 263.3 307.2
Total liabilities and equity 492.6 567.8
Working capital requirements (8) 47.7 (4.3)
Net financial debts (9) 140.6 84.5
Capital employed (10) 182.4 151.2
Average workforce (yearly) 1.681 1.777
(1) EBITDA / capital employed(2) Net financial debts / equity (including non-controlling interests)(3) Enterprise value = market capitalization as at 31.12 + non-controlling interests
+ net financial debts – investments in associated companies(4) Share price as at 31.12 / net result from continued operations, per share (5) EBITDA = earnings profit before depreciation, amortization and non-recurring items(6) Cash flow = net cash from operations after restructuring(7) Equity including non-controlling interests(8) Current assets (excluding cash and cash equivalents) – non-financial current liabilities(9) Financial liabilities – Cash and cash equivalents(10) Non-current assets + working capital requirements
key �gures
4 — HAMON ANNUAL REPORT 2016
Dear shareholders,
Dear readers,
As you will note when reading this annual report and as explained in the previous press releases, the year 2016 was a difficult time for the Hamon Group, even though orders booked increased by 5.6% compared with 2015 to EUR 473 million.
ªe results are not good, the international context is complicated and the environment is highly competitive. ªis did not prevent our shareholders from carrying out a major capital increase last December, thereby showing their confidence in the company by providing support in difficult times.
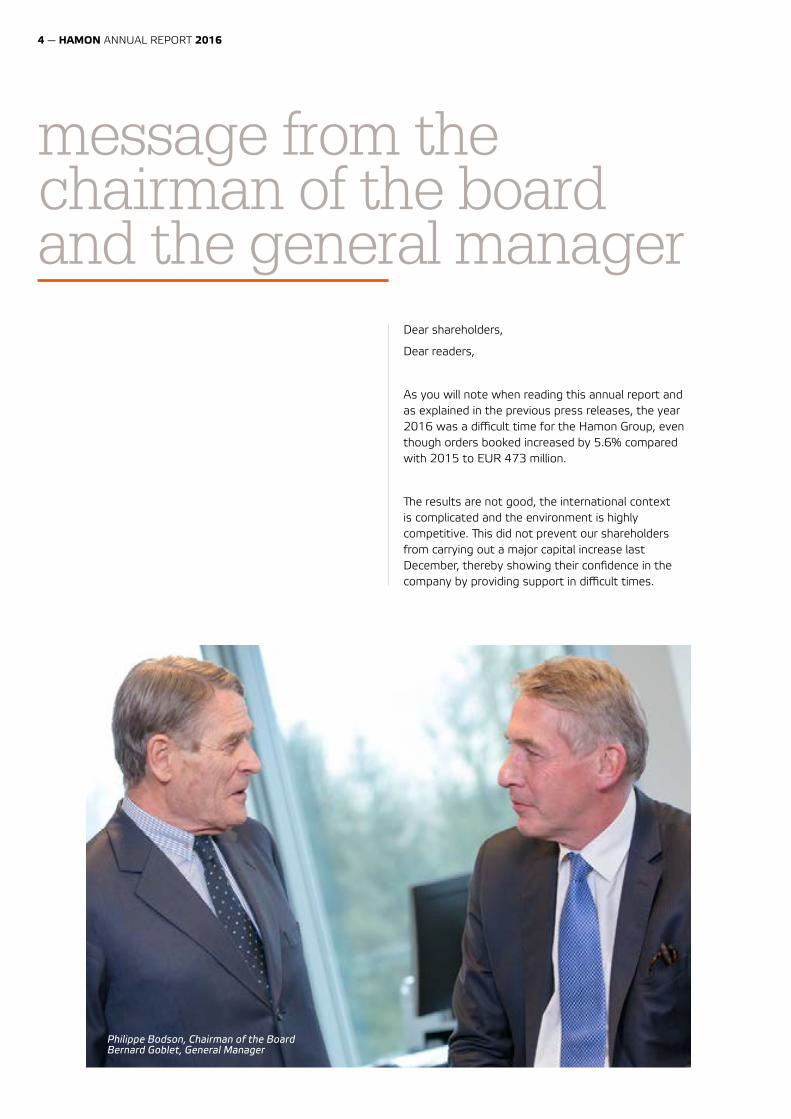
message from the chairman of the board and the general manager
Philippe Bodson, Chairman of the BoardBernard Goblet, General Manager
5 — MESSAGE
Moreover, in 2016, the Board decided to adopt a series of measures, most of which have already been implemented, such as the refinancing, the change in governance and the cost-cutting programme. Clearly, additional measures will be taken in 2017 to restore the profitability of the Group, such as more synergies between the Group’s operating entities, better cost control, production streamlining, continued development of the aftermarket, etc.
Working closely with the Board, the management will get down to the task of implementing all the measures that will prove necessary to restore the financial situation of the Group. Hamon has a great many assets, in particular its human scale, highly qualified, loyal staff with indisputable know-how in niche sectors that offer fine development opportunities for the Group and an excellent reputation on its markets.
2017 is expected to be a year of transition in this respect.
To achieve this, we are counting on the loyalty of our commercial and financial partners, whom we would like to thank, here and now, for the confidence they show in us. We would also like to thank the Hamon staff for their enthusiasm and their commitment to the Group.
Philippe Bodson, Chairman of the Board
Bernard Goblet, General Manager
6 — HAMON ANNUAL REPORT 2016
group pro�leHamon ranks among the leaders in its niche markets related to energy and environmental protection.
POSITIONING
Hamon, an international engineering, procurement and construction company (EPC), is one of the world’s leading players in the niche markets for which it supplies equipment and the related aftermarket:
Cooling systems; Air quality systems; Heat recovery systems (and steam generators); Process heat exchangers; Industrial chimneys.
ªe target end customers are mainly:
Electric power plants; Oil, gas and petrochemical industries; Other heavy industries, including steel, cement, glass and waste incineration.
Hamon also sells its products and services to end users, including through large ‘EPC (engineering, procurement, construction) contractors’ engineering firms.
Hamon offers its customers innovative systems using the best technology and responding exactly to their needs, at competitive prices thanks to strict cost control.
VISIONTo provide its customers with the best technologies and equipment to produce cleaner energy and maintain air quality, at competitive prices.
MISSION To develop new technologies and to design, install and provide aftermarket service for efficient installations for cooling systems, heat exchangers, air pollution control systems, heat recovery systems and chimneys.
To improve our customers’ performances in the energy, oil and gas sectors as well as other heavy industries, such as steel, glass and chemicals.
To carry out all our projects on schedule and within budget, in accordance with the customer’s specifications.
To provide a high-quality service in all our areas of activity, ensuring the satisfaction and development of our staff and protection of the environment, while
offering our shareholders adequate profitability.
VALUES1. PROFESSIONALISMHamon attaches great importance to the rigour and efficiency of its services and the products it supplies to its customers.
2. RESPECT FOR THE INDIVIDUALHamon respects the Universal Declaration of Human Rights and aims to foster a positive relationship with its teams.
3. RESPECT FOR THE ENVIRONMENTHamon holds the protection of the environment at the heart of its operations and its business activities.
4. RESPECT FOR CULTURAL DIVERSITYªroughout the world, Hamon promotes cultural diversity in its working relations with its partners, its teams and local communities.
HAMON’S MAIN ACTIVITIESªe Group’s main activities include sales, research and development, design, the manufacture of certain key components, project management, procurement, on-site installation (civil engineering), commissioning and aftermarket service.
Hamon focuses on high added-value activities, such as design, whether this is thermal design (for cooling systems and heat exchangers), ‘process’ design (in particular for chemical treatment systems for flue gas emissions) or mechanical design for all our equipment. ªe design levels differ depending on whether we are in the preliminary phase, preparing the final quote or undertaking detailed engineering to fulfil confirmed orders.
7 — GROUP PROFILE
group pro�le
Supply chain management is another integral part of our business activities. ªis begins with assembly dates and schedules for site deliveries to our customers’, then integrates logistics aspects, matters linked to production (and production planning) in the Group’s plants and purchasing from suppliers (again including all aspects linked to logistics) as well as quality control at our suppliers’, in our plants and on site. ªe Group also takes care of all the administrative processes (trade finance, customs clearance, tax, purchase order follow-up, etc.). ªe management of these different and often complex tasks is essential for the success of our projects, particularly when, as is increasingly often the case, they involve several countries or emerging countries. ªe Hamon supply chain comprises hundreds of suppliers from around the world: local suppliers (for example, local subcontracting or labour) and global component suppliers located thousands of kilometres away.
We are continuing to develop a global sourcing approach, with internal teams of internal buyers scattered around the world and a wide-ranging supplier network, in order to meet our supply needs with the right level of quality, innovation, productivity and reliability, while maintaining optimal stock management.
ªese measures are part and parcel of the Hamon Group’s continuous improvement philosophy, resulting in better profitability for the Group and greater customer satisfaction.
In 2016, purchases of materials and services amounted to a total of around EUR 304 million, or approximately 70% of the Group’s turnover.
We would also like to point out that we take care to ensure respect for the aspects and values of sustainable development and social responsibility of organizations throughout our supply chain (see the chapter on Social Responsibility).
Finally, Research & Development activities are also essential to ensure that we offer our customers ever more efficient cutting-edge systems. For further details on our R&D, see the end of the Corporate Social Responsibility chapter, section 5.4. Innovation/R&D efforts. We are unable to give a detailed description here of all the Group’s other activities, but each one is instrumental to the success of our projects and the satisfaction of our customers.
OUR VALUES:
PROFESSIONALISM
RESPECT FOR THE INDIVIDUAL
RESPECT FOR THE ENVIRONMENT
RESPECT FOR CULTURAL
DIVERSITY
8 — HAMON ANNUAL REPORT 2016
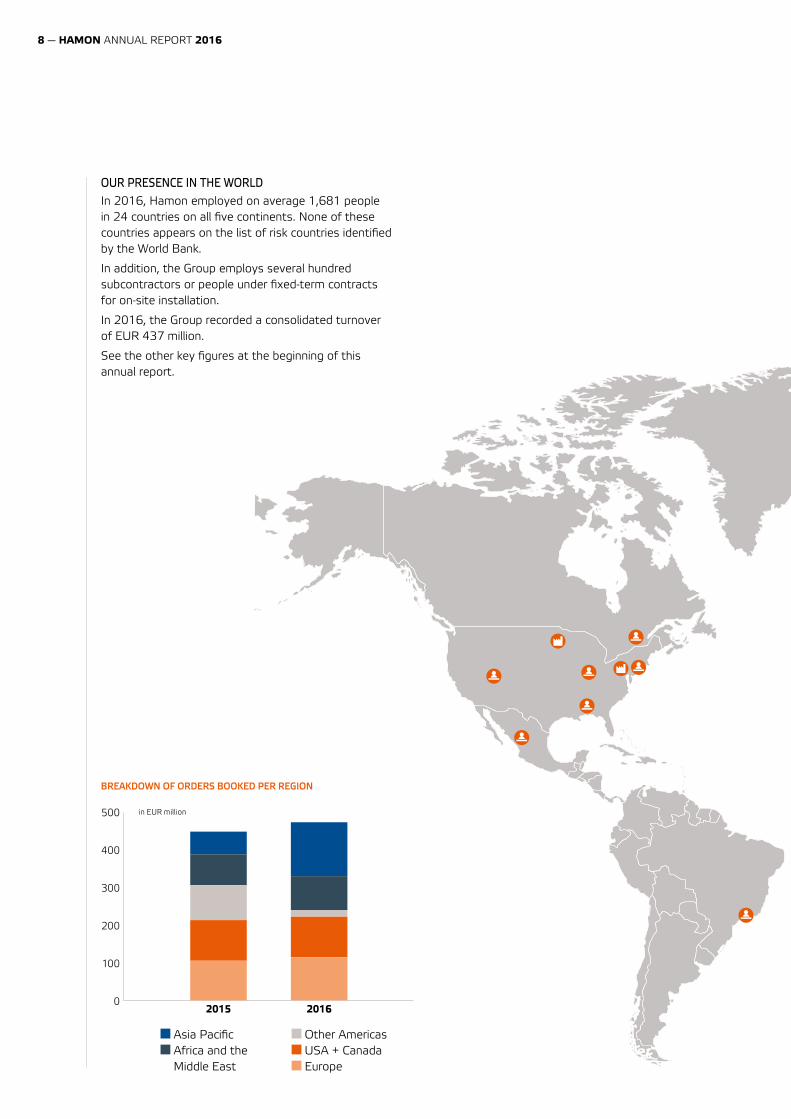
OUR PRESENCE IN THE WORLDIn 2016, Hamon employed on average 1,681 people in 24 countries on all five continents. None of these countries appears on the list of risk countries identified by the World Bank.
In addition, the Group employs several hundred subcontractors or people under fixed-term contracts for on-site installation.
In 2016, the Group recorded a consolidated turnover of EUR 437 million.
See the other key figures at the beginning of this annual report.
BREAKDOWN OF ORDERS BOOKED PER REGION
Asia Pacific Africa and the Middle East
Other Americas USA + Canada Europe
2015 2016
500
400
300
200
100
0
in EUR million
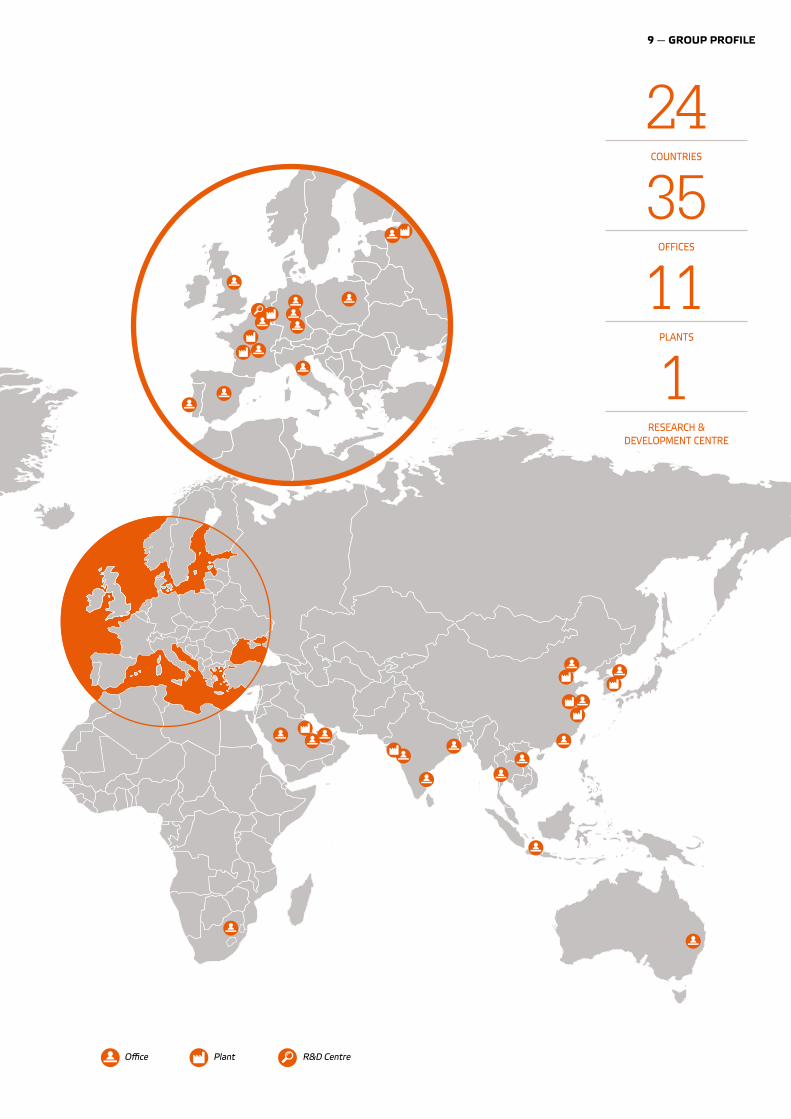
9 — GROUP PROFILE
35OFFICES
24COUNTRIES
11PLANTS
1RESEARCH &
DEVELOPMENT CENTRE
Office Plant R&D Centre
10 — HAMON ANNUAL REPORT 2016
key events 2016
1. IN BRIEF
COMMERCIAL ACTIVITY
ªe business units evolved along different lines compared with 2015: the Cooling Systems BU did not book the expected volume of new orders because of increased competition on the market, whereas the other BUs all increased their bookings compared with the previous year. In particular the Air Quality Systems BU and the Process Heat Exchanges BU increased their bookings by 83% and 32% respectively.ªe Group is successfully continuing its strategy to develop the aftermarket. Revenue declined due to the end of the ReACT™ contract in the NAFTA BU, the generally lower level of new order bookings and the postponement of or delays in the start-up of major projects in the Cooling Systems BU and the Air Quality Systems BU.
EBITDA
ªe EBITDA of the BUs was badly affected by the low volume of activity and results expected upon completion of certain projects (mostly older projects) which were lower than anticipated. To cope with this situation, the Group launched major cost-cutting programmes as of 2016. ªe full results
of these programmes will only become evident in the coming years. Finally, the Group decided to book additional write-offs on assets that seem unlikely to be recovered. Write-offs, mainly on trade receivables, amounting to a total of EUR 7.6 million were booked, on top of the EUR 10 million already written off as at 30 June 2016. Without these additional write-offs, EBITDA would amount to EUR - 6.8 million.
NET RESULT
ªe net result of the Group amounted to a loss of EUR 63 million. Excluding extraordinary items, amounting to EUR 38 million, the net result would be EUR – 25 million. ªe main extraordinary items relate to (i) write-offs on assets that seem unlikely to be recovered (trade receivables, deferred tax assets) for EUR 28.2 million, (ii) non-recurrent expenses linked mainly to restructuring for EUR 7.2 million, (iii) expenses linked to the 2016 year-end refinancing amounting to EUR 2.6 million. BALANCE SHEET
ªe balance sheet was reinforced thank to the capital increase of EUR 37.7 million subscribed by Sogepa and Sopal International SA in December 2016 and the syndicated loan refinancing agreements. Equity as at 31 December 2016 does not include the sum of EUR 5.1 million from the capital increase carried out in January 2017.ªe evolution in the net financial debt to EUR 140.6 million at the end of 2016 is the consequence of the capital increase, the result of the year and the development of the net working capital.
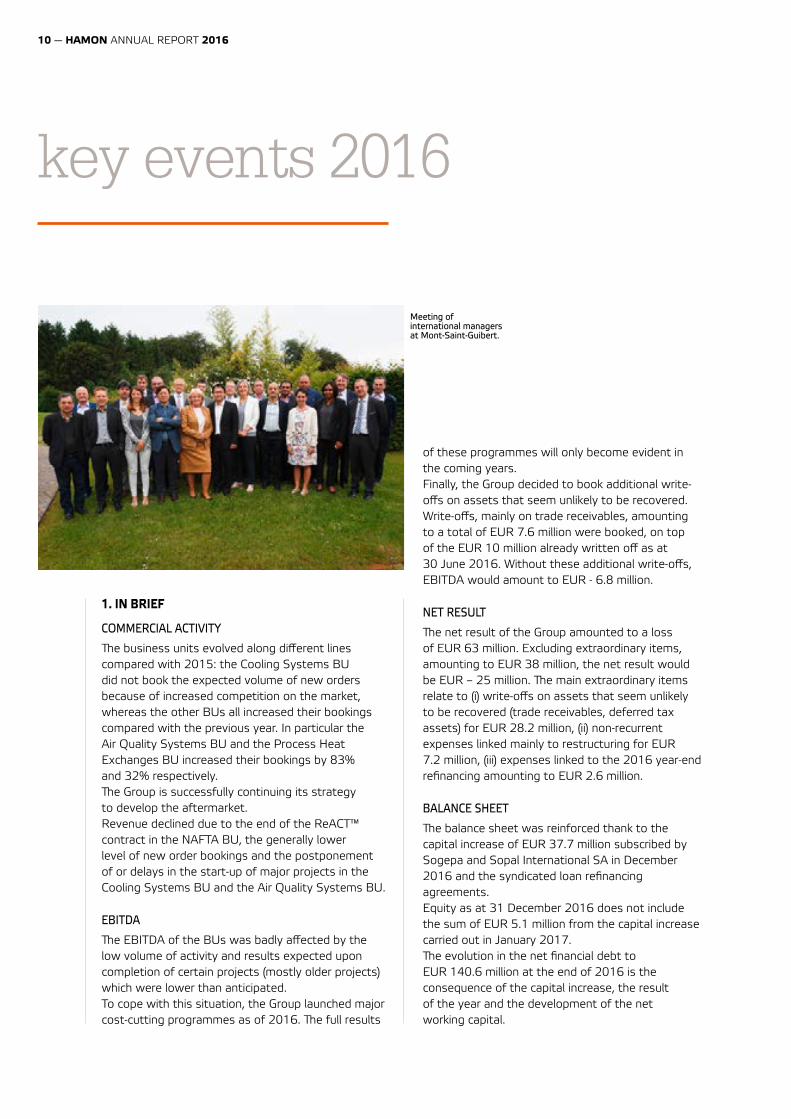
Meeting of international managers at Mont-Saint-Guibert.
11 — KEY EVENTS 2016
key events 2016
IMPROVEMENT ACTIONS
Faced with a difficult sectoral environment, in 2016 the Board of Directors decided on a series of corrective measures, most of which were implemented, such as capital increases, refinancing, the change in governance, and the cost-cutting programme. Moreover, discussions on the sale of the American subsidiary, ªermal Transfer Corporation (TTC) are progressing.Owing to the difficulties that marked the 2016 financial year, the management, with the agreement of the Board of Directors, is examining the implementation of additional measures to improve the Group’s performance.
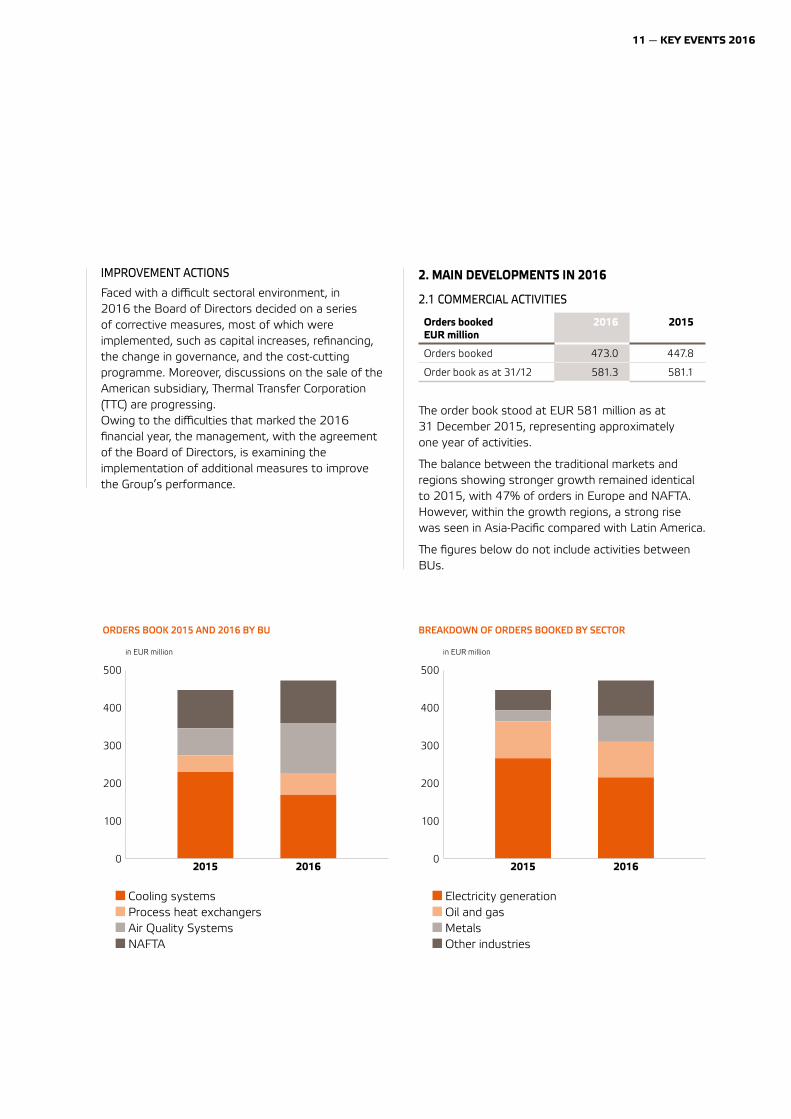
Cooling systems Process heat exchangers Air Quality Systems NAFTA
Electricity generation Oil and gas Metals Other industries
2015 2016
500
400
300
200
100
0
in EUR million
2. MAIN DEVELOPMENTS IN 2016
2.1 COMMERCIAL ACTIVITIES
Orders booked EUR million
2016 2015
Orders booked 473.0 447.8
Order book as at 31/12 581.3 581.1
ªe order book stood at EUR 581 million as at 31 December 2015, representing approximately one year of activities.
ªe balance between the traditional markets and regions showing stronger growth remained identical to 2015, with 47% of orders in Europe and NAFTA. However, within the growth regions, a strong rise was seen in Asia-Pacific compared with Latin America.
ªe figures below do not include activities between BUs.
ORDERS BOOK 2015 AND 2016 BY BU BREAKDOWN OF ORDERS BOOKED BY SECTOR
2015 2016
500
400
300
200
100
0
in EUR million
12 — HAMON ANNUAL REPORT 2016
2.2 CONSOLIDATED INCOME STATEMENT
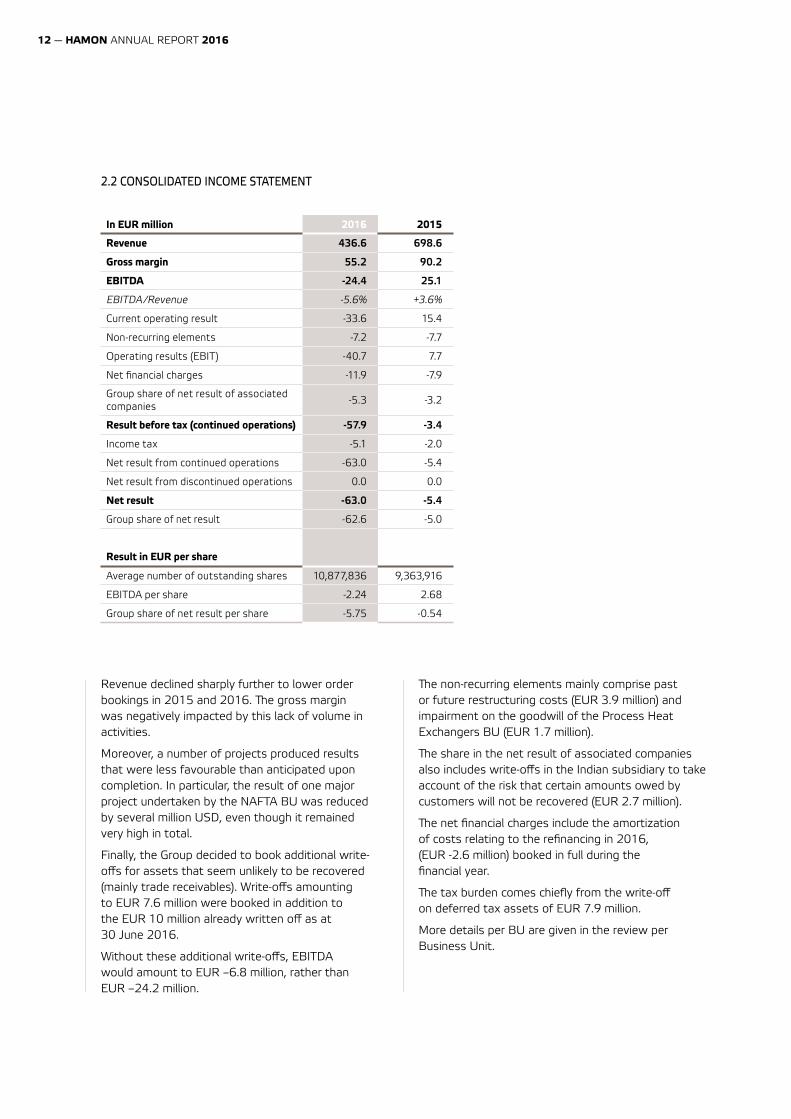
In EUR million 2016 2015
Revenue 436.6 698.6
Gross margin 55.2 90.2
EBITDA -24.4 25.1
EBITDA/Revenue -5.6% +3.6%
Current operating result -33.6 15.4
Non-recurring elements -7.2 -7.7
Operating results (EBIT) -40.7 7.7
Net financial charges -11.9 -7.9
Group share of net result of associated companies
-5.3 -3.2
Result before tax (continued operations) -57.9 -3.4
Income tax -5.1 -2.0
Net result from continued operations -63.0 -5.4
Net result from discontinued operations 0.0 0.0
Net result -63.0 -5.4
Group share of net result -62.6 -5.0
Result in EUR per share
Average number of outstanding shares 10,877,836 9,363,916
EBITDA per share -2.24 2.68
Group share of net result per share -5.75 -0.54
Revenue declined sharply further to lower order bookings in 2015 and 2016. ªe gross margin was negatively impacted by this lack of volume in activities.
Moreover, a number of projects produced results that were less favourable than anticipated upon completion. In particular, the result of one major project undertaken by the NAFTA BU was reduced by several million USD, even though it remained very high in total.
Finally, the Group decided to book additional write-offs for assets that seem unlikely to be recovered (mainly trade receivables). Write-offs amounting to EUR 7.6 million were booked in addition to the EUR 10 million already written off as at 30 June 2016.
Without these additional write-offs, EBITDA would amount to EUR –6.8 million, rather than EUR –24.2 million.
ªe non-recurring elements mainly comprise past or future restructuring costs (EUR 3.9 million) and impairment on the goodwill of the Process Heat Exchangers BU (EUR 1.7 million).
ªe share in the net result of associated companies also includes write-offs in the Indian subsidiary to take account of the risk that certain amounts owed by customers will not be recovered (EUR 2.7 million).
ªe net financial charges include the amortization of costs relating to the refinancing in 2016, (EUR -2.6 million) booked in full during the financial year.
ªe tax burden comes chiefly from the write-off on deferred tax assets of EUR 7.9 million.
More details per BU are given in the review per Business Unit.
13 — KEY EVENTS 2016
2.3 CONSOLIDATED BALANCE SHEET
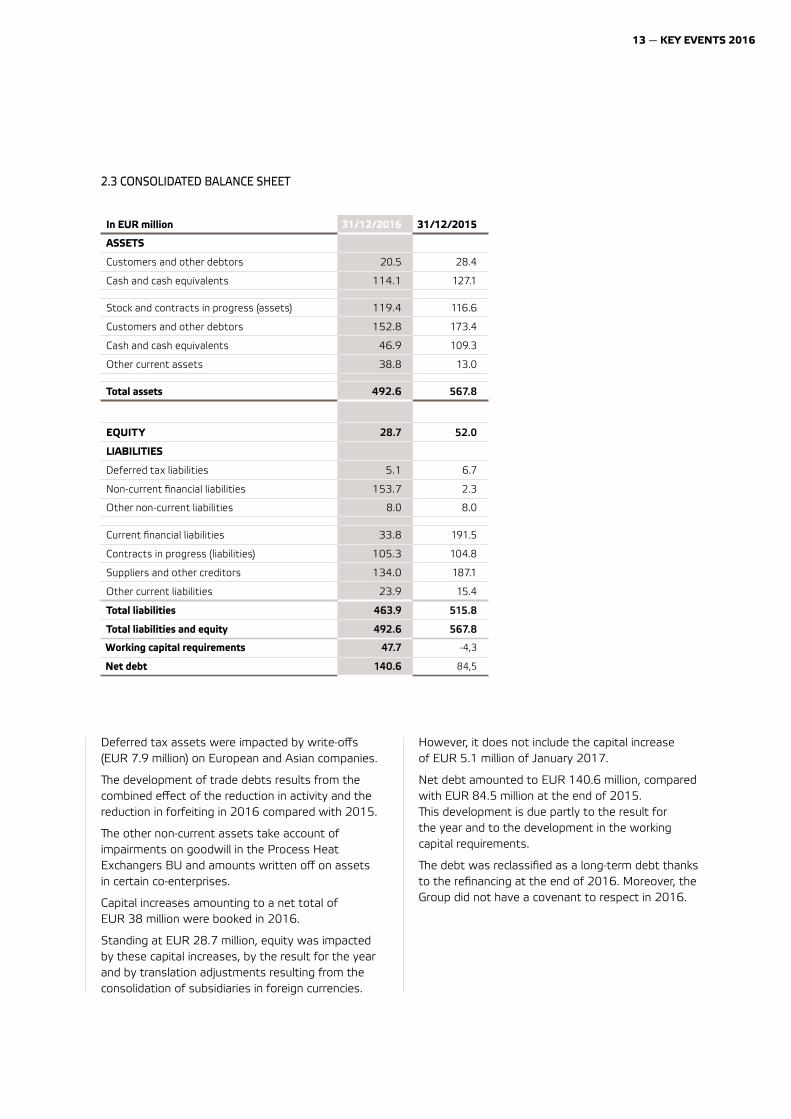
In EUR million 31/12/2016 31/12/2015
ASSETS
Customers and other debtors 20.5 28.4
Cash and cash equivalents 114.1 127.1
Stock and contracts in progress (assets) 119.4 116.6
Customers and other debtors 152.8 173.4
Cash and cash equivalents 46.9 109.3
Other current assets 38.8 13.0
Total assets 492.6 567.8
EQUITY 28.7 52.0
LIABILITIES
Deferred tax liabilities 5.1 6.7
Non-current financial liabilities 153.7 2.3
Other non-current liabilities 8.0 8.0
Current financial liabilities 33.8 191.5
Contracts in progress (liabilities) 105.3 104.8
Suppliers and other creditors 134.0 187.1
Other current liabilities 23.9 15.4
Total liabilities 463.9 515.8
Total liabilities and equity 492.6 567.8
Working capital requirements 47.7 -4,3
Net debt 140.6 84,5
Deferred tax assets were impacted by write-offs (EUR 7.9 million) on European and Asian companies.
ªe development of trade debts results from the combined effect of the reduction in activity and the reduction in forfeiting in 2016 compared with 2015.
ªe other non-current assets take account of impairments on goodwill in the Process Heat Exchangers BU and amounts written off on assets in certain co-enterprises.
Capital increases amounting to a net total of EUR 38 million were booked in 2016.
Standing at EUR 28.7 million, equity was impacted by these capital increases, by the result for the year and by translation adjustments resulting from the consolidation of subsidiaries in foreign currencies.
However, it does not include the capital increase of EUR 5.1 million of January 2017.
Net debt amounted to EUR 140.6 million, compared with EUR 84.5 million at the end of 2015. ªis development is due partly to the result for the year and to the development in the working capital requirements.
ªe debt was reclassified as a long-term debt thanks to the refinancing at the end of 2016. Moreover, the Group did not have a covenant to respect in 2016.
14 — HAMON ANNUAL REPORT 2016
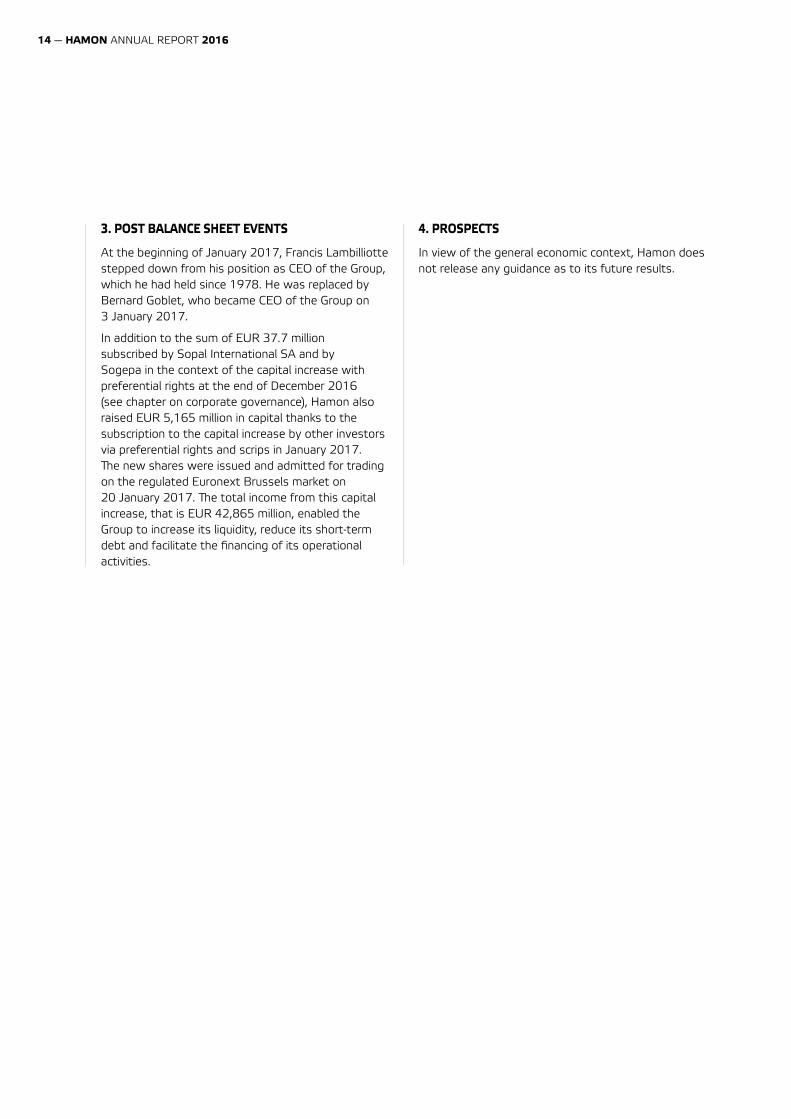
3. POST BALANCE SHEET EVENTS
At the beginning of January 2017, Francis Lambilliotte stepped down from his position as CEO of the Group, which he had held since 1978. He was replaced by Bernard Goblet, who became CEO of the Group on 3 January 2017.
In addition to the sum of EUR 37.7 million subscribed by Sopal International SA and by Sogepa in the context of the capital increase with preferential rights at the end of December 2016 (see chapter on corporate governance), Hamon also raised EUR 5,165 million in capital thanks to the subscription to the capital increase by other investors via preferential rights and scrips in January 2017. ªe new shares were issued and admitted for trading on the regulated Euronext Brussels market on 20 January 2017. ªe total income from this capital increase, that is EUR 42,865 million, enabled the Group to increase its liquidity, reduce its short-term debt and facilitate the financing of its operational activities.
4. PROSPECTS
In view of the general economic context, Hamon does not release any guidance as to its future results.
15 — KEY EVENTS 2016
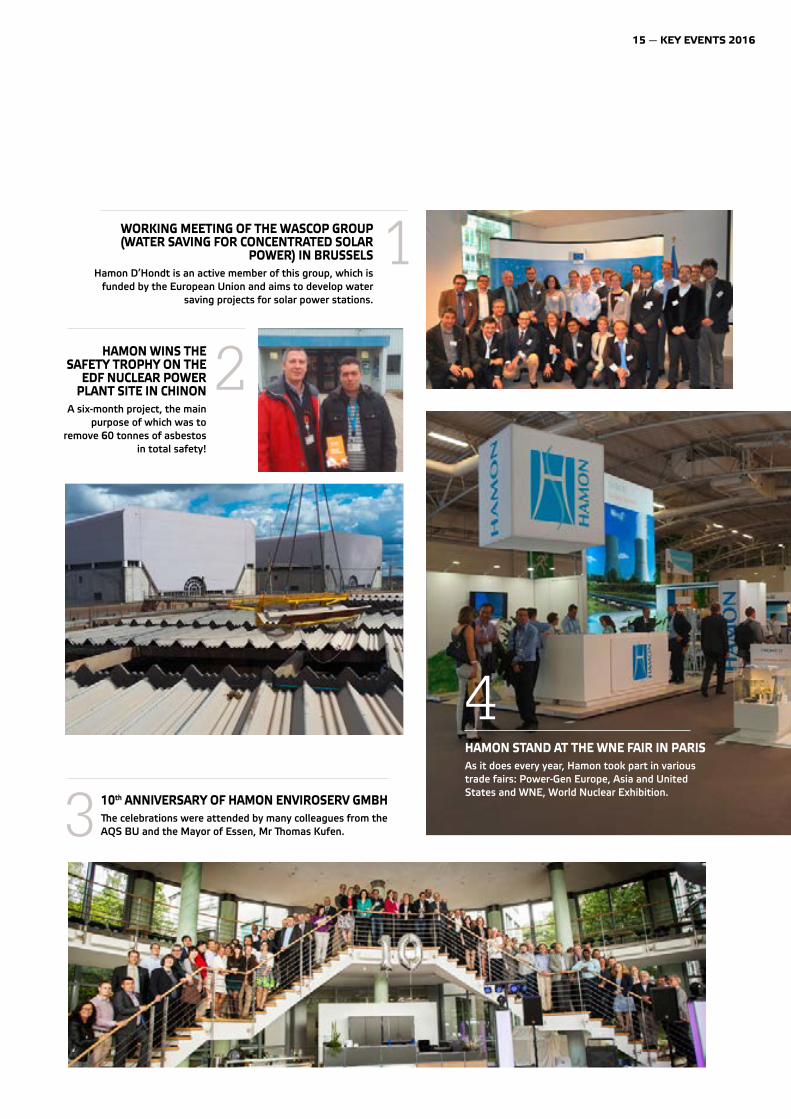
HAMON WINS THE SAFETY TROPHY ON THE
EDF NUCLEAR POWER PLANT SITE IN CHINON
A six-month project, the main purpose of which was to
remove 60 tonnes of asbestos in total safety!
10th ANNIVERSARY OF HAMON ENVIROSERV GMBH �e celebrations were attended by many colleagues from the AQS BU and the Mayor of Essen, Mr �omas Kufen.
WORKING MEETING OF THE WASCOP GROUP (WATER SAVING FOR CONCENTRATED SOLAR
POWER) IN BRUSSELS Hamon D’Hondt is an active member of this group, which is
funded by the European Union and aims to develop water saving projects for solar power stations.
1
2
3
4HAMON STAND AT THE WNE FAIR IN PARISAs it does every year, Hamon took part in various trade fairs: Power-Gen Europe, Asia and United States and WNE, World Nuclear Exhibition.
16 — HAMON ANNUAL REPORT 2016
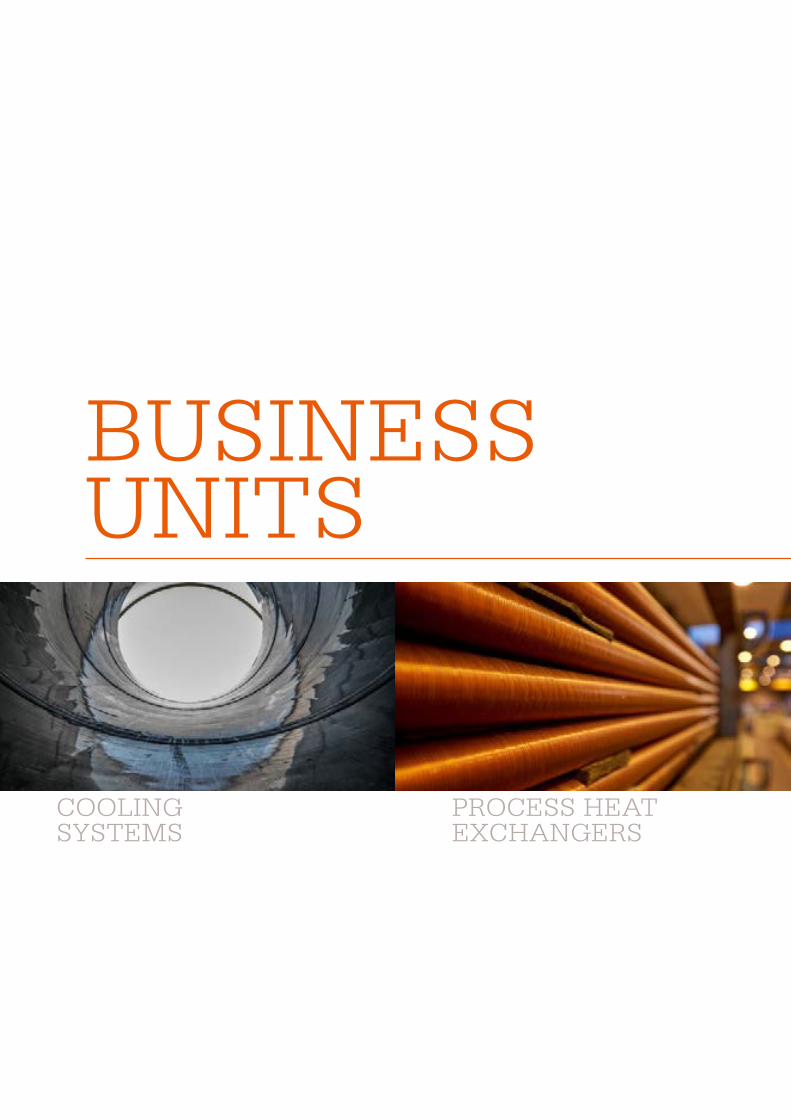
BUSINESS UNITS
COOLING SYSTEMS
PROCESS HEAT EXCHANGERS
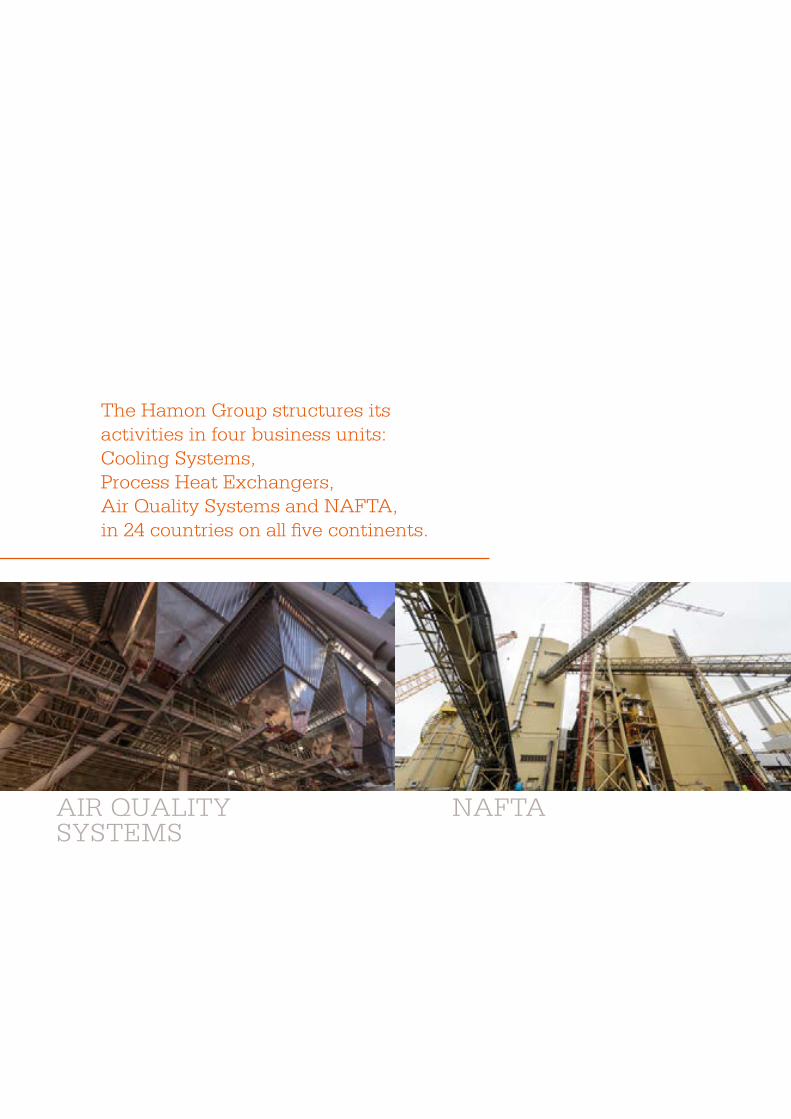
BUSINESS UNITS
The Hamon Group structures its activities in four business units: Cooling Systems, Process Heat Exchangers, Air Quality Systems and NAFTA, in 24 countries on all five continents.
AIR QUALITY SYSTEMS
NAFTA

COOLING SYSTEMS
The Cooling Systems Business Unit supplies electric power plants and industries, including the chemicals, petrochemicals, iron and steel, paper making and sugar re�ning industries, with equipment and related services designed to cool water or condense steam produced by their processes.
COOLING SYSTEMS
CUSTOMIZED TECHNICAL SOLUTIONS
Hamon offers two types of technical solutions adapted to the needs of electricity producers, engineering companies and industries: wet cooling towers and dry cooling systems.
ªe wet cooling towers work by evaporating part of the water flow using different means of generating air flow (natural draft with a chimney or induced draft when fans are used). ªey cool down all kinds of water (from fresh water to treated waste water and salt water) and even acid solutions. ªey can also be equipped with a plume abating system.
Dry cooling systems (air-cooled condensers and indirect systems) are used to condense and cool down steam without evaporation and without releasing a plume. ªey therefore offer a solution to cooling problems in areas where water is scarce, such as in parts of continental China, South Africa or the Middle East.
REDUCING PRIMARY ENERGY CONSUMPTION
By ensuring that these cooling systems are accurately designed, more electricity can be generated for a given consumption of primary energy. Colder cooling water increases the output of a steam turbine. For each drop in the temperature of the cold water of one degree Celsius, electricity generation increases by approximately one per cent. With same level of electricity generation, the consumption of primary energy (coal, gas, etc.) declines and CO2 emissions into the atmosphere are reduced. In the other industries, good cooling system
management also enables substantial savings. ªe use of a closed circuit system (with cooling tower) also avoids the heating of sea or river water caused by hot water discharged from the open circuit and thus prevents the destruction of their ecosystem.
AN INTERNATIONAL CENTRE OF EXCELLENCE
ªe unit’s centre of excellence is located in Mont- St-Guibert (Belgium). ªe BU has a test and R&D centre in Drogenbos (Belgium) as well as in China and offices in various countries: South Africa, Germany, England, Saudi Arabia, Australia, Bahrain, Brazil, China, South Korea, United Arab Emirates, United States, France, India, Indonesia, Italy, Mexico, Poland, Russia and ªailand, as well as a network of agents. Critical components are designed by Hamon and manufactured by the Group’s plants in France, India, China and the United States.
REVIEW OF THE YEAR 2016
ªe markets in China and the Middle East were fairly quiet in 2016, which contributed to the relatively low level of bookings. However, the BU booked some good orders for wet cooling in 2016, including one for a combined cycle power plant in the USA, one for the oil industry in Germany and one for the steel industry in China. ªere were also several contracts for both new units and for renovation and maintenance in Europe, the USA and Asia.
COOLING SYSTEMS
KEY FIGURES
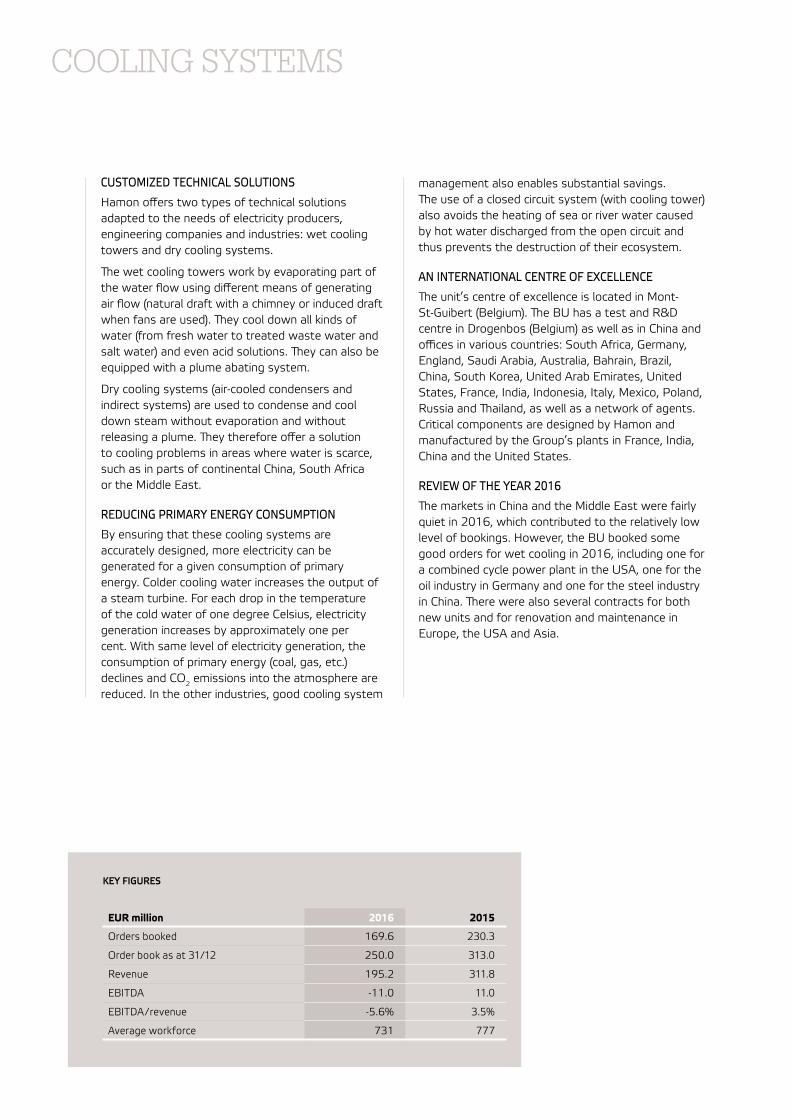
EUR million 2016 2015
Orders booked 169.6 230.3
Order book as at 31/12 250.0 313.0
Revenue 195.2 311.8
EBITDA -11.0 11.0
EBITDA/ revenue -5.6% 3.5%
Average workforce 731 777
21 — COOLING SYSTEMS
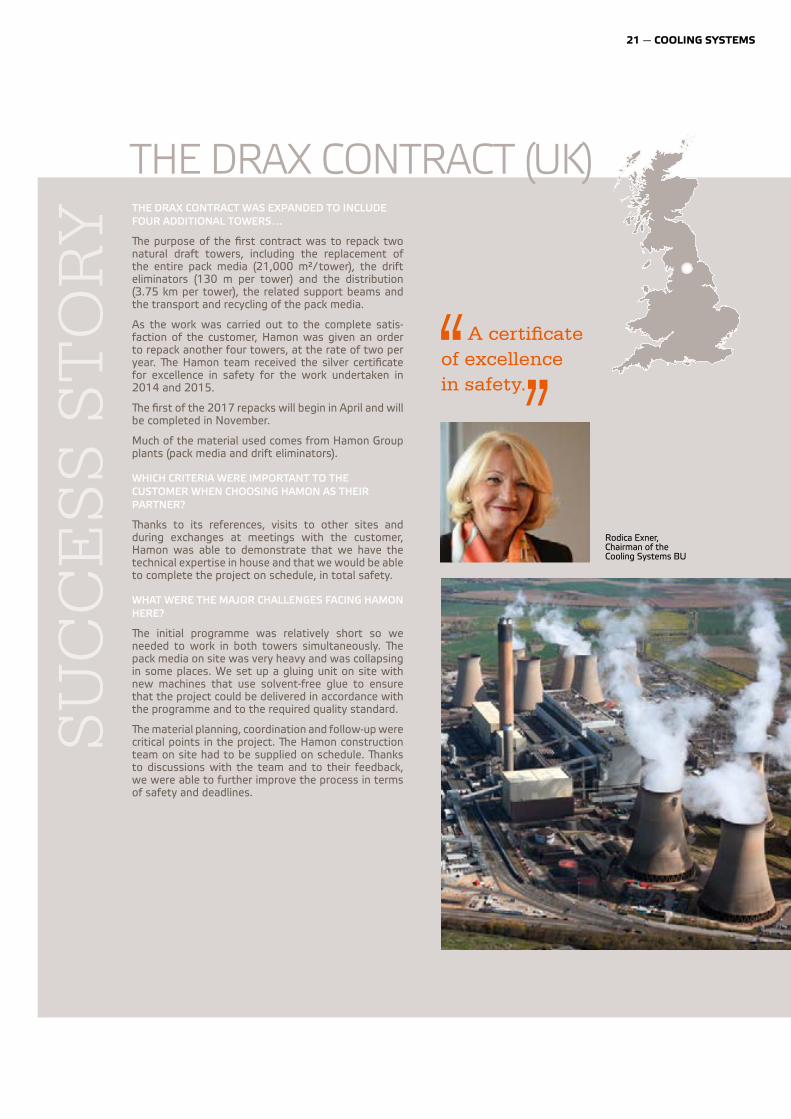
THE DRAX CONTRACT WAS EXPANDED TO INCLUDE FOUR ADDITIONAL TOWERS…
�e purpose of the first contract was to repack two natural draft towers, including the replacement of the entire pack media (21,000 m²/ tower), the drift eliminators (130 m per tower) and the distribution (3.75 km per tower), the related support beams and the transport and recycling of the pack media.
As the work was carried out to the complete satis-faction of the customer, Hamon was given an order to repack another four towers, at the rate of two per year. �e Hamon team received the silver certificate for excellence in safety for the work undertaken in 2014 and 2015.
�e first of the 2017 repacks will begin in April and will be completed in November.
Much of the material used comes from Hamon Group plants (pack media and drift eliminators).
WHICH CRITERIA WERE IMPORTANT TO THE CUSTOMER WHEN CHOOSING HAMON AS THEIR PARTNER?
�anks to its references, visits to other sites and during exchanges at meetings with the customer, Hamon was able to demonstrate that we have the technical expertise in house and that we would be able to complete the project on schedule, in total safety.
WHAT WERE THE MAJOR CHALLENGES FACING HAMON HERE?
�e initial programme was relatively short so we needed to work in both towers simultaneously. �e pack media on site was very heavy and was collapsing in some places. We set up a gluing unit on site with new machines that use solvent-free glue to ensure that the project could be delivered in accordance with the programme and to the required quality standard.
�e material planning, coordination and follow-up were critical points in the project. �e Hamon construction team on site had to be supplied on schedule. �anks to discussions with the team and to their feedback, we were able to further improve the process in terms of safety and deadlines.
THE DRAX CONTRACT (UK)
SU
CC
ES
S S
TO
RY
A certi�cate of excellence in safety.
Rodica Exner, Chairman of the Cooling Systems BU
As regards dry cooling, the BU signed contracts in the Middle East, China and northern Europe.
Revenue in 2016 was significantly below that in 2015 due to the low level of new order bookings, the halting of two projects because of insolvency proceedings involving a customer and certain delays in project implementation due to customers.
Despite good project management in both wet and dry cooling, the EBITDA amounted to EUR –11 million owing to the negative volume impact, EUR 9 million written off for bad debts and a slowdown in wet cooling in the USA.
PROSPECTS FOR 2017
For the Cooling Systems Business Unit, 2017 will again be a year of challenges. ªe markets remain highly competitive overall in wet systems and even more so in dry systems.
Mexico still has fine opportunities to offer. Certain countries in the Gulf and Central Asia, which up to now had few development projects, are now more active and are opening up new prospects.
ªe aftermarket business remains one of the BU’s spearheads. Major natural draft tower renovation projects are planned this year. Hamon has dedicated teams and unparalleled expertise in this field.
COOLING SYSTEMS
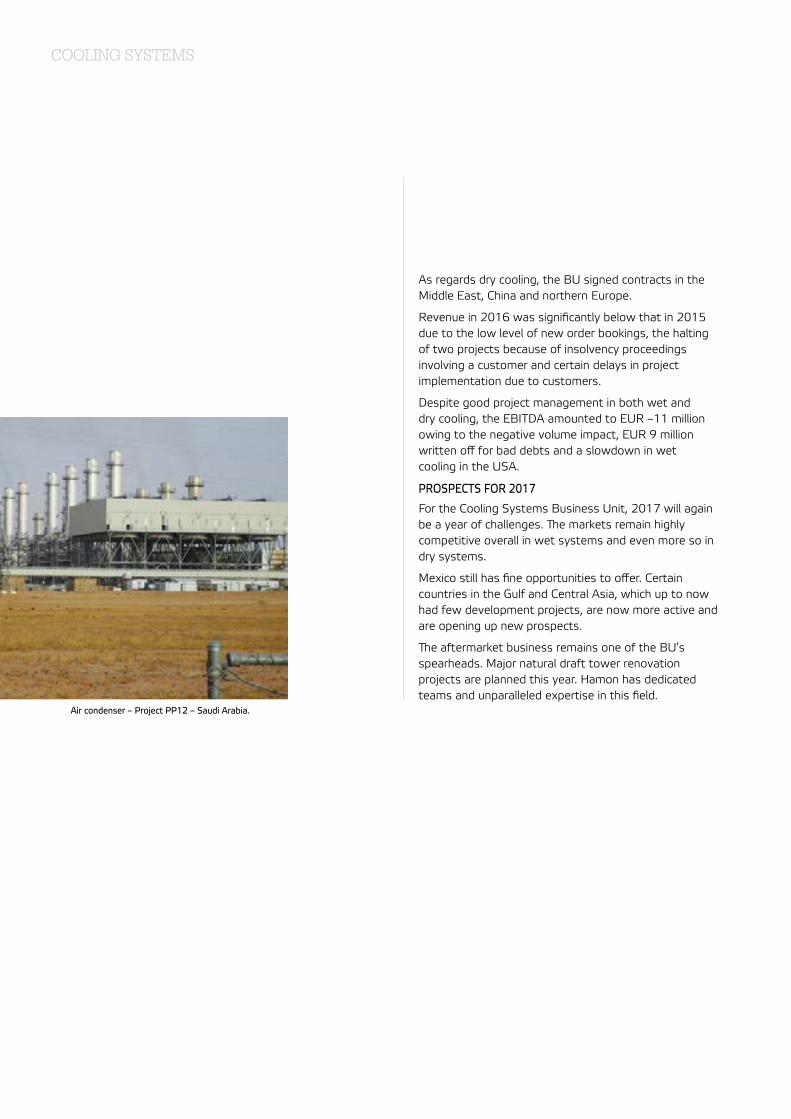
Air condenser – Project PP12 – Saudi Arabia.
23 — COOLING SYSTEMS
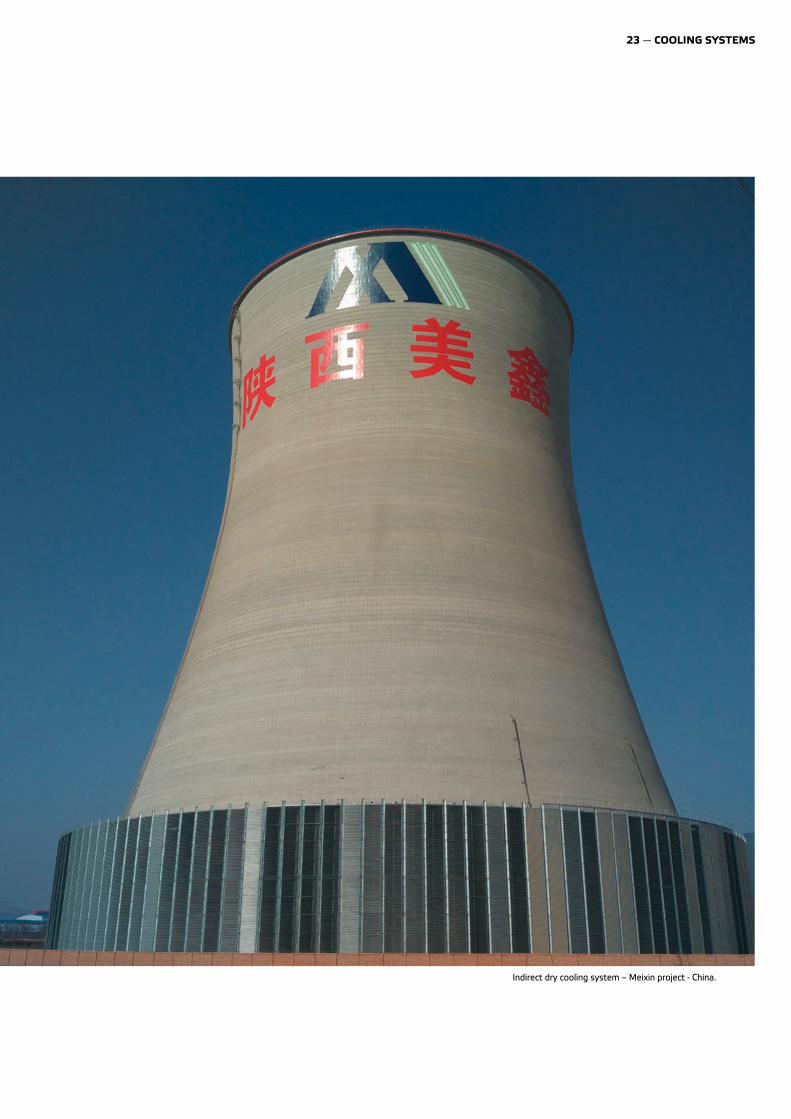
Indirect dry cooling system – Meixin project - China.

PROCESS HEAT EXCHANGERS
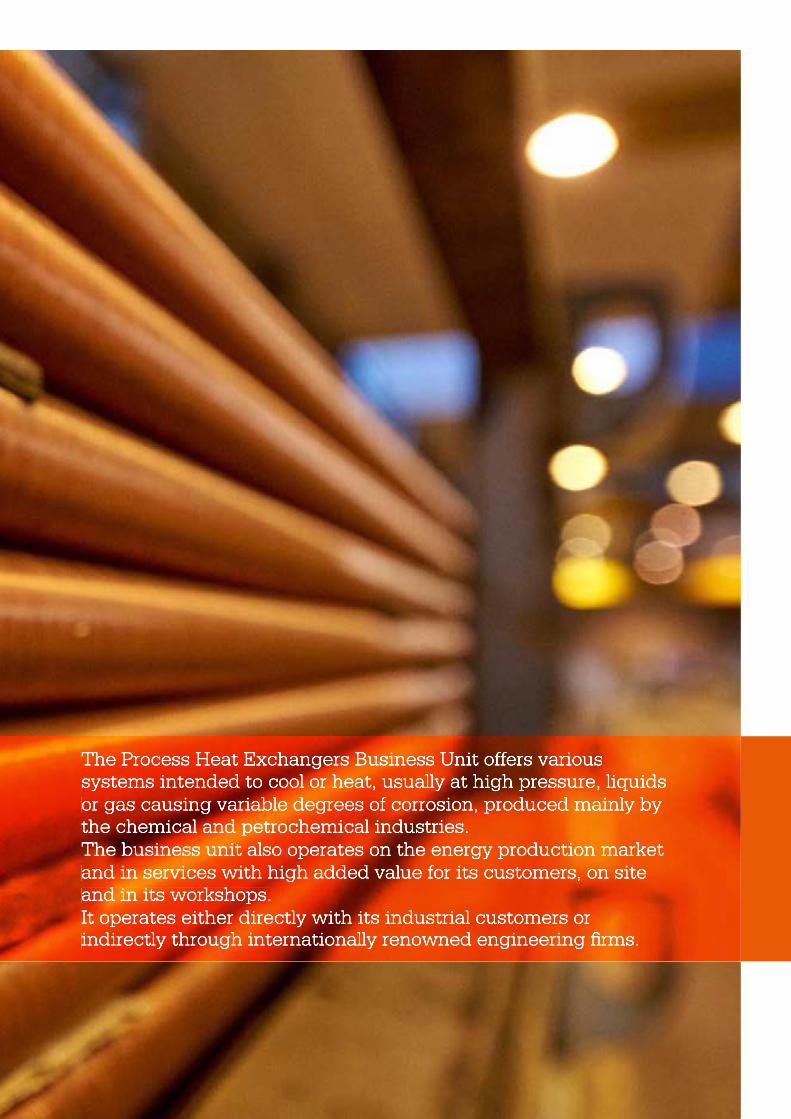
The Process Heat Exchangers Business Unit offers various systems intended to cool or heat, usually at high pressure, liquids or gas causing variable degrees of corrosion, produced mainly by the chemical and petrochemical industries.The business unit also operates on the energy production market and in services with high added value for its customers, on site and in its workshops.It operates either directly with its industrial customers or indirectly through internationally renowned engineering �rms.
The Process Heat Exchangers Business Unit offers various systems intended to cool or heat, usually at high pressure, liquids or gas causing variable degrees of corrosion, produced mainly by the chemical and petrochemical industries.The business unit also operates on the energy production market and in services with high added value for its customers, on site and in its workshops.It operates either directly with its industrial customers or indirectly through internationally renowned engineering �rms.
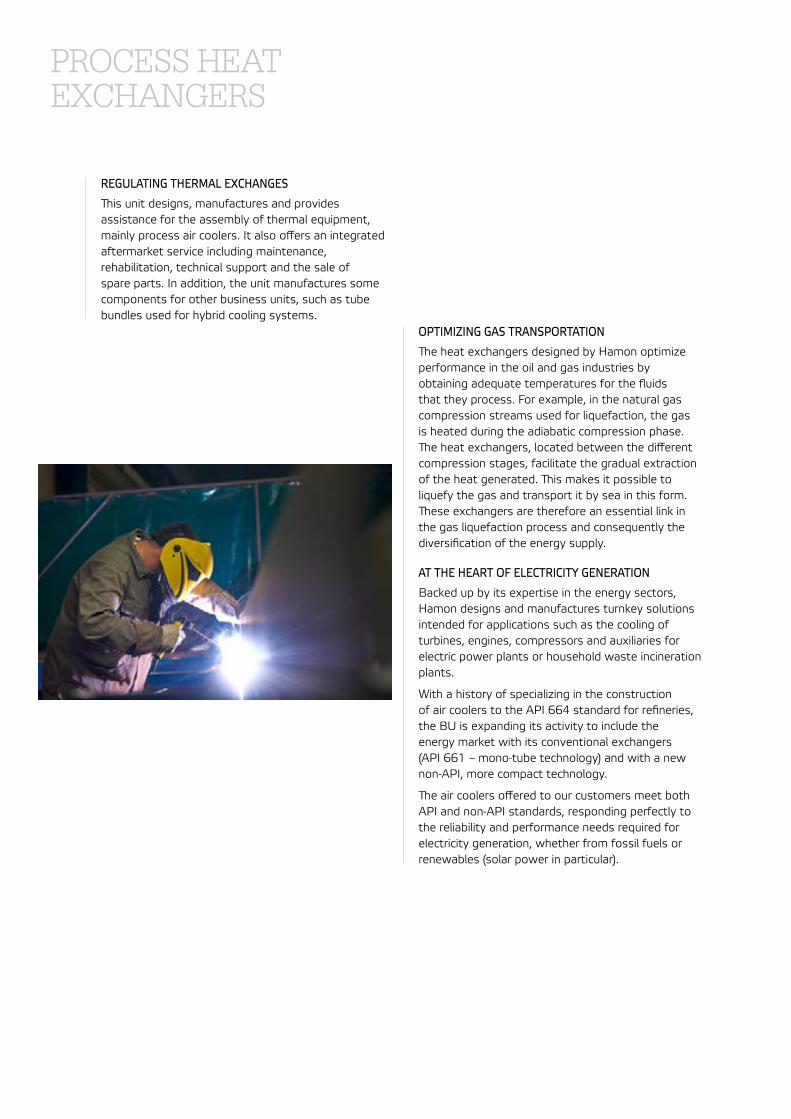
REGULATING THERMAL EXCHANGES
ªis unit designs, manufactures and provides assistance for the assembly of thermal equipment, mainly process air coolers. It also offers an integrated aftermarket service including maintenance, rehabilitation, technical support and the sale of spare parts. In addition, the unit manufactures some components for other business units, such as tube bundles used for hybrid cooling systems.
OPTIMIZING GAS TRANSPORTATION
ªe heat exchangers designed by Hamon optimize performance in the oil and gas industries by obtaining adequate temperatures for the fluids that they process. For example, in the natural gas compression streams used for liquefaction, the gas is heated during the adiabatic compression phase. ªe heat exchangers, located between the different compression stages, facilitate the gradual extraction of the heat generated. ªis makes it possible to liquefy the gas and transport it by sea in this form. ªese exchangers are therefore an essential link in the gas liquefaction process and consequently the diversification of the energy supply.
AT THE HEART OF ELECTRICITY GENERATION
Backed up by its expertise in the energy sectors, Hamon designs and manufactures turnkey solutions intended for applications such as the cooling of turbines, engines, compressors and auxiliaries for electric power plants or household waste incineration plants.
With a history of specializing in the construction of air coolers to the API 664 standard for refineries, the BU is expanding its activity to include the energy market with its conventional exchangers (API 661 – mono-tube technology) and with a new non-API, more compact technology.
ªe air coolers offered to our customers meet both API and non-API standards, responding perfectly to the reliability and performance needs required for electricity generation, whether from fossil fuels or renewables (solar power in particular).
PROCESS HEAT EXCHANGERS
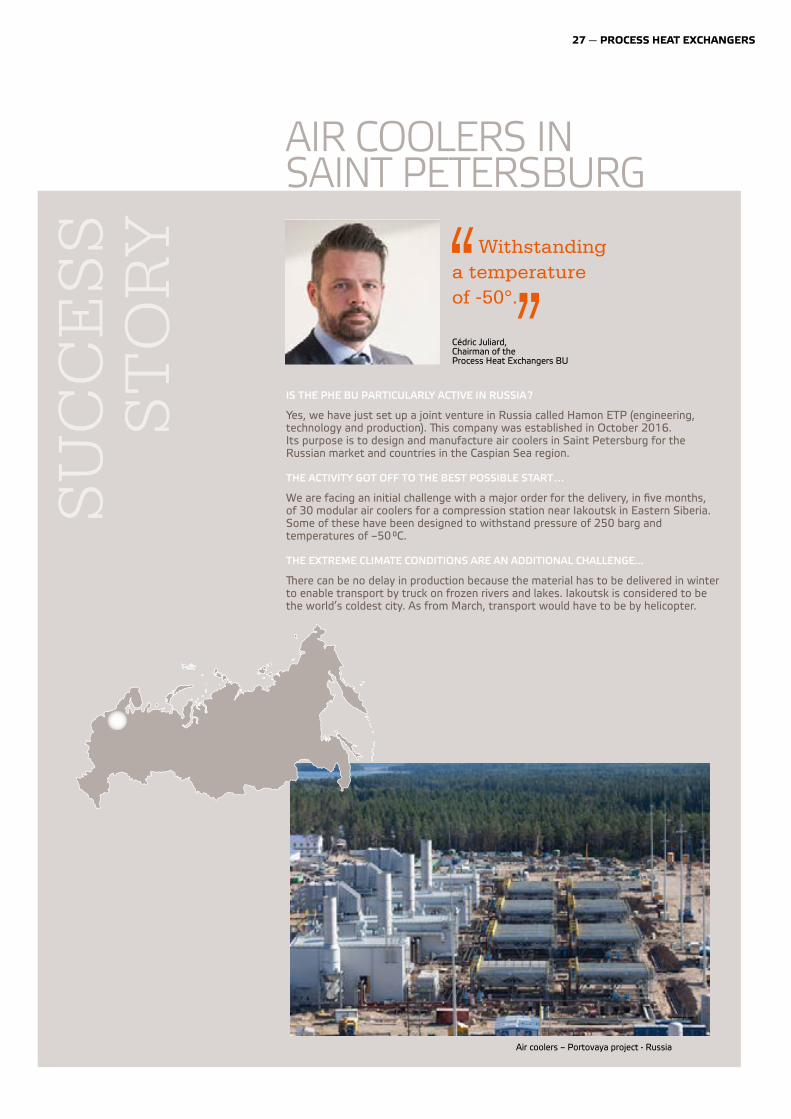
IS THE PHE BU PARTICULARLY ACTIVE IN RUSSIA ?
Yes, we have just set up a joint venture in Russia called Hamon ETP (engineering, technology and production). �is company was established in October 2016. Its purpose is to design and manufacture air coolers in Saint Petersburg for the Russian market and countries in the Caspian Sea region.
THE ACTIVITY GOT OFF TO THE BEST POSSIBLE START…
We are facing an initial challenge with a major order for the delivery, in five months, of 30 modular air coolers for a compression station near Iakoutsk in Eastern Siberia. Some of these have been designed to withstand pressure of 250 barg and temperatures of –50 °C.
THE EXTREME CLIMATE CONDITIONS ARE AN ADDITIONAL CHALLENGE...
�ere can be no delay in production because the material has to be delivered in winter to enable transport by truck on frozen rivers and lakes. Iakoutsk is considered to be the world’s coldest city. As from March, transport would have to be by helicopter.
Cédric Juliard, Chairman of the Process Heat Exchangers BU
Withstanding a temperature of -50°.
SU
CC
ES
S
ST
OR
YAIR COOLERS IN SAINT PETERSBURG
Air coolers – Portovaya project - Russia
27 — PROCESS HEAT EXCHANGERS
PROCESS HEAT EXCHANGERS
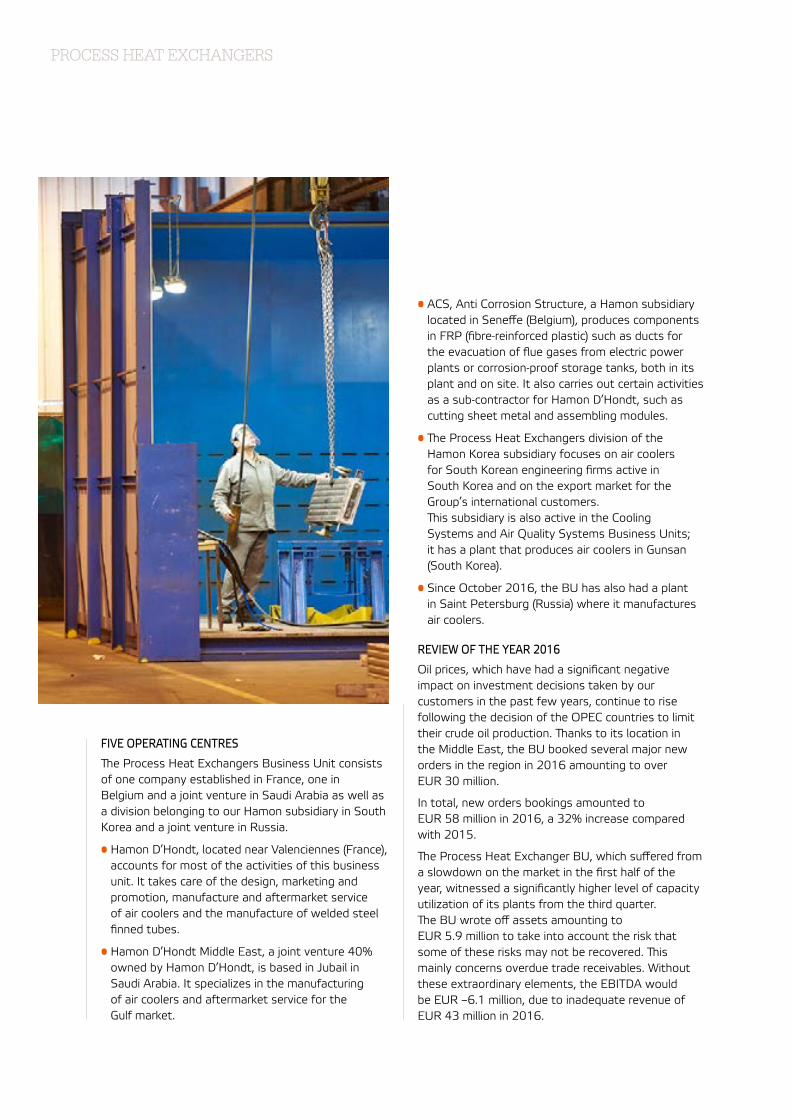
FIVE OPERATING CENTRES
ªe Process Heat Exchangers Business Unit consists of one company established in France, one in Belgium and a joint venture in Saudi Arabia as well as a division belonging to our Hamon subsidiary in South Korea and a joint venture in Russia.
• Hamon D’Hondt, located near Valenciennes (France), accounts for most of the activities of this business unit. It takes care of the design, marketing and promotion, manufacture and aftermarket service of air coolers and the manufacture of welded steel finned tubes.
• Hamon D’Hondt Middle East, a joint venture 40% owned by Hamon D’Hondt, is based in Jubail in Saudi Arabia. It specializes in the manufacturing of air coolers and aftermarket service for the Gulf market.
• ACS, Anti Corrosion Structure, a Hamon subsidiary located in Seneffe (Belgium), produces components in FRP (fibre-reinforced plastic) such as ducts for the evacuation of flue gases from electric power plants or corrosion-proof storage tanks, both in its plant and on site. It also carries out certain activities as a sub-contractor for Hamon D’Hondt, such as cutting sheet metal and assembling modules.
• ªe Process Heat Exchangers division of the Hamon Korea subsidiary focuses on air coolers for South Korean engineering firms active in South Korea and on the export market for the Group’s international customers. ªis subsidiary is also active in the Cooling Systems and Air Quality Systems Business Units; it has a plant that produces air coolers in Gunsan (South Korea).
• Since October 2016, the BU has also had a plant in Saint Petersburg (Russia) where it manufactures air coolers.
REVIEW OF THE YEAR 2016
Oil prices, which have had a significant negative impact on investment decisions taken by our customers in the past few years, continue to rise following the decision of the OPEC countries to limit their crude oil production. ªanks to its location in the Middle East, the BU booked several major new orders in the region in 2016 amounting to over EUR 30 million.
In total, new orders bookings amounted to EUR 58 million in 2016, a 32% increase compared with 2015.
ªe Process Heat Exchanger BU, which suffered from a slowdown on the market in the first half of the year, witnessed a significantly higher level of capacity utilization of its plants from the third quarter. ªe BU wrote off assets amounting to EUR 5.9 million to take into account the risk that some of these risks may not be recovered. ªis mainly concerns overdue trade receivables. Without these extraordinary elements, the EBITDA would be EUR –6.1 million, due to inadequate revenue of EUR 43 million in 2016.
29 — PROCESS HEAT EXCHANGERS
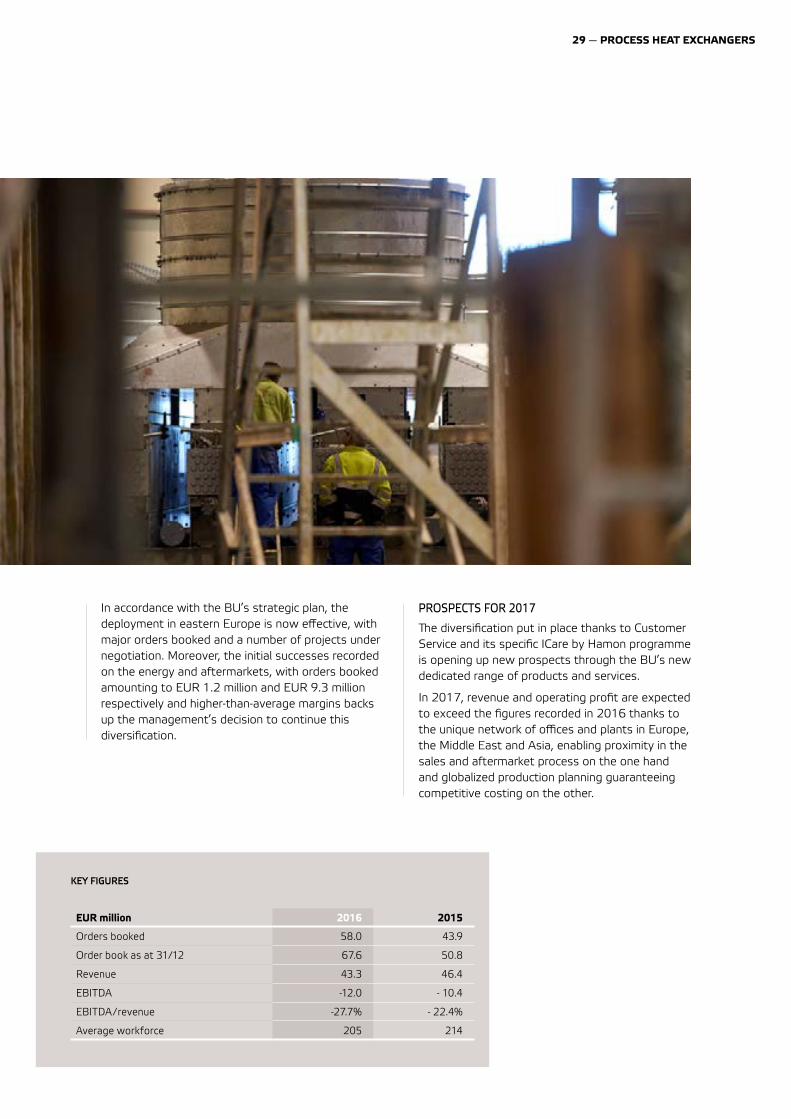
In accordance with the BU’s strategic plan, the deployment in eastern Europe is now effective, with major orders booked and a number of projects under negotiation. Moreover, the initial successes recorded on the energy and aftermarkets, with orders booked amounting to EUR 1.2 million and EUR 9.3 million respectively and higher-than-average margins backs up the management’s decision to continue this diversification.
KEY FIGURES
PROSPECTS FOR 2017
ªe diversification put in place thanks to Customer Service and its specific ICare by Hamon programme is opening up new prospects through the BU’s new dedicated range of products and services.
In 2017, revenue and operating profit are expected to exceed the figures recorded in 2016 thanks to the unique network of offices and plants in Europe, the Middle East and Asia, enabling proximity in the sales and aftermarket process on the one hand and globalized production planning guaranteeing competitive costing on the other.
EUR million 2016 2015
Orders booked 58.0 43.9
Order book as at 31/12 67.6 50.8
Revenue 43.3 46.4
EBITDA -12.0 - 10.4
EBITDA/ revenue -27.7% - 22.4%
Average workforce 205 214
AIR QUALITY SYSTEMS
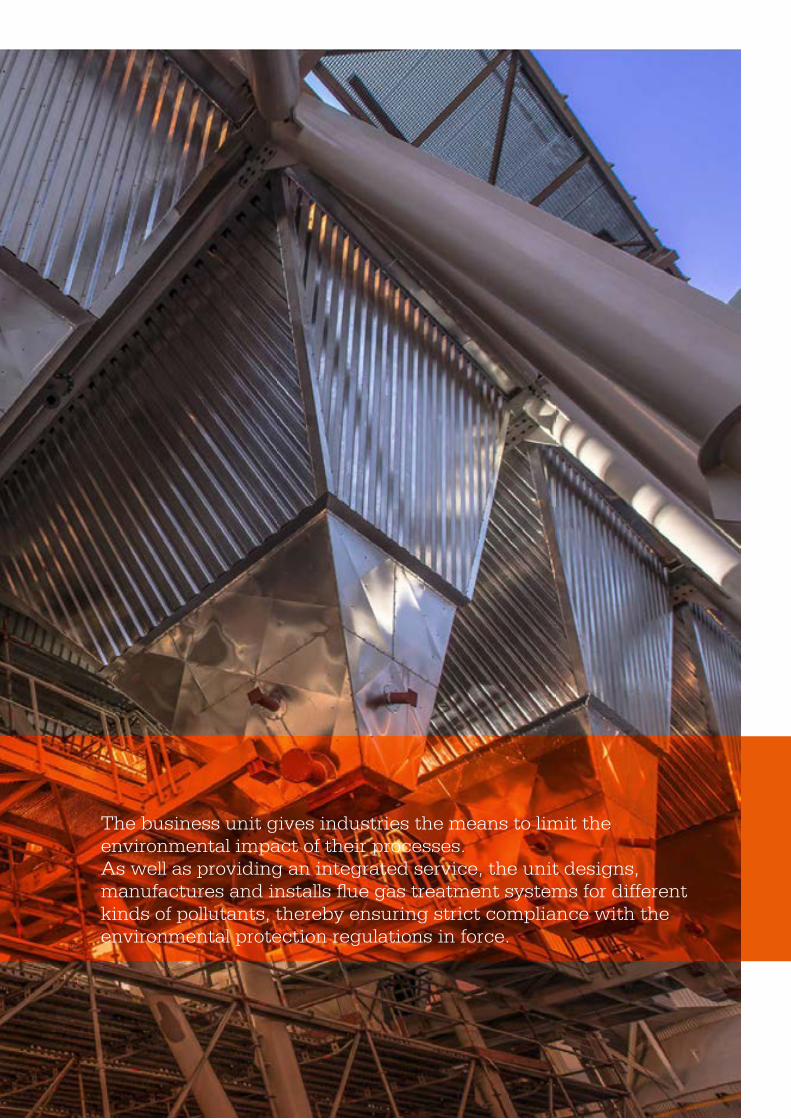
AIR QUALITY SYSTEMS The business unit gives industries the means to limit the
environmental impact of their processes.As well as providing an integrated service, the unit designs, manufactures and installs �ue gas treatment systems for different kinds of pollutants, thereby ensuring strict compliance with the environmental protection regulations in force.
A REPUTATION FOR EXCELLENCE
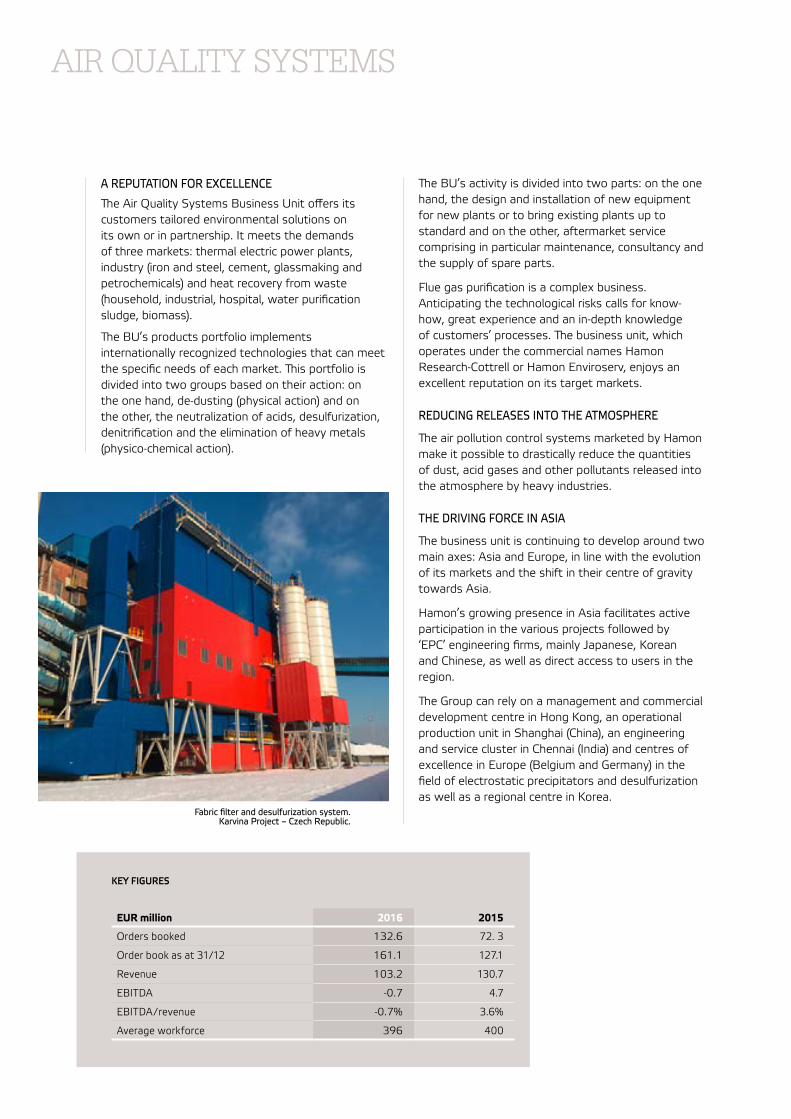
ªe Air Quality Systems Business Unit offers its customers tailored environmental solutions on its own or in partnership. It meets the demands of three markets: thermal electric power plants, industry (iron and steel, cement, glassmaking and petrochemicals) and heat recovery from waste (household, industrial, hospital, water purification sludge, biomass).
ªe BU’s products portfolio implements internationally recognized technologies that can meet the specific needs of each market. ªis portfolio is divided into two groups based on their action: on the one hand, de-dusting (physical action) and on the other, the neutralization of acids, desulfurization, denitrification and the elimination of heavy metals (physico-chemical action).
ªe BU’s activity is divided into two parts: on the one hand, the design and installation of new equipment for new plants or to bring existing plants up to standard and on the other, aftermarket service comprising in particular maintenance, consultancy and the supply of spare parts.
Flue gas purification is a complex business. Anticipating the technological risks calls for know-how, great experience and an in-depth knowledge of customers’ processes. ªe business unit, which operates under the commercial names Hamon Research-Cottrell or Hamon Enviroserv, enjoys an excellent reputation on its target markets.
REDUCING RELEASES INTO THE ATMOSPHERE
ªe air pollution control systems marketed by Hamon make it possible to drastically reduce the quantities of dust, acid gases and other pollutants released into the atmosphere by heavy industries.
THE DRIVING FORCE IN ASIA
ªe business unit is continuing to develop around two main axes: Asia and Europe, in line with the evolution of its markets and the shift in their centre of gravity towards Asia.
Hamon’s growing presence in Asia facilitates active participation in the various projects followed by ‘EPC’ engineering firms, mainly Japanese, Korean and Chinese, as well as direct access to users in the region.
ªe Group can rely on a management and commercial development centre in Hong Kong, an operational production unit in Shanghai (China), an engineering and service cluster in Chennai (India) and centres of excellence in Europe (Belgium and Germany) in the field of electrostatic precipitators and desulfurization as well as a regional centre in Korea.
KEY FIGURES
AIR QUALITY SYSTEMS
EUR million 2016 2015
Orders booked 132.6 72. 3
Order book as at 31/12 161.1 127.1
Revenue 103.2 130.7
EBITDA -0.7 4.7
EBITDA/ revenue -0.7% 3.6%
Average workforce 396 400
Fabric filter and desulfurization system. Karvina Project – Czech Republic.
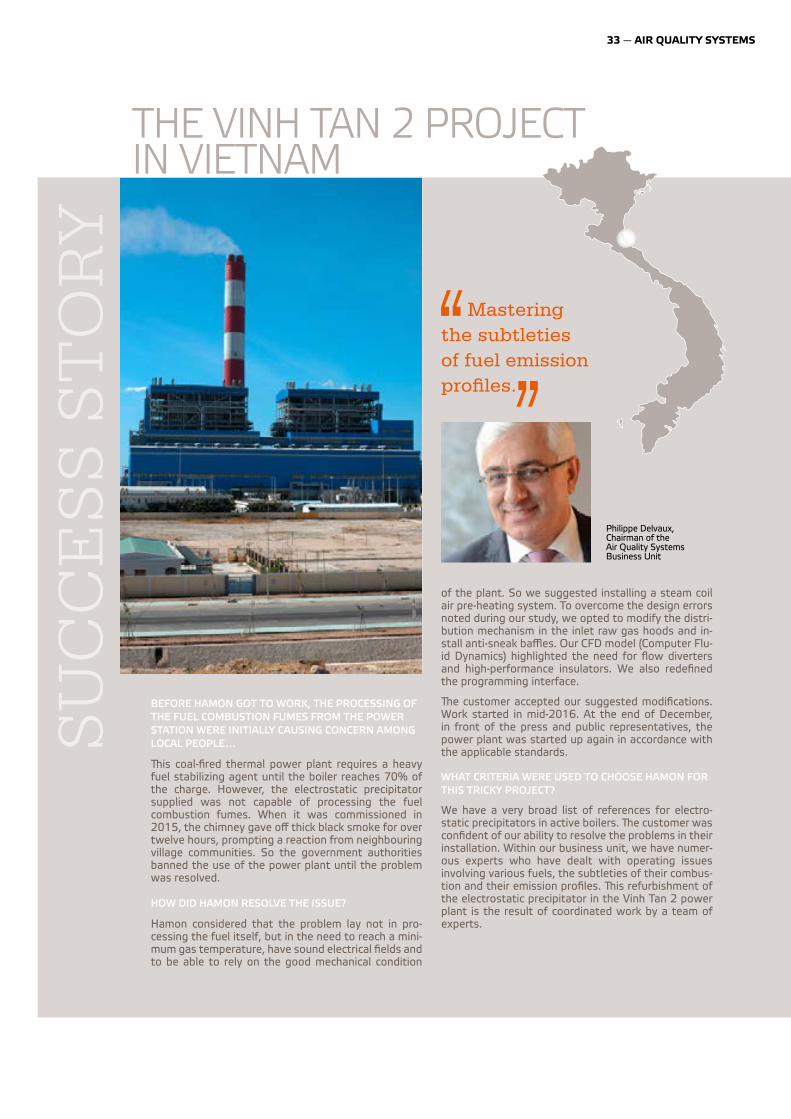
BEFORE HAMON GOT TO WORK, THE PROCESSING OF THE FUEL COMBUSTION FUMES FROM THE POWER STATION WERE INITIALLY CAUSING CONCERN AMONG LOCAL PEOPLE…
�is coal-fired thermal power plant requires a heavy fuel stabilizing agent until the boiler reaches 70% of the charge. However, the electrostatic precipitator supplied was not capable of processing the fuel combustion fumes. When it was commissioned in 2015, the chimney gave off thick black smoke for over twelve hours, prompting a reaction from neighbouring village communities. So the government authorities banned the use of the power plant until the problem was resolved.
HOW DID HAMON RESOLVE THE ISSUE?
Hamon considered that the problem lay not in pro-cessing the fuel itself, but in the need to reach a mini-mum gas temperature, have sound electrical fields and to be able to rely on the good mechanical condition
SU
CC
ES
S S
TO
RY
THE VINH TAN 2 PROJECT IN VIETNAM
Mastering the subtleties of fuel emission pro�les.
of the plant. So we suggested installing a steam coil air pre-heating system. To overcome the design errors noted during our study, we opted to modify the distri-bution mechanism in the inlet raw gas hoods and in-stall anti-sneak baffles. Our CFD model (Computer Flu-id Dynamics) highlighted the need for flow diverters and high-performance insulators. We also redefined the programming interface.
�e customer accepted our suggested modifications. Work started in mid-2016. At the end of December, in front of the press and public representatives, the power plant was started up again in accordance with the applicable standards.
WHAT CRITERIA WERE USED TO CHOOSE HAMON FOR THIS TRICKY PROJECT?
We have a very broad list of references for electro-static precipitators in active boilers. �e customer was confident of our ability to resolve the problems in their installation. Within our business unit, we have numer-ous experts who have dealt with operating issues involving various fuels, the subtleties of their combus-tion and their emission profiles. �is refurbishment of the electrostatic precipitator in the Vinh Tan 2 power plant is the result of coordinated work by a team of experts.
Philippe Delvaux,Chairman of the Air Quality Systems Business Unit
33 — AIR QUALITY SYSTEMS
AIR QUALITY SYSTEMS
ªe other subsidiaries and branches focus on commercial activities and project implementation (mainly in Brazil, France, Italy, South Africa and Poland).
ªe Business Unit’s development in Asia has a major impact on our competitiveness in all regions.
REVIEW OF THE YEAR 2016
ªe Business Unit booked new orders amounting to EUR 133 million in 2016, considerably exceeding the figure recorded the previous year, thanks to an outstanding first half year (EUR 111 million in new order bookings). ªe second half year bookings were concentrated in the aftermarket segment. Some customers delayed their decisions and deferred certain orders until 2017. ªe BU made a breakthrough in Asia, where two service contracts were signed and successfully fulfilled. ªe purpose of these contracts was to repair and improve units recently supplied by competitors but which had not achieved their contractual performance levels. ªis surely opens up a new potential market for Hamon.
As anticipated, the BU returned to a positive EBITDA in the second half of 2016, but this was unfortunately too low to offset the consequences of the low sales level in the first half of the year. ªis was due to lower than expected sales and additional write-offs on trade receivables of EUR 0.9 million.
PROSPECTS FOR 2017
ªe projects put on hold in the second half of 2016 have now been relaunched. Our main opportunities lie in south-eastern Asia and in Central and Eastern Europe, specifically in the Balkans. A major market is developing for the desulphurization of combustion gases in India, where Hamon is favourably positioned on various projects with prospects of success from early 2017. ªe steel industry is also very active with numerous projects around the globe.
Now more than ever, the active presence of the AQS BU in Asia is a plus for following up local projects, since the nearness of the sites and knowledge of local regulations are essential for business. What is more, the resources put in place in China and India also provide support for the entire BU for projects outside Asia so as to offer customers in all regions competitive solutions.
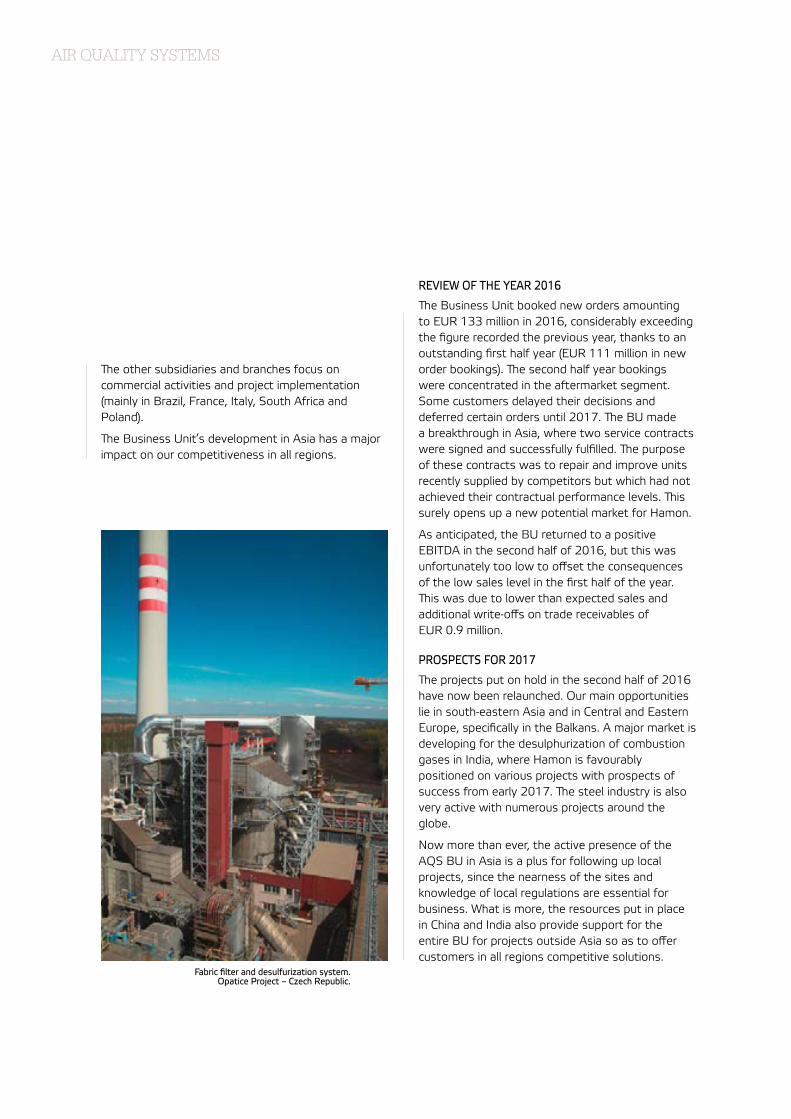
Fabric filter and desulfurization system. Opatice Project – Czech Republic.
35 — AIR QUALITY SYSTEMS
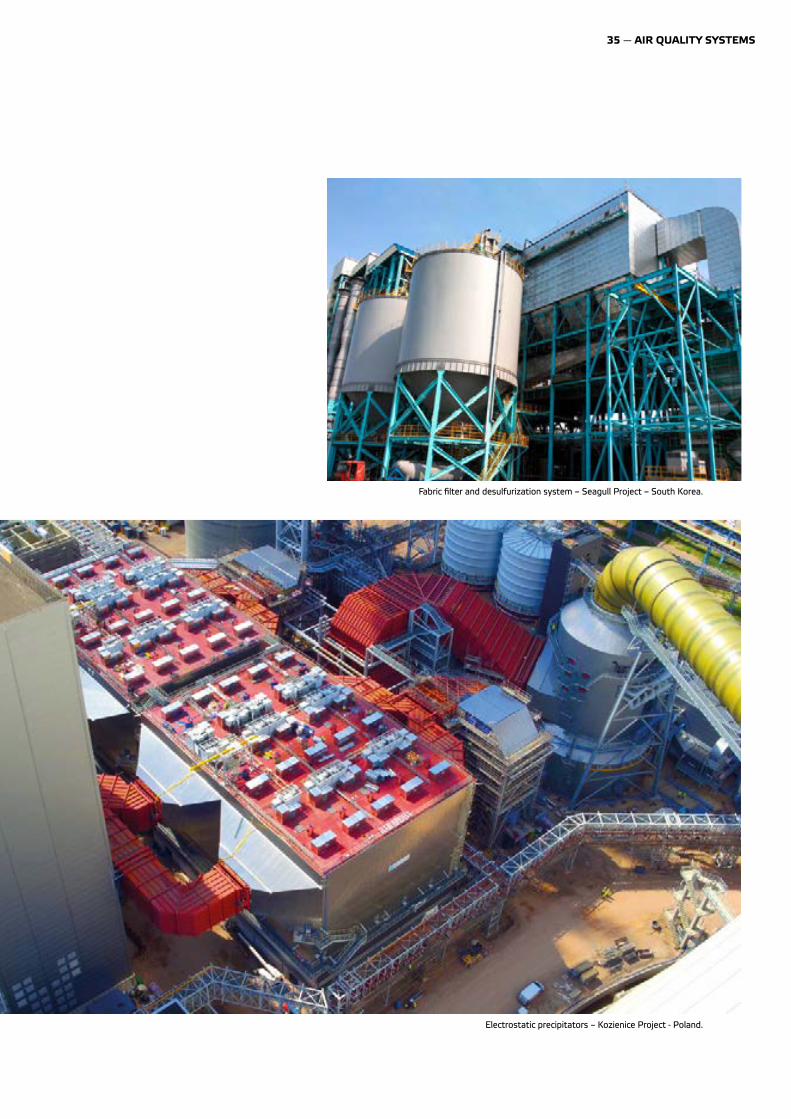
Electrostatic precipitators – Kozienice Project - Poland.
Fabric filter and desulfurization system – Seagull Project – South Korea.
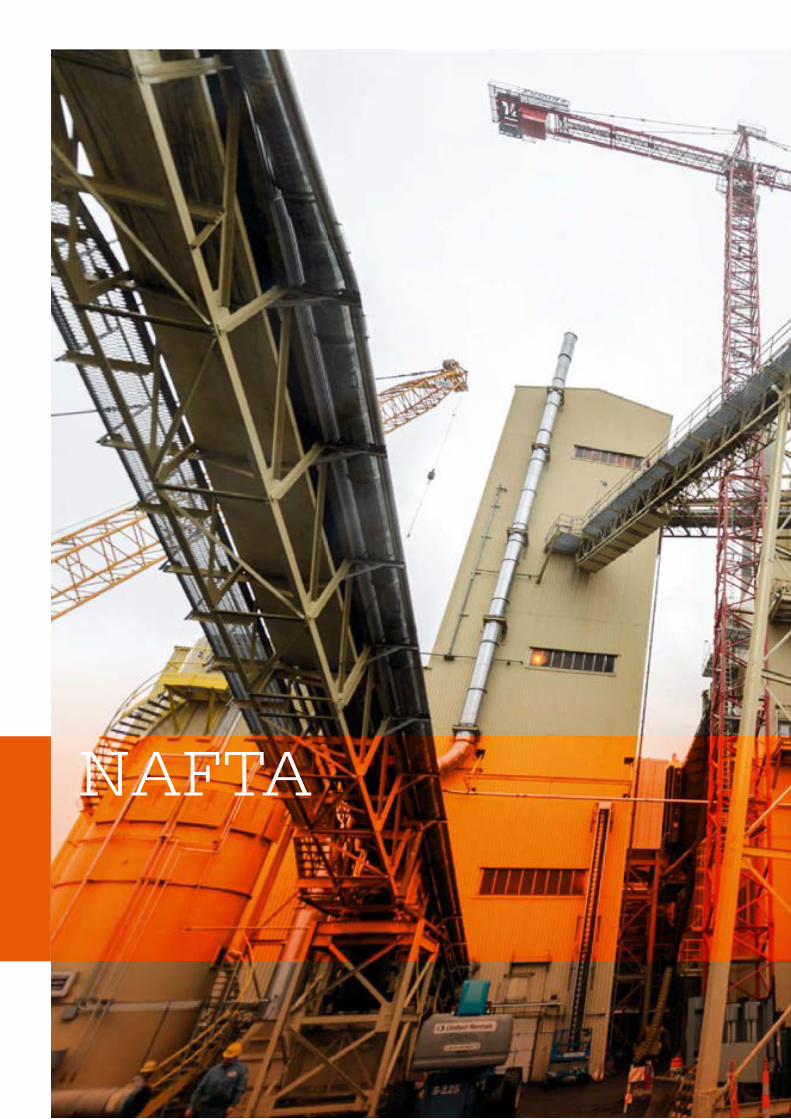
NAFTA
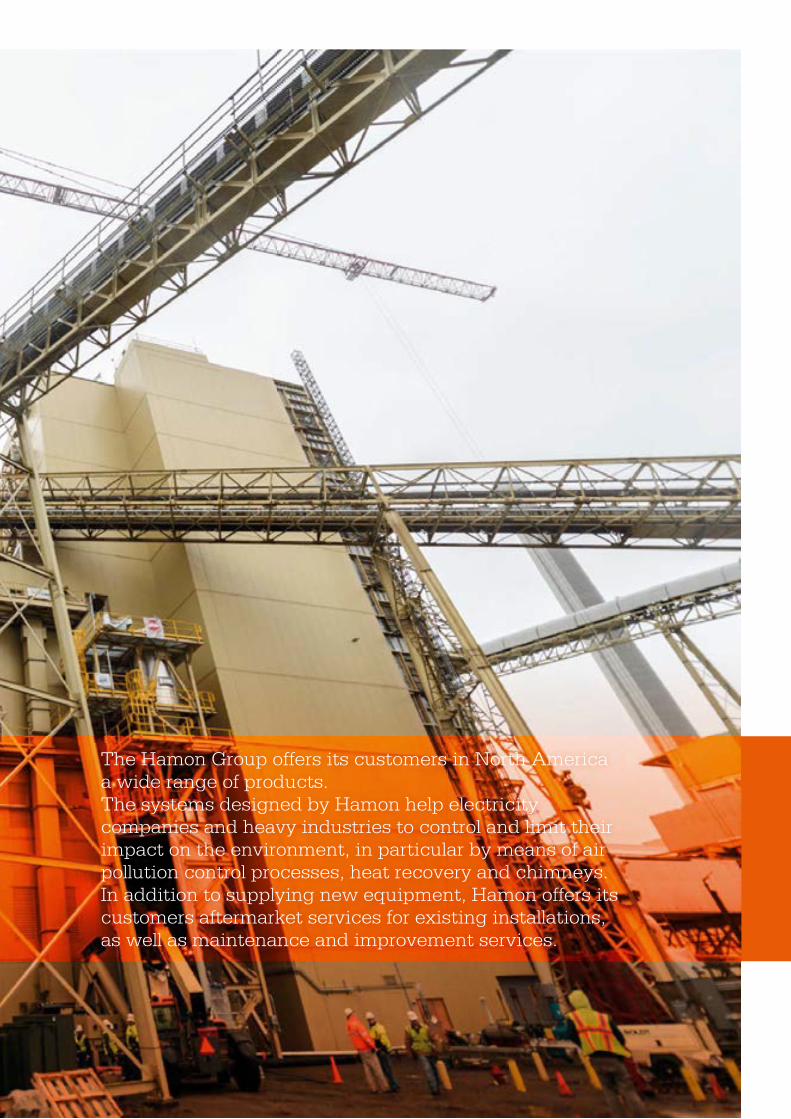
The Hamon Group offers its customers in North America a wide range of products.The systems designed by Hamon help electricity companies and heavy industries to control and limit their impact on the environment, in particular by means of air pollution control processes, heat recovery and chimneys. In addition to supplying new equipment, Hamon offers its customers aftermarket services for existing installations, as well as maintenance and improvement services.
REDUCING THE IMPACT ON THE ENVIRONMENT
ªe BU is currently active, through the products it offers, in three fields:
AIR POLLUTION CONTROL:
• Elimination of flue gas particles using electrostatic precipitators and fabric filters;
• Wet gas scrubbing, an Exxon-Mobil process used for the combined elimination of sulphur (deSOx), nitrogen oxides (deNOx) and particles in chemicals and process plants;
• ReACT™ process used to capture SOx, NOx, particles, mercury and acid gases simultaneously with minimal use of water;
• U2A: a process used to transform urea into ammonia (‘U2A’), a reagent used in the treatment by selective catalytic reduction of NOx in flue gases.
HEAT RECOVERY:
• Heat recovery systems including recuperators, economizers and gas-to-gas exchangers;
• Heat recovery steam generators (HRSG) that enable combined cycle power plants to achieve very high efficiency levels;
• Other types of special boilers for specific industrial applications.
CHIMNEYS:
• Concrete industrial chimneys that can be up to 300 metres high;
• Steel stacks;
• Concrete silos.
ªe North American entities also operate in cooling systems (wet and dry). ªe figures relating to these activities are included in the results of the Cooling Systems BU.
Moreover, the BU also provides aftermarket services linked to the above product ranges.
PRESERVING AIR QUALITY
ªe NAFTA BU makes its contribution to society in the three fields in which it operates.
ªe Air Pollution Control systems offered by Hamon help drastically reduce the amounts of dust, acid gases and other pollutants released into the atmosphere by fossil fuel power plants and other heavy industries.
ªe heat recovery systems offer industrial customers the opportunity to limit their energy consumption by recovering the heat carried by some fluids. Smaller amounts of fuel burnt means fewer greenhouse gases released into the atmosphere.
Chimneys provide a better dispersion of flue gases released into the atmosphere by heavy industry, to avoid exposing local people to poor air quality when atmospheric conditions are unfavourable. Chimneys have become an integral part of air pollution control systems, particularly in desulfurization systems (FGD).
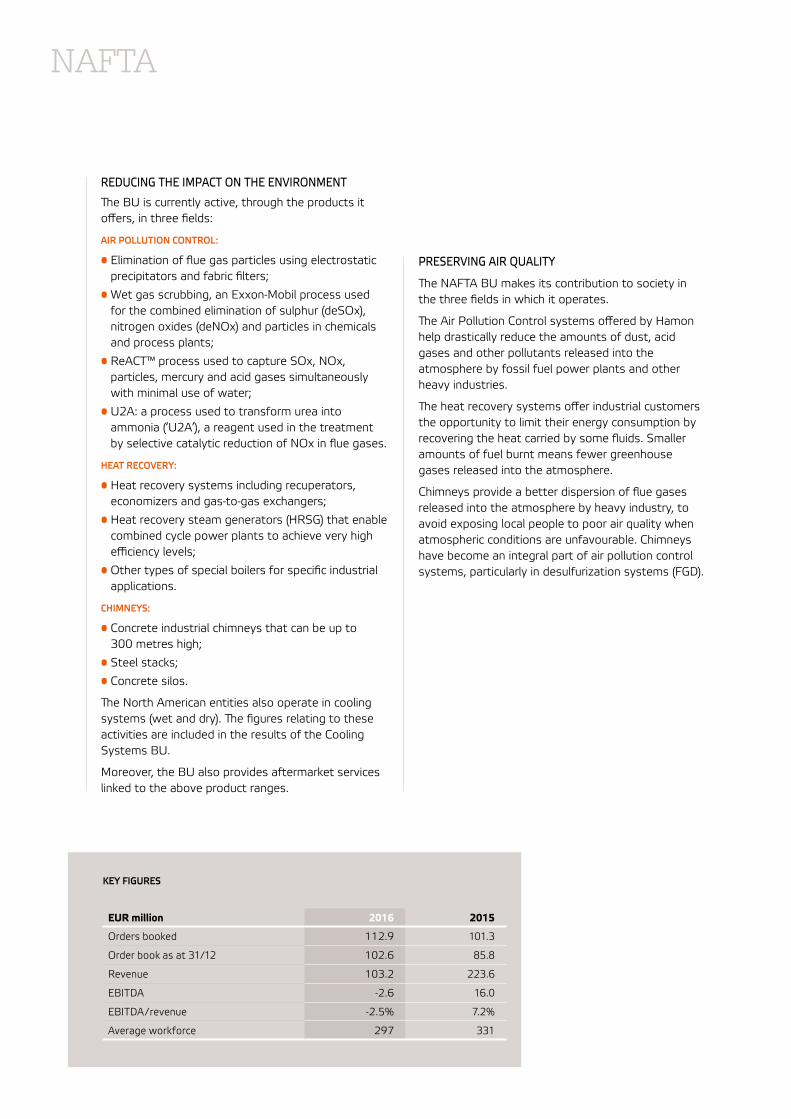
KEY FIGURES
EUR million 2016 2015
Orders booked 112.9 101.3
Order book as at 31/12 102.6 85.8
Revenue 103.2 223.6
EBITDA -2.6 16.0
EBITDA/ revenue -2.5% 7.2%
Average workforce 297 331
NAFTA
39 — NAFTA
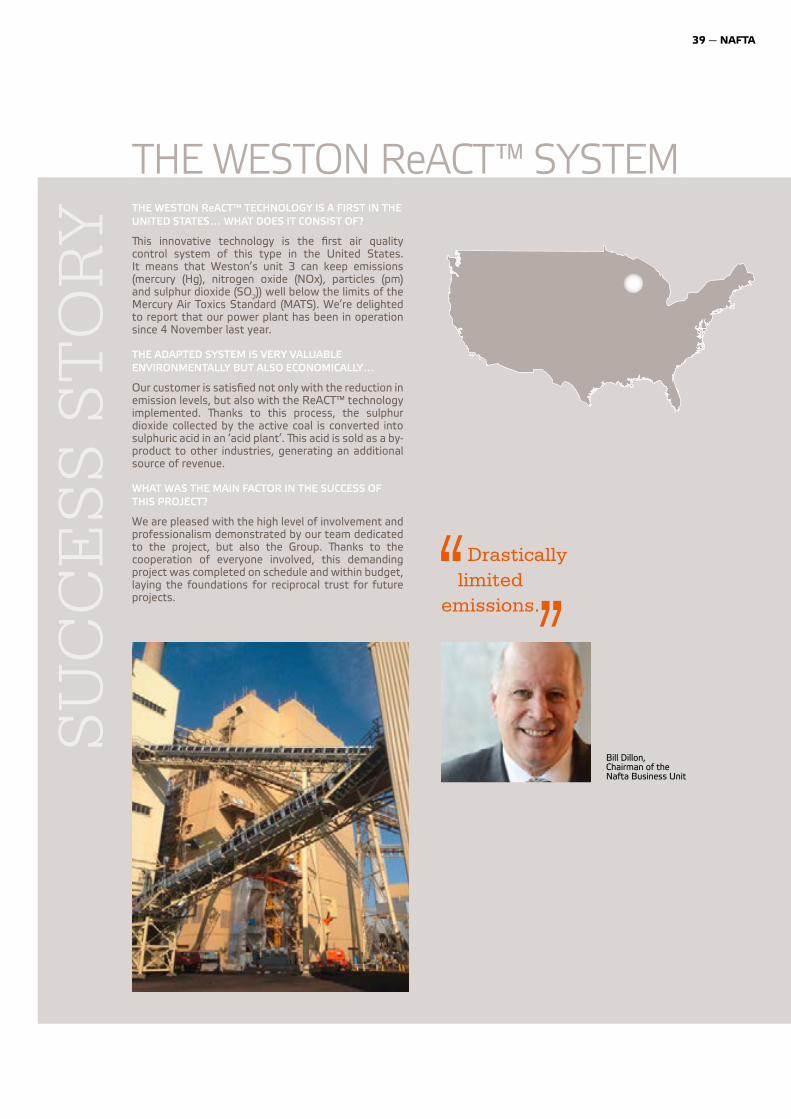
THE WESTON ReACT™ TECHNOLOGY IS A FIRST IN THE UNITED STATES… WHAT DOES IT CONSIST OF?
�is innovative technology is the first air quality control system of this type in the United States. It means that Weston’s unit 3 can keep emissions (mercury (Hg), nitrogen oxide (NOx), particles (pm) and sulphur dioxide (SO2)) well below the limits of the Mercury Air Toxics Standard (MATS). We’re delighted to report that our power plant has been in operation since 4 November last year.
THE ADAPTED SYSTEM IS VERY VALUABLE ENVIRONMENTALLY BUT ALSO ECONOMICALLY…
Our customer is satisfied not only with the reduction in emission levels, but also with the ReACT™ technology implemented. �anks to this process, the sulphur dioxide collected by the active coal is converted into sulphuric acid in an ‘acid plant’. �is acid is sold as a by-product to other industries, generating an additional source of revenue.
WHAT WAS THE MAIN FACTOR IN THE SUCCESS OF THIS PROJECT?
We are pleased with the high level of involvement and professionalism demonstrated by our team dedicated to the project, but also the Group. �anks to the cooperation of everyone involved, this demanding project was completed on schedule and within budget, laying the foundations for reciprocal trust for future projects.
SU
CC
ES
S S
TO
RY
THE WESTON ReACT™ SYSTEM
Drastically limited emissions.
Bill Dillon,Chairman of the Nafta Business Unit
REVIEW OF THE YEAR 2016
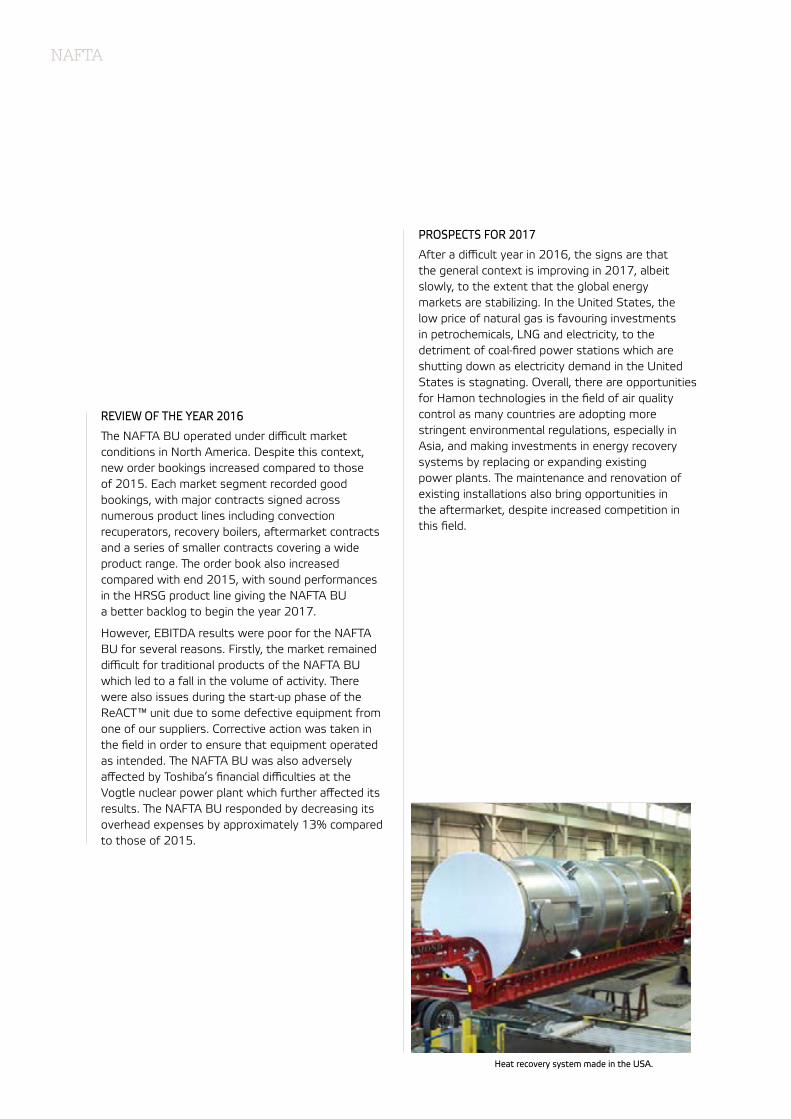
ªe NAFTA BU operated under difficult market conditions in North America. Despite this context, new order bookings increased compared to those of 2015. Each market segment recorded good bookings, with major contracts signed across numerous product lines including convection recuperators, recovery boilers, aftermarket contracts and a series of smaller contracts covering a wide product range. ªe order book also increased compared with end 2015, with sound performances in the HRSG product line giving the NAFTA BU a better backlog to begin the year 2017.
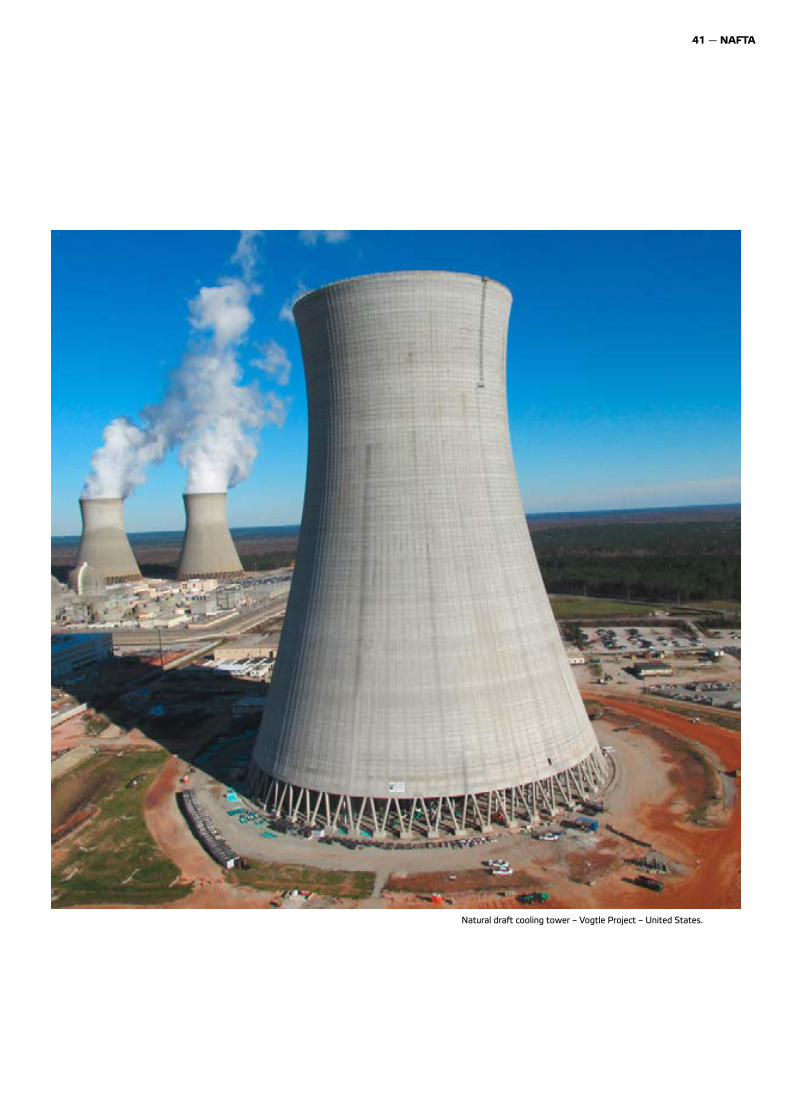
However, EBITDA results were poor for the NAFTA BU for several reasons. Firstly, the market remained difficult for traditional products of the NAFTA BU which led to a fall in the volume of activity. ªere were also issues during the start-up phase of the ReACT™ unit due to some defective equipment from one of our suppliers. Corrective action was taken in the field in order to ensure that equipment operated as intended. ªe NAFTA BU was also adversely affected by Toshiba’s financial difficulties at the Vogtle nuclear power plant which further affected its results. ªe NAFTA BU responded by decreasing its overhead expenses by approximately 13% compared to those of 2015.
PROSPECTS FOR 2017
After a difficult year in 2016, the signs are that the general context is improving in 2017, albeit slowly, to the extent that the global energy markets are stabilizing. In the United States, the low price of natural gas is favouring investments in petrochemicals, LNG and electricity, to the detriment of coal-fired power stations which are shutting down as electricity demand in the United States is stagnating. Overall, there are opportunities for Hamon technologies in the field of air quality control as many countries are adopting more stringent environmental regulations, especially in Asia, and making investments in energy recovery systems by replacing or expanding existing power plants. ªe maintenance and renovation of existing installations also bring opportunities in the aftermarket, despite increased competition in this field.
NAFTA
Heat recovery system made in the USA.
41 — NAFTA
Natural draft cooling tower – Vogtle Project – United States.
42 — HAMON ANNUAL REPORT 2016
social responsibilityHamon, an industrial and engineering �rm, has always sought to integrate sustainable development into its sectors of activity Hamon’s approach consists of analyzing, measuring and limiting the impact of its activities in order to take its share of responsibility to society. Hamon also takes care to act in line with its values, based on respect for the individual and on ethics.
1. INTRODUCTION
1.1. REPORTING REFERENCE FRAMEWORK
ªe Group models its approach on the ISO 26000 international guidelines on corporate social responsibility adopted by around a hundred countries in 2010. ªe aim is to bring Hamon’s strategy and business conduct into line with these principles and the related fields of action. ªe main aspects covered are:• organizational governance;• human rights;• labour relations and working conditions;• environmental protection;• fair operating practices;• consumer issues;• community involvement and local development.
Over the past few years, Hamon has put in place a series of actions, measures their effectiveness and reports on its performances. ªe methodology developed by the Global Reporting Initiative (GRI) is the operational framework used for this reporting. Following the example of the IAS/IFRS standards in the financial sector, the GRI, an international body based in the Netherlands, aims to provide all organizations, whatever their sector, size or location, with a reliable, standardized and credible framework for non-financial reporting.
ªe methodology takes account of several types of information:
• general information, such as: the strategy of the organization, its profile, the reporting scope, governance, etc.;
• information specific to the company and the sustainable development issues of its areas of activity: the company explains its management approach to this here and reports on key performance indicators.
Readers will find the information they are seeking in the correspondence grid, the standard table of contents of the GRI, given at the end of this report.
ªe reporting method developed by the GRI covers three main information categories:
• economic performance (detailed in other parts of this annual report);
• environmental performance;
• social performance:
- employment and decent labour practices;
- human rights;
- society;
- product liability (less relevant for Hamon as it does not sell consumer goods).
ªis report is based on the GRI G4 guidelines. ªe information available focuses mainly on that deemed relevant by Hamon’s management and its stakeholders as regards its day-to-day business activities.
According to the G4 guidelines, there are two possible reporting levels. Hamon has opted to report ‘in accordance’ using the ‘core criteria’.
1.2. UNITED NATIONS GLOBAL COMPACT AND OTHER INITIATIVES SUPPORTED BY HAMON
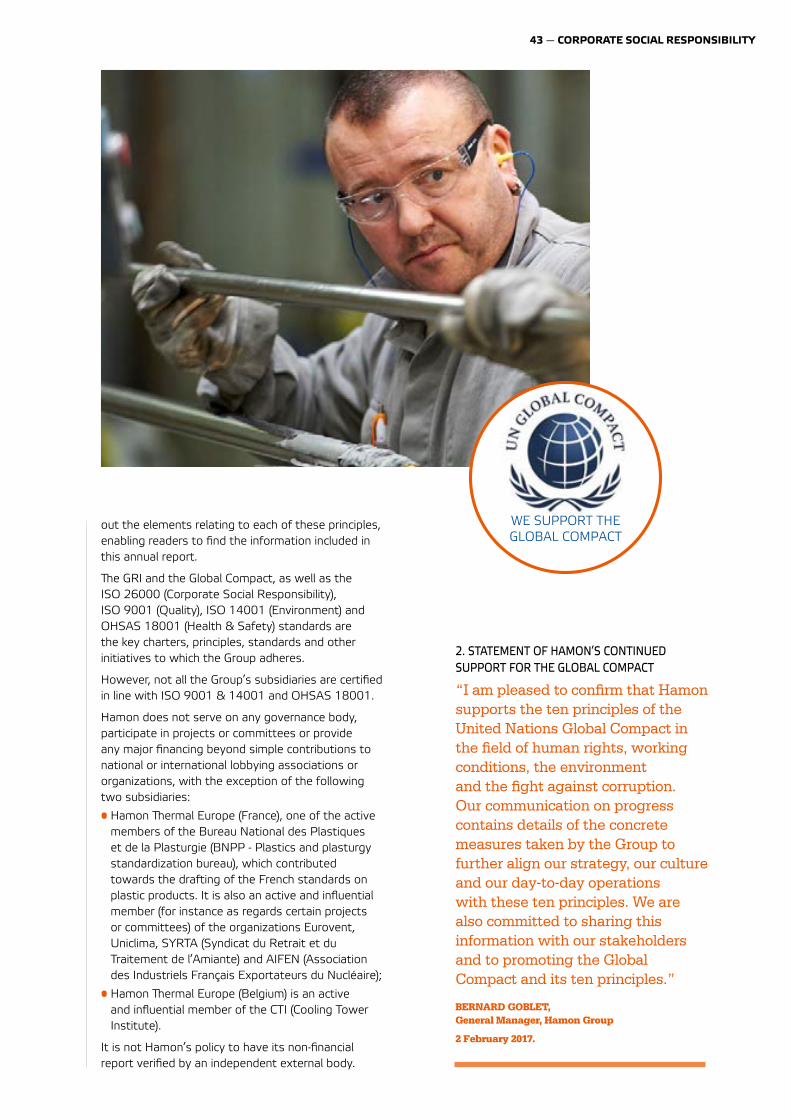
Hamon has also signed the UN Global Compact and has been an associate participant since September 2013. As such, the Group ensures compliance with the ten principles of the Global Compact.
ªis undertaking requires the issuing of an annual report on the progress made on these ten principles (COP - Communication On Progress). ªere are two levels of reporting. Hamon has opted for the ‘GC Active’ level.
ªis chapter constitutes our communication on progress with regard to these ten principles. It is also available on the Global Compact and GRI websites. ªe correspondence grid attached to this report sets
43 — CORPORATE SOCIAL RESPONSIBILITY
out the elements relating to each of these principles, enabling readers to find the information included in this annual report.
ªe GRI and the Global Compact, as well as the ISO 26000 (Corporate Social Responsibility), ISO 9001 (Quality), ISO 14001 (Environment) and OHSAS 18001 (Health & Safety) standards are the key charters, principles, standards and other initiatives to which the Group adheres.
However, not all the Group’s subsidiaries are certified in line with ISO 9001 & 14001 and OHSAS 18001.
Hamon does not serve on any governance body, participate in projects or committees or provide any major financing beyond simple contributions to national or international lobbying associations or organizations, with the exception of the following two subsidiaries:
• Hamon ªermal Europe (France), one of the active members of the Bureau National des Plastiques et de la Plasturgie (BNPP - Plastics and plasturgy standardization bureau), which contributed towards the drafting of the French standards on plastic products. It is also an active and influential member (for instance as regards certain projects or committees) of the organizations Eurovent, Uniclima, SYRTA (Syndicat du Retrait et du Traitement de l’Amiante) and AIFEN (Association des Industriels Français Exportateurs du Nucléaire);
• Hamon ªermal Europe (Belgium) is an active and influential member of the CTI (Cooling Tower Institute).
It is not Hamon’s policy to have its non-financial report verified by an independent external body.
2. STATEMENT OF HAMON’S CONTINUED SUPPORT FOR THE GLOBAL COMPACT
“I am pleased to con�rm that Hamon supports the ten principles of the United Nations Global Compact in the �eld of human rights, working conditions, the environment and the �ght against corruption. Our communication on progress contains details of the concrete measures taken by the Group to further align our strategy, our culture and our day-to-day operations with these ten principles. We are also committed to sharing this information with our stakeholders and to promoting the Global Compact and its ten principles.”
BERNARD GOBLET,General Manager, Hamon Group
2 February 2017.
WE SUPPORT THE GLOBAL COMPACT
44 — HAMON ANNUAL REPORT 2016
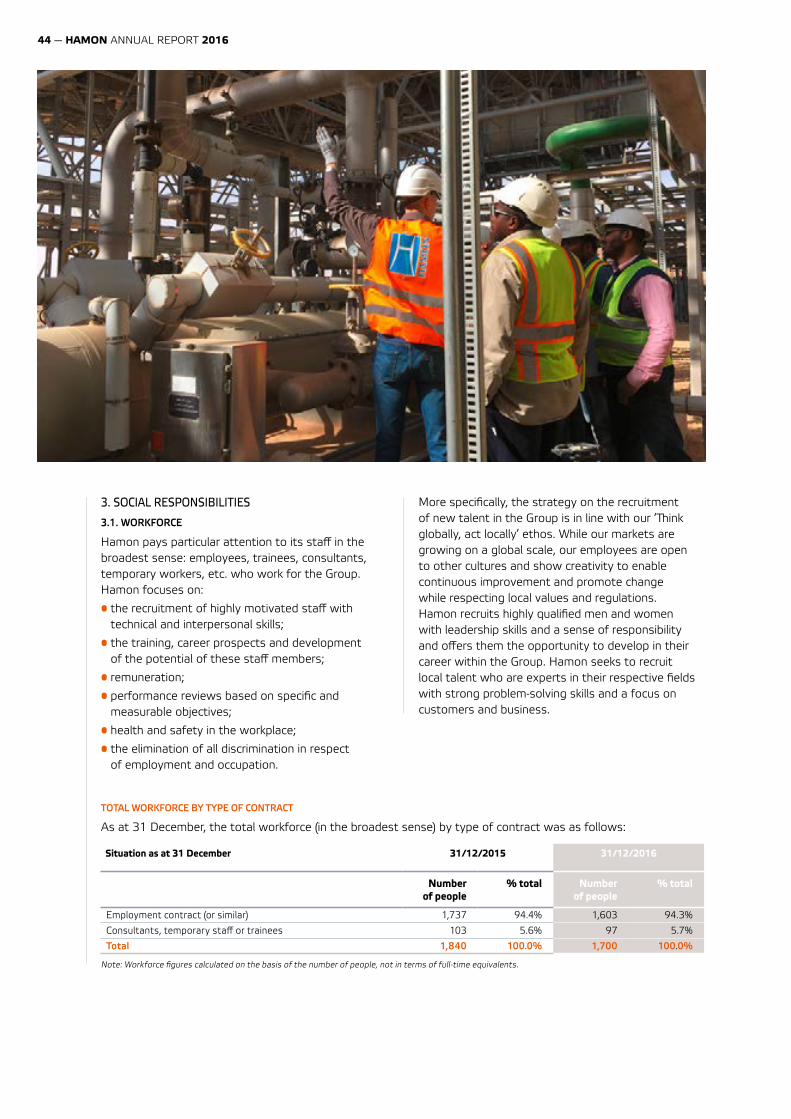
3. SOCIAL RESPONSIBILITIES
3.1. WORKFORCE
Hamon pays particular attention to its staff in the broadest sense: employees, trainees, consultants, temporary workers, etc. who work for the Group. Hamon focuses on:
• the recruitment of highly motivated staff with technical and interpersonal skills;
• the training, career prospects and development of the potential of these staff members;
• remuneration;
• performance reviews based on specific and measurable objectives;
• health and safety in the workplace;
• the elimination of all discrimination in respect of employment and occupation.
More specifically, the strategy on the recruitment of new talent in the Group is in line with our ‘ªink globally, act locally’ ethos. While our markets are growing on a global scale, our employees are open to other cultures and show creativity to enable continuous improvement and promote change while respecting local values and regulations. Hamon recruits highly qualified men and women with leadership skills and a sense of responsibility and offers them the opportunity to develop in their career within the Group. Hamon seeks to recruit local talent who are experts in their respective fields with strong problem-solving skills and a focus on customers and business.
TOTAL WORKFORCE BY TYPE OF CONTRACT
As at 31 December, the total workforce (in the broadest sense) by type of contract was as follows:
Situation as at 31 December 31/12/2015 31/12/2016
Number of people
% total Number of people
% total
Employment contract (or similar) 1,737 94.4% 1,603 94.3%
Consultants, temporary staff or trainees 103 5.6% 97 5.7%
Total 1,840 100.0% 1,700 100.0%
Note: Workforce figures calculated on the basis of the number of people, not in terms of full-time equivalents.
45 — CORPORATE SOCIAL RESPONSIBILITY
In addition to the above, Hamon also employs a several hundred local temporary workers, mainly on its building sites, whose numbers are constantly changing. ªey are scattered among our areas of operation around the world and usually work on these projects for a few months.
ªe workforce declined comparably in 2016 for permanent employees and consultants, temporary staff and trainees (approximately –7%).
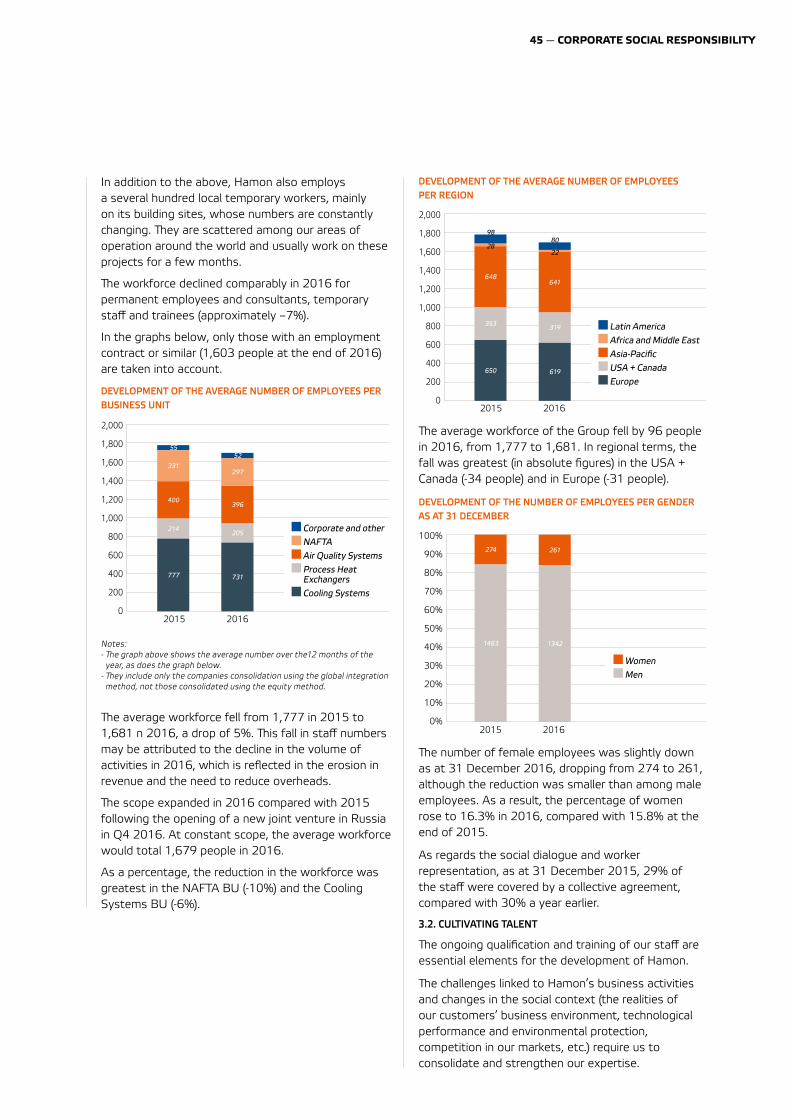
In the graphs below, only those with an employment contract or similar (1,603 people at the end of 2016) are taken into account.
DEVELOPMENT OF THE AVERAGE NUMBER OF EMPLOYEES PER BUSINESS UNIT
2,000
1,800
1,600
1,400
1,200
1,000
800
600
400
200
0
Corporate and other NAFTA Air Quality Systems Process Heat Exchangers Cooling Systems
2015 2016
51
331
400
214
777
55
731
205
396
297
52
Notes:- ªe graph above shows the average number over the12 months of the year, as does the graph below.
- ªey include only the companies consolidation using the global integration method, not those consolidated using the equity method.
ªe average workforce fell from 1,777 in 2015 to 1,681 n 2016, a drop of 5%. ªis fall in staff numbers may be attributed to the decline in the volume of activities in 2016, which is reflected in the erosion in revenue and the need to reduce overheads.
ªe scope expanded in 2016 compared with 2015 following the opening of a new joint venture in Russia in Q4 2016. At constant scope, the average workforce would total 1,679 people in 2016.
As a percentage, the reduction in the workforce was greatest in the NAFTA BU (-10%) and the Cooling Systems BU (-6%).
DEVELOPMENT OF THE AVERAGE NUMBER OF EMPLOYEES PER REGION
2,000
1,800
1,600
1,400
1,200
1,000
800
600
400
200
0
Latin America Africa and Middle East Asia-Pacific USA + Canada Europe
648
353
650
28
98
2015 2016
619
319
641
80
22
ªe average workforce of the Group fell by 96 people in 2016, from 1,777 to 1,681. In regional terms, the fall was greatest (in absolute figures) in the USA + Canada (-34 people) and in Europe (-31 people).
DEVELOPMENT OF THE NUMBER OF EMPLOYEES PER GENDER AS AT 31 DECEMBER
2015 2016
100%
90%
80%
70%
60%
50%
40%
30%
20%
10%
0%
Women Men
1342
261
1463
274
ªe number of female employees was slightly down as at 31 December 2016, dropping from 274 to 261, although the reduction was smaller than among male employees. As a result, the percentage of women rose to 16.3% in 2016, compared with 15.8% at the end of 2015.
As regards the social dialogue and worker representation, as at 31 December 2015, 29% of the staff were covered by a collective agreement, compared with 30% a year earlier.
3.2. CULTIVATING TALENT
ªe ongoing qualification and training of our staff are essential elements for the development of Hamon.
ªe challenges linked to Hamon’s business activities and changes in the social context (the realities of our customers’ business environment, technological performance and environmental protection, competition in our markets, etc.) require us to consolidate and strengthen our expertise.
46 — HAMON ANNUAL REPORT 2016
Hamon’s staff are pivotal to our success. It is important that we constantly increase their level of versatility and competence in each business unit.
In addition to formal training, our employees receive daily ‘on-the-job’ coaching. In the Hamon ‘multi-department’ culture of work and project management, employees use their own specific skills and knowledge. ªey also learn from other team members. During the annual performance appraisals, employees are encouraged to define their own training needs so that we can offer each individual a specific training programme and help everyone to develop within the Group.
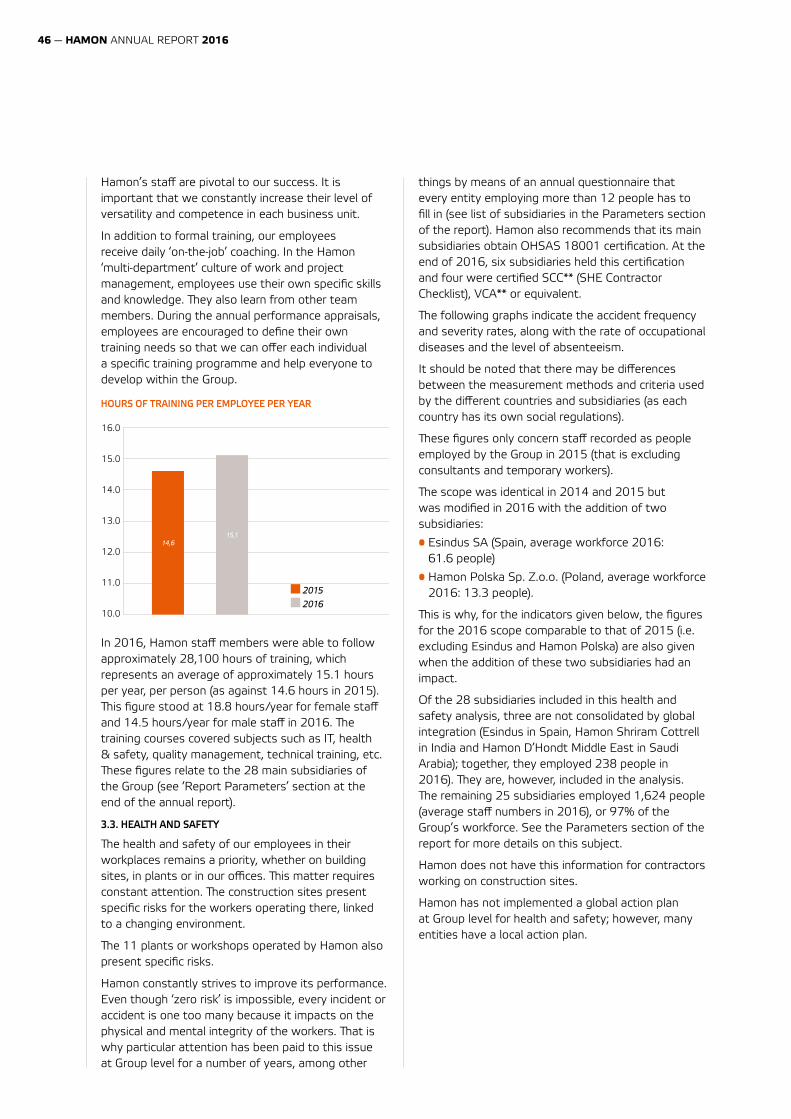
HOURS OF TRAINING PER EMPLOYEE PER YEAR
2015 2016
16.0
15.0
14.0
13.0
12.0
11.0
10.0
15,114,6
In 2016, Hamon staff members were able to follow approximately 28,100 hours of training, which represents an average of approximately 15.1 hours per year, per person (as against 14.6 hours in 2015). ªis figure stood at 18.8 hours/year for female staff and 14.5 hours/year for male staff in 2016. ªe training courses covered subjects such as IT, health & safety, quality management, technical training, etc. ªese figures relate to the 28 main subsidiaries of the Group (see ‘Report Parameters’ section at the end of the annual report).
3.3. HEALTH AND SAFETY
ªe health and safety of our employees in their workplaces remains a priority, whether on building sites, in plants or in our offices. ªis matter requires constant attention. ªe construction sites present specific risks for the workers operating there, linked to a changing environment.
ªe 11 plants or workshops operated by Hamon also present specific risks.
Hamon constantly strives to improve its performance. Even though ‘zero risk’ is impossible, every incident or accident is one too many because it impacts on the physical and mental integrity of the workers. ªat is why particular attention has been paid to this issue at Group level for a number of years, among other
things by means of an annual questionnaire that every entity employing more than 12 people has to fill in (see list of subsidiaries in the Parameters section of the report). Hamon also recommends that its main subsidiaries obtain OHSAS 18001 certification. At the end of 2016, six subsidiaries held this certification and four were certified SCC** (SHE Contractor Checklist), VCA** or equivalent.
ªe following graphs indicate the accident frequency and severity rates, along with the rate of occupational diseases and the level of absenteeism.
It should be noted that there may be differences between the measurement methods and criteria used by the different countries and subsidiaries (as each country has its own social regulations).
ªese figures only concern staff recorded as people employed by the Group in 2015 (that is excluding consultants and temporary workers).
ªe scope was identical in 2014 and 2015 but was modified in 2016 with the addition of two subsidiaries:
• Esindus SA (Spain, average workforce 2016: 61.6 people)
• Hamon Polska Sp. Z.o.o. (Poland, average workforce 2016: 13.3 people).
ªis is why, for the indicators given below, the figures for the 2016 scope comparable to that of 2015 (i.e. excluding Esindus and Hamon Polska) are also given when the addition of these two subsidiaries had an impact.
Of the 28 subsidiaries included in this health and safety analysis, three are not consolidated by global integration (Esindus in Spain, Hamon Shriram Cottrell in India and Hamon D’Hondt Middle East in Saudi Arabia); together, they employed 238 people in 2016). ªey are, however, included in the analysis. ªe remaining 25 subsidiaries employed 1,624 people (average staff numbers in 2016), or 97% of the Group’s workforce. See the Parameters section of the report for more details on this subject.
Hamon does not have this information for contractors working on construction sites.
Hamon has not implemented a global action plan at Group level for health and safety; however, many entities have a local action plan.
47 — CORPORATE SOCIAL RESPONSIBILITY
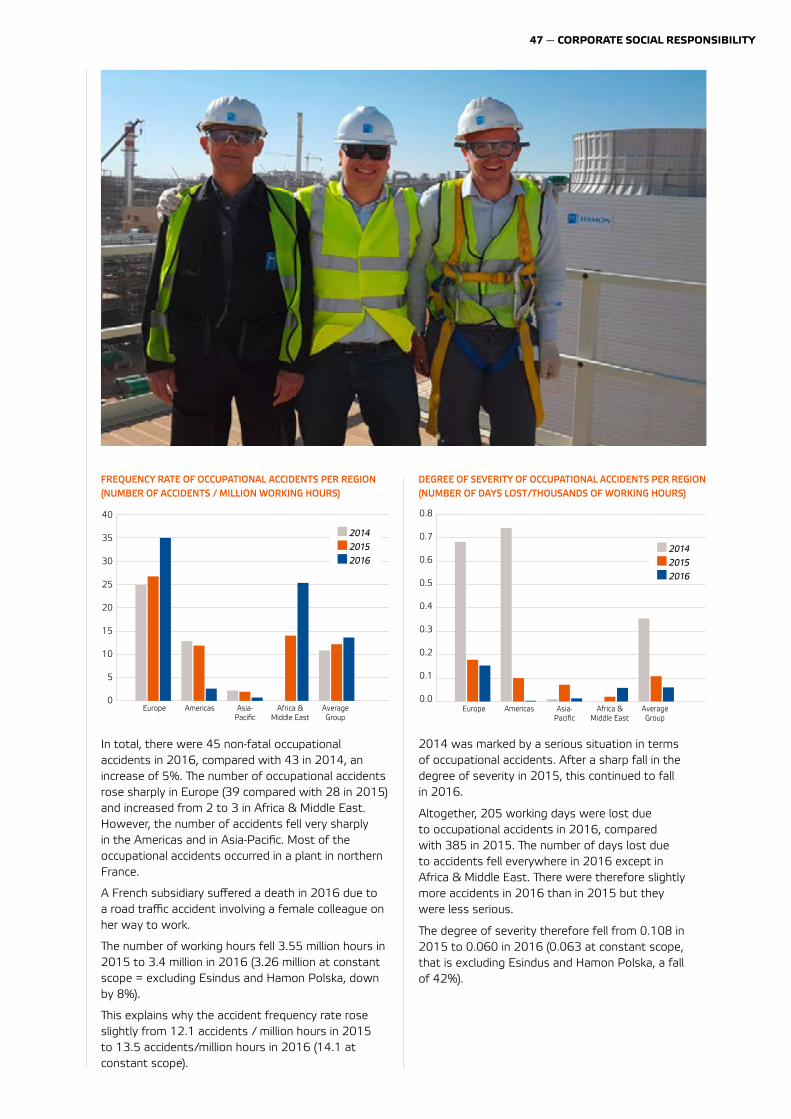
FREQUENCY RATE OF OCCUPATIONAL ACCIDENTS PER REGION (NUMBER OF ACCIDENTS / MILLION WORKING HOURS)
40
35
30
25
20
15
10
5
0Europe Americas Asia-
PacificAfrica &
Middle EastAverage Group
2014 2015 2016
In total, there were 45 non-fatal occupational accidents in 2016, compared with 43 in 2014, an increase of 5%. ªe number of occupational accidents rose sharply in Europe (39 compared with 28 in 2015) and increased from 2 to 3 in Africa & Middle East. However, the number of accidents fell very sharply in the Americas and in Asia-Pacific. Most of the occupational accidents occurred in a plant in northern France.
A French subsidiary suffered a death in 2016 due to a road traffic accident involving a female colleague on her way to work.
ªe number of working hours fell 3.55 million hours in 2015 to 3.4 million in 2016 (3.26 million at constant scope = excluding Esindus and Hamon Polska, down by 8%).
ªis explains why the accident frequency rate rose slightly from 12.1 accidents / million hours in 2015 to 13.5 accidents/million hours in 2016 (14.1 at constant scope).
DEGREE OF SEVERITY OF OCCUPATIONAL ACCIDENTS PER REGION (NUMBER OF DAYS LOST/THOUSANDS OF WORKING HOURS)
0.8
0.7
0.6
0.5
0.4
0.3
0.2
0.1
0.0Europe Americas Asia-
PacificAfrica &
Middle EastAverage Group
2014 2015 2016
2014 was marked by a serious situation in terms of occupational accidents. After a sharp fall in the degree of severity in 2015, this continued to fall in 2016.
Altogether, 205 working days were lost due to occupational accidents in 2016, compared with 385 in 2015. ªe number of days lost due to accidents fell everywhere in 2016 except in Africa & Middle East. ªere were therefore slightly more accidents in 2016 than in 2015 but they were less serious.
ªe degree of severity therefore fell from 0.108 in 2015 to 0.060 in 2016 (0.063 at constant scope, that is excluding Esindus and Hamon Polska, a fall of 42%).
48 — HAMON ANNUAL REPORT 2016
RATE OF OCCUPATIONAL DISEASES RATE PER REGION (NUMBER OF DAYS LOST / THOUSANDS OF HOURS WORK)
0.35
0.30
0.25
0.20
0.15
0.10
0.05
0.00Europe Americas Asia-
PacificAfrica &
Middle EastAverage Group
2014 2015 2016
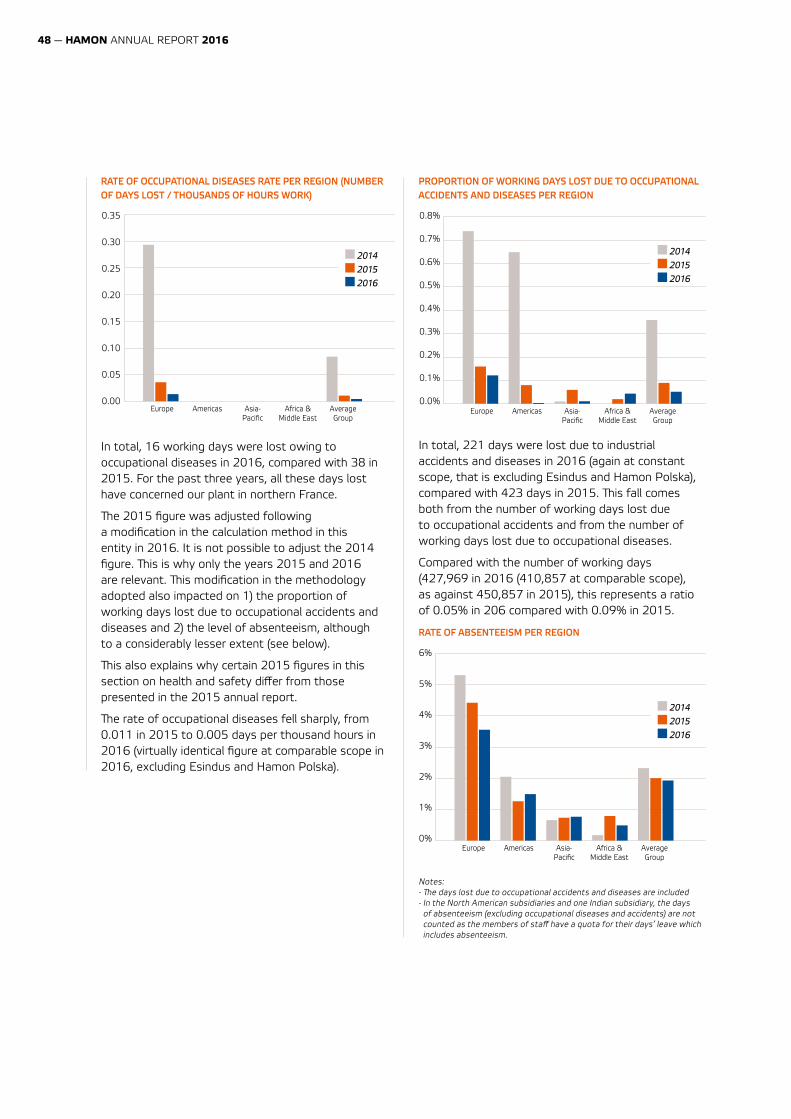
In total, 16 working days were lost owing to occupational diseases in 2016, compared with 38 in 2015. For the past three years, all these days lost have concerned our plant in northern France.
ªe 2015 figure was adjusted following a modification in the calculation method in this entity in 2016. It is not possible to adjust the 2014 figure. ªis is why only the years 2015 and 2016 are relevant. ªis modification in the methodology adopted also impacted on 1) the proportion of working days lost due to occupational accidents and diseases and 2) the level of absenteeism, although to a considerably lesser extent (see below).
ªis also explains why certain 2015 figures in this section on health and safety differ from those presented in the 2015 annual report.
ªe rate of occupational diseases fell sharply, from 0.011 in 2015 to 0.005 days per thousand hours in 2016 (virtually identical figure at comparable scope in 2016, excluding Esindus and Hamon Polska).
PROPORTION OF WORKING DAYS LOST DUE TO OCCUPATIONAL ACCIDENTS AND DISEASES PER REGION
0.8%
0.7%
0.6%
0.5%
0.4%
0.3%
0.2%
0.1%
0.0%Europe Americas Asia-
PacificAfrica &
Middle EastAverage Group
2014 2015 2016
In total, 221 days were lost due to industrial accidents and diseases in 2016 (again at constant scope, that is excluding Esindus and Hamon Polska), compared with 423 days in 2015. ªis fall comes both from the number of working days lost due to occupational accidents and from the number of working days lost due to occupational diseases.
Compared with the number of working days (427,969 in 2016 (410,857 at comparable scope), as against 450,857 in 2015), this represents a ratio of 0.05% in 206 compared with 0.09% in 2015.
RATE OF ABSENTEEISM PER REGION
6%
5%
4%
3%
2%
1%
0%Europe Americas Asia-
PacificAfrica &
Middle EastAverage Group
2014 2015 2016
Notes:- ªe days lost due to occupational accidents and diseases are included- In the North American subsidiaries and one Indian subsidiary, the days of absenteeism (excluding occupational diseases and accidents) are not counted as the members of staff have a quota for their days’ leave which includes absenteeism.
49 — CORPORATE SOCIAL RESPONSIBILITY
ªe total number of days lost through absenteeism fell from 9,030 in 2015 to 8,229 in 2016 (7,977 at constant scope, down 12%).
Excluding the number of days lost due to occupational accidents and diseases, the number of days lost for absenteeism fell from 8,607 days in 2015 to 8,008 days in 2016 (7,756 days a constant scope, down 10%).
Of this total, 3,240 days are due to 12 long-term illnesses in 2016 in Belgium, France and Brazil, compared with 3,708 days in 2015.
ªe rate of absenteeism fell in 2016, both at Group level and in Europe. Within the Group, it amounted to 1.92% in 2016 (1.94% at constant scope), compared with 2.00% in 2015.
ªe fall in the number of days of absenteeism is partly offset by a fall in the number of working days: 427,969 in 2016 (410,857 days at constant scope), compared with 450,766 in 2015.
3.4. HUMAN RIGHTS
As a signatory to the United Nations Global Compact, Hamon is committed to respecting and ensuring that all its employees and partners respect human rights in their business relationships. ªis commitment reflects the values that the Group strives to convey on a daily basis.
ªe Hamon Code of Ethics has included a chapter on human rights since 2014.
In 2016, Hamon continued to promote ethics and respect for human rights, which lie at the heart of its working relationships, specifically:
• through its participation in the United Nations Global Compact;
• through its commitment to observe the Universal Declaration of Human Rights;
• through its commitment not to employ children;
• through its commitment not to use compulsory or forced labour.
Hamon upholds a number of other human rights issues, such as the fight against discrimination in employment and occupation.
ªrough a questionnaire sent to the Group’s main subsidiaries at the end of every financial year, Hamon seeks to raise awareness of respect for human rights and ensure that each one fully upholds the points included in the Universal Declaration. In 2016, the 28 subsidiaries included in the reporting scope outlined in the Parameters section of the report observed this Declaration (to the extent permitted by the legislation in the respective countries).
50 — HAMON ANNUAL REPORT 2016
PROHIBITING CHILD LABOUR
ªis issue is especially relevant, as regards our business activities and as a signatory to the United Nations Global Compact, both:
• internally: for our subsidiaries located in emerging countries, particularly those with plants in India or China;
• externally: as regards our suppliers located in emerging countries (and in particular plants that manufacture components).
ªe Group policy on respect for human rights specifically states that Hamon rules out all forms of child labour.
ªis point is also included in the annual questionnaire sent to the main subsidiaries. In 2016, one of the 28 subsidiaries consulted employed people under 18 years of age: this was one of the Group’s plants in France, which welcomed a trainee aged 14 for four days and an apprentice aged 16 for four weeks to help with their training.
As regards our suppliers, our general terms and conditions of purchase, which are being applied increasingly systematically by the Group’s subsidiaries, contain a number of clauses on respect for the social regulations in force and in particular the ban on employing children. ªey also call for our suppliers to pass on these concerns throughout their supply chain.
New suppliers or recurring suppliers of a significant size are assessed by means of a qualifying questionnaire and are regularly audited.
PREVENTING ALL FORCED LABOUR
As with child labour, Hamon prohibits any form of forced or compulsory labour and remains vigilant in this matter in all the geographic regions where the Group operates and in particular in the plants in emerging countries (India and China).
Similarly, outside its direct scope of operation, as far as possible Hamon remains vigilant with regard to its suppliers located in emerging countries and particularly those with plants that manufacture certain components for the Group.
ªe Group’s human rights policy, disseminated via our Code of Ethics, specifically prohibits forced or compulsory labour.
ªe annual questionnaire sent to the Group’s main subsidiaries asks them to be vigilant in their field of operation.
In 2016, no incidents of this nature were reported by Hamon’s subsidiaries.
Hamon has also ensured that this requirement is included in its general terms and conditions of purchase.
ªe Group’s new suppliers or recurring suppliers of a significant size are assessed and audited in this respect.
Hamon seeks to raise awareness of the issues of both child labour and compulsory labour, not only among its own suppliers but also among all parties involved farther up its supply chain.
GRIEVANCES CONCERNING HUMAN RIGHTS VIOLATIONS
In the event of any dispute concerning human rights violations involving the Group’s activities and its relations with other companies (for example in our supply chain: customers or suppliers), staff members or other individuals, an alarm is sounded.
For Hamon, this is a key performance indicator.
ªis issue is included in the questionnaire sent by the Group’s Legal Department to all large subsidiaries in order to check whether they have been involved in any dispute of this nature over the past financial year.
In 2016, no human rights grievances were filed, investigated or settled via official grievance settlement mechanisms:
• no grievances filed;
• no grievances investigated;
• no grievances previously filed and settled in 2016.
3.5. FIGHT AGAINST CORRUPTION
ªe Hamon Group manages its affairs transparently and ethically. It adopts a zero tolerance policy towards corruption.
ªis is clearly stated in the Code of Ethics, drafted in 2009 and reviewed at the end of 2014. A specific chapter is dedicated to this issue.
ªis Code has gradually been shared with all the Group’s subsidiaries, which circulate it among all their employees. At the end of 2016, all the employees of the 28 subsidiaries included in the reporting scope had received or had access to this Code of Ethics. ªe entire Hamon & Cie Board of Directors as well as the members of the Executive Committee have also received it. In many of the subsidiaries, newly recruited employees receive it along with a copy of the internal working regulations.
No cases of corruption were noted in the Group in 2016.
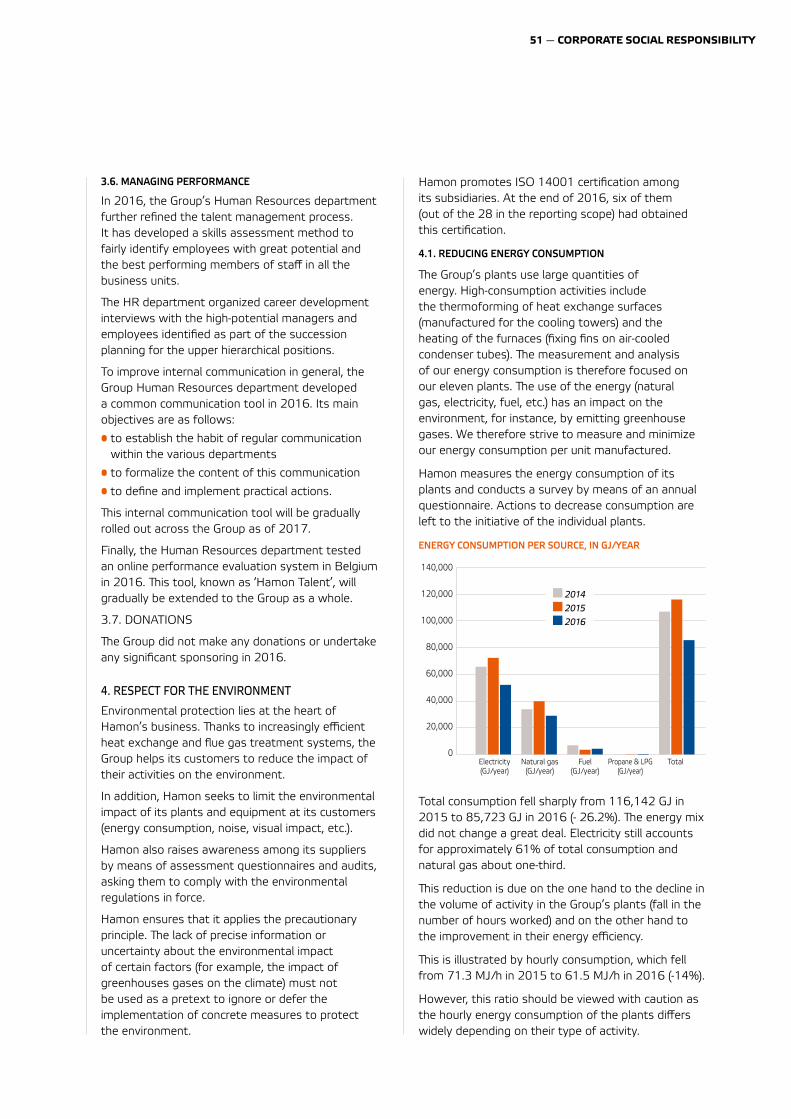
51 — CORPORATE SOCIAL RESPONSIBILITY
3.6. MANAGING PERFORMANCE
In 2016, the Group’s Human Resources department further refined the talent management process. It has developed a skills assessment method to fairly identify employees with great potential and the best performing members of staff in all the business units.
ªe HR department organized career development interviews with the high-potential managers and employees identified as part of the succession planning for the upper hierarchical positions.
To improve internal communication in general, the Group Human Resources department developed a common communication tool in 2016. Its main objectives are as follows:
• to establish the habit of regular communication within the various departments
• to formalize the content of this communication
• to define and implement practical actions.
ªis internal communication tool will be gradually rolled out across the Group as of 2017.
Finally, the Human Resources department tested an online performance evaluation system in Belgium in 2016. ªis tool, known as ‘Hamon Talent’, will gradually be extended to the Group as a whole.
3.7. DONATIONS
ªe Group did not make any donations or undertake any significant sponsoring in 2016.
4. RESPECT FOR THE ENVIRONMENT
Environmental protection lies at the heart of Hamon’s business. ªanks to increasingly efficient heat exchange and flue gas treatment systems, the Group helps its customers to reduce the impact of their activities on the environment.
In addition, Hamon seeks to limit the environmental impact of its plants and equipment at its customers (energy consumption, noise, visual impact, etc.).
Hamon also raises awareness among its suppliers by means of assessment questionnaires and audits, asking them to comply with the environmental regulations in force.
Hamon ensures that it applies the precautionary principle. ªe lack of precise information or uncertainty about the environmental impact of certain factors (for example, the impact of greenhouses gases on the climate) must not be used as a pretext to ignore or defer the implementation of concrete measures to protect the environment.
Hamon promotes ISO 14001 certification among its subsidiaries. At the end of 2016, six of them (out of the 28 in the reporting scope) had obtained this certification.
4.1. REDUCING ENERGY CONSUMPTION
ªe Group’s plants use large quantities of energy. High-consumption activities include the thermoforming of heat exchange surfaces (manufactured for the cooling towers) and the heating of the furnaces (fixing fins on air-cooled condenser tubes). ªe measurement and analysis of our energy consumption is therefore focused on our eleven plants. ªe use of the energy (natural gas, electricity, fuel, etc.) has an impact on the environment, for instance, by emitting greenhouse gases. We therefore strive to measure and minimize our energy consumption per unit manufactured.
Hamon measures the energy consumption of its plants and conducts a survey by means of an annual questionnaire. Actions to decrease consumption are left to the initiative of the individual plants.
ENERGY CONSUMPTION PER SOURCE, IN GJ/YEAR
140,000
120,000
100,000
80,000
60,000
40,000
20,000
0Electricity (GJ/year)
Natural gas (GJ/year)
Fuel (GJ/year)
Propane & LPG (GJ/year)
Total
2014 2015 2016
Total consumption fell sharply from 116,142 GJ in 2015 to 85,723 GJ in 2016 (- 26.2%). ªe energy mix did not change a great deal. Electricity still accounts for approximately 61% of total consumption and natural gas about one-third.
ªis reduction is due on the one hand to the decline in the volume of activity in the Group’s plants (fall in the number of hours worked) and on the other hand to the improvement in their energy efficiency.
ªis is illustrated by hourly consumption, which fell from 71.3 MJ/h in 2015 to 61.5 MJ/h in 2016 (-14%).
However, this ratio should be viewed with caution as the hourly energy consumption of the plants differs widely depending on their type of activity.
52 — HAMON ANNUAL REPORT 2016
Hamon is unable to distinguish what proportion of electrical energy is generated using renewable sources. ªe other sources of energy (natural gas, fuel, propane, LPG) are not renewable.
In 2016, the 11 plants did not buy any heat, steam or cooling. Likewise, they did not sell any electricity, heat, steam or cooling.
Further to European Directive 2012/27 on energy efficiency, certain subsidiaries of the Group in Belgium and Germany, considered to be large enterprises, started the energy audit of their buildings at the end of 2016 with the assistance of approved consultants. ªese audits are expected to be completed during the course of 2017.
4.2. MINIMIZING WATER CONSUMPTION
ªe Hamon plants use a large quantity of water, for instance for sanitary facilities, to cool certain machines and for hydrostatic tests. Water consumption (and the wastewater generated) impacts on the environment. We therefore strive to measure and minimize our water consumption.
As with energy consumption, Hamon measures the water consumption of its eleven plants by means of an annual questionnaire. Each plant puts in place measures on a case-by-case basis to reduce this consumption or its impact.
TOTAL MAINS WATER CONSUMPTION (M³/YEAR)
45 000
40 000
35 000
30 000
25 000
20 000
15 000
10 000
5 000
02014 2015 2016
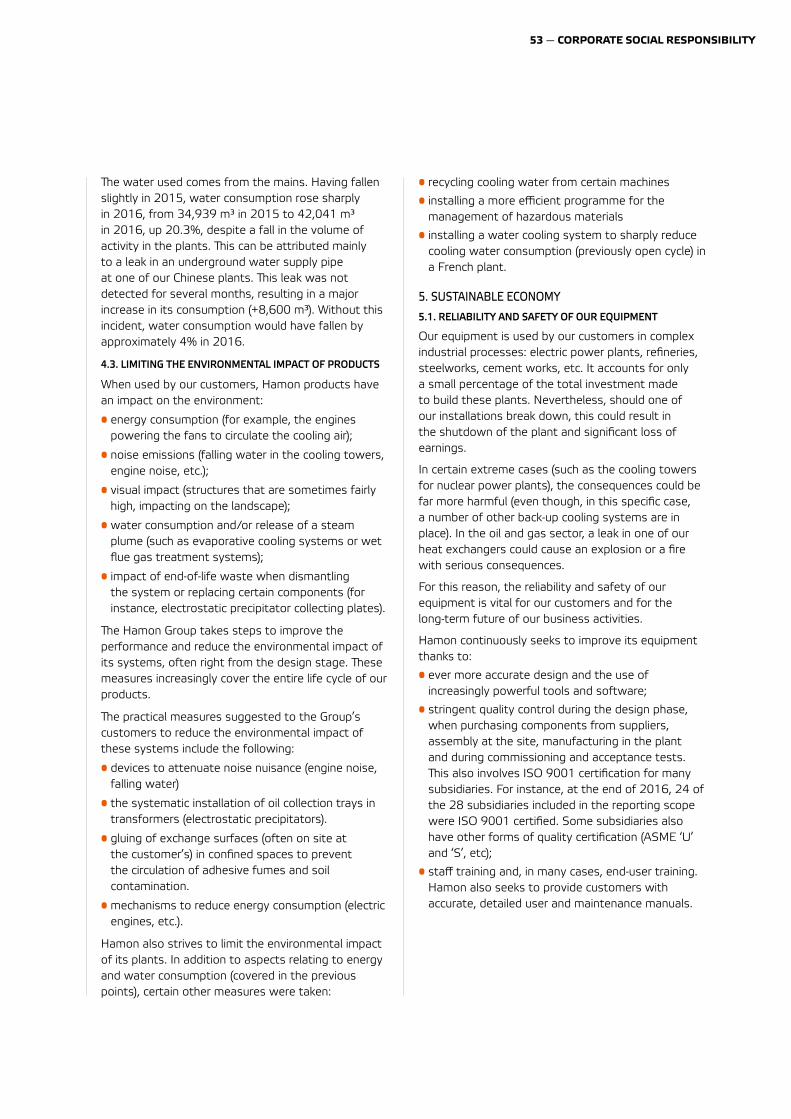
53 — CORPORATE SOCIAL RESPONSIBILITY
ªe water used comes from the mains. Having fallen slightly in 2015, water consumption rose sharply in 2016, from 34,939 m³ in 2015 to 42,041 m³ in 2016, up 20.3%, despite a fall in the volume of activity in the plants. ªis can be attributed mainly to a leak in an underground water supply pipe at one of our Chinese plants. ªis leak was not detected for several months, resulting in a major increase in its consumption (+8,600 m³). Without this incident, water consumption would have fallen by approximately 4% in 2016.
4.3. LIMITING THE ENVIRONMENTAL IMPACT OF PRODUCTS
When used by our customers, Hamon products have an impact on the environment:
• energy consumption (for example, the engines powering the fans to circulate the cooling air);
• noise emissions (falling water in the cooling towers, engine noise, etc.);
• visual impact (structures that are sometimes fairly high, impacting on the landscape);
• water consumption and/or release of a steam plume (such as evaporative cooling systems or wet flue gas treatment systems);
• impact of end-of-life waste when dismantling the system or replacing certain components (for instance, electrostatic precipitator collecting plates).
ªe Hamon Group takes steps to improve the performance and reduce the environmental impact of its systems, often right from the design stage. ªese measures increasingly cover the entire life cycle of our products.
ªe practical measures suggested to the Group’s customers to reduce the environmental impact of these systems include the following:
• devices to attenuate noise nuisance (engine noise, falling water)
• the systematic installation of oil collection trays in transformers (electrostatic precipitators).
• gluing of exchange surfaces (often on site at the customer’s) in confined spaces to prevent the circulation of adhesive fumes and soil contamination.
• mechanisms to reduce energy consumption (electric engines, etc.).
Hamon also strives to limit the environmental impact of its plants. In addition to aspects relating to energy and water consumption (covered in the previous points), certain other measures were taken:
• recycling cooling water from certain machines
• installing a more efficient programme for the management of hazardous materials
• installing a water cooling system to sharply reduce cooling water consumption (previously open cycle) in a French plant.
5. SUSTAINABLE ECONOMY
5.1. RELIABILITY AND SAFETY OF OUR EQUIPMENT
Our equipment is used by our customers in complex industrial processes: electric power plants, refineries, steelworks, cement works, etc. It accounts for only a small percentage of the total investment made to build these plants. Nevertheless, should one of our installations break down, this could result in the shutdown of the plant and significant loss of earnings.
In certain extreme cases (such as the cooling towers for nuclear power plants), the consequences could be far more harmful (even though, in this specific case, a number of other back-up cooling systems are in place). In the oil and gas sector, a leak in one of our heat exchangers could cause an explosion or a fire with serious consequences.
For this reason, the reliability and safety of our equipment is vital for our customers and for the long-term future of our business activities.
Hamon continuously seeks to improve its equipment thanks to:
• ever more accurate design and the use of increasingly powerful tools and software;
• stringent quality control during the design phase, when purchasing components from suppliers, assembly at the site, manufacturing in the plant and during commissioning and acceptance tests. ªis also involves ISO 9001 certification for many subsidiaries. For instance, at the end of 2016, 24 of the 28 subsidiaries included in the reporting scope were ISO 9001 certified. Some subsidiaries also have other forms of quality certification (ASME ‘U’ and ‘S’, etc);
• staff training and, in many cases, end-user training. Hamon also seeks to provide customers with accurate, detailed user and maintenance manuals.
54 — HAMON ANNUAL REPORT 2016
Hamon’s installations have fairly long life spans (often 20 to 30 years or even longer). ªey are usually fitted in plants or power plants that have even longer life cycles and in which some installations or components (including ours) sometimes have to be replaced or renovated after decades.
As we have provided thousands of systems around the world in the past few decades, we are unable to gather and compile information on the reliability and safety of our equipment. Apart from the problem of identifying the right person to contact at the customer’s and making an accurate and comparable analysis regardless of the type of equipment, this sort of information also presents confidentiality issues. ªis is why we do not provide any performance indicators for this aspect.
5.2. HIGH-PERFORMANCE PRODUCTS
ªe performance of our equipment is very important to our customers. It may concern, for example, the temperature of the water leaving our cooling systems, or the level of pollutants at the outlet of our air pollution control systems.
In some cases, such as cooling towers, more efficient installations would offer our customer a direct economic benefit. For instance, colder cooling water helps electricians improve the thermodynamic efficiency of their steam turbines and therefore generate more electricity using the same amount of primary energy.
Our end-user customers not only take into account the investment costs of purchasing our systems, but also the operating costs throughout their life cycle. Increased efficiency therefore improves our competitiveness with our customers and ensures the long-term future of our business.
Hamon continuously seeks to improve the performance of its products. ªis is achieved, in particular, through:
• our Research & Development activities;
• our design methods and tools, helping to further optimize our equipment;
• stringent quality control (see previous point);
• licensing or partnership agreements concluded, enabling us to market cutting-edge technologies (for example the ReACT™ technology – see Review by Business Unit, NAFTA).
As with the analysis of the reliability and safety of our equipment, we are unable to gather, compile or disclose this kind of data.
However, two of our subsidiaries, one in Belgium and one in France, have introduced a means by which customers can assess our systems (satisfaction survey).
5.3. COMPLIANCE WITH SPECIFICATIONS
Compliance with the specifications received from our customers during the tendering process is a very important factor in customer satisfaction as well as for our financial performance in each project. ªis may concern:
• technical specifications (temperatures, pollutant levels, pressure loss, etc.);
• delivery schedules and lead times;
• various constraints or requirements stipulated by our customers (concerning the origin of certain components, logistics considerations, etc.);
• the price.
If necessary, corrective measures are taken, for instance when preliminary or final acceptance tests show that our systems do not fully meet the customer’s specifications, to avoid any warranty claims.
Hamon complies strictly with its customers’ specifications. ªis requires perfect cooperation and flawless work by the many parties involved in the implementation of the project, both internally and with the customer and our suppliers. One person plays a key role here: the project manager. Hamon ensures that projects are allocated to project managers based on their skills and the degree of complexity involved in the project.
In the supplier - Hamon – customer supply chain, problems may sometimes arise, or claims may even be made:
• between the customer and Hamon: for instance, if Hamon fails to meet certain customer requirements;
• between Hamon and the customer: for instance, if the customer changes the specifications during the project;
• between Hamon and its suppliers.
ªe scale of these claims can vary greatly. Some are settled very quickly, while others can lead to legal proceedings. Hamon takes every possible measure to manage this type of complaint quickly.
Bearing in mind that hundreds of projects are managed worldwide every year and given the diversity of this kind of action, Hamon is unable to measure its performance in this area.
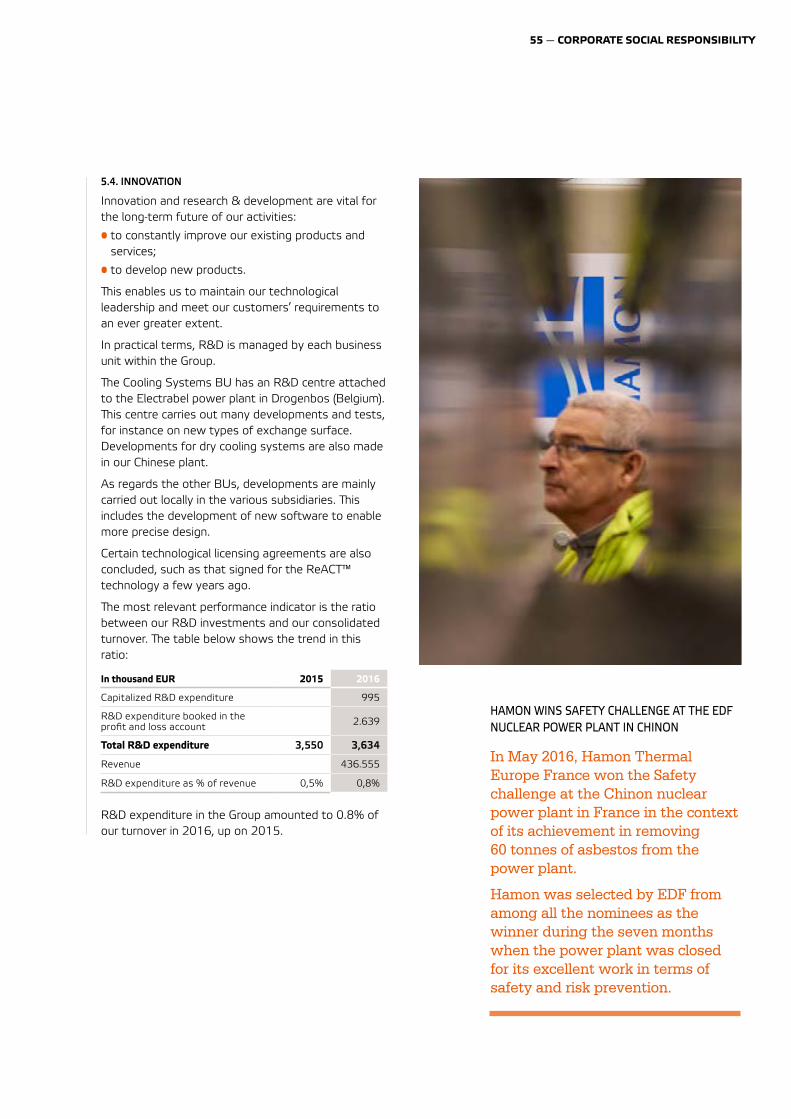
55 — CORPORATE SOCIAL RESPONSIBILITY
5.4. INNOVATION
Innovation and research & development are vital for the long-term future of our activities:
• to constantly improve our existing products and services;
• to develop new products.
ªis enables us to maintain our technological leadership and meet our customers’ requirements to an ever greater extent.
In practical terms, R&D is managed by each business unit within the Group.
ªe Cooling Systems BU has an R&D centre attached to the Electrabel power plant in Drogenbos (Belgium). ªis centre carries out many developments and tests, for instance on new types of exchange surface. Developments for dry cooling systems are also made in our Chinese plant.
As regards the other BUs, developments are mainly carried out locally in the various subsidiaries. ªis includes the development of new software to enable more precise design.
Certain technological licensing agreements are also concluded, such as that signed for the ReACT™ technology a few years ago.
ªe most relevant performance indicator is the ratio between our R&D investments and our consolidated turnover. ªe table below shows the trend in this ratio:
In thousand EUR 2015 2016
Capitalized R&D expenditure 995
R&D expenditure booked in the profit and loss account 2.639
Total R&D expenditure 3,550 3,634
Revenue 436.555
R&D expenditure as % of revenue 0,5% 0,8%
R&D expenditure in the Group amounted to 0.8% of our turnover in 2016, up on 2015.
HAMON WINS SAFETY CHALLENGE AT THE EDF NUCLEAR POWER PLANT IN CHINON
In May 2016, Hamon Thermal Europe France won the Safety challenge at the Chinon nuclear power plant in France in the context of its achievement in removing 60 tonnes of asbestos from the power plant.
Hamon was selected by EDF from among all the nominees as the winner during the seven months when the power plant was closed for its excellent work in terms of safety and risk prevention.
56 — HAMON ANNUAL REPORT 2016
I. THE ADMINISTRATIVE BODY, EXECUTIVE MANAGEMENT AND GOVERNANCE
1. GENERAL CONSIDERATIONS
Hamon has adopted the 2009 Belgian Code of Corporate Governance as its reference, in accordance with the provisions of the act of 6 April 2010, intended to reinforce corporate governance in listed companies and the Royal Decree of 6 June 2010 on the designation of the corporate governance code to be followed by listed companies. ªis code is available for consultation on the website of the Corporate Governance Commission, www.corporategovernancecommittee.be.
ªe Hamon Corporate Governance Charter sets out in detail the governance structure of our company as well as the related policies and procedures. ªis Charter is published on our website, www.hamon.com, and can also be consulted simply upon request at the head office of the company.
ªis Statement of Corporate Governance provides information about corporate governance events that occurred in the last financial period.
Hamon departed from the following provisions of the Code in 2016:
• Principle 4.6: Two directors (the Chairman and the Managing Director) were appointed for a period of five years, whereas the Code recommends a four-year term. Baron Philippe Bodson, beginning his third mandate as an independent director, was appointed by the general meeting on 28 April 2015 for five years, which will enable him to complete the maximum period of 12 years authorized by Article 526ter 2° of the Company Code for an independent director. ªe mandate of Mr Francis Lambilliotte was set at five years in order to bring it into line with the duration of the mandate of Chairman of the Board.
• Principle 4.11: ªe most recent assessment of the Board dates back to 2013. ªe Code states that an assessment should take place every two or three years. ªis matter will be broached by the Board further to its new composition.
• Principle 5.3/6: ªe Appointment Committee met just once in 2016 whereas the Code of Governance requires two meetings. ªere was no need to meet more frequently in 2016.
2. GOVERNANCE STRUCTURE
ªe Group’s governance structure was modified slightly further to the conclusion of the new Shareholders’ Agreement between Sopal International SA and Sogepa on 18 December 2016. ªis new Convention is part of the capital increase in Hamon & Cie of 28 December 2016, after which Sogepa subscribed the amount of EUR 32,650,000 and Sopal International SA EUR 5,050,000. Taking into account the subscriptions which were then collected in the context of the public offer for the capital increase, as at 20 January 2017, Sogepa held 44.23% of the capital in the company (cf. Relations with shareholders, below).
Moreover, the Managing Director, Mr Francis Lambilliotte, informed the general meeting of 16 December 2016 of his wish to step down from his position as CEO which he had held at Hamon for thirty years. From now on, he will focus on the strategy of the Group and will chair the Strategic Committee to be set up as of 1 January 2017. He will also continue to sit on the Board of Directors of the company as Vice-Chairman, with Philippe Bodson remaining Chairman of the Board of Directors.
ªe governance structure of the Group was therefore modified as of 1 January 2017. ªe main changes are as follows:
• ªe composition of the Board of Directors has changed to take account of the increase in the stake held by Sogepa in the capital of Hamon & Cie of 28 December 2016.
• A position of General Manager has been created which will replace the position of managing director previously held by Mr Francis Lambilliotte further to his resignation referred to above.
• ªe Appointment and Remuneration Committees set up in 2005 have been combined to form a single Committee, the ‘Appointment and Remuneration Committee’.
• A Strategic Committee has been set up to inform the Board of (i) the potential and development of markets and products and the position of the competition; (ii) the validity of the industrial hypotheses used as a basis for financial forecasts and (iii) the Group’s products/markets strategy.
ªe various modifications are explained in greater detail in the text below, at the point where they apply.
statement of corporate governance
57 — STATEMENT OF CORPORATE GOVERNANCE
Otherwise, the general shareholders’ meeting exercises the powers assigned to it by law and by the articles of association.
Finally, Hamon is divided into operational business units, represented on the Executive Committee.
ªe working methods of the various bodies referred to above are laid down in the Corporate Governance Charter, which is available on the Hamon website.
3. THE BOARD OF DIRECTORS
Hamon is governed by a Board of Directors which, in accordance with Articles 14 ff. of the articles of association, has extensive powers.
ªe Board of Directors is a collegial body whose actions must be presented in an annual report to the general meeting.
More specifically, the Board of Directors is charged with:
(i) defining the general policy direction of the company and its subsidiaries
(ii) taking decisions on all major strategic, financial and operational issues in the company and
(iii) dealing with all other matters reserved for the Board of Directors under Belgian law.
ªe articles of association state that the decisions of the Board of Directors are taken by a simple majority of votes and that in the event of a tied vote, the director chairing the Board meeting has the casting vote.
ªe directors, all of whom are now non-executive, discuss the strategy and key policies put forward by the management critically and constructively and contribute towards their development. ªey meticulously assess the performance of the management in achieving the agreed objectives.
3.1. APPOINTMENT - COMPOSITION
ªe members of the Board of Directors are appointed by the general shareholders’ meeting. If it becomes necessary to replace one of the directors, the new director will be chosen from among the candidates presented by the shareholder having proposed the outgoing director.
Directors whose term of office expires remain in position until such time as the general meeting has approved a replacement. ªe general meeting has the power to dismiss a director at any time. Moreover, outgoing directors are eligible for re-election subject to the application of Article 526ter
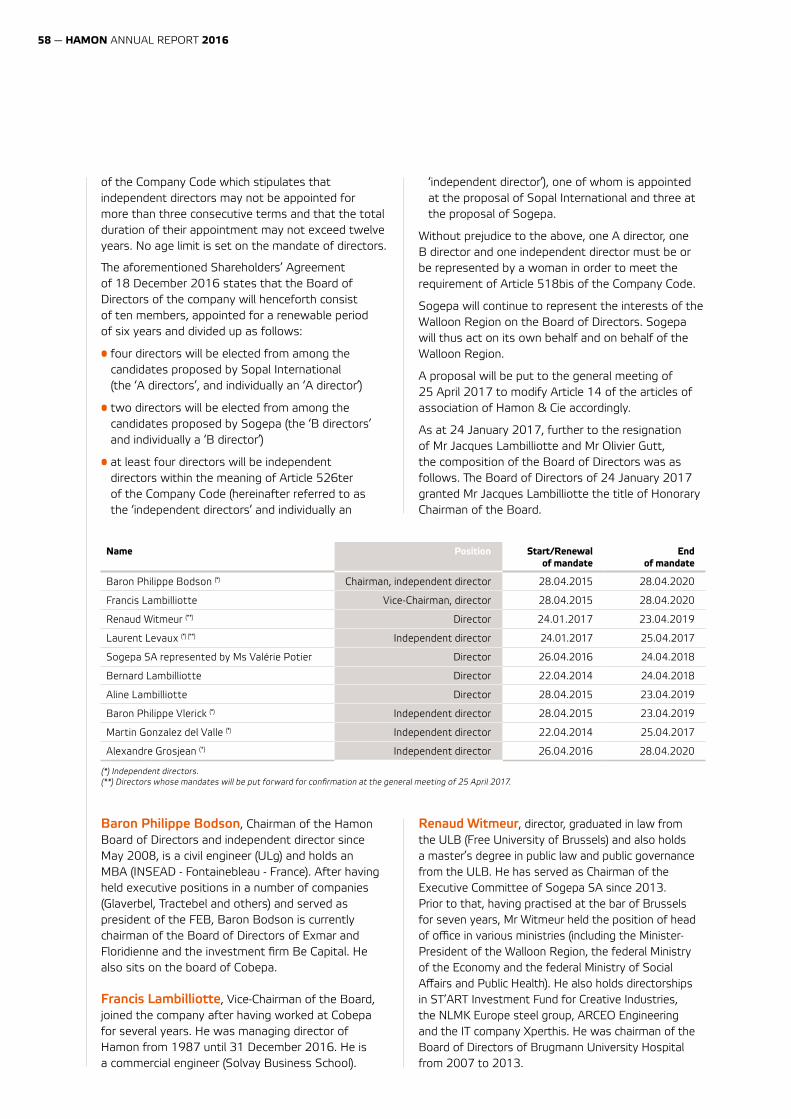
58 — HAMON ANNUAL REPORT 2016
Name Position Start/Renewal of mandate
End of mandate
Baron Philippe Bodson (*) Chairman, independent director 28.04.2015 28.04.2020
Francis Lambilliotte Vice-Chairman, director 28.04.2015 28.04.2020
Renaud Witmeur (**) Director 24.01.2017 23.04.2019
Laurent Levaux (*) (**) Independent director 24.01.2017 25.04.2017
Sogepa SA represented by Ms Valérie Potier Director 26.04.2016 24.04.2018
Bernard Lambilliotte Director 22.04.2014 24.04.2018
Aline Lambilliotte Director 28.04.2015 23.04.2019
Baron Philippe Vlerick (*) Independent director 28.04.2015 23.04.2019
Martin Gonzalez del Valle (*) Independent director 22.04.2014 25.04.2017
Alexandre Grosjean (*) Independent director 26.04.2016 28.04.2020
(*) Independent directors.(**) Directors whose mandates will be put forward for confirmation at the general meeting of 25 April 2017.
Baron Philippe Bodson, Chairman of the Hamon Board of Directors and independent director since May 2008, is a civil engineer (ULg) and holds an MBA (INSEAD - Fontainebleau - France). After having held executive positions in a number of companies (Glaverbel, Tractebel and others) and served as president of the FEB, Baron Bodson is currently chairman of the Board of Directors of Exmar and Floridienne and the investment firm Be Capital. He also sits on the board of Cobepa.
Francis Lambilliotte, Vice-Chairman of the Board, joined the company after having worked at Cobepa for several years. He was managing director of Hamon from 1987 until 31 December 2016. He is a commercial engineer (Solvay Business School).
Renaud Witmeur, director, graduated in law from the ULB (Free University of Brussels) and also holds a master’s degree in public law and public governance from the ULB. He has served as Chairman of the Executive Committee of Sogepa SA since 2013. Prior to that, having practised at the bar of Brussels for seven years, Mr Witmeur held the position of head of office in various ministries (including the Minister-President of the Walloon Region, the federal Ministry of the Economy and the federal Ministry of Social Affairs and Public Health). He also holds directorships in ST’ART Investment Fund for Creative Industries, the NLMK Europe steel group, ARCEO Engineering and the IT company Xperthis. He was chairman of the Board of Directors of Brugmann University Hospital from 2007 to 2013.
of the Company Code which stipulates that independent directors may not be appointed for more than three consecutive terms and that the total duration of their appointment may not exceed twelve years. No age limit is set on the mandate of directors.
ªe aforementioned Shareholders’ Agreement of 18 December 2016 states that the Board of Directors of the company will henceforth consist of ten members, appointed for a renewable period of six years and divided up as follows:
• four directors will be elected from among the candidates proposed by Sopal International (the ‘A directors’, and individually an ‘A director’)
• two directors will be elected from among the candidates proposed by Sogepa (the ‘B directors’ and individually a ‘B director’)
• at least four directors will be independent directors within the meaning of Article 526ter of the Company Code (hereinafter referred to as the ‘independent directors’ and individually an
‘independent director’), one of whom is appointed at the proposal of Sopal International and three at the proposal of Sogepa.
Without prejudice to the above, one A director, one B director and one independent director must be or be represented by a woman in order to meet the requirement of Article 518bis of the Company Code.
Sogepa will continue to represent the interests of the Walloon Region on the Board of Directors. Sogepa will thus act on its own behalf and on behalf of the Walloon Region.
A proposal will be put to the general meeting of 25 April 2017 to modify Article 14 of the articles of association of Hamon & Cie accordingly.
As at 24 January 2017, further to the resignation of Mr Jacques Lambilliotte and Mr Olivier Gutt, the composition of the Board of Directors was as follows. ªe Board of Directors of 24 January 2017 granted Mr Jacques Lambilliotte the title of Honorary Chairman of the Board.
59 — STATEMENT OF CORPORATE GOVERNANCE
Laurent Levaux, independent director, graduated in applied economics from the Catholic University of Louvain and holds an MBA from the University of Chicago in the USA. Having turned around and run an SME in the Liège region, he continued his career at McKinsey from 1985 to 1994. He was then CEO of the CMI group for eight years, then CEO of ABX Logistics for six years. He has been Chairman of Aviapartner since 2008. Mr Levaux also holds directorships with BPost, Proximus and Groupe Herstal and is Chairman of the Board of Directors at Investsud.
Valérie Potier was appointed as Sogepa representative by the general meeting of 28 April 2015. She therefore represents the interests of the Walloon Region on the Board. She has a degree in Commercial Sciences from HEC Liège (General and International Management with financial options) and has worked as a financial analyst at SWIFT and then as a manager at Ernst & Young, company auditors. She joined Sogepa in 2011 as a consultant. She is currently Consultant and Head of Finance, Budget and Accounting. Ms Potier was appointed as a director at the proposal of Sogepa in accordance with the terms of the Shareholders’ Convention of 8 October 2014 concluded between Sopal and the Walloon Region and in the presence of the company.
Bernard Lambilliotte, director, is a commercial engineer (Solvay Business School) and holds an MBA (INSEAD-Fontainebleau-France). He is currently Chief Investment Officer at Ecofin, an investment fund (based in London), which he founded. He is also a director of Kapitol S.A. He previously held various financial positions at Pictet & Cie, Swiss Bank Corporation and Drexel Burnham Lambert. Bernard Lambilliotte is the brother of Francis Lambilliotte.
Aline Lambilliotte was appointed as a director at the general meeting of 28 April 2015. She has a degree in Economic Sciences from the ULB as well as a Master of Arts in Corporate Communication from the City University of New York. Her professional experience lies mainly in project management and editorial work. She is a director of Air Industrie ªermique and Esindus. Aline Lambilliotte is the daughter of Francis Lambilliotte.
Baron Philippe Vlerick, independent director since 6 December 2011, holds a Bachelor’s degree in Philosophy, a law degree and a Master’s degree from the Vlerick School of Management as well as an MBA (Indiana University, Bloomington-USA). Baron Vlerick, who heads the Vlerick Group (Uco, B.I.C. Carpets, Vlerick Vastgoed, etc.) is the chairman of Pentahold, vice-chairman of the boards of directors of KBC Groep, Spector Photo Group and Corelio
and a director of several companies, including Besix Group, Etex and Exmar.
Martin Gonzalez del Valle, independent director since June 2005. He is co-founder and partner of Realza Capital, one of the largest private equity firms in Spain. Prior to that, for twelve years he worked in the private equity sector as a partner and CFO of Investindustrial in Plain and as Senior Director and member of the Executive Committee of Mercapital. He was previously general manager of Crédit Agricole Indosuez in Madrid and held various positions in capital goods and sanitary goods companies.
He is chairman of the board of directors of Esindus (non-executive mandate) and director of the listed Spanish company Iberpapel SA. He has a law degree from the University of Madrid and holds an MBA (Insead-Fontainebleau-France).
Alexandre Grosjean was appointed by the extraordinary general meeting of 7 October 2015 further to the resignation of Mr Jean Hamon as an independent director. He is a commercial engineer (Solvay Business School). He has worked in the banking sector since the start of his career, with various institutions: Kredietbank, Crédit Lyonnais, Duménil-Lebblé, Caisse Privée Banque where he was a member of the Management Committee and a director and finally ING where he was a Consultant, Private and Corporate banking (family business). He is currently Senior Adviser in the Intuitae Group. He is also chairman and managing director of the Galeries Royales Saint- Hubert, director and member of the Audit Committee of N.V SCR-Sibelco and a director of various companies, including Immoklaar, Floriges and others.
3.2 CHAIRMAN/VICE-CHAIRMAN
In accordance with the Shareholders’ Agreement of 18 December 2016, the Chairman of the Board of Directors is chosen by the independent directors.
ªe aforementioned Shareholders’ Agreement states that for the next three years, the Chairman of the Board of Directors will be Baron Philippe Bodson.
ªe Vice-Chairman of the Board is chosen by the A directors.
Mr Francis Lambilliotte has been Vice-Chairman since 1 January 2017.
3.3 ACTIVITIES
ªe Board of Directors met eight times in 2016.
ªe main subjects discussed were:
( i ) the approval of the results of the Group, forecast results and annual budgets;
( ii ) monitoring of business and the financial situation of the Group and some of its subsidiaries;
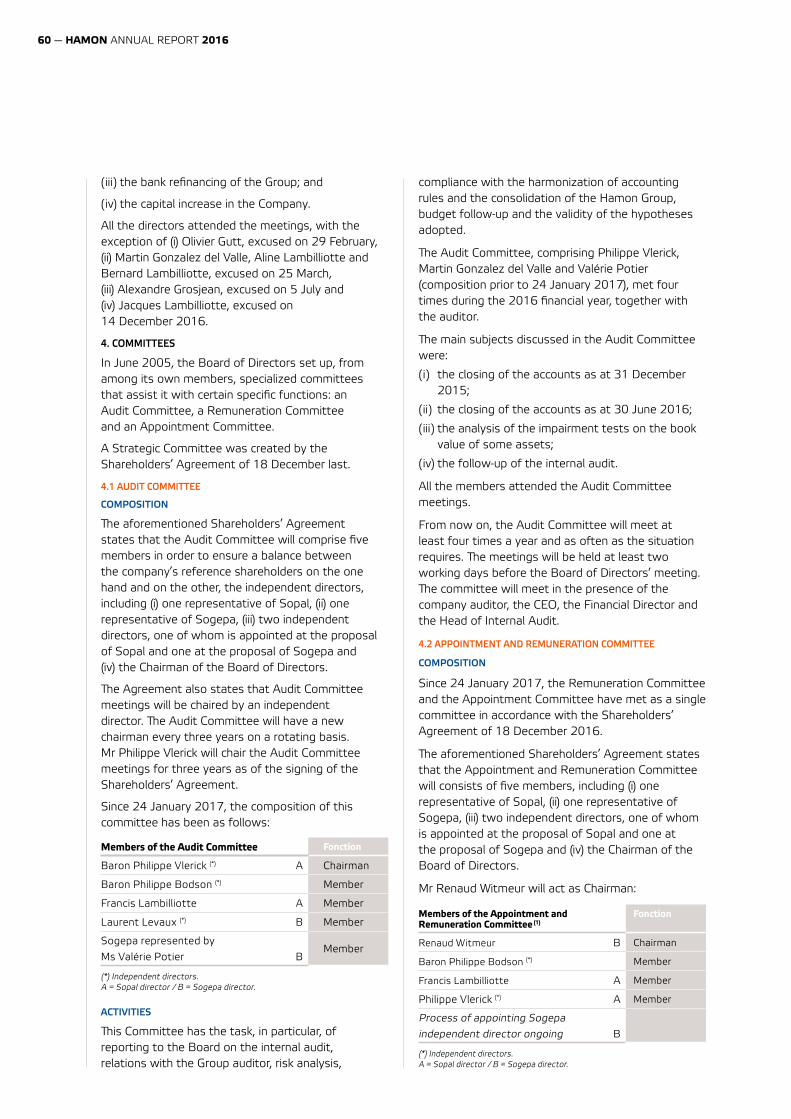
60 — HAMON ANNUAL REPORT 2016
( iii ) the bank refinancing of the Group; and
( iv ) the capital increase in the Company.
All the directors attended the meetings, with the exception of (i) Olivier Gutt, excused on 29 February, (ii) Martin Gonzalez del Valle, Aline Lambilliotte and Bernard Lambilliotte, excused on 25 March, (iii) Alexandre Grosjean, excused on 5 July and (iv) Jacques Lambilliotte, excused on 14 December 2016.
4. COMMITTEES
In June 2005, the Board of Directors set up, from among its own members, specialized committees that assist it with certain specific functions: an Audit Committee, a Remuneration Committee and an Appointment Committee.
A Strategic Committee was created by the Shareholders’ Agreement of 18 December last.
4.1 AUDIT COMMITTEE
COMPOSITION
ªe aforementioned Shareholders’ Agreement states that the Audit Committee will comprise five members in order to ensure a balance between the company’s reference shareholders on the one hand and on the other, the independent directors, including (i) one representative of Sopal, (ii) one representative of Sogepa, (iii) two independent directors, one of whom is appointed at the proposal of Sopal and one at the proposal of Sogepa and (iv) the Chairman of the Board of Directors.
ªe Agreement also states that Audit Committee meetings will be chaired by an independent director. ªe Audit Committee will have a new chairman every three years on a rotating basis. Mr Philippe Vlerick will chair the Audit Committee meetings for three years as of the signing of the Shareholders’ Agreement.
Since 24 January 2017, the composition of this committee has been as follows:
Members of the Audit Committee Fonction
Baron Philippe Vlerick (*) A Chairman
Baron Philippe Bodson (*) Member
Francis Lambilliotte A Member
Laurent Levaux (*) B Member
Sogepa represented by
Ms Valérie Potier BMember
(*) Independent directors. A = Sopal director / B = Sogepa director.
ACTIVITIES
ªis Committee has the task, in particular, of reporting to the Board on the internal audit, relations with the Group auditor, risk analysis,
compliance with the harmonization of accounting rules and the consolidation of the Hamon Group, budget follow-up and the validity of the hypotheses adopted.
ªe Audit Committee, comprising Philippe Vlerick, Martin Gonzalez del Valle and Valérie Potier (composition prior to 24 January 2017), met four times during the 2016 financial year, together with the auditor.
ªe main subjects discussed in the Audit Committee were:
( i ) the closing of the accounts as at 31 December 2015;
( ii ) the closing of the accounts as at 30 June 2016;
( iii ) the analysis of the impairment tests on the book value of some assets;
( iv ) the follow-up of the internal audit.
All the members attended the Audit Committee meetings.
From now on, the Audit Committee will meet at least four times a year and as often as the situation requires. ªe meetings will be held at least two working days before the Board of Directors’ meeting. ªe committee will meet in the presence of the company auditor, the CEO, the Financial Director and the Head of Internal Audit.
4.2 APPOINTMENT AND REMUNERATION COMMITTEE
COMPOSITION
Since 24 January 2017, the Remuneration Committee and the Appointment Committee have met as a single committee in accordance with the Shareholders’ Agreement of 18 December 2016.
ªe aforementioned Shareholders’ Agreement states that the Appointment and Remuneration Committee will consists of five members, including (i) one representative of Sopal, (ii) one representative of Sogepa, (iii) two independent directors, one of whom is appointed at the proposal of Sopal and one at the proposal of Sogepa and (iv) the Chairman of the Board of Directors.
Mr Renaud Witmeur will act as Chairman:
Members of the Appointment and Remuneration Committee (1)
Fonction
Renaud Witmeur B Chairman
Baron Philippe Bodson (*) Member
Francis Lambilliotte A Member
Philippe Vlerick (*) A Member
Process of appointing Sogepa independent director ongoing B
(*) Independent directors.A = Sopal director / B = Sogepa director.
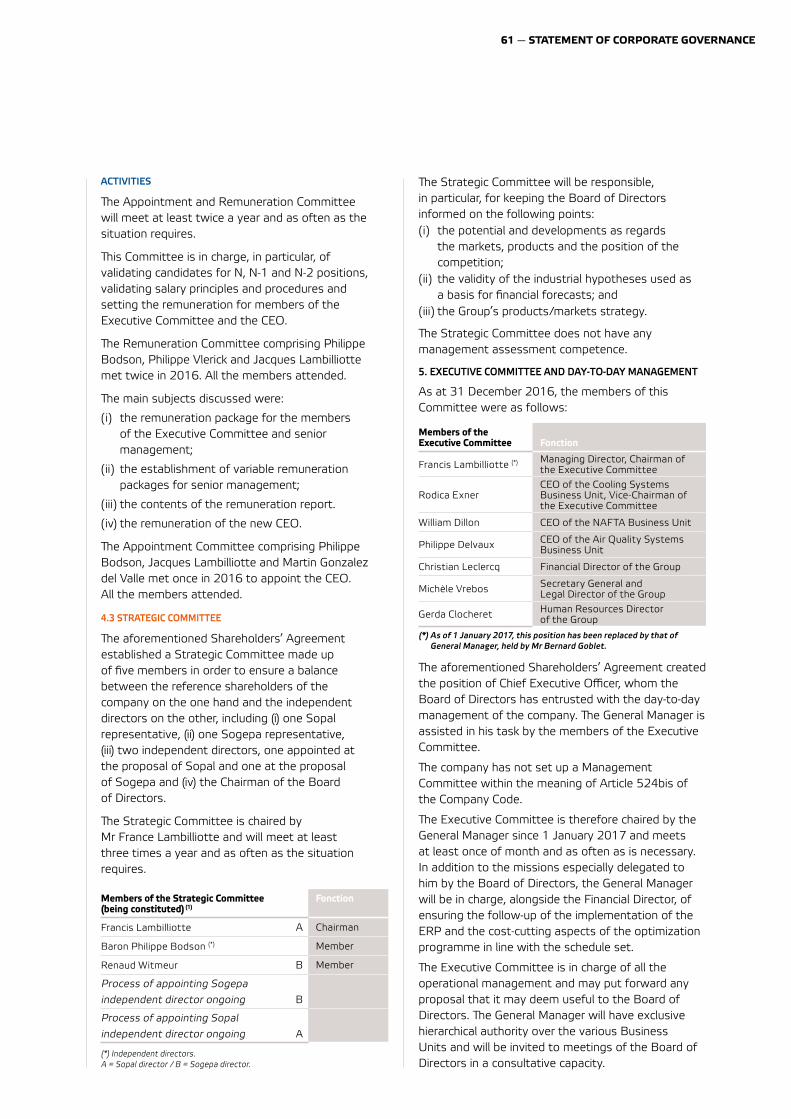
61 — STATEMENT OF CORPORATE GOVERNANCE
ACTIVITIES
ªe Appointment and Remuneration Committee will meet at least twice a year and as often as the situation requires.
ªis Committee is in charge, in particular, of validating candidates for N, N-1 and N-2 positions, validating salary principles and procedures and setting the remuneration for members of the Executive Committee and the CEO.
ªe Remuneration Committee comprising Philippe Bodson, Philippe Vlerick and Jacques Lambilliotte met twice in 2016. All the members attended.
ªe main subjects discussed were:
( i ) the remuneration package for the members of the Executive Committee and senior management;
( ii ) the establishment of variable remuneration packages for senior management;
( iii ) the contents of the remuneration report.
( iv ) the remuneration of the new CEO.
ªe Appointment Committee comprising Philippe Bodson, Jacques Lambilliotte and Martin Gonzalez del Valle met once in 2016 to appoint the CEO. All the members attended.
4.3 STRATEGIC COMMITTEE
ªe aforementioned Shareholders’ Agreement established a Strategic Committee made up of five members in order to ensure a balance between the reference shareholders of the company on the one hand and the independent directors on the other, including (i) one Sopal representative, (ii) one Sogepa representative, (iii) two independent directors, one appointed at the proposal of Sopal and one at the proposal of Sogepa and (iv) the Chairman of the Board of Directors.
ªe Strategic Committee is chaired by Mr France Lambilliotte and will meet at least three times a year and as often as the situation requires.
Members of the Strategic Committee (being constituted) (1)
Fonction
Francis Lambilliotte A Chairman
Baron Philippe Bodson (*) Member
Renaud Witmeur B Member
Process of appointing Sogepa independent director ongoing B
Process of appointing Sopal independent director ongoing A
(*) Independent directors.A = Sopal director / B = Sogepa director.
ªe Strategic Committee will be responsible, in particular, for keeping the Board of Directors informed on the following points:( i ) the potential and developments as regards
the markets, products and the position of the competition;
( ii ) the validity of the industrial hypotheses used as a basis for financial forecasts; and
( iii ) the Group’s products/markets strategy.
ªe Strategic Committee does not have any management assessment competence.
5. EXECUTIVE COMMITTEE AND DAY-TO-DAY MANAGEMENT
As at 31 December 2016, the members of this Committee were as follows:
Members of the Executive Committee
Fonction
Francis Lambilliotte (*) Managing Director, Chairman of the Executive Committee
Rodica ExnerCEO of the Cooling Systems Business Unit, Vice-Chairman of the Executive Committee
William Dillon CEO of the NAFTA Business Unit
Philippe Delvaux CEO of the Air Quality Systems Business Unit
Christian Leclercq Financial Director of the Group
Michèle Vrebos Secretary General and Legal Director of the Group
Gerda Clocheret Human Resources Director of the Group
(*) As of 1 January 2017, this position has been replaced by that of General Manager, held by Mr Bernard Goblet.
ªe aforementioned Shareholders’ Agreement created the position of Chief Executive Officer, whom the Board of Directors has entrusted with the day-to-day management of the company. ªe General Manager is assisted in his task by the members of the Executive Committee.
ªe company has not set up a Management Committee within the meaning of Article 524bis of the Company Code.
ªe Executive Committee is therefore chaired by the General Manager since 1 January 2017 and meets at least once of month and as often as is necessary. In addition to the missions especially delegated to him by the Board of Directors, the General Manager will be in charge, alongside the Financial Director, of ensuring the follow-up of the implementation of the ERP and the cost-cutting aspects of the optimization programme in line with the schedule set.
ªe Executive Committee is in charge of all the operational management and may put forward any proposal that it may deem useful to the Board of Directors. ªe General Manager will have exclusive hierarchical authority over the various Business Units and will be invited to meetings of the Board of Directors in a consultative capacity.
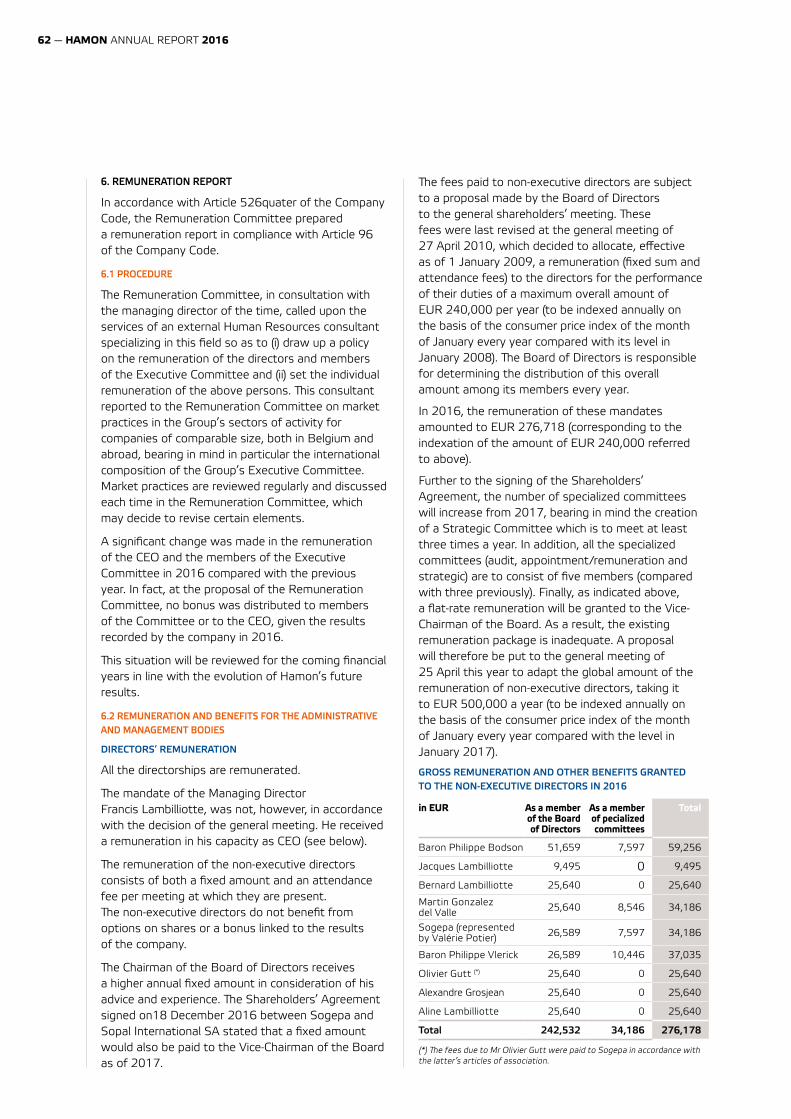
62 — HAMON ANNUAL REPORT 2016
6. REMUNERATION REPORT
In accordance with Article 526quater of the Company Code, the Remuneration Committee prepared a remuneration report in compliance with Article 96 of the Company Code.
6.1 PROCEDURE
ªe Remuneration Committee, in consultation with the managing director of the time, called upon the services of an external Human Resources consultant specializing in this field so as to (i) draw up a policy on the remuneration of the directors and members of the Executive Committee and (ii) set the individual remuneration of the above persons. ªis consultant reported to the Remuneration Committee on market practices in the Group’s sectors of activity for companies of comparable size, both in Belgium and abroad, bearing in mind in particular the international composition of the Group’s Executive Committee. Market practices are reviewed regularly and discussed each time in the Remuneration Committee, which may decide to revise certain elements.
A significant change was made in the remuneration of the CEO and the members of the Executive Committee in 2016 compared with the previous year. In fact, at the proposal of the Remuneration Committee, no bonus was distributed to members of the Committee or to the CEO, given the results recorded by the company in 2016.
ªis situation will be reviewed for the coming financial years in line with the evolution of Hamon’s future results.
6.2 REMUNERATION AND BENEFITS FOR THE ADMINISTRATIVE AND MANAGEMENT BODIES
DIRECTORS’ REMUNERATION
All the directorships are remunerated.
ªe mandate of the Managing Director Francis Lambilliotte, was not, however, in accordance with the decision of the general meeting. He received a remuneration in his capacity as CEO (see below).
ªe remuneration of the non-executive directors consists of both a fixed amount and an attendance fee per meeting at which they are present. ªe non-executive directors do not benefit from options on shares or a bonus linked to the results of the company.
ªe Chairman of the Board of Directors receives a higher annual fixed amount in consideration of his advice and experience. ªe Shareholders’ Agreement signed on18 December 2016 between Sogepa and Sopal International SA stated that a fixed amount would also be paid to the Vice-Chairman of the Board as of 2017.
ªe fees paid to non-executive directors are subject to a proposal made by the Board of Directors to the general shareholders’ meeting. ªese fees were last revised at the general meeting of 27 April 2010, which decided to allocate, effective as of 1 January 2009, a remuneration (fixed sum and attendance fees) to the directors for the performance of their duties of a maximum overall amount of EUR 240,000 per year (to be indexed annually on the basis of the consumer price index of the month of January every year compared with its level in January 2008). ªe Board of Directors is responsible for determining the distribution of this overall amount among its members every year.
In 2016, the remuneration of these mandates amounted to EUR 276,718 (corresponding to the indexation of the amount of EUR 240,000 referred to above).
Further to the signing of the Shareholders’ Agreement, the number of specialized committees will increase from 2017, bearing in mind the creation of a Strategic Committee which is to meet at least three times a year. In addition, all the specialized committees (audit, appointment/remuneration and strategic) are to consist of five members (compared with three previously). Finally, as indicated above, a flat-rate remuneration will be granted to the Vice-Chairman of the Board. As a result, the existing remuneration package is inadequate. A proposal will therefore be put to the general meeting of 25 April this year to adapt the global amount of the remuneration of non-executive directors, taking it to EUR 500,000 a year (to be indexed annually on the basis of the consumer price index of the month of January every year compared with the level in January 2017).
GROSS REMUNERATION AND OTHER BENEFITS GRANTED TO THE NON-EXECUTIVE DIRECTORS IN 2016
in EUR As a member of the Board of Directors
As a member of pecialized committees
Total
Baron Philippe Bodson 51,659 7,597 59,256
Jacques Lambilliotte 9,495 0 9,495
Bernard Lambilliotte 25,640 0 25,640
Martin Gonzalez del Valle 25,640 8,546 34,186
Sogepa (represented by Valérie Potier) 26,589 7,597 34,186
Baron Philippe Vlerick 26,589 10,446 37,035
Olivier Gutt (*) 25,640 0 25,640
Alexandre Grosjean 25,640 0 25,640
Aline Lambilliotte 25,640 0 25,640
Total 242,532 34,186 276,178
(*) ªe fees due to Mr Olivier Gutt were paid to Sogepa in accordance with the latter’s articles of association.
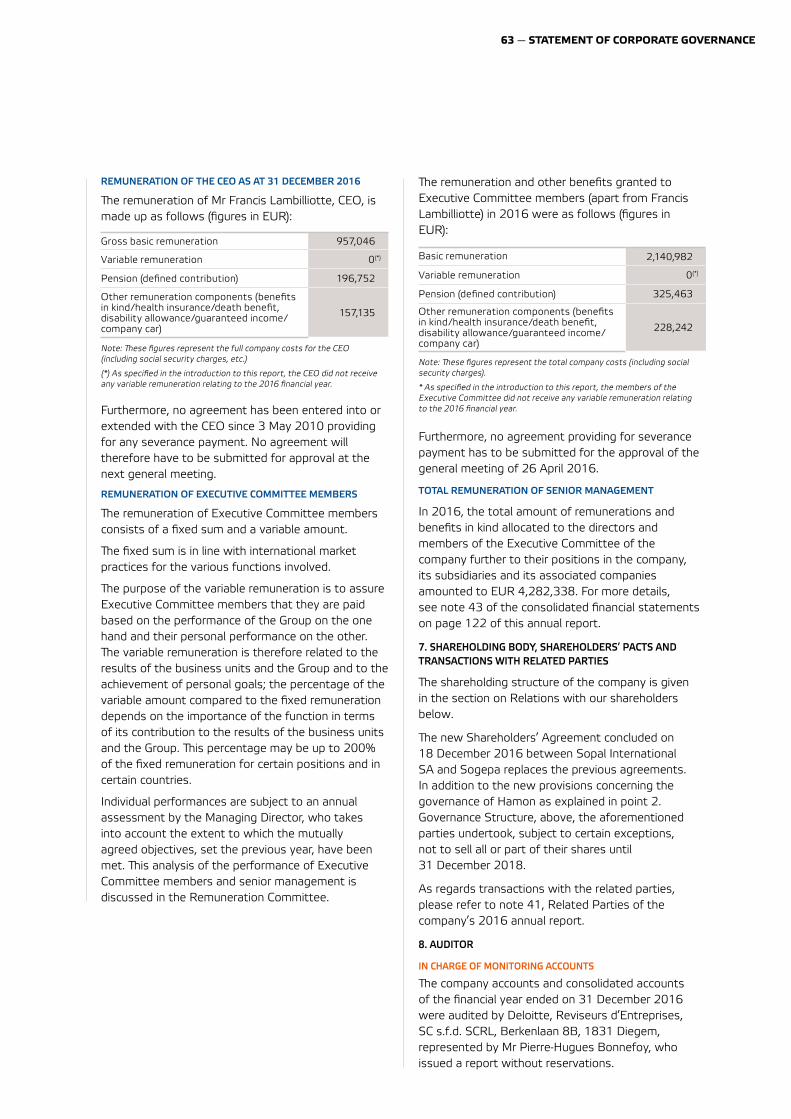
63 — STATEMENT OF CORPORATE GOVERNANCE
REMUNERATION OF THE CEO AS AT 31 DECEMBER 2016
ªe remuneration of Mr Francis Lambilliotte, CEO, is made up as follows (figures in EUR):
Gross basic remuneration 957,046
Variable remuneration 0(*)
Pension (defined contribution) 196,752
Other remuneration components (benefits in kind/health insurance/death benefit, disability allowance/guaranteed income/company car)
157,135
Note: ªese figures represent the full company costs for the CEO (including social security charges, etc.)
(*) As specified in the introduction to this report, the CEO did not receive any variable remuneration relating to the 2016 financial year.
Furthermore, no agreement has been entered into or extended with the CEO since 3 May 2010 providing for any severance payment. No agreement will therefore have to be submitted for approval at the next general meeting.
REMUNERATION OF EXECUTIVE COMMITTEE MEMBERS
ªe remuneration of Executive Committee members consists of a fixed sum and a variable amount.
ªe fixed sum is in line with international market practices for the various functions involved.
ªe purpose of the variable remuneration is to assure Executive Committee members that they are paid based on the performance of the Group on the one hand and their personal performance on the other. ªe variable remuneration is therefore related to the results of the business units and the Group and to the achievement of personal goals; the percentage of the variable amount compared to the fixed remuneration depends on the importance of the function in terms of its contribution to the results of the business units and the Group. ªis percentage may be up to 200% of the fixed remuneration for certain positions and in certain countries.
Individual performances are subject to an annual assessment by the Managing Director, who takes into account the extent to which the mutually agreed objectives, set the previous year, have been met. ªis analysis of the performance of Executive Committee members and senior management is discussed in the Remuneration Committee.
ªe remuneration and other benefits granted to Executive Committee members (apart from Francis Lambilliotte) in 2016 were as follows (figures in EUR):
Basic remuneration 2,140,982
Variable remuneration 0(*)
Pension (defined contribution) 325,463
Other remuneration components (benefits in kind/health insurance/death benefit, disability allowance/guaranteed income/company car)
228,242
Note: ªese figures represent the total company costs (including social security charges).
* As specified in the introduction to this report, the members of the Executive Committee did not receive any variable remuneration relating to the 2016 financial year.
Furthermore, no agreement providing for severance payment has to be submitted for the approval of the general meeting of 26 April 2016.
TOTAL REMUNERATION OF SENIOR MANAGEMENT
In 2016, the total amount of remunerations and benefits in kind allocated to the directors and members of the Executive Committee of the company further to their positions in the company, its subsidiaries and its associated companies amounted to EUR 4,282,338. For more details, see note 43 of the consolidated financial statements on page 122 of this annual report.
7. SHAREHOLDING BODY, SHAREHOLDERS’ PACTS AND TRANSACTIONS WITH RELATED PARTIES
ªe shareholding structure of the company is given in the section on Relations with our shareholders below.
ªe new Shareholders’ Agreement concluded on 18 December 2016 between Sopal International SA and Sogepa replaces the previous agreements. In addition to the new provisions concerning the governance of Hamon as explained in point 2. Governance Structure, above, the aforementioned parties undertook, subject to certain exceptions, not to sell all or part of their shares until 31 December 2018.
As regards transactions with the related parties, please refer to note 41, Related Parties of the company’s 2016 annual report.
8. AUDITOR
IN CHARGE OF MONITORING ACCOUNTS
ªe company accounts and consolidated accounts of the financial year ended on 31 December 2016 were audited by Deloitte, Reviseurs d’Entreprises, SC s.f.d. SCRL, Berkenlaan 8B, 1831 Diegem, represented by Mr Pierre-Hugues Bonnefoy, who issued a report without reservations.
64 — HAMON ANNUAL REPORT 2016
ªe auditor’s mandate was renewed by the general meeting of 22 April 2014 for three years, until the next general meeting of 25 April 2017. It is therefore due to expire. An invitation to tender has been launched among various statutory auditing firms in order to present the possible choice of a new auditor to the general meeting.
REMUNERATION OF THE AUDITOR
ªe fees received by the auditor and its network (Deloitte) for the 2016 financial period for the entire consolidated scope of the Group amounted to EUR 1,293,458.
9. APPROPRIATION OF THE RESULT
ªe company did not pay a dividend for the 2015 financial year and will not pay a dividend for the 2016 financial year.
10. CODE OF CONDUCT
ªe Group had drawn up a Code of Ethics for all its employees covering various aspects including (i) compliance with the legal provisions on insider trading, (ii) prevention of conflicts of interest with the Group, (iii) observance of confidentiality in the exercising of their functions, (iv) correct and proper conduct in the management of business, (v) the fight against corruption, (vi) respect for human rights.
ªis Code aims to increase awareness among employees regarding the need to respect a code of conduct when exercising their professional duties and ensure that all staff members carry out their activities ethically and in compliance with the regulations in force. ªe Code reflects the Group’s determination to maintain a relationship of trust and professionalism with all its stakeholders.
ªis Code of Ethics was updated on 1 December 2014 and is available on the company website, http://www.hamon.com/en/corporate/about-us/ corporate-social-responsibility/
ªe Corporate Governance Charter published on the Hamon website includes a section specifically on insider trading.
11. CONFLICTS OF INTEREST
ªe procedures on conflicts of interest laid down in Articles 523 and 524 of the Company Code were applied in the context of the capital increases undertaken in 2016 to the extent that these were transactions involving Sopal International SA, a company related to Hamon within the meaning of Article 11 of the Company Code.
12. COMPLIANCE WITH THE RULES ON MARKET ABUSE
ªe Board of Directors has drawn up a set of rules governing transactions and the public disclosure of transactions involving shares in the company,
derivatives or other financial instruments linked to them. ªe transaction regulations specify which information concerning these transactions must be disclosed to the market. ªe transaction regulations are laid down in the Corporate Governance Charter.
13. ELEMENTS LIKELY TO IMPACT ON ANY PUBLIC TAKEOVER BID
Article 5bis of the Hamon & Cie articles of association states that the Board of Directors is authorized to increase the company capital once or on several occasions up to the sum of EUR 2,157,441.60.
ªe current available balance of the authorized capital amounts to EUR 1,358,653.5, taking account of the use made in 2015 and 2016 as part of the capital increases undertaken by means of the authorized capital. ªis authorization is limited to five years; it can be renewed once or on several occasions for a maximum period of five years each time, by the general meeting. Capital increases decided upon further to this authorization may be effected in cash or in kind, or by the incorporation of available or unavailable reserves or share premiums, with or without the creation of new shares, whether preferential or not, with or without voting rights and with or without subscription rights. ªis authorization was renewed by the ordinary general meeting of 22 April 2014 for a period of five years, i.e. until the general meeting of 23 April 2019.
In the context of the authorization granted to it by the articles of association, the Board may decide to issue bonds, subscription rights or option rights, just as it may also cancel or limit the preferential rights of existing shareholders in the interests of the company and in accordance with the legal conditions, including in favour of one or more specific individuals or members of staff of the company or related companies.
ªe extraordinary general meeting of Hamon & Cie also expressly authorized the Board of Directors, in the event of a public takeover bid for the shares of the company, to increase the capital by contributions in kind or in cash, limiting or cancelling, if need be, the preferential rights of shareholders, including those in favour of one or more specific individuals.
ªe extraordinary general meeting of 22 April 2014 renewed this authorization for a three-year period until the general meeting of 25 April 2017. A proposal to renew this authorization will be put to the general meeting.
ªe Hamon & Cie articles of association also stipulate that the company is authorized to buy its own shares on the stock market without necessarily making an offer of acquisition to shareholders. ªe Board of Directors is authorized to dispose of company shares
65 — STATEMENT OF CORPORATE GOVERNANCE
through the stock market or in any other way in the cases provided for by law without the prior authorization of the general meeting. ªe Board is also authorized by the extraordinary general meeting to acquire or dispose of company shares to avoid any serious or imminent damage to the company, in accordance with the law. ªe extraordinary general meeting of 22 April 2014 renewed this authorization for a three-year period until the general meeting of 25 April 2017. ªe general meeting will be asked to renew this authorization.
II. INTERNAL AUDITING AND RISK MANAGEMENT SYSTEMS IN THE COMPANY
1. INTRODUCTION
ªe law of 6 April 2010 on strengthening corporate governance stipulates, in the context of the implementation of a European directive, that the declaration on corporate governance must contain a description of the main characteristics of the internal auditing and risk management systems of the company as part of the process of preparing financial information.
In compliance with the provisions of the Code, the elements relating to risks other than those associated with the process of drawing up financial statements are also described.
At the proposal of the Audit Committee, the Hamon Board of Directors approved the use as an initial reference of the proposal drafted by the working group set up by the Corporate Governance Commission of the Federation of Belgian Businesses, the FEB, made up of representatives of listed companies, the Institut des Réviseurs d’Entreprises, and the Institute of Internal Auditors Belgium (IIANel).
Moreover, the Board of Directors requested the Audit Committee to report to it every six months on the implementation of this reference framework and improvements to be made to it.
Hamon has organized its internal auditing and risk management by defining the audit environment (general framework), identifying and classifying the main risks to which it is exposed, analyzing its level of control of these risks and organizing an ‘audit of the audit’. ªe company also focuses particular attention on the reliability of the reporting and financial communication process.
2. THE AUDIT ENVIRONMENT
ROLES AND VALUES OF THE COMPANY
i. A Sustainable Development Charter – included in our 2009 annual report – sets out the basis on which Hamon intends to develop its business, with respect for the environment, human rights, the
local communities among which it operates and its staff. It fosters values such as professionalism, corporate culture, cultural diversity, team spirit and a ‘do it right the first time’ approach. See also the Vision, Mission and Values sections in the Group Profile part of this report.
ii. A Corporate Governance Charter – available for consultation on the website – was drawn up and validated by the Board of Directors. ªis charter clearly defines the role of the various management bodies, their working method and their composition. It should be remembered that Hamon has a Board of Directors and specialized committees: an audit committee, a remuneration and appointment committee and a strategic committee as of 24 January 2017, while the day-to-day management is undertaken by the CEO, assisted by an executive committee.
iii. A Code of Ethics, drawn up for the attention of all employees, as described in Section 10. Code of Conduct on page 32
iv. An internal audit charter was also drawn up at the start of 2016.
RISK CULTURE
Hamon adopts a cautious approach. ªe company manages large-scale projects in various fields of activity, integrating innovative systems that boast cutting-edge technology and effectively meet its customers’ needs, while applying stringent cost control. ªe projects undergo an in-depth risk analysis right from the quote preparation phase to ensure that they will continue to create value in the long term.
CLEAR MISSIONS
i. ªe Hamon structure is based on its business units (BUs), which fulfil a very clear role both in terms of product portfolio and as regards organization and results.
ii. ªe internal organization is set out in charts and each employee has a description of his or her role and of the procedures for delegating authority.
iii. ªe Group also provides support functions for the BUs through the IT, Legal, Corporate Finance, Treasury and Human Resources departments of the parent company.
iv. Control functions:
· Compliance is undertaken by the Secretary General.
· ªe CFO is responsible for organizing risk management and directly supervises the Controlling Team, which is in charge of the Group management control.
· ªe BU managers are responsible for monitoring the industrial risks.
· ªe internal audit function put in place in 2015.
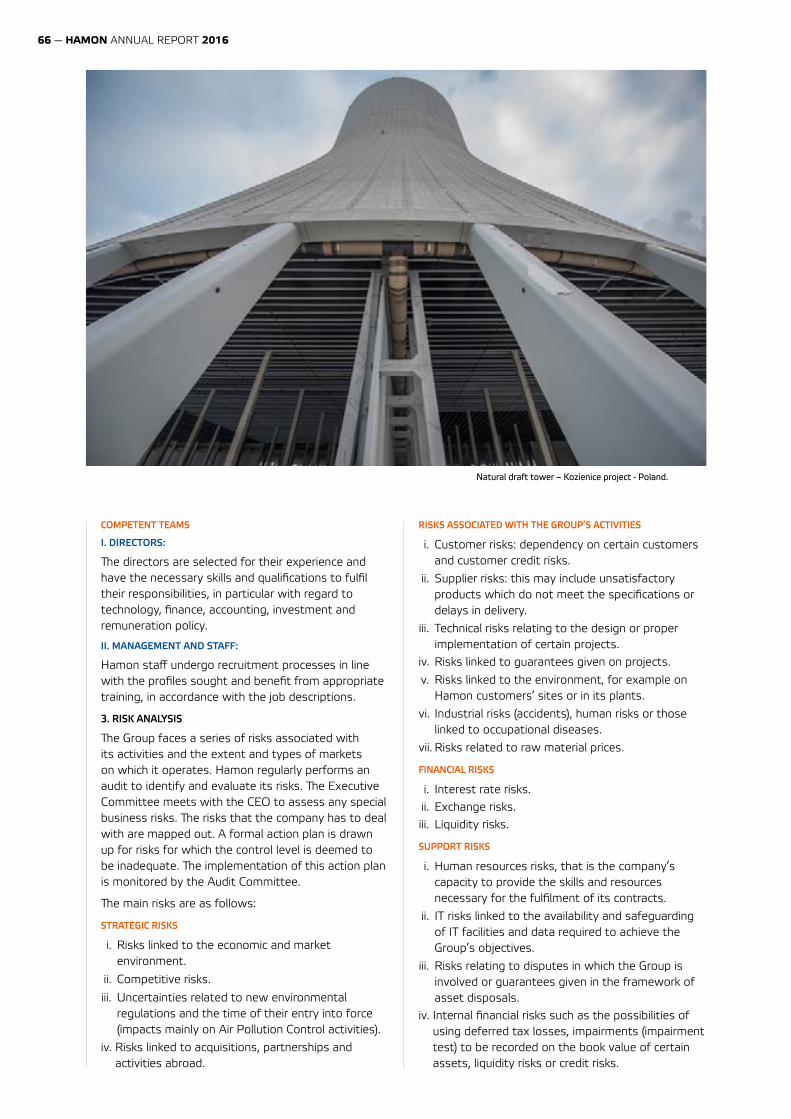
66 — HAMON ANNUAL REPORT 2016
COMPETENT TEAMS
I. DIRECTORS:
ªe directors are selected for their experience and have the necessary skills and qualifications to fulfil their responsibilities, in particular with regard to technology, finance, accounting, investment and remuneration policy.
II. MANAGEMENT AND STAFF:
Hamon staff undergo recruitment processes in line with the profiles sought and benefit from appropriate training, in accordance with the job descriptions.
3. RISK ANALYSIS
ªe Group faces a series of risks associated with its activities and the extent and types of markets on which it operates. Hamon regularly performs an audit to identify and evaluate its risks. ªe Executive Committee meets with the CEO to assess any special business risks. ªe risks that the company has to deal with are mapped out. A formal action plan is drawn up for risks for which the control level is deemed to be inadequate. ªe implementation of this action plan is monitored by the Audit Committee.
ªe main risks are as follows:
STRATEGIC RISKS
i. Risks linked to the economic and market environment.
ii. Competitive risks.
iii. Uncertainties related to new environmental regulations and the time of their entry into force (impacts mainly on Air Pollution Control activities).
iv. Risks linked to acquisitions, partnerships and activities abroad.
RISKS ASSOCIATED WITH THE GROUP’S ACTIVITIES
i. Customer risks: dependency on certain customers and customer credit risks.
ii. Supplier risks: this may include unsatisfactory products which do not meet the specifications or delays in delivery.
iii. Technical risks relating to the design or proper implementation of certain projects.
iv. Risks linked to guarantees given on projects.
v. Risks linked to the environment, for example on Hamon customers’ sites or in its plants.
vi. Industrial risks (accidents), human risks or those linked to occupational diseases.
vii. Risks related to raw material prices.
FINANCIAL RISKS
i. Interest rate risks. ii. Exchange risks. iii. Liquidity risks.
SUPPORT RISKS
i. Human resources risks, that is the company’s capacity to provide the skills and resources necessary for the fulfilment of its contracts.
ii. IT risks linked to the availability and safeguarding of IT facilities and data required to achieve the Group’s objectives.
iii. Risks relating to disputes in which the Group is involved or guarantees given in the framework of asset disposals.
iv. Internal financial risks such as the possibilities of using deferred tax losses, impairments (impairment test) to be recorded on the book value of certain assets, liquidity risks or credit risks.
Natural draft tower – Kozienice project - Poland.
67 — STATEMENT OF CORPORATE GOVERNANCE
4. CONTROL MEASURES PUT IN PLACE
Hamon takes steps to keep control of these risks as well as possible by means of an adequate risk management policy based on it project activities:
i. Implementation of an adequate internal control framework at Group level.
ii. Analysis of technical, financial and implementation risks based on a check list that is tailored to the different business units; this analysis is undertaken prior to submitting quotes to our customers and is based on a system of delegation of authority.
iii. Monthly follow-up through business meetings of the progress of various Group projects.
iv. Monthly and quarterly reporting on management, disputes and the cash position.
v. Management control system for the Group to supervise the progress of projects and activities within the Group and guard against or issue warnings should a problem arise.
vi. Quarterly review by the Executive Committee of the state of business, disputes and risks.
As regards covering monetary risks, Hamon has put in place a risk management policy for interest rates, exchange rates and counter party risks:
i. Interest rate risks: these are managed by using interest rate swaps (IRS) when the long rates exceed certain limits set by the Group.
ii. Exchange risks: the positions in foreign currencies resulting from the fulfilment of our construction contracts are covered by derivatives (forward exchange rate contracts, swaps, NDF) when they exceed the limits set by the Group.
iii. Counter party risks: cash deposits and investments must comply with certain safety and liquidity criteria and only then with return criteria.
ªe monetary risk management policy is set by the financial management of the Group and reviewed on a regular basis.
5. FINANCIAL INFORMATION AND COMMUNICATION
ªe process of gathering financial information is organized as follows:
1. A schedule is drawn up of the tasks that have to be carried out as part of the company’s monthly, quarterly, half-year and annual closings and those of its subsidiaries, along with their deadlines. ªe Group has a check list of actions to be followed by the financial department. In addition, each subsidiary has drawn up its own check list to enable it to meet its specific needs.
2. ªe local teams produce the accounting figures under the supervision of the financial managers at the subsidiaries. ªe books are kept either by the
Group ERP – JD Edwards - or, depending on the roll-out programme or the size of the subsidiary, using software programs purchased locally and backed up by appropriate support contracts, or for the smallest entities, by external service providers. It should be noted that Hamon has developed a ‘disaster recovery’ plan and a ‘business continuity’ plan, the steps of which are validated by IT security auditors.
3. ªe Controlling team of the subsidiary checks the validity of the figures and produces the reports. ªe figures are checked using the following procedures:
i. consistency tests by means of comparisons with past or budget figures;
ii. spot checks on transactions and depending on their materiality.
4. At central level, the consolidation is carried out using a software package - SAFRAN - in which the input is undertaken locally by the subsidiaries. ªe consolidation and reporting team prepares the consolidated figures and uses spot checks and consistency tests to verify the basic financial information. ªis central Controlling team takes an active part, at least twice a year, in the business reviews of each of the subsidiaries of the business units for which it is responsible.
5. Communication with members of staff and various Hamon employees is adapted to the size of the company. It is based mainly on the different press releases, the Group’s intranet and sending internal memos by e-mail, business meetings or verbal communication between management and staff.
6. To ensure rapid communication and the equal treatment of shareholders, Hamon publishes the agenda and the minutes of general meetings, half-year and annual financial results, press releases, the articles of association, the Corporate Governance Charter and the annual report on its website.
6. PARTIES INVOLVED IN THE SUPERVISION AND EVALUATION OF THE INTERNAL AUDIT
ªe quality of the internal audit is assessed during the course of the financial year:
1. by means of the Group management control, as part of its quarterly reviews of each business unit and regular audits carried out at the subsidiaries during which all the activities and key internal checks relating to contracts are reviewed.
2. by internal auditing, which carries out several internal auditing missions at subsidiaries every year. ªe subsidiaries and processes audited are chosen at the start of the year on the basis of
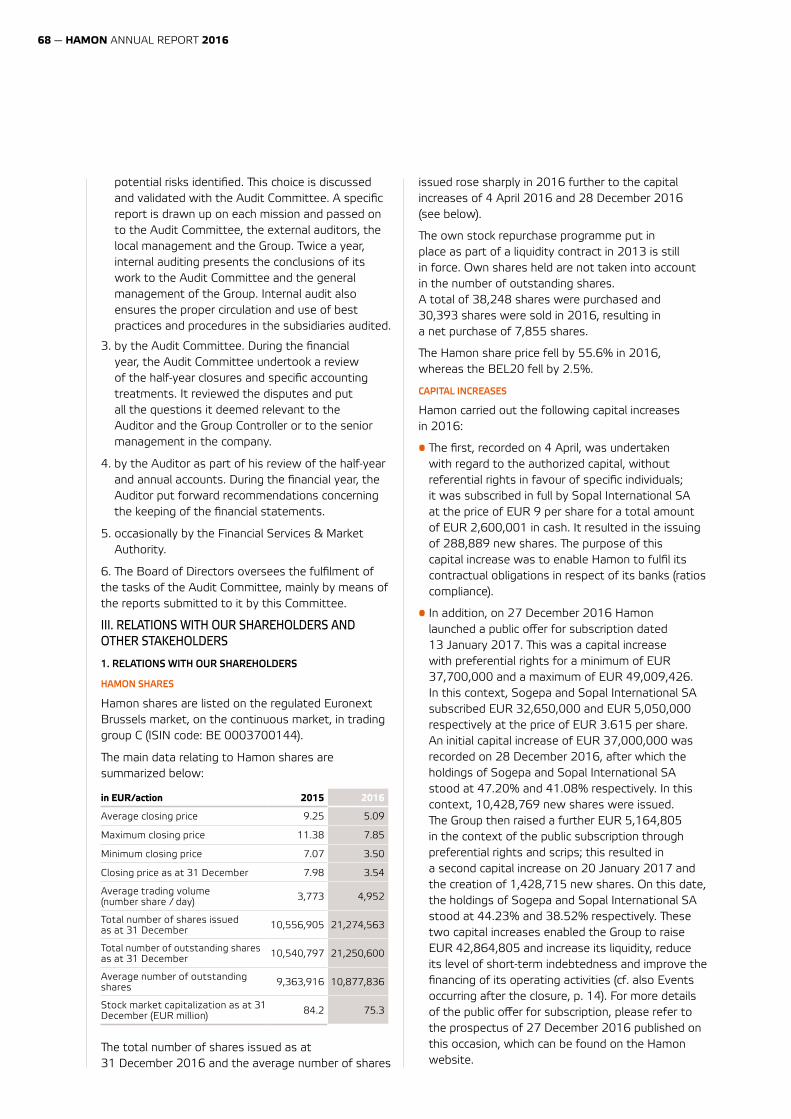
68 — HAMON ANNUAL REPORT 2016
potential risks identified. ªis choice is discussed and validated with the Audit Committee. A specific report is drawn up on each mission and passed on to the Audit Committee, the external auditors, the local management and the Group. Twice a year, internal auditing presents the conclusions of its work to the Audit Committee and the general management of the Group. Internal audit also ensures the proper circulation and use of best practices and procedures in the subsidiaries audited.
3. by the Audit Committee. During the financial year, the Audit Committee undertook a review of the half-year closures and specific accounting treatments. It reviewed the disputes and put all the questions it deemed relevant to the Auditor and the Group Controller or to the senior management in the company.
4. by the Auditor as part of his review of the half-year and annual accounts. During the financial year, the Auditor put forward recommendations concerning the keeping of the financial statements.
5. occasionally by the Financial Services & Market Authority.
6. ªe Board of Directors oversees the fulfilment of the tasks of the Audit Committee, mainly by means of the reports submitted to it by this Committee.
III. RELATIONS WITH OUR SHAREHOLDERS AND OTHER STAKEHOLDERS
1. RELATIONS WITH OUR SHAREHOLDERS
HAMON SHARES
Hamon shares are listed on the regulated Euronext Brussels market, on the continuous market, in trading group C (ISIN code: BE 0003700144).
ªe main data relating to Hamon shares are summarized below:
in EUR/action 2015 2016
Average closing price 9.25 5.09
Maximum closing price 11.38 7.85
Minimum closing price 7.07 3.50
Closing price as at 31 December 7.98 3.54
Average trading volume (number share / day) 3,773 4,952
Total number of shares issued as at 31 December 10,556,905 21,274,563
Total number of outstanding shares as at 31 December 10,540,797 21,250,600
Average number of outstanding shares 9,363,916 10,877,836
Stock market capitalization as at 31 December (EUR million) 84.2 75.3
ªe total number of shares issued as at 31 December 2016 and the average number of shares
issued rose sharply in 2016 further to the capital increases of 4 April 2016 and 28 December 2016 (see below).
ªe own stock repurchase programme put in place as part of a liquidity contract in 2013 is still in force. Own shares held are not taken into account in the number of outstanding shares. A total of 38,248 shares were purchased and 30,393 shares were sold in 2016, resulting in a net purchase of 7,855 shares.
ªe Hamon share price fell by 55.6% in 2016, whereas the BEL20 fell by 2.5%.
CAPITAL INCREASES
Hamon carried out the following capital increases in 2016:
• ªe first, recorded on 4 April, was undertaken with regard to the authorized capital, without referential rights in favour of specific individuals; it was subscribed in full by Sopal International SA at the price of EUR 9 per share for a total amount of EUR 2,600,001 in cash. It resulted in the issuing of 288,889 new shares. ªe purpose of this capital increase was to enable Hamon to fulfil its contractual obligations in respect of its banks (ratios compliance).
• In addition, on 27 December 2016 Hamon launched a public offer for subscription dated 13 January 2017. ªis was a capital increase with preferential rights for a minimum of EUR 37,700,000 and a maximum of EUR 49,009,426. In this context, Sogepa and Sopal International SA subscribed EUR 32,650,000 and EUR 5,050,000 respectively at the price of EUR 3.615 per share. An initial capital increase of EUR 37,000,000 was recorded on 28 December 2016, after which the holdings of Sogepa and Sopal International SA stood at 47.20% and 41.08% respectively. In this context, 10,428,769 new shares were issued. ªe Group then raised a further EUR 5,164,805 in the context of the public subscription through preferential rights and scrips; this resulted in a second capital increase on 20 January 2017 and the creation of 1,428,715 new shares. On this date, the holdings of Sogepa and Sopal International SA stood at 44.23% and 38.52% respectively. ªese two capital increases enabled the Group to raise EUR 42,864,805 and increase its liquidity, reduce its level of short-term indebtedness and improve the financing of its operating activities (cf. also Events occurring after the closure, p. 14). For more details of the public offer for subscription, please refer to the prospectus of 27 December 2016 published on this occasion, which can be found on the Hamon website.
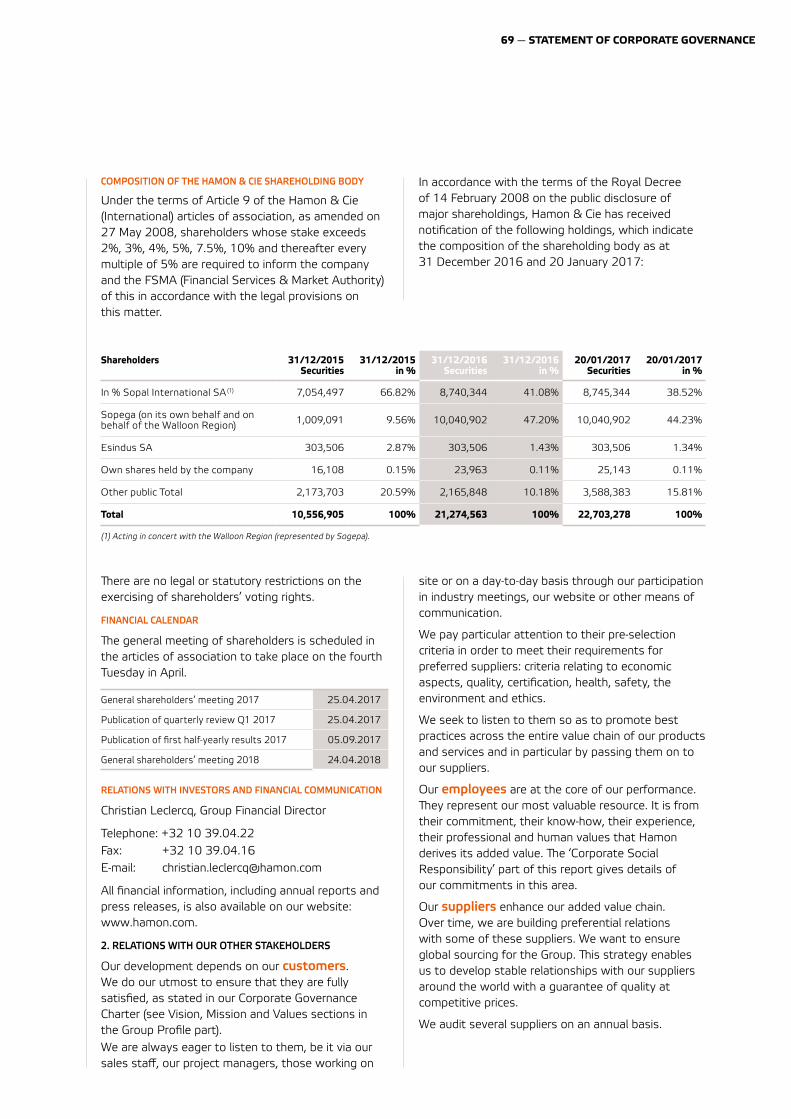
69 — STATEMENT OF CORPORATE GOVERNANCE
COMPOSITION OF THE HAMON & CIE SHAREHOLDING BODY
Under the terms of Article 9 of the Hamon & Cie (International) articles of association, as amended on 27 May 2008, shareholders whose stake exceeds 2%, 3%, 4%, 5%, 7.5%, 10% and thereafter every multiple of 5% are required to inform the company and the FSMA (Financial Services & Market Authority) of this in accordance with the legal provisions on this matter.
In accordance with the terms of the Royal Decree of 14 February 2008 on the public disclosure of major shareholdings, Hamon & Cie has received notification of the following holdings, which indicate the composition of the shareholding body as at 31 December 2016 and 20 January 2017:
Shareholders 31/12/2015Securities
31/12/2015in %
31/12/2016Securities
31/12/2016 in %
20/01/2017Securities
20/01/2017in %
In % Sopal International SA (1) 7,054,497 66.82% 8,740,344 41.08% 8,745,344 38.52%
Sopega (on its own behalf and on behalf of the Walloon Region) 1,009,091 9.56% 10,040,902 47.20% 10,040,902 44.23%
Esindus SA 303,506 2.87% 303,506 1.43% 303,506 1.34%
Own shares held by the company 16,108 0.15% 23,963 0.11% 25,143 0.11%
Other public Total 2,173,703 20.59% 2,165,848 10.18% 3,588,383 15.81%
Total 10,556,905 100% 21,274,563 100% 22,703,278 100%
(1) Acting in concert with the Walloon Region (represented by Sogepa).
ªere are no legal or statutory restrictions on the exercising of shareholders’ voting rights.
FINANCIAL CALENDAR
ªe general meeting of shareholders is scheduled in the articles of association to take place on the fourth Tuesday in April.
General shareholders’ meeting 2017 25.04.2017
Publication of quarterly review Q1 2017 25.04.2017
Publication of first half-yearly results 2017 05.09.2017
General shareholders’ meeting 2018 24.04.2018
RELATIONS WITH INVESTORS AND FINANCIAL COMMUNICATION
Christian Leclercq, Group Financial Director
Telephone: +32 10 39.04.22Fax: +32 10 39.04.16E-mail: [email protected]
All financial information, including annual reports and press releases, is also available on our website: www.hamon.com.
2. RELATIONS WITH OUR OTHER STAKEHOLDERS
Our development depends on our customers. We do our utmost to ensure that they are fully satisfied, as stated in our Corporate Governance Charter (see Vision, Mission and Values sections in the Group Profile part).We are always eager to listen to them, be it via our sales staff, our project managers, those working on
site or on a day-to-day basis through our participation in industry meetings, our website or other means of communication.
We pay particular attention to their pre-selection criteria in order to meet their requirements for preferred suppliers: criteria relating to economic aspects, quality, certification, health, safety, the environment and ethics.
We seek to listen to them so as to promote best practices across the entire value chain of our products and services and in particular by passing them on to our suppliers.
Our employees are at the core of our performance. ªey represent our most valuable resource. It is from their commitment, their know-how, their experience, their professional and human values that Hamon derives its added value. ªe ‘Corporate Social Responsibility’ part of this report gives details of our commitments in this area.
Our suppliers enhance our added value chain. Over time, we are building preferential relations with some of these suppliers. We want to ensure global sourcing for the Group. ªis strategy enables us to develop stable relationships with our suppliers around the world with a guarantee of quality at competitive prices.
We audit several suppliers on an annual basis.
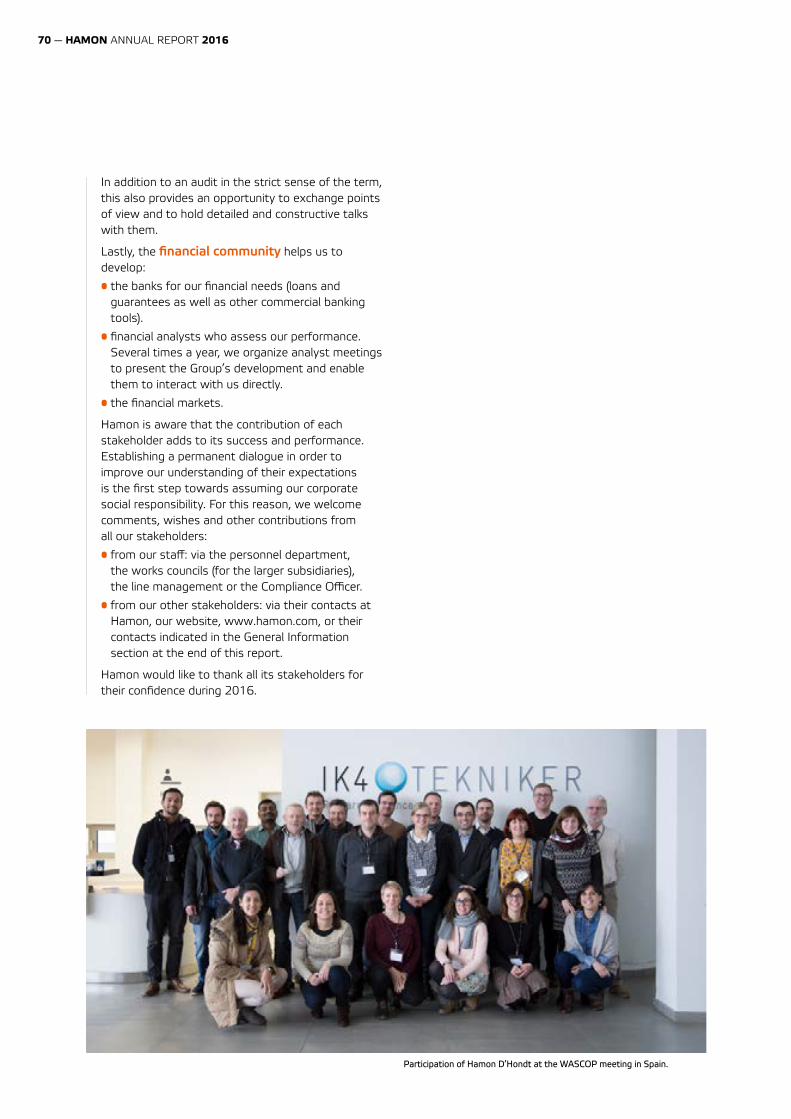
70 — HAMON ANNUAL REPORT 2016
In addition to an audit in the strict sense of the term, this also provides an opportunity to exchange points of view and to hold detailed and constructive talks with them.
Lastly, the financial community helps us to develop:
• the banks for our financial needs (loans and guarantees as well as other commercial banking tools).
• financial analysts who assess our performance. Several times a year, we organize analyst meetings to present the Group’s development and enable them to interact with us directly.
• the financial markets.
Hamon is aware that the contribution of each stakeholder adds to its success and performance. Establishing a permanent dialogue in order to improve our understanding of their expectations is the first step towards assuming our corporate social responsibility. For this reason, we welcome comments, wishes and other contributions from all our stakeholders:
• from our staff: via the personnel department, the works councils (for the larger subsidiaries), the line management or the Compliance Officer.
• from our other stakeholders: via their contacts at Hamon, our website, www.hamon.com, or their contacts indicated in the General Information section at the end of this report.
Hamon would like to thank all its stakeholders for their confidence during 2016.
Participation of Hamon D’Hondt at the WASCOP meeting in Spain.

FINANCIAL STATEMENTS
72 — HAMON ANNUAL REPORT 2016
73 1. CONSOLIDATED INCOME STATEMENT
74 2. CONSOLIDATED STATEMENT OF COMPREHENSIVE INCOME
75 3. CONSOLIDATED BALANCE SHEET
76 4. CONSOLIDATED CASH FLOW STATEMENT
77 5. CONSOLIDATED STATEMENT OF CHANGES IN EQUITY
78 6. NOTES TO THE CONSOLIDATED FINANCIAL STATEMENTS
78 — 1. General information
78 — 2. Declaration of compliance and responsability
78 — 3. Principal accounting standards
86 — 4. Key assumptions and estimates
87 — 5. Consolidated entities
88 — 6. Exchange rates used by the group
89 — 7. Information by segment
92 — 8. Revenue
92 — 9. Operating expenses
93 — 10. Other operating incomes and expenses
93 — 11. Non-recurring income (expenses)
94 — 12. Net finance costs
95 — 13. Income tax
95 — 14. Changes of scope
96 — 15. Earnings per share
96 — 16. Cash flow from operating activities
96 — 17. Cash flow from investing activities
96 — 18. Cash flow from financing activities
97 — 19. Intangible assets
98 — 20. Goodwill
99 — 21. Property, plant & equipment
100 — 22. Available-for-sales financial assets
101 — 23. Deferred taxes
102 — 24. Inventories
102 — 25. Construction contracts
102 — 26. Trade and other receivables
103 — 27. Cash and cash equivalents
103 — 28. Share capital
104 — 29. Provisions for other liabilities and charges
104 — 30. Provisions for post-employment benefits
109 — 31. Share-based compensation (stock options)
109 — 32. Financial liabilities
110 — 33. Trade and other payables
111 — 34. Derivative instruments
112 — 35. Financial assets and liabilities
113 — 36. Risk management policies
116 — 37. Guarantees on the group assets
117 — 38. Finance and operating lease agreements
118 — 39. Commitments
118 — 40. Contingent liabilities
119 — 41. Related parties
120 — 42. Minority shares and joint-ventures
122 — 43. Management compensation
123 — 44. Staff
123 — 45. Events after the balance sheet date
123 — 46. Auditors’s fees
124 — 47. Alternative performance indicators
126 7. STATUTORY ACCOUNTS OF HAMON & CIE (INTERNATIONAL) SA
128 8. STATUTORY AUDITOR’S REPORT
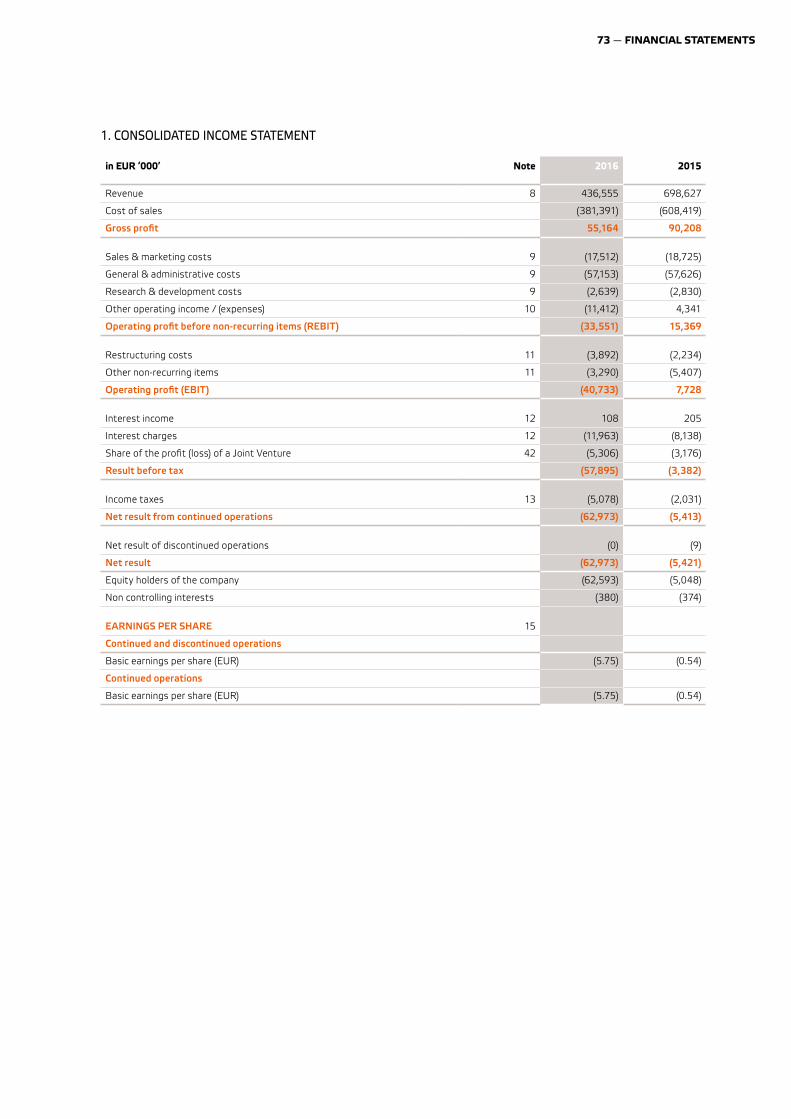
73 — FINANCIAL STATEMENTS
1. CONSOLIDATED INCOME STATEMENT
in EUR ‘000’ Note 2016 2015
Revenue 8 436,555 698,627
Cost of sales (381,391) (608,419)
Gross profit 55,164 90,208
Sales & marketing costs 9 (17,512) (18,725)
General & administrative costs 9 (57,153) (57,626)
Research & development costs 9 (2,639) (2,830)
Other operating income / (expenses) 10 (11,412) 4,341
Operating profit before non-recurring items (REBIT) (33,551) 15,369
Restructuring costs 11 (3,892) (2,234)
Other non-recurring items 11 (3,290) (5,407)
Operating profit (EBIT) (40,733) 7,728
Interest income 12 108 205
Interest charges 12 (11,963) (8,138)
Share of the profit (loss) of a Joint Venture 42 (5,306) (3,176)
Result before tax (57,895) (3,382)
Income taxes 13 (5,078) (2,031)
Net result from continued operations (62,973) (5,413)
Net result of discontinued operations (0) (9)
Net result (62,973) (5,421)
Equity holders of the company (62,593) (5,048)
Non controlling interests (380) (374)
EARNINGS PER SHARE 15
Continued and discontinued operations
Basic earnings per share (EUR) (5.75) (0.54)
Continued operations
Basic earnings per share (EUR) (5.75) (0.54)
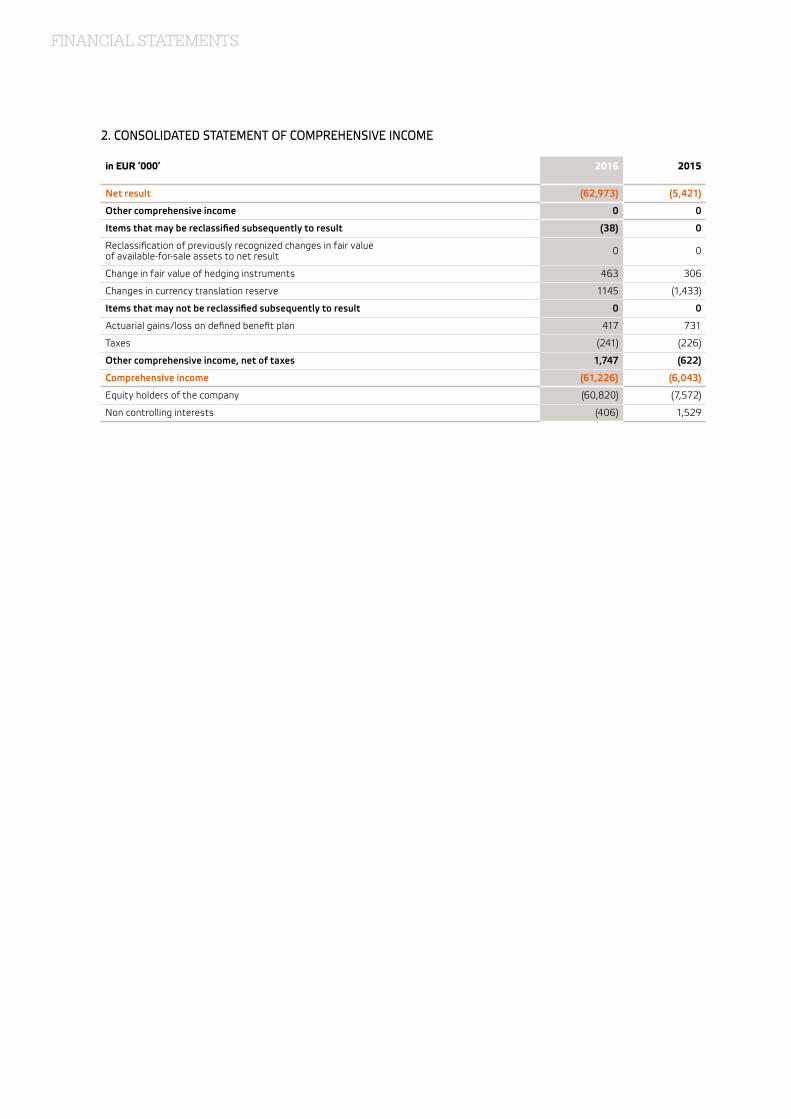
FINANCIAL STATEMENTS
2. CONSOLIDATED STATEMENT OF COMPREHENSIVE INCOME
in EUR ‘000’ 2016 2015
Net result (62,973) (5,421)
Other comprehensive income 0 0
Items that may be reclassified subsequently to result (38) 0
Reclassification of previously recognized changes in fair value of available-for-sale assets to net result 0 0
Change in fair value of hedging instruments 463 306
Changes in currency translation reserve 1145 (1,433)
Items that may not be reclassified subsequently to result 0 0
Actuarial gains/loss on defined benefit plan 417 731
Taxes (241) (226)
Other comprehensive income, net of taxes 1,747 (622)
Comprehensive income (61,226) (6,043)
Equity holders of the company (60,820) (7,572)
Non controlling interests (406) 1,529
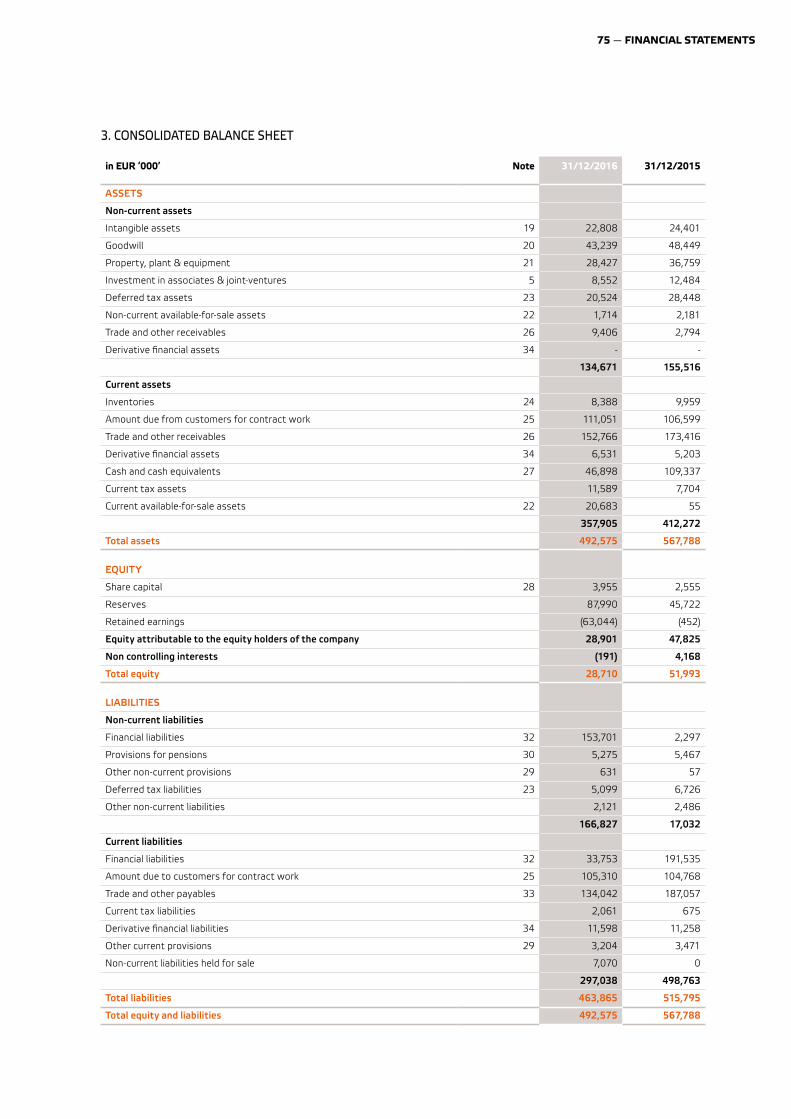
75 — FINANCIAL STATEMENTS
3. CONSOLIDATED BALANCE SHEET
in EUR ‘000’ Note 31/12/2016 31/12/2015
ASSETS
Non-current assets
Intangible assets 19 22,808 24,401
Goodwill 20 43,239 48,449
Property, plant & equipment 21 28,427 36,759
Investment in associates & joint-ventures 5 8,552 12,484
Deferred tax assets 23 20,524 28,448
Non-current available-for-sale assets 22 1,714 2,181
Trade and other receivables 26 9,406 2,794
Derivative financial assets 34 - -
134,671 155,516
Current assets
Inventories 24 8,388 9,959
Amount due from customers for contract work 25 111,051 106,599
Trade and other receivables 26 152,766 173,416
Derivative financial assets 34 6,531 5,203
Cash and cash equivalents 27 46,898 109,337
Current tax assets 11,589 7,704
Current available-for-sale assets 22 20,683 55
357,905 412,272
Total assets 492,575 567,788
EQUITY
Share capital 28 3,955 2,555
Reserves 87,990 45,722
Retained earnings (63,044) (452)
Equity attributable to the equity holders of the company 28,901 47,825
Non controlling interests (191) 4,168
Total equity 28,710 51,993
LIABILITIES
Non-current liabilities
Financial liabilities 32 153,701 2,297
Provisions for pensions 30 5,275 5,467
Other non-current provisions 29 631 57
Deferred tax liabilities 23 5,099 6,726
Other non-current liabilities 2,121 2,486
166,827 17,032
Current liabilities
Financial liabilities 32 33,753 191,535
Amount due to customers for contract work 25 105,310 104,768
Trade and other payables 33 134,042 187,057
Current tax liabilities 2,061 675
Derivative financial liabilities 34 11,598 11,258
Other current provisions 29 3,204 3,471
Non-current liabilities held for sale 7,070 0
297,038 498,763
Total liabilities 463,865 515,795
Total equity and liabilities 492,575 567,788
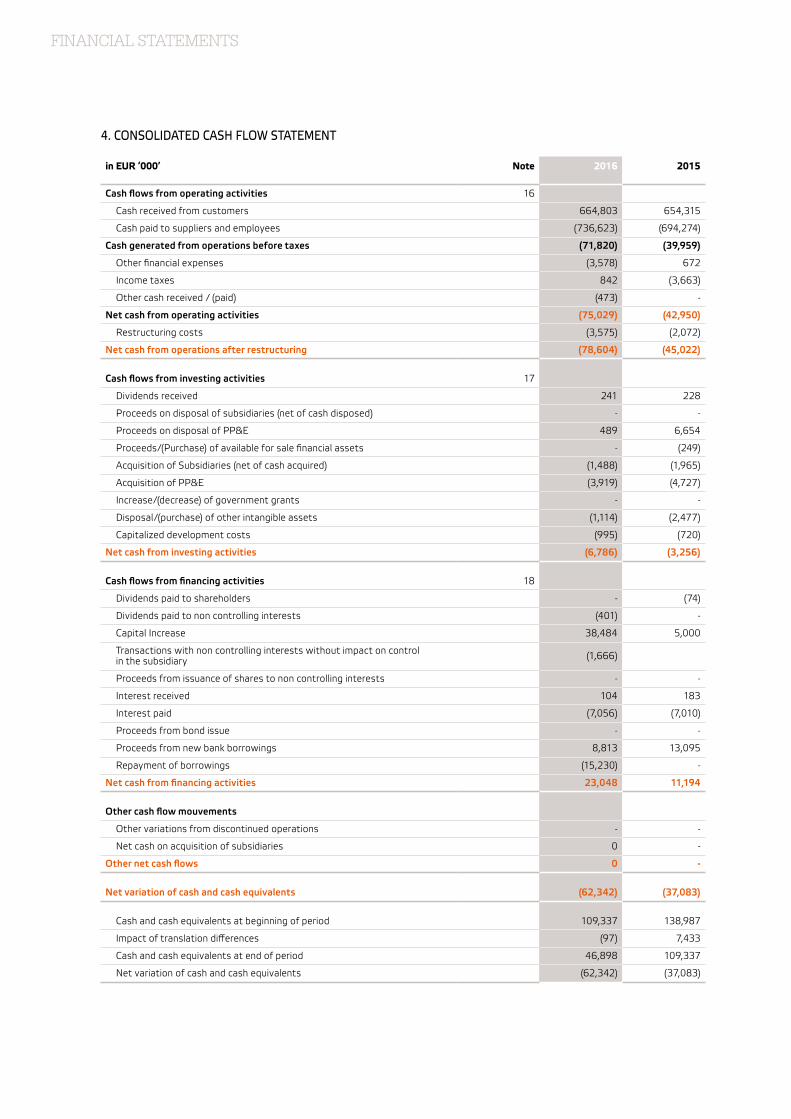
FINANCIAL STATEMENTS
4. CONSOLIDATED CASH FLOW STATEMENT
in EUR ‘000’ Note 2016 2015
Cash flows from operating activities 16
Cash received from customers 664,803 654,315
Cash paid to suppliers and employees (736,623) (694,274)
Cash generated from operations before taxes (71,820) (39,959)
Other financial expenses (3,578) 672
Income taxes 842 (3,663)
Other cash received / (paid) (473) -
Net cash from operating activities (75,029) (42,950)
Restructuring costs (3,575) (2,072)
Net cash from operations after restructuring (78,604) (45,022)
Cash flows from investing activities 17
Dividends received 241 228
Proceeds on disposal of subsidiaries (net of cash disposed) - -
Proceeds on disposal of PP&E 489 6,654
Proceeds/(Purchase) of available for sale financial assets - (249)
Acquisition of Subsidiaries (net of cash acquired) (1,488) (1,965)
Acquisition of PP&E (3,919) (4,727)
Increase/(decrease) of government grants - -
Disposal/(purchase) of other intangible assets (1,114) (2,477)
Capitalized development costs (995) (720)
Net cash from investing activities (6,786) (3,256)
Cash flows from financing activities 18
Dividends paid to shareholders - (74)
Dividends paid to non controlling interests (401) -
Capital Increase 38,484 5,000
Transactions with non controlling interests without impact on control in the subsidiary (1,666)
Proceeds from issuance of shares to non controlling interests - -
Interest received 104 183
Interest paid (7,056) (7,010)
Proceeds from bond issue - -
Proceeds from new bank borrowings 8,813 13,095
Repayment of borrowings (15,230) -
Net cash from financing activities 23,048 11,194
Other cash flow mouvements
Other variations from discontinued operations - -
Net cash on acquisition of subsidiaries 0 -
Other net cash flows 0 -
Net variation of cash and cash equivalents (62,342) (37,083)
Cash and cash equivalents at beginning of period 109,337 138,987
Impact of translation differences (97) 7,433
Cash and cash equivalents at end of period 46,898 109,337
Net variation of cash and cash equivalents (62,342) (37,083)
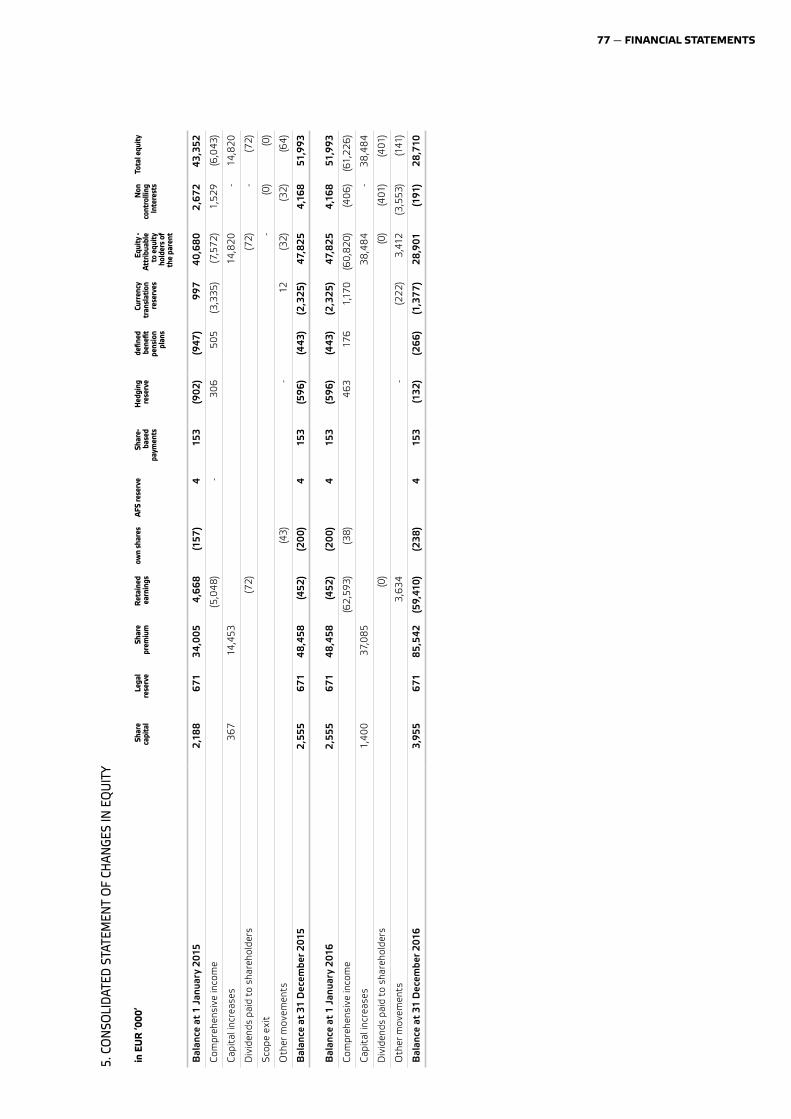
77 — FINANCIAL STATEMENTS
5. C
ON
SOLI
DAT
ED S
TATE
MEN
T O
F CH
ANGE
S IN
EQ
UIT
Y
in E
UR
‘000
’Sh
are
capi
tal
Lega
l re
serv
eSh
are
prem
ium
Ret
aine
d ea
rnin
gsow
n sh
ares
AFS
rese
rve
Shar
e-
base
d pa
ymen
ts
Hed
ging
re
serv
ede
fined
be
nefit
pe
nsio
n pl
ans
Curr
ency
tr
ansl
atio
n re
serv
es
Equi
ty -
Attr
ibua
ble
to e
quity
ho
lder
s of
th
e pa
rent
Non
co
ntro
lling
In
tere
sts
Tota
l equ
ity
Bal
ance
at
1 Ja
nuar
y 20
15 2
,18
8 6
71
34,
005
4
,66
8 (1
57)
4
153
(9
02)
(947
) 9
97
40,
68
0 2
,67
2 4
3,35
2
Com
preh
ensi
ve in
com
e (5
,04
8)
- 3
06
505
(3
,335
) (7
,57
2)
1,5
29
(6,0
43)
Capi
tal i
ncre
ases
367
1
4,45
3 1
4,82
0 -
14,
820
Div
iden
ds p
aid
to s
hare
hold
ers
(72
) (7
2)
- (7
2)
Sco
pe e
xit
- (0
) (0
)
Oth
er m
ovem
ents
(43
) -
12
(32
) (3
2)
(64
)
Bal
ance
at
31 D
ecem
ber 2
015
2,5
55
671
4
8,4
58
(452
) (2
00
) 4
1
53
(59
6)
(443
) (2
,325
) 4
7,8
25
4,1
68
51,
993
Bal
ance
at
1 Ja
nuar
y 20
16 2
,555
6
71
48
,458
(4
52)
(20
0)
4
153
(5
96
) (4
43)
(2,3
25)
47,
825
4
,16
8 5
1,9
93
Com
preh
ensi
ve in
com
e (6
2,59
3)
(38
) 4
63
176
1
,170
(6
0,82
0)
(40
6)
(61,
226
)
Capi
tal i
ncre
ases
1,4
00
37,
085
3
8,4
84
- 3
8,4
84
Div
iden
ds p
aid
to s
hare
hold
ers
(0)
(0)
(401
) (4
01)
Oth
er m
ovem
ents
3,6
34
- (2
22)
3,4
12
(3,5
53)
(141
)
Bal
ance
at
31 D
ecem
ber 2
016
3,9
55
671
8
5,5
42
(59,
410
) (2
38
) 4
1
53
(132
) (2
66
) (1
,37
7)
28
,901
(1
91)
28
,710
FINANCIAL STATEMENTS
6. NOTES TO THE CONSOLIDATED FINANCIAL STATE-MENTS1. GENERAL INFORMATION
Hamon & Cie (International) sa (hereafter called ‘Hamon’ or ‘the Company’) is a limited liability company under Belgian law. Its registered office is Axisparc, rue Emile Francqui 2, B-1435 Mont-St-Guibert, Belgium; telephone: 32 10 39 04 00.
ªe principal activities of Hamon and the various subsi-diaries of the Group are described in the first part of this annual report.
ªe legislation governing the activities of Hamon & Cie (International) is Belgian law or the law of the countries in which its subsidiaries are established. ªe country of origin of the Company is Belgium.
ªe Company’s financial year begins on the 1 January and closes on the 31 December of each year.
ªe Company was founded on 31 December 1927 for an unlimited period.
ªe Company registration number is 0402.960.467.
2. DECLARATION OF COMPLIANCE AND RESPONSABILITY
ªe consolidated financial statements were approved by the Board of Directors on 02 March 2017.
We declare that to our knowledge:
• ªe consolidated financial statements have been pre-pared according to the International Financial Reporting Standards (IFRS) as approved by the European Union.
• ªe financial statements are a fair view of the assets, the financial situation and results of the Group.
• ªe Management report is a fair review of the ongoing business, the results and the situation of the Group and it includes a description of the principle risks and uncer-tainties which the Group is facing.
02 March 2017.
Bernard Goblet Christian LeclercqManaging Director CFO
3. PRINCIPAL ACCOUNTING STANDARDS
3.1. PRINCIPAL ACCOUNTING STANDARDS
ªese consolidated financial statements have been pre-pared in accordance with the International Financial Repor-ting Standards.
ªey have been prepared on basis of the historical cost convention except for some financial instruments mea-sured at fair value in conformity with IAS 39. ªe financial statements are presented in thousands of Euros, rounded to the nearest thousand.
Standards and Interpretations that became applicable in 2016
ªe accounting policies used for the preparation of the condensed consolidated financial statements are consis-tant with those used in the 2015 consolidated financial statements.
ªe Group has decided not to anticipate the application of revised or new standards and interpretations. ªe applica-tion of these revised or new standards and interpretations should have no significant impact on the consolidated financial statements. (IFRS 9 – Financial instruments and IFRS 16 – Leases are currently under review).
Standards and interpretations applicable for the annual period beginning on 1 January 2016
• Improvements to IFRS (2010-2012) (applicable for annual periods beginning on or after 1 February 2015)
• Improvements to IFRS (2012-2014) (applicable for annual periods beginning on or after 1 January 2016)
• Amendments to IFRS 10, IFRS 12 and IAS 28 Invest-ment Entities: Applying the Consolidation Exception (applicable for annual periods beginning on or after 1 January 2016)
• Amendments to IFRS 11 Joint Arrangements - Accoun-ting for Acquisitions of Interests in Joint Operations (applicable for annual periods beginning on or after 1 January 2016)
• Amendments to IAS 1 Presentation of Financial Sta-tements – Disclosure Initiative (applicable for annual periods beginning on or after 1 January 2016)
• Amendments to IAS 16 and IAS 38 Property, Plant and Equipment and Intangible Assets – Clarification of Acceptable Methods of Depreciation and Amortisation (applicable for annual periods beginning on or after 1 January 2016)
• Amendments to IAS 16 and IAS 41 Agriculture: Bearer Plants (applicable for annual periods beginning on or after 1 January 2016)
• Amendments to IAS 19 Employee Benefits – Employee Contributions (applicable for annual periods beginning on or after 1 February 2015)
• Amendments to IAS 27 Separate Financial Statements – Equity Method (applicable for annual periods beginning on or after 1 January 2016)
A working group has been put in place in order to value the IFRS 15 impact on the consolidated financial state-
79 — FINANCIAL STATEMENTS
ments. An analyze will be performed per project in order to determine the accounting differences. However, as per the actual accounting standards on revenue recognition; the Group does not anticipate any material differences driven by IFRS 15 implementation but this conclusion has to be confirmed after the detailed ongoing analyze, especially on the tender costs.
3.2. CONVERSION OF FOREIGN CURRENCIES OPERATIONS
Foreign currency transactions (i.e. in a currency other than the functional currency of the entity) are recorded at the spot exchange rate on the date of the transaction. At each closing date, monetary assets and liabilities denominated in foreign currencies are translated using the closing rate. Gains and losses arising from the settlement of foreign currency monetary items or on their re-evaluation at the closing date are recognized in the Income statement in the “Other operating income / (expenses)”; and in finance costs for gains / losses related to the financial debt.
ªe assets and liabilities of the Group activities whose working currency is not the Euro are converted into Euros at the financial year’s closing rate. Income and charges are converted at the average rate of the period except if the exchange rates have been subject to major fluctua-tions. Resulting exchange gains and losses are accounted for as a distinct component of the equity. At the time of the disposal of an activity whose working currency is not the Euro, the accumulated deferred exchange gains and losses recorded under the ‘Translation reserve’ heading are reversed in the income statement.
Goodwill and other adjustments of the fair value resulting from the acquisition of an activity whose working currency is not the Euro are treated as assets and liabilities of the acti-vity and posted in accordance with the preceding paragraph.
3.3. CONSOLIDATION PRINCIPLES
ªe consolidated financial statements incorporate the financial statements of the Company and entities (includ-ing structured entities) controlled by the Company and its subsidiaries. Control is achieved when the Company:
• has power over the investee;
• is exposed, or has rights, to variable returns from its involvement with the investee; and
• has the ability to use its power to affect its returns
ªe Company re-assesses whether or not it controls an investor if facts and circumstances indicate that there are changes to one or more of the three elements of control listed above.
When the Company has less than a majority of the vot-ing rights of an investor, it has power over the investor when the voting rights are sufficient to give it the practi-cal ability to direct the relevant activities of the investor unilaterally. ªe Company considers all relevant facts and circumstances in assessing whether or not the Company’s voting rights to an investor’s is sufficient to give it power, including:
• the size of the Company’s holding of voting rights rela-tive to the size and dispersion of holdings of the other vote holders;
• potential voting rights held by the Company, other vote holders or other parties;
• rights arising from other contractual arrangements; and
• any additional facts and circumstances that indicate that the Company has, or does not have, the current ability to direct the relevant activities at the time that decisions need to be made, including voting patterns at previous shareholders’ meetings.
Consolidation of a subsidiary begins when Hamon obtains control over the subsidiary and ceases when the Company loses control of the subsidiary. Specifically, income and expenses of a subsidiary acquired or disposed of during the year are included in the consolidated statement of profit or loss and other comprehensive income from the date the Company gains control until the date when the Company ceases to control the subsidiary.
Profit or loss and each component of other comprehen-sive income are attributed to the owners of the Company and to the non-controlling interests. Total comprehen-sive income of subsidiaries is attributed to the owners of the Company and to the non-controlling interests even if this results in the non-controlling interests having a deficit balance.
When necessary, adjustments are made to the financial statements of subsidiaries to bring their accounting poli-cies into line with the Group’s accounting policies.
All intragroup assets and liabilities, equity, income, expenses and cash flows relating to transactions between members of the Group are eliminated in full on consolida-tion.
Changes in the Group’s ownership interests in existing subsidiaries
Changes in the Group’s ownership interests in subsidiaries that do not result in the Group losing control over the sub-sidiaries are accounted for as equity transactions.
ªe carrying amounts of the Group’s interests and the non-controlling interests are adjusted to reflect the changes in their relative interests in the subsidiaries. Any difference between the amount by which the non-control-ling interests are adjusted and the fair value of the consi-deration paid or received is recognized directly in equity and attributed to owners of the Company.
When the Group loses control of a subsidiary, a gain or loss is recognized in profit or loss and is calculated as the difference between (i) the aggregate of the fair value of the consideration received and the fair value of any retained interest and (ii) the previous carrying amount of the assets (including goodwill), and liabilities of the subsidiary and any non-controlling interests. All amounts previously reco-gnized in other comprehensive income in relation to that subsidiary are accounted for as if the Group had directly
FINANCIAL STATEMENTS
disposed of the related assets or liabilities of the subsi-diary (i.e. reclassified to profit or loss or transferred to another category of equity as specified / permitted by applicable IFRS). ªe fair value of any investment retained in the former subsidiary at the date when control is lost is regarded as the fair value on initial recognition for subse-quent accounting under IAS 39, when applicable, the cost on initial recognition of an investment in an associate or a joint venture.
Investments in associates and joint ventures
An associate is an entity over which the Group has signi-ficant influence. Significant influence is the power to par-ticipate in the financial and operating policy decisions of the investor but is not control or joint control over those policies.
A joint venture is a joint arrangement whereby the parties that have joint control of the arrangement have rights to the net assets of the joint arrangement. Joint control is the contractually agreement sharing of control of an arrange-ment, which exists only when decisions about the relevant activities require unanimous consent of the parties sharing control.
ªe results and assets and liabilities of associates or joint ventures are incorporated in these consolidated financial statements using the equity method of accounting, except when the investment, or a portion thereof, is classified as held for sale, in which case it is accounted for in accordance with IFRS 5. Under the equity method, an investment in an associate or a joint venture is initially recognized in the consolidated statement of financial position at cost and adjusted thereafter to recognize the Group’s share of the profit or loss and other comprehensive income of the associate or joint venture. When the Group’s share of losses of an associate or a joint venture exceeds the Group’s interest in that associate or joint venture (which includes any long-term interests that, in substance, form part of the Group’s net investment in the associate or joint venture), the Group discontinues recognizing its share of further losses. Additional losses are recognized only to the extent that the Group has incurred legal or constructive obligations or made payments on behalf of the associate or joint venture.
An investment in an associate or a joint venture is accounted for using the equity method from the date on which the investor becomes an associate or a joint ven-ture. On acquisition of the investment in an associate or a joint venture, any excess of the cost of the investment over the Group’s share of the net fair value of the identi-fiable assets and liabilities of the investor is recognized as goodwill, which is included within the carrying amount of the investment.
Any excess of the Group’s share of the net fair value of the identifiable assets and liabilities over the cost of the investment, after reassessment, is recognized immedia-tely in profit or loss in the period in which the investment is acquired.
ªe Group discontinues the use of the equity method from the date when the investment ceases to be an associate or a joint venture, or when the investment is classified as held for sale. When the Group retains an interest in the for-mer associate or joint venture and the retained interest is a financial asset, the Group measures the retained interest at fair value at that date and the fair value is regarded as its fair value on initial recognition in accordance with IAS 39.
ªe difference between the carrying amount of the asso-ciate or joint venture at the date the equity method was discontinued, and the fair value of any retained interest and any proceeds from disposing of a part interest in the asso-ciate or joint venture is included in the determination of the gain or loss on disposal of the associate or joint venture. In addition, the Group accounts for all amounts previously recognized in other comprehensive income in relation to that associate or joint venture on the same basis as would be required if that associate or joint venture had directly disposed of the related assets or liabilities. ªerefore, if a gain or loss previously recognized in other comprehen-sive income by that associate or joint venture would be reclassified to profit or loss on the disposal of the related assets or liabilities, the Group reclassifies the gain or loss from equity to profit or loss (as a reclassification adjust-ment) when the equity method is discontinued.
ªe Group continues to use the equity method when an investment in an associate becomes an investment in a joint venture or an investment in a joint venture becomes an investment in an associate. ªere is no re-measurement to fair value upon such changes in ownership interests.
When the Group reduces its ownership interest in an associate or a joint venture but the Group continues to use the equity method, the Group reclassifies to profit or loss the proportion of the gain or loss that had previously been recognized in other comprehensive income relating to that reduction in ownership interest if that gain or loss would be reclassified to profit or loss on the disposal of the related assets or liabilities.
When a group entity transacts with an associate or a joint venture of the Group, profits and losses resulting from the transactions with the associate or joint venture are reco-gnized in the Group’s consolidated financial statements only to the extent of interests in the associate or joint ven-ture that are not related to the Group.
Put options on non-controlling interests
Other non-current liabilities include, amongst others, put options granted by the Group to non-controlling interests. As no specific guidance is provided by IFRS, the Group has adopted the following accounting treatment for these commitments:
• payments of dividends to non-controlling interests result in a decrease of the other non-current liability;
• in the consolidated income statement, controlling inter-ests are allocated their share in income. In the consol-idated balance sheet, the share in income allocated to non-controlling interests increases the other non-current liability.
81 — FINANCIAL STATEMENTS
In the case of a fixed-price put, the liability corresponds to the present value of the strike price.
In the case of a fair value or variable-price put, the liability is measured based on estimates of the fair value at the consolidated balance sheet date or contractual conditions applicable to the exercise price based on the latest availa-ble information.
3.4. INTANGIBLE ASSETS
Intangible assets are recognized if it is probable that the future economic benefits attributable to the assets will flow to the Group and if their costs can be measured reli-ably. After initial recognition, an intangible asset shall be carried at its cost less any accumulated amortization and impairments.
Patents, Trademarks and Similar Rights
Patents and trademarks with a finite life are initially meas-ured at cost and are amortized on a straight-line basis over the shorter of their useful lives or their contractual period.
Patents and trademarks with an indefinite life are subject to an annual impairment test.
Development Costs
In-house development costs are capitalized as intangible assets only if all following conditions are met:
• An identifiable asset has been created (such as software and new processes);
• It is probable that the asset will generate future eco-nomic benefits;
• ªe asset’s development costs can be measured reliably.
ªe development phase starts when the new products, processes or software programs (‘Identifiable Asset’) are defined. ªe objective consists of developing an Identi-fiable Asset, which fulfils the customers’ technical and qualitative requirements or enables the customers’ require-ments to be met at a lower cost for the Company. ªe development activities are based on the results obtained from industrial research or from existing knowhow and are generating profit. ªis condition is reviewed each year in order to determine the project’s profitability poten-tial. Development costs are amortized over a maximum period of 5 (five) years. When the above recognition crite-ria is not met, the development expenditure is charged to expenses.
Other internally generated intangible assets
Except for development costs meeting the above condi-tions, costs linked to any other internally generated intan-gible element such as brands, customer lists, goodwill, research costs are charged to expenses and are not cap-italized.
Goodwill
Recognition of goodwillApplication of IFRS 3 revised as of 1 January 2010, leads the Group to separately identify business combinations carried out before and after this date.
• Business combinations carried out prior to 1 January 2010
Goodwill recognized during a business combination is accounted for as an asset, being the excess of the cost of a business combination over the Group’s interest in the fair value of the acquiree’s identifiable assets, liabilities and contingent liabilities recognized.
ªe initial accounting for business combinations is not restated.
Any adjustments to the consideration transferred in these business combinations changes their initial accounting and leads to a matching adjustment to goodwill.
• Business combinations carried out after 1 January 2010
Goodwill is measured as the excess of the aggregate of:
1. the consideration transferred;
2. the amount of any non-controlling interests in the acquiree; and
3. in a business combination achieved in stages, the acqui-sition-date fair value of the previously held equity inter-est in the acquiree over the net of the acquisition-date fair values of the identifiable assets acquired and the liabilities assumed.
Goodwill recognized on the acquisition date is not subse-quently adjusted.
Measurement of goodwillGoodwill is not depreciated but it is tested for impairment at least once a year. Any impairment loss is charged to the income statement. An impairment loss accounted for on goodwill cannot be reversed at a later date.
At the time of the sale of a subsidiary or a jointly con-trolled entity, the relevant goodwill is included in the deter-mination of the result of the sale. Goodwill on associated companies is presented under ‘Investments In Associated Companies’.
3.5. TANGIBLE ASSETS
An item of property, plant and equipment is recognized as a tangible asset if it is probable that the future economic benefits attributable to the asset will flow to the Group and if their costs can be measured reliably.
After the initial accounting, all tangible assets are stated at cost less the accumulated depreciation and impairment losses. ªe cost includes all the costs directly attributable to bringing the asset to the location and condition nec-essary for it to be capable of operating in the intended manner.
Repair and maintenance costs and other subsequent expenditure linked to an asset are charged as expenses in the income statement of the financial year during which they are incurred.
ªe depreciable amount of an asset is allocated system-atically over its useful life using the straight-line method.
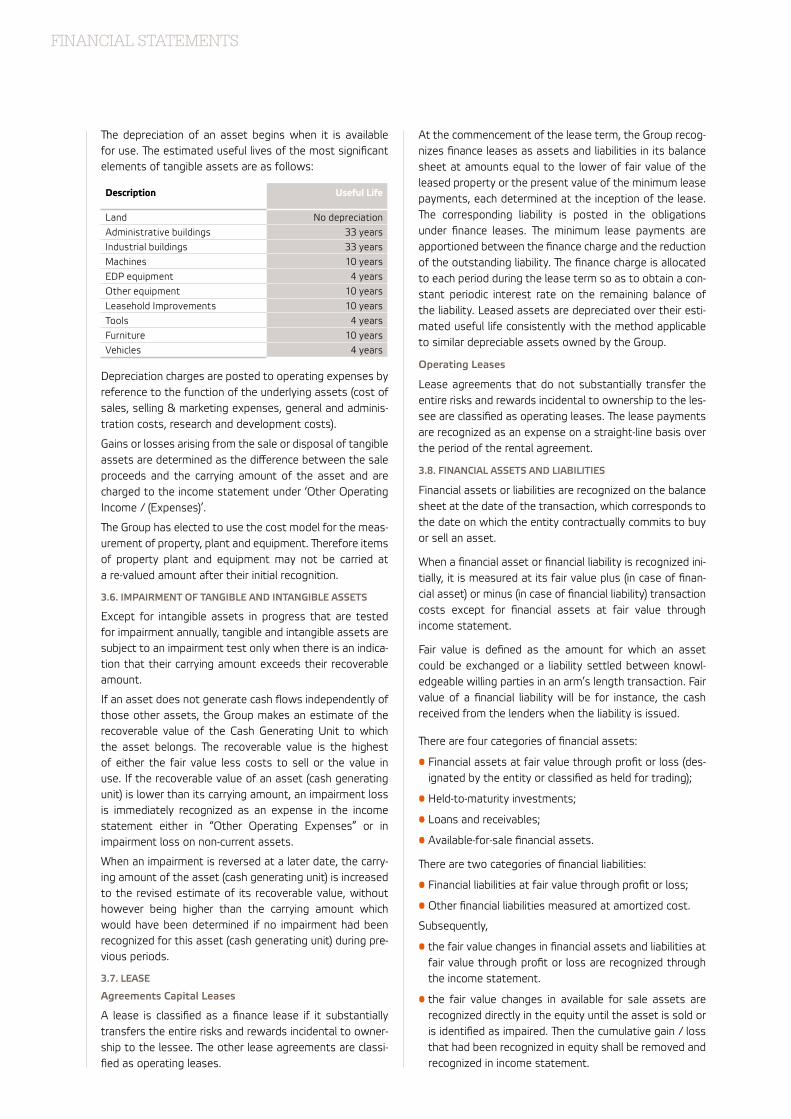
FINANCIAL STATEMENTS
ªe depreciation of an asset begins when it is available for use. ªe estimated useful lives of the most significant elements of tangible assets are as follows:
Description Useful Life
Land No depreciationAdministrative buildings 33 yearsIndustrial buildings 33 yearsMachines 10 yearsEDP equipment 4 yearsOther equipment 10 yearsLeasehold Improvements 10 yearsTools 4 yearsFurniture 10 yearsVehicles 4 years
Depreciation charges are posted to operating expenses by reference to the function of the underlying assets (cost of sales, selling & marketing expenses, general and adminis-tration costs, research and development costs).
Gains or losses arising from the sale or disposal of tangible assets are determined as the difference between the sale proceeds and the carrying amount of the asset and are charged to the income statement under ‘Other Operating Income / (Expenses)’.
ªe Group has elected to use the cost model for the meas-urement of property, plant and equipment. ªerefore items of property plant and equipment may not be carried at a re-valued amount after their initial recognition.
3.6. IMPAIRMENT OF TANGIBLE AND INTANGIBLE ASSETS
Except for intangible assets in progress that are tested for impairment annually, tangible and intangible assets are subject to an impairment test only when there is an indica-tion that their carrying amount exceeds their recoverable amount.
If an asset does not generate cash flows independently of those other assets, the Group makes an estimate of the recoverable value of the Cash Generating Unit to which the asset belongs. ªe recoverable value is the highest of either the fair value less costs to sell or the value in use. If the recoverable value of an asset (cash generating unit) is lower than its carrying amount, an impairment loss is immediately recognized as an expense in the income statement either in “Other Operating Expenses” or in impairment loss on non-current assets.
When an impairment is reversed at a later date, the carry-ing amount of the asset (cash generating unit) is increased to the revised estimate of its recoverable value, without however being higher than the carrying amount which would have been determined if no impairment had been recognized for this asset (cash generating unit) during pre-vious periods.
3.7. LEASE
Agreements Capital Leases
A lease is classified as a finance lease if it substantially transfers the entire risks and rewards incidental to owner-ship to the lessee. ªe other lease agreements are classi-fied as operating leases.
At the commencement of the lease term, the Group recog-nizes finance leases as assets and liabilities in its balance sheet at amounts equal to the lower of fair value of the leased property or the present value of the minimum lease payments, each determined at the inception of the lease. ªe corresponding liability is posted in the obligations under finance leases. ªe minimum lease payments are apportioned between the finance charge and the reduction of the outstanding liability. ªe finance charge is allocated to each period during the lease term so as to obtain a con-stant periodic interest rate on the remaining balance of the liability. Leased assets are depreciated over their esti-mated useful life consistently with the method applicable to similar depreciable assets owned by the Group.
Operating Leases
Lease agreements that do not substantially transfer the entire risks and rewards incidental to ownership to the les-see are classified as operating leases. ªe lease payments are recognized as an expense on a straight-line basis over the period of the rental agreement.
3.8. FINANCIAL ASSETS AND LIABILITIES
Financial assets or liabilities are recognized on the balance sheet at the date of the transaction, which corresponds to the date on which the entity contractually commits to buy or sell an asset.
When a financial asset or financial liability is recognized ini-tially, it is measured at its fair value plus (in case of finan-cial asset) or minus (in case of financial liability) transaction costs except for financial assets at fair value through income statement.
Fair value is defined as the amount for which an asset could be exchanged or a liability settled between knowl-edgeable willing parties in an arm’s length transaction. Fair value of a financial liability will be for instance, the cash received from the lenders when the liability is issued.
ªere are four categories of financial assets:
• Financial assets at fair value through profit or loss (des-ignated by the entity or classified as held for trading);
• Held-to-maturity investments;
• Loans and receivables;
• Available-for-sale financial assets.
ªere are two categories of financial liabilities:
• Financial liabilities at fair value through profit or loss;
• Other financial liabilities measured at amortized cost.
Subsequently,
• the fair value changes in financial assets and liabilities at fair value through profit or loss are recognized through the income statement.
• the fair value changes in available for sale assets are recognized directly in the equity until the asset is sold or is identified as impaired. ªen the cumulative gain / loss that had been recognized in equity shall be removed and recognized in income statement.
83 — FINANCIAL STATEMENTS
• investments in equity instruments that are not quoted in an active market and whose fair value cannot be reliably measured by an alternative pricing method are evaluated at cost.
• loans and receivables, held-to-maturity Investments and other financial liabilities are measured at amortized cost using the effective interest rate method, except for fixed term/time deposits, which are valued at cost.
ªe effective interest rate is the rate that exactly discounts estimated future net cash settlements or receipts through the expected life of the financial asset or liability to its net carrying amount.
Trade and Other Receivables (Payables)
Receivables and payables are recognized using the amor-tized cost method i.e. the discounted value of the receiv-able. Based on a thorough and detailed review of the receivables and their specific risk of no –recoverability; appropriate impairment losses are recognized in case of expected default of payments.
Cash and Cash Equivalents
Cash and cash equivalents comprise cash on hand and demand deposits together with short-term, highly liquid investments, that are readily convertible into a known amount of cash, that have a maturity of three months or less, and that are subject to an insignificant risk of change in value. ªese elements are taken into the Balance Sheet at their nominal value. Bank overdrafts are included in the current financial liabilities.
Equity Instruments
Any contract that exhibits a residual interest in the assets of an entity after deducting all of its liabilities is an equity instrument. Equity instruments issued by the Company are measured at their fair value net of issuance costs.
Loans & borrowings
Loans and borrowings are initially recognized at fair value, plus or minus transaction costs. ªey are subsequently measured at amortized cost using the effective interest method. Any subsequent change in value between the fair value and the settlement value (including the redemption premium to be received or paid) is recognized in the income statement over the period of the borrowing (effective inter-est rate method). ªe borrowing issuance costs related to mixed facilities including debt and bank guarantee lines agreement are prorated between the different lines and presented in deduction of the financial liabilities on the balance sheet. ªose costs are amortized on the duration of the borrowing. Regularly the revolving facility is com-pletely utilized. Amounts borrowed as part of the “Credit Revolving Facility” are accounted for under ‘Non-current Financial Liabilities’ when the maturity of those borrowing are above one year and the Group has the possibility to roll-over them at its discretion.
Derivative Financial Instruments
ªe Group enters into derivative financial instruments to manage its exposure to interest rate risks arising from
financing activities and foreign exchange rate risks arising from operational activities (cash flow hedges). ªe Group’s policy is not to enter into speculative transactions nor issue or hold financial instruments for negotiation purposes.
Derivative financial instruments are initially recognized at their fair value and are subsequently revaluated to their fair value at each reporting date.
a) Derivatives qualifying for cash flow hedgeªe effective portion of changes in the fair value of deriv-ative financial instruments qualifying as cash flow hedges are immediately deferred in equity. Gains or losses relat-ing to the ineffective portion are recognized in the income statement.
When the forecast transaction that is hedged results in the recognition of a non-financial asset or liability, then the gains or losses previously deferred in the equity are trans-ferred from equity and included in the initial measurement of the cost of the asset or liability.
When the forecast transaction that is hedged results in the recognition of a financial asset or liability, then the gains or losses previously deferred in the equity are recycled in the income statement in the periods when the hedged item is recognized in the income statement. However if it is likely that part of or the whole cumulative result posted in equity will not be offset in the future period(s), the (portion of the) result unlikely to be offset is recognized in the income statement.
b) Derivatives which do not qualify for hedgingªe changes of fair value of derivative financial instruments that do not qualify for hedge accounting are immediately recognized in the income statement.
c) Derivatives qualifying for accounting treatment through the work in progress account (WIP)
If a derivative financial instrument hedges variations in cash flow relating to a recognized liability, a firm commitment or an expected transaction in the frame of a contract (mainly forward purchases of raw materials, or foreign exchange purchases or sales), a documentation of the cash flow hedge relationship as described in section a) here above will not be prepared. Any gain or loss resulting from the derivative financial instrument is recognized in the income statement as a financial income or expense.
ªese instruments are however submitted to a test of efficiency based on the same methodology as utilized for hedge accounting.
ªe effective part of any gain or loss on the financial instrument is recognized as a cost of the contract and is deferred into a work in progress account (WIP).
ªis element is however not considered for determining the percentage of completion of the contract.
FINANCIAL STATEMENTS
d) Derivatives qualifying for net investment hedge in foreign operations
Derivatives financial instruments hedging net investments in foreign operations are accounted for similarly to cash flow hedges. Any gain or loss on the hedging instrument relating to the effective portion of the hedge is recognized in other comprehensive income and accumulated in the foreign currency translation reserve. ªe gain or loss relat-ing to the ineffective portion is recognized immediately in profit or loss. Gain and loss on the hedging instrument relating to the effective portion of the hedge accumulated in the foreign currency translation reserve are reclassified to profit or loss in the same way as exchange differences relating to the foreign operation.
Stock options
Share options are measured at their fair value at the date of grant. ªis fair value is assessed using the Black & Scholes option pricing model and is expensed on a straight-line basis over the vesting period of these rights, taking into account an estimate of the number of options that will eventually vest.
3.9. INVENTORY
Inventory is carried at the balance sheet at the lower of cost and net realizable value. ªe cost of inventory includes the cost of purchase of direct materials, the cost of con-version (including manufacturing costs) and other costs incurred in bringing the inventory to their present location and condition. ªe cost of interchangeable inventory items is determined using the weighted average cost method. ªe net realizable value is the estimated selling price less the estimated costs of completion and the estimated dis-tribution, selling and marketing costs.
3.10. POST-EMPLOYMENT AND OTHER LONG TERM EMPLOYEE BENEFITS
Post-employment benefits are classified in two categories: defined benefit plans and defined contribution plans.
Defined Contribution Plans
Contributions paid for defined contribution plans are rec-ognized as expenses when employees have rendered the services giving rights to those contributions.
ªe Group Hamon offers defined contribution pension plans with a minimum return guaranteed to the Belgian affiliates. ªerefore those plans are defined benefit plans and have been reclassified as such in this annual report.
For more details, please refer to note 30.
Defined Benefit Plans
For defined benefit plans, the amount recognized in the balance sheet as a net liability (asset) corresponds to the difference between the present value of future obligations and the fair value of the plan assets.
If the calculation of the net obligation gives rise to a sur-plus for the Group, the asset recognized for this surplus is limited to the present value of any future plan refunds or any reduction in future contributions to the plan.
Cost of defined benefits include cost of services and net interest on the net liability (asset) recognized in net results
(respectively in cost of goods sold distribution and mar-keting expenses, general and administration expenses and R&D expenses for the cost of services, and as financial expenses (income) for the net interests), as well as the revaluations of the net liability (asset) recognized in other comprehensive income.
ªe present value of the obligation and the costs of ser-vices are determined by using the “projected unit credit method” and actuarial valuations are performed at the end of each reporting period.
ªe actuarial calculation method implies the use of actu-arial assumptions by the Group, involving the discount rate, evolution of wages, employee turnover and mor-tality tables. ªese actuarial assumptions correspond to the best estimations of the variables that will determine the final cost of post-employment benefits. ªe discount rate reflects the rate of return on high quality corporate bonds with a term equal to the estimated duration of the post-employment benefits obligations.
Other long-term employee benefits
ªe accounting treatment of other long-term employee benefits is similar to the accounting treatment for post-em-ployment benefits, except for the fact that revaluations of the net liability (asset) are accounted for in the income statement.
ªe actuarial calculations of post-employment obligations and other long-term employee benefits are performed by independent actuaries.
3.11. PROVISIONS FOR LIABILITIES AND CHARGES
Provisions are recognized if and only if the Group has a present obligation (legal or constructive) arising from a past event, which will probably result in an outgoing pay-ment for which the amount can be reliably estimated.
Provisions for guarantee are recognized upon delivery of the product, on basis of the best estimate of the expendi-ture necessary for the extinction of the Group’s obligation. ªose provisions take into account the specific risks related to the contract, the market, the technical constrains and results from an agreement between technical, business and financial managers.
Provisions for restructuring are recognized only after the Group has adopted a detailed formal plan that has been publicly announced to the parties involved before the clos-ing date.
Provisions are measured at their present value where the effect of the time value of money is material.
3.12. INCOME
Income is recognized when it is probable that the future economic benefits attributable to a transaction will flow to the Group and if its amount can be measured reliably.
Revenues are measured at the fair value of the counter-part received or to be received and represent amounts to be received following the supply of goods or the rendering of services in the course of the ordinary activities of the Group.
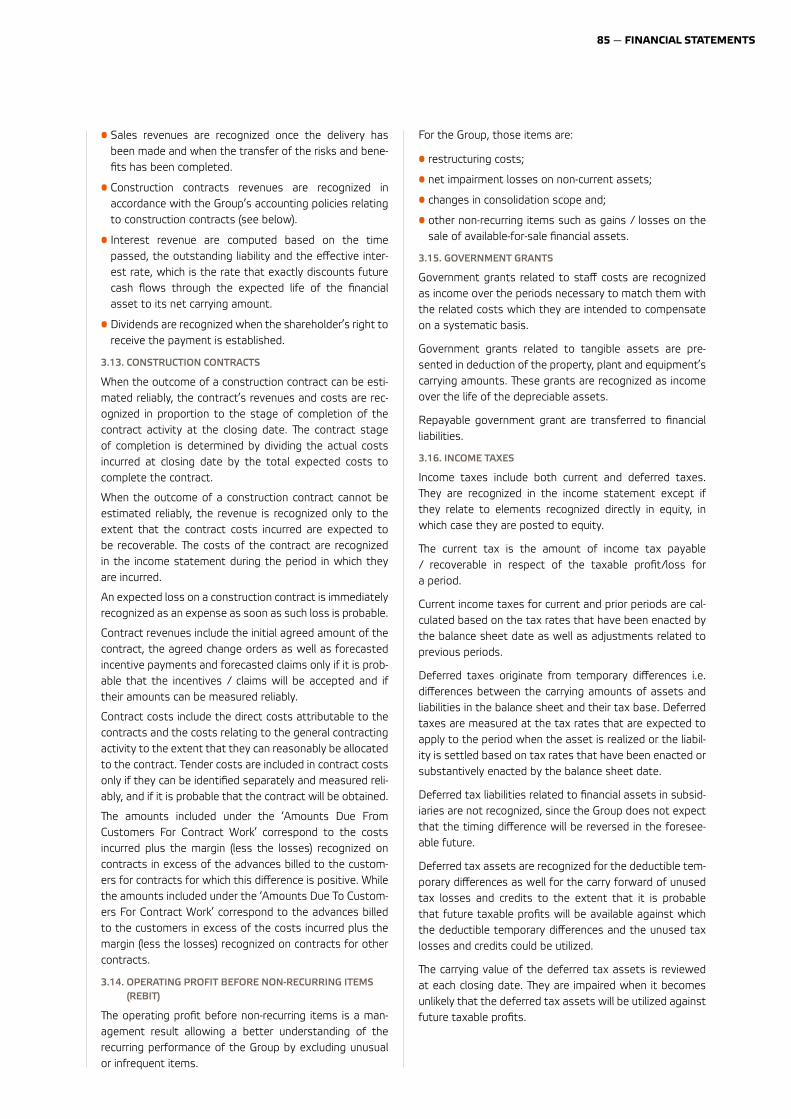
85 — FINANCIAL STATEMENTS
• Sales revenues are recognized once the delivery has been made and when the transfer of the risks and bene-fits has been completed.
• Construction contracts revenues are recognized in accordance with the Group’s accounting policies relating to construction contracts (see below).
• Interest revenue are computed based on the time passed, the outstanding liability and the effective inter-est rate, which is the rate that exactly discounts future cash flows through the expected life of the financial asset to its net carrying amount.
• Dividends are recognized when the shareholder’s right to receive the payment is established.
3.13. CONSTRUCTION CONTRACTS
When the outcome of a construction contract can be esti-mated reliably, the contract’s revenues and costs are rec-ognized in proportion to the stage of completion of the contract activity at the closing date. ªe contract stage of completion is determined by dividing the actual costs incurred at closing date by the total expected costs to complete the contract.
When the outcome of a construction contract cannot be estimated reliably, the revenue is recognized only to the extent that the contract costs incurred are expected to be recoverable. ªe costs of the contract are recognized in the income statement during the period in which they are incurred.
An expected loss on a construction contract is immediately recognized as an expense as soon as such loss is probable.
Contract revenues include the initial agreed amount of the contract, the agreed change orders as well as forecasted incentive payments and forecasted claims only if it is prob-able that the incentives / claims will be accepted and if their amounts can be measured reliably.
Contract costs include the direct costs attributable to the contracts and the costs relating to the general contracting activity to the extent that they can reasonably be allocated to the contract. Tender costs are included in contract costs only if they can be identified separately and measured reli-ably, and if it is probable that the contract will be obtained.
ªe amounts included under the ‘Amounts Due From Customers For Contract Work’ correspond to the costs incurred plus the margin (less the losses) recognized on contracts in excess of the advances billed to the custom-ers for contracts for which this difference is positive. While the amounts included under the ‘Amounts Due To Custom-ers For Contract Work’ correspond to the advances billed to the customers in excess of the costs incurred plus the margin (less the losses) recognized on contracts for other contracts.
3.14. OPERATING PROFIT BEFORE NON-RECURRING ITEMS (REBIT)
ªe operating profit before non-recurring items is a man-agement result allowing a better understanding of the recurring performance of the Group by excluding unusual or infrequent items.
For the Group, those items are:
• restructuring costs;
• net impairment losses on non-current assets;
• changes in consolidation scope and;
• other non-recurring items such as gains / losses on the sale of available-for-sale financial assets.
3.15. GOVERNMENT GRANTS
Government grants related to staff costs are recognized as income over the periods necessary to match them with the related costs which they are intended to compensate on a systematic basis.
Government grants related to tangible assets are pre-sented in deduction of the property, plant and equipment’s carrying amounts. ªese grants are recognized as income over the life of the depreciable assets.
Repayable government grant are transferred to financial liabilities.
3.16. INCOME TAXES
Income taxes include both current and deferred taxes. ªey are recognized in the income statement except if they relate to elements recognized directly in equity, in which case they are posted to equity.
ªe current tax is the amount of income tax payable / recoverable in respect of the taxable profit/loss for a period.
Current income taxes for current and prior periods are cal-culated based on the tax rates that have been enacted by the balance sheet date as well as adjustments related to previous periods.
Deferred taxes originate from temporary differences i.e. differences between the carrying amounts of assets and liabilities in the balance sheet and their tax base. Deferred taxes are measured at the tax rates that are expected to apply to the period when the asset is realized or the liabil-ity is settled based on tax rates that have been enacted or substantively enacted by the balance sheet date.
Deferred tax liabilities related to financial assets in subsid-iaries are not recognized, since the Group does not expect that the timing difference will be reversed in the foresee-able future.
Deferred tax assets are recognized for the deductible tem-porary differences as well for the carry forward of unused tax losses and credits to the extent that it is probable that future taxable profits will be available against which the deductible temporary differences and the unused tax losses and credits could be utilized.
ªe carrying value of the deferred tax assets is reviewed at each closing date. ªey are impaired when it becomes unlikely that the deferred tax assets will be utilized against future taxable profits.
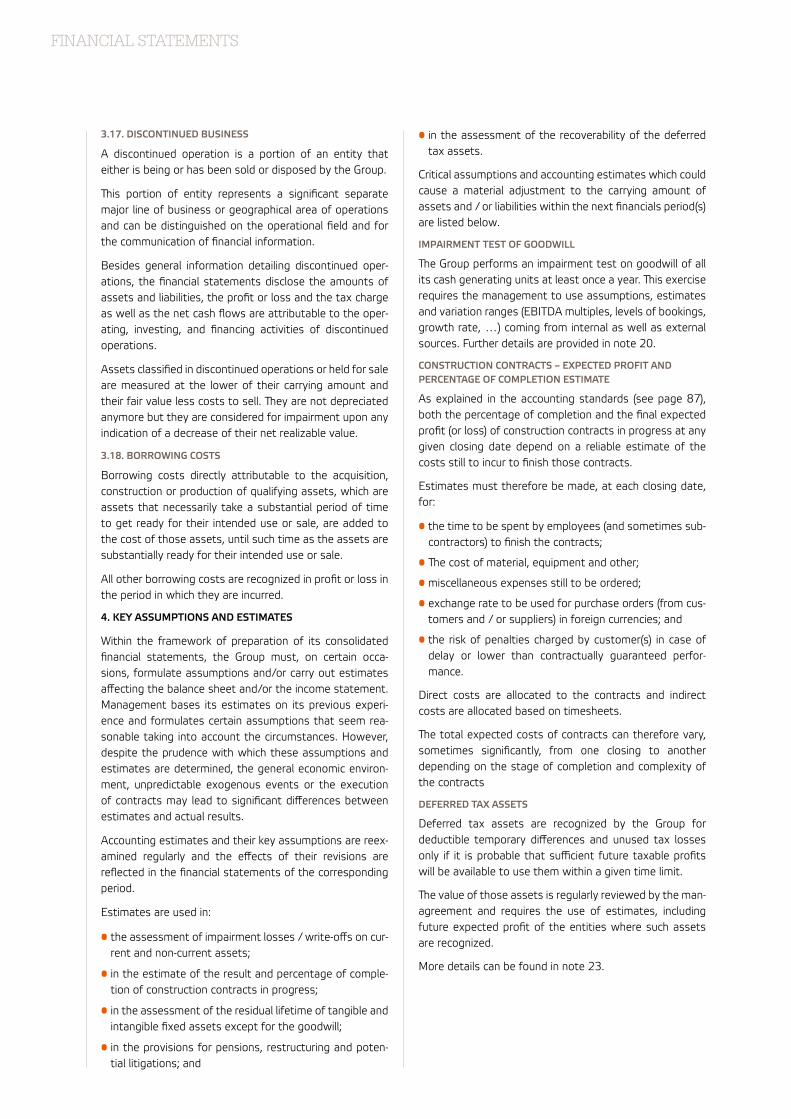
FINANCIAL STATEMENTS
3.17. DISCONTINUED BUSINESS
A discontinued operation is a portion of an entity that either is being or has been sold or disposed by the Group.
ªis portion of entity represents a significant separate major line of business or geographical area of operations and can be distinguished on the operational field and for the communication of financial information.
Besides general information detailing discontinued oper-ations, the financial statements disclose the amounts of assets and liabilities, the profit or loss and the tax charge as well as the net cash flows are attributable to the oper-ating, investing, and financing activities of discontinued operations.
Assets classified in discontinued operations or held for sale are measured at the lower of their carrying amount and their fair value less costs to sell. ªey are not depreciated anymore but they are considered for impairment upon any indication of a decrease of their net realizable value.
3.18. BORROWING COSTS
Borrowing costs directly attributable to the acquisition, construction or production of qualifying assets, which are assets that necessarily take a substantial period of time to get ready for their intended use or sale, are added to the cost of those assets, until such time as the assets are substantially ready for their intended use or sale.
All other borrowing costs are recognized in profit or loss in the period in which they are incurred.
4. KEY ASSUMPTIONS AND ESTIMATES
Within the framework of preparation of its consolidated financial statements, the Group must, on certain occa-sions, formulate assumptions and/or carry out estimates affecting the balance sheet and/or the income statement. Management bases its estimates on its previous experi-ence and formulates certain assumptions that seem rea-sonable taking into account the circumstances. However, despite the prudence with which these assumptions and estimates are determined, the general economic environ-ment, unpredictable exogenous events or the execution of contracts may lead to significant differences between estimates and actual results.
Accounting estimates and their key assumptions are reex-amined regularly and the effects of their revisions are reflected in the financial statements of the corresponding period.
Estimates are used in:
• the assessment of impairment losses / write-offs on cur-rent and non-current assets;
• in the estimate of the result and percentage of comple-tion of construction contracts in progress;
• in the assessment of the residual lifetime of tangible and intangible fixed assets except for the goodwill;
• in the provisions for pensions, restructuring and poten-tial litigations; and
• in the assessment of the recoverability of the deferred tax assets.
Critical assumptions and accounting estimates which could cause a material adjustment to the carrying amount of assets and / or liabilities within the next financials period(s) are listed below.
IMPAIRMENT TEST OF GOODWILL
ªe Group performs an impairment test on goodwill of all its cash generating units at least once a year. ªis exercise requires the management to use assumptions, estimates and variation ranges (EBITDA multiples, levels of bookings, growth rate, …) coming from internal as well as external sources. Further details are provided in note 20.
CONSTRUCTION CONTRACTS – EXPECTED PROFIT AND PERCENTAGE OF COMPLETION ESTIMATE
As explained in the accounting standards (see page 87), both the percentage of completion and the final expected profit (or loss) of construction contracts in progress at any given closing date depend on a reliable estimate of the costs still to incur to finish those contracts.
Estimates must therefore be made, at each closing date, for:
• the time to be spent by employees (and sometimes sub-contractors) to finish the contracts;
• ªe cost of material, equipment and other;
• miscellaneous expenses still to be ordered;
• exchange rate to be used for purchase orders (from cus-tomers and / or suppliers) in foreign currencies; and
• the risk of penalties charged by customer(s) in case of delay or lower than contractually guaranteed perfor-mance.
Direct costs are allocated to the contracts and indirect costs are allocated based on timesheets.
ªe total expected costs of contracts can therefore vary, sometimes significantly, from one closing to another depending on the stage of completion and complexity of the contracts
DEFERRED TAX ASSETS
Deferred tax assets are recognized by the Group for deductible temporary differences and unused tax losses only if it is probable that sufficient future taxable profits will be available to use them within a given time limit.
ªe value of those assets is regularly reviewed by the man-agreement and requires the use of estimates, including future expected profit of the entities where such assets are recognized.
More details can be found in note 23.
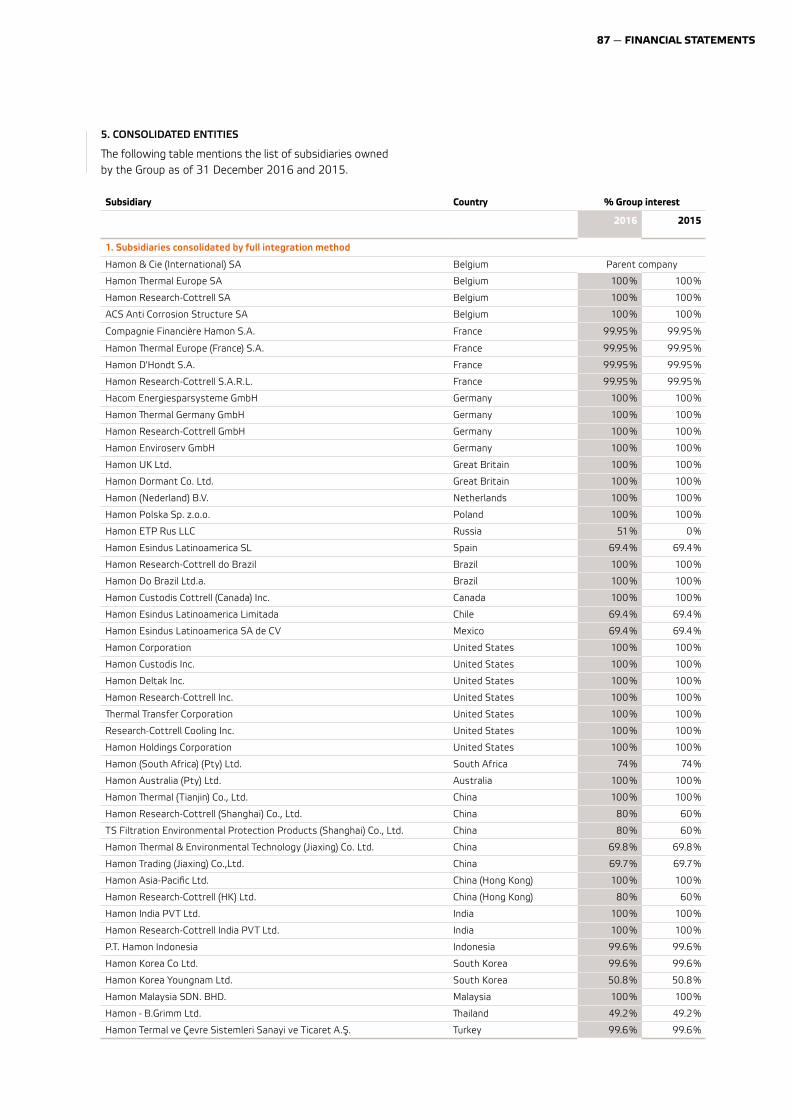
87 — FINANCIAL STATEMENTS
5. CONSOLIDATED ENTITIES
ªe following table mentions the list of subsidiaries owned by the Group as of 31 December 2016 and 2015.
Subsidiary Country % Group interest
2016 2015
1. Subsidiaries consolidated by full integration method
Hamon & Cie (International) SA Belgium Parent company
Hamon ªermal Europe SA Belgium 100 % 100 %
Hamon Research-Cottrell SA Belgium 100 % 100 %
ACS Anti Corrosion Structure SA Belgium 100 % 100 %
Compagnie Financière Hamon S.A. France 99.95 % 99.95 %
Hamon ªermal Europe (France) S.A. France 99.95 % 99.95 %
Hamon D'Hondt S.A. France 99.95 % 99.95 %
Hamon Research-Cottrell S.A.R.L. France 99.95 % 99.95 %
Hacom Energiesparsysteme GmbH Germany 100 % 100 %
Hamon ªermal Germany GmbH Germany 100 % 100 %
Hamon Research-Cottrell GmbH Germany 100 % 100 %
Hamon Enviroserv GmbH Germany 100 % 100 %
Hamon UK Ltd. Great Britain 100 % 100 %
Hamon Dormant Co. Ltd. Great Britain 100 % 100 %
Hamon (Nederland) B.V. Netherlands 100 % 100 %
Hamon Polska Sp. z.o.o. Poland 100 % 100 %
Hamon ETP Rus LLC Russia 51 % 0 %
Hamon Esindus Latinoamerica SL Spain 69.4 % 69.4 %
Hamon Research-Cottrell do Brazil Brazil 100 % 100 %
Hamon Do Brazil Ltd.a. Brazil 100 % 100 %
Hamon Custodis Cottrell (Canada) Inc. Canada 100 % 100 %
Hamon Esindus Latinoamerica Limitada Chile 69.4 % 69.4 %
Hamon Esindus Latinoamerica SA de CV Mexico 69.4 % 69.4 %
Hamon Corporation United States 100 % 100 %
Hamon Custodis Inc. United States 100 % 100 %
Hamon Deltak Inc. United States 100 % 100 %
Hamon Research-Cottrell Inc. United States 100 % 100 %
ªermal Transfer Corporation United States 100 % 100 %
Research-Cottrell Cooling Inc. United States 100 % 100 %
Hamon Holdings Corporation United States 100 % 100 %
Hamon (South Africa) (Pty) Ltd. South Africa 74 % 74 %
Hamon Australia (Pty) Ltd. Australia 100 % 100 %
Hamon ªermal (Tianjin) Co., Ltd. China 100 % 100 %
Hamon Research-Cottrell (Shanghai) Co., Ltd. China 80 % 60 %
TS Filtration Environmental Protection Products (Shanghai) Co., Ltd. China 80 % 60 %
Hamon ªermal & Environmental Technology (Jiaxing) Co. Ltd. China 69.8 % 69.8 %
Hamon Trading (Jiaxing) Co.,Ltd. China 69.7 % 69.7 %
Hamon Asia-Pacific Ltd. China (Hong Kong) 100 % 100 %
Hamon Research-Cottrell (HK) Ltd. China (Hong Kong) 80 % 60 %
Hamon India PVT Ltd. India 100 % 100 %
Hamon Research-Cottrell India PVT Ltd. India 100 % 100 %
P.T. Hamon Indonesia Indonesia 99.6 % 99.6 %
Hamon Korea Co Ltd. South Korea 99.6 % 99.6 %
Hamon Korea Youngnam Ltd. South Korea 50.8 % 50.8 %
Hamon Malaysia SDN. BHD. Malaysia 100 % 100 %
Hamon - B.Grimm Ltd. ªailand 49.2 % 49.2 %
Hamon Termal ve Çevre Sistemleri Sanayi ve Ticaret A.Ş. Turkey 99.6 % 99.6 %
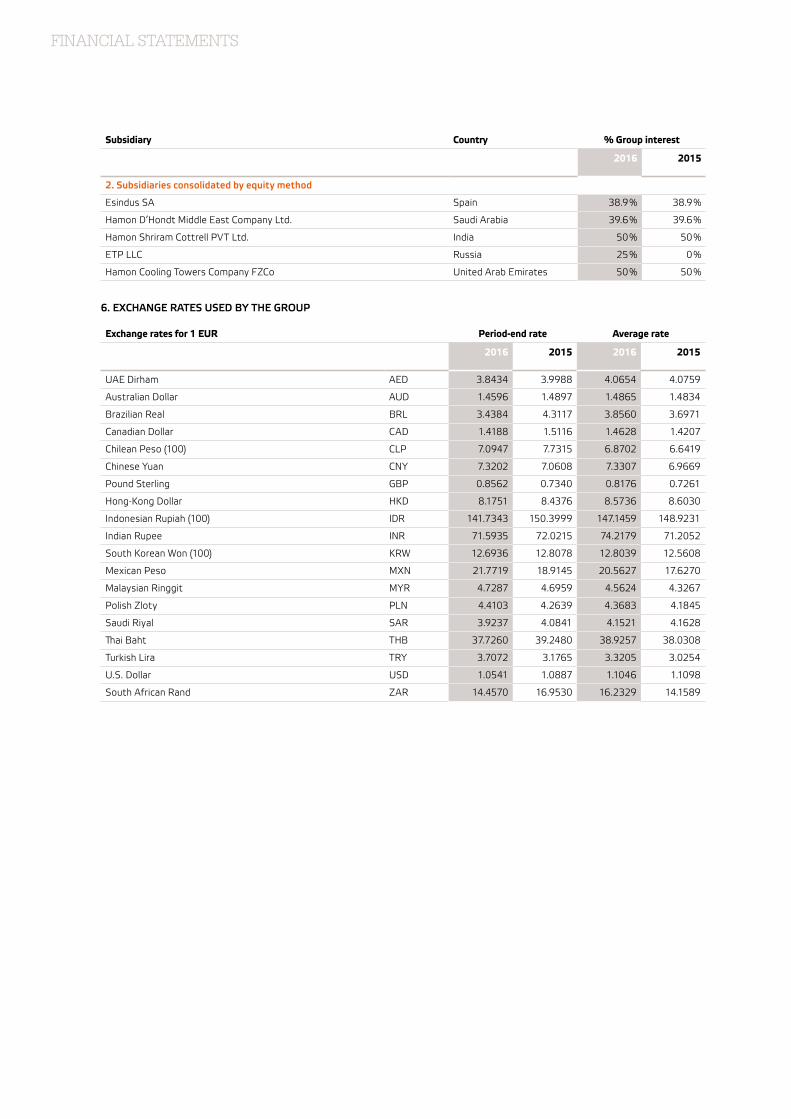
FINANCIAL STATEMENTS
Subsidiary Country % Group interest
2016 2015
2. Subsidiaries consolidated by equity method
Esindus SA Spain 38.9 % 38.9 %
Hamon D’Hondt Middle East Company Ltd. Saudi Arabia 39.6 % 39.6 %
Hamon Shriram Cottrell PVT Ltd. India 50 % 50 %
ETP LLC Russia 25 % 0 %
Hamon Cooling Towers Company FZCo United Arab Emirates 50 % 50 %
6. EXCHANGE RATES USED BY THE GROUP
Exchange rates for 1 EUR Period-end rate Average rate
2016 2015 2016 2015
UAE Dirham AED 3.8434 3.9988 4.0654 4.0759
Australian Dollar AUD 1.4596 1.4897 1.4865 1.4834
Brazilian Real BRL 3.4384 4.3117 3.8560 3.6971
Canadian Dollar CAD 1.4188 1.5116 1.4628 1.4207
Chilean Peso (100) CLP 7.0947 7.7315 6.8702 6.6419
Chinese Yuan CNY 7.3202 7.0608 7.3307 6.9669
Pound Sterling GBP 0.8562 0.7340 0.8176 0.7261
Hong-Kong Dollar HKD 8.1751 8.4376 8.5736 8.6030
Indonesian Rupiah (100) IDR 141.7343 150.3999 147.1459 148.9231
Indian Rupee INR 71.5935 72.0215 74.2179 71.2052
South Korean Won (100) KRW 12.6936 12.8078 12.8039 12.5608
Mexican Peso MXN 21.7719 18.9145 20.5627 17.6270
Malaysian Ringgit MYR 4.7287 4.6959 4.5624 4.3267
Polish Zloty PLN 4.4103 4.2639 4.3683 4.1845
Saudi Riyal SAR 3.9237 4.0841 4.1521 4.1628
ªai Baht THB 37.7260 39.2480 38.9257 38.0308
Turkish Lira TRY 3.7072 3.1765 3.3205 3.0254
U.S. Dollar USD 1.0541 1.0887 1.1046 1.1098
South African Rand ZAR 14.4570 16.9530 16.2329 14.1589
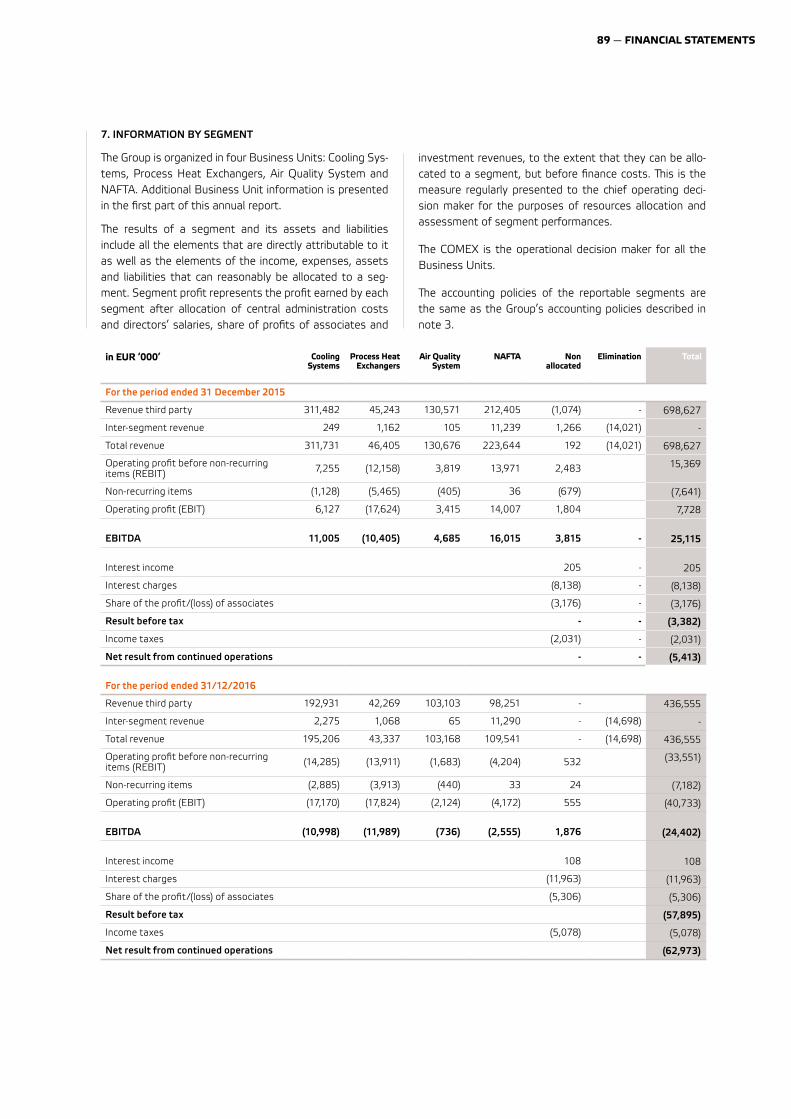
89 — FINANCIAL STATEMENTS
7. INFORMATION BY SEGMENT
ªe Group is organized in four Business Units: Cooling Sys-tems, Process Heat Exchangers, Air Quality System and NAFTA. Additional Business Unit information is presented in the first part of this annual report.
ªe results of a segment and its assets and liabilities include all the elements that are directly attributable to it as well as the elements of the income, expenses, assets and liabilities that can reasonably be allocated to a seg-ment. Segment profit represents the profit earned by each segment after allocation of central administration costs and directors’ salaries, share of profits of associates and
investment revenues, to the extent that they can be allo-cated to a segment, but before finance costs. ªis is the measure regularly presented to the chief operating deci-sion maker for the purposes of resources allocation and assessment of segment performances.
ªe COMEX is the operational decision maker for all the Business Units.
ªe accounting policies of the reportable segments are the same as the Group’s accounting policies described in note 3.
in EUR ‘000’ Cooling Systems
Process Heat Exchangers
Air Quality System
NAFTA Non allocated
Elimination Total
For the period ended 31 December 2015
Revenue third party 311,482 45,243 130,571 212,405 (1,074) - 698,627
Inter-segment revenue 249 1,162 105 11,239 1,266 (14,021) -
Total revenue 311,731 46,405 130,676 223,644 192 (14,021) 698,627
Operating profit before non-recurring items (REBIT) 7,255 (12,158) 3,819 13,971 2,483 15,369
Non-recurring items (1,128) (5,465) (405) 36 (679) (7,641)
Operating profit (EBIT) 6,127 (17,624) 3,415 14,007 1,804 7,728
EBITDA 11,005 (10,405) 4,685 16,015 3,815 - 25,115
Interest income 205 - 205
Interest charges (8,138) - (8,138)
Share of the profit/(loss) of associates (3,176) - (3,176)
Result before tax - - (3,382)
Income taxes (2,031) - (2,031)
Net result from continued operations - - (5,413)
For the period ended 31/12/2016
Revenue third party 192,931 42,269 103,103 98,251 - 436,555
Inter-segment revenue 2,275 1,068 65 11,290 - (14,698) -
Total revenue 195,206 43,337 103,168 109,541 - (14,698) 436,555
Operating profit before non-recurring items (REBIT) (14,285) (13,911) (1,683) (4,204) 532 (33,551)
Non-recurring items (2,885) (3,913) (440) 33 24 (7,182)
Operating profit (EBIT) (17,170) (17,824) (2,124) (4,172) 555 (40,733)
EBITDA (10,998) (11,989) (736) (2,555) 1,876 (24,402)
Interest income 108 108
Interest charges (11,963) (11,963)
Share of the profit/(loss) of associates (5,306) (5,306)
Result before tax (57,895)
Income taxes (5,078) (5,078)
Net result from continued operations (62,973)
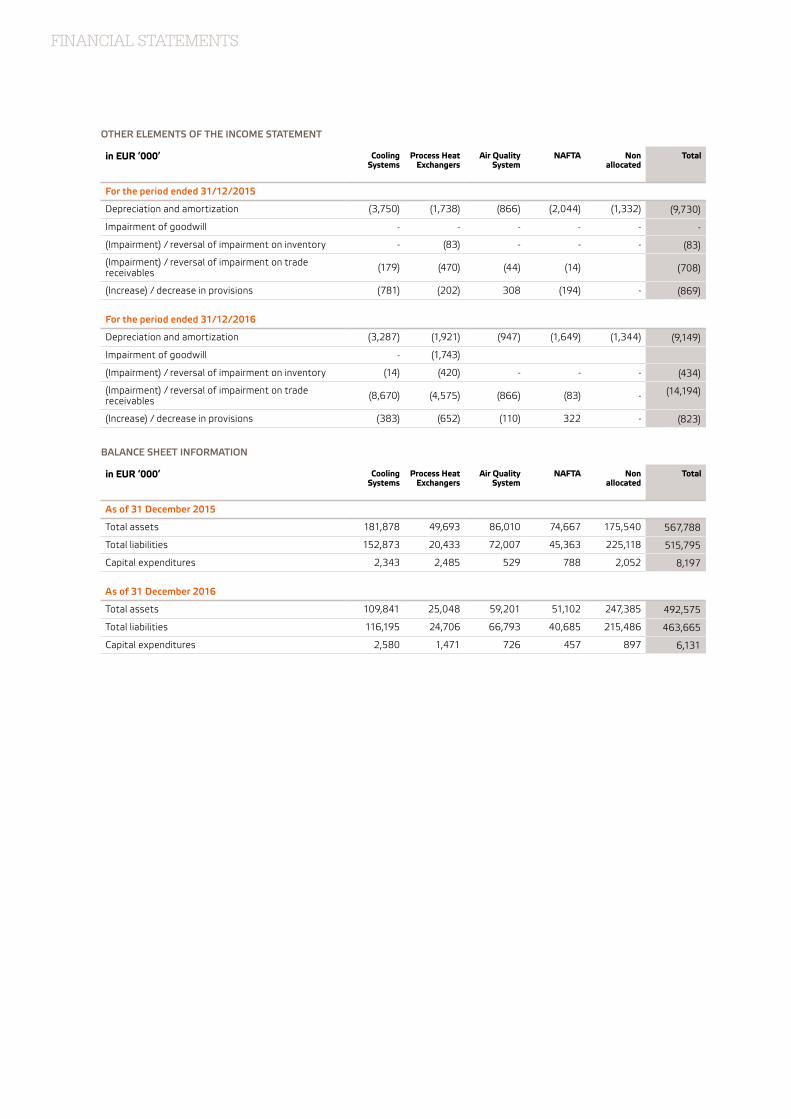
FINANCIAL STATEMENTS
OTHER ELEMENTS OF THE INCOME STATEMENT
in EUR ‘000’ Cooling Systems
Process Heat Exchangers
Air Quality System
NAFTA Non allocated
Total
For the period ended 31/12/2015
Depreciation and amortization (3,750) (1,738) (866) (2,044) (1,332) (9,730)
Impairment of goodwill - - - - - -
(Impairment) / reversal of impairment on inventory - (83) - - - (83)
(Impairment) / reversal of impairment on trade receivables (179) (470) (44) (14) (708)
(Increase) / decrease in provisions (781) (202) 308 (194) - (869)
For the period ended 31/12/2016
Depreciation and amortization (3,287) (1,921) (947) (1,649) (1,344) (9,149)
Impairment of goodwill - (1,743)
(Impairment) / reversal of impairment on inventory (14) (420) - - - (434)
(Impairment) / reversal of impairment on trade receivables (8,670) (4,575) (866) (83) - (14,194)
(Increase) / decrease in provisions (383) (652) (110) 322 - (823)
BALANCE SHEET INFORMATION
in EUR ‘000’ Cooling Systems
Process Heat Exchangers
Air Quality System
NAFTA Non allocated
Total
As of 31 December 2015
Total assets 181,878 49,693 86,010 74,667 175,540 567,788
Total liabilities 152,873 20,433 72,007 45,363 225,118 515,795
Capital expenditures 2,343 2,485 529 788 2,052 8,197
As of 31 December 2016
Total assets 109,841 25,048 59,201 51,102 247,385 492,575
Total liabilities 116,195 24,706 66,793 40,685 215,486 463,665
Capital expenditures 2,580 1,471 726 457 897 6,131
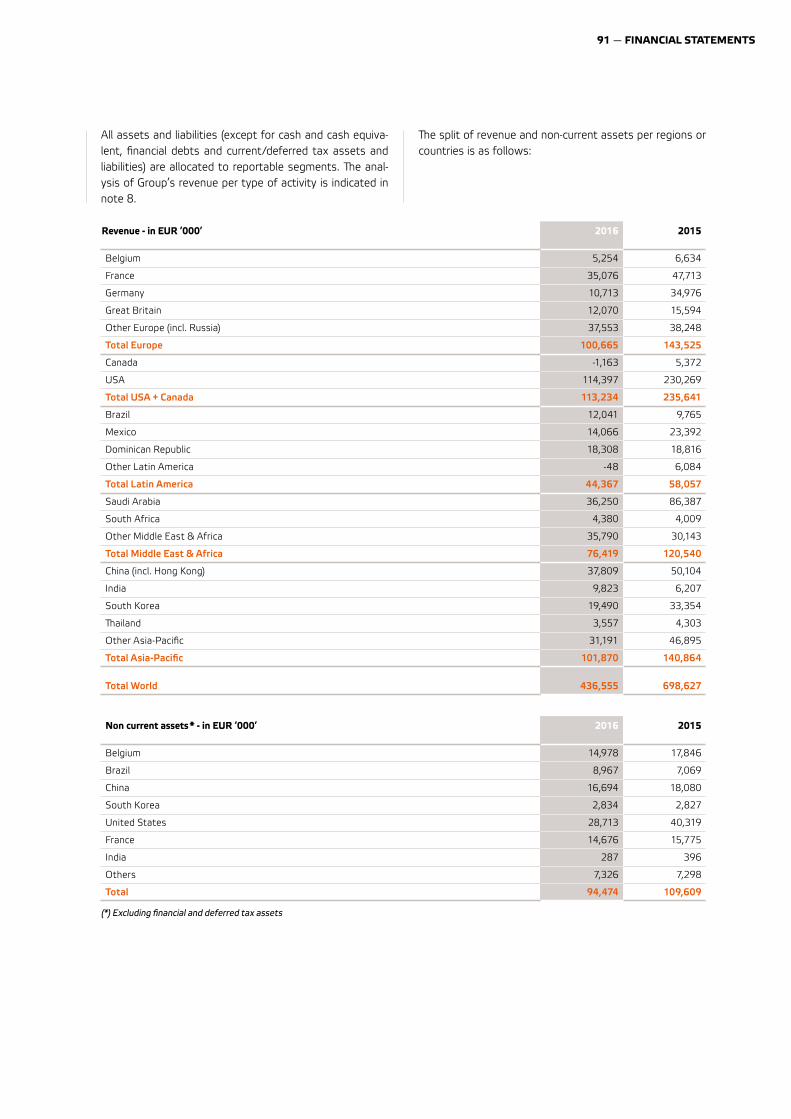
91 — FINANCIAL STATEMENTS
All assets and liabilities (except for cash and cash equiva-lent, financial debts and current/deferred tax assets and liabilities) are allocated to reportable segments. ªe anal-ysis of Group’s revenue per type of activity is indicated in note 8.
ªe split of revenue and non-current assets per regions or countries is as follows:
Revenue - in EUR ‘000’ 2016 2015
Belgium 5,254 6,634
France 35,076 47,713
Germany 10,713 34,976
Great Britain 12,070 15,594
Other Europe (incl. Russia) 37,553 38,248
Total Europe 100,665 143,525
Canada -1,163 5,372
USA 114,397 230,269
Total USA + Canada 113,234 235,641
Brazil 12,041 9,765
Mexico 14,066 23,392
Dominican Republic 18,308 18,816
Other Latin America -48 6,084
Total Latin America 44,367 58,057
Saudi Arabia 36,250 86,387
South Africa 4,380 4,009
Other Middle East & Africa 35,790 30,143
Total Middle East & Africa 76,419 120,540
China (incl. Hong Kong) 37,809 50,104
India 9,823 6,207
South Korea 19,490 33,354
ªailand 3,557 4,303
Other Asia-Pacific 31,191 46,895
Total Asia-Pacific 101,870 140,864
Total World 436,555 698,627
Non current assets * - in EUR ‘000’ 2016 2015
Belgium 14,978 17,846
Brazil 8,967 7,069
China 16,694 18,080
South Korea 2,834 2,827
United States 28,713 40,319
France 14,676 15,775
India 287 396
Others 7,326 7,298
Total 94,474 109,609
(*) Excluding financial and deferred tax assets
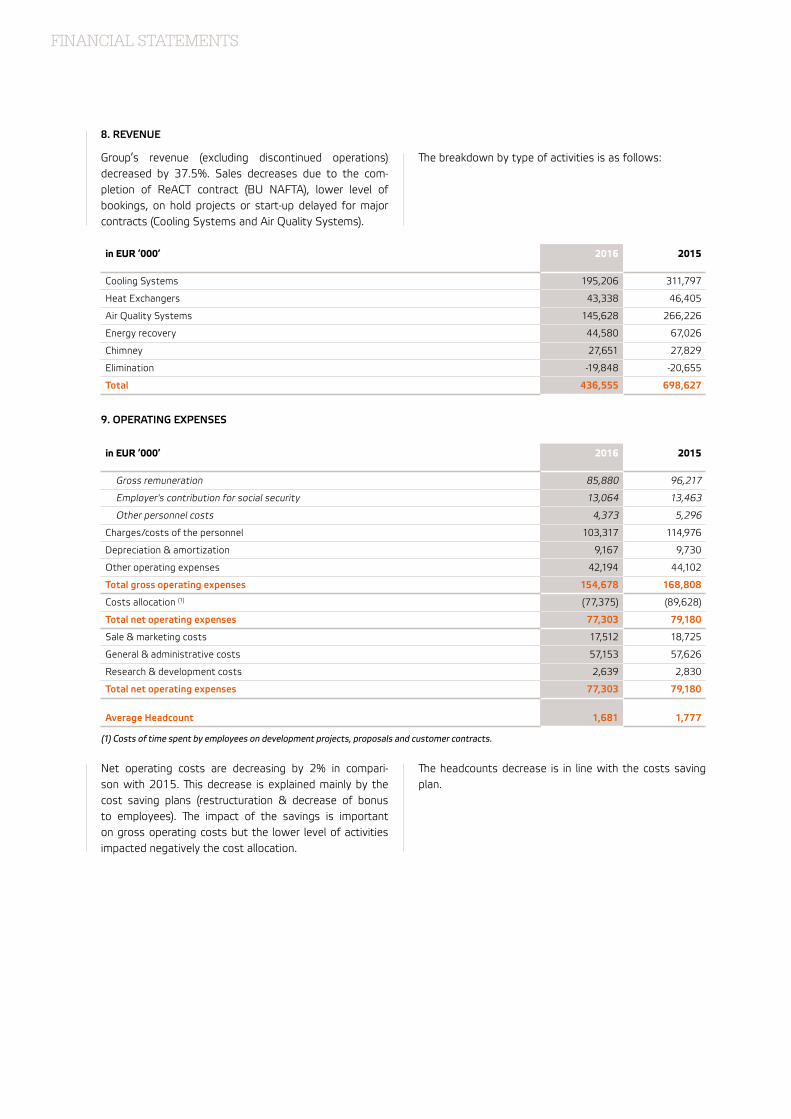
FINANCIAL STATEMENTS
8. REVENUE
Group’s revenue (excluding discontinued operations) decreased by 37.5%. Sales decreases due to the com-pletion of ReACT contract (BU NAFTA), lower level of bookings, on hold projects or start-up delayed for major contracts (Cooling Systems and Air Quality Systems).
ªe breakdown by type of activities is as follows:
in EUR ‘000’ 2016 2015
Cooling Systems 195,206 311,797
Heat Exchangers 43,338 46,405
Air Quality Systems 145,628 266,226
Energy recovery 44,580 67,026
Chimney 27,651 27,829
Elimination -19,848 -20,655
Total 436,555 698,627
9. OPERATING EXPENSES
in EUR ‘000’ 2016 2015
Gross remuneration 85,880 96,217
Employer's contribution for social security 13,064 13,463
Other personnel costs 4,373 5,296
Charges/costs of the personnel 103,317 114,976
Depreciation & amortization 9,167 9,730
Other operating expenses 42,194 44,102
Total gross operating expenses 154,678 168,808
Costs allocation (1) (77,375) (89,628)
Total net operating expenses 77,303 79,180
Sale & marketing costs 17,512 18,725
General & administrative costs 57,153 57,626
Research & development costs 2,639 2,830
Total net operating expenses 77,303 79,180
Average Headcount 1,681 1,777
(1) Costs of time spent by employees on development projects, proposals and customer contracts.
Net operating costs are decreasing by 2% in compari-son with 2015. ªis decrease is explained mainly by the cost saving plans (restructuration & decrease of bonus to employees). ªe impact of the savings is important on gross operating costs but the lower level of activities impacted negatively the cost allocation.
ªe headcounts decrease is in line with the costs saving plan.
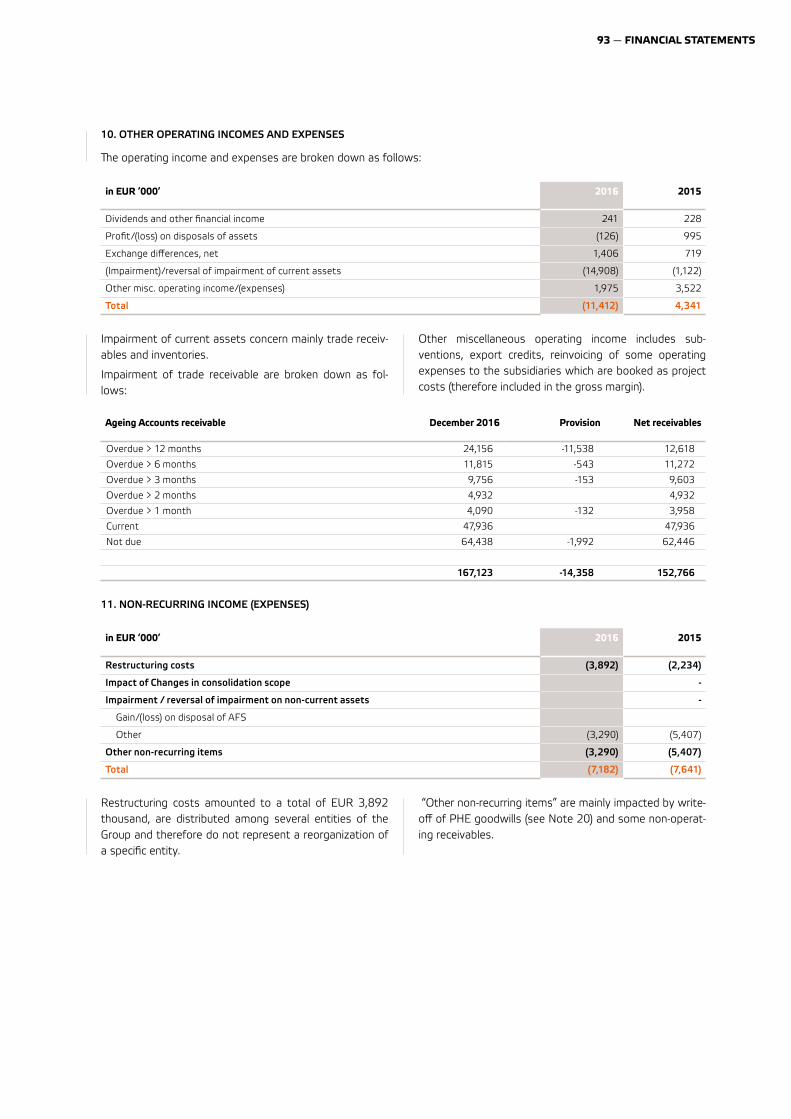
93 — FINANCIAL STATEMENTS
10. OTHER OPERATING INCOMES AND EXPENSES
ªe operating income and expenses are broken down as follows:
in EUR ‘000’ 2016 2015
Dividends and other financial income 241 228
Profit/(loss) on disposals of assets (126) 995
Exchange differences, net 1,406 719
(Impairment)/reversal of impairment of current assets (14,908) (1,122)
Other misc. operating income/(expenses) 1,975 3,522
Total (11,412) 4,341
Impairment of current assets concern mainly trade receiv-ables and inventories.
Impairment of trade receivable are broken down as fol-lows:
Other miscellaneous operating income includes sub-ventions, export credits, reinvoicing of some operating expenses to the subsidiaries which are booked as project costs (therefore included in the gross margin).
11. NON-RECURRING INCOME (EXPENSES)
in EUR ‘000’ 2016 2015
Restructuring costs (3,892) (2,234)
Impact of Changes in consolidation scope -
Impairment / reversal of impairment on non-current assets -
Gain/(loss) on disposal of AFS
Other (3,290) (5,407)
Other non-recurring items (3,290) (5,407)
Total (7,182) (7,641)
Restructuring costs amounted to a total of EUR 3,892 thousand, are distributed among several entities of the Group and therefore do not represent a reorganization of a specific entity.
“Other non-recurring items” are mainly impacted by write-off of PHE goodwills (see Note 20) and some non-operat-ing receivables.
Ageing Accounts receivable December 2016 Provision Net receivables
Overdue > 12 months 24,156 -11,538 12,618
Overdue > 6 months 11,815 -543 11,272
Overdue > 3 months 9,756 -153 9,603
Overdue > 2 months 4,932 4,932
Overdue > 1 month 4,090 -132 3,958
Current 47,936 47,936
Not due 64,438 -1,992 62,446
167,123 -14,358 152,766
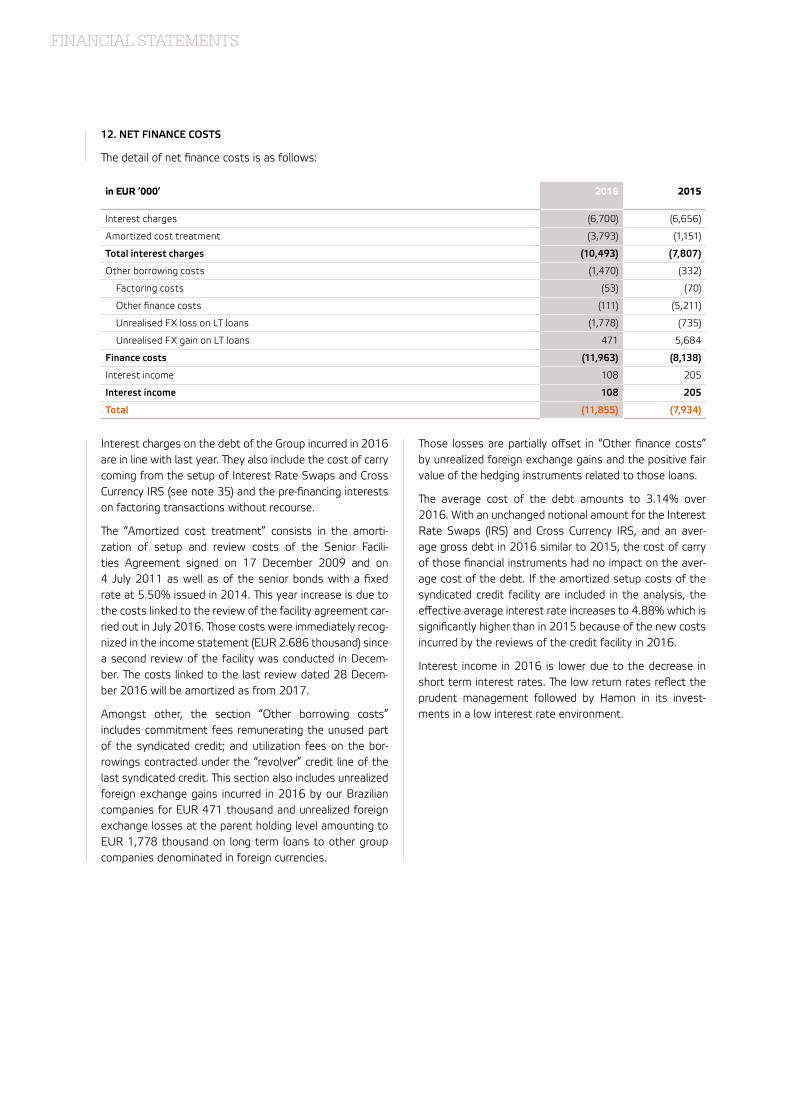
FINANCIAL STATEMENTS
12. NET FINANCE COSTS
ªe detail of net finance costs is as follows:
in EUR ‘000’ 2016 2015
Interest charges (6,700) (6,656)
Amortized cost treatment (3,793) (1,151)
Total interest charges (10,493) (7,807)
Other borrowing costs (1,470) (332)
Factoring costs (53) (70)
Other finance costs (111) (5,211)
Unrealised FX loss on LT loans (1,778) (735)
Unrealised FX gain on LT loans 471 5,684
Finance costs (11,963) (8,138)
Interest income 108 205
Interest income 108 205
Total (11,855) (7,934)
Interest charges on the debt of the Group incurred in 2016 are in line with last year. ªey also include the cost of carry coming from the setup of Interest Rate Swaps and Cross Currency IRS (see note 35) and the pre-financing interests on factoring transactions without recourse.
ªe “Amortized cost treatment” consists in the amorti-zation of setup and review costs of the Senior Facili-ties Agreement signed on 17 December 2009 and on 4 July 2011 as well as of the senior bonds with a fixed rate at 5.50% issued in 2014. ªis year increase is due to the costs linked to the review of the facility agreement car-ried out in July 2016. ªose costs were immediately recog-nized in the income statement (EUR 2.686 thousand) since a second review of the facility was conducted in Decem-ber. ªe costs linked to the last review dated 28 Decem-ber 2016 will be amortized as from 2017.
Amongst other, the section “Other borrowing costs” includes commitment fees remunerating the unused part of the syndicated credit; and utilization fees on the bor-rowings contracted under the “revolver” credit line of the last syndicated credit. ªis section also includes unrealized foreign exchange gains incurred in 2016 by our Brazilian companies for EUR 471 thousand and unrealized foreign exchange losses at the parent holding level amounting to EUR 1,778 thousand on long term loans to other group companies denominated in foreign currencies.
ªose losses are partially offset in “Other finance costs” by unrealized foreign exchange gains and the positive fair value of the hedging instruments related to those loans.
ªe average cost of the debt amounts to 3.14% over 2016. With an unchanged notional amount for the Interest Rate Swaps (IRS) and Cross Currency IRS, and an aver-age gross debt in 2016 similar to 2015, the cost of carry of those financial instruments had no impact on the aver-age cost of the debt. If the amortized setup costs of the syndicated credit facility are included in the analysis, the effective average interest rate increases to 4.88% which is significantly higher than in 2015 because of the new costs incurred by the reviews of the credit facility in 2016.
Interest income in 2016 is lower due to the decrease in short term interest rates. ªe low return rates reflect the prudent management followed by Hamon in its invest-ments in a low interest rate environment.
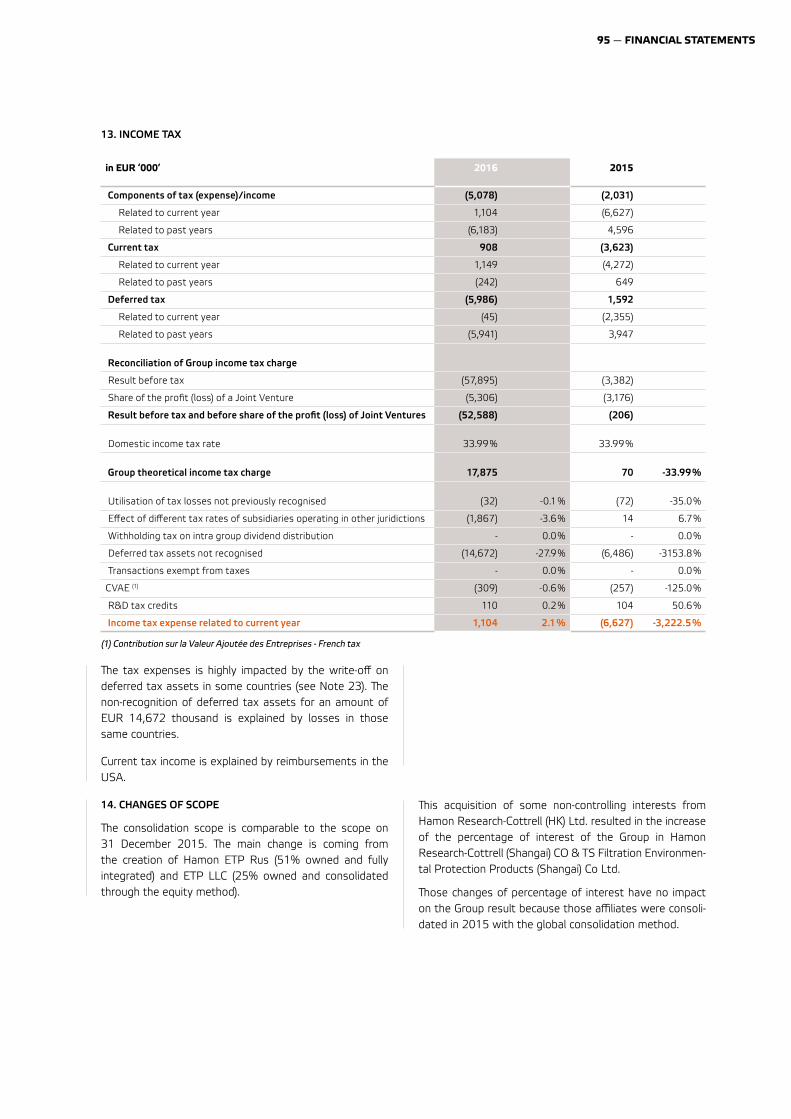
95 — FINANCIAL STATEMENTS
13. INCOME TAX
in EUR ‘000’ 2016 2015
Components of tax (expense)/income (5,078) (2,031)
Related to current year 1,104 (6,627)
Related to past years (6,183) 4,596
Current tax 908 (3,623)
Related to current year 1,149 (4,272)
Related to past years (242) 649
Deferred tax (5,986) 1,592
Related to current year (45) (2,355)
Related to past years (5,941) 3,947
Reconciliation of Group income tax charge
Result before tax (57,895) (3,382)
Share of the profit (loss) of a Joint Venture (5,306) (3,176)
Result before tax and before share of the profit (loss) of Joint Ventures (52,588) (206)
Domestic income tax rate 33.99 % 33.99 %
Group theoretical income tax charge 17,875 70 -33.99 %
Utilisation of tax losses not previously recognised (32) -0.1 % (72) -35.0 %
Effect of different tax rates of subsidiaries operating in other juridictions (1,867) -3.6 % 14 6.7 %
Withholding tax on intra group dividend distribution - 0.0 % - 0.0 %
Deferred tax assets not recognised (14,672) -27.9 % (6,486) -3153.8 %
Transactions exempt from taxes - 0.0 % - 0.0 %
CVAE (1) (309) -0.6 % (257) -125.0 %
R&D tax credits 110 0.2 % 104 50.6 %
Income tax expense related to current year 1,104 2.1 % (6,627) -3,222.5 %
(1) Contribution sur la Valeur Ajoutée des Entreprises - French tax
ªe tax expenses is highly impacted by the write-off on deferred tax assets in some countries (see Note 23). ªe non-recognition of deferred tax assets for an amount of EUR 14,672 thousand is explained by losses in those same countries.
Current tax income is explained by reimbursements in the USA.
14. CHANGES OF SCOPE
ªe consolidation scope is comparable to the scope on 31 December 2015. ªe main change is coming from the creation of Hamon ETP Rus (51% owned and fully integrated) and ETP LLC (25% owned and consolidated through the equity method).
ªis acquisition of some non-controlling interests from Hamon Research-Cottrell (HK) Ltd. resulted in the increase of the percentage of interest of the Group in Hamon Research-Cottrell (Shangai) CO & TS Filtration Environmen-tal Protection Products (Shangai) Co Ltd.
ªose changes of percentage of interest have no impact on the Group result because those affiliates were consoli-dated in 2015 with the global consolidation method.
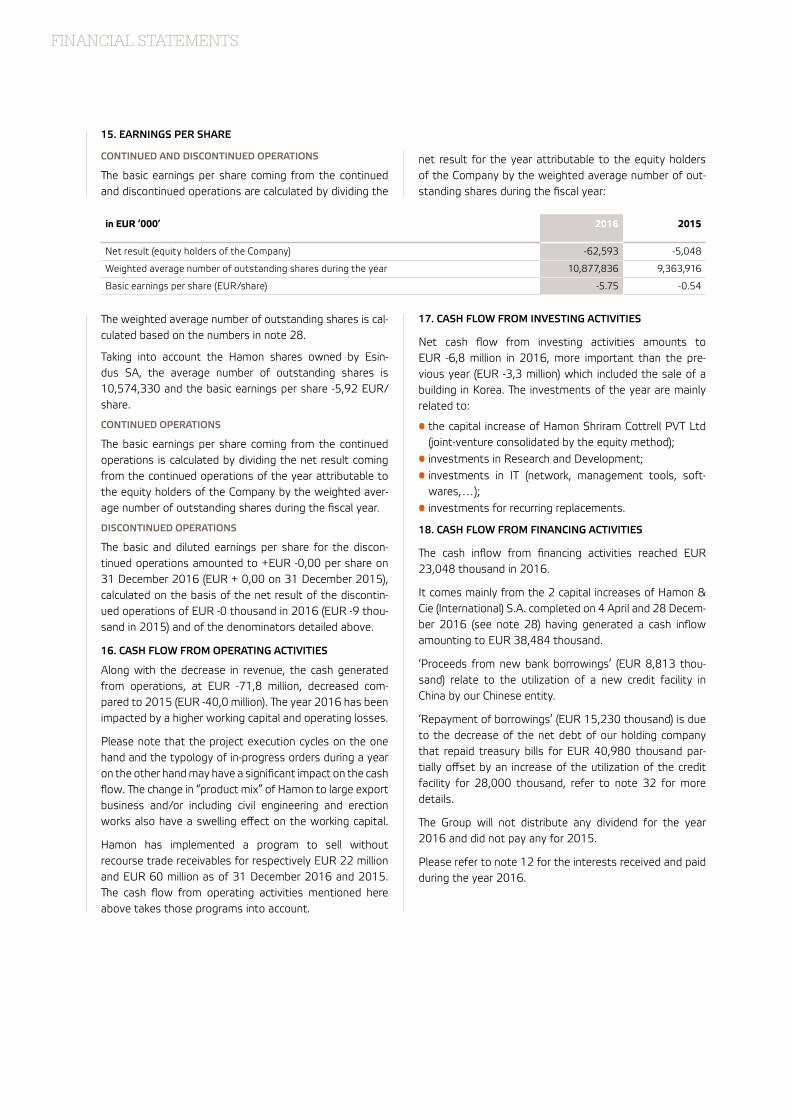
FINANCIAL STATEMENTS
15. EARNINGS PER SHARE
CONTINUED AND DISCONTINUED OPERATIONS
ªe basic earnings per share coming from the continued and discontinued operations are calculated by dividing the
net result for the year attributable to the equity holders of the Company by the weighted average number of out-standing shares during the fiscal year:
in EUR ‘000’ 2016 2015
Net result (equity holders of the Company) -62,593 -5,048
Weighted average number of outstanding shares during the year 10,877,836 9,363,916
Basic earnings per share (EUR/share) -5.75 -0.54
ªe weighted average number of outstanding shares is cal-culated based on the numbers in note 28.
Taking into account the Hamon shares owned by Esin-dus SA, the average number of outstanding shares is 10,574,330 and the basic earnings per share -5,92 EUR/ share.
CONTINUED OPERATIONS
ªe basic earnings per share coming from the continued operations is calculated by dividing the net result coming from the continued operations of the year attributable to the equity holders of the Company by the weighted aver-age number of outstanding shares during the fiscal year.
DISCONTINUED OPERATIONS
ªe basic and diluted earnings per share for the discon-tinued operations amounted to +EUR -0,00 per share on 31 December 2016 (EUR + 0,00 on 31 December 2015), calculated on the basis of the net result of the discontin-ued operations of EUR -0 thousand in 2016 (EUR -9 thou-sand in 2015) and of the denominators detailed above.
16. CASH FLOW FROM OPERATING ACTIVITIES
Along with the decrease in revenue, the cash generated from operations, at EUR -71,8 million, decreased com-pared to 2015 (EUR -40,0 million). ªe year 2016 has been impacted by a higher working capital and operating losses.
Please note that the project execution cycles on the one hand and the typology of in-progress orders during a year on the other hand may have a significant impact on the cash flow. ªe change in “product mix” of Hamon to large export business and/or including civil engineering and erection works also have a swelling effect on the working capital.
Hamon has implemented a program to sell without recourse trade receivables for respectively EUR 22 million and EUR 60 million as of 31 December 2016 and 2015. ªe cash flow from operating activities mentioned here above takes those programs into account.
17. CASH FLOW FROM INVESTING ACTIVITIES
Net cash flow from investing activities amounts to EUR -6,8 million in 2016, more important than the pre-vious year (EUR -3,3 million) which included the sale of a building in Korea. ªe investments of the year are mainly related to:
• the capital increase of Hamon Shriram Cottrell PVT Ltd (joint-venture consolidated by the equity method);
• investments in Research and Development;• investments in IT (network, management tools, soft-
wares,…);• investments for recurring replacements.
18. CASH FLOW FROM FINANCING ACTIVITIES
ªe cash inflow from financing activities reached EUR 23,048 thousand in 2016.
It comes mainly from the 2 capital increases of Hamon & Cie (International) S.A. completed on 4 April and 28 Decem-ber 2016 (see note 28) having generated a cash inflow amounting to EUR 38,484 thousand.
‘Proceeds from new bank borrowings’ (EUR 8,813 thou-sand) relate to the utilization of a new credit facility in China by our Chinese entity.
‘Repayment of borrowings’ (EUR 15,230 thousand) is due to the decrease of the net debt of our holding company that repaid treasury bills for EUR 40,980 thousand par-tially offset by an increase of the utilization of the credit facility for 28,000 thousand, refer to note 32 for more details.
ªe Group will not distribute any dividend for the year 2016 and did not pay any for 2015.
Please refer to note 12 for the interests received and paid during the year 2016.
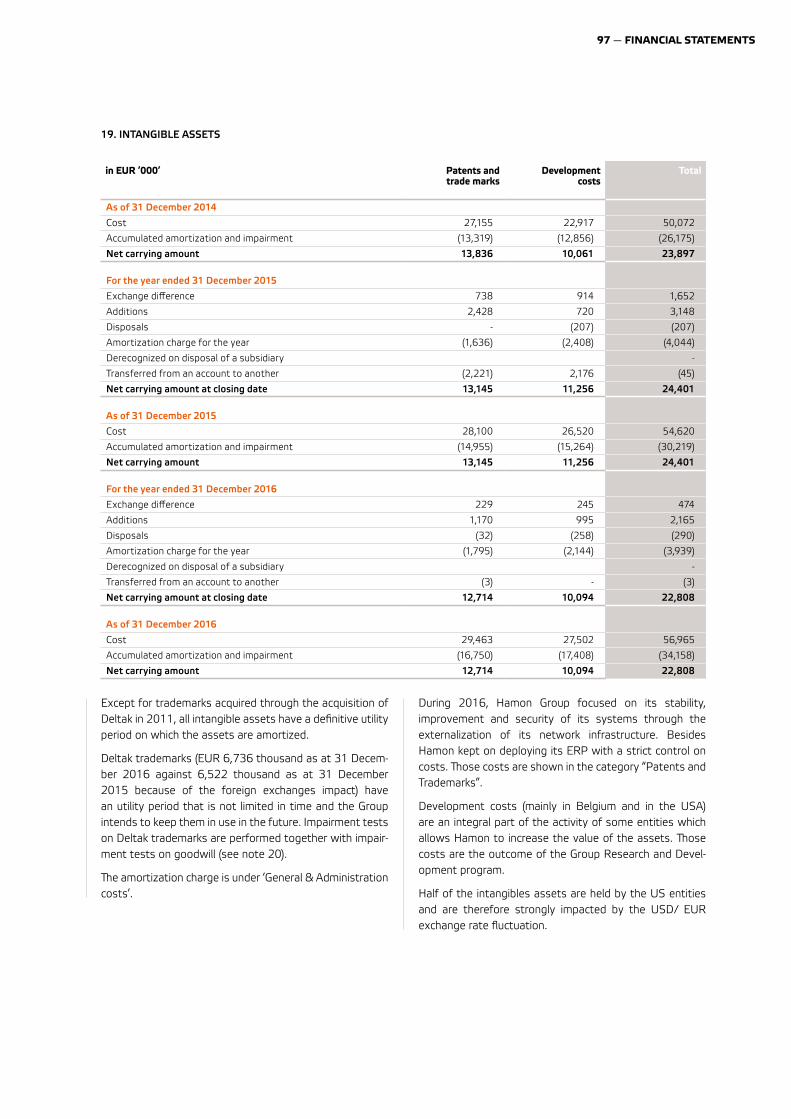
97 — FINANCIAL STATEMENTS
19. INTANGIBLE ASSETS
in EUR ‘000’ Patents and trade marks
Development costs
Total
As of 31 December 2014
Cost 27,155 22,917 50,072
Accumulated amortization and impairment (13,319) (12,856) (26,175)
Net carrying amount 13,836 10,061 23,897
For the year ended 31 December 2015
Exchange difference 738 914 1,652
Additions 2,428 720 3,148
Disposals - (207) (207)
Amortization charge for the year (1,636) (2,408) (4,044)
Derecognized on disposal of a subsidiary -
Transferred from an account to another (2,221) 2,176 (45)
Net carrying amount at closing date 13,145 11,256 24,401
As of 31 December 2015
Cost 28,100 26,520 54,620
Accumulated amortization and impairment (14,955) (15,264) (30,219)
Net carrying amount 13,145 11,256 24,401
For the year ended 31 December 2016
Exchange difference 229 245 474
Additions 1,170 995 2,165
Disposals (32) (258) (290)
Amortization charge for the year (1,795) (2,144) (3,939)
Derecognized on disposal of a subsidiary -
Transferred from an account to another (3) - (3)
Net carrying amount at closing date 12,714 10,094 22,808
As of 31 December 2016
Cost 29,463 27,502 56,965
Accumulated amortization and impairment (16,750) (17,408) (34,158)
Net carrying amount 12,714 10,094 22,808
Except for trademarks acquired through the acquisition of Deltak in 2011, all intangible assets have a definitive utility period on which the assets are amortized.
Deltak trademarks (EUR 6,736 thousand as at 31 Decem-ber 2016 against 6,522 thousand as at 31 December 2015 because of the foreign exchanges impact) have an utility period that is not limited in time and the Group intends to keep them in use in the future. Impairment tests on Deltak trademarks are performed together with impair-ment tests on goodwill (see note 20).
ªe amortization charge is under ‘General & Administration costs’.
During 2016, Hamon Group focused on its stability, improvement and security of its systems through the externalization of its network infrastructure. Besides Hamon kept on deploying its ERP with a strict control on costs. ªose costs are shown in the category “Patents and Trademarks”.
Development costs (mainly in Belgium and in the USA) are an integral part of the activity of some entities which allows Hamon to increase the value of the assets. ªose costs are the outcome of the Group Research and Devel-opment program.
Half of the intangibles assets are held by the US entities and are therefore strongly impacted by the USD/ EUR exchange rate fluctuation.
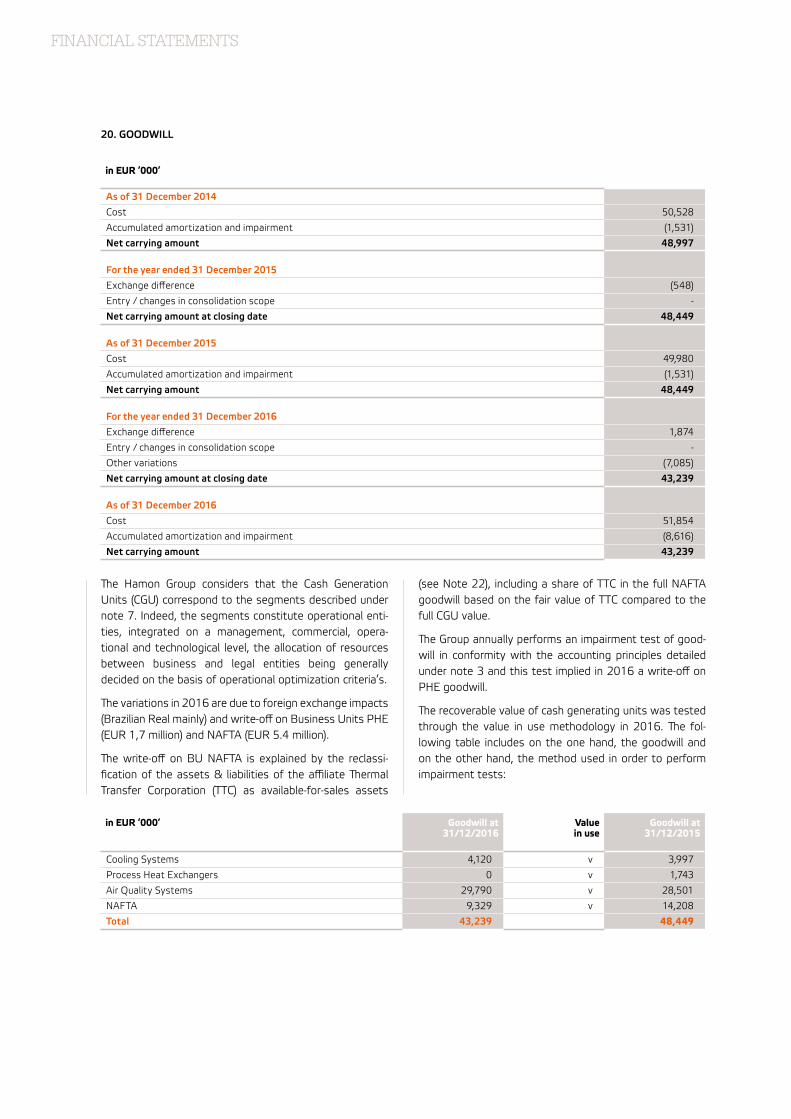
FINANCIAL STATEMENTS
20. GOODWILL
in EUR ‘000’
As of 31 December 2014
Cost 50,528
Accumulated amortization and impairment (1,531)
Net carrying amount 48,997
For the year ended 31 December 2015
Exchange difference (548)
Entry / changes in consolidation scope -
Net carrying amount at closing date 48,449
As of 31 December 2015
Cost 49,980
Accumulated amortization and impairment (1,531)
Net carrying amount 48,449
For the year ended 31 December 2016
Exchange difference 1,874
Entry / changes in consolidation scope -
Other variations (7,085)
Net carrying amount at closing date 43,239
As of 31 December 2016
Cost 51,854
Accumulated amortization and impairment (8,616)
Net carrying amount 43,239
ªe Hamon Group considers that the Cash Generation Units (CGU) correspond to the segments described under note 7. Indeed, the segments constitute operational enti-ties, integrated on a management, commercial, opera-tional and technological level, the allocation of resources between business and legal entities being generally decided on the basis of operational optimization criteria’s.
ªe variations in 2016 are due to foreign exchange impacts (Brazilian Real mainly) and write-off on Business Units PHE (EUR 1,7 million) and NAFTA (EUR 5.4 million).
ªe write-off on BU NAFTA is explained by the reclassi-fication of the assets & liabilities of the affiliate ªermal Transfer Corporation (TTC) as available-for-sales assets
(see Note 22), including a share of TTC in the full NAFTA goodwill based on the fair value of TTC compared to the full CGU value.
ªe Group annually performs an impairment test of good-will in conformity with the accounting principles detailed under note 3 and this test implied in 2016 a write-off on PHE goodwill.
ªe recoverable value of cash generating units was tested through the value in use methodology in 2016. ªe fol-lowing table includes on the one hand, the goodwill and on the other hand, the method used in order to perform impairment tests:
in EUR ‘000’ Goodwill at 31/12/2016
Value in use
Goodwill at 31/12/2015
Cooling Systems 4,120 v 3,997
Process Heat Exchangers 0 v 1,743
Air Quality Systems 29,790 v 28,501
NAFTA 9,329 v 14,208
Total 43,239 48,449
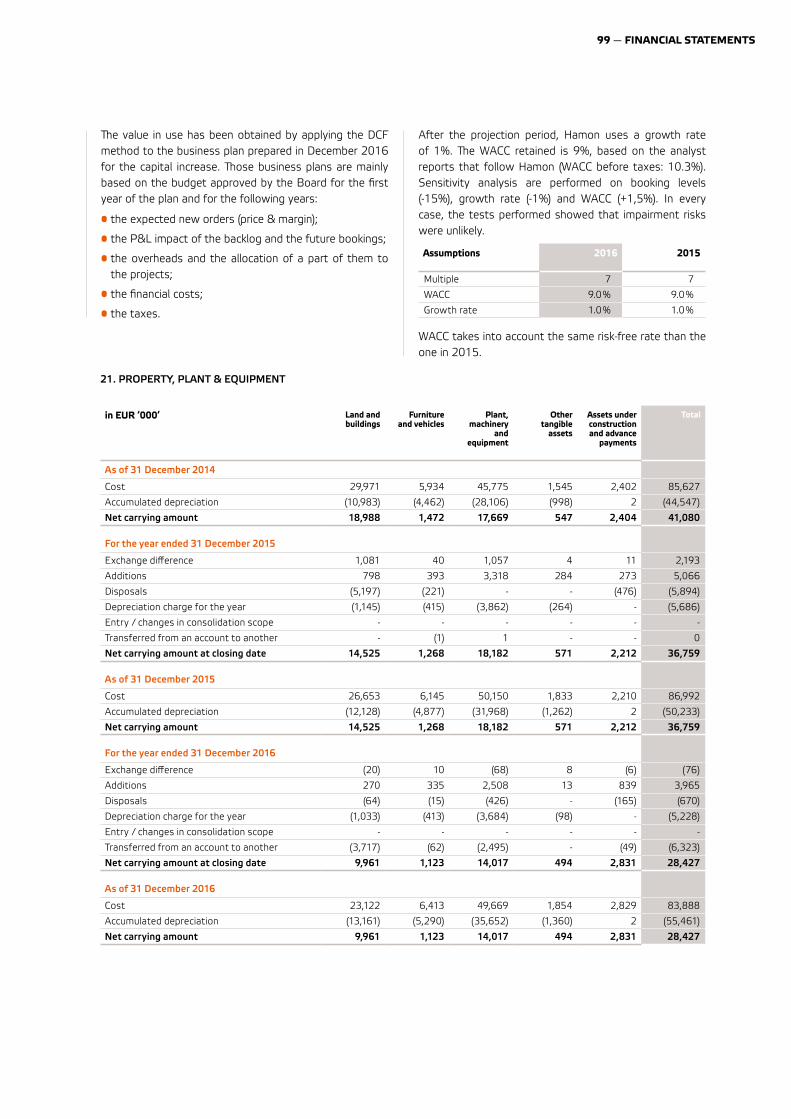
99 — FINANCIAL STATEMENTS
After the projection period, Hamon uses a growth rate of 1%. ªe WACC retained is 9%, based on the analyst reports that follow Hamon (WACC before taxes: 10.3%). Sensitivity analysis are performed on booking levels (-15%), growth rate (-1%) and WACC (+1,5%). In every case, the tests performed showed that impairment risks were unlikely.
Assumptions 2016 2015
Multiple 7 7
WACC 9.0 % 9.0 %
Growth rate 1.0 % 1.0 %
WACC takes into account the same risk-free rate than the one in 2015.
21. PROPERTY, PLANT & EQUIPMENT
in EUR ‘000’ Land and buildings
Furniture and vehicles
Plant, machinery
and equipment
Other tangible
assets
Assets under construction and advance
payments
Total
As of 31 December 2014
Cost 29,971 5,934 45,775 1,545 2,402 85,627
Accumulated depreciation (10,983) (4,462) (28,106) (998) 2 (44,547)
Net carrying amount 18,988 1,472 17,669 547 2,404 41,080
For the year ended 31 December 2015
Exchange difference 1,081 40 1,057 4 11 2,193
Additions 798 393 3,318 284 273 5,066
Disposals (5,197) (221) - - (476) (5,894)
Depreciation charge for the year (1,145) (415) (3,862) (264) - (5,686)
Entry / changes in consolidation scope - - - - - -
Transferred from an account to another - (1) 1 - - 0
Net carrying amount at closing date 14,525 1,268 18,182 571 2,212 36,759
As of 31 December 2015
Cost 26,653 6,145 50,150 1,833 2,210 86,992
Accumulated depreciation (12,128) (4,877) (31,968) (1,262) 2 (50,233)
Net carrying amount 14,525 1,268 18,182 571 2,212 36,759
For the year ended 31 December 2016
Exchange difference (20) 10 (68) 8 (6) (76)
Additions 270 335 2,508 13 839 3,965
Disposals (64) (15) (426) - (165) (670)
Depreciation charge for the year (1,033) (413) (3,684) (98) - (5,228)
Entry / changes in consolidation scope - - - - - -
Transferred from an account to another (3,717) (62) (2,495) - (49) (6,323)
Net carrying amount at closing date 9,961 1,123 14,017 494 2,831 28,427
As of 31 December 2016
Cost 23,122 6,413 49,669 1,854 2,829 83,888
Accumulated depreciation (13,161) (5,290) (35,652) (1,360) 2 (55,461)
Net carrying amount 9,961 1,123 14,017 494 2,831 28,427
ªe value in use has been obtained by applying the DCF method to the business plan prepared in December 2016 for the capital increase. ªose business plans are mainly based on the budget approved by the Board for the first year of the plan and for the following years:
• the expected new orders (price & margin);
• the P&L impact of the backlog and the future bookings;
• the overheads and the allocation of a part of them to the projects;
• the financial costs;
• the taxes.
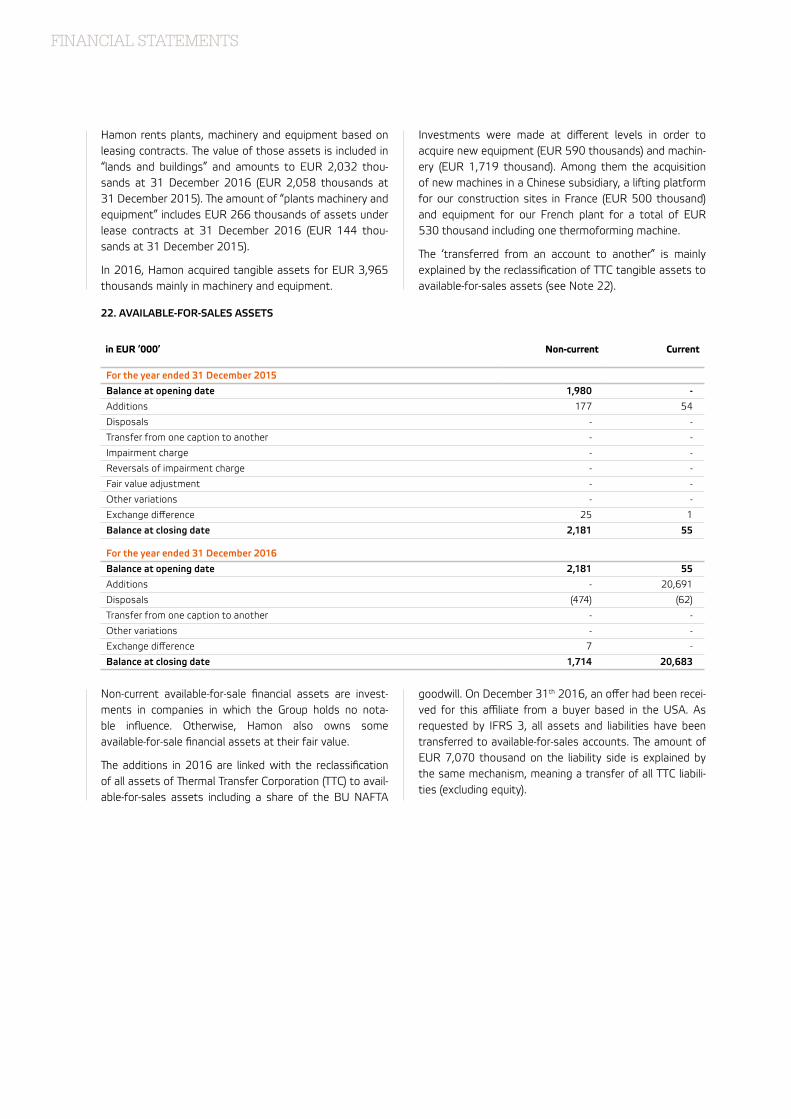
FINANCIAL STATEMENTS
Hamon rents plants, machinery and equipment based on leasing contracts. ªe value of those assets is included in “lands and buildings” and amounts to EUR 2,032 thou-sands at 31 December 2016 (EUR 2,058 thousands at 31 December 2015). ªe amount of “plants machinery and equipment” includes EUR 266 thousands of assets under lease contracts at 31 December 2016 (EUR 144 thou-sands at 31 December 2015).
In 2016, Hamon acquired tangible assets for EUR 3,965 thousands mainly in machinery and equipment.
Investments were made at different levels in order to acquire new equipment (EUR 590 thousands) and machin-ery (EUR 1,719 thousand). Among them the acquisition of new machines in a Chinese subsidiary, a lifting platform for our construction sites in France (EUR 500 thousand) and equipment for our French plant for a total of EUR 530 thousand including one thermoforming machine.
ªe ‘transferred from an account to another” is mainly explained by the reclassification of TTC tangible assets to available-for-sales assets (see Note 22).
22. AVAILABLE-FOR-SALES ASSETS
in EUR ‘000’ Non-current Current
For the year ended 31 December 2015
Balance at opening date 1,980 -
Additions 177 54
Disposals - -
Transfer from one caption to another - -
Impairment charge - -
Reversals of impairment charge - -
Fair value adjustment - -
Other variations - -
Exchange difference 25 1
Balance at closing date 2,181 55
For the year ended 31 December 2016
Balance at opening date 2,181 55
Additions - 20,691
Disposals (474) (62)
Transfer from one caption to another - -
Other variations - -
Exchange difference 7 -
Balance at closing date 1,714 20,683
Non-current available-for-sale financial assets are invest-ments in companies in which the Group holds no nota-ble influence. Otherwise, Hamon also owns some available-for-sale financial assets at their fair value.
ªe additions in 2016 are linked with the reclassification of all assets of ªermal Transfer Corporation (TTC) to avail-able-for-sales assets including a share of the BU NAFTA
goodwill. On December 31th 2016, an offer had been recei-ved for this affiliate from a buyer based in the USA. As requested by IFRS 3, all assets and liabilities have been transferred to available-for-sales accounts. ªe amount of EUR 7,070 thousand on the liability side is explained by the same mechanism, meaning a transfer of all TTC liabili-ties (excluding equity).
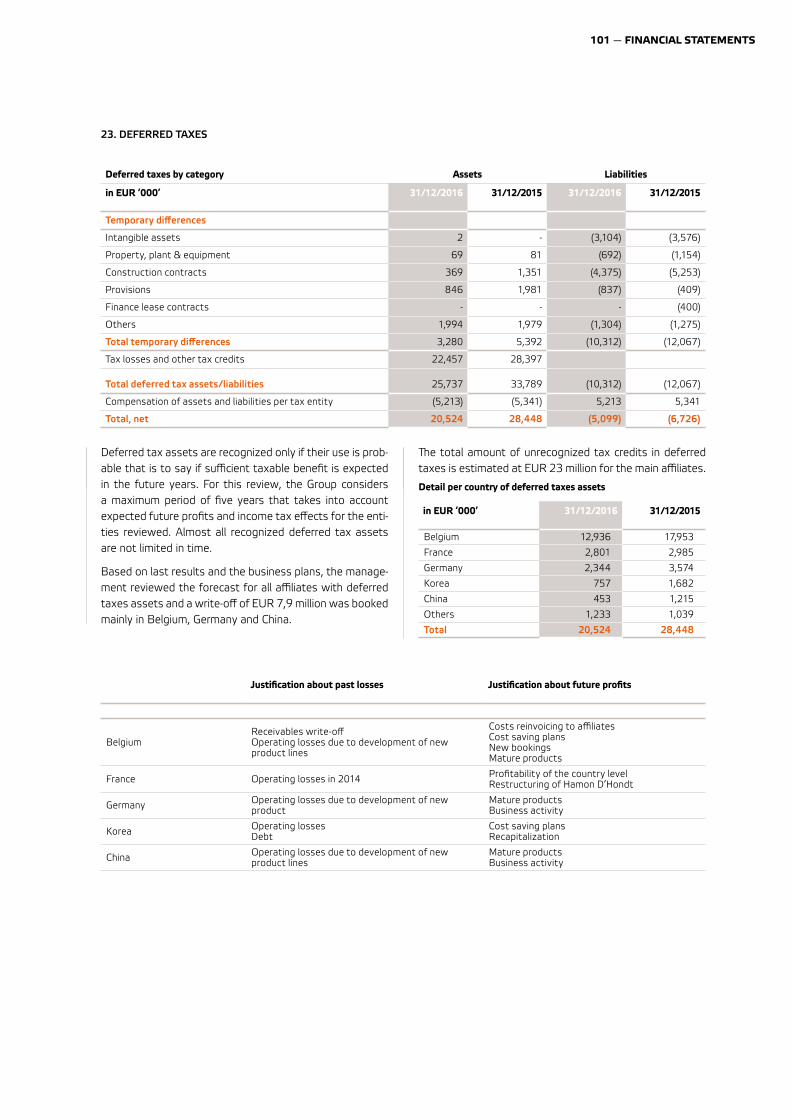
101 — FINANCIAL STATEMENTS
23. DEFERRED TAXES
Deferred taxes by category Assets Liabilities
in EUR ‘000’ 31/12/2016 31/12/2015 31/12/2016 31/12/2015
Temporary differences
Intangible assets 2 - (3,104) (3,576)
Property, plant & equipment 69 81 (692) (1,154)
Construction contracts 369 1,351 (4,375) (5,253)
Provisions 846 1,981 (837) (409)
Finance lease contracts - - - (400)
Others 1,994 1,979 (1,304) (1,275)
Total temporary differences 3,280 5,392 (10,312) (12,067)
Tax losses and other tax credits 22,457 28,397
Total deferred tax assets/liabilities 25,737 33,789 (10,312) (12,067)
Compensation of assets and liabilities per tax entity (5,213) (5,341) 5,213 5,341
Total, net 20,524 28,448 (5,099) (6,726)
Deferred tax assets are recognized only if their use is prob-able that is to say if sufficient taxable benefit is expected in the future years. For this review, the Group considers a maximum period of five years that takes into account expected future profits and income tax effects for the enti-ties reviewed. Almost all recognized deferred tax assets are not limited in time.
Based on last results and the business plans, the manage-ment reviewed the forecast for all affiliates with deferred taxes assets and a write-off of EUR 7,9 million was booked mainly in Belgium, Germany and China.
ªe total amount of unrecognized tax credits in deferred taxes is estimated at EUR 23 million for the main affiliates.
Detail per country of deferred taxes assets
in EUR ‘000’ 31/12/2016 31/12/2015
Belgium 12,936 17,953
France 2,801 2,985
Germany 2,344 3,574
Korea 757 1,682
China 453 1,215
Others 1,233 1,039
Total 20,524 28,448
Justification about past losses Justification about future profits
BelgiumReceivables write-off Operating losses due to development of new product lines
Costs reinvoicing to affiliatesCost saving plansNew bookingsMature products
France Operating losses in 2014 Profitability of the country levelRestructuring of Hamon D’Hondt
Germany Operating losses due to development of new product
Mature productsBusiness activity
Korea Operating lossesDebt
Cost saving plansRecapitalization
China Operating losses due to development of new product lines
Mature productsBusiness activity
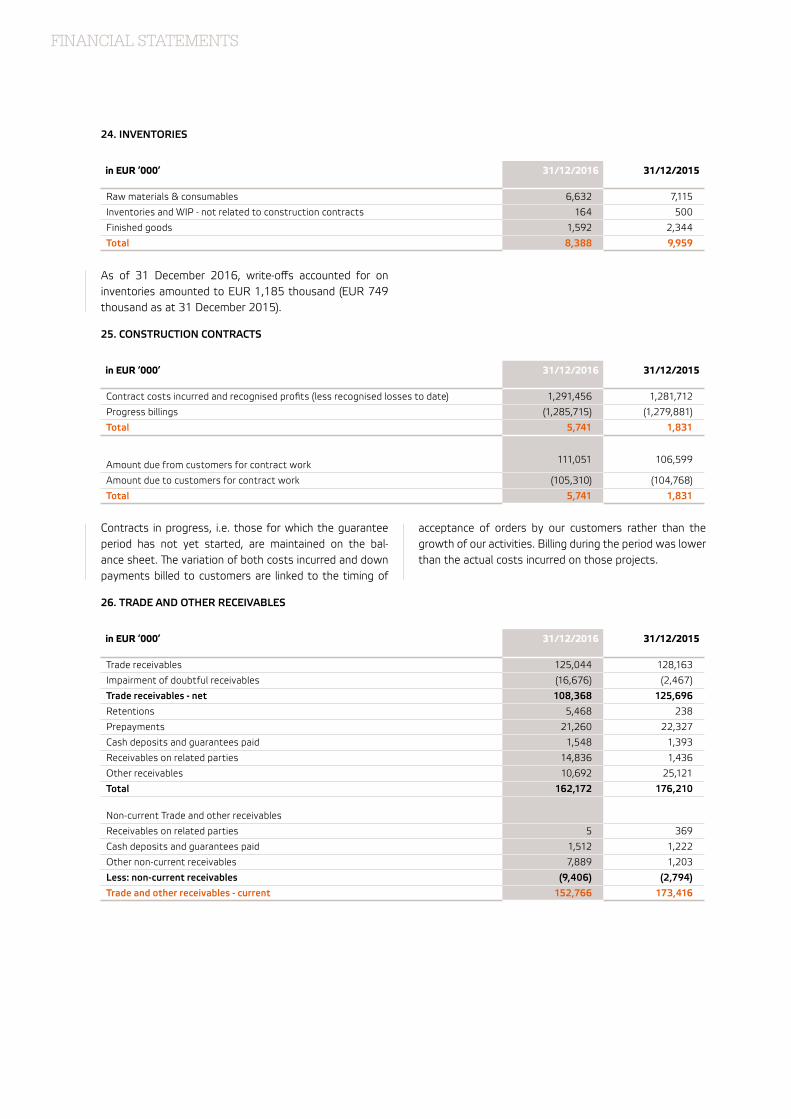
FINANCIAL STATEMENTS
24. INVENTORIES
in EUR ‘000’ 31/12/2016 31/12/2015
Raw materials & consumables 6,632 7,115
Inventories and WIP - not related to construction contracts 164 500
Finished goods 1,592 2,344
Total 8,388 9,959
26. TRADE AND OTHER RECEIVABLES
in EUR ‘000’ 31/12/2016 31/12/2015
Trade receivables 125,044 128,163
Impairment of doubtful receivables (16,676) (2,467)
Trade receivables - net 108,368 125,696
Retentions 5,468 238
Prepayments 21,260 22,327
Cash deposits and guarantees paid 1,548 1,393
Receivables on related parties 14,836 1,436
Other receivables 10,692 25,121
Total 162,172 176,210
Non-current Trade and other receivables
Receivables on related parties 5 369
Cash deposits and guarantees paid 1,512 1,222
Other non-current receivables 7,889 1,203
Less: non-current receivables (9,406) (2,794)
Trade and other receivables - current 152,766 173,416
Contracts in progress, i.e. those for which the guarantee period has not yet started, are maintained on the bal-ance sheet. ªe variation of both costs incurred and down payments billed to customers are linked to the timing of
acceptance of orders by our customers rather than the growth of our activities. Billing during the period was lower than the actual costs incurred on those projects.
As of 31 December 2016, write-offs accounted for on inventories amounted to EUR 1,185 thousand (EUR 749 thousand as at 31 December 2015).
25. CONSTRUCTION CONTRACTS
in EUR ‘000’ 31/12/2016 31/12/2015
Contract costs incurred and recognised profits (less recognised losses to date) 1,291,456 1,281,712
Progress billings (1,285,715) (1,279,881)
Total 5,741 1,831
Amount due from customers for contract work 111,051 106,599
Amount due to customers for contract work (105,310) (104,768)
Total 5,741 1,831
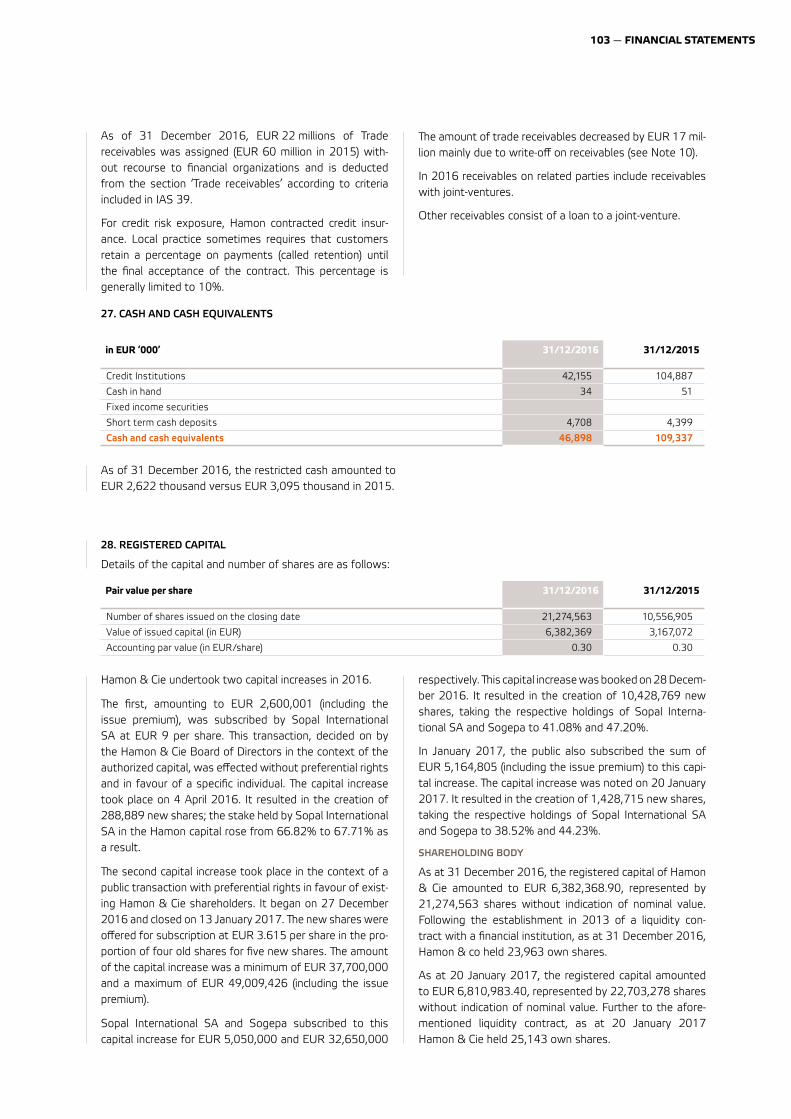
103 — FINANCIAL STATEMENTS
27. CASH AND CASH EQUIVALENTS
in EUR ‘000’ 31/12/2016 31/12/2015
Credit Institutions 42,155 104,887
Cash in hand 34 51
Fixed income securities
Short term cash deposits 4,708 4,399
Cash and cash equivalents 46,898 109,337
28. REGISTERED CAPITAL
Details of the capital and number of shares are as follows:
Pair value per share 31/12/2016 31/12/2015
Number of shares issued on the closing date 21,274,563 10,556,905
Value of issued capital (in EUR) 6,382,369 3,167,072
Accounting par value (in EUR/share) 0.30 0.30
Hamon & Cie undertook two capital increases in 2016.
ªe first, amounting to EUR 2,600,001 (including the issue premium), was subscribed by Sopal International SA at EUR 9 per share. ªis transaction, decided on by the Hamon & Cie Board of Directors in the context of the authorized capital, was effected without preferential rights and in favour of a specific individual. ªe capital increase took place on 4 April 2016. It resulted in the creation of 288,889 new shares; the stake held by Sopal International SA in the Hamon capital rose from 66.82% to 67.71% as a result.
ªe second capital increase took place in the context of a public transaction with preferential rights in favour of exist-ing Hamon & Cie shareholders. It began on 27 December 2016 and closed on 13 January 2017. ªe new shares were offered for subscription at EUR 3.615 per share in the pro-portion of four old shares for five new shares. ªe amount of the capital increase was a minimum of EUR 37,700,000 and a maximum of EUR 49,009,426 (including the issue premium).
Sopal International SA and Sogepa subscribed to this capital increase for EUR 5,050,000 and EUR 32,650,000
respectively. ªis capital increase was booked on 28 Decem-ber 2016. It resulted in the creation of 10,428,769 new shares, taking the respective holdings of Sopal Interna-tional SA and Sogepa to 41.08% and 47.20%.
In January 2017, the public also subscribed the sum of EUR 5,164,805 (including the issue premium) to this capi-tal increase. ªe capital increase was noted on 20 January 2017. It resulted in the creation of 1,428,715 new shares, taking the respective holdings of Sopal International SA and Sogepa to 38.52% and 44.23%.
SHAREHOLDING BODY
As at 31 December 2016, the registered capital of Hamon & Cie amounted to EUR 6,382,368.90, represented by 21,274,563 shares without indication of nominal value. Following the establishment in 2013 of a liquidity con-tract with a financial institution, as at 31 December 2016, Hamon & co held 23,963 own shares.
As at 20 January 2017, the registered capital amounted to EUR 6,810,983.40, represented by 22,703,278 shares without indication of nominal value. Further to the afore-mentioned liquidity contract, as at 20 January 2017 Hamon & Cie held 25,143 own shares.
As of 31 December 2016, EUR 22 millions of Trade receivables was assigned (EUR 60 million in 2015) with-out recourse to financial organizations and is deducted from the section ‘Trade receivables’ according to criteria included in IAS 39.
For credit risk exposure, Hamon contracted credit insur-ance. Local practice sometimes requires that customers retain a percentage on payments (called retention) until the final acceptance of the contract. ªis percentage is generally limited to 10%.
ªe amount of trade receivables decreased by EUR 17 mil-lion mainly due to write-off on receivables (see Note 10).
In 2016 receivables on related parties include receivables with joint-ventures.
Other receivables consist of a loan to a joint-venture.
As of 31 December 2016, the restricted cash amounted to EUR 2,622 thousand versus EUR 3,095 thousand in 2015.
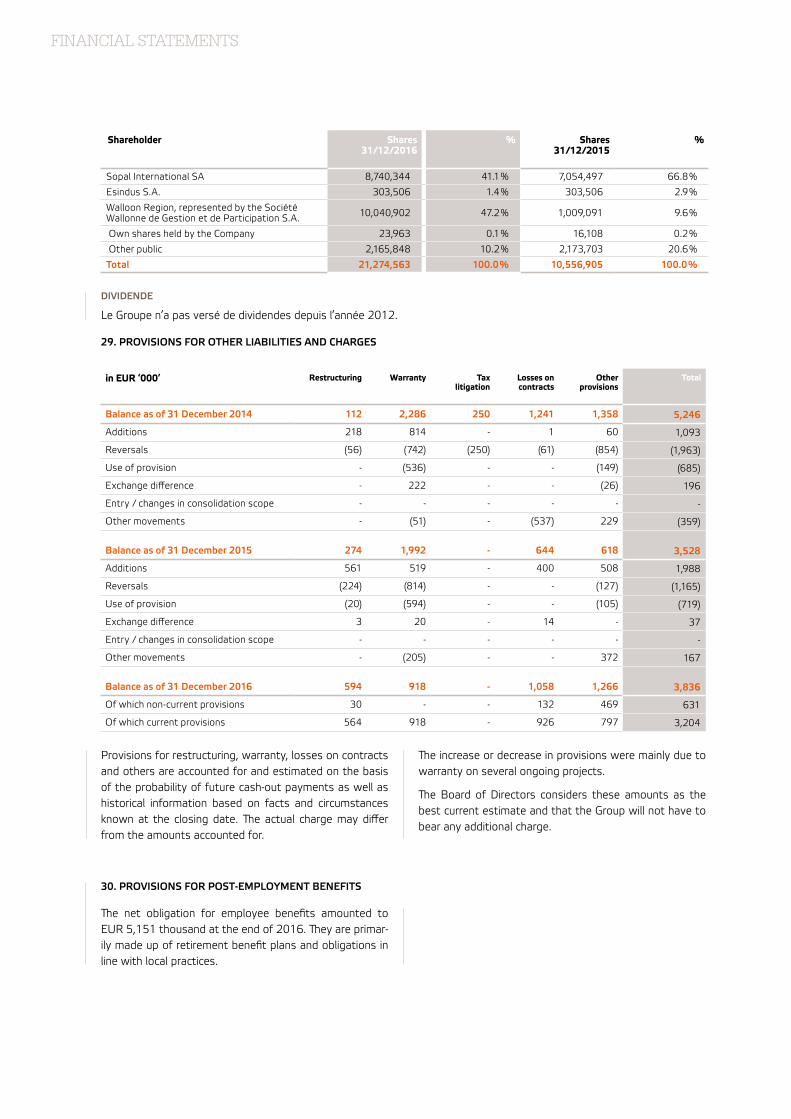
FINANCIAL STATEMENTS
Shareholder Shares 31/12/2016
% Shares 31/12/2015
%
Sopal International SA 8,740,344 41.1 % 7,054,497 66.8 %
Esindus S.A. 303,506 1.4 % 303,506 2.9 %
Walloon Region, represented by the Société Wallonne de Gestion et de Participation S.A. 10,040,902 47.2 % 1,009,091 9.6 %
Own shares held by the Company 23,963 0.1 % 16,108 0.2 %
Other public 2,165,848 10.2 % 2,173,703 20.6 %
Total 21,274,563 100.0 % 10,556,905 100.0 %
DIVIDENDE
Le Groupe n’a pas versé de dividendes depuis l’année 2012.
29. PROVISIONS FOR OTHER LIABILITIES AND CHARGES
in EUR ‘000’ Restructuring Warranty Tax litigation
Losses on contracts
Other provisions
Total
Balance as of 31 December 2014 112 2,286 250 1,241 1,358 5,246
Additions 218 814 - 1 60 1,093
Reversals (56) (742) (250) (61) (854) (1,963)
Use of provision - (536) - - (149) (685)
Exchange difference - 222 - - (26) 196
Entry / changes in consolidation scope - - - - - -
Other movements - (51) - (537) 229 (359)
Balance as of 31 December 2015 274 1,992 - 644 618 3,528
Additions 561 519 - 400 508 1,988
Reversals (224) (814) - - (127) (1,165)
Use of provision (20) (594) - - (105) (719)
Exchange difference 3 20 - 14 - 37
Entry / changes in consolidation scope - - - - - -
Other movements - (205) - - 372 167
Balance as of 31 December 2016 594 918 - 1,058 1,266 3,836
Of which non-current provisions 30 - - 132 469 631
Of which current provisions 564 918 - 926 797 3,204
Provisions for restructuring, warranty, losses on contracts and others are accounted for and estimated on the basis of the probability of future cash-out payments as well as historical information based on facts and circumstances known at the closing date. ªe actual charge may differ from the amounts accounted for.
ªe increase or decrease in provisions were mainly due to warranty on several ongoing projects.
ªe Board of Directors considers these amounts as the best current estimate and that the Group will not have to bear any additional charge.
30. PROVISIONS FOR POST-EMPLOYMENT BENEFITS
ªe net obligation for employee benefits amounted to EUR 5,151 thousand at the end of 2016. ªey are primar-ily made up of retirement benefit plans and obligations in line with local practices.
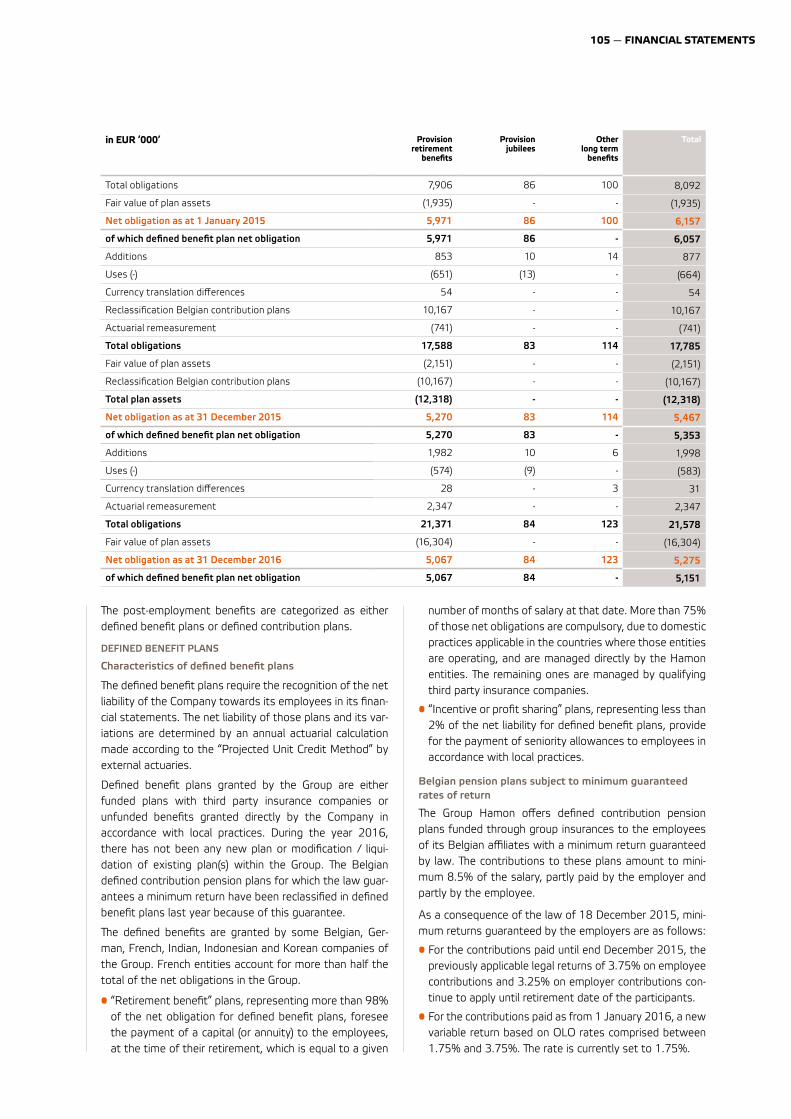
105 — FINANCIAL STATEMENTS
ªe post-employment benefits are categorized as either defined benefit plans or defined contribution plans.
DEFINED BENEFIT PLANS
Characteristics of defined benefit plans
ªe defined benefit plans require the recognition of the net liability of the Company towards its employees in its finan-cial statements. ªe net liability of those plans and its var-iations are determined by an annual actuarial calculation made according to the “Projected Unit Credit Method” by external actuaries.
Defined benefit plans granted by the Group are either funded plans with third party insurance companies or unfunded benefits granted directly by the Company in accordance with local practices. During the year 2016, there has not been any new plan or modification / liqui-dation of existing plan(s) within the Group. ªe Belgian defined contribution pension plans for which the law guar-antees a minimum return have been reclassified in defined benefit plans last year because of this guarantee.
ªe defined benefits are granted by some Belgian, Ger-man, French, Indian, Indonesian and Korean companies of the Group. French entities account for more than half the total of the net obligations in the Group.
• “Retirement benefit” plans, representing more than 98% of the net obligation for defined benefit plans, foresee the payment of a capital (or annuity) to the employees, at the time of their retirement, which is equal to a given
number of months of salary at that date. More than 75% of those net obligations are compulsory, due to domestic practices applicable in the countries where those entities are operating, and are managed directly by the Hamon entities. ªe remaining ones are managed by qualifying third party insurance companies.
• “Incentive or profit sharing” plans, representing less than 2% of the net liability for defined benefit plans, provide for the payment of seniority allowances to employees in accordance with local practices.
Belgian pension plans subject to minimum guaranteed rates of return
ªe Group Hamon offers defined contribution pension plans funded through group insurances to the employees of its Belgian affiliates with a minimum return guaranteed by law. ªe contributions to these plans amount to mini-mum 8.5% of the salary, partly paid by the employer and partly by the employee.
As a consequence of the law of 18 December 2015, mini-mum returns guaranteed by the employers are as follows:
• For the contributions paid until end December 2015, the previously applicable legal returns of 3.75% on employee contributions and 3.25% on employer contributions con-tinue to apply until retirement date of the participants.
• For the contributions paid as from 1 January 2016, a new variable return based on OLO rates comprised between 1.75% and 3.75%. ªe rate is currently set to 1.75%.
in EUR ‘000’ Provision retirement
benefits
Provision jubilees
Other long term
benefits
Total
Total obligations 7,906 86 100 8,092
Fair value of plan assets (1,935) - - (1,935)
Net obligation as at 1 January 2015 5,971 86 100 6,157
of which defined benefit plan net obligation 5,971 86 - 6,057
Additions 853 10 14 877
Uses (-) (651) (13) - (664)
Currency translation differences 54 - - 54
Reclassification Belgian contribution plans 10,167 - - 10,167
Actuarial remeasurement (741) - - (741)
Total obligations 17,588 83 114 17,785
Fair value of plan assets (2,151) - - (2,151)
Reclassification Belgian contribution plans (10,167) - - (10,167)
Total plan assets (12,318) - - (12,318)
Net obligation as at 31 December 2015 5,270 83 114 5,467
of which defined benefit plan net obligation 5,270 83 - 5,353
Additions 1,982 10 6 1,998
Uses (-) (574) (9) - (583)
Currency translation differences 28 - 3 31
Actuarial remeasurement 2,347 - - 2,347
Total obligations 21,371 84 123 21,578
Fair value of plan assets (16,304) - - (16,304)
Net obligation as at 31 December 2016 5,067 84 123 5,275
of which defined benefit plan net obligation 5,067 84 - 5,151
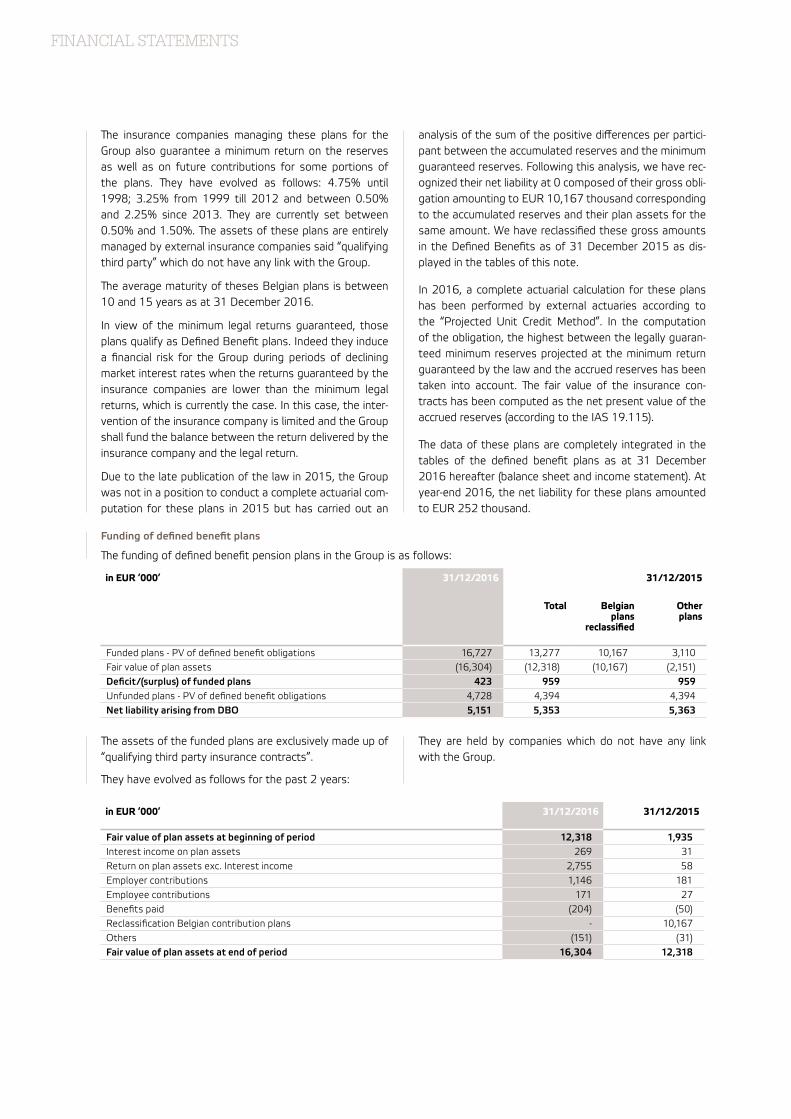
FINANCIAL STATEMENTS
ªe insurance companies managing these plans for the Group also guarantee a minimum return on the reserves as well as on future contributions for some portions of the plans. ªey have evolved as follows: 4.75% until 1998; 3.25% from 1999 till 2012 and between 0.50% and 2.25% since 2013. ªey are currently set between 0.50% and 1.50%. ªe assets of these plans are entirely managed by external insurance companies said “qualifying third party” which do not have any link with the Group.
ªe average maturity of theses Belgian plans is between 10 and 15 years as at 31 December 2016.
In view of the minimum legal returns guaranteed, those plans qualify as Defined Benefit plans. Indeed they induce a financial risk for the Group during periods of declining market interest rates when the returns guaranteed by the insurance companies are lower than the minimum legal returns, which is currently the case. In this case, the inter-vention of the insurance company is limited and the Group shall fund the balance between the return delivered by the insurance company and the legal return.
Due to the late publication of the law in 2015, the Group was not in a position to conduct a complete actuarial com-putation for these plans in 2015 but has carried out an
analysis of the sum of the positive differences per partici-pant between the accumulated reserves and the minimum guaranteed reserves. Following this analysis, we have rec-ognized their net liability at 0 composed of their gross obli-gation amounting to EUR 10,167 thousand corresponding to the accumulated reserves and their plan assets for the same amount. We have reclassified these gross amounts in the Defined Benefits as of 31 December 2015 as dis-played in the tables of this note.
In 2016, a complete actuarial calculation for these plans has been performed by external actuaries according to the “Projected Unit Credit Method”. In the computation of the obligation, the highest between the legally guaran-teed minimum reserves projected at the minimum return guaranteed by the law and the accrued reserves has been taken into account. ªe fair value of the insurance con-tracts has been computed as the net present value of the accrued reserves (according to the IAS 19.115).
ªe data of these plans are completely integrated in the tables of the defined benefit plans as at 31 December 2016 hereafter (balance sheet and income statement). At year-end 2016, the net liability for these plans amounted to EUR 252 thousand.
Funding of defined benefit plans
ªe funding of defined benefit pension plans in the Group is as follows:
in EUR ‘000’ 31/12/2016 31/12/2015
Total Belgian plans
reclassified
Other plans
Funded plans - PV of defined benefit obligations 16,727 13,277 10,167 3,110Fair value of plan assets (16,304) (12,318) (10,167) (2,151)Deficit/(surplus) of funded plans 423 959 959Unfunded plans - PV of defined benefit obligations 4,728 4,394 4,394Net liability arising from DBO 5,151 5,353 5,363
ªe assets of the funded plans are exclusively made up of “qualifying third party insurance contracts”.
in EUR ‘000’ 31/12/2016 31/12/2015
Fair value of plan assets at beginning of period 12,318 1,935 Interest income on plan assets 269 31 Return on plan assets exc. Interest income 2,755 58 Employer contributions 1,146 181 Employee contributions 171 27 Benefits paid (204) (50)Reclassification Belgian contribution plans - 10,167 Others (151) (31)Fair value of plan assets at end of period 16,304 12,318
ªey are held by companies which do not have any link with the Group.
ªey have evolved as follows for the past 2 years:
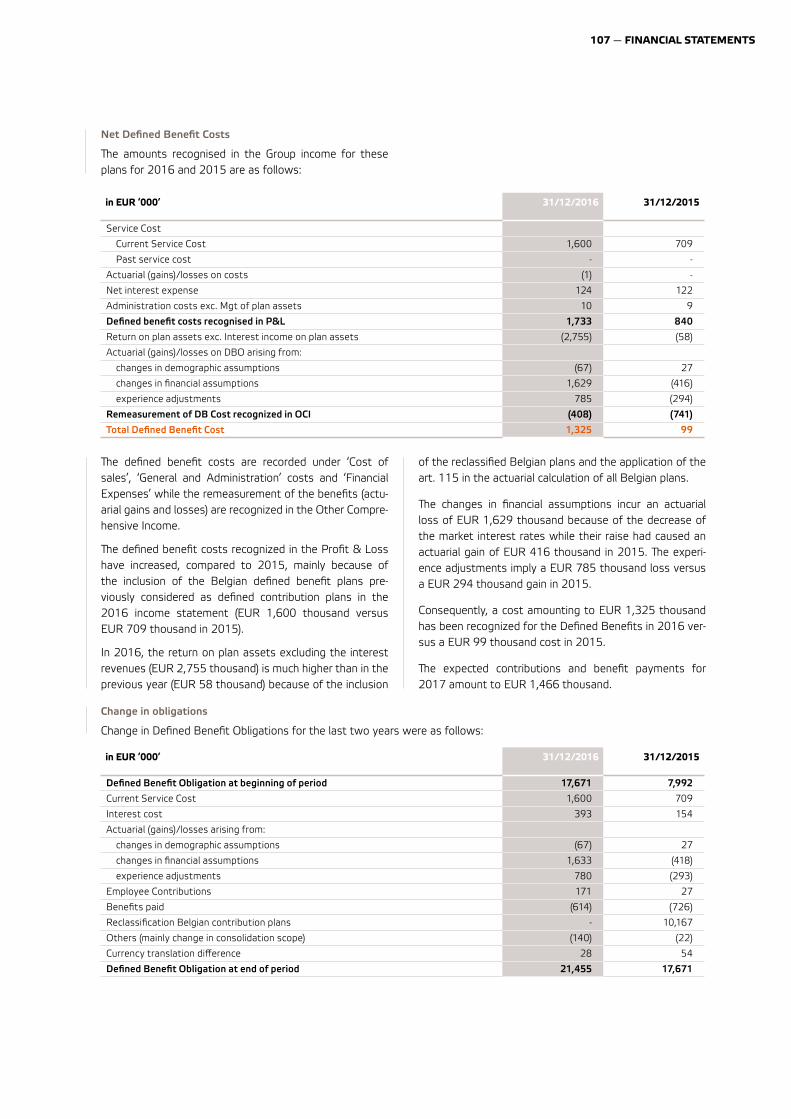
107 — FINANCIAL STATEMENTS
Net Defined Benefit Costs
ªe amounts recognised in the Group income for these plans for 2016 and 2015 are as follows:
ªe defined benefit costs are recorded under ‘Cost of sales’, ‘General and Administration’ costs and ‘Financial Expenses’ while the remeasurement of the benefits (actu-arial gains and losses) are recognized in the Other Compre-hensive Income.
ªe defined benefit costs recognized in the Profit & Loss have increased, compared to 2015, mainly because of the inclusion of the Belgian defined benefit plans pre-viously considered as defined contribution plans in the 2016 income statement (EUR 1,600 thousand versus EUR 709 thousand in 2015).
In 2016, the return on plan assets excluding the interest revenues (EUR 2,755 thousand) is much higher than in the previous year (EUR 58 thousand) because of the inclusion
in EUR ‘000’ 31/12/2016 31/12/2015
Service Cost
Current Service Cost 1,600 709
Past service cost - -
Actuarial (gains)/losses on costs (1) -
Net interest expense 124 122
Administration costs exc. Mgt of plan assets 10 9
Defined benefit costs recognised in P&L 1,733 840
Return on plan assets exc. Interest income on plan assets (2,755) (58)
Actuarial (gains)/losses on DBO arising from:
changes in demographic assumptions (67) 27
changes in financial assumptions 1,629 (416)
experience adjustments 785 (294)
Remeasurement of DB Cost recognized in OCI (408) (741)
Total Defined Benefit Cost 1,325 99
of the reclassified Belgian plans and the application of the art. 115 in the actuarial calculation of all Belgian plans.
ªe changes in financial assumptions incur an actuarial loss of EUR 1,629 thousand because of the decrease of the market interest rates while their raise had caused an actuarial gain of EUR 416 thousand in 2015. ªe experi-ence adjustments imply a EUR 785 thousand loss versus a EUR 294 thousand gain in 2015.
Consequently, a cost amounting to EUR 1,325 thousand has been recognized for the Defined Benefits in 2016 ver-sus a EUR 99 thousand cost in 2015.
ªe expected contributions and benefit payments for 2017 amount to EUR 1,466 thousand.
Change in obligations
Change in Defined Benefit Obligations for the last two years were as follows:
in EUR ‘000’ 31/12/2016 31/12/2015
Defined Benefit Obligation at beginning of period 17,671 7,992
Current Service Cost 1,600 709
Interest cost 393 154
Actuarial (gains)/losses arising from:
changes in demographic assumptions (67) 27
changes in financial assumptions 1,633 (418)
experience adjustments 780 (293)
Employee Contributions 171 27
Benefits paid (614) (726)
Reclassification Belgian contribution plans - 10,167
Others (mainly change in consolidation scope) (140) (22)
Currency translation difference 28 54
Defined Benefit Obligation at end of period 21,455 17,671
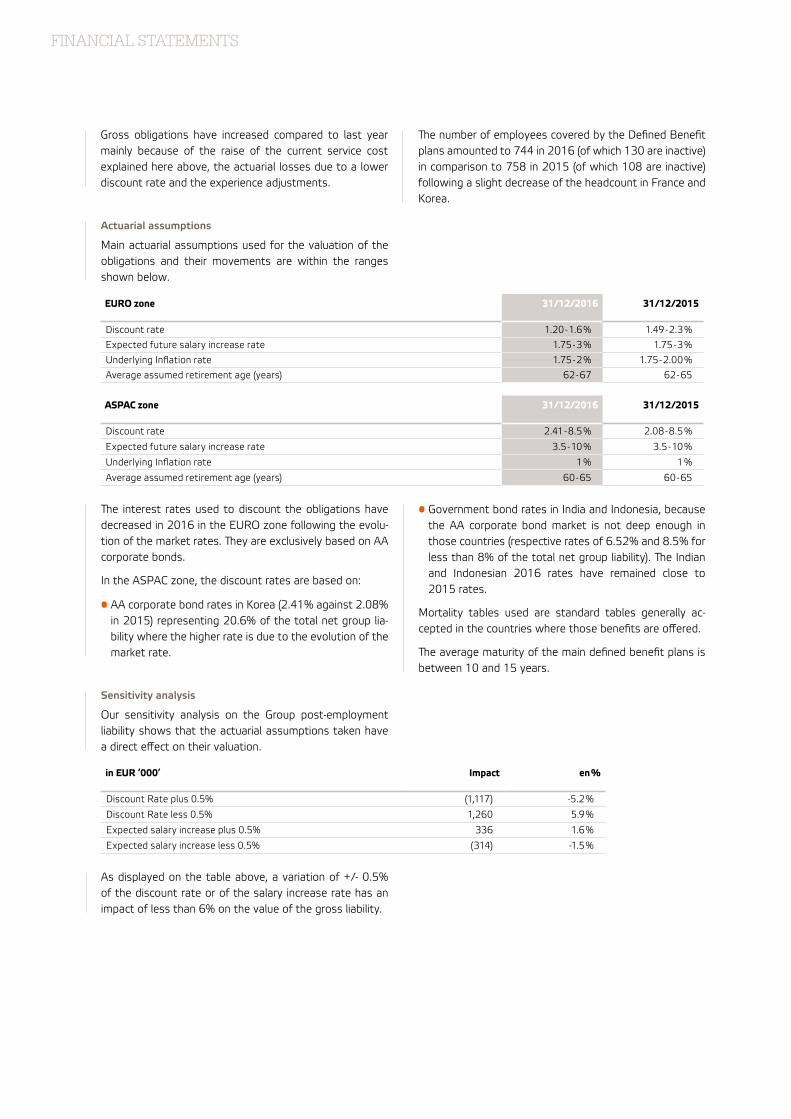
FINANCIAL STATEMENTS
Actuarial assumptions
Main actuarial assumptions used for the valuation of the obligations and their movements are within the ranges shown below.
Sensitivity analysis
Our sensitivity analysis on the Group post-employment liability shows that the actuarial assumptions taken have a direct effect on their valuation.
in EUR ‘000’ Impact en %
Discount Rate plus 0.5% (1,117) -5.2 %
Discount Rate less 0.5% 1,260 5.9 %
Expected salary increase plus 0.5% 336 1.6 %
Expected salary increase less 0.5% (314) -1.5 %
EURO zone 31/12/2016 31/12/2015
Discount rate 1.20 - 1.6 % 1.49 - 2.3 %
Expected future salary increase rate 1.75 - 3 % 1.75 - 3 %
Underlying Inflation rate 1.75 - 2 % 1.75 - 2.00 %
Average assumed retirement age (years) 62 - 67 62 - 65
ASPAC zone 31/12/2016 31/12/2015
Discount rate 2.41 - 8.5 % 2.08 - 8.5 %
Expected future salary increase rate 3.5 - 10 % 3.5 - 10 %
Underlying Inflation rate 1 % 1 %
Average assumed retirement age (years) 60 - 65 60 - 65
ªe interest rates used to discount the obligations have decreased in 2016 in the EURO zone following the evolu-tion of the market rates. ªey are exclusively based on AA corporate bonds.
In the ASPAC zone, the discount rates are based on:
• AA corporate bond rates in Korea (2.41% against 2.08% in 2015) representing 20.6% of the total net group lia-bility where the higher rate is due to the evolution of the market rate.
• Government bond rates in India and Indonesia, because the AA corporate bond market is not deep enough in those countries (respective rates of 6.52% and 8.5% for less than 8% of the total net group liability). ªe Indian and Indonesian 2016 rates have remained close to 2015 rates.
Mortality tables used are standard tables generally ac-cepted in the countries where those benefits are offered.
ªe average maturity of the main defined benefit plans is between 10 and 15 years.
As displayed on the table above, a variation of +/- 0.5% of the discount rate or of the salary increase rate has an impact of less than 6% on the value of the gross liability.
Gross obligations have increased compared to last year mainly because of the raise of the current service cost explained here above, the actuarial losses due to a lower discount rate and the experience adjustments.
ªe number of employees covered by the Defined Benefit plans amounted to 744 in 2016 (of which 130 are inactive) in comparison to 758 in 2015 (of which 108 are inactive) following a slight decrease of the headcount in France and Korea.
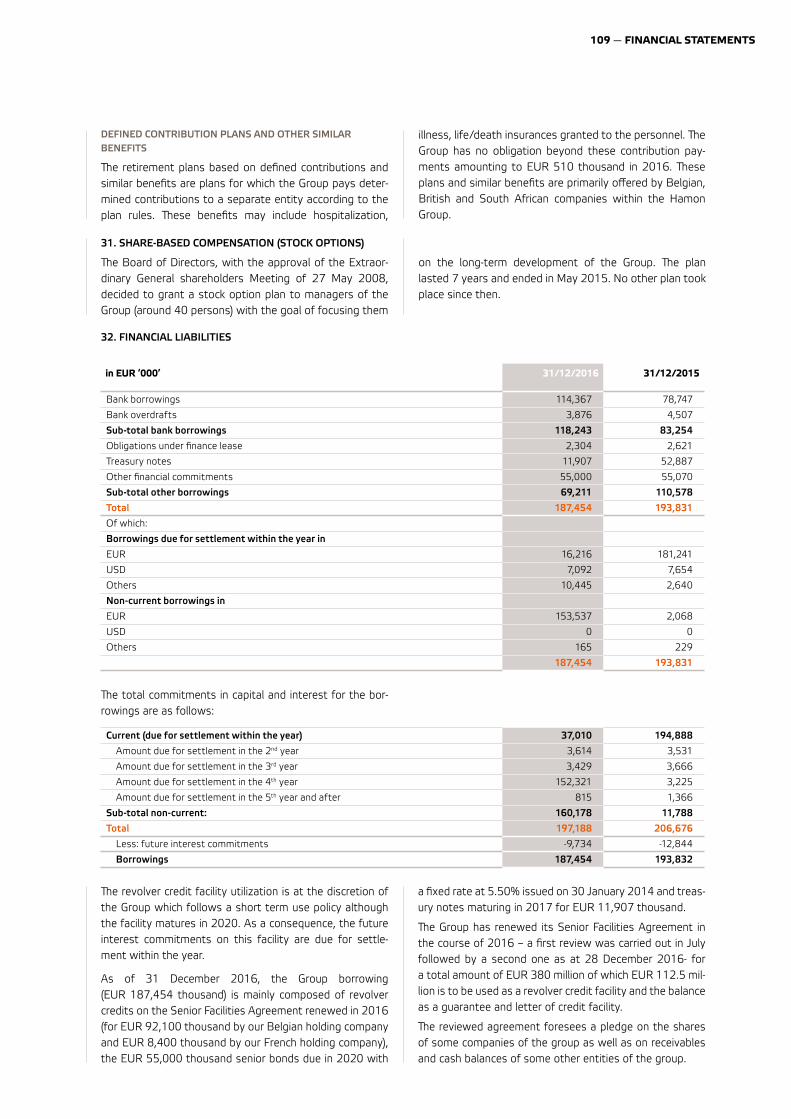
109 — FINANCIAL STATEMENTS
31. SHARE-BASED COMPENSATION (STOCK OPTIONS)
ªe Board of Directors, with the approval of the Extraor-dinary General shareholders Meeting of 27 May 2008, decided to grant a stock option plan to managers of the Group (around 40 persons) with the goal of focusing them
on the long-term development of the Group. ªe plan lasted 7 years and ended in May 2015. No other plan took place since then.
32. FINANCIAL LIABILITIES
in EUR ‘000’ 31/12/2016 31/12/2015
Bank borrowings 114,367 78,747
Bank overdrafts 3,876 4,507
Sub-total bank borrowings 118,243 83,254
Obligations under finance lease 2,304 2,621
Treasury notes 11,907 52,887
Other financial commitments 55,000 55,070
Sub-total other borrowings 69,211 110,578
Total 187,454 193,831
Of which:
Borrowings due for settlement within the year in
EUR 16,216 181,241
USD 7,092 7,654
Others 10,445 2,640
Non-current borrowings in
EUR 153,537 2,068
USD 0 0
Others 165 229
187,454 193,831
DEFINED CONTRIBUTION PLANS AND OTHER SIMILAR BENEFITS
ªe retirement plans based on defined contributions and similar benefits are plans for which the Group pays deter-mined contributions to a separate entity according to the plan rules. ªese benefits may include hospitalization,
illness, life/death insurances granted to the personnel. ªe Group has no obligation beyond these contribution pay-ments amounting to EUR 510 thousand in 2016. ªese plans and similar benefits are primarily offered by Belgian, British and South African companies within the Hamon Group.
ªe total commitments in capital and interest for the bor-rowings are as follows:
Current (due for settlement within the year) 37,010 194,888
Amount due for settlement in the 2nd year 3,614 3,531
Amount due for settlement in the 3rd year 3,429 3,666
Amount due for settlement in the 4th year 152,321 3,225
Amount due for settlement in the 5th year and after 815 1,366
Sub-total non-current: 160,178 11,788
Total 197,188 206,676
Less: future interest commitments -9,734 -12,844
Borrowings 187,454 193,832
ªe revolver credit facility utilization is at the discretion of the Group which follows a short term use policy although the facility matures in 2020. As a consequence, the future interest commitments on this facility are due for settle-ment within the year.
As of 31 December 2016, the Group borrowing (EUR 187,454 thousand) is mainly composed of revolver credits on the Senior Facilities Agreement renewed in 2016 (for EUR 92,100 thousand by our Belgian holding company and EUR 8,400 thousand by our French holding company), the EUR 55,000 thousand senior bonds due in 2020 with
a fixed rate at 5.50% issued on 30 January 2014 and treas-ury notes maturing in 2017 for EUR 11,907 thousand.
ªe Group has renewed its Senior Facilities Agreement in the course of 2016 – a first review was carried out in July followed by a second one as at 28 December 2016- for a total amount of EUR 380 million of which EUR 112.5 mil-lion is to be used as a revolver credit facility and the balance as a guarantee and letter of credit facility.
ªe reviewed agreement foresees a pledge on the shares of some companies of the group as well as on receivables and cash balances of some other entities of the group.
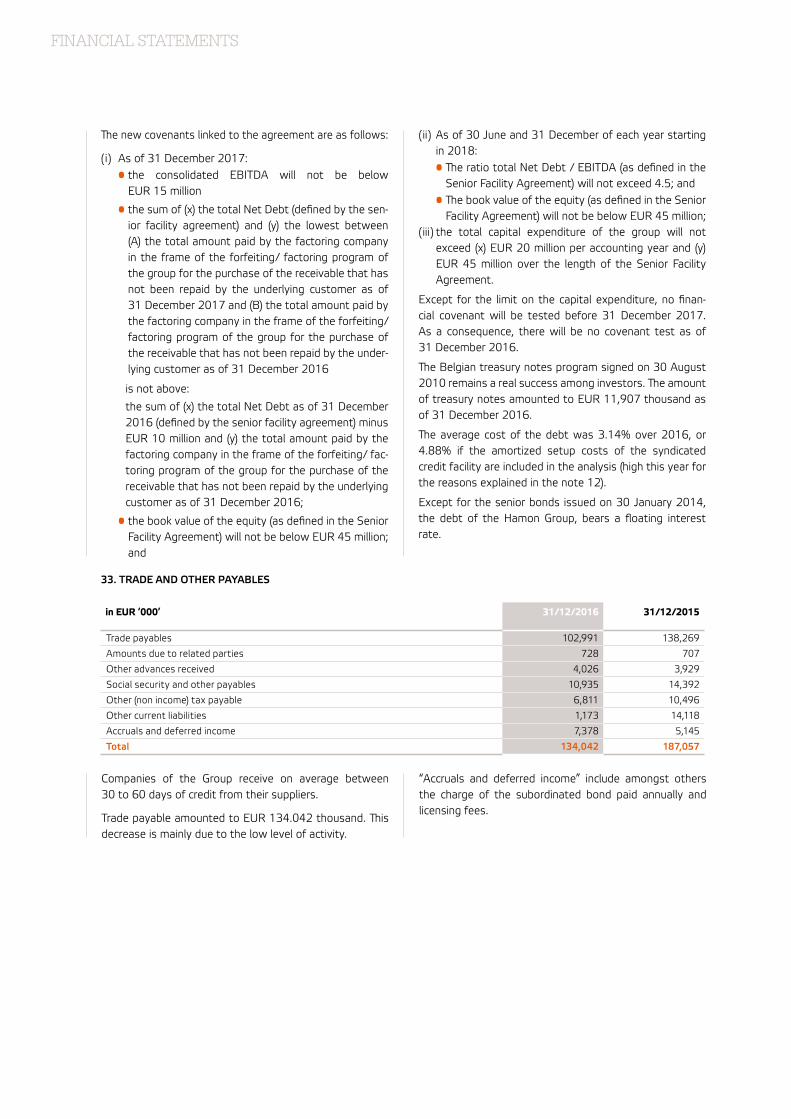
FINANCIAL STATEMENTS
ªe new covenants linked to the agreement are as follows:
( i ) As of 31 December 2017: • the consolidated EBITDA will not be below
EUR 15 million
• the sum of (x) the total Net Debt (defined by the sen-ior facility agreement) and (y) the lowest between (A) the total amount paid by the factoring company in the frame of the forfeiting/ factoring program of the group for the purchase of the receivable that has not been repaid by the underlying customer as of 31 December 2017 and (B) the total amount paid by the factoring company in the frame of the forfeiting/ factoring program of the group for the purchase of the receivable that has not been repaid by the under-lying customer as of 31 December 2016
is not above:
the sum of (x) the total Net Debt as of 31 December 2016 (defined by the senior facility agreement) minus EUR 10 million and (y) the total amount paid by the factoring company in the frame of the forfeiting/ fac-toring program of the group for the purchase of the receivable that has not been repaid by the underlying customer as of 31 December 2016;
• the book value of the equity (as defined in the Senior Facility Agreement) will not be below EUR 45 million; and
( ii ) As of 30 June and 31 December of each year starting in 2018:
• ªe ratio total Net Debt / EBITDA (as defined in the Senior Facility Agreement) will not exceed 4.5; and
• ªe book value of the equity (as defined in the Senior Facility Agreement) will not be below EUR 45 million;
( iii ) the total capital expenditure of the group will not exceed (x) EUR 20 million per accounting year and (y) EUR 45 million over the length of the Senior Facility Agreement.
Except for the limit on the capital expenditure, no finan-cial covenant will be tested before 31 December 2017. As a consequence, there will be no covenant test as of 31 December 2016.
ªe Belgian treasury notes program signed on 30 August 2010 remains a real success among investors. ªe amount of treasury notes amounted to EUR 11,907 thousand as of 31 December 2016.
ªe average cost of the debt was 3.14% over 2016, or 4.88% if the amortized setup costs of the syndicated credit facility are included in the analysis (high this year for the reasons explained in the note 12).
Except for the senior bonds issued on 30 January 2014, the debt of the Hamon Group, bears a floating interest rate.
33. TRADE AND OTHER PAYABLES
in EUR ‘000’ 31/12/2016 31/12/2015
Trade payables 102,991 138,269
Amounts due to related parties 728 707
Other advances received 4,026 3,929
Social security and other payables 10,935 14,392
Other (non income) tax payable 6,811 10,496
Other current liabilities 1,173 14,118
Accruals and deferred income 7,378 5,145
Total 134,042 187,057
Companies of the Group receive on average between 30 to 60 days of credit from their suppliers.
Trade payable amounted to EUR 134.042 thousand. ªis decrease is mainly due to the low level of activity.
“Accruals and deferred income” include amongst others the charge of the subordinated bond paid annually and licensing fees.
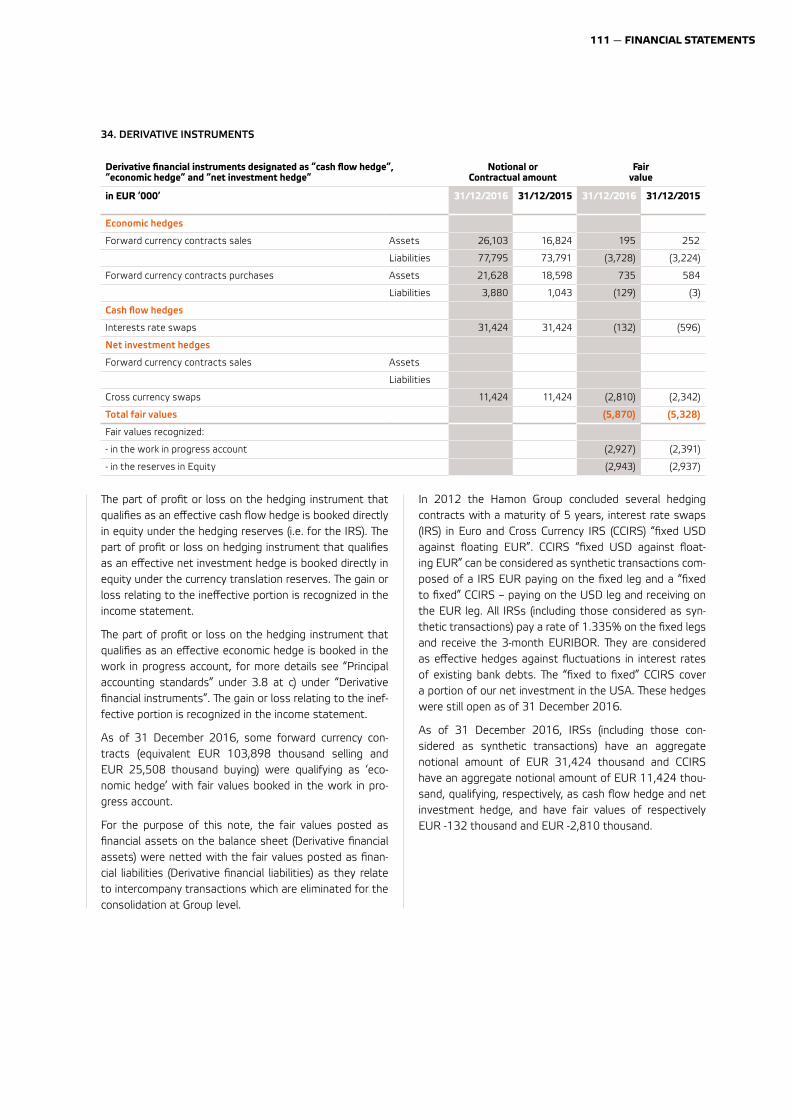
111 — FINANCIAL STATEMENTS
34. DERIVATIVE INSTRUMENTS
Derivative financial instruments designated as “cash flow hedge”, “economic hedge” and “net investment hedge”
Notional or Contractual amount
Fair value
in EUR ‘000’ 31/12/2016 31/12/2015 31/12/2016 31/12/2015
Economic hedges
Forward currency contracts sales Assets 26,103 16,824 195 252
Liabilities 77,795 73,791 (3,728) (3,224)
Forward currency contracts purchases Assets 21,628 18,598 735 584
Liabilities 3,880 1,043 (129) (3)
Cash flow hedges
Interests rate swaps 31,424 31,424 (132) (596)
Net investment hedges
Forward currency contracts sales Assets
Liabilities
Cross currency swaps 11,424 11,424 (2,810) (2,342)
Total fair values (5,870) (5,328)
Fair values recognized:
- in the work in progress account (2,927) (2,391)
- in the reserves in Equity (2,943) (2,937)
ªe part of profit or loss on the hedging instrument that qualifies as an effective cash flow hedge is booked directly in equity under the hedging reserves (i.e. for the IRS). ªe part of profit or loss on hedging instrument that qualifies as an effective net investment hedge is booked directly in equity under the currency translation reserves. ªe gain or loss relating to the ineffective portion is recognized in the income statement.
ªe part of profit or loss on the hedging instrument that qualifies as an effective economic hedge is booked in the work in progress account, for more details see “Principal accounting standards” under 3.8 at c) under “Derivative financial instruments”. ªe gain or loss relating to the inef-fective portion is recognized in the income statement.
As of 31 December 2016, some forward currency con-tracts (equivalent EUR 103,898 thousand selling and EUR 25,508 thousand buying) were qualifying as ‘eco-nomic hedge’ with fair values booked in the work in pro-gress account.
For the purpose of this note, the fair values posted as financial assets on the balance sheet (Derivative financial assets) were netted with the fair values posted as finan-cial liabilities (Derivative financial liabilities) as they relate to intercompany transactions which are eliminated for the consolidation at Group level.
In 2012 the Hamon Group concluded several hedging contracts with a maturity of 5 years, interest rate swaps (IRS) in Euro and Cross Currency IRS (CCIRS) “fixed USD against floating EUR”. CCIRS “fixed USD against float-ing EUR” can be considered as synthetic transactions com-posed of a IRS EUR paying on the fixed leg and a “fixed to fixed” CCIRS – paying on the USD leg and receiving on the EUR leg. All IRSs (including those considered as syn-thetic transactions) pay a rate of 1.335% on the fixed legs and receive the 3-month EURIBOR. ªey are considered as effective hedges against fluctuations in interest rates of existing bank debts. ªe “fixed to fixed” CCIRS cover a portion of our net investment in the USA. ªese hedges were still open as of 31 December 2016.
As of 31 December 2016, IRSs (including those con-sidered as synthetic transactions) have an aggregate notional amount of EUR 31,424 thousand and CCIRS have an aggregate notional amount of EUR 11,424 thou-sand, qualifying, respectively, as cash flow hedge and net investment hedge, and have fair values of respectively EUR -132 thousand and EUR -2,810 thousand.
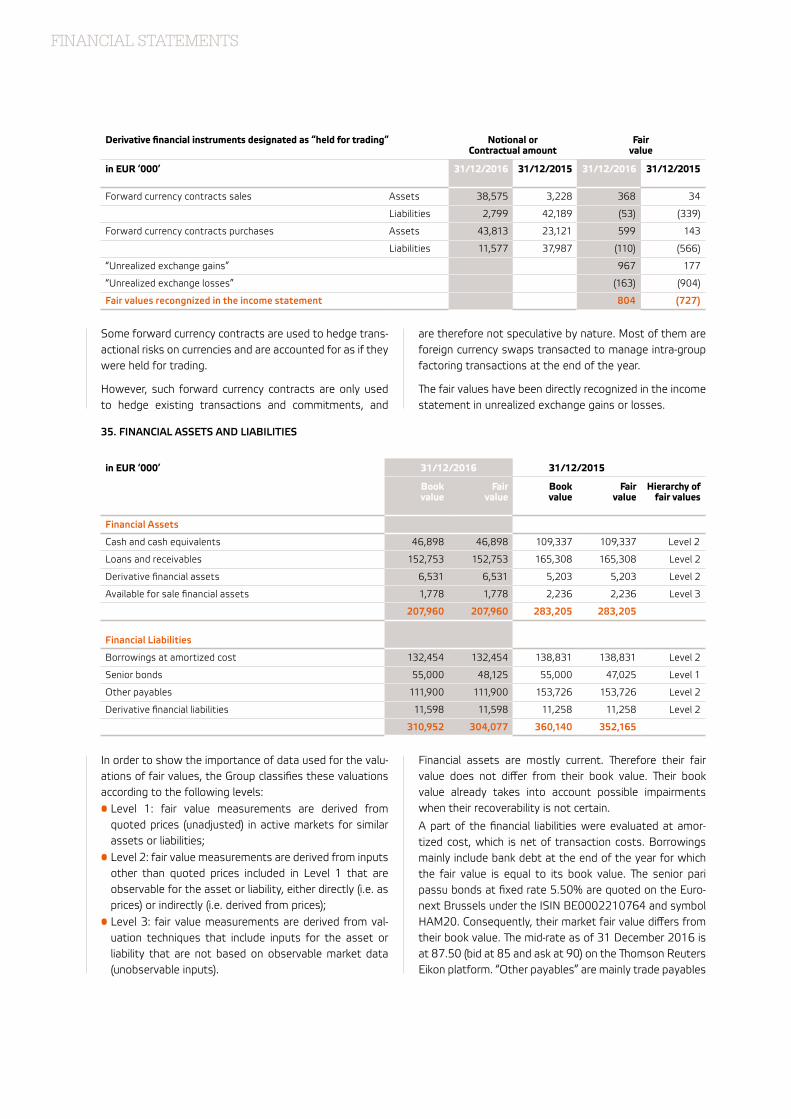
FINANCIAL STATEMENTS
Derivative financial instruments designated as “held for trading” Notional or Contractual amount
Fair value
in EUR ‘000’ 31/12/2016 31/12/2015 31/12/2016 31/12/2015
Forward currency contracts sales Assets 38,575 3,228 368 34
Liabilities 2,799 42,189 (53) (339)
Forward currency contracts purchases Assets 43,813 23,121 599 143
Liabilities 11,577 37,987 (110) (566)
“Unrealized exchange gains” 967 177
“Unrealized exchange losses” (163) (904)
Fair values recongnized in the income statement 804 (727)
Some forward currency contracts are used to hedge trans-actional risks on currencies and are accounted for as if they were held for trading.
However, such forward currency contracts are only used to hedge existing transactions and commitments, and
are therefore not speculative by nature. Most of them are foreign currency swaps transacted to manage intra-group factoring transactions at the end of the year.
ªe fair values have been directly recognized in the income statement in unrealized exchange gains or losses.
35. FINANCIAL ASSETS AND LIABILITIES
in EUR ‘000’ 31/12/2016 31/12/2015
Book value
Fair value
Book value
Fair value
Hierarchy of fair values
Financial Assets
Cash and cash equivalents 46,898 46,898 109,337 109,337 Level 2
Loans and receivables 152,753 152,753 165,308 165,308 Level 2
Derivative financial assets 6,531 6,531 5,203 5,203 Level 2
Available for sale financial assets 1,778 1,778 2,236 2,236 Level 3
207,960 207,960 283,205 283,205
Financial Liabilities
Borrowings at amortized cost 132,454 132,454 138,831 138,831 Level 2
Senior bonds 55,000 48,125 55,000 47,025 Level 1
Other payables 111,900 111,900 153,726 153,726 Level 2
Derivative financial liabilities 11,598 11,598 11,258 11,258 Level 2
310,952 304,077 360,140 352,165
In order to show the importance of data used for the valu-ations of fair values, the Group classifies these valuations according to the following levels:• Level 1: fair value measurements are derived from
quoted prices (unadjusted) in active markets for similar assets or liabilities;
• Level 2: fair value measurements are derived from inputs other than quoted prices included in Level 1 that are observable for the asset or liability, either directly (i.e. as prices) or indirectly (i.e. derived from prices);
• Level 3: fair value measurements are derived from val-uation techniques that include inputs for the asset or liability that are not based on observable market data (unobservable inputs).
Financial assets are mostly current. ªerefore their fair value does not differ from their book value. ªeir book value already takes into account possible impairments when their recoverability is not certain.
A part of the financial liabilities were evaluated at amor-tized cost, which is net of transaction costs. Borrowings mainly include bank debt at the end of the year for which the fair value is equal to its book value. ªe senior pari passu bonds at fixed rate 5.50% are quoted on the Euro-next Brussels under the ISIN BE0002210764 and symbol HAM20. Consequently, their market fair value differs from their book value. ªe mid-rate as of 31 December 2016 is at 87.50 (bid at 85 and ask at 90) on the ªomson Reuters Eikon platform. “Other payables” are mainly trade payables
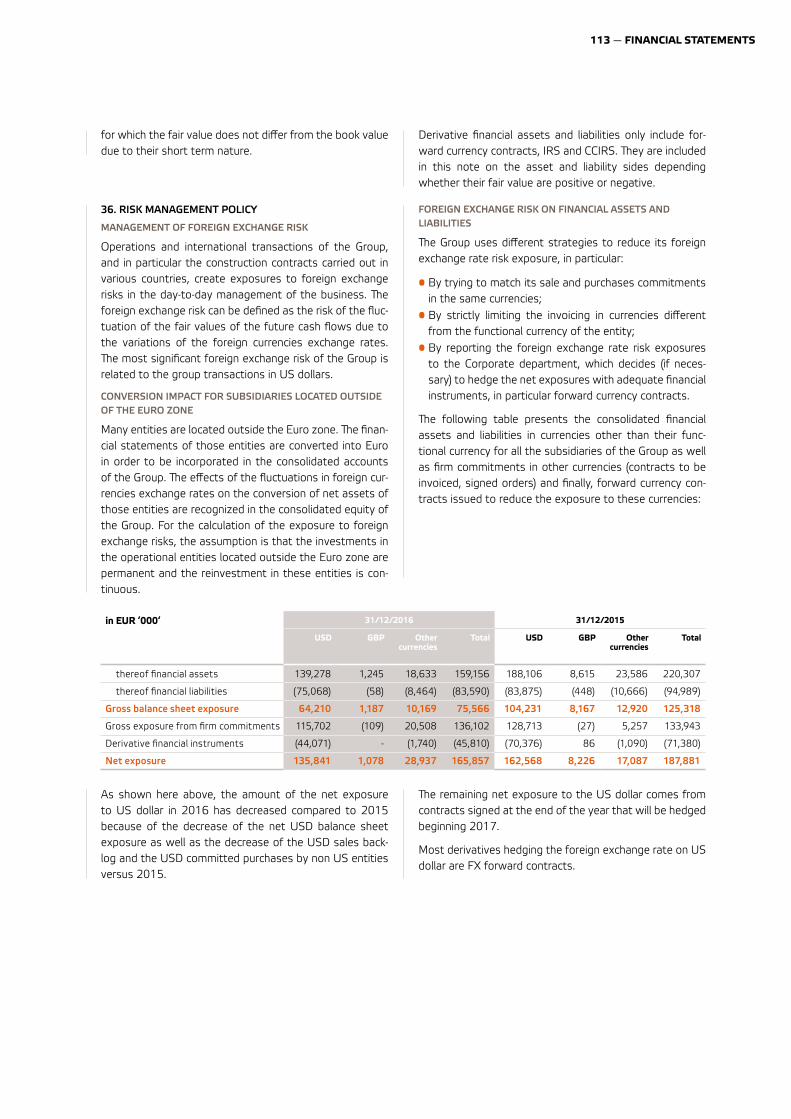
113 — FINANCIAL STATEMENTS
for which the fair value does not differ from the book value due to their short term nature.
Derivative financial assets and liabilities only include for-ward currency contracts, IRS and CCIRS. ªey are included in this note on the asset and liability sides depending whether their fair value are positive or negative.
in EUR ‘000‘ 31/12/2016 31/12/2015
USD GBP Other currencies
Total USD GBP Other currencies
Total
thereof financial assets 139,278 1,245 18,633 159,156 188,106 8,615 23,586 220,307
thereof financial liabilities (75,068) (58) (8,464) (83,590) (83,875) (448) (10,666) (94,989)
Gross balance sheet exposure 64,210 1,187 10,169 75,566 104,231 8,167 12,920 125,318
Gross exposure from firm commitments 115,702 (109) 20,508 136,102 128,713 (27) 5,257 133,943
Derivative financial instruments (44,071) - (1,740) (45,810) (70,376) 86 (1,090) (71,380)
Net exposure 135,841 1,078 28,937 165,857 162,568 8,226 17,087 187,881
36. RISK MANAGEMENT POLICY
MANAGEMENT OF FOREIGN EXCHANGE RISK
Operations and international transactions of the Group, and in particular the construction contracts carried out in various countries, create exposures to foreign exchange risks in the day-to-day management of the business. ªe foreign exchange risk can be defined as the risk of the fluc-tuation of the fair values of the future cash flows due to the variations of the foreign currencies exchange rates. ªe most significant foreign exchange risk of the Group is related to the group transactions in US dollars.
CONVERSION IMPACT FOR SUBSIDIARIES LOCATED OUTSIDE OF THE EURO ZONE
Many entities are located outside the Euro zone. ªe finan-cial statements of those entities are converted into Euro in order to be incorporated in the consolidated accounts of the Group. ªe effects of the fluctuations in foreign cur-rencies exchange rates on the conversion of net assets of those entities are recognized in the consolidated equity of the Group. For the calculation of the exposure to foreign exchange risks, the assumption is that the investments in the operational entities located outside the Euro zone are permanent and the reinvestment in these entities is con-tinuous.
FOREIGN EXCHANGE RISK ON FINANCIAL ASSETS AND LIABILITIES
ªe Group uses different strategies to reduce its foreign exchange rate risk exposure, in particular:
• By trying to match its sale and purchases commitments in the same currencies;
• By strictly limiting the invoicing in currencies different from the functional currency of the entity;
• By reporting the foreign exchange rate risk exposures to the Corporate department, which decides (if neces-sary) to hedge the net exposures with adequate financial instruments, in particular forward currency contracts.
ªe following table presents the consolidated financial assets and liabilities in currencies other than their func-tional currency for all the subsidiaries of the Group as well as firm commitments in other currencies (contracts to be invoiced, signed orders) and finally, forward currency con-tracts issued to reduce the exposure to these currencies:
As shown here above, the amount of the net exposure to US dollar in 2016 has decreased compared to 2015 because of the decrease of the net USD balance sheet exposure as well as the decrease of the USD sales back-log and the USD committed purchases by non US entities versus 2015.
ªe remaining net exposure to the US dollar comes from contracts signed at the end of the year that will be hedged beginning 2017.
Most derivatives hedging the foreign exchange rate on US dollar are FX forward contracts.
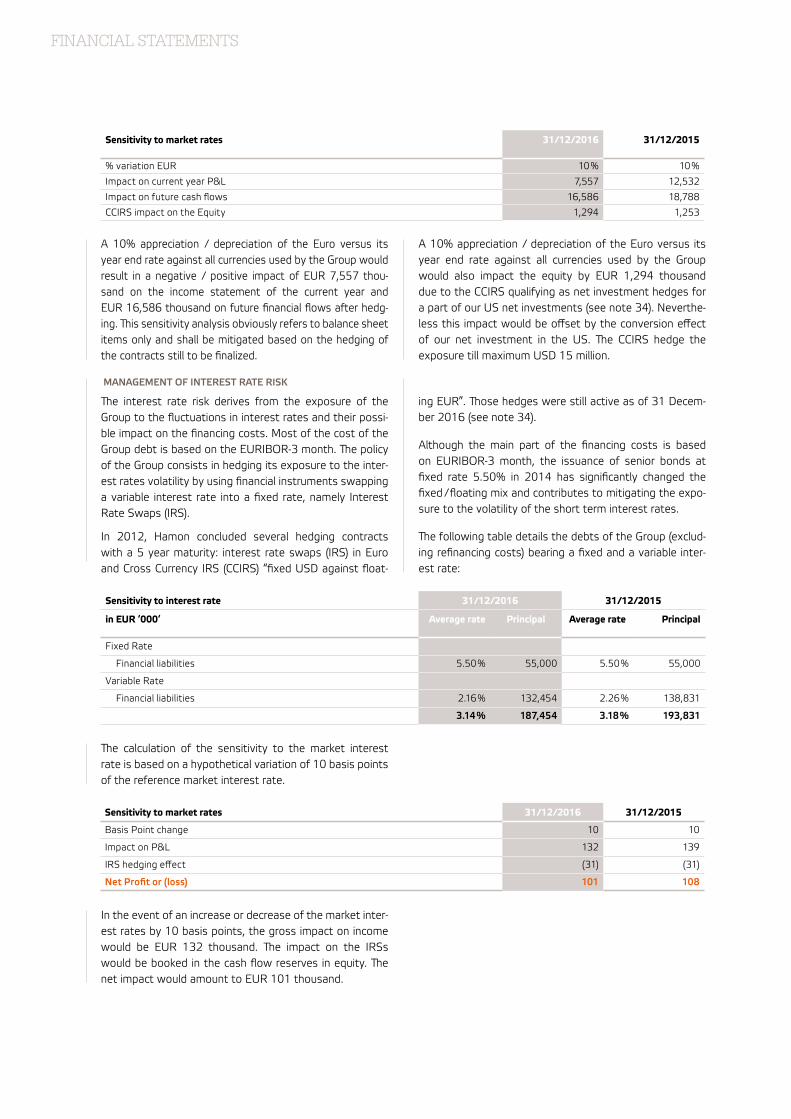
FINANCIAL STATEMENTS
Sensitivity to market rates 31/12/2016 31/12/2015
% variation EUR 10 % 10 %
Impact on current year P&L 7,557 12,532
Impact on future cash flows 16,586 18,788
CCIRS impact on the Equity 1,294 1,253
A 10% appreciation / depreciation of the Euro versus its year end rate against all currencies used by the Group would result in a negative / positive impact of EUR 7,557 thou-sand on the income statement of the current year and EUR 16,586 thousand on future financial flows after hedg-ing. ªis sensitivity analysis obviously refers to balance sheet items only and shall be mitigated based on the hedging of the contracts still to be finalized.
MANAGEMENT OF INTEREST RATE RISK
ªe interest rate risk derives from the exposure of the Group to the fluctuations in interest rates and their possi-ble impact on the financing costs. Most of the cost of the Group debt is based on the EURIBOR-3 month. ªe policy of the Group consists in hedging its exposure to the inter-est rates volatility by using financial instruments swapping a variable interest rate into a fixed rate, namely Interest Rate Swaps (IRS).
In 2012, Hamon concluded several hedging contracts with a 5 year maturity: interest rate swaps (IRS) in Euro and Cross Currency IRS (CCIRS) “fixed USD against float-
A 10% appreciation / depreciation of the Euro versus its year end rate against all currencies used by the Group would also impact the equity by EUR 1,294 thousand due to the CCIRS qualifying as net investment hedges for a part of our US net investments (see note 34). Neverthe-less this impact would be offset by the conversion effect of our net investment in the US. ªe CCIRS hedge the exposure till maximum USD 15 million.
ing EUR”. ªose hedges were still active as of 31 Decem-ber 2016 (see note 34).
Although the main part of the financing costs is based on EURIBOR-3 month, the issuance of senior bonds at fixed rate 5.50% in 2014 has significantly changed the fixed / floating mix and contributes to mitigating the expo-sure to the volatility of the short term interest rates.
ªe following table details the debts of the Group (exclud-ing refinancing costs) bearing a fixed and a variable inter-est rate:
Sensitivity to interest rate 31/12/2016 31/12/2015
in EUR ‘000‘ Average rate Principal Average rate Principal
Fixed Rate
Financial liabilities 5.50 % 55,000 5.50 % 55,000
Variable Rate
Financial liabilities 2.16 % 132,454 2.26 % 138,831
3.14 % 187,454 3.18 % 193,831
ªe calculation of the sensitivity to the market interest rate is based on a hypothetical variation of 10 basis points of the reference market interest rate.
Sensitivity to market rates 31/12/2016 31/12/2015
Basis Point change 10 10
Impact on P&L 132 139
IRS hedging effect (31) (31)
Net Profit or (loss) 101 108
In the event of an increase or decrease of the market inter-est rates by 10 basis points, the gross impact on income would be EUR 132 thousand. ªe impact on the IRSs would be booked in the cash flow reserves in equity. ªe net impact would amount to EUR 101 thousand.
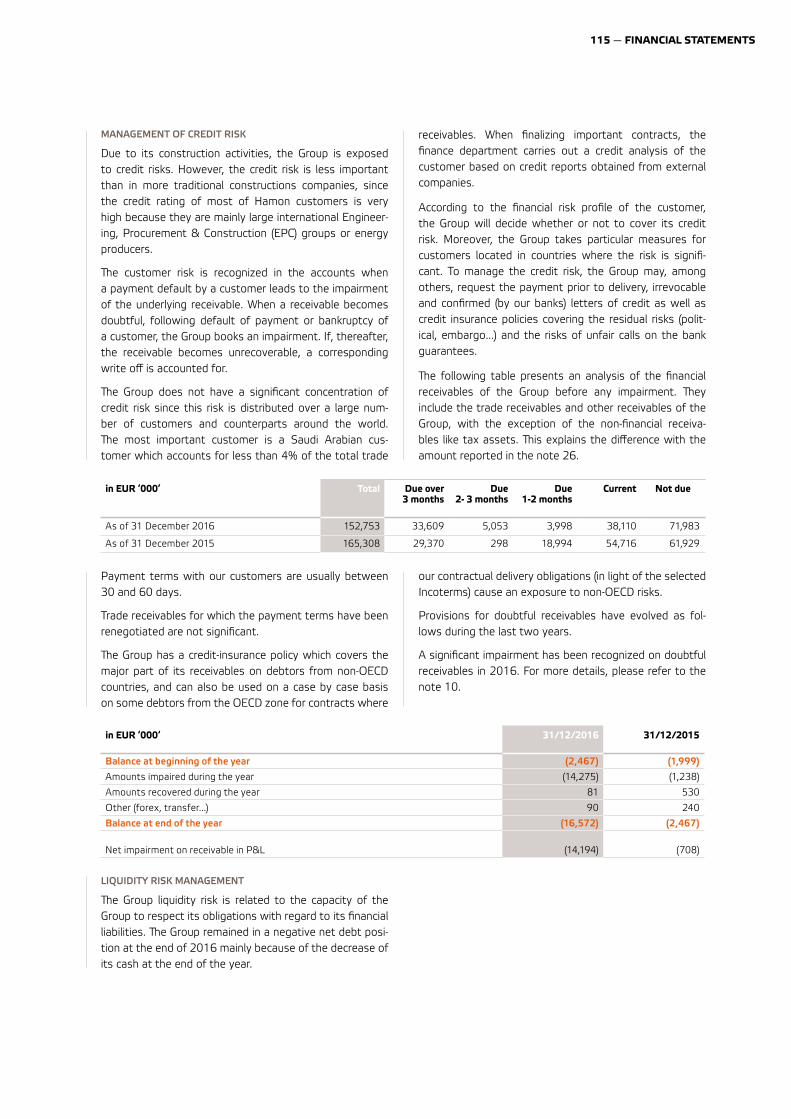
115 — FINANCIAL STATEMENTS
MANAGEMENT OF CREDIT RISK
Due to its construction activities, the Group is exposed to credit risks. However, the credit risk is less important than in more traditional constructions companies, since the credit rating of most of Hamon customers is very high because they are mainly large international Engineer-ing, Procurement & Construction (EPC) groups or energy producers.
ªe customer risk is recognized in the accounts when a payment default by a customer leads to the impairment of the underlying receivable. When a receivable becomes doubtful, following default of payment or bankruptcy of a customer, the Group books an impairment. If, thereafter, the receivable becomes unrecoverable, a corresponding write off is accounted for.
ªe Group does not have a significant concentration of credit risk since this risk is distributed over a large num-ber of customers and counterparts around the world. ªe most important customer is a Saudi Arabian cus-tomer which accounts for less than 4% of the total trade
receivables. When finalizing important contracts, the finance department carries out a credit analysis of the customer based on credit reports obtained from external companies.
According to the financial risk profile of the customer, the Group will decide whether or not to cover its credit risk. Moreover, the Group takes particular measures for customers located in countries where the risk is signifi-cant. To manage the credit risk, the Group may, among others, request the payment prior to delivery, irrevocable and confirmed (by our banks) letters of credit as well as credit insurance policies covering the residual risks (polit-ical, embargo...) and the risks of unfair calls on the bank guarantees.
ªe following table presents an analysis of the financial receivables of the Group before any impairment. ªey include the trade receivables and other receivables of the Group, with the exception of the non-financial receiva-bles like tax assets. ªis explains the difference with the amount reported in the note 26.
in EUR ‘000’ Total Due over 3 months
Due 2- 3 months
Due 1-2 months
Current Not due
As of 31 December 2016 152,753 33,609 5,053 3,998 38,110 71,983
As of 31 December 2015 165,308 29,370 298 18,994 54,716 61,929
Payment terms with our customers are usually between 30 and 60 days.
Trade receivables for which the payment terms have been renegotiated are not significant.
ªe Group has a credit-insurance policy which covers the major part of its receivables on debtors from non-OECD countries, and can also be used on a case by case basis on some debtors from the OECD zone for contracts where
our contractual delivery obligations (in light of the selected Incoterms) cause an exposure to non-OECD risks.
Provisions for doubtful receivables have evolved as fol-lows during the last two years.
A significant impairment has been recognized on doubtful receivables in 2016. For more details, please refer to the note 10.
in EUR ‘000‘ 31/12/2016 31/12/2015
Balance at beginning of the year (2,467) (1,999)
Amounts impaired during the year (14,275) (1,238)
Amounts recovered during the year 81 530
Other (forex, transfer...) 90 240
Balance at end of the year (16,572) (2,467)
Net impairment on receivable in P&L (14,194) (708)
LIQUIDITY RISK MANAGEMENT
ªe Group liquidity risk is related to the capacity of the Group to respect its obligations with regard to its financial liabilities. ªe Group remained in a negative net debt posi-tion at the end of 2016 mainly because of the decrease of its cash at the end of the year.
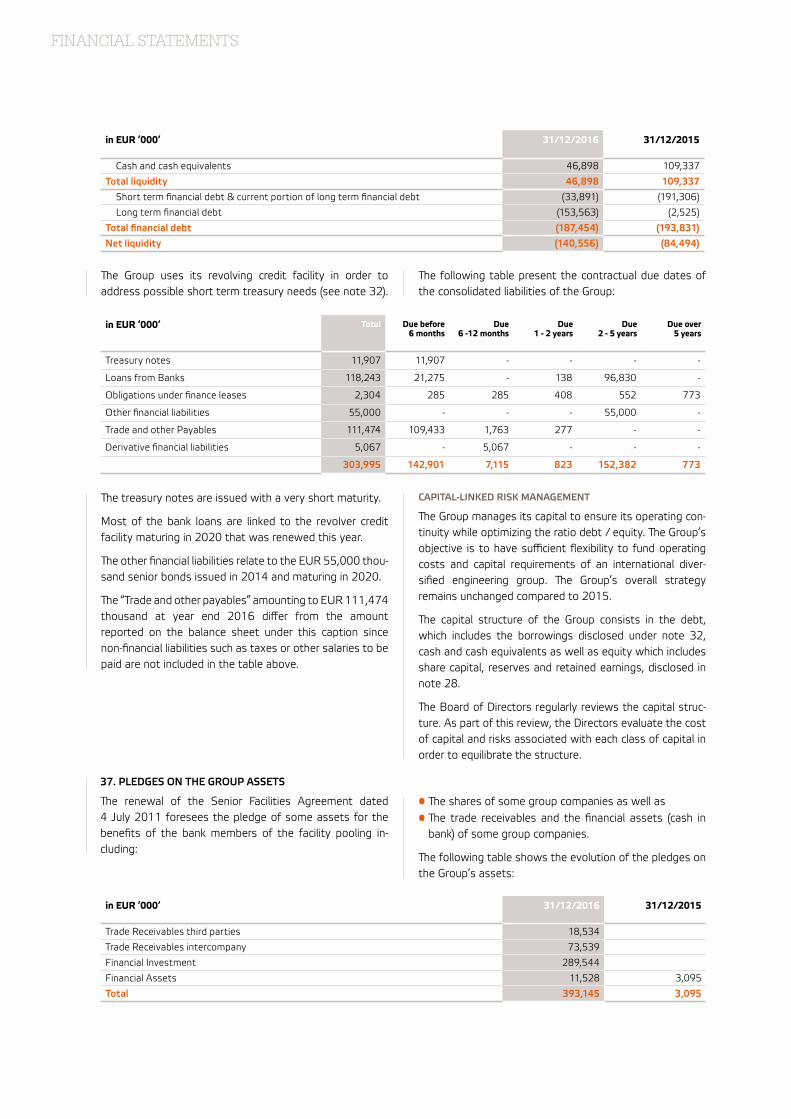
FINANCIAL STATEMENTS
in EUR ‘000‘ 31/12/2016 31/12/2015
Cash and cash equivalents 46,898 109,337
Total liquidity 46,898 109,337
Short term financial debt & current portion of long term financial debt (33,891) (191,306)
Long term financial debt (153,563) (2,525)
Total financial debt (187,454) (193,831)
Net liquidity (140,556) (84,494)
ªe treasury notes are issued with a very short maturity.
Most of the bank loans are linked to the revolver credit facility maturing in 2020 that was renewed this year.
ªe other financial liabilities relate to the EUR 55,000 thou-sand senior bonds issued in 2014 and maturing in 2020.
ªe “Trade and other payables” amounting to EUR 111,474 thousand at year end 2016 differ from the amount reported on the balance sheet under this caption since non-financial liabilities such as taxes or other salaries to be paid are not included in the table above.
CAPITAL-LINKED RISK MANAGEMENT
ªe Group manages its capital to ensure its operating con-tinuity while optimizing the ratio debt / equity. ªe Group’s objective is to have sufficient flexibility to fund operating costs and capital requirements of an international diver-sified engineering group. ªe Group’s overall strategy remains unchanged compared to 2015.
ªe capital structure of the Group consists in the debt, which includes the borrowings disclosed under note 32, cash and cash equivalents as well as equity which includes share capital, reserves and retained earnings, disclosed in note 28.
ªe Board of Directors regularly reviews the capital struc-ture. As part of this review, the Directors evaluate the cost of capital and risks associated with each class of capital in order to equilibrate the structure.
ªe Group uses its revolving credit facility in order to address possible short term treasury needs (see note 32).
ªe following table present the contractual due dates of the consolidated liabilities of the Group:
in EUR ‘000‘ Total Due before 6 months
Due 6 -12 months
Due 1 - 2 years
Due 2 - 5 years
Due over 5 years
Treasury notes 11,907 11,907 - - - -
Loans from Banks 118,243 21,275 - 138 96,830 -
Obligations under finance leases 2,304 285 285 408 552 773
Other financial liabilities 55,000 - - - 55,000 -
Trade and other Payables 111,474 109,433 1,763 277 - -
Derivative financial liabilities 5,067 - 5,067 - - -
303,995 142,901 7,115 823 152,382 773
37. PLEDGES ON THE GROUP ASSETS
ªe renewal of the Senior Facilities Agreement dated 4 July 2011 foresees the pledge of some assets for the benefits of the bank members of the facility pooling in -cluding:
• ªe shares of some group companies as well as• ªe trade receivables and the financial assets (cash in
bank) of some group companies.
ªe following table shows the evolution of the pledges on the Group’s assets:
in EUR ‘000‘ 31/12/2016 31/12/2015
Trade Receivables third parties 18,534
Trade Receivables intercompany 73,539
Financial Investment 289,544
Financial Assets 11,528 3,095
Total 393,145 3,095
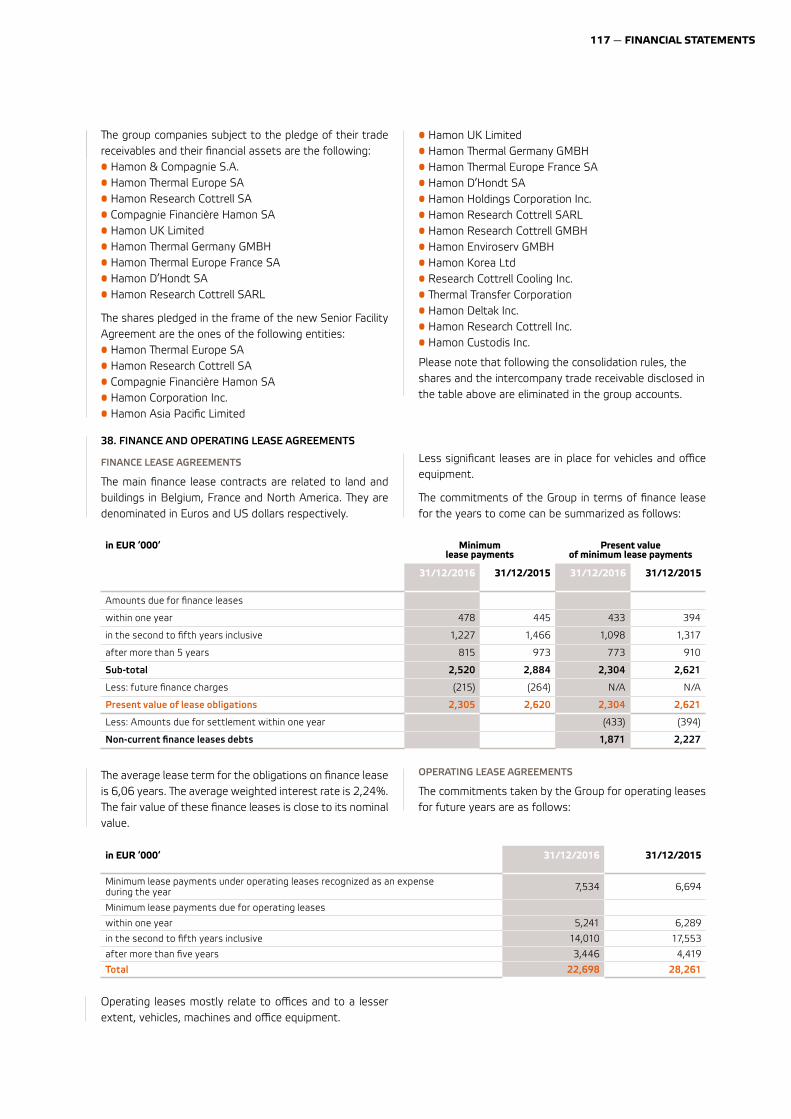
117 — FINANCIAL STATEMENTS
ªe group companies subject to the pledge of their trade receivables and their financial assets are the following:• Hamon & Compagnie S.A.• Hamon ªermal Europe SA• Hamon Research Cottrell SA• Compagnie Financière Hamon SA• Hamon UK Limited• Hamon ªermal Germany GMBH• Hamon ªermal Europe France SA• Hamon D’Hondt SA• Hamon Research Cottrell SARL
ªe shares pledged in the frame of the new Senior Facility Agreement are the ones of the following entities:• Hamon ªermal Europe SA• Hamon Research Cottrell SA• Compagnie Financière Hamon SA• Hamon Corporation Inc.• Hamon Asia Pacific Limited
• Hamon UK Limited• Hamon ªermal Germany GMBH• Hamon ªermal Europe France SA• Hamon D’Hondt SA• Hamon Holdings Corporation Inc.• Hamon Research Cottrell SARL• Hamon Research Cottrell GMBH• Hamon Enviroserv GMBH• Hamon Korea Ltd • Research Cottrell Cooling Inc.• ªermal Transfer Corporation• Hamon Deltak Inc.• Hamon Research Cottrell Inc.• Hamon Custodis Inc.
Please note that following the consolidation rules, the shares and the intercompany trade receivable disclosed in the table above are eliminated in the group accounts.
in EUR ‘000‘ Minimum lease payments
Present value of minimum lease payments
31/12/2016 31/12/2015 31/12/2016 31/12/2015
Amounts due for finance leases
within one year 478 445 433 394
in the second to fifth years inclusive 1,227 1,466 1,098 1,317
after more than 5 years 815 973 773 910
Sub-total 2,520 2,884 2,304 2,621
Less: future finance charges (215) (264) N/A N/A
Present value of lease obligations 2,305 2,620 2,304 2,621
Less: Amounts due for settlement within one year (433) (394)
Non-current finance leases debts 1,871 2,227
ªe average lease term for the obligations on finance lease is 6,06 years. ªe average weighted interest rate is 2,24%. ªe fair value of these finance leases is close to its nominal value.
OPERATING LEASE AGREEMENTS
ªe commitments taken by the Group for operating leases for future years are as follows:
in EUR ‘000‘ 31/12/2016 31/12/2015
Minimum lease payments under operating leases recognized as an expense during the year 7,534 6,694
Minimum lease payments due for operating leases
within one year 5,241 6,289
in the second to fifth years inclusive 14,010 17,553
after more than five years 3,446 4,419
Total 22,698 28,261
Operating leases mostly relate to offices and to a lesser extent, vehicles, machines and office equipment.
38. FINANCE AND OPERATING LEASE AGREEMENTS
FINANCE LEASE AGREEMENTS
ªe main finance lease contracts are related to land and buildings in Belgium, France and North America. ªey are denominated in Euros and US dollars respectively.
Less significant leases are in place for vehicles and office equipment.
ªe commitments of the Group in terms of finance lease for the years to come can be summarized as follows:
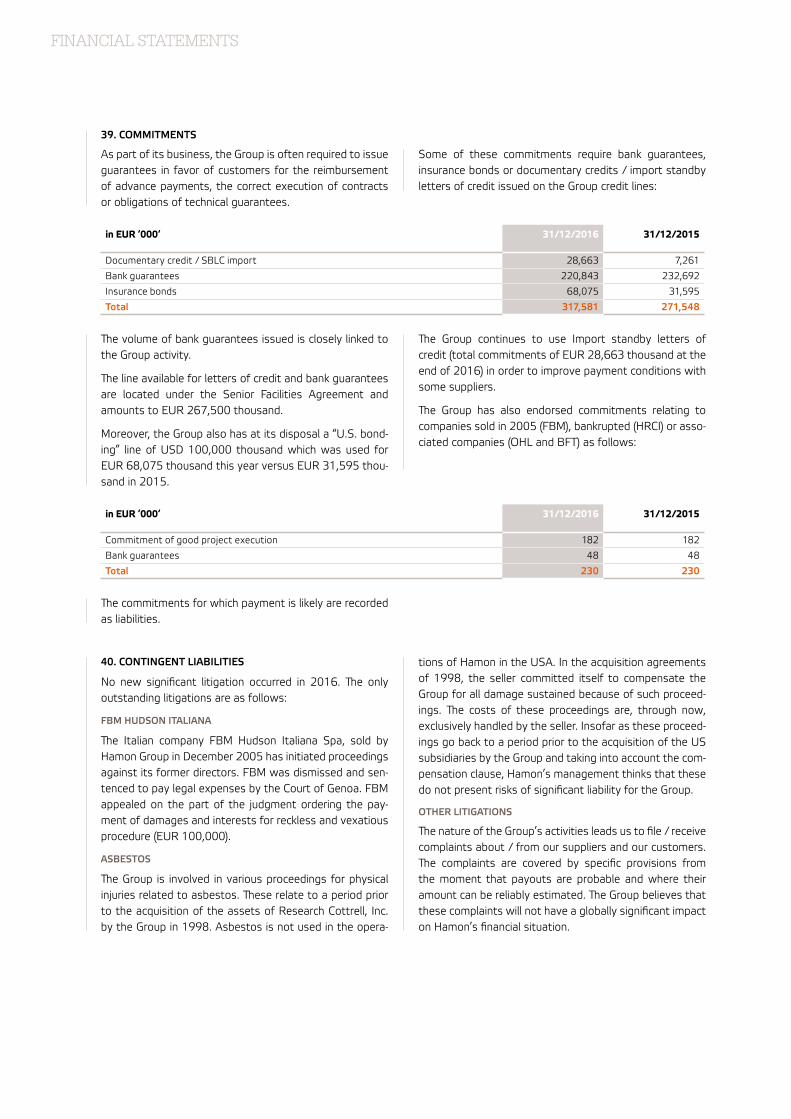
FINANCIAL STATEMENTS
39. COMMITMENTS
As part of its business, the Group is often required to issue guarantees in favor of customers for the reimbursement of advance payments, the correct execution of contracts or obligations of technical guarantees.
Some of these commitments require bank guarantees, insurance bonds or documentary credits / import standby letters of credit issued on the Group credit lines:
in EUR ‘000‘ 31/12/2016 31/12/2015
Documentary credit / SBLC import 28,663 7,261
Bank guarantees 220,843 232,692
Insurance bonds 68,075 31,595
Total 317,581 271,548
ªe volume of bank guarantees issued is closely linked to the Group activity.
ªe line available for letters of credit and bank guarantees are located under the Senior Facilities Agreement and amounts to EUR 267,500 thousand.
Moreover, the Group also has at its disposal a “U.S. bond-ing” line of USD 100,000 thousand which was used for EUR 68,075 thousand this year versus EUR 31,595 thou-sand in 2015.
ªe Group continues to use Import standby letters of credit (total commitments of EUR 28,663 thousand at the end of 2016) in order to improve payment conditions with some suppliers.
ªe Group has also endorsed commitments relating to companies sold in 2005 (FBM), bankrupted (HRCI) or asso-ciated companies (OHL and BFT) as follows:
in EUR ‘000‘ 31/12/2016 31/12/2015
Commitment of good project execution 182 182
Bank guarantees 48 48
Total 230 230
40. CONTINGENT LIABILITIES
No new significant litigation occurred in 2016. ªe only outstanding litigations are as follows:
FBM HUDSON ITALIANA
ªe Italian company FBM Hudson Italiana Spa, sold by Hamon Group in December 2005 has initiated proceedings against its former directors. FBM was dismissed and sen-tenced to pay legal expenses by the Court of Genoa. FBM appealed on the part of the judgment ordering the pay-ment of damages and interests for reckless and vexatious procedure (EUR 100,000).
ASBESTOS
ªe Group is involved in various proceedings for physical injuries related to asbestos. ªese relate to a period prior to the acquisition of the assets of Research Cottrell, Inc. by the Group in 1998. Asbestos is not used in the opera-
tions of Hamon in the USA. In the acquisition agreements of 1998, the seller committed itself to compensate the Group for all damage sustained because of such proceed-ings. ªe costs of these proceedings are, through now, exclusively handled by the seller. Insofar as these proceed-ings go back to a period prior to the acquisition of the US subsidiaries by the Group and taking into account the com-pensation clause, Hamon’s management thinks that these do not present risks of significant liability for the Group.
OTHER LITIGATIONS
ªe nature of the Group’s activities leads us to file / receive complaints about / from our suppliers and our customers. ªe complaints are covered by specific provisions from the moment that payouts are probable and where their amount can be reliably estimated. ªe Group believes that these complaints will not have a globally significant impact on Hamon’s financial situation.
ªe commitments for which payment is likely are recorded as liabilities.
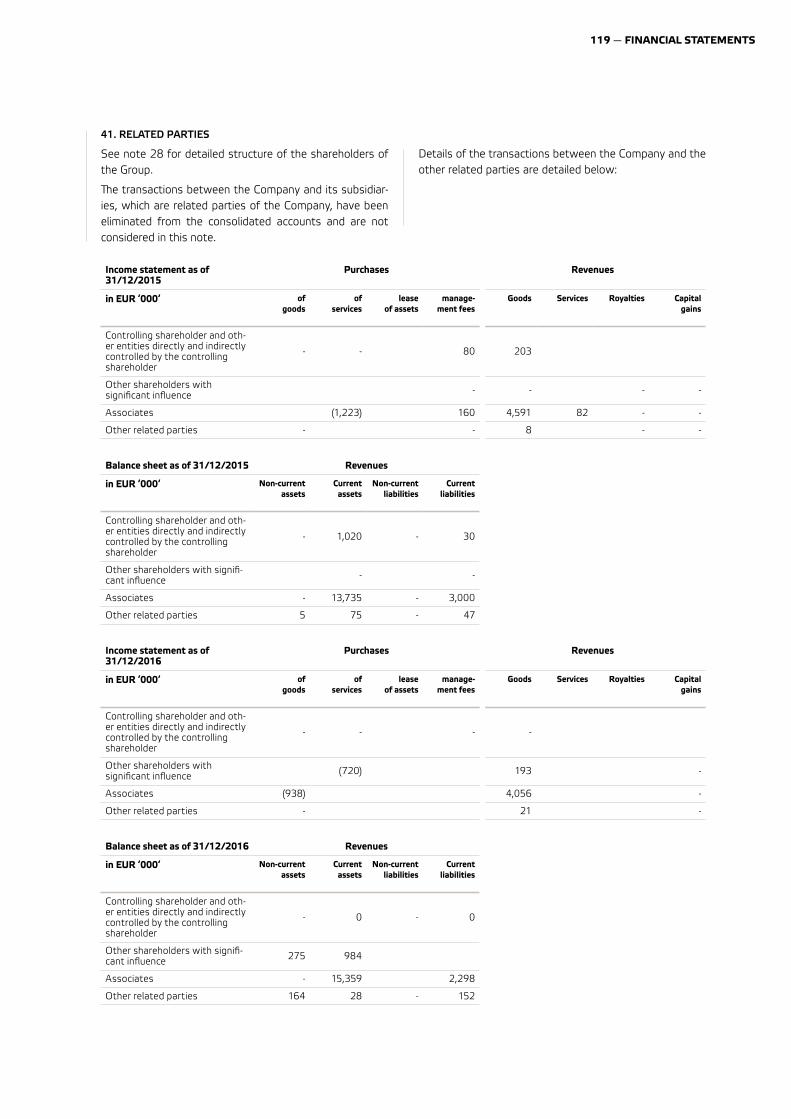
119 — FINANCIAL STATEMENTS
41. RELATED PARTIES
See note 28 for detailed structure of the shareholders of the Group.
ªe transactions between the Company and its subsidiar-ies, which are related parties of the Company, have been eliminated from the consolidated accounts and are not considered in this note.
Details of the transactions between the Company and the other related parties are detailed below:
Income statement as of 31/12/2015
Purchases Revenues
in EUR ‘000‘ of goods
of services
lease of assets
manage-ment fees
Goods Services Royalties Capital gains
Controlling shareholder and oth-er entities directly and indirectly controlled by the controlling shareholder
- - 80 203
Other shareholders with significant influence - - - -
Associates (1,223) 160 4,591 82 - -
Other related parties - - 8 - -
Balance sheet as of 31/12/2015 Revenues
in EUR ‘000‘ Non-current assets
Current assets
Non-current liabilities
Current liabilities
Controlling shareholder and oth-er entities directly and indirectly controlled by the controlling shareholder
- 1,020 - 30
Other shareholders with signifi-cant influence - -
Associates - 13,735 - 3,000
Other related parties 5 75 - 47
Income statement as of 31/12/2016
Purchases Revenues
in EUR ‘000‘ of goods
of services
lease of assets
manage-ment fees
Goods Services Royalties Capital gains
Controlling shareholder and oth-er entities directly and indirectly controlled by the controlling shareholder
- - - -
Other shareholders with significant influence (720) 193 -
Associates (938) 4,056 -
Other related parties - 21 -
Balance sheet as of 31/12/2016 Revenues
in EUR ‘000‘ Non-current assets
Current assets
Non-current liabilities
Current liabilities
Controlling shareholder and oth-er entities directly and indirectly controlled by the controlling shareholder
- 0 - 0
Other shareholders with signifi-cant influence 275 984
Associates - 15,359 2,298
Other related parties 164 28 - 152
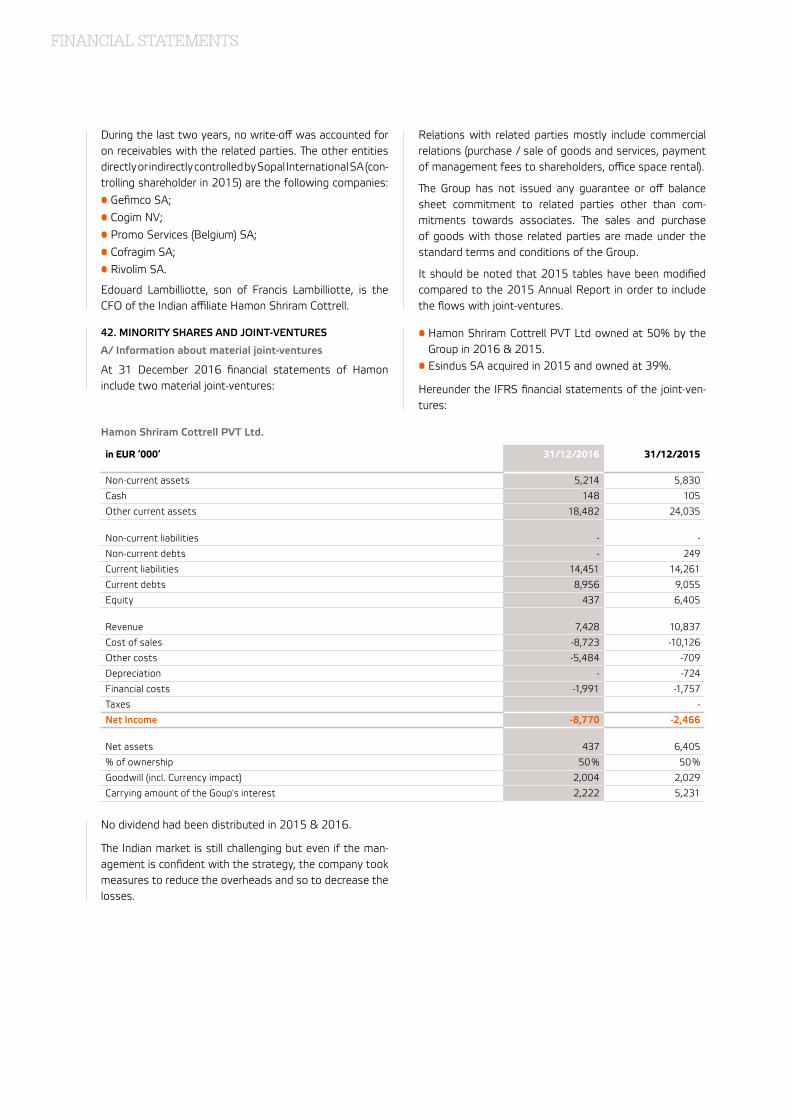
FINANCIAL STATEMENTS
During the last two years, no write-off was accounted for on receivables with the related parties. ªe other entities directly or indirectly controlled by Sopal International SA (con-trolling shareholder in 2015) are the following companies:
• Gefimco SA;
• Cogim NV;
• Promo Services (Belgium) SA;
• Cofragim SA;
• Rivolim SA.
Edouard Lambilliotte, son of Francis Lambilliotte, is the CFO of the Indian affiliate Hamon Shriram Cottrell.
Relations with related parties mostly include commercial relations (purchase / sale of goods and services, payment of management fees to shareholders, office space rental).
ªe Group has not issued any guarantee or off balance sheet commitment to related parties other than com-mitments towards associates. ªe sales and purchase of goods with those related parties are made under the standard terms and conditions of the Group.
It should be noted that 2015 tables have been modified compared to the 2015 Annual Report in order to include the flows with joint-ventures.
Hamon Shriram Cottrell PVT Ltd.
in EUR ‘000‘ 31/12/2016 31/12/2015
Non-current assets 5,214 5,830
Cash 148 105
Other current assets 18,482 24,035
Non-current liabilities - -
Non-current debts - 249
Current liabilities 14,451 14,261
Current debts 8,956 9,055
Equity 437 6,405
Revenue 7,428 10,837
Cost of sales -8,723 -10,126
Other costs -5,484 -709
Depreciation - -724
Financial costs -1,991 -1,757
Taxes -
Net Income -8,770 -2,466
Net assets 437 6,405
% of ownership 50 % 50 %
Goodwill (incl. Currency impact) 2,004 2,029
Carrying amount of the Goup's interest 2,222 5,231
No dividend had been distributed in 2015 & 2016.
ªe Indian market is still challenging but even if the man-agement is confident with the strategy, the company took measures to reduce the overheads and so to decrease the losses.
42. MINORITY SHARES AND JOINT-VENTURES
A/ Information about material joint-ventures
At 31 December 2016 financial statements of Hamon include two material joint-ventures:
• Hamon Shriram Cottrell PVT Ltd owned at 50% by the Group in 2016 & 2015.
• Esindus SA acquired in 2015 and owned at 39%.
Hereunder the IFRS financial statements of the joint-ven-tures:
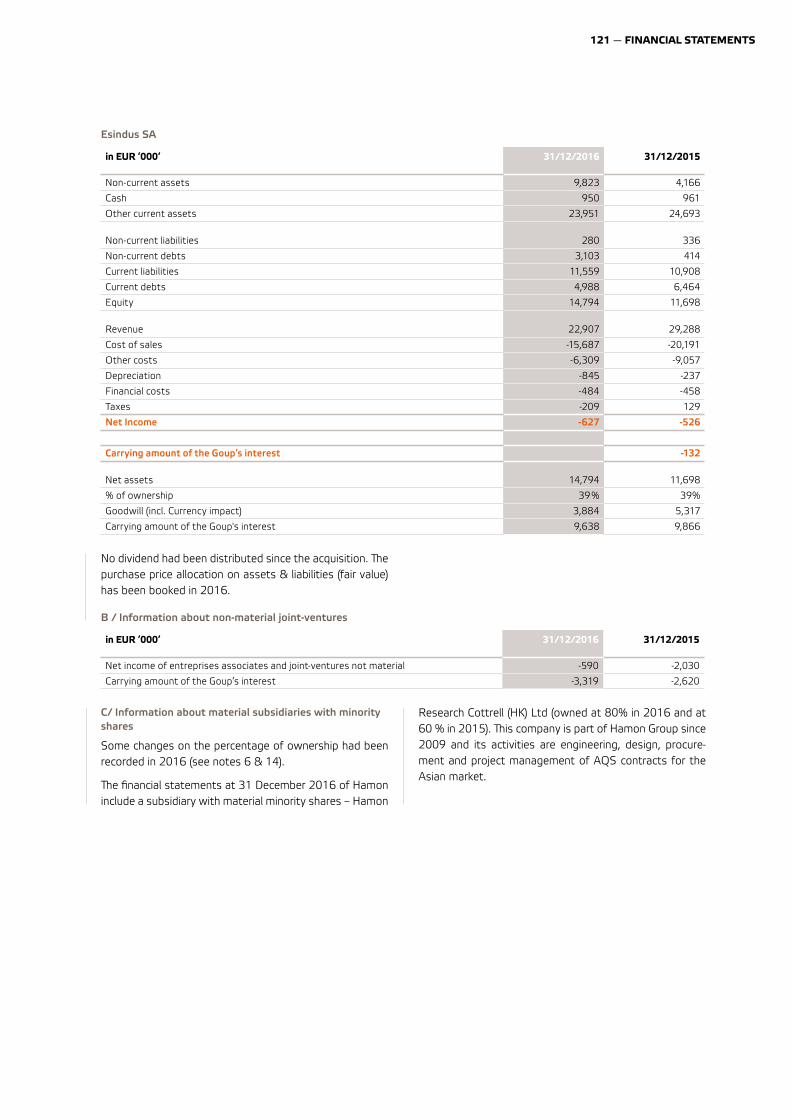
121 — FINANCIAL STATEMENTS
C/ Information about material subsidiaries with minority shares
Some changes on the percentage of ownership had been recorded in 2016 (see notes 6 & 14).
ªe financial statements at 31 December 2016 of Hamon include a subsidiary with material minority shares – Hamon
Research Cottrell (HK) Ltd (owned at 80% in 2016 and at 60 % in 2015). ªis company is part of Hamon Group since 2009 and its activities are engineering, design, procure-ment and project management of AQS contracts for the Asian market.
Esindus SA
in EUR ‘000‘ 31/12/2016 31/12/2015
Non-current assets 9,823 4,166
Cash 950 961
Other current assets 23,951 24,693
Non-current liabilities 280 336
Non-current debts 3,103 414
Current liabilities 11,559 10,908
Current debts 4,988 6,464
Equity 14,794 11,698
Revenue 22,907 29,288
Cost of sales -15,687 -20,191
Other costs -6,309 -9,057
Depreciation -845 -237
Financial costs -484 -458
Taxes -209 129
Net Income -627 -526
Carrying amount of the Goup’s interest -132
Net assets 14,794 11,698
% of ownership 39 % 39%
Goodwill (incl. Currency impact) 3,884 5,317
Carrying amount of the Goup's interest 9,638 9,866
No dividend had been distributed since the acquisition. ªe purchase price allocation on assets & liabilities (fair value) has been booked in 2016.
B / Information about non-material joint-ventures
in EUR ‘000‘ 31/12/2016 31/12/2015
Net income of entreprises associates and joint-ventures not material -590 -2,030
Carrying amount of the Goup’s interest -3,319 -2,620
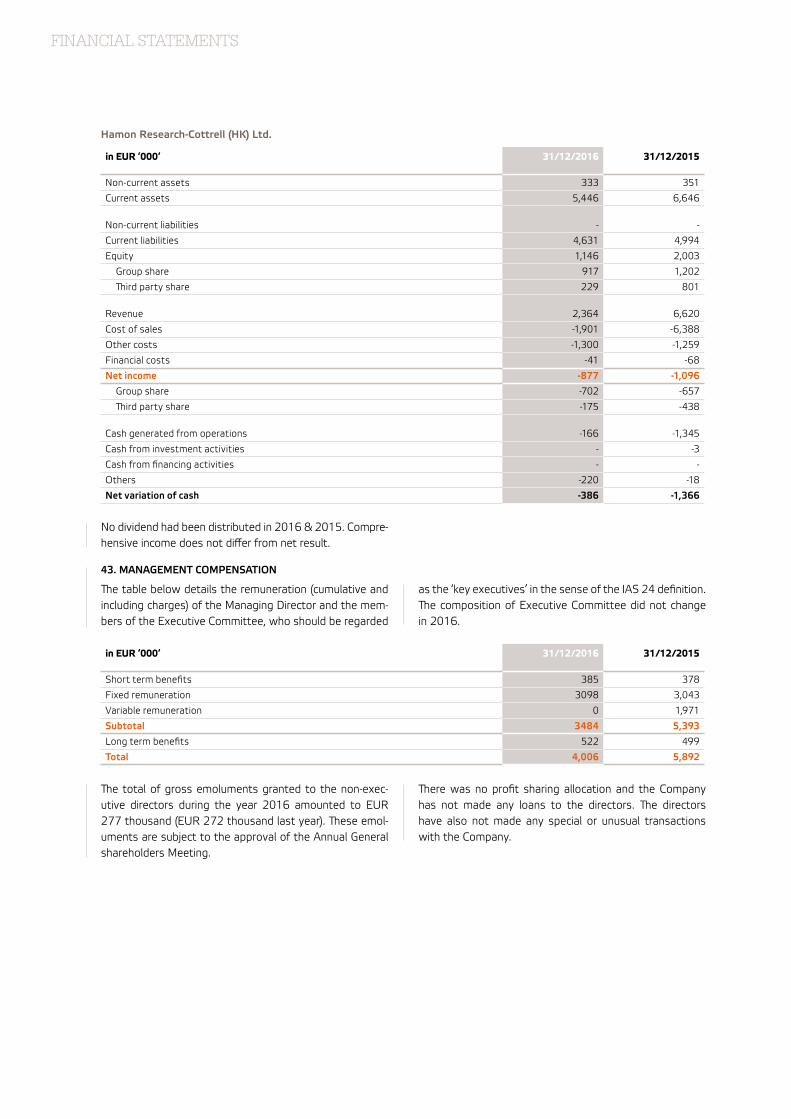
FINANCIAL STATEMENTS
Hamon Research-Cottrell (HK) Ltd.
in EUR ‘000‘ 31/12/2016 31/12/2015
Non-current assets 333 351
Current assets 5,446 6,646
Non-current liabilities - -
Current liabilities 4,631 4,994
Equity 1,146 2,003
Group share 917 1,202
ªird party share 229 801
Revenue 2,364 6,620
Cost of sales -1,901 -6,388
Other costs -1,300 -1,259
Financial costs -41 -68
Net income -877 -1,096
Group share -702 -657
ªird party share -175 -438
Cash generated from operations -166 -1,345
Cash from investment activities - -3
Cash from financing activities - -
Others -220 -18
Net variation of cash -386 -1,366
43. MANAGEMENT COMPENSATION
ªe table below details the remuneration (cumulative and including charges) of the Managing Director and the mem-bers of the Executive Committee, who should be regarded
as the ‘key executives’ in the sense of the IAS 24 definition.ªe composition of Executive Committee did not change in 2016.
in EUR ‘000‘ 31/12/2016 31/12/2015
Short term benefits 385 378
Fixed remuneration 3098 3,043
Variable remuneration 0 1,971
Subtotal 3484 5,393
Long term benefits 522 499
Total 4,006 5,892
ªe total of gross emoluments granted to the non-exec-utive directors during the year 2016 amounted to EUR 277 thousand (EUR 272 thousand last year). ªese emol-uments are subject to the approval of the Annual General shareholders Meeting.
ªere was no profit sharing allocation and the Company has not made any loans to the directors. ªe directors have also not made any special or unusual transactions with the Company.
No dividend had been distributed in 2016 & 2015. Compre-hensive income does not differ from net result.
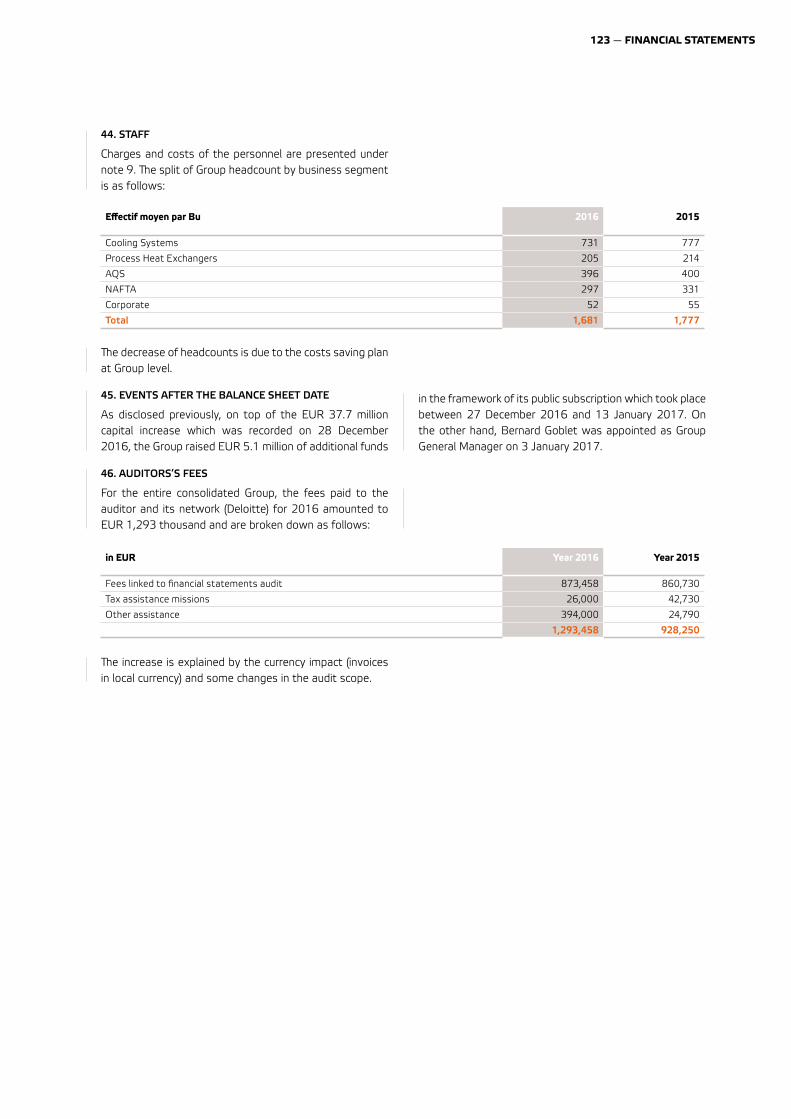
123 — FINANCIAL STATEMENTS
44. STAFF
Charges and costs of the personnel are presented under note 9. ªe split of Group headcount by business segment is as follows:
Effectif moyen par Bu 2016 2015
Cooling Systems 731 777
Process Heat Exchangers 205 214
AQS 396 400
NAFTA 297 331
Corporate 52 55
Total 1,681 1,777
ªe decrease of headcounts is due to the costs saving plan at Group level.
45. EVENTS AFTER THE BALANCE SHEET DATE
As disclosed previously, on top of the EUR 37.7 million capital increase which was recorded on 28 December 2016, the Group raised EUR 5.1 million of additional funds
46. AUDITORS’S FEES
For the entire consolidated Group, the fees paid to the auditor and its network (Deloitte) for 2016 amounted to EUR 1,293 thousand and are broken down as follows:
in EUR Year 2016 Year 2015
Fees linked to financial statements audit 873,458 860,730
Tax assistance missions 26,000 42,730
Other assistance 394,000 24,790
1,293,458 928,250
ªe increase is explained by the currency impact (invoices in local currency) and some changes in the audit scope.
in the framework of its public subscription which took place between 27 December 2016 and 13 January 2017. On the other hand, Bernard Goblet was appointed as Group General Manager on 3 January 2017.
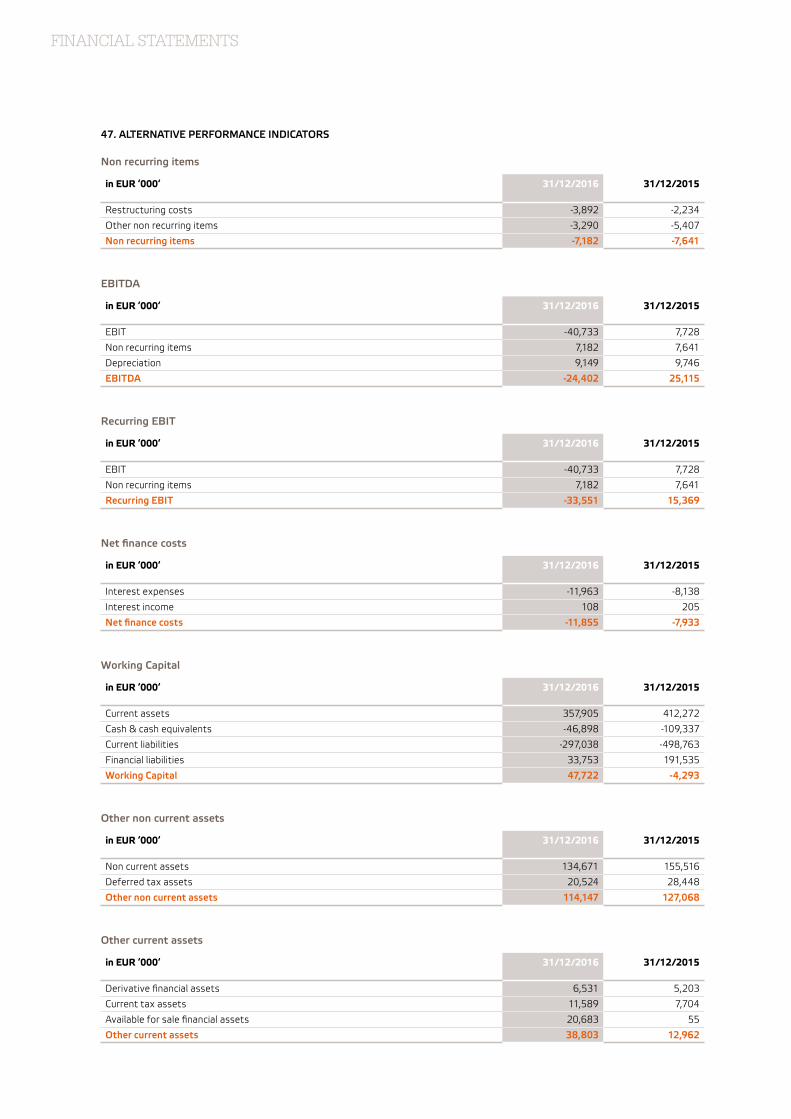
FINANCIAL STATEMENTS
Non recurring items
in EUR ‘000‘ 31/12/2016 31/12/2015
Restructuring costs -3,892 -2,234
Other non recurring items -3,290 -5,407
Non recurring items -7,182 -7,641
EBITDA
in EUR ‘000‘ 31/12/2016 31/12/2015
EBIT -40,733 7,728
Non recurring items 7,182 7,641
Depreciation 9,149 9,746
EBITDA -24,402 25,115
Recurring EBIT
in EUR ‘000‘ 31/12/2016 31/12/2015
EBIT -40,733 7,728
Non recurring items 7,182 7,641
Recurring EBIT -33,551 15,369
Net finance costs
in EUR ‘000‘ 31/12/2016 31/12/2015
Interest expenses -11,963 -8,138
Interest income 108 205
Net finance costs -11,855 -7,933
Working Capital
in EUR ‘000‘ 31/12/2016 31/12/2015
Current assets 357,905 412,272
Cash & cash equivalents -46,898 -109,337
Current liabilities -297,038 -498,763
Financial liabilities 33,753 191,535
Working Capital 47,722 -4,293
Other non current assets
in EUR ‘000‘ 31/12/2016 31/12/2015
Non current assets 134,671 155,516
Deferred tax assets 20,524 28,448
Other non current assets 114,147 127,068
Other current assets
in EUR ‘000‘ 31/12/2016 31/12/2015
Derivative financial assets 6,531 5,203
Current tax assets 11,589 7,704
Available for sale financial assets 20,683 55
Other current assets 38,803 12,962
47. ALTERNATIVE PERFORMANCE INDICATORS
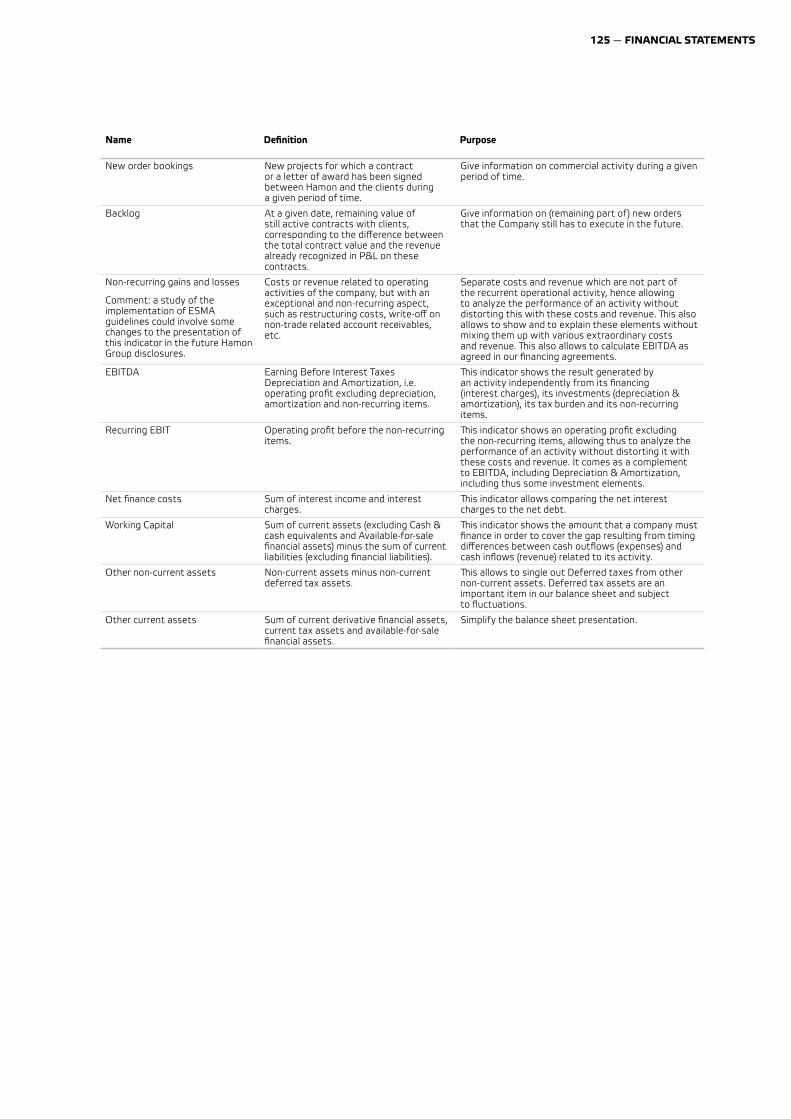
125 — FINANCIAL STATEMENTS
Name Definition Purpose
New order bookings New projects for which a contract or a letter of award has been signed between Hamon and the clients during a given period of time.
Give information on commercial activity during a given period of time.
Backlog At a given date, remaining value of still active contracts with clients, corresponding to the difference between the total contract value and the revenue already recognized in P&L on these contracts.
Give information on (remaining part of ) new orders that the Company still has to execute in the future.
Non-recurring gains and losses
Comment: a study of the implementation of ESMA guidelines could involve some changes to the presentation of this indicator in the future Hamon Group disclosures.
Costs or revenue related to operating activities of the company, but with an exceptional and non-recurring aspect, such as restructuring costs, write-off on non-trade related account receivables, etc.
Separate costs and revenue which are not part of the recurrent operational activity, hence allowing to analyze the performance of an activity without distorting this with these costs and revenue. ªis also allows to show and to explain these elements without mixing them up with various extraordinary costs and revenue. ªis also allows to calculate EBITDA as agreed in our financing agreements.
EBITDA Earning Before Interest Taxes Depreciation and Amortization, i.e. operating profit excluding depreciation, amortization and non-recurring items.
ªis indicator shows the result generated by an activity independently from its financing (interest charges), its investments (depreciation & amortization), its tax burden and its non-recurring items.
Recurring EBIT Operating profit before the non-recurring items.
ªis indicator shows an operating profit excluding the non-recurring items, allowing thus to analyze the performance of an activity without distorting it with these costs and revenue. It comes as a complement to EBITDA, including Depreciation & Amortization, including thus some investment elements.
Net finance costs Sum of interest income and interest charges.
ªis indicator allows comparing the net interest charges to the net debt.
Working Capital Sum of current assets (excluding Cash & cash equivalents and Available-for-sale financial assets) minus the sum of current liabilities (excluding financial liabilities).
ªis indicator shows the amount that a company must finance in order to cover the gap resulting from timing differences between cash outflows (expenses) and cash inflows (revenue) related to its activity.
Other non-current assets Non-current assets minus non-current deferred tax assets.
ªis allows to single out Deferred taxes from other non-current assets. Deferred tax assets are an important item in our balance sheet and subject to fluctuations.
Other current assets Sum of current derivative financial assets, current tax assets and available-for-sale financial assets.
Simplify the balance sheet presentation.
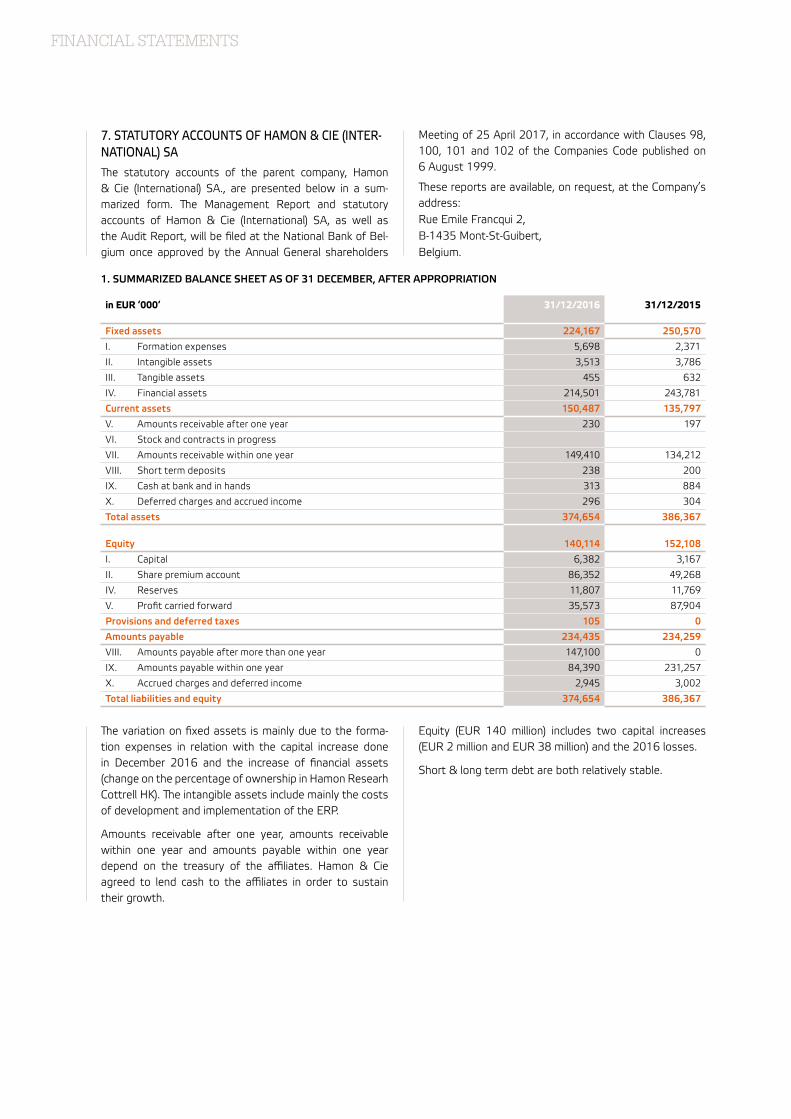
FINANCIAL STATEMENTS
7. STATUTORY ACCOUNTS OF HAMON & CIE (INTER-NATIONAL) SAªe statutory accounts of the parent company, Hamon & Cie (International) SA., are presented below in a sum-marized form. ªe Management Report and statutory accounts of Hamon & Cie (International) SA, as well as the Audit Report, will be filed at the National Bank of Bel-gium once approved by the Annual General shareholders
Meeting of 25 April 2017, in accordance with Clauses 98, 100, 101 and 102 of the Companies Code published on 6 August 1999.
ªese reports are available, on request, at the Company’s address:Rue Emile Francqui 2,B-1435 Mont-St-Guibert,Belgium.
1. SUMMARIZED BALANCE SHEET AS OF 31 DECEMBER, AFTER APPROPRIATION
in EUR ‘000‘ 31/12/2016 31/12/2015
Fixed assets 224,167 250,570
I. Formation expenses 5,698 2,371
II. Intangible assets 3,513 3,786
III. Tangible assets 455 632
IV. Financial assets 214,501 243,781
Current assets 150,487 135,797
V. Amounts receivable after one year 230 197
VI. Stock and contracts in progress
VII. Amounts receivable within one year 149,410 134,212
VIII. Short term deposits 238 200
IX. Cash at bank and in hands 313 884
X. Deferred charges and accrued income 296 304
Total assets 374,654 386,367
Equity 140,114 152,108
I. Capital 6,382 3,167
II. Share premium account 86,352 49,268
IV. Reserves 11,807 11,769
V. Profit carried forward 35,573 87,904
Provisions and deferred taxes 105 0
Amounts payable 234,435 234,259
VIII. Amounts payable after more than one year 147,100 0
IX. Amounts payable within one year 84,390 231,257
X. Accrued charges and deferred income 2,945 3,002
Total liabilities and equity 374,654 386,367
ªe variation on fixed assets is mainly due to the forma-tion expenses in relation with the capital increase done in December 2016 and the increase of financial assets (change on the percentage of ownership in Hamon Researh Cottrell HK). ªe intangible assets include mainly the costs of development and implementation of the ERP.
Amounts receivable after one year, amounts receivable within one year and amounts payable within one year depend on the treasury of the affiliates. Hamon & Cie agreed to lend cash to the affiliates in order to sustain their growth.
Equity (EUR 140 million) includes two capital increases (EUR 2 million and EUR 38 million) and the 2016 losses.
Short & long term debt are both relatively stable.
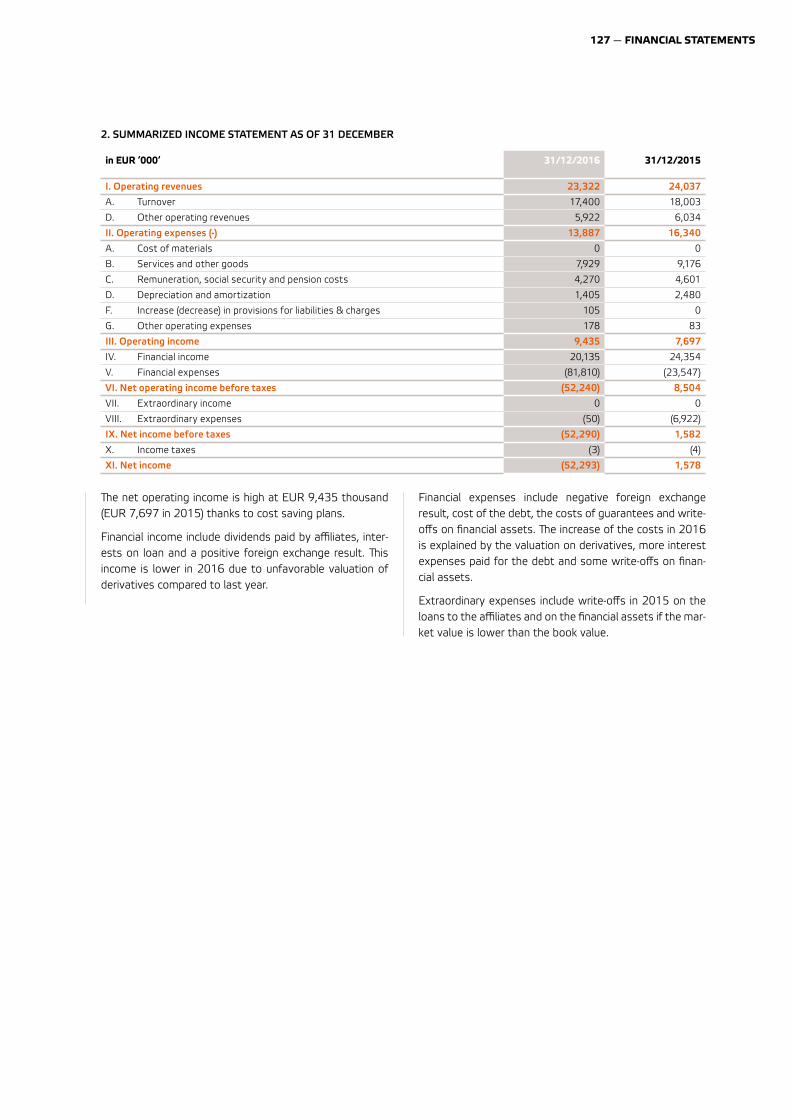
127 — FINANCIAL STATEMENTS
2. SUMMARIZED INCOME STATEMENT AS OF 31 DECEMBER
in EUR ‘000‘ 31/12/2016 31/12/2015
I. Operating revenues 23,322 24,037
A. Turnover 17,400 18,003
D. Other operating revenues 5,922 6,034
II. Operating expenses (-) 13,887 16,340
A. Cost of materials 0 0
B. Services and other goods 7,929 9,176
C. Remuneration, social security and pension costs 4,270 4,601
D. Depreciation and amortization 1,405 2,480
F. Increase (decrease) in provisions for liabilities & charges 105 0
G. Other operating expenses 178 83
III. Operating income 9,435 7,697
IV. Financial income 20,135 24,354
V. Financial expenses (81,810) (23,547)
VI. Net operating income before taxes (52,240) 8,504
VII. Extraordinary income 0 0
VIII. Extraordinary expenses (50) (6,922)
IX. Net income before taxes (52,290) 1,582
X. Income taxes (3) (4)
XI. Net income (52,293) 1,578
ªe net operating income is high at EUR 9,435 thousand (EUR 7,697 in 2015) thanks to cost saving plans.
Financial income include dividends paid by affiliates, inter-ests on loan and a positive foreign exchange result. ªis income is lower in 2016 due to unfavorable valuation of derivatives compared to last year.
Financial expenses include negative foreign exchange result, cost of the debt, the costs of guarantees and write-offs on financial assets. ªe increase of the costs in 2016 is explained by the valuation on derivatives, more interest expenses paid for the debt and some write-offs on finan-cial assets.
Extraordinary expenses include write-offs in 2015 on the loans to the affiliates and on the financial assets if the mar-ket value is lower than the book value.
129 — FINANCIAL STATEMENTS
131 — FINANCIAL STATEMENTS
ANNEXES
ANNEXES
PARAMETERS OF THE CORPORATE SOCIAL RESPONSIBILITYREPORT
For several years, our annual report has included a Cor-porate Social Responsibility chapter, based on the Global Reporting Initiative (GRI) guidelines. Since 2014, it has been based on the GRI ‘G4’ guidelines.
°is section explains the basis on which this chapter has been drafted.
RELEVANT ASPECTS IDENTIFIED AND STAKEHOLDER INVOLVEMENT
ªe relevant aspects and stakeholder involvement were identified late 2013-early 2014 (no change compared with the previous financial year).
Hamon first identified an initial list of aspects which see-med relevant to its business activities. ªese aspects cove-red environmental, economic and social fields. ªeir scope was also examined (within and/or outside the Group).
We then prioritized these aspects based on the principles of relevance. ªis enabled us to establish a materiality matrix chart of the various aspects, according to their importance for Hamon and their importance for its main stakeholders.
ªe third stage involved selecting the stakeholders to involve in the process. ªis was carried out specifically for the preparation of the 2014 annual report. As Hamon is present in 25 countries, we focused, for this first year, on the two countries in which Hamon first started its business: France and Belgium. It was not physically pos-sible to involve all our stakeholders in all the countries in which we are present.
We then identified our main stakeholders in these two countries. ªese were:
• Staff representatives and employees at our main French and Belgian subsidiaries.
• Regular customers of these French and Belgian subsi-diaries, both end users of our products and engineering contractors.
• Suppliers of these subsidiaries. Here again, we selected large suppliers with whom we work regularly.
ªe next step involved the validation by our stakehol-ders of our materiality matrix chart, containing the rele-vant aspects chosen and their scope. ªese discussions were held during two plenary meetings, one with all the staff representatives involved and the other with the suppliers. For the customers, discussions were held on a customer-by-customer basis (face-to-face or via telephone conference). Each stakeholder brought up certain new topics or concerns, but none of them were among the most relevant aspects, with the exception of the ‘human rights’ aspect for the staff representatives. Hamon decided to keep this aspect (on a general basis) in its report because it is also one of the four major chapters that must be covered for the United Nations Global Compact’s Communication on Progress (COP). For the same reason, the fight against corruption also figures among the aspects included.
Lastly, the findings of this work were presented to the Group’s Executive Committee in June 2014. Major deci-sions had to be made as to whether or not to involve certain external stakeholders (customers) when repor-ting on certain aspects and topics that are very specific to our business. For reasons of practicality and confiden-tiality with regard to our competitors, it was decided not to involve our customers when transmitting information required to establish certain specific economic perfor-mance indicators.
In order to apply the entire process rigorously and neu-trally, Hamon was assisted by a consultant specialized in non-financial reporting.
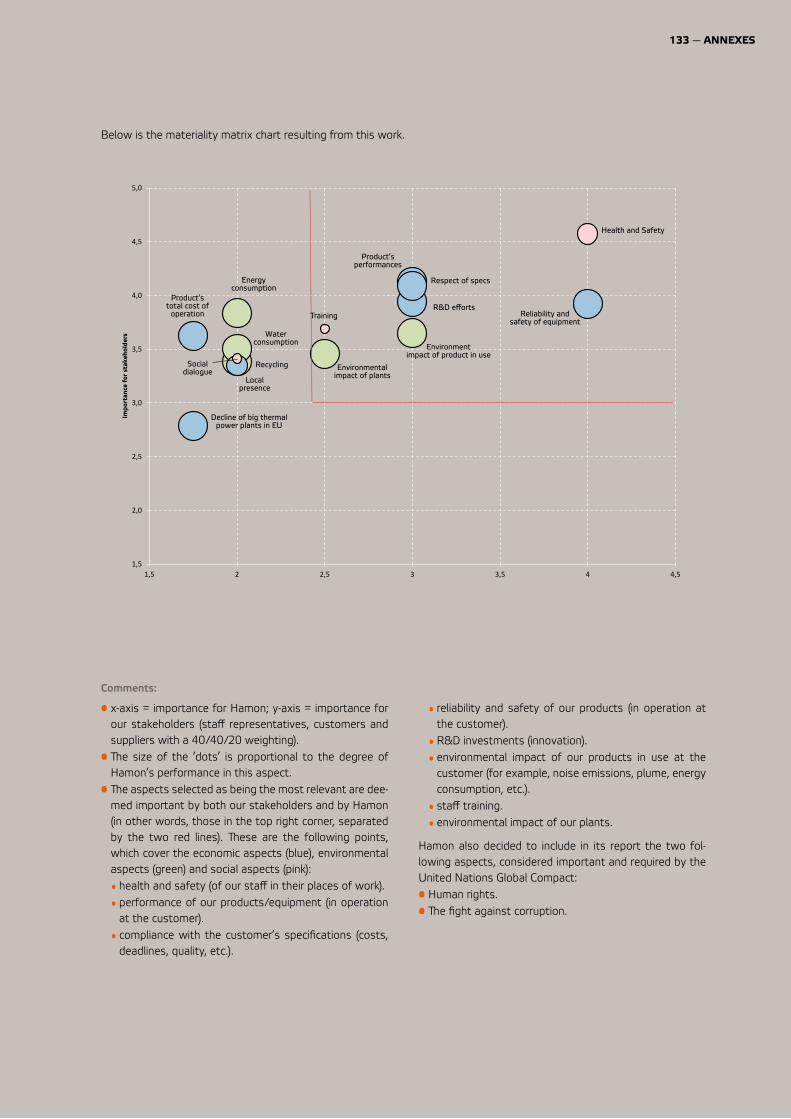
133 — ANNEXES
Below is the materiality matrix chart resulting from this work.
Comments:
• x-axis = importance for Hamon; y-axis = importance for our stakeholders (staff representatives, customers and suppliers with a 40/40/20 weighting).
• ªe size of the ‘dots’ is proportional to the degree of Hamon’s performance in this aspect.
• ªe aspects selected as being the most relevant are dee-med important by both our stakeholders and by Hamon (in other words, those in the top right corner, separated by the two red lines). ªese are the following points, which cover the economic aspects (blue), environmental aspects (green) and social aspects (pink):
• health and safety (of our staff in their places of work). • performance of our products/equipment (in operation
at the customer). • compliance with the customer’s specifications (costs,
deadlines, quality, etc.).
• reliability and safety of our products (in operation at the customer).
• R&D investments (innovation). • environmental impact of our products in use at the
customer (for example, noise emissions, plume, energy consumption, etc.).
• staff training. • environmental impact of our plants.
Hamon also decided to include in its report the two fol-lowing aspects, considered important and required by the United Nations Global Compact:• Human rights.• ªe fight against corruption.
1,5
2,0
2,5
3,0
3,5
4,0
4,5
5,0
1,5 2 2,5 3 3,5 4 4,5
Energy consumption
Water consumption
Impo
rtan
ce f
or s
take
hold
ers
Training
Decline of big thermal power plants in EU
Environmental impact of plants
Product’s performances
Reliability and safety of equipment
Health and Safety
Respect of specs
R&D efforts
Environment impact of product in use
Social dialogue
Local presence
Recycling
Product’s total cost of
operation
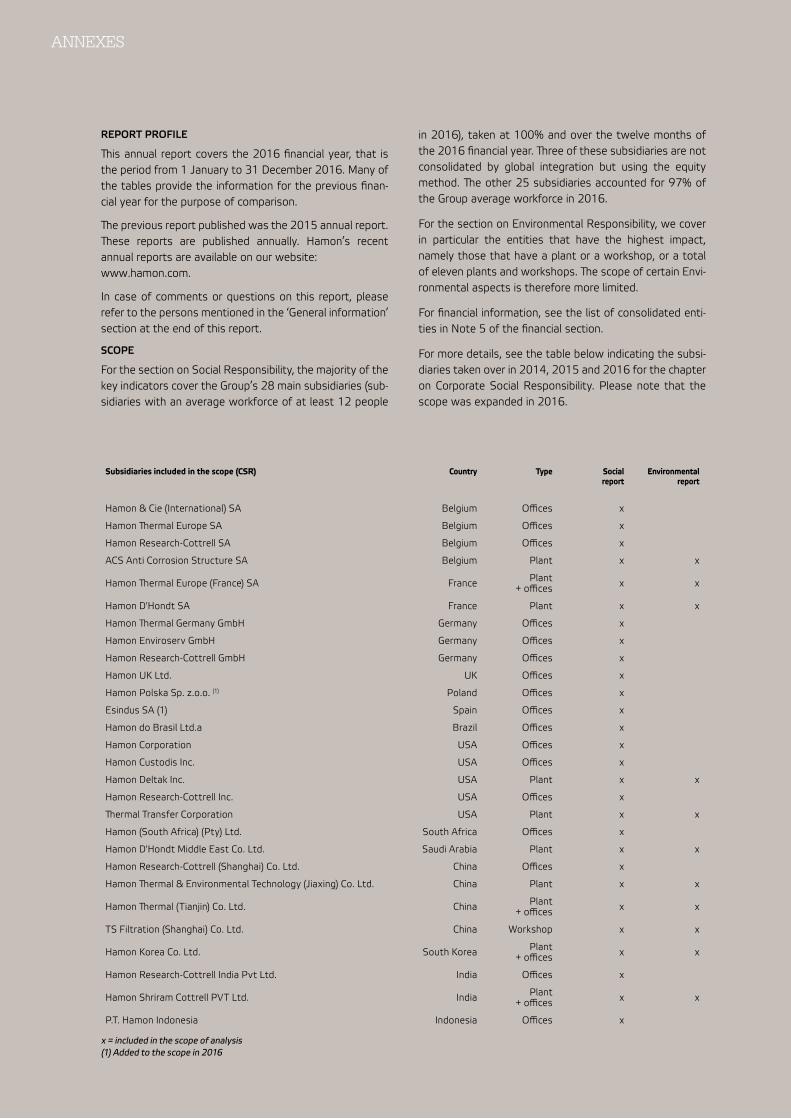
ANNEXES
REPORT PROFILE
ªis annual report covers the 2016 financial year, that is the period from 1 January to 31 December 2016. Many of the tables provide the information for the previous finan-cial year for the purpose of comparison.
ªe previous report published was the 2015 annual report. ªese reports are published annually. Hamon’s recent annual reports are available on our website: www.hamon.com.
In case of comments or questions on this report, please refer to the persons mentioned in the ‘General information’ section at the end of this report.
SCOPE
For the section on Social Responsibility, the majority of the key indicators cover the Group’s 28 main subsidiaries (sub-sidiaries with an average workforce of at least 12 people
in 2016), taken at 100% and over the twelve months of the 2016 financial year. ªree of these subsidiaries are not consolidated by global integration but using the equity method. ªe other 25 subsidiaries accounted for 97% of the Group average workforce in 2016.
For the section on Environmental Responsibility, we cover in particular the entities that have the highest impact, namely those that have a plant or a workshop, or a total of eleven plants and workshops. ªe scope of certain Envi-ronmental aspects is therefore more limited.
For financial information, see the list of consolidated enti-ties in Note 5 of the financial section.
For more details, see the table below indicating the subsi-diaries taken over in 2014, 2015 and 2016 for the chapter on Corporate Social Responsibility. Please note that the scope was expanded in 2016.
Subsidiaries included in the scope (CSR) Country Type Social report
Environmental report
Hamon & Cie (International) SA Belgium Offices x
Hamon ªermal Europe SA Belgium Offices x
Hamon Research-Cottrell SA Belgium Offices x
ACS Anti Corrosion Structure SA Belgium Plant x x
Hamon ªermal Europe (France) SA France Plant + offices x x
Hamon D'Hondt SA France Plant x x
Hamon ªermal Germany GmbH Germany Offices x
Hamon Enviroserv GmbH Germany Offices x
Hamon Research-Cottrell GmbH Germany Offices x
Hamon UK Ltd. UK Offices x
Hamon Polska Sp. z.o.o. (1) Poland Offices x
Esindus SA (1) Spain Offices x
Hamon do Brasil Ltd.a Brazil Offices x
Hamon Corporation USA Offices x
Hamon Custodis Inc. USA Offices x
Hamon Deltak Inc. USA Plant x x
Hamon Research-Cottrell Inc. USA Offices x
ªermal Transfer Corporation USA Plant x x
Hamon (South Africa) (Pty) Ltd. South Africa Offices x
Hamon D'Hondt Middle East Co. Ltd. Saudi Arabia Plant x x
Hamon Research-Cottrell (Shanghai) Co. Ltd. China Offices x
Hamon ªermal & Environmental Technology (Jiaxing) Co. Ltd. China Plant x x
Hamon ªermal (Tianjin) Co. Ltd. China Plant + offices x x
TS Filtration (Shanghai) Co. Ltd. China Workshop x x
Hamon Korea Co. Ltd. South Korea Plant + offices x x
Hamon Research-Cottrell India Pvt Ltd. India Offices x
Hamon Shriram Cottrell PVT Ltd. India Plant + offices x x
P.T. Hamon Indonesia Indonesia Offices x
x = included in the scope of analysis (1) Added to the scope in 2016
135 — ANNEXES
ªe following entities are consolidated in our financial statements by global integration, but not included in the non-financial reporting scope, because they are not signi-ficant (sleeping entities, holding companies, entities with very few if any staff, subsidiary created in the fourth quar-ter of 2016).
Company Country
Compagnie Financière Hamon S.A. France
Hamon Research-Cottrell S.A.R.L. France
Hacom Energiesparsysteme GmbH Germany
Hamon Dormant Co. Ltd UK
Hamon (Nederland) B.V. Netherlands
Hamon Esindus Latinoamerica SL Spain
Hamon ETP LLC Russia
Hamon Research-Cottrell do Brazil Brazil
Hamon Custodis Cottrell (Canada) Inc. Canada
Hamon Esindus Latinoamerica Limitada Chile
Hamon Esindus Latinoamerica SA de CV Mexico
Research-Cottrell Cooling Inc. USA
Hamon Holdings Corporation USA
Hamon Australia (Pty) Ltd. Australia
Hamon Trading (Jiaxing) Co.,Ltd. China
Hamon Asia-Pacific Ltd China (Hong Kong)
Hamon Research-Cottrell (HK) Ltd. China (Hong Kong)
Hamon India PVT Ltd. India
Hamon Korea Youngnam Ltd. South Korea
Hamon Malaysia SDN. BHD. Malaysia
Hamon - B.Grimm Ltd. ªailand
Hamon Termal ve Çevre Sistemleri Sanayi ve Ticaret A.Ş. Turkey
CHANGES TO THE SCOPE OF THE REPORT
ªe scope used in 2016 for this non-financial report differs from that used in 2014 and 2015. It now includes the 28 main companies in the Group – see table above. Two sub-sidiaries have been added:• Esindus SA in Spain (although consolidated using the
equity method) following the acquisition by Hamon of 39% of the capital in this company in October 2015.
• Hamon Polska Sp. Z.o.o., which has developed strongly over the past few years.
SELECTION OF THE CONTENT OF THIS REPORT
ªe content of this report is based on:• ªe requirements of the Global Reporting Initiative (GRI),
G4 guidelines, reporting ‘In accordance’, using the ‘core criteria’.
• ªe requirements of the United Nations Global Compact, for the Communication On Progress (COP), level ‘GC active’.
• Relevance: information which is not relevant for our stakeholders or which does not have a significant impact on the Group is not included.
• ªe stakeholders to whom the report is addressed and their expectations, that is our customers, staff (current employees or applicants), suppliers, shareholders, banks, financial analysts.
• For financial information: legal requirements regarding financial information (IAS / IFRS standards), reviewed by our auditors.
ªe report also aims to present the information as clearly and transparently as possible.
INFORMATION ON THE KEY PERFORMANCE INDICATORS
Some social indicators require detailed explanations. ªe references are those of the GRI – G4 (general standard disclosures and specific standard disclosures):
TOTAL WORKFORCE BY REGION, BU AND GENDER (GRI REF. : G4-10)
As noted in the Corporate Social Responsibility section, these figures are based on:• ªe workforce of companies consolidated by global inte-
gration.• ªe number of people (not full-time equivalents); this
includes only staff on open-ended or long-term contracts. Given our extensive activities on worksites, the number of employees on short-term contracts constantly varies. In some cases, we use external temporary recruitment agencies.
• ªe average figures at the start and end of each quarter.
RATE OF FREQUENCY OF OCCUPATIONAL ACCIDENTS BY REGION (NUMBER OF ACCIDENTS / MILLION WORKING HOURS) (GRI REF. : G4-LA6)
ªe rate of frequency is the ratio between:• ªe number of occupational accidents having caused
the loss of at least one working day (fatal and non-fatal, including on the way to work).
• ªe number of effective hours of work (in million).
DEGREE OF SEVERITY OF OCCUPATIONAL ACCIDENTS BY REGION (NUMBER OF DAYS LOST / THOUSAND WORKING HOURS) (GRI REF. : G4-LA6)
ªe degree of severity is the ratio between:• ªe number of working days lost because of an occupa-
tional accident.• ªe number of effective hours of work (in thousands).
ªe number of days lost are working days (not calendar days). ªe starting point for the calculation is the day of the occupational accident or disease.
RATE OF OCCUPATIONAL DISEASES BY REGION (NUMBER OF DAYS LOST / THOUSAND WORKING HOURS) (GRI REF. : G4-LA6)
ªe rate is the ratio between:• ªe number of working days lost due to occupational
diseases (depression, inhaling of toxic gases, etc.).• ªe number of effective hours of work (in thousands).
ANNEXES
PROPORTION OF WORKING DAYS LOST BECAUSE OF OCCUPATIONAL ACCIDENTS OR DISEASES BY REGION (NUMBER OF DAYS LOST / NUMBER OF THEORETICAL WORKING DAYS) (GRI REF. : G4-LA6)
ªe rate is the ratio between:• ªe number of working days lost due to occupational
accidents and diseases.• ªe number of theoretical working days, excluding statu-
tory leave and holidays.
RATE OF ABSENTEEISM (GRI REF. : G4-LA6)
ªis rate is the ratio between:• ªe number of working days lost due to occupational
accidents, occupational diseases and other illnesses (flu, etc.) or unexplained absences; maternity leave and planned leave such as holiday and statutory leave are not included. For the U.S. subsidiaries (and certain Asian subsidiaries until 2014), the days of absenteeism are not recorded as they are included in an annual quota for leave (and days’ absence owing to illness).
• ªe theoretical number of working days, excluding statu-tory leave and holidays.
ªe other key indicators are more usual; a brief definition only is therefore given below:
a) Economic indicators
• Direct economic value created and distributed (GRI ref. : G4-EC1): this includes the turnover, the gross margin, labour costs, financial charges paid to banks, taxes paid, dividends paid out to shareholders, profits carried over, donations.
• Research & Development expenditure (not an element specifically defined by GRI): this is the ratio between the R&D expenditure (both capitalized and booked in the in the income statement) and revenue.
b) Environmental indicators
• Energy consumption within the organization (GRI ref. : G4-EN3). ªe following conversion factors are used:
• Conversion of MWh into MJ: 1 kWh = 3.6 MJ • Conversion of Nm³ of natural gas into MJ: 1 Nm³ =
39.01 MJ • Conversion of litres of fuel into MJ: 1 l = 35.94 MJ • Conversion kg of propane and LPG into MJ: 1 kg =
50 MJ• Total volume of water withdrawn, by source (GRI ref. :
G4-EN8).• Measures to reduce the environmental impact of pro-
ducts and services (GRI ref. : G4-EN27).
c) Other social indicators
• Average number of hours of training per year (GRI ref. : G4-LA9).
• Human rights – operations and suppliers identified as presenting a significant risk for accidents linked to child labour and the measures taken (GRI ref. : G4-HR5).
• Human rights – operations and suppliers identified as presenting a significant risk for accidents relating to forced or compulsory labour and the measures taken (GRI ref. : G4-HR6).
• Human rights – number of grievances about on human rights impacts filed, addressed and resolved through for-mal grievance mechanisms (GRI ref. : G4-HR12).
• Fight against corruption – communication and training on anti-corruption policies and procedures (GRI ref. : G4-SO4).
ªe GRI correspondence grid below shows where to find each of these key performance indicators as well as the general standard disclosures in the annual report.
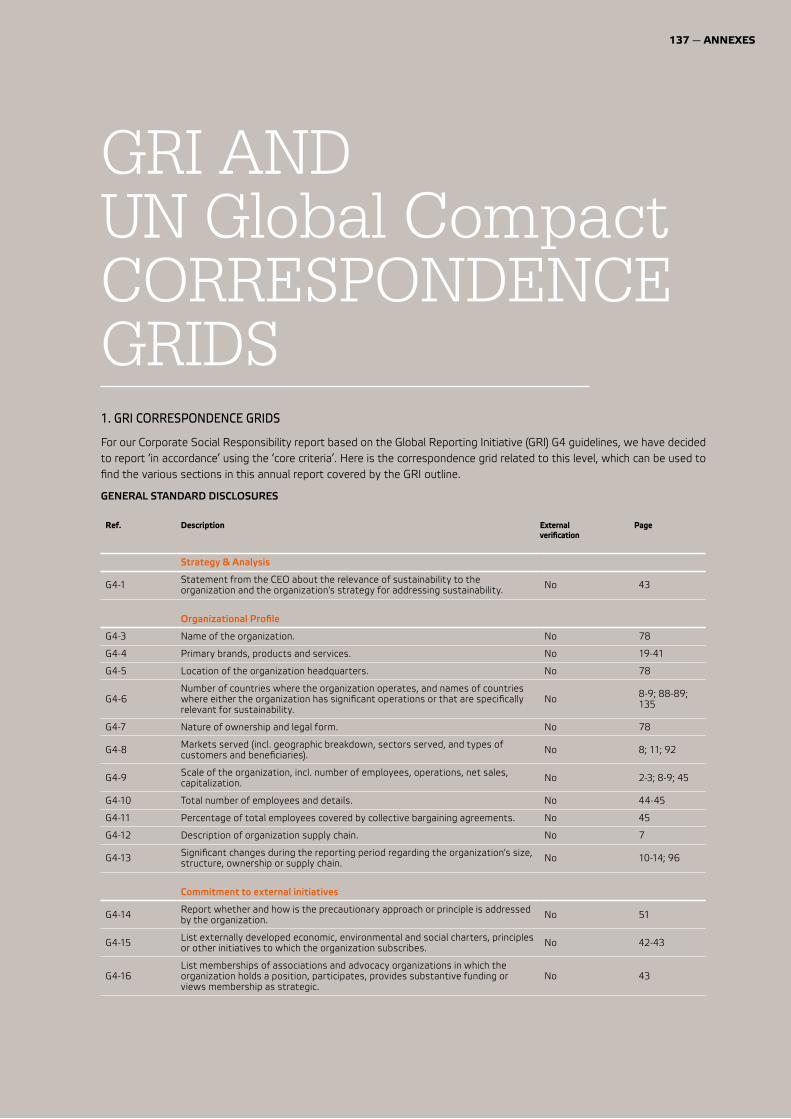
137 — ANNEXES
GRI ANDUN Global CompactCOR RE SPOND ENCE GRIDS1. GRI CORRESPONDENCE GRIDS
For our Corporate Social Responsibility report based on the Global Reporting Initiative (GRI) G4 guidelines, we have decided to report ‘in accordance’ using the ‘core criteria’. Here is the correspondence grid related to this level, which can be used to find the various sections in this annual report covered by the GRI outline.
GENERAL STANDARD DISCLOSURES
Ref. Description External verification
Page
Strategy & Analysis
G4-1 Statement from the CEO about the relevance of sustainability to the organization and the organization's strategy for addressing sustainability. No 43
Organizational Profile
G4-3 Name of the organization. No 78
G4-4 Primary brands, products and services. No 19-41
G4-5 Location of the organization headquarters. No 78
G4-6Number of countries where the organization operates, and names of countries where either the organization has significant operations or that are specifically relevant for sustainability.
No 8-9; 88-89; 135
G4-7 Nature of ownership and legal form. No 78
G4-8 Markets served (incl. geographic breakdown, sectors served, and types of customers and beneficiaries). No 8; 11; 92
G4-9 Scale of the organization, incl. number of employees, operations, net sales, capitalization. No 2-3; 8-9; 45
G4-10 Total number of employees and details. No 44-45
G4-11 Percentage of total employees covered by collective bargaining agreements. No 45
G4-12 Description of organization supply chain. No 7
G4-13 Significant changes during the reporting period regarding the organization's size, structure, ownership or supply chain. No 10-14; 96
Commitment to external initiatives
G4-14 Report whether and how is the precautionary approach or principle is addressed by the organization. No 51
G4-15 List externally developed economic, environmental and social charters, principles or other initiatives to which the organization subscribes. No 42-43
G4-16List memberships of associations and advocacy organizations in which the organization holds a position, participates, provides substantive funding or views membership as strategic.
No 43
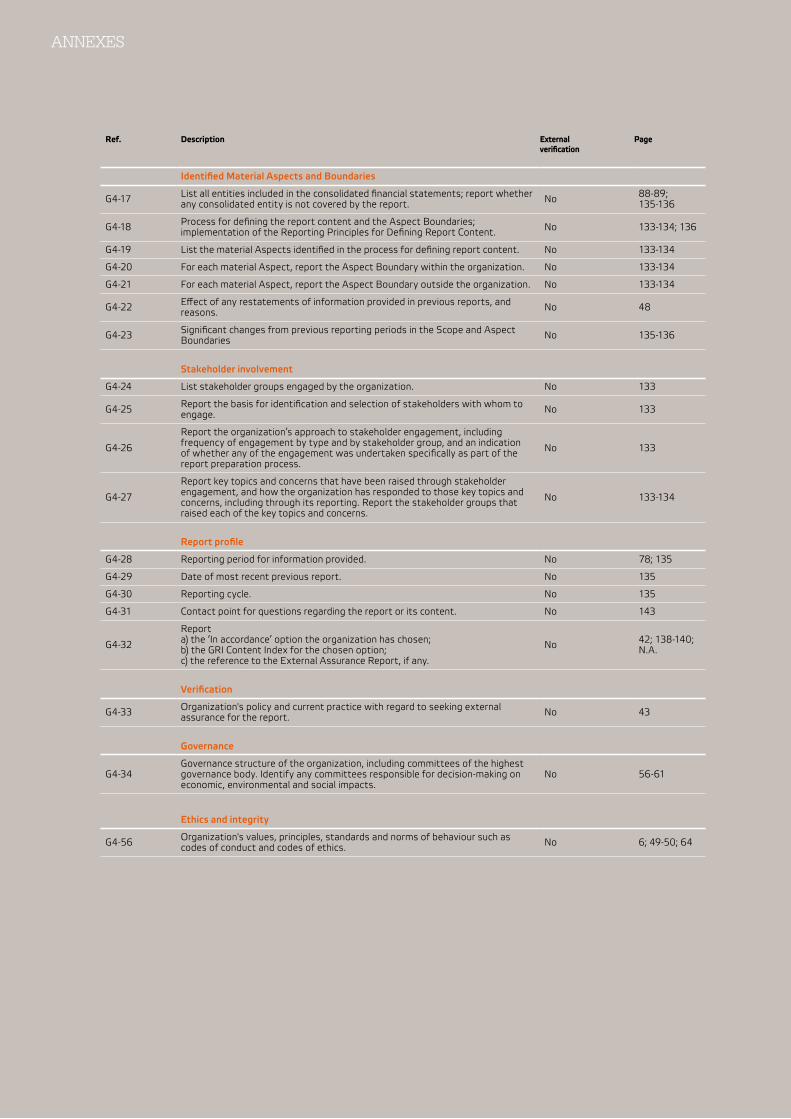
ANNEXES
Ref. Description External verification
Page
Identified Material Aspects and Boundaries
G4-17 List all entities included in the consolidated financial statements; report whether any consolidated entity is not covered by the report. No 88-89;
135-136
G4-18 Process for defining the report content and the Aspect Boundaries; implementation of the Reporting Principles for Defining Report Content. No 133-134; 136
G4-19 List the material Aspects identified in the process for defining report content. No 133-134
G4-20 For each material Aspect, report the Aspect Boundary within the organization. No 133-134
G4-21 For each material Aspect, report the Aspect Boundary outside the organization. No 133-134
G4-22 Effect of any restatements of information provided in previous reports, and reasons. No 48
G4-23 Significant changes from previous reporting periods in the Scope and Aspect Boundaries No 135-136
Stakeholder involvement
G4-24 List stakeholder groups engaged by the organization. No 133
G4-25 Report the basis for identification and selection of stakeholders with whom to engage. No 133
G4-26
Report the organization’s approach to stakeholder engagement, including frequency of engagement by type and by stakeholder group, and an indication of whether any of the engagement was undertaken specifically as part of the report preparation process.
No 133
G4-27
Report key topics and concerns that have been raised through stakeholder engagement, and how the organization has responded to those key topics and concerns, including through its reporting. Report the stakeholder groups that raised each of the key topics and concerns.
No 133-134
Report profile
G4-28 Reporting period for information provided. No 78; 135
G4-29 Date of most recent previous report. No 135
G4-30 Reporting cycle. No 135
G4-31 Contact point for questions regarding the report or its content. No 143
G4-32
Report a) the ‘In accordance’ option the organization has chosen; b) the GRI Content Index for the chosen option; c) the reference to the External Assurance Report, if any.
No 42; 138-140; N.A.
Verification
G4-33 Organization's policy and current practice with regard to seeking external assurance for the report. No 43
Governance
G4-34Governance structure of the organization, including committees of the highest governance body. Identify any committees responsible for decision-making on economic, environmental and social impacts.
No 56-61
Ethics and integrity
G4-56 Organization's values, principles, standards and norms of behaviour such as codes of conduct and codes of ethics. No 6; 49-50; 64
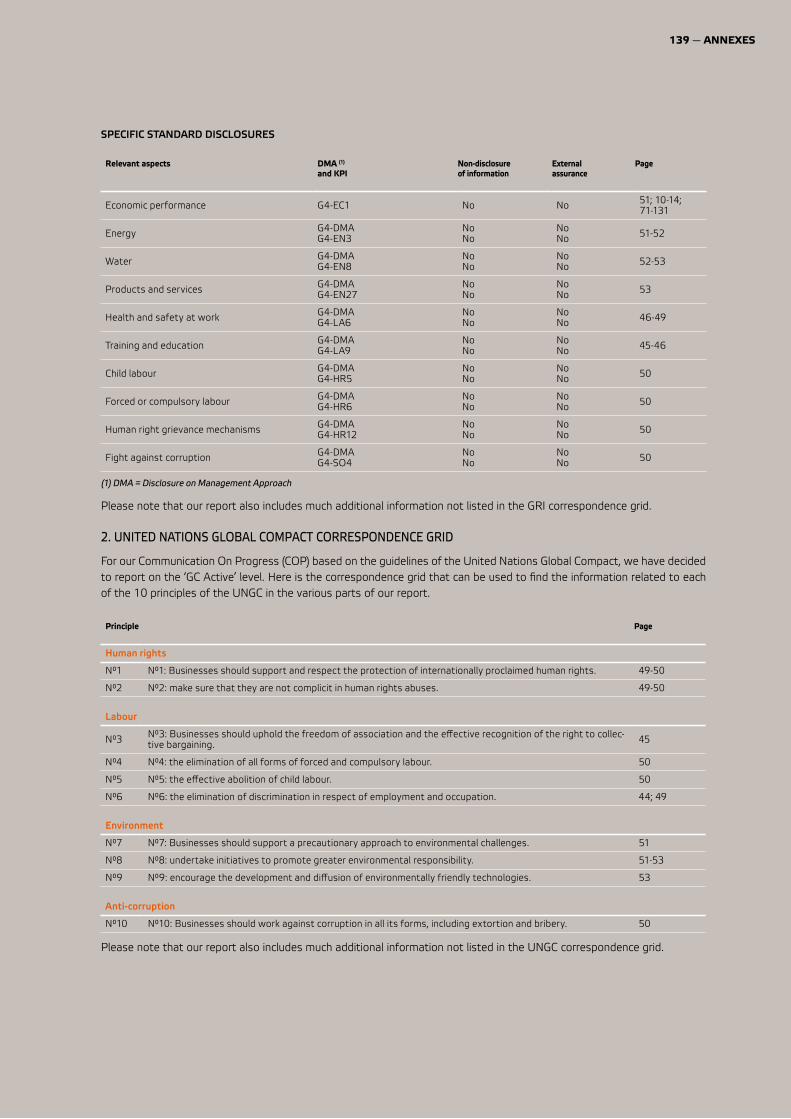
139 — ANNEXES
SPECIFIC STANDARD DISCLOSURES
Relevant aspects DMA (1) and KPI
Non-disclosure of information
External assurance
Page
Economic performance G4-EC1 No No 51; 10-14; 71-131
Energy G4-DMA G4-EN3
No No
No No 51-52
Water G4-DMA G4-EN8
No No
No No 52-53
Products and services G4-DMA G4-EN27
No No
No No 53
Health and safety at work G4-DMA G4-LA6
No No
No No 46-49
Training and education G4-DMA G4-LA9
No No
No No 45-46
Child labour G4-DMA G4-HR5
No No
No No 50
Forced or compulsory labour G4-DMA G4-HR6
No No
No No 50
Human right grievance mechanisms G4-DMA G4-HR12
No No
No No 50
Fight against corruption G4-DMA G4-SO4
No No
No No 50
(1) DMA = Disclosure on Management Approach
Please note that our report also includes much additional information not listed in the GRI correspondence grid.
2. UNITED NATIONS GLOBAL COMPACT CORRESPONDENCE GRID
For our Communication On Progress (COP) based on the guidelines of the United Nations Global Compact, we have decided to report on the ‘GC Active’ level. Here is the correspondence grid that can be used to find the information related to each of the 10 principles of the UNGC in the various parts of our report.
Principle Page
Human rights
N°1 N°1: Businesses should support and respect the protection of internationally proclaimed human rights. 49-50
N°2 N°2: make sure that they are not complicit in human rights abuses. 49-50
Labour
N°3 N°3: Businesses should uphold the freedom of association and the effective recognition of the right to collec-tive bargaining. 45
N°4 N°4: the elimination of all forms of forced and compulsory labour. 50
N°5 N°5: the effective abolition of child labour. 50
N°6 N°6: the elimination of discrimination in respect of employment and occupation. 44; 49
Environment
N°7 N°7: Businesses should support a precautionary approach to environmental challenges. 51
N°8 N°8: undertake initiatives to promote greater environmental responsibility. 51-53
N°9 N°9: encourage the development and diffusion of environmentally friendly technologies. 53
Anti-corruption
N°10 N°10: Businesses should work against corruption in all its forms, including extortion and bribery. 50
Please note that our report also includes much additional information not listed in the UNGC correspondence grid.
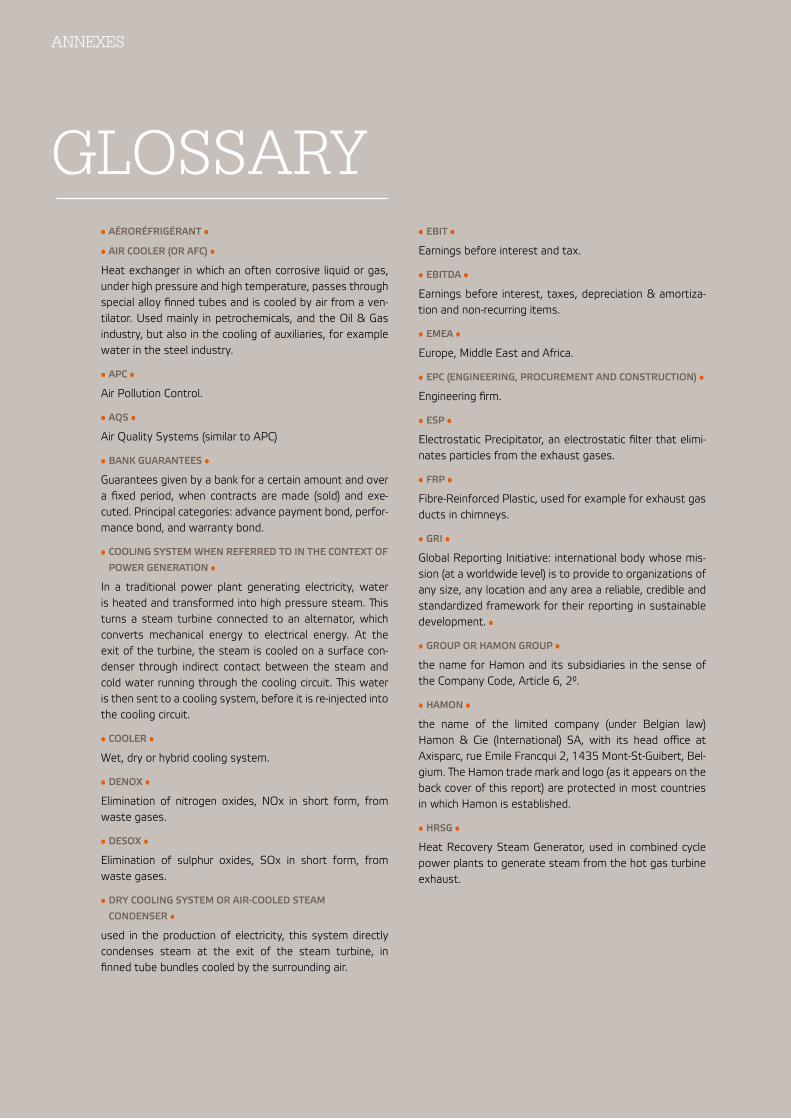
ANNEXES
GLOSSARY• AÉRORÉFRIGÉRANT •
• AIR COOLER (OR AFC) •
Heat exchanger in which an often corrosive liquid or gas, under high pressure and high temperature, passes through special alloy finned tubes and is cooled by air from a ven-tilator. Used mainly in petrochemicals, and the Oil & Gas industry, but also in the cooling of auxiliaries, for example water in the steel industry.
• APC •
Air Pollution Control.
• AQS •
Air Quality Systems (similar to APC)
• BANK GUARANTEES •
Guarantees given by a bank for a certain amount and over a fixed period, when contracts are made (sold) and exe-cuted. Principal categories: advance payment bond, perfor-mance bond, and warranty bond.
• COOLING SYSTEM WHEN REFERRED TO IN THE CONTEXT OF
POWER GENERATION •
In a traditional power plant generating electricity, water is heated and transformed into high pressure steam. ªis turns a steam turbine connected to an alternator, which converts mechanical energy to electrical energy. At the exit of the turbine, the steam is cooled on a surface con-denser through indirect contact between the steam and cold water running through the cooling circuit. ªis water is then sent to a cooling system, before it is re-injected into the cooling circuit.
• COOLER •
Wet, dry or hybrid cooling system.
• DENOX •
Elimination of nitrogen oxides, NOx in short form, from waste gases.
• DESOX •
Elimination of sulphur oxides, SOx in short form, from waste gases.
• DRY COOLING SYSTEM OR AIR-COOLED STEAM
CONDENSER •
used in the production of electricity, this system directly condenses steam at the exit of the steam turbine, in finned tube bundles cooled by the surrounding air.
• EBIT •
Earnings before interest and tax.
• EBITDA •
Earnings before interest, taxes, depreciation & amortiza-tion and non-recurring items.
• EMEA •
Europe, Middle East and Africa.
• EPC (ENGINEERING, PROCUREMENT AND CONSTRUCTION) •
Engineering firm.
• ESP •
Electrostatic Precipitator, an electrostatic filter that elimi-nates particles from the exhaust gases.
• FRP •
Fibre-Reinforced Plastic, used for example for exhaust gas ducts in chimneys.
• GRI •
Global Reporting Initiative: international body whose mis-sion (at a worldwide level) is to provide to organizations of any size, any location and any area a reliable, credible and standardized framework for their reporting in sustainable development. •
• GROUP OR HAMON GROUP •
the name for Hamon and its subsidiaries in the sense of the Company Code, Article 6, 2°.
• HAMON •
the name of the limited company (under Belgian law) Hamon & Cie (International) SA, with its head office at Axisparc, rue Emile Francqui 2, 1435 Mont-St-Guibert, Bel-gium. ªe Hamon trade mark and logo (as it appears on the back cover of this report) are protected in most countries in which Hamon is established.
• HRSG •
Heat Recovery Steam Generator, used in combined cycle power plants to generate steam from the hot gas turbine exhaust.
141 — ANNEXES
• HYBRID COOLING SYSTEM •
combination of a wet cooling system and finned tube bundles that slightly heat the saturated humid air, in order to reduce the steam plume.
• IDDC (INDIRECT DRY COOLING) •
indirect dry cooling system, in which the cooling water is cooled down without any contact with air, thus with no water consumption.
• NAFTA •
North American Free Trade Agreement: territory which includes the United States of America, Canada and Mexico.
• NORTH AMERICA •
the territory regrouping the United States of America, Canada and Mexico.
• ORDER BOOK •
refers to the residual value of Hamon’s outstanding contracts on a given date, which is the result of the dif-ference between the total value of customer contracts and the revenue already recognized in the results for these contracts.
• ORDERS BOOKED •
refers to the new projects for which a contract or a let-ter of award has been signed between a Group entity and a customer during a given period.
• SNCR •
Selective Non Catalytic Reduction: NOx removal pro-cess in which reagents are injected and in which no catalyst is used (versus Selective Catalytic Reduction (SCR) processes in which catalysts are used to elimi-nate NOx).
• WET COOLING SYSTEM •
a system that cools water from 30-40° C to 20-30° C. ªe cooling occurs via direct contact between the water and surface streaming air, with evaporation of a part of the water.
ANNEXES
GENERALINFORMATION
• HAMON & CIE (INTERNATIONAL) S.A. •
Axisparc,Rue Emile Francqui 2,B-1435 Mont-Saint-GuibertBelgium
Telephone: + 32 10 39.04.00Fax: + 32 10 39.04.01E-mail: [email protected]: www.hamon.com
VAT: BE 402.960.467Business number: 0402.960.467
• RELATIONS WITH INVESTORS AND FINANCIAL COMMUNICATION •
Christian Leclercq, Group Financial DirectorTelephone: + 32 10 39.04.22Fax: + 32 10 39.04.16E-mail: [email protected]
• ANY COMMENT ON THIS ANNUAL REPORT? •
Please send comments to Michèle VrebosE-mail: [email protected]
• RESPONSIBLE PUBLISHERS •
Bernard GobletChristian Leclercq
Ce rapport annuel est également disponible en français.

1 — HAMON ANNUAL REPORT 2016
HA
MO
N A
NN
UA
L REP
OR
T 2016