Embed Size (px)
Citation preview

H1 2014 Operational and Financial Results
16 September 2014

0.128.128
153.204.0
128.128.128
208. 208.208
245.138.31
192.0.0
242. 242. 242
255.192.0
229.242.242
178.210.216
DISCLAIMER
The information contained herein pertaining to SIBUR (the "Company") has been provided by the Company solely for use at this presentation. By attending this
presentation, or by reading these presentation slides, you agree to be bound by the limitations set out below. This presentation does not constitute or form part of,
and should not be construed as, an offer, solicitation or invitation to sell or issue, or any solicitation of any offer to purchase or subscribe for, any securities of the
Company, nor shall any part of it nor the fact of its distribution form part of, or be relied on in connection with, any contract or investment decision relating thereto.
No representation or warranty, either express or implied, is made as to, and no reliance should be placed on, the fairness, accuracy, completeness, correctness or
reliability of the information contained herein. It should not be regarded by recipients as a substitute for the exercise of their own judgment. The Company accepts
no responsibility for any losses howsoever arising, directly or indirectly, from this presentation or its contents. The material contained in this presentation is
presented solely for information purposes and is not to be construed as providing investment advice. As such, it has no regard to the specific investment objectives,
financial situation or particular needs of any recipient. There may be material variances between estimated data set forth in this presentation and actual results, and
between the data set forth in this presentation and corresponding data previously published by or on behalf of the Company.
This presentation contains forward-looking statements, including (without limitation) statements containing the words "anticipates," "expects," "intends," "may,"
"plans," “forecasts,” "projects," "will," "would", "targets,“ “believes” and similar words. These statements are based on the current expectations and projections of the
Company about future events and are subject to change without notice. All statements, other than statements of historical fact, contained herein are forward-looking
statements. Forward-looking statements are subject to inherent risks and uncertainties, such that future events and actual results may differ materially from those
set forth in, contemplated by or underlying such forward-looking statements. The Company may not actually achieve or realize its plans, intentions or expectations.
There can be no assurance that the Company's actual results will not differ materially from the expectations set forth in such forward-looking statements. Factors
that could cause actual results to differ from such expectations include, but are not limited to, the state of the global economy, the ability of the petrochemical sector
to maintain levels of growth and development, risks related to petrochemical prices and regional political and security concerns. The above is not an exhaustive list
of the factors that could cause actual results to differ materially from the expectations set forth in such forward-looking statements. The Company and its Affiliates
are under no obligation to update the information, opinions or forward-looking statements in this presentation.
2

0.128.128
153.204.0
128.128.128
208. 208.208
245.138.31
192.0.0
242. 242. 242
255.192.0
229.242.242
178.210.216
AGENDA
1. H1 2014: Key Developments and Highlights
2. Operational and Financial Results
3. Appendices
3

0.128.128
153.204.0
128.128.128
208. 208.208
245.138.31
192.0.0
242. 242. 242
255.192.0
229.242.242
178.210.216
Macroeconomic environment was generally challenging in H1’14
Near stagnancy in Russian economy; flat GDP growth in China;
rebounding EU and US GDP
Accelerating inflation
Largely flat oil prices; higher prices for LPG and naphtha
(in USD terms)
Further deterioration in synthetic rubbers
Positive effect of RR depreciation against USD and EUR
Avg. RR/USD rate up by 12.8% y-o-y
Avg. RR/EUR rate up by 17.8% y-o-y
Indexation of natural gas prices
Growth in avg. H1’14 price of 16.7% y-o-y
BoD approval to proceed with ZapSibNeftekhim (ZapSib-2 project)
Increase in the total 2014 approved CapEx budget to RR 74 bln
from RR 53 bln (net of VAT)
Launch of major facilities in Western Siberia:
Purovsk–Pyt-Yakh–Tobolsk pipeline partially launched (822 km out
of 1,100 km put in operation), transportation of feedstock initiated,
certain sections to go on stream next year
Second GFU in Tobolsk launched (capacity expansion from
3.8 mtpa up to 6.6 mtpa)
Tobolsk-Polymer – gradual ramp-up in production volumes
(98.8 kt produced in H1’14)
Further organic expansion in petchem:
PET capacity expansion (from 140 ktpa up to 210 ktpa)
New BOPP-films production line (30.5 ktpa)
RusVinyl commissioning at advanced stage,
test PVC batch produced
Material expansion in energy products trading volumes following
Ust-Luga launch (up by 697 kt)
First LPG shipments to China
Acquisition of 25% in Omsk Polypropylene Plant (Poliom) via JV with
Gazprom Neft and Titan Group
KEY HIGHLIGHTS
March 2014: acquisition of a 49% stake in Yugragazpererabotka
and new commercial agreements with Rosneft
RR 52,773 million in non-cash gain
Increase in debt to fund the transaction
Lengthy shutdowns at our production sites in Kstovo and
Dzerzhinsk (both scheduled and unscheduled)
External Environment – H1 2014 SIBUR: Key Developments 2014 YTD
One-off Factors – H1 2014
4

0.128.128
153.204.0
128.128.128
208. 208.208
245.138.31
192.0.0
242. 242. 242
255.192.0
229.242.242
178.210.216
Project Overview
ZAPSIBNEFTEKHIM (ZAPSIB-2):
FURTHER EXPANSION OF POLYOLEFINS PRODUCTION IN TOBOLSK
Project Rationale
Production Scheme
Propane
Ethylene
1,500 Ethylene
cracking
unit (ECU)
’000 tonnes
Ethane
N-Butane
HDPE - 350
HDPE - 350
LLDPE / HDPE - 400
LLDPE / HDPE - 400
PP - 500 Propylene
525 (1) Net of VAT, including expenses related to FEED, preparation and commissioning works.
(2) Net of VAT, excluding FEED stage financing.
Status as of September 2014
Greenfield construction of ethylene cracking unit and polyolefin
production complex in Tobolsk within the SIBUR’s Tobolsk
petrochemical hub
Configuration:
Cracking unit: 1.5 mtpa of ethylene, 500 ktpa of propylene,
100 ktpa of crude C4 (LINDE AG, Germany)
PE production units: 1.5 mtpa of PE (INEOS, the UK)
PP production unit: 0.5 mtpa of PP (LyondellBasell,
the Netherlands)
Total estimated project CapEx: ~USD 9.5(1) bln (~RR 360 bln)
Estimated project CapEx for 2014: RR 21(2) bln
Estimated project timeline: 5 – 5.5 yrs
Russian State support for the project expected through investment
agreements with the Tobolsk regional Government and City
Administration
Preparation works for construction
FEED for ECU, PP and PE units completed
Next stage of our investment programme in line with SIBUR’s
strategy on the back of successful implementation of the previous
investment cycle
Our key objectives:
monetise access to attractively priced hydrocarbon feedstock
stranded in Western Siberia
capitalise on SIBUR’s global cost advantage
benefit from developed feedstock processing and
transportation infrastructure
achieve economies of scale
strengthen vertically integrated business model
meet growing demand for basic polymers both in Russia and
internationally
increase in overall sales geography diversification
5
0.128.128
153.204.0
128.128.128
208. 208.208
245.138.31
192.0.0
242. 242. 242
255.192.0
229.242.242
178.210.216
AGENDA
1. H1 2014: Key Developments and Highlights
2. Operational and Financial Results
3. Appendices
6

0.128.128
153.204.0
128.128.128
208. 208.208
245.138.31
192.0.0
242. 242. 242
255.192.0
229.242.242
178.210.216
H1 2014 KEY OPERATIONAL AND FINANCIAL HIGHLIGHTS
APG processing volumes increased by 7.4% y-o-y
Natural gas production increased by 8.0% y-o-y
Raw NGL fractionation volumes increased by 10.6% y-o-y
LPG production increased by 12.6% y-o-y
Petrochemical products sales volumes decreased by 3.1% y-o-y
Operational
Results
Financial
Results
Revenue increased by 32.1% y-o-y to RR 171.7 bln
EBITDA increased by 29.8% y-o-y to RR 49.5 bln, for an EBITDA margin of 28.8%
Estimated EBITDA margin adjusted for naphtha trading(1) amounted to 32.4%
Net profit surged 196.3% y-o-y to RR 75.7 bln
Adjusted net profit(2) increased by 32.8% to RR 30.7 bln
Operating cash flows before working capital changes increased by 30.3%
CapEx decreased by 26.4% y-o-y to RR 26.5 bln
Net Debt to EBITDA at 1.27x as of 30 Jun’14 vs. 1.48x as of 31 Mar’14 and 1.17x as of 31 Dec’13
Notes:
(1) Estimated adjusted EBITDA margin excludes naphtha trading via the Ust-Luga transshipment facility.
(2) Net profit adjusted for non-cash charge related to the equity-settled share-based payment plans and the non-cash gains on acquisition and deconsolidation of OOO Yugragazpererabotka.
7

0.128.128
153.204.0
128.128.128
208. 208.208
245.138.31
192.0.0
242. 242. 242
255.192.0
229.242.242
178.210.216
31.0 35.0
H1 2013 H1 2014
2.0 2.2
H1 2013 H1 2014
3.8%
9.2%
H1 2013 H1 2014
0.9% 0.8%
H1 2013 H1 2014
6.9% 7.8%
H1 2013 H1 2014
MACRO ENVIRONMENT
Russian GDP Growth(1) Consumer Price Index (y-o-y)(1) Producer Price Index (y-o-y)(1)
Average Exchange Rate(2) Effective Average Electricity Tariffs
RR per kw•hour
+9.0%
Source:
(1) Russian Federal State Statistics Service.
(2) CBR.
+12.8%
RR / USD
30.4 32.7
31 Dec'12 30 Jun'13
Exchange Rate(2)
RR / USD
7.7% 32.7 33.6
31 Dec'13 30 Jun'14
2.8%
8

0.128.128
153.204.0
128.128.128
208. 208.208
245.138.31
192.0.0
242. 242. 242
255.192.0
229.242.242
178.210.216
1.0
1.5
2.0
2.5
3.0
3.5
H1 2013 H1 2014
Natural rubber (USD) Styrene-butadiene rubber
Butadiene Butyl rubber
Styrene
0.0
0.5
1.0
1.5
H1 2013 H1 2014
Brent NaphthaLPG CIF ARA (large) MTBENatural gas
(2.6%)
(24.5%)
(29.8%)
(3.6%)
1.0
1.2
1.4
1.6
1.8
2.0
H1 2013 H1 2014
2-ethylhexanol Expandable polystyrene
MEG Butyl acrylate
PET
1.3
1.4
1.5
1.6
H1 2013 H1 2014
PP LDPE
MARKET ENVIRONMENT(1)
Source: Argus, Platts, Bloomberg, ICIS, Chemease, Malaysian Rubber Board, Federal Tariff Service of Russian Federation
Notes:
(1) For detailed market data statistics please refer to Appendix. Prices quoted in EUR are converted to USD at average EUR / USD FX rates for the respective periods.
Energy Products Basic Polymers
+0.8% +4.4%
+12.3%
+4.6%
Synthetic Rubbers Plastics & Organic Synthesis
(8.8%)
(5.7%)
(6.8%)
+2.2%
(13.7%)
(0.4%)
’000 USD per tonne except as stated (avg. for the period)
’000 USD per thousand cubic metres of natural gas (avg. for the period)
’000 USD per tonne (avg. for the period)
’000 USD per tonne (avg. for the period)
’000 USD per tonne (avg. for the period)
+3.5%
(25.4%)
+0.1%
9

0.128.128
153.204.0
128.128.128
208. 208.208
245.138.31
192.0.0
242. 242. 242
255.192.0
229.242.242
178.210.216 23.1 30.7
H1 2013 H1 2014
38.1 49.5
H1 2013 H1 2014
130.0
171.7
H1 2013 H1 2014
SIBUR FINANCIAL SUMMARY
RR bln
29.3% 28.8%
Adjusted Net Profit
36.3 20.5
H1 2013 H1 2014
RR bln
RR bln
+32.1%
+29.8%
+41.6%
Revenue EBITDA
Cash Used in Investing Activities(2)
RR bln
+32.8%
1.17x 1.48x
1.27x
31 Dec'13 31 Mar'14 30 Jun'14
Net Debt / EBITDA
37.8 37.0 5.0 (5.8)
RR bln
Operating Cash Flow
Adj. margin, %
17.8% 17.9%
(1) Estimated EBITDA margin excludes naphtha trading via the Ust-Luga transshipment facility.
(2) Includes CapEx and M&A.
32.4% Adj. EBITDA margin(1), %
EBITDA margin, %
51.4
Acquisition of
Yugragazpererabotka
49.3 37.1
(2.4) (9.8)
OCF before ΔWC
ΔWC Income taxpaid
OCF
H1 2
013
H1 2
014
10

0.128.128
153.204.0
128.128.128
208. 208.208
245.138.31
192.0.0
242. 242. 242
255.192.0
229.242.242
178.210.216
23
20
10 6
3
12
10
8 5 3
REVENUE STRUCTURE AND DYNAMICS
46 39
8 6 1
Asia
Europe
CIS Other
Russia %
By region Revenue Split by Region Revenue Split by Product
H1 2014
%
H1 2014
130.0
171.7
H1 2013 H1 2014
RR bln
Total Revenue
+32.1%
58.0 59.9
H1 2013 H1 2014
67.2
107.4
H1 2013 H1 2014
+59.8%
+3.4%
RR bln
Energy Products Petrochemical Products
RR bln
Intermediates and
other chemicals
LPG
Naphtha
Natural gas
Basic polymers
Synthetic rubbers
Plastics and organic
synthesis products
MTBE and
other fuels
Processing services
and other sales
Raw NGL
11

0.128.128
153.204.0
128.128.128
208. 208.208
245.138.31
192.0.0
242. 242. 242
255.192.0
229.242.242
178.210.216
REVENUE DYNAMICS BY PRODUCT GROUP
9.7 9.0
H1 2013 H1 2014
9.8 8.4
H1 2013 H1 2014
20.7 21.4
H1 2013 H1 2014
16.9 13.5
H1 2013 H1 2014
12.7 17.6
H1 2013 H1 2014
27.1
39.4
H1 2013 H1 2014
10.6 16.7
H1 2013 H1 2014
Natural gas
Synthetic Rubbers Plastics & Organic
Synthesis
MTBE
Intermediates & Other
RR bln
+45.3%
+38.1%
(7.0%)
(20.1%) +3.0%
(14.5%)
LPG
Basic Polymers
4.5 5.2
H1 2013 H1 2014
Raw NGL
+15.9%
H1 2013 H1 2014
Other Revenue
(9.1%) 4.8 4.4
Trading and other sales
Sales of processing services
RR bln RR bln RR bln
RR bln RR bln RR bln RR bln RR bln
+58.2%
11.9
34.2
H1 2013 H1 2014
Naphtha
+187.9%
RR bln
12

0.128.128
153.204.0
128.128.128
208. 208.208
245.138.31
192.0.0
242. 242. 242
255.192.0
229.242.242
178.210.216
Sales volumes, ’000 tonnes
Change in effective avg. selling price, %
537
1,151
H1 2013 H1 2014
1,445 1,753
H1 2013 H1 2014
6,212
7,354
H1 2013 H1 2014
KEY ENERGY PRODUCTS: SALES VOLUMES AND PRICE DYNAMICS
LPG
+21.3%
+19.8%
+16.7%
Sales volumes,’000 tonnes
Change in effective avg. selling price, %
Key Factors Natural Gas
+18.4%
Sales volumes, mln cubic metres
Change in effective avg. selling price, % Higher sales volumes of naphtha and LPG on
expanded trading activities
organic growth in production following the launch of integrated
feedstock processing and transportation infrastructure
Increase in natural gas sales volumes due to consolidation of
100% production at GPPs of OOO Yugragazpererabotka
following its acquisition
Higher selling prices across the product range
…due to positive dynamics in international market prices for
most products…
...supported by substantial RR depreciation
Increase in natural gas selling price on 16.7% y-o-y indexation
of regulated prices
Naphtha
+34.4%
+114.2%
13

0.128.128
153.204.0
128.128.128
208. 208.208
245.138.31
192.0.0
242. 242. 242
255.192.0
229.242.242
178.210.216
390 372
H1 2013 H1 2014
Basic Polymers Synthetic Rubbers Key Factors
Plastics & Organic Synthesis Intermediates & Other
211 178
H1 2013 H1 2014
214
304
H1 2013 H1 2014
250
177
H1 2013 H1 2014
(28.9%)
+42.0%
(4.7%)
+20.4% +8.0%
(5.6%)
PETROCHEMICALS: SALES VOLUMES AND PRICE DYNAMICS
Sales volumes, ’000 tonnes
Change in effective avg. selling price, %
Sales volumes, ’000 tonnes
Change in effective avg. selling price, %
Sales volumes, ’000 tonnes
Change in effective avg. selling price, %
+11.4%
(15.3%)
Change in effective avg. selling price, %
Sales volumes, ’000 tonnes
Basic polymers:
Higher sales volumes due to growth in PP
production following Tobolsk-Polymer launch
Higher PP and LDPE prices reflecting growth in
international market prices supported by weak RR
Synthetic rubbers:
Decrease in sales volumes primarily due to lower
commodity rubbers production…
…partially compensated by lower inventory build-
up and growth in TPE sales volumes
Continued downward pricing trend for all rubber
grades
Plastics & organic synthesis:
Lower sales volumes largely due to
decrease in glycols production as a result of
shutdowns in Kstovo and Dzerzhinsk
deconsolidation of Plastic and divestment of PVC
cable compounds production…
…compensated by higher PET and BOPP-film
production following capacity expansions
Decline in market prices mitigated by substantial
RR depreciation
Intermediates & other chemicals:
Lower sales volumes due to lengthy shutdowns
in Kstovo and Dzerzhinsk
Higher TPA volumes used internally
following expanded PET production
14

0.128.128
153.204.0
128.128.128
208. 208.208
245.138.31
192.0.0
242. 242. 242
255.192.0
229.242.242
178.210.216
Increase in goods for resale purchases on expanded trading activities
following the launch of Ust-Luga transshipment facility
Higher feedstock & materials on higher APG purchases following the
acquisition of Yugragazpererabotka and new terms of contracts with
Rosneft
purchase of 100% of APG supplied to the GPPs of Yugragazpererabotka
change in APG price formula for new contracts with Rosneft
compensated by termination of raw NGL purchases from Rosneft
Higher D&A expenses due to
commissioning of new large-scale facilities (Tobolsk-Polymer, Ust-Luga,
certain sections of raw NGL pipeline)
amortisation of intangible assets related to APG supply contracts
consolidation of Yugragazpererabotka’s assets
Higher transportation & rent expenses due to longer delivery distances
and higher transported volumes combined with RR depreciation
Increase in energy & utilities expenses due to Yugragazpererabotka
consolidation from March 2014
(1) Operating expenses before equity-settled share-based payment plans.
(2) Transportation, logistics and rent.
NET OPERATING EXPENSES STRUCTURE AND DYNAMICS
Net Operating Expenses(1)
15
Y-o-Y dynamics
97.3
133.6
H1 2013 H1 2014
RR bln
29
16
15 3
11
10
8
3 2
Feedstock &
materials
Transportation &
logistics
Energy &
utilities
Staff costs
Depreciation &
amortisation
%
Goods
for resale
Structure
75% 78%
+37.3%
Key Factors
– % of revenue x%
H1 2014
Repairs &
maintenance
Services from
3rd parties
Rent
3.1
22.0
H1 2013 H1 2014
Goods for Resale
RR bln
+611.6%
2% 13%
Depreciation & Amortisation
RR bln
5.2 11.3
H1 2013 H1 2014
+118.1%
4% 7%
12.9 13.1
H1 2013 H1 2014
Staff Costs
RR bln
+1.3%
10% 8%
33.3 38.9
H1 2013 H1 2014
Feedstock & Materials
RR bln
+17.0%
26% 23%
H1 2013 H1 2014
24.3 22.0
Transportation & logistics
Transportation & Rent(2)
RR bln
+10.3%
17% 14%
13.0 15.0
H1 2013 H1 2014
Energy & Utilities
+15.2%
10% 9%
RR bln
Rent expenses

0.128.128
153.204.0
128.128.128
208. 208.208
245.138.31
192.0.0
242. 242. 242
255.192.0
229.242.242
178.210.216
Net cash from operating activities remained
largely flat y-o-y on
higher EBITDA…
partially offset by negative impact from
WC changes on expanded trading
activities…
…and higher income tax paid
Improvement in WC turnover to 35.6 days in
H1’14 from 50.4 in H1’13
Net cash used in investing activities
increased by 41.6% y-o-y on
1st tranche payment for the acquisition of
Rosneft’s 49% stake in
Yugragazpererabotka
higher contributions to the share capital
of RusVinyl, financing of Yuzhno-
Priobskiy GPP construction and
OOO Poliom stake acquisition
…despite decrease in CapEx by 26.4%
y-o-y(1)
Net cash received from financing activities
attributable to new borrowings to fund the
acquisition of a 49% stake in
Yugragazpererabotka
CASH FLOW STATEMENT HIGHLIGHTS
Six months ended
30 June Change
% RR mln, except as stated 2014 2013
Net cash from operating activities 37,071 36,995 0.2%
Operating cash flows before WC changes 49,281 37,827 30.3%
Changes in working capital (2,413) 4,956 n/m
Income tax paid (9,797) (5,788) 69.3%
Net cash used in investing activities, including (51,420) (36,325) 41.6%
Purchase of PPE (26,520) (36,044) (26.4%)
Acquisition of interest in subsidiaries, net of cash
acquired (20,666) (329) n/m
Additional contribution to the share capital of joint
ventures (4,475) (500) 795.0%
Net cash (used in) / from financing activities, including 21,156 (9,992) n/m
Net proceeds from / (repayment of) debt 24,898 (1,163) n/m
Dividends (6,383) (7,625) (16.3%)
Effect of exchange rate changes on cash and cash
equivalents 26 12 119.1%
Net increase / (decrease) in cash and cash
equivalents 6,833 (9,310) n/m
Key Developments Key Highlights
16 Notes:
(1) In September 2014, SIBUR Board of Directors approved expansion of the investment programme for 2014 from RR 53 bln to RR 74 bln (net of VAT).
0.128.128
153.204.0
128.128.128
208. 208.208
245.138.31
192.0.0
242. 242. 242
255.192.0
229.242.242
178.210.216
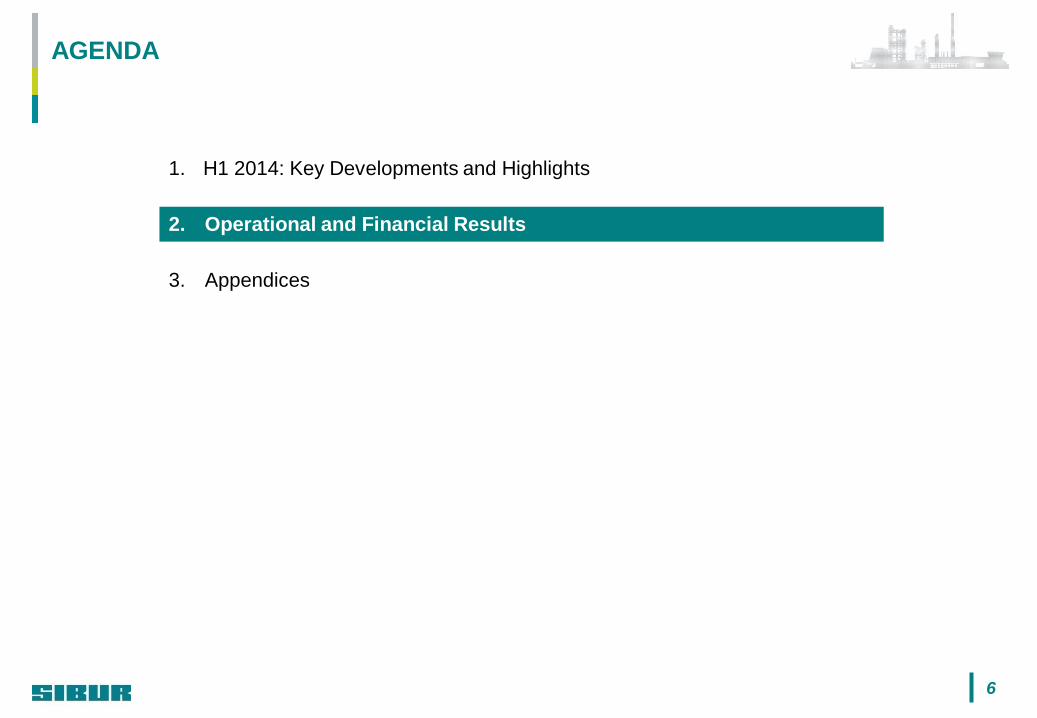
RR bln, except as stated
1 Sep
2014(2)
30 Jun
2014
31 Mar
2014
Change, %
1 Sep vs 30 Jun
Total debt 133.4 129.3 131.5 3.2%
Maturity profile
Short-term 31.1 48.6 68.6 (36.0%)
Long-term 102.3 80.7 62.9 26.8%
Currency split
USD 101.3 87.1 104.9 16.3%
RR 27.0 37.2 21.8 (27.4%)
EUR 5.1 5.0 4.8 2.0%
Credit lines 81.1 77.8 56.8 4.2%
Committed 33.2 33.1 12.1 0.3%
Uncommitted 47.9 44.7 44.7 7.2%
48.6
30.5 41.5
8.6
< 1 y 1-2 y 2-5 y > 5 y
29
4 67
DEBT STRUCTURE AND MATURITY PROFILE
17
30 Jun’14 RR bln
Debt Maturity Profile Debt Currency Split
RR
EUR
USD
30 Jun’14
%
Key Highlights
Notes:
(1) Interest represents accrued interest, i.e. includes interest expense and capitalised interest.
(2) Unaudited data.
Net debt increased by 23.7% y-o-y primarily due to
new borrowings to fund the acquisition of a 49% stake in
Yugragazpererabotka
In April 2014, SIBUR entered into a 2-yr RR 27 bln credit facility to
refinance short-term debt
As of 30 June 2014, all of the debt was unsecured, except for
RR 15.4 bln outstanding under the Tobolsk-Polymer project
finance facility, fully released from pledge by August 2014
RR bln, except as stated
30 Jun
2014
31 Mar
2014
31 Dec
2013
Change, %
vs 31 Dec 2013
Debt 129.3 131.5 100.5 28.6%
Cash & cash equivalents 14.8 11.5 7.9 86.0%
Net debt 114.5 120.0 92.5 23.7%
Average loan tenor (years) 2.2 2.1 2.7
Available credit lines 77.8 56.8 66.7 37.0%
Debt / EBITDA 1.43x 1.62x 1.27x
Net debt / EBITDA 1.27x 1.48x 1.17x
EBITDA / Interest(1) 17x 18x 17x
Key Figures

0.128.128
153.204.0
128.128.128
208. 208.208
245.138.31
192.0.0
242. 242. 242
255.192.0
229.242.242
178.210.216
FINANCIAL CALENDAR – 2014
18
Event Date
FY 2013 Operational and Financial Results 18 March 2014
Q1 2014 Operational and Financial Results 10 June 2014
Q2 and H1 2014 Operational and Financial Results 16 September 2014
Q3 and 9M 2014 Operational and Financial Results Week of 8 December 2014
SEP 2014
M T W T F S S
1 2 3 4 5 6 7
8 9 10 11 12 13 14
15 16 17 18 19 20 21
22 23 24 25 26 27 28
29 30
DEC 2014
M T W T F S S
1 2 3 4 5 6 7
8 9 10 11 12 13 14
15 16 17 18 19 20 21
22 23 24 25 26 27 28
29 30 31

0.128.128
153.204.0
128.128.128
208. 208.208
245.138.31
192.0.0
242. 242. 242
255.192.0
229.242.242
178.210.216
19
Appendix

0.128.128
153.204.0
128.128.128
208. 208.208
245.138.31
192.0.0
242. 242. 242
255.192.0
229.242.242
178.210.216
SIBUR AND ROSNEFT –
NEW FRAMEWORK FOR LONG-TERM COOPERATION
Acquisition of Control in Yugragazpererabotka New Contracts
Increase in guaranteed APG supplies to 10 bcm p.a.
from 6.6 bcm p.a.
Increase in guaranteed sales of natural gas(1)
Tenors for APG supplies and natural gas sales
extended to 2032 (inclusive) from 2026
Rosneft‘s commitment to NGLs content in APG
supplied to Yugragazpererabotka
Acquisition of a 49% interest in Yugragazpererabotka
from Rosneft Group completed on 6 March 2014
Deal value of USD 1.567 bln in cash
USD 0.567 bln paid in March 2014
USD 1 bln to be paid by 6 March 2015
Strategic Importance for SIBUR
SIBUR gains full control over 3 GPPs with
processing capacity of 13.4 bcm p.a. and related
infrastructure
Cementing long-term access to feedstock
Operational and strategic synergies
Notes:
(1) Natural gas produced at Nizhnevartovskiy GPP and Belozerniy GPP.
Consolidation as a wholly owned subsidiary from
6 March 2014
Overall improvement in SIBUR results
Non-cash gain on equity interest (to be excluded from
dividend base)
Impact on SIBUR Financials
20

0.128.128
153.204.0
128.128.128
208. 208.208
245.138.31
192.0.0
242. 242. 242
255.192.0
229.242.242
178.210.216
YUGRAGAZPERERABOTKA TRANSACTION IMPLICATIONS
SIBUR purchases 51% of volumes supplied
to Yugragazpererabotka GPPs, primarily
from Rosneft
Rosneft is responsible for the remaining
49% of volumes
APG
SIBUR purchases 100% of volumes supplied
to Yugragazpererabotka GPPs, primarily
from Rosneft
Rosneft sells all volumes to SIBUR
APG purchasing volumes and costs
Pre Transaction Post Transaction Impact on SIBUR
SIBUR obtains 51%, purchases 49% from
Rosneft
Rosneft obtains 49%, sells 49% to SIBUR
SIBUR retains 100% Raw NGL production
Raw NGL purchasing volumes and
costs Raw NGL
SIBUR obtains 51%, sells 51% to Rosneft
Rosneft obtains 49%, purchases 51% from
SIBUR
SIBUR obtains 100%, sells all volumes from
Nizhnevartovskiy and Belozerniy GPPs to
Rosneft
Natural gas production
Sales volumes and revenue from
sales of natural gas Natural Gas
OpEx (other than feedstock)
Processing fee
Non-cash gain on equity interest(2)
SIBUR pays to Yugragazpererabotka a
processing fee reflected in OpEx as 3rd
party processing
100% OpEx consolidated
P&L(1)
CF SIBUR finances its share of
Yugragazpererabotka CapEx via
loans issued / investments in JVs
100% CapEx consolidated CapEx
Loans issued / investments in JVs
SIBUR’s 51% interest is accounted for as
Investment in JV
100% consolidated PP&E, goodwill, other non-current assets
Accounts payable, total debt BS
21 Notes:
(1) Items other than revenue and feedstock costs.
(2) For the purpose of dividends calculation net profit will be adjusted for this charge.
0.128.128
153.204.0
128.128.128
208. 208.208
245.138.31
192.0.0
242. 242. 242
255.192.0
229.242.242
178.210.216
YUGRAGAZPERERABOTKA ACQUISITION: IMPLICATION ON SIBUR
FINANCIALS
P&L Balance Sheet
RR millions As of 30 Jun’14
As of 31 Dec’13
Assets
Non-current assets
Property, plant and
equipment 298,651 282,198
Other intangible assets 119,577 4,553
…. …. ….
Total non-current assets 480,840 344,887
Current assets
Total current assets 81,698 68,544
Liabilities
Non-current liabilities
Deferred income tax
liabilities 30,103 5,606
…. …. ….
Total non-current liabilities 154,898 102,682
Current liabilities
Short-term debt and current
portion of long-term debt 48,570 42,743
Trade and other payables 72,597 36,458
….
Total current liabilities 124,565 81,480
Equity 311,410 234,304
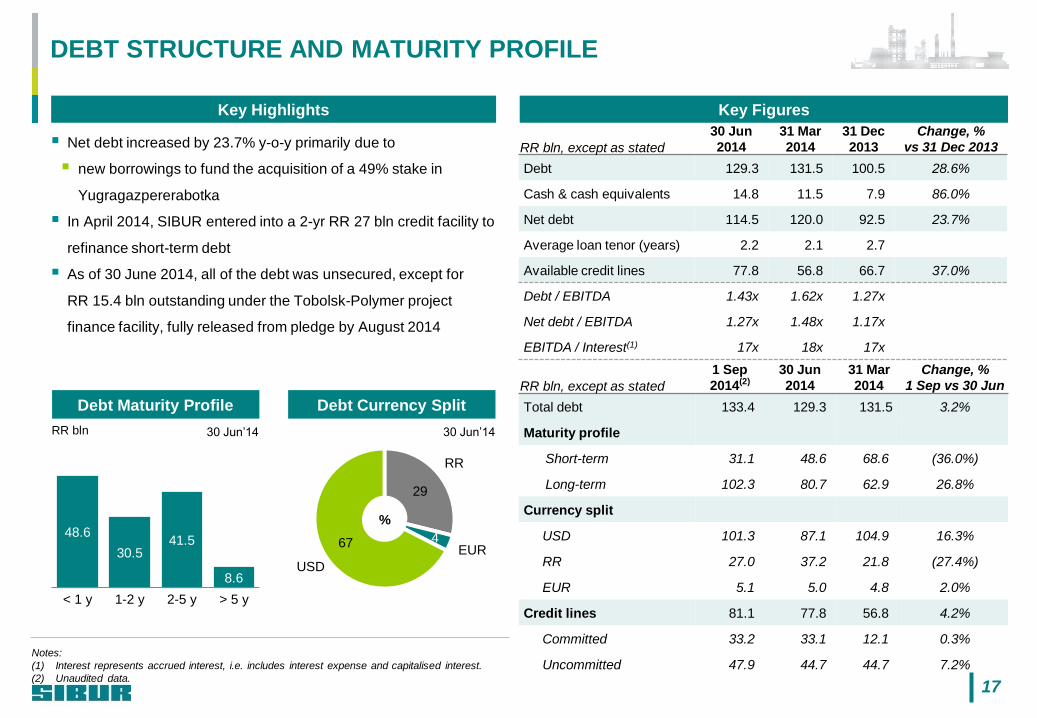
Following the acquisition of control over
Yugragazpererabotka, the Group has reflected
the following transactions in its IFRS for the H1
results:
Increase in PPE value in balance sheet
Increase in intangible assets related to
supply contracts of RR 115,816 mln
Non-taxable gain resulted in higher deferred
income tax liabilities
RR 52,773 mln gain was recognised due to
revaluation of SIBUR’s previously held at
historical cost 51% interest in
Yugragazpererabotka
Total cash consideration of RR 55,733 mln
split between:
cash outflow of RR 20,547 (1st tranche
payment)
an increase in trade and other payables in
balance sheet
Increase in borrowings to fund the
transaction
RR millions H1’14 H1’13
Revenue 171,712 130,030
Total OpEx (141,382) (97,297)
Operating profit 30,330 32,733 Gain on acquisition of subsidiary 52,773 -
…. .... .... Profit before income tax 83,345 30,024
Income tax expense (7,654) (4,479) Profit for the reporting period 75,691 25,545
Cash Flow Statement
RR millions H1’14 H1’13 CFO 37,071 36,995
CFI (51,420) (36,325) Acquisition of interest in subsidiaries, net of cash acquired (20,666) (329)
…. .... ....
CFF 21,156 (9,992)
Net proceeds from debt 24,898 (1,163)
…. …. …. Net increase/ (decrease) in cash and cash equivalents 6,833 (9,310)
Cash and cash
equivalents, eop 14,781 4,260
22

0.128.128
153.204.0
128.128.128
208. 208.208
245.138.31
192.0.0
242. 242. 242
255.192.0
229.242.242
178.210.216
H1 2013 H1 2014
Energy Products
MARKET PRICES
Rebased to 100
Synthetic Rubbers
Rebased to 100
Plastics & Organic Synthesis Products
Rebased to 100
Basic Polymers
Rebased to 100
Source: Argus, Platts, Bloomberg, ICIS, Malaysian Rubber Board, Chemease, Federal Tariff Service of Russian Federation
H1 2013 H1 2014
80%
100%
120%
LDPE CFR China film, Spot
PP rafia China Main Port, Spot
H1 2013 H1 2013 H1 2014 H1 2014
60%
80%
100%
120%
140%
Polystyrene, EPS block FOB KoreaMEG Contract, FD NWE T22-ethylhexanol Spot, FD NWEButyl acrylate Spot, FD NWEPET FOB China, Spot
40%
60%
80%
100%
120%
Brent Naphtha CIF NWE
LPG CIF ARA (large) MTBE
Natural gas
0%
20%
40%
60%
80%
100%
120%
Styrene butadiene rubber Natural Rubber
Butadiene Butyl rubber
Styrene
23

0.128.128
153.204.0
128.128.128
208. 208.208
245.138.31
192.0.0
242. 242. 242
255.192.0
229.242.242
178.210.216
MARKET PRICES (CONT’D)
24
PRODUCT QUOTE SOURCE
ENERGY PRODUCTS
Oil Brent (USD per bbl) Bloomberg
Naphtha Naphtha CIF NWE Argus
LPG LPG CIF ARA (large) Argus
MTBE MTBE FOB Rotterdam / FOB ARA Platts
Natural gas Natural gas wholesale price (for population) Federal Tariff Service of Russian Federation
BASIC POLYMERS
LDPE LDPE CFR China film, Spot ICIS
PP PP rafia China Main Port, Spot ICIS
SYNTHETIC RUBBERS
Natural rubber NR SMR 20 Malaysian Rubber Board
Butyl rubber IIR 1751 (yanshan) Chemease
Butadiene Butadiene Contract, FD NWE ICIS
Styrene-butadiene rubber ESBR 1500 Spot, FD NWE ICIS
Styrene Styrene Spot, FOB Rotterdam ICIS
PLASTICS & ORGANIC SYNTHESIS PRODUCTS
PET PET FOB China, Spot ICIS
Monoethylene glycol (MEG) MEG Contract, FD NWE T2 ICIS
2-ethylhexanol (alcohol) 2-ethylhexanol Spot, FD NWE ICIS
Butyl acrylate Butyl acrylate Spot, FD NWE ICIS
Expandable polystyrene Polystyrene, EPS block FOB Korea ICIS