Embed Size (px)
Citation preview

PAO SIBUR Holding International Financial Reporting Standards Consolidated Financial Statements and Independent Auditor’s Report 31 December 2017

Table of Contents Independent Auditor’s Report IFRS Consolidated Statement of Profit or Loss .......................................................................................... 1 IFRS Consolidated Statement of Financial Position ................................................................................... 2 IFRS Consolidated Statement of Cash Flows ............................................................................................. 3 IFRS Consolidated Statement of Changes in Equity .................................................................................. 4 IFRS Consolidated Statement of Comprehensive Income ......................................................................... 5 Notes to the IFRS Consolidated Financial Statements: 1 Nature of Operations ......................................................................................................................................... 6 2 Basis of Preparation and Significant Accounting Policies ............................................................................... 6 3 Critical Accounting Estimates and Judgements in Applying Accounting Policies ....................................... 18 4 Acquisition and Deconsolidation of Subsidiaries and Transactions with Non-Controlling Interest ............ 21 5 Assets and Liabilities Classified as Held for Sale .......................................................................................... 23 6 Revenue ........................................................................................................................................................... 24 7 Operating Expenses ......................................................................................................................................... 24 8 Finance Income and Expenses ........................................................................................................................ 25 9 Segment Information....................................................................................................................................... 25 10 Construction Contracts .................................................................................................................................... 27 11 Earnings per Share .......................................................................................................................................... 27 12 Property, Plant and Equipment ....................................................................................................................... 28 13 Advances and Prepayments for Capital Construction .................................................................................... 28 14 Goodwill and Intangible Assets ...................................................................................................................... 29 15 Investments in Joint Ventures and Associates................................................................................................ 30 16 Advances Issued and Received under Project Management Services ........................................................... 36 17 Prepaid Borrowing Costs ................................................................................................................................ 37 18 Trade and Other Receivables .......................................................................................................................... 37 19 Other Non-Current Assets............................................................................................................................... 38 20 Inventories ....................................................................................................................................................... 39 21 Loans Receivable ............................................................................................................................................ 39 22 Prepayments and Other Current Assets .......................................................................................................... 40 23 Bank Deposits ................................................................................................................................................. 40 24 Cash and Cash Equivalents ............................................................................................................................. 40 25 Long-Term Debt Excluding Related to ZapSibNeftekhim ............................................................................ 41 26 Long-Term ZapSibNeftekhim Related Debt .................................................................................................. 42 27 Grants and Subsidies ....................................................................................................................................... 44 28 Other Non-Current Liabilities ......................................................................................................................... 44 29 Trade and Other Payables ............................................................................................................................... 45 30 Short-Term Debt and Current Portion of Long-Term Debt Excluding Related to ZapSibNeftekhim ......... 45 31 Taxes Other than Income Tax Payable ........................................................................................................... 45 32 Shareholders’ Equity ....................................................................................................................................... 46 33 Non-Controlling Interest ................................................................................................................................. 47 34 Income Tax ...................................................................................................................................................... 48 35 Cash Generated from Operations and Net Debt Reconciliation .................................................................... 50 36 Principal Subsidiaries ...................................................................................................................................... 51 37 Related Parties ................................................................................................................................................. 51 38 Financial Instruments and Financial Risk Factors ......................................................................................... 53 39 Fair Value of Financial Instruments ............................................................................................................... 57 40 Commitments, Contingencies and Operating Risks ....................................................................................... 58 41 New Accounting Developments ..................................................................................................................... 61 42 New Accounting Pronouncements ................................................................................................................. 61 Contact Info ................................................................................................................................................................. 64


PAO SIBUR HOLDING IFRS CONSOLIDATED STATEMENT OF FINANCIAL POSITION (In millions of Russian roubles, unless otherwise stated)
The accompanying notes on pages 6 to 64 are an integral part of these consolidated financial statements
2
As of 31 December Notes 2017 2016
Assets
Non-current assets 12 Property, plant and equipment 605,315 435,002 13 Advances and prepayments for capital construction 69,015 95,998
4, 14 Goodwill 12,097 12,097 14 Intangible assets excluding goodwill 107,822 114,228 15 Investments in joint ventures and associates 33,673 31,757 34 Deferred income tax assets 11,731 11,081 16 Long-term advances issued under project management services 52,027 33,109 21 Loans receivable 1,501 - 17 Prepaid borrowing costs 2,307 3,432 18 Trade and other receivables 2,408 1,754 19 Other non-current assets 2,848 2,150 Total non-current assets 900,744 740,608 Current assets
20 Inventories 31,734 30,992 34 Prepaid current income tax 2,334 5,523 21 Loans receivable 13 971 18 Trade and other receivables 25,738 20,135 22 Prepayments and other current assets 24,085 16,381 16 Short-term advances issued under project management services 39,699 4,630 17 Prepaid borrowing costs 4,455 3,709 24 Cash and cash equivalents 48,456 60,635 Total current assets 176,514 142,976
4, 5 Assets classified as held for sale 6,568 2,641 Total assets 1,083,826 886,225 Liabilities and equity
Non-current liabilities
25 Long-term debt excluding related to ZapSibNeftekhim 111,786 160,855 26 Long-term ZapSibNeftekhim related debt 170,712 158,770 27 Grants and subsidies 48,720 41,082 16 Long-term advances received under project management services 58,524 35,481 34 Deferred income tax liabilities 38,730 34,355 28 Other non-current liabilities 16,575 12,390 Total non-current liabilities 445,047 442,933 Current liabilities
29 Trade and other payables 95,360 50,007 16 Short-term advances received under project management services 39,558 5,931 34 Income tax payable 1,611 2,213
30 Short-term debt and current portion of long-term debt excluding related to ZapSibNeftekhim 27,361 21,273
26 Current portion of long-term ZapSibNeftekhim related debt 2,485 915 31 Taxes other than income tax payable 8,550 5,615 Total current liabilities 174,925 85,954
4, 5 Liabilities associated with assets classified as held for sale 6,696 600 Total liabilities 626,668 529,487 Equity
32 Ordinary share capital 21,784 21,784 Share premium 9,357 9,357
37 Equity-settled share-based payment plans 32,450 32,450 Retained earnings 388,515 290,889
Total equity attributable to the shareholders of the parent company 452,106 354,480
33 Non-controlling interest 5,052 2,258 Total equity 457,158 356,738 Total liabilities and equity 1,083,826 886,225

PAO SIBUR HOLDING IFRS CONSOLIDATED STATEMENT OF CASH FLOWS (In millions of Russian roubles, unless otherwise stated)
The accompanying notes on pages 6 to 64 are an integral part of these consolidated financial statements
3
Year ended 31 December Notes 2017 2016
Operating activities 35 Cash from operating activities before income tax payment 172,317 150,606
Income tax paid (19,640) (12,912) 35 Net cash from operating activities 152,677 137,694
Investing activities Purchase of property, plant and equipment (131,765) (141,862) Purchase of intangible assets and other non-current assets (3,496) (3,831)
4 Acquisition of interest in subsidiary, net of cash acquired (2,227) (2,765) 4 Proceeds from disposal of subsidiary, net of cash disposed 22,136 3,445 Income tax paid on the disposal of subsidiary (3,471) -
15 Additional contributions to the share capital of joint ventures and associates (2,075) (4,076)
15 Dividends received 2,247 2,573 Interest received 1,877 672
15, 21 Loans issued (1,493) (1,268) Repayment of loans receivable 971 4,438 Proceeds from sale of property, plant and equipment 65 283 Other (78) 148 Net cash used in investing activities (117,309) (142,243) Financing activities Proceeds from debt 73,411 177,628 Repayment of debt (96,498) (215,569)
23 Loan settlement arrangement - (26,095) Interest paid (14,655) (21,894)
32, 33 Dividends paid (19,709) (16,163) Sale of currency under swap agreements - (10,072) Proceeds under swap agreements - 8,002 Placement of deposits - (3,342) Return of deposits - 3,208 Bank commissions paid (1,707) (3,239)
27 Grants and subsidies received 11,274 1,723 23 Return of deposit under loan settlement arrangement 1,384 -
Proceeds from sale of non-controlling interest - 1,500 Purchase of non-controlling interest - (405) Net cash used in financing activities (46,500) (104,718) Effect of exchange rate changes on cash and cash equivalents (1,047) (2,181) Net decrease in cash and cash equivalents (12,179) (111,448) Cash and cash equivalents, at the beginning of the reporting year 60,635 172,083 Cash and cash equivalents, at the end of the reporting year 48,456 60,635

PAO SIBUR HOLDING IFRS CONSOLIDATED STATEMENT OF CHANGES IN EQUITY (In millions of Russian roubles, unless otherwise stated)
The accompanying notes on pages 6 to 64 are an integral part of these consolidated financial statements
4
Attributable to the shareholders of the parent company
Notes
Share
capital Share
premium
Equity-settled
share-based payment
plans Retained earnings Total
Non-control-
ling interest
Total equity
Balance as of 31 December 2015 21,784 9,357 32,450 193,900 257,491 1,216 258,707
Profit for the year - - - 111,139 111,139 1,950 113,089
Actuarial gain on post-employment benefit obligations - - - 98 98 7 105
Total comprehensive income for the year - - - 111,237 111,237 1,957 113,194
3, 4, 33
Transactions with non-controlling interest in subsidiaries - - - 65 65 935 1,000
32, 33 Dividends - - - (14,313) (14,313) (1,850) (16,163)
Balance as of 31 December 2016 21,784 9,357 32,450 290,889 354,480 2,258 356,738
Profit for the year - - - 116,909 116,909 3,337 120,246
Actuarial loss on post-employment benefit obligations - - - (112) (112) (5) (117)
Total comprehensive income for the year - - - 116,797 116,797 3,332 120,129
32, 33 Dividends - - - (19,171) (19,171) (538) (19,709)
Balance as of 31 December 2017 21,784 9,357 32,450 388,515 452,106 5,052 457,158

PAO SIBUR HOLDING IFRS CONSOLIDATED STATEMENT OF COMPREHENSIVE INCOME (In millions of Russian roubles, unless otherwise stated)
The accompanying notes on pages 6 to 64 are an integral part of these consolidated financial statements
5
Year ended 31 December 2017 2016 Profit for the year 120,246 113,089 Other comprehensive (loss)/income: (117) 105 Items that will not be reclassified to profit or loss:
Actuarial (loss)/gain on post-employment benefit obligations (157) 153 Deferred tax effect 40 (48)
Total comprehensive income for the year 120,129 113,194 Total comprehensive income for the year, including attributable to: 120,129 113,194
Non-controlling interest 3,332 1,957 Shareholders of the parent company 116,797 111,237
PAO SIBUR HOLDING NOTES TO THE IFRS CONSOLIDATED FINANCIAL STATEMENTS (In millions of Russian roubles, unless otherwise stated)
6
1 NATURE OF OPERATIONS
PAO SIBUR Holding (the “Company”) and its subsidiaries (jointly referred to as the “Group”) form a vertically integrated gas processing and petrochemical business. The Group purchases and processes raw materials (primarily associated petroleum gas and natural gas liquids), and produces and markets energy and petrochemical products, both domestically and internationally.
The Group’s overall sales have no material exposure to seasonal factors. The Group’s production facilities are located in the Russian Federation.
2 BASIS OF PREPARATION AND SIGNIFICANT ACCOUNTING POLICIES
Basis of preparation. These consolidated financial statements have been prepared in accordance with International Financial Reporting Standards (IFRS) and interpretations issued by the IFRS Interpretations Committee (IFRS IC). Most of the Group’s companies maintain their accounting records in Russian roubles (RR) and prepare their statutory financial statements in accordance with the Regulations on Accounting and Reporting of the Russian Federation (RAR). The consolidated financial statements are based on the statutory records of Group’s companies, with adjustments and reclassifications recorded to ensure fair presentation in accordance with IFRS.
The consolidated financial statements have been prepared under the historical cost convention, as modified by the initial recognition of financial instruments based on fair value, the revaluation of available-for-sale financial assets, financial assets and liabilities (including derivative instruments) categorised at fair value through profit or loss. The preparation of consolidated financial statements under IFRS requires the use of certain critical accounting estimates. It also requires management to exercise judgement when applying the Group’s accounting policies. Those areas involving a higher degree of judgement or complexity, or where assumptions and estimates are significant to the consolidated financial statements are disclosed in Note 3.
The principal accounting policies applied in the preparation of these consolidated financial statements are set out below. These policies have been consistently applied to all the periods presented, unless otherwise stated.
Consolidated financial statements. Subsidiaries are those investees, including structured entities, that the Group controls because the Group has (i) the power to direct relevant activities of the investees that significantly affect their returns, (ii) exposure, or rights, to variable returns from its involvement with the investees, and (iii) the ability to use its power over the investees to affect the amount of an investor’s returns. The existence and effect of substantive rights, including substantive potential voting rights, are considered when assessing whether the Group has power over another entity. For a right to be substantive, the holder must have the practical ability to exercise that right when decisions about the direction of the relevant activities of the investee need to be made. The Group may have power over an investee even when it holds less than a majority of voting power in an investee. In such cases, the Group assesses the size of its voting rights relative to the size and dispersion of holdings of the other vote holders to determine if it has de-facto power over the investee. Protective rights of other investors, such as those that relate to fundamental changes in an investee’s activities or apply only in exceptional circumstances, do not prevent the Group from controlling an investee. Subsidiaries are consolidated from the date on which control is transferred to the Group (acquisition date) and are deconsolidated from the date on which such control ceases.
The acquisition method of accounting is used to account for the acquisition of subsidiaries. Identifiable assets acquired, as well as liabilities and contingent liabilities assumed in a business combination are measured at their fair values at the acquisition date, regardless of the extent of any non-controlling interest.
The Group measures non-controlling interest on a transaction-by-transaction basis, either at: a) fair value, or b) the non-controlling interest’s proportionate share of the acquiree’s net assets.

PAO SIBUR HOLDING NOTES TO THE IFRS CONSOLIDATED FINANCIAL STATEMENTS (In millions of Russian roubles, unless otherwise stated)
7
2 BASIS OF PREPARATION AND SIGNIFICANT ACCOUNTING POLICIES (CONTINUED)
Goodwill is measured by deducting the acquiree’s net assets from the aggregate amount of the consideration transferred for the acquiree, as well as the amount of non-controlling interest in the acquiree and the fair value of the interest in the acquiree held immediately before the acquisition date. Any negative amount (“negative goodwill”) is recognized in profit or loss after management reassesses whether it identified all the assets acquired, all liabilities and contingent liabilities assumed, and reviews the appropriateness of their measurement.
The consideration transferred for the acquiree is measured at the fair value of the assets released, equity instruments issued, and liabilities incurred or assumed, including the fair values of assets or liabilities from contingent consideration arrangements, but excludes acquisition-related costs such as fees for advisory, legal, valuation and similar professional services. Transaction costs related to an acquisition and incurred for issuing equity instruments are deducted from equity; transaction costs incurred for issuing debt as part of a business combination are deducted from the carrying amount of the debt and all other transaction costs associated with the acquisition are expensed.
Intercompany transactions, balances and unrealised gains on transactions between Group companies are eliminated. In addition, unrealised losses are also eliminated unless the relevant cost cannot be recovered. The Company and all of its subsidiaries use uniform accounting policies that are consistent with the Group’s policies.
Non-controlling interest is the part of a subsidiary’s net results and equity that is attributable to interests that the Group does not own, either directly or indirectly. Non-controlling interest forms a separate component of the Group’s equity.
Assets and disposal groups classified as held for sale. Assets and disposal groups (which may include both non-current and current assets) are classified in the consolidated statement of financial position as “assets classified as held for sale” if their carrying amount will be recovered principally through a sale transaction (including loss of control over the subsidiary holding the assets) within 12 months after the reporting period and a sale is considered highly probable. They are stated at the lower of carrying amount and fair value less costs to sell.
Non-current assets or disposal groups classified as held for sale in the current period’s consolidated statement of financial position are not reclassified or presented again in the comparative consolidated statement of financial position to reflect the classification at the end of the current period.
Liabilities directly associated with the disposal group that will be transferred in the disposal transaction are reclassified and presented separately in the consolidated statement of financial position.
Property, plant and equipment. Property, plant and equipment items are stated at cost, restated to the equivalent purchasing power of the Russian rouble as of 31 December 2002 for assets acquired prior to 1 January 2003, less accumulated depreciation and provision for impairment, wherever required.
Costs for minor repairs and day-to-day maintenance are expensed when incurred. The cost for replacing major parts or components of property, plant and equipment items is capitalised when it is probable that future economic benefits will flow to the Group, the cost of the item can be measured reliably, and the replaced part has been taken out of commission and derecognized. Gains and losses on disposals determined by comparing proceeds with carrying amounts are recognised in profit or loss.
An asset’s carrying amount is immediately recorded to its recoverable amount if the asset’s carrying amount is greater than its estimated recoverable amount.
PAO SIBUR HOLDING NOTES TO THE IFRS CONSOLIDATED FINANCIAL STATEMENTS (In millions of Russian roubles, unless otherwise stated)
8
2 BASIS OF PREPARATION AND SIGNIFICANT ACCOUNTING POLICIES (CONTINUED)
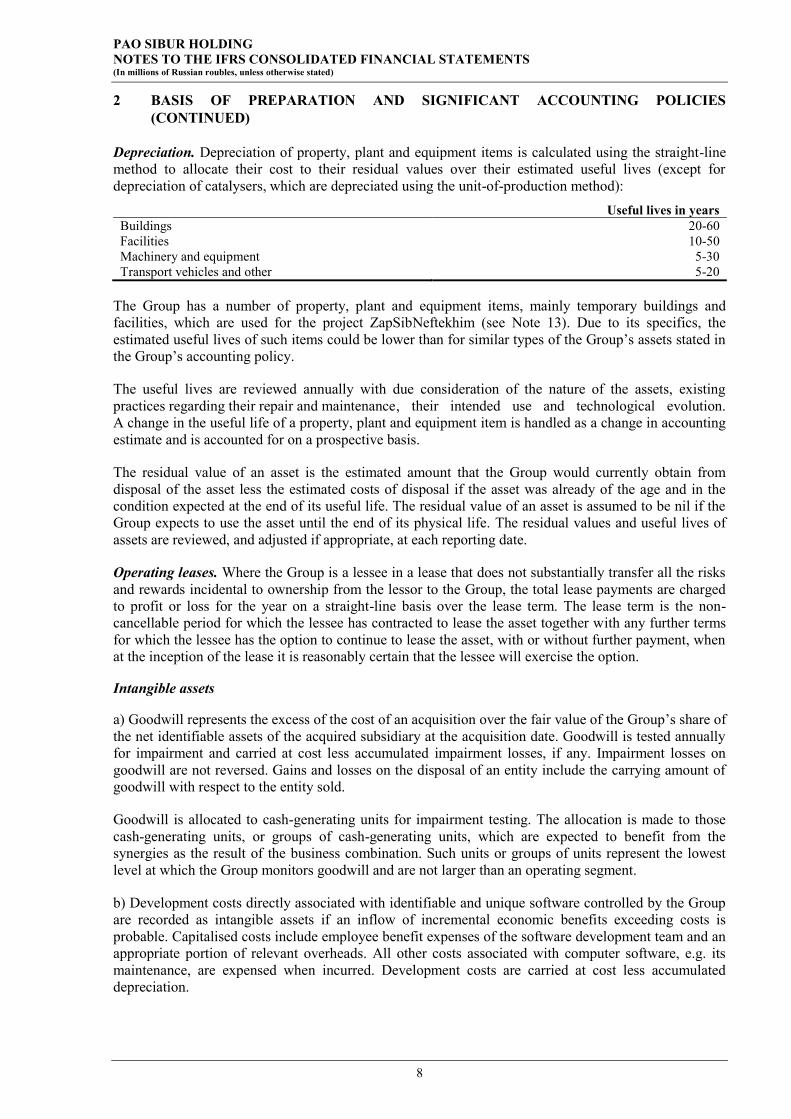
Depreciation. Depreciation of property, plant and equipment items is calculated using the straight-line method to allocate their cost to their residual values over their estimated useful lives (except for depreciation of catalysers, which are depreciated using the unit-of-production method):
Useful lives in years Buildings 20-60 Facilities 10-50 Machinery and equipment 5-30 Transport vehicles and other 5-20
The Group has a number of property, plant and equipment items, mainly temporary buildings and facilities, which are used for the project ZapSibNeftekhim (see Note 13). Due to its specifics, the estimated useful lives of such items could be lower than for similar types of the Group’s assets stated in the Group’s accounting policy.
The useful lives are reviewed annually with due consideration of the nature of the assets, existing practices regarding their repair and maintenance , their intended use and technological evolution. A change in the useful life of a property, plant and equipment item is handled as a change in accounting estimate and is accounted for on a prospective basis.
The residual value of an asset is the estimated amount that the Group would currently obtain from disposal of the asset less the estimated costs of disposal if the asset was already of the age and in the condition expected at the end of its useful life. The residual value of an asset is assumed to be nil if the Group expects to use the asset until the end of its physical life. The residual values and useful lives of assets are reviewed, and adjusted if appropriate, at each reporting date.
Operating leases. Where the Group is a lessee in a lease that does not substantially transfer all the risks and rewards incidental to ownership from the lessor to the Group, the total lease payments are charged to profit or loss for the year on a straight-line basis over the lease term. The lease term is the non-cancellable period for which the lessee has contracted to lease the asset together with any further terms for which the lessee has the option to continue to lease the asset, with or without further payment, when at the inception of the lease it is reasonably certain that the lessee will exercise the option.
Intangible assets
a) Goodwill represents the excess of the cost of an acquisition over the fair value of the Group’s share of the net identifiable assets of the acquired subsidiary at the acquisition date. Goodwill is tested annually for impairment and carried at cost less accumulated impairment losses, if any. Impairment losses on goodwill are not reversed. Gains and losses on the disposal of an entity include the carrying amount of goodwill with respect to the entity sold.
Goodwill is allocated to cash-generating units for impairment testing. The allocation is made to those cash-generating units, or groups of cash-generating units, which are expected to benefit from the synergies as the result of the business combination. Such units or groups of units represent the lowest level at which the Group monitors goodwill and are not larger than an operating segment.
b) Development costs directly associated with identifiable and unique software controlled by the Group are recorded as intangible assets if an inflow of incremental economic benefits exceeding costs is probable. Capitalised costs include employee benefit expenses of the software development team and an appropriate portion of relevant overheads. All other costs associated with computer software, e.g. its maintenance, are expensed when incurred. Development costs are carried at cost less accumulated depreciation.

PAO SIBUR HOLDING NOTES TO THE IFRS CONSOLIDATED FINANCIAL STATEMENTS (In millions of Russian roubles, unless otherwise stated)
9
2 BASIS OF PREPARATION AND SIGNIFICANT ACCOUNTING POLICIES (CONTINUED)
c) Research expenditure is recognized as an expense when incurred. Costs incurred on development projects (relating to the design and testing of new or improved products) are recognized as intangible assets when it is probable that the project will be a success considering its commercial and technological feasibility, and costs can be measured reliably. Other development expenditures are recognized as an expense as incurred. Development costs previously recognized as an expense are not recognized as an asset in a subsequent period.
d) Other intangible assets with finite useful lives are carried at cost less accumulated amortisation.
Amortisation is calculated using the straight-line method to allocate the cost of intangible assets over their estimated useful lives. Supply contracts are amortised during the contract maturity from 5 to 19 years. The useful lives are reviewed annually taking into consideration the nature of the intangible assets. Annually, at each reporting date, management assesses whether there is any indication of impairment of intangible assets. If impaired, the carrying amount of intangible assets is written down to the higher of value in use and fair value less costs to sell.
Impairment of non-financial assets. Assets with an indefinite useful life, goodwill for example, are not subject to amortisation and are tested annually for impairment. Assets subject to depreciation or amortisation are reviewed for impairment whenever events or changes in circumstances indicate that the carrying amount may not be recoverable. An impairment loss is recognized for the amount by which the asset’s carrying amount exceeds its recoverable amount. The recoverable amount is the higher of an asset’s fair value less costs to sell and value in use. For the purposes of assessing impairment, assets are grouped at the lowest levels for which there are separately identifiable cash flows (cash-generating units). Non-financial assets other than goodwill that have suffered impairment are reviewed for possible reversal of the impairment at each reporting date.
Joint arrangements. Under IFRS 11 investments in joint arrangements are classified as either joint operations or joint ventures depending on the contractual rights and obligations of each investor. The Group has assessed the nature of its joint arrangements and determined them to be joint ventures. Investments in joint ventures are accounted for by the equity method of accounting and are initially recognized at cost. Dividends received from joint ventures reduce the carrying value of the investment in joint ventures. The carrying amount of joint ventures includes goodwill identified on acquisition less accumulated impairment losses, if any. The Group’s share of the post-acquisition profit or loss of joint ventures is recorded in profit or loss for the year as a share of the net income of joint ventures. The Group’s share of other post-acquisition comprehensive income of joint ventures is recognized in the Group’s other comprehensive income.
When the Group’s share of losses in a joint venture equals or exceeds its interest in the joint venture, including any other unsecured receivables, the Group does not recognize any further losses, unless it has incurred obligations or made payments on behalf of the joint venture.
Unrealized gains on transactions between the Group and its joint ventures are eliminated to the extent of the Group’s interest in the joint ventures. In addition, unrealized losses are also eliminated unless the transaction provides evidence of an impairment of the asset transferred.
Associates. Associates are entities over which the Group has significant influence (directly or indirectly), but not control, generally resulting from a shareholding of between 20 and 50 percent of voting rights. Investments in associates are accounted for using the equity method of accounting and are initially recognized at cost. Dividends received from associates reduce the carrying value of investments in associates. The carrying amount of associates includes goodwill identified on acquisition less accumulated impairment losses, if any. The Group’s share of the post-acquisition profit or loss of associates is recorded in profit or loss for the year as a share of the net income of associates. The Group’s share of other post-acquisition comprehensive income of associates is recognized in the Group’s other comprehensive income.
PAO SIBUR HOLDING NOTES TO THE IFRS CONSOLIDATED FINANCIAL STATEMENTS (In millions of Russian roubles, unless otherwise stated)
10
2 BASIS OF PREPARATION AND SIGNIFICANT ACCOUNTING POLICIES (CONTINUED)
When the Group’s share of the losses of an associate equals or exceeds its interest in an associate, including any other unsecured receivables, the Group does not recognise any further losses, unless it has incurred obligations or made payments on behalf of the associate.
Unrealised gains on transactions between the Group and its associates are eliminated to the extent of the Group’s interest in the associates. In addition, unrealised losses are also eliminated unless the transaction provides evidence of an impairment of the asset transferred.
Disposals of subsidiaries, associates or joint ventures. When the Group ceases to have control or significant influence, any retained interest in the entity is remeasured to its fair value at the date when control is lost, with the change in carrying amount recognised in profit or loss. The fair value is the initial carrying amount for the purposes of subsequently accounting for the retained interest as an associate, joint venture or financial asset. In addition, any amounts previously recognised in other comprehensive income in respect of that entity, are accounted for as if the Group had directly disposed of the related assets or liabilities. This may mean that amounts previously recognised in other comprehensive income are reclassified to profit or loss.
If the ownership interest in an associate is reduced but significant influence is retained, only a proportionate share of the amounts previously recognised in other comprehensive income are reclassified to profit or loss where appropriate.
Loans and receivables. Loans and receivables are recognized initially at fair value plus transaction costs and subsequently measured at amortised cost using the effective interest method amount less a provision made for impairment of these receivables.
Prepayments. Prepayments are carried at cost less provision for impairment. A prepayment is classified as non-current when the goods or services relating to the prepayment are expected to be obtained after one year, or when the prepayment relates to an asset which will itself be classified as non-current upon initial recognition. Prepayments to acquire assets are transferred to the carrying amount of an asset once the Group has obtained control of the asset and it is probable that future economic benefits associated with the asset will flow to the Group. Other prepayments are written off to profit or loss when the goods or services relating to the prepayments are received. If there is an indication that the assets, goods or services relating to a prepayment will not be received, the carrying value of the prepayment is recorded accordingly and a corresponding impairment loss is recognized in profit or loss for the year.
Inventories. Inventories are recorded at the lower of cost and net realisable value. The cost of inventory is assigned on a weighted average basis. The cost of finished goods and work in progress comprises raw material, direct labour, other direct costs and related production overheads, but nonetheless excludes borrowing costs. Net realisable value is the estimated selling price in the ordinary course of business, less the cost of completion and selling expenses.
Cash and cash equivalents. Cash and cash equivalents include cash in hand, deposits held on call with banks, and other short-term, highly liquid investments with original maturities of three months or less. Cash and cash equivalents are carried at amortised cost using the effective interest method. Restricted balances are excluded from cash and cash equivalents for the purposes of the consolidated statement of cash flows. Balances restricted from being exchanged or used to settle a liability for at least 12 months after the reporting period are included in other non-current assets. Foreign exchange gains and losses from deposits held on call with banks are classified as foreign exchange gains or losses from operating activities.
Cash inflows and outflows related to long-term deposits are classified within financing activities.

PAO SIBUR HOLDING NOTES TO THE IFRS CONSOLIDATED FINANCIAL STATEMENTS (In millions of Russian roubles, unless otherwise stated)
11
2 BASIS OF PREPARATION AND SIGNIFICANT ACCOUNTING POLICIES (CONTINUED)
Trade and other payables. Trade payables are accrued when a single counterparty has performed its obligations under a relevant contract, and are recognized initially at fair value plus transaction costs and subsequently carried at amortised cost using the effective interest method.
Provisions for liabilities and charges. Provisions for liabilities and charges are recognized when the Group has a present legal or constructive obligation as a result of past events, and it is probable that an outflow of resources will be required to settle the obligation and so that a reliable estimate of the relevant amount can be made. Where there are a number of similar obligations, the likelihood that an outflow will be required in settlement is determined by considering the class of obligations as a whole.
A provision is recognized even if there is little likelihood of an outflow connected to any item included in the same class of obligations. Where the Group expects a provision to be reimbursed, under an insurance contract for example, the reimbursement is recognized as a separate asset but only when reimbursement is virtually certain. Provisions are reassessed at each reporting date and changes in the provisions are reflected in the profit or loss.
Provisions are measured at the present value of the expenditures expected to be required in order to settle the obligation using a pre-tax rate that reflects current market assessments of the time value of money and the risks specific to the obligation. The increase in a provision due to passage of time is recognized as interest expense.
Value added tax. Output value added tax (VAT) related to sales is payable to the relevant tax authorities upon the earlier of a) collection of receivables from customers or b) delivery of goods or services to customers. Input VAT is generally recoverable against output VAT upon receipt of the relevant VAT invoice. The Russian tax authorities permit the settlement of VAT on a net basis. VAT related to sales and purchases that have not been settled at the reporting date (VAT recoverable and payable) is recognized on a gross basis and disclosed separately as a current asset and current liability, respectively. Where a provision has been made for impairment of receivables, an impairment loss is recorded for the gross amount of the debtor, including VAT. The related VAT liability is maintained until the debt is written off for tax purposes.
Grants and subsidies. Grants and subsidies are recognized at their fair value where there is a reasonable assurance that the grant will be received and the Group will comply with all accompanying conditions. Grants and subsidies related to the purchase of property, plant and equipment are included in non-current liabilities as deferred income and are credited to the profit or loss: a) on a straight-line basis over the expected lives of the related assets, or b) in full when the assets are sold. Grants and subsidies received as compensation for non-capital expense are credited to profit or loss reducing the corresponding expense.
Where grants are seen as a mechanism to finance acquisition of property, plant and equipment the cash inflows are shown as a financing activity.
Debt. Debt is recognized initially at fair value, net of transaction costs incurred. Debt is subsequently carried at amortised cost. Any difference between the proceeds (net of transaction costs) and the redemption value is recognized in the consolidated statement of profit or loss over the period of the debt using the effective interest method.
Fees paid for the establishment of loan facilities are recognized as transaction costs of the loan to the extent that it is probable that some or all of the facility will be drawn down. In this case, the fee is deferred until the draw-down occurs and presented as prepaid borrowing costs. The split-off between the short-term and long-term portion of prepaid borrowing cost is performed based on the expected schedule of the related financing withdrawal.

PAO SIBUR HOLDING NOTES TO THE IFRS CONSOLIDATED FINANCIAL STATEMENTS (In millions of Russian roubles, unless otherwise stated)
12
2 BASIS OF PREPARATION AND SIGNIFICANT ACCOUNTING POLICIES (CONTINUED)
To the extent there is no evidence of the probability that some or all of the facility will be drawn down, the fee is capitalised as a pre-payment for liquidity services and amortised over the period of the relevant facility.
Capitalisation of borrowing costs. Borrowing costs directly attributable to the acquisition, construction or production of assets that require considerable time to be prepared for their intended use or sale (qualifying assets) are capitalised as part of the costs for such assets if the commencement date for capitalisation occurred on or after 1 January 2009.
Capitalisation of borrowing costs continues up to the date when the assets are substantially ready for their use or sale.
The Group capitalises borrowing costs that could have been avoided if it had not made capital expenditures on qualifying assets. Capitalised borrowing costs are calculated at the Group’s average funding cost (the weighted average interest cost is applied to the expenditures on the qualifying assets), except to the extent that funds are borrowed specifically for the purpose of obtaining a qualifying asset. Where this occurs, actual borrowing costs incurred, less any investment income on the temporary investment of the borrowings, are capitalised.
Share capital. Ordinary shares are classified as equity. Incremental costs directly attributable to the issue of new shares are shown in equity as a deduction, net of tax, from the proceeds. Any excess of the fair value of consideration received over the par value of shares issued is presented as share premium.
Where the Group companies purchase the Company’s equity share capital, the consideration paid including any attributable transaction costs net of income taxes is deducted from total shareholders’ equity until the equity instruments are cancelled, sold or reissued. Where such shares are subsequently sold or reissued, any consideration received net of any directly attributable incremental transaction costs and the related income tax effects is included in shareholders’ equity. The gains (losses) arising from treasury shares transactions are recognized in the consolidated statement of changes in shareholders’ equity, net of associated costs including taxation.
Earnings per share. Earnings per share are determined by dividing the profit or loss attributable to equity holders of the Company by the weighted average number of participating shares outstanding during the reporting year.
Dividends. Dividends are recognized as a liability and deducted from equity at the reporting date only if they are declared before or on the reporting date. Dividends are disclosed when declared after the reporting date but before the consolidated financial statements are authorised for issue.
Purchases and sales of non-controlling interests. The Group applies the economic entity model to account for transactions with owners of non-controlling interests. The Group recognises the difference between the purchase consideration and the carrying amount of non-controlling interests acquired and records it as a capital transaction directly in equity. Any difference between the sales consideration and carrying amount of non-controlling interests sold is also recognized as a capital transaction in the consolidated statement of changes in equity.
Current and deferred income tax. Income taxes are covered in the consolidated financial statements in accordance with Russian law as enacted, or substantively enacted, by the reporting date. The income tax charge or credit comprises current tax and deferred tax, and is recognized in profit or loss, unless it is recognized in other comprehensive income or directly in equity because it relates to transactions that are recognized, in the same or a different period, in other comprehensive income or directly in equity.
PAO SIBUR HOLDING NOTES TO THE IFRS CONSOLIDATED FINANCIAL STATEMENTS (In millions of Russian roubles, unless otherwise stated)
13
2 BASIS OF PREPARATION AND SIGNIFICANT ACCOUNTING POLICIES (CONTINUED)
Current income tax is the amount expected to be paid to or refunded by the tax authorities on taxable profits or losses for the current and prior periods. Deferred income tax is recognized using the balance sheet liability method for tax loss carry-forwards and temporary differences arising between the tax bases of assets and liabilities and their carrying amounts for financial reporting purposes. Under the initial recognition exemption, deferred taxes are not recorded for temporary differences on initial recognition of an asset or liability in a transaction other than a business combination if the transaction, when initially recorded, affects neither accounting nor taxable profit.
Deferred tax assets and liabilities are netted only within individual Group companies. Deferred tax assets for deductible temporary differences and tax loss carry-forwards are recorded only to the extent that there are sufficient taxable temporary differences, or that it is probable there will be future taxable profit against which the deductions can be utilised.
The Group controls the reversal of temporary differences relating to taxes chargeable on dividends from subsidiaries or on gains at their disposal. The Group does not recognise deferred tax liabilities on such temporary differences except to the extent that management expects the temporary differences to reverse in the foreseeable future.
Taxes other than income tax, including VAT and excise tax are recorded within operating expenses.
Post-employment obligations. Some Group companies provide retirement benefits to their retired employees. Entitlement to these benefits is usually conditional on the employee remaining in service up to retirement age and the completion of a minimum service period. The expected costs of such benefits are accrued over the period of employment using the same accounting methodology used for defined benefit pension plans. Actuarial gains and losses arising from experience adjustments and changes in actuarial assumptions are charged or credited to equity in other comprehensive income in the period in which they arise. These obligations are valued annually by independent qualified actuaries.
Employee benefits. Wages, salaries and contributions to the Russian Federation state pension and social insurance funds, paid annual leave and sick leave, bonuses, and non-monetary benefits (such as health services and kindergarten services) are accrued in the year in which the associated services are rendered by the Group’s employees.
Equity-settled share-based payment plans. The share option programme allows the Group’s management to hold shares in the Company. The fair value of the options is measured at the grant date and is spread over the period during which the employees become unconditionally entitled to the options. The fair value of the options granted is measured at the fair value for the underlying shares calculated at the grant date using a valuation model that takes into account the terms and conditions of the options granted. Each tranche is accounted for as a separate arrangement and expensed, together with a corresponding increase in shareholder’s equity, on a straight-line basis over the vesting periods.
Revenue recognition. Revenues from sales of goods are recognized for financial reporting purposes at the point of transfer of ownership risks and rewards, normally when the goods are shipped. If the Group agrees to transport goods to a specified location, revenue is recognized when the goods are delivered to the customer at the destination point. In an agency relationship, the gross inflows of economic benefits include amounts collected on behalf of the principal which do not result in increases in equity for the Group. Thus, revenue for such arrangements is the commission, received by the agent, and accounted on net basis.
Sales are shown net of VAT, excise tax, export duties and other similar mandatory payments. Revenues are measured at the fair value of the consideration received or receivable.
Interest income is recognized on a time-proportion basis using the effective interest method.

PAO SIBUR HOLDING NOTES TO THE IFRS CONSOLIDATED FINANCIAL STATEMENTS (In millions of Russian roubles, unless otherwise stated)
14
2 BASIS OF PREPARATION AND SIGNIFICANT ACCOUNTING POLICIES (CONTINUED)
Construction contracts. Contract costs are recognized as expenses in the period in which they are incurred. When the outcome of a construction contract cannot be estimated reliably, contract revenue is recognized only to the extent of contract costs incurred that are likely to be recoverable. When the outcome of a construction contract can be estimated reliably and it is probable that the contract will be profitable, contract revenue is recognized over the period of the contract. When it is probable that total contract costs will exceed total contract revenue, the expected loss is recognized as an expense immediately. Variations in contract work, claims and incentive payments are included in contract revenue to the extent that has been agreed with the customer and the amounts are capable of being reliably measured.
The Group uses the ‘percentage-of-completion’ method to determine the appropriate amount of revenue to recognize in a given period. The stage of completion is measured by reference to the contract costs incurred up to the statement of financial position date as a percentage of total estimated costs for each contract. Costs incurred in the year in connection with future activity on a contract are excluded from contract costs in determining the stage of completion. They are presented as inventories, prepayments or other assets, depending on their nature.
The Group presents as an asset the gross amount due from customers for contract work for all contracts in progress for which costs incurred plus recognized profits (less recognized losses) exceed progress billings, which are acts of services rendered signed by customers. Progress billings not yet paid by customers and retentions are included within trade accounts receivable. The Group presents as a liability the gross amount due to customers for contract work for all contracts in progress for which progress billings exceed costs incurred plus recognized profits (less recognized losses).
Classification of financial assets. The Group classifies its financial assets in the following categories: at fair value through profit or loss, loans and receivables, and available for sale. The classification depends on the purpose for which the financial assets were acquired. Management determines the classification of its financial assets at initial recognition.
a) Financial assets at fair value through profit or loss
Financial assets at fair value through profit or loss are financial assets held for trading. A financial asset is classified in this category if it was acquired principally for the purpose of selling in the short term. Derivatives are also categorised as financial assets at fair value through profit or loss. Assets in this category are classified as current assets as they are expected to be settled within 12 months from the reporting date. Gains or losses arising from changes in the fair value of the “financial assets at fair value through profit or loss” category are presented in the profit or loss in the period in which they arise.
b) Loans and receivables
Loans and receivables are non-derivative financial assets with fixed or determinable payments that are not quoted on an active market. They are included in current assets, except for maturities greater than 12 months after the reporting date, which are classified as non-current assets.
The Group’s loans and receivables include trade and other receivables, loans and notes receivable, and cash and cash equivalents in the consolidated statement of financial position.
c) Available-for-sale financial assets
Available-for-sale financial assets are non-derivatives that are either designated in this category or not classified in any of the other categories. They are included in non-current assets unless management intends to dispose of the investment within 12 months from the reporting date.
PAO SIBUR HOLDING NOTES TO THE IFRS CONSOLIDATED FINANCIAL STATEMENTS (In millions of Russian roubles, unless otherwise stated)
15
2 BASIS OF PREPARATION AND SIGNIFICANT ACCOUNTING POLICIES (CONTINUED)
Available-for-sale investments are carried at fair value. Interest income on available-for-sale debt securities is calculated using the effective interest method and recognized in profit or loss for the year as finance income. All other elements of changes in the fair value are recognized in other comprehensive income until the investment is derecognized or impaired at which time the cumulative gain or loss is reclassified from other comprehensive income to other operating income in profit or loss for the year.
Impairment losses are recognized in profit or loss for the year when incurred as a result of one or more events (“loss events”) that occurred after the initial recognition of available-for-sale investments. A significant or prolonged decline in the fair value of an equity security below its cost is an indicator that it is impaired. The cumulative impairment loss – measured as the difference between the acquisition cost and the current fair value, less any impairment loss on that asset previously recognized in profit or loss – is reclassified from other comprehensive income to other operating expenses in profit or loss for the year.
Impairment losses on equity instruments are not reversed and any subsequent gains are recognized in other comprehensive income. If, in a subsequent period, the fair value of a debt instrument classified as available-for-sale increases and the increase can be objectively related to an event occurring after the impairment loss was recognized in profit or loss, the impairment loss is reversed through current period’s profit or loss.
Classification of financial liabilities. Financial liabilities have the following measurement categories: a) held for trading, which also includes financial derivatives, and b) other financial liabilities. Liabilities held for trading are carried at fair value with changes in value recognized in profit or loss for the year (as finance income or finance expenses) in the period in which they arise. Other financial liabilities are carried at amortised cost. The Group’s other financial liabilities comprise of ‘trade and other payables’ and ‘long-term and short-term debt in the consolidated statement of financial position.
Financial instruments – key measurement terms. Depending on their classification financial instruments are carried at fair value or amortised cost as described below.
Fair value is the price that would be received from selling an asset or paid to transfer a liability in an orderly transaction between market participants at the measurement date. The best evidence of fair value is a price quoted in an active market. An active market is one where transactions for the asset or liability take place with sufficient frequency and volume to provide pricing information on an ongoing basis.
The fair value of financial instruments traded in an active market is measured as the product of the quoted price for the individual asset or liability and the quantity held by the entity. This is the case even if a market’s normal daily trading volume is insufficient to absorb the quantity held and placing orders to sell the position in a single transaction might affect the quoted price.
A portfolio of other financial assets and liabilities that are not traded in an active market is measured at the fair value of a group of financial assets and financial liabilities on the basis of the price that would be received from selling a net long position (i.e. an asset) for a particular risk exposure or paid to transfer a net short position (i.e. a liability) for a particular risk exposure in an orderly transaction between market participants at the measurement date.
This is applicable for assets carried at fair value on a recurring basis if the Group: (a) manages the group of financial assets and financial liabilities on the basis of the entity’s net exposure to a particular market risk (or risks) or to the credit risk of a particular counterparty in accordance with the entity’s documented risk management or investment strategy; (b) it provides information on that basis about the group of assets and liabilities to the entity’s key management personnel; and (c) the market risks, including duration of the entity’s exposure to a particular market risk (or risks) arising from the financial assets and financial liabilities is substantially the same.

PAO SIBUR HOLDING NOTES TO THE IFRS CONSOLIDATED FINANCIAL STATEMENTS (In millions of Russian roubles, unless otherwise stated)
16
2 BASIS OF PREPARATION AND SIGNIFICANT ACCOUNTING POLICIES (CONTINUED)
Valuation techniques such as discounted cash flow models or models based on recent arm’s length transactions or consideration of the investees’ financial data are used to measure the fair value of certain financial instruments for which external market pricing information is unavailable. Fair value measurements are analysed according to their levels in the fair value hierarchy as follows: (i) level one are measurements based on quoted prices (unadjusted) in active markets for identical assets or liabilities, (ii) level two measurements are valuation techniques with all material inputs observable for the given asset or liability, either directly (that is, as prices) or indirectly (that is, derived from prices), and (iii) level three measurements are valuations not based on solely observable market data (that is, the measurement requires significant unobservable inputs). No transfers between the levels of the fair value hierarchy are deemed to have occurred during the reporting period.
Transaction costs are incremental costs that are directly attributable to the acquisition, issue or disposal of a financial instrument. An incremental cost is one that would not have been incurred if the transaction had not taken place. Transaction costs include fees and commissions paid to agents (including employees acting as selling agents), advisers, brokers and dealers, levies by regulatory agencies and securities exchanges, and transfer taxes and duties. Transaction costs do not include debt premiums or discounts, financing costs or internal administrative or holding costs.
Amortised cost is the amount at which the financial instrument was recognized at initial recognition less any principal repayments, plus accrued interest, and for financial assets less any write-down for incurred impairment losses. Accrued interest includes amortisation of transaction costs deferred at initial recognition and of any premium or discount to maturity amount using the effective interest method. Accrued interest income and accrued interest expense, including both accrued coupon and amortised discount or premium (including fees deferred at origination, if any), are not presented separately and are, instead, included in the carrying values of related items in the consolidated statement of financial position.
The effective interest method is a method for allocating interest income or interest expense over the relevant period, so as to achieve a constant periodic rate of interest (effective interest rate) on the carrying amount. The effective interest rate is the rate that exactly discounts estimated future cash payments or receipts (excluding future credit losses) through the expected life of the financial instrument or a shorter period, if appropriate, to the net carrying amount of the financial instrument. The effective interest rate discounts cash flows of variable interest instruments to the next date for establishing a new interest price, except for the premium or discount which reflects the credit spread over the floating rate specified in the instrument, or other variables that are not reset to market rates. Such premiums or discounts are amortised over the whole expected life of the instrument. The present value calculation includes all fees paid or received between parties to the contract which are an integral part of the effective interest rate.
Derivative financial instruments, including interest rate futures, forward rate agreements, currency and interest rate swaps, currency and interest rate options are carried at their fair value. All derivative instruments are carried as assets when fair value is positive and as liabilities when fair value is negative. Changes in the fair value of derivative instruments are included in profit or loss for the year. The Group does not apply hedge accounting.

PAO SIBUR HOLDING NOTES TO THE IFRS CONSOLIDATED FINANCIAL STATEMENTS (In millions of Russian roubles, unless otherwise stated)
17
2 BASIS OF PREPARATION AND SIGNIFICANT ACCOUNTING POLICIES (CONTINUED)
Impairment of financial assets carried at amortised cost. Impairment losses are recognized in profit or loss when incurred as a result of one or more events (hereinafter “loss events”) that occurred after the initial recognition of the financial asset and which have an impact on the amount or timing of the estimated future cash flows of the financial asset or group of financial assets that can be reliably estimated. If the Group determines that no objective evidence exists that impairment was incurred for an individually assessed financial asset, whether significant or not, it includes the given asset in a group of financial assets with similar credit risk characteristics, and then collectively assesses them for impairment. The primary factors that the Group considers in determining whether a financial asset is impaired are its overdue status and the realisability of related collateral, if any. The following other principal criteria are also used to determine whether there is objective evidence that an impairment loss has occurred:
any portion or instalment is overdue and the late payment cannot be attributed to a delay caused by settlement systems;
the counterparty experiences a significant financial difficulty as evidenced by its financial information which the Group has obtained;
the counterparty is considering bankruptcy or a financial reorganisation;
there is an adverse change in the payment status of the counterparty as a result of changes in national or local economic conditions that impact the counterparty; or
the value of collateral, if any, significantly decreases as a result of deteriorating market conditions.
If the terms of an impaired financial asset held at amortized cost are renegotiated or otherwise modified because of the counterparty’s financial difficulties, impairment is measured using the original effective interest rate before the modification of terms. Impairment losses are always recognized through an allowance account to write down the asset’s carrying amount to the present value of expected cash flows (which exclude future credit losses that have not been incurred) discounted at the original effective interest rate of the asset. The calculation of the present value of the estimated future cash flows of a collateralized financial asset reflects the cash flows that may result from foreclosure less costs for obtaining and selling the collateral, whether or not foreclosure is probable.
If, in a subsequent period, the amount of the impairment loss decreases and the decrease can be related objectively to an event occurring after the impairment was recognized (such as an improvement in the debtor’s credit rating), the previously recognized impairment loss is reversed by adjusting the allowance account through profit or loss.
Uncollectible assets are written off against the related impairment loss provision after all necessary procedures for recovering the asset have been completed and the amount of the loss has been determined. Subsequent recoveries of amounts previously written off are credited to the impairment loss account within the profit or loss for the year.
Foreign currency transactions. The functional currency of each of the Group’s consolidated entities is the currency of the primary economic environment in which the given entity operates. The functional currency of the Company and most of its subsidiaries (including SIBUR International GmbH, an export trading company of the Group) and the Group’s presentation currency, is the national currency of the Russian Federation, the Russian rouble (RR).
Monetary assets and liabilities held by Group entities as of 31 December 2017 and 2016 and denominated in foreign currencies are translated into RR at the exchange rate prevailing at that date. Foreign currency transactions are accounted for at the exchange rate prevailing at the date of the transaction. Gains and losses from the settlement of such transactions and from the translation of monetary assets and liabilities denominated in a foreign currency are recognized as exchange gains or losses in profit or loss.
PAO SIBUR HOLDING NOTES TO THE IFRS CONSOLIDATED FINANCIAL STATEMENTS (In millions of Russian roubles, unless otherwise stated)
18
2 BASIS OF PREPARATION AND SIGNIFICANT ACCOUNTING POLICIES (CONTINUED)
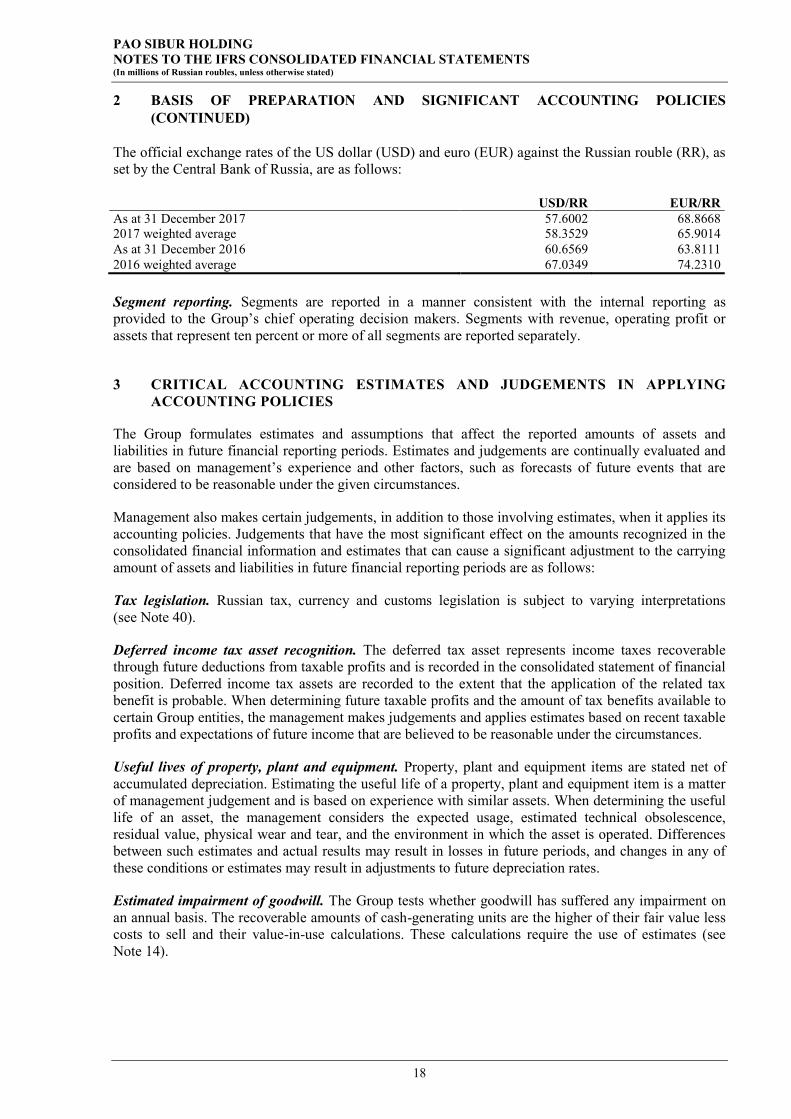
The official exchange rates of the US dollar (USD) and euro (EUR) against the Russian rouble (RR), as set by the Central Bank of Russia, are as follows:
USD/RR EUR/RR As at 31 December 2017 57.6002 68.8668 2017 weighted average 58.3529 65.9014 As at 31 December 2016 60.6569 63.8111 2016 weighted average 67.0349 74.2310
Segment reporting. Segments are reported in a manner consistent with the internal reporting as provided to the Group’s chief operating decision makers. Segments with revenue, operating profit or assets that represent ten percent or more of all segments are reported separately.
3 CRITICAL ACCOUNTING ESTIMATES AND JUDGEMENTS IN APPLYING ACCOUNTING POLICIES
The Group formulates estimates and assumptions that affect the reported amounts of assets and liabilities in future financial reporting periods. Estimates and judgements are continually evaluated and are based on management’s experience and other factors, such as forecasts of future events that are considered to be reasonable under the given circumstances.
Management also makes certain judgements, in addition to those involving estimates, when it applies its accounting policies. Judgements that have the most significant effect on the amounts recognized in the consolidated financial information and estimates that can cause a significant adjustment to the carrying amount of assets and liabilities in future financial reporting periods are as follows:
Tax legislation. Russian tax, currency and customs legislation is subject to varying interpretations (see Note 40).
Deferred income tax asset recognition. The deferred tax asset represents income taxes recoverable through future deductions from taxable profits and is recorded in the consolidated statement of financial position. Deferred income tax assets are recorded to the extent that the application of the related tax benefit is probable. When determining future taxable profits and the amount of tax benefits available to certain Group entities, the management makes judgements and applies estimates based on recent taxable profits and expectations of future income that are believed to be reasonable under the circumstances.
Useful lives of property, plant and equipment. Property, plant and equipment items are stated net of accumulated depreciation. Estimating the useful life of a property, plant and equipment item is a matter of management judgement and is based on experience with similar assets. When determining the useful life of an asset, the management considers the expected usage, estimated technical obsolescence, residual value, physical wear and tear, and the environment in which the asset is operated. Differences between such estimates and actual results may result in losses in future periods, and changes in any of these conditions or estimates may result in adjustments to future depreciation rates.
Estimated impairment of goodwill. The Group tests whether goodwill has suffered any impairment on an annual basis. The recoverable amounts of cash-generating units are the higher of their fair value less costs to sell and their value-in-use calculations. These calculations require the use of estimates (see Note 14).
PAO SIBUR HOLDING NOTES TO THE IFRS CONSOLIDATED FINANCIAL STATEMENTS (In millions of Russian roubles, unless otherwise stated)
19
3 CRITICAL ACCOUNTING ESTIMATES AND JUDGEMENTS IN APPLYING ACCOUNTING POLICIES (CONTINUED)
Estimated impairment of property, plant and equipment and intangible assets excluding goodwill. Property, plant and equipment and intangible assets excluding goodwill are reviewed for impairment whenever events or changes in circumstances indicate that the carrying amount may not be recoverable. For the purposes of assessing impairment, assets are grouped at the lowest levels for which there are separately identifiable cash flows (cash-generating units or CGU).
The recoverable amount of a CGU is the higher of its fair value less costs to sell and its value-in-use calculations, which require the estimation of discounted cash flows. The estimation of cash flows and assumptions considers all information available at the year-end on the future development of the operating business and may deviate from actual future developments. An impairment charge is the difference between the carrying amount and the recoverable CGU amount.
Grants and subsidies. As a major investor in infrastructure and social projects in the regions where it operates, the Group has signed cooperation agreements with several regional authorities, including investment and financial support agreements, under which the Group is entitled to a partial refund of capital expenditures incurred in the respective regions subject to certain conditions. Such reimbursements are made after supporting documents have been submitted to the relevant authority either in the form of an income tax rebate or a direct grant of public funds. Quarterly, at each reporting date, management assesses whether there is a reasonable assurance that the Group is able to comply with the required conditions. The management believes that the Group will be able to comply with the conditions stipulated by the agreements.
Operating leases. The Group has a number of contracts with third parties for the rental of tank wagons (railway cars) with terms of 5-10 years each. At their inception minimum lease payments for some of the contracts were close to the market value of the wagons. At the same time this situation resulted from a shortage of rail cars on the market and the strong negotiating position of service providers. Based on that, and on the fact that the rewards are not substantially transferred to the Group because at the end of the lease period cars will be capable of generating significant cash flow (even if they are subsequently sold or rented at significant discounts), the rented cars are accounted as an operating lease in the consolidated financial statements.
The Group also has a number of arrangements with several shipping companies for freight of eight vessels with terms from 5 to 10 years. At the inception date, the minimum lease payments for contracts were up to 80-85 percent of the value of the vessels and the economic useful life amounted to approximately 30 years. Based on that, and on the fact that the rewards are not substantially transferred to the Group because at the end of the lease period vessels will be capable for generating significant cash flow, the rented vessels are presented as an operating lease in these consolidated financial statements.
Construction contracts. The Group accounts for construction projects, design and engineering projects using the ‘percentage-of-completion’ method. The use of this method requires the Group to estimate the proportional revenue and costs. If circumstances arise that may change the original estimates of revenues, costs, or extent of progress toward completion, estimates are revised. These revisions may result in increases or decreases in estimated revenues or costs and are reflected in profit or loss in the period in which the circumstances that give rise to the revision become known by management. For the years ended 31 December 2017 and 31 December 2016, the Group recognized revenue from the application of the ‘percentage-of-completion method’ of RR 7,988 and RR 1,009, respectively (see Note 10). In addition, receivables related to construction contracts and certain other contracts accounted for under the ‘percentage-of-completion method’ are subject to credit risk. In other words, although some revenue continues to be contractually bound, the customer can still refuse to pay or to pay in time. Where revenue has been validly recognized on a contract, but an uncertainty subsequently arises about the recoverability of the related amount due from the customer, any provision against the amount due is recognized as an expense.

PAO SIBUR HOLDING NOTES TO THE IFRS CONSOLIDATED FINANCIAL STATEMENTS (In millions of Russian roubles, unless otherwise stated)
20
3 CRITICAL ACCOUNTING ESTIMATES AND JUDGEMENTS IN APPLYING ACCOUNTING POLICIES (CONTINUED)
AO NIPIgazpererabotka consolidation. In June 2016, the Company sold a 44 percent ownership interest (representing 50 percent of the voting shares) in the Group’s subsidiary, AO NIPIgazpererabotka (“NIPIGAZ”) to certain companies controlled by some of its shareholders, including those that simultaneously serve as senior Group management. As a result, the effective percentage of NIPIGAZ’s share capital held by the Group decreased to 45 percent (representing 50 percent of the voting shares).
The Group has continued to consolidate NIPIGAZ as it has retained control over its relevant activities as defined by IFRS 10 “Consolidated Financial Statements”. The Group has made a significant judgement that it has retained control over NIPIGAZ as the Group and its key management can cumulatively control a majority of votes at the meetings of NIPIGAZ’s governing bodies. Also, the Group holding 50 percent of the voting shares can block any decisions by NIPIGAZ’s governing bodies.
The difference between the amount of non-controlling interest, calculated as 44 percent of NIPIGAZ’s net assets, and the fair value of the consideration received for the shares sold was recognized in equity attributable to the shareholders of the parent company, in the amount of RR 128 for the year ended 31 December 2016.
OOO SIBUR-Portenergo disposal. In November 2015, the Company sold its 100% interest in OOO SIBUR-Portenergo, the subsidiary of the Group that operates the liquefied petroleum gas and naphtha transshipment terminal located in Ust-Luga, Leningrad Region (“Terminal”), to Baltic Sea Transshipment PTE. Ltd (“Buyer”), a company established by a consortium of Russian and international investors, including the Russian Direct Investment Fund (see Note 4).
After the disposal, OOO Management company SIBUR-Portenergo (“Management Company”), a subsidiary of the Group, manages Terminal operations for a service fee. The Buyer is entitled to terminate the service contract with the Management Company at any time.
The Buyer makes decisions regarding all relevant Terminal activities, as defined by IFRS 10 “Consolidated Financial Statements”, including approving its budgets, setting the terms of significant contracts, and financing and investing activities. The Management Company operates under budgets approved by the Buyer. Should the Management Company disagree with the Buyer’s approved budget, it will formally relinquish responsibility for Terminal operations and will officially notify the Buyer accordingly.
In November 2015, the Company signed a long-term, take-or-pay transshipment contract with OOO SIBUR-Portenergo, which is valid through December 2029 (“Transshipment Contract”). Under the Transshipment Contract, the Company must transship its liquefied petroleum gas (“LPG”) and fully utilize the Terminal’s LPG transshipment capacity. As well, the Company must transship its naphtha and utilize a pre-determined percentage of the Terminal’s naphtha transshipment capacity if there are no other customers.
The Company’s management took the requirements of IFRS 10 “Consolidated Financial Statements” into consideration and made a significant judgement that, although the Group has retained some exposure or rights to variable returns from its involvement with the Terminal, it does not control the Terminal because it is the Buyer’s prerogative to make decisions on relevant Terminal operations, and the Terminal’s naphtha transshipment capacity may be utilized by third parties upon a decision of the Buyer.
Cash and cash equivalents. In 2015, cash received by the Group’s subsidiary OOO ZapSibNeftekhim from Russia’s National Wealth Fund, was placed on a special account at Sberbank of Russia (see Note 26). This cash can only be used for payments for equipment delivered and services provided to the project ZapSibNeftekhim (see Note 13). The Group’s management made a judgement that, while this cash is limited to the aforementioned use, it can be classified as cash and cash equivalents as OOO ZapSibNeftekhim has no other significant expenditures. As of 31 December 2017, the outstanding balance of cash held on this special account was RR nil (as of 31 December 2016 – RR 37,397).

PAO SIBUR HOLDING NOTES TO THE IFRS CONSOLIDATED FINANCIAL STATEMENTS (In millions of Russian roubles, unless otherwise stated)
21
4 ACQUISITION AND DECONSOLIDATION OF SUBSIDIARIES AND TRANSACTIONS WITH NON-CONTROLLING INTEREST
AO Uralorgsintez
As of 31 December 2016, the Company classified assets and liabilities of its subsidiary, AO Uralorgsintez, in the amount of RR 2,641 and RR 600, respectively, as assets held for sale and associated liabilities. The main operating activities of AO Uralorgsintez are processing hydrocarbon feedstock to LPG and naphtha, and producing benzene hydrocarbons and methyl tertiary butyl ether (“MTBE”), a high-octane fuel additive.
In April 2017, the Company sold its 100% interest in AO Uralorgsintez to OAO ECTOSintez (“the Buyer”), a Russian producer of anti-knock compounds, mainly MTBE, for a cash consideration of RR 22,000 and a working capital price adjustment of RR 175, both received in the first half 2017.
The interest was disposed under condition that the Company and the Buyer would sign several operating agreements, including those, under which the Buyer is obliged to: 1) process certain types of the Group's feedstock into finished goods using significant part (up to full capacity) of relevant AO Uralorgsintez's production facilities; 2) purchase certain raw materials from the Group to utilise significant part of some AO Uralorgsintez's production capacities with the option of the Group to utilise the residual part of these production capacities; 3) sell significant part of AO Uralorgsintez's major product when the Group acts as a sales agent. All these contracts were signed at the transaction date for the 10-years period at fair market prices.
The Company’s management considered the requirements of IFRIC 4 “Determining Whether an Arrangement Contains a Lease”. The terms of the contracts are at arm’s length. Not only more than an insignificant amount of AO Uralorgsintez’s output will be consumed by parties other than the Group, while the Buyer makes decisions on relevant operations of AO Uralorgsintez and controls physical access to the production site. As a result, the management made a significant judgement that it is not a lease arrangement, even though the Group will utilise a significant part of the AO Uralorgsintez’s production capacity.
The carrying amounts of AO Uralorgsintez’s assets and liabilities as of the disposal date amounted to RR 2,909 and RR 539, respectively. As of 31 December 2016, AO Uralorgsintez’s assets and liabilities amounted to RR 2,641 and RR 600, respectively. AO Uralorgsintez's assets were mainly presented by property, plant and equipment; liabilities were presented by trade payables, deferred tax liabilities and other payables.
As a result of the disposal, the Company recognized a gain in the amount of RR 19,805, which was classified as a gain on disposal of subsidiary in the consolidated statement of profit or loss.
The Company did not incur any significant transaction costs on this disposal. Until the disposal date AO Uralorgsintez’s financial results are reported in the Plastics, Elastomers and Intermediates segment (see Note 9).
OOO Tobolsk HPP
In February 2016, the Company acquired a 100 percent stake in OOO Tobolsk Heating and Power Plant (Tobolsk HPP) from a third party, OAO Fortum (the “Seller”), for the purposes of further development of the Tobolsk production site.
The Company purchased Tobolsk HPP for a cash consideration of RR 1,200 and a working capital price adjustment of RR 254, both of which were paid in 2016. Additionally, the Company should reimburse the Seller for all Tobolsk HPP cash inflows under its capacity supply contracts, which are specific to this industry revenue stream, guaranteed by the legislation of the Russian Federation, as the recovery of capital investments. Such reimbursements are payable on a monthly basis from the date of acquisition until 2020. In addition, there is a contingent consideration payable after 1 April 2018 if the Group realises synergies as a result of integrating Tobolsk HPP into its production site infrastructure in Tobolsk.

PAO SIBUR HOLDING NOTES TO THE IFRS CONSOLIDATED FINANCIAL STATEMENTS (In millions of Russian roubles, unless otherwise stated)
22
4 ACQUISITION AND DECONSOLIDATION OF SUBSIDIARIES AND TRANSACTIONS WITH NON-CONTROLLING INTEREST (CONTINUED)
As at the transaction date, a reimbursement amount of RR 5,870 was calculated based on the estimated future cash flows under the relevant capacity supply contracts discounted by the Group’s weighted average cost of capital. In 2017 and 2016, the Company reimbursed the Seller RR 2,108 and RR 1,192, respectively.
As of 31 December 2017 and 31 December 2016, the Company reassessed the present value of future cash flows under the relevant capacity supply contracts, considering market inputs, relevant at the reporting date and changes in electricity supply legislation, adopted subsequently to the acquisition date. For the years ended 31 December 2017 and 31 December 2016, the Company recognized gain of RR 80 and loss of RR 690, respectively, in the result of subsidiary’s acquisition and remeasurement of related liabilities line of the consolidated statement of profit or loss.
As of 31 December 2017 and 31 December 2016, a corresponding liability was recognized in the amount of RR 4,737 and RR 6,117, respectively. As of 31 December 2017 and 31 December 2016, the non-current portion of this liability in the amount of RR 2,856 and RR 4,132, respectively, was recognized in the other non-current liability line, while the current portion in the amount of RR 1,881 and RR 1,985, respectively, was recognized in the trade and other payables line of the consolidated statement of financial position. In 2017 and 2016, unwinding of discount on the liability in the amount of RR 808 and RR 749, respectively, was recognized in the finance expenses line of the consolidated statement of profit or loss.
As at the transaction date, a liability related to contingent consideration of RR 585 was calculated as the sum of the potential outcomes of different scenarios in which the Group realizes synergies from integrating Tobolsk HPP into its production site infrastructure in Tobolsk, multiplied by the probability of each scenario. In 2017, the Company reassessed the probability of each scenario, and as a result, recognized loss of RR 1,045 in the result of subsidiary’s acquisition and remeasurement of related liabilities line of the consolidated statement of profit or loss. As of 31 December 2017 and 31 December 2016, a corresponding liability was recognized in the amount of RR 1,818 and RR 666, respectively, in the other non-current liabilities line of the consolidated statement of financial position (see Note 39).
The Company recognized an excess amount totalling RR 2,356 of net assets acquired over the total purchase consideration in a result of subsidiary’s acquisition and remeasurement of related liabilities line of the consolidated statement of profit or loss for the year ended 31 December 2016.
The net result of the acquisition recognized by the Company in a result of subsidiary’s acquisition and remeasurement of related liabilities line of the consolidated statement of profit or loss for the years ended 31 December 2017 and 31 December 2016 consists of:
2017 2016 An excess amount of net assets acquired over the total purchase consideration - 2,356 Remeasurement of payables for acquisition of Tobolsk HPP (965) (690)
Result of subsidiary’s acquisition and remeasurement of related liabilities (965) 1,666
OOO SIBUR-Portenergo
In November 2015, the Company’s interest in OOO SIBUR-Portenergo was sold for a cash consideration of RR 21,335, which was received at the disposal date, as well as deferred and contingent considerations. The deferred consideration was received in full after confirmation of the terminal’s basic capacity in the amount of RR 3,445 in July 2016.
The contingent consideration amount of USD 18 million is payable after seven years since the disposal date and was derived based on a specific formula linked to the pricing of OOO SIBUR-Portenergo’s long-term transshipment contracts in excess of a defined threshold.
As of 31 December 2017 and 31 December 2016, the contingent consideration was RR 736 and RR 719, respectively (see Note 39).
PAO SIBUR HOLDING NOTES TO THE IFRS CONSOLIDATED FINANCIAL STATEMENTS (In millions of Russian roubles, unless otherwise stated)
23
4 ACQUISITION AND DECONSOLIDATION OF SUBSIDIARIES AND TRANSACTIONS WITH NON-CONTROLLING INTEREST (CONTINUED)
AO Polief
In December 2015, following the results of a privatisation auction, the Company signed an agreement to acquire a 17.5 percent non-controlling interest in AO Polief from the Government of the Republic of Bashkortostan for a cash consideration of RR 500. The transaction was finalised in January 2016; as a result, the Company, previously held an 82.5 percent stake in the entity, became the sole owner of AO Polief. The difference between the consideration paid and the non-controlling interest acquired was recognized in retained earnings in the amount of RR 193.
5 ASSETS AND LIABILITIES CLASSIFIED AS HELD FOR SALE
As of 31 December 2017, the assets and liabilities associated with the assets classified as held for sale represented by assets and liabilities of the Group’s subsidiary OOO LNG NOVAENGINEERING (“NOVAENGINEERING”), which was founded by NIPIGAZ in February 2017 to provide engineering, design and other services related to gravity-based structure liquefied natural gas plants (“Projects”), including ARCTIC LNG 2 project for PAO NOVATEK.
In the second half of 2017, NIPIGAZ signed the joint venture agreement (“JVA”) with Technip France and LINDE AG. In accordance with the JVA the parties will exercise joint control over relevant activities of NOVAENGINEERING and the Group’s management determines it as a joint venture. In January 2018 the part of NIPIGAZ’s interest in NOVAENGINEERING was sold for a cash consideration of RR 16 to the parties of the JVA. As a result the JVA came into force and the ownership percentage of NIPIGAZ in NOVAENGINEERING decreased to 50.1 percent. According to the JVA terms profit sharing percentage of the Group in NOVAENGINEERING’s results is not the same as ownership percentage and is specifically determined for each Project. The Group’s management is planning to keep the Group’s majority ownership percentage in NOVAENGINEERING.
As of 31 December 2017, the assets and liabilities associated with the assets classified as held for sale amounted to RR 6,568, mainly presented by trade and other receivables, and RR 6,696, mainly presented by trade and other payables, respectively.
NOVAENGINEERING’s financial results are reported as Unallocated in the segment information (see Note 9).

PAO SIBUR HOLDING NOTES TO THE IFRS CONSOLIDATED FINANCIAL STATEMENTS (In millions of Russian roubles, unless otherwise stated)
24
6 REVENUE
Revenue by products and reportable segments is presented below:
Year ended 31 December 2017 2016 Feedstock and Energy 184,199 170,708
Liquefied petroleum gas 110,708 88,839 Natural gas 47,474 45,958 Naphtha 23,904 30,846 Raw natural gas liquids 67 2,701 Other sales 2,046 2,364
Olefins and Polyolefins 88,135 86,830 Polyolefins 63,576 60,225 BOPP films 16,642 18,509 Olefins 5,810 5,072 Other polymers products 1,418 2,344 Other sales 689 680
Plastics, Elastomers and Intermediates 146,877 130,690 Elastomers 51,857 39,421 Plastics and organic synthesis products 47,227 45,929 Intermediates and other chemicals 23,410 20,539 MTBE and fuel additives 23,120 23,213 Other sales 1,263 1,588
Unallocated 35,408 23,584 Other revenue 35,408 23,584
Total revenue 454,619 411,812
7 OPERATING EXPENSES Year ended 31 December 2017 2016
Feedstock and materials 92,934 82,993 Transportation and logistics 67,058 73,738 Energy and utilities 38,770 37,716 Staff costs 38,334 34,510 Depreciation and amortisation 35,486 34,996 Goods for resale 23,170 14,182 Services provided by third parties 14,129 10,594 Repairs and maintenance 8,291 8,534 Processing services of third parties 3,333 2,040 Taxes other than income tax 3,313 2,246 Rent expenses 1,354 1,256 Marketing and advertising 1,221 777 Charity and sponsorship 820 950 Loss on disposal of property, plant and equipment 319 172 Impairment of assets held for sale 180 - Impairment of property, plant and equipment 164 1,502 Change in WIP and refined products balances (1,803) (284) Other 2,525 2,759
Total operating expenses 329,598 308,681
Staff costs for the years ended 31 December 2017 and 31 December 2016 included statutory pension and other social security contributions of RR 7,127 and RR 6,563, respectively, also RR 592 and RR 472 of statutory pension and other social security contributions were capitalized in property, plant and equipment for the years ended 31 December 2017 and 31 December 2016, respectively.
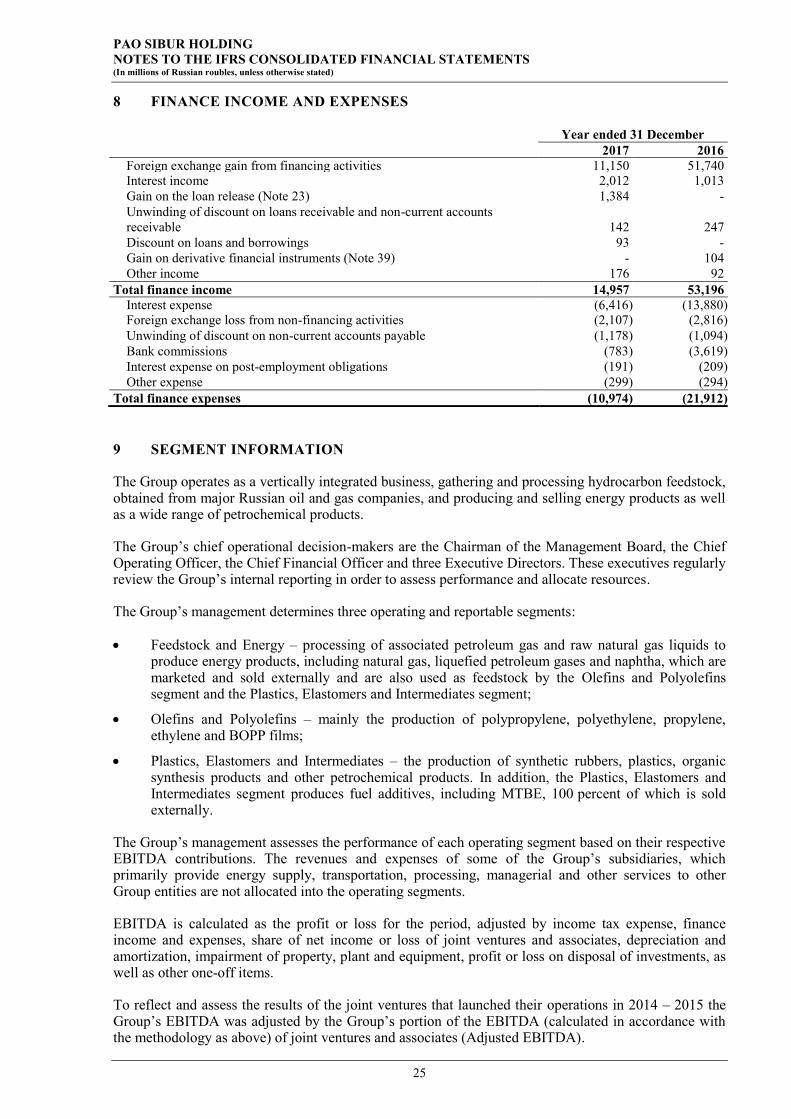
PAO SIBUR HOLDING NOTES TO THE IFRS CONSOLIDATED FINANCIAL STATEMENTS (In millions of Russian roubles, unless otherwise stated)
25
8 FINANCE INCOME AND EXPENSES Year ended 31 December 2017 2016
Foreign exchange gain from financing activities 11,150 51,740 Interest income 2,012 1,013 Gain on the loan release (Note 23) 1,384 - Unwinding of discount on loans receivable and non-current accounts receivable 142 247 Discount on loans and borrowings 93 - Gain on derivative financial instruments (Note 39) - 104 Other income 176 92
Total finance income 14,957 53,196 Interest expense (6,416) (13,880) Foreign exchange loss from non-financing activities (2,107) (2,816) Unwinding of discount on non-current accounts payable (1,178) (1,094) Bank commissions (783) (3,619) Interest expense on post-employment obligations (191) (209) Other expense (299) (294)
Total finance expenses (10,974) (21,912)
9 SEGMENT INFORMATION
The Group operates as a vertically integrated business, gathering and processing hydrocarbon feedstock, obtained from major Russian oil and gas companies, and producing and selling energy products as well as a wide range of petrochemical products.
The Group’s chief operational decision-makers are the Chairman of the Management Board, the Chief Operating Officer, the Chief Financial Officer and three Executive Directors. These executives regularly review the Group’s internal reporting in order to assess performance and allocate resources.
The Group’s management determines three operating and reportable segments:
Feedstock and Energy – processing of associated petroleum gas and raw natural gas liquids to produce energy products, including natural gas, liquefied petroleum gases and naphtha, which are marketed and sold externally and are also used as feedstock by the Olefins and Polyolefins segment and the Plastics, Elastomers and Intermediates segment;
Olefins and Polyolefins – mainly the production of polypropylene, polyethylene, propylene, ethylene and BOPP films;
Plastics, Elastomers and Intermediates – the production of synthetic rubbers, plastics, organic synthesis products and other petrochemical products. In addition, the Plastics, Elastomers and Intermediates segment produces fuel additives, including MTBE, 100 percent of which is sold externally.
The Group’s management assesses the performance of each operating segment based on their respective EBITDA contributions. The revenues and expenses of some of the Group’s subsidiaries, which primarily provide energy supply, transportation, processing, managerial and other services to other Group entities are not allocated into the operating segments.
EBITDA is calculated as the profit or loss for the period, adjusted by income tax expense, finance income and expenses, share of net income or loss of joint ventures and associates, depreciation and amortization, impairment of property, plant and equipment, profit or loss on disposal of investments, as well as other one-off items.
To reflect and assess the results of the joint ventures that launched their operations in 2014 – 2015 the Group’s EBITDA was adjusted by the Group’s portion of the EBITDA (calculated in accordance with the methodology as above) of joint ventures and associates (Adjusted EBITDA).
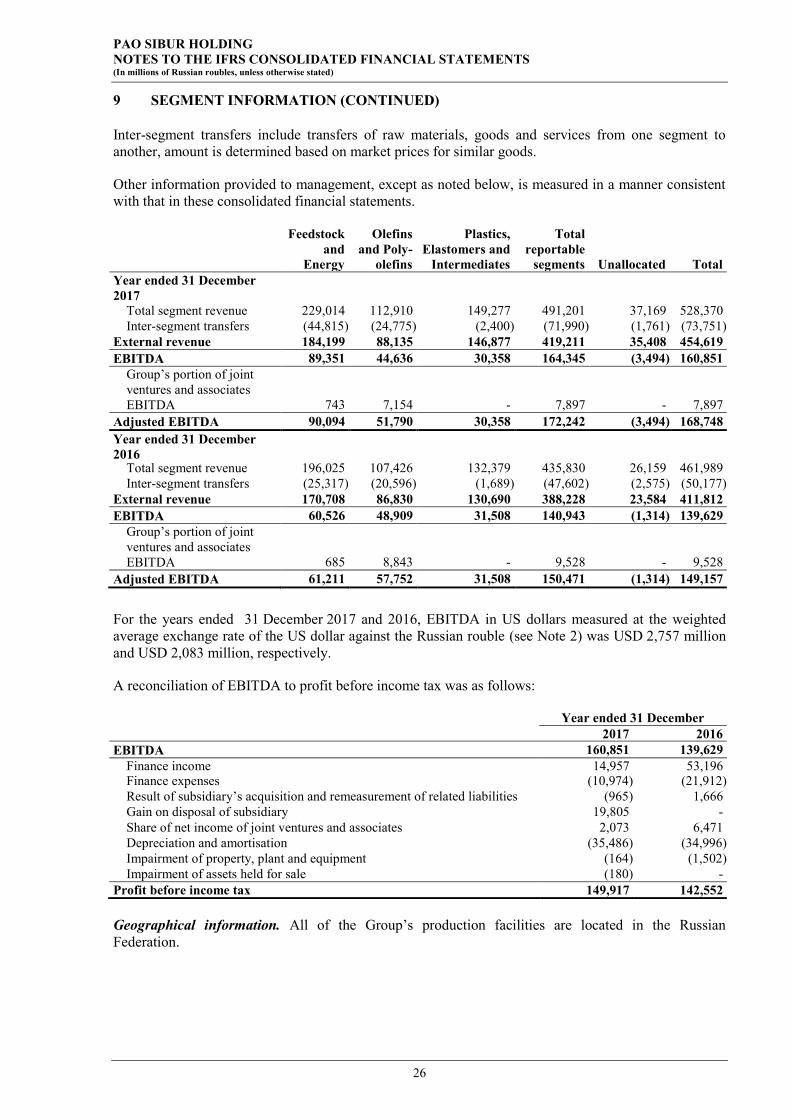
PAO SIBUR HOLDING NOTES TO THE IFRS CONSOLIDATED FINANCIAL STATEMENTS (In millions of Russian roubles, unless otherwise stated)
26
9 SEGMENT INFORMATION (CONTINUED)
Inter-segment transfers include transfers of raw materials, goods and services from one segment to another, amount is determined based on market prices for similar goods.
Other information provided to management, except as noted below, is measured in a manner consistent with that in these consolidated financial statements.
Feedstock
and Energy
Olefins and Poly-
olefins
Plastics, Elastomers and
Intermediates
Total reportable
segments Unallocated Total Year ended 31 December 2017
Total segment revenue 229,014 112,910 149,277 491,201 37,169 528,370 Inter-segment transfers (44,815) (24,775) (2,400) (71,990) (1,761) (73,751)
External revenue 184,199 88,135 146,877 419,211 35,408 454,619 EBITDA 89,351 44,636 30,358 164,345 (3,494) 160,851
Group’s portion of joint ventures and associates EBITDA 743 7,154 - 7,897 - 7,897
Adjusted EBITDA 90,094 51,790 30,358 172,242 (3,494) 168,748 Year ended 31 December 2016
Total segment revenue 196,025 107,426 132,379 435,830 26,159 461,989 Inter-segment transfers (25,317) (20,596) (1,689) (47,602) (2,575) (50,177)
External revenue 170,708 86,830 130,690 388,228 23,584 411,812 EBITDA 60,526 48,909 31,508 140,943 (1,314) 139,629
Group’s portion of joint ventures and associates EBITDA 685 8,843 - 9,528 - 9,528
Adjusted EBITDA 61,211 57,752 31,508 150,471 (1,314) 149,157
For the years ended 31 December 2017 and 2016, EBITDA in US dollars measured at the weighted average exchange rate of the US dollar against the Russian rouble (see Note 2) was USD 2,757 million and USD 2,083 million, respectively.
A reconciliation of EBITDA to profit before income tax was as follows:
Year ended 31 December 2017 2016 EBITDA 160,851 139,629
Finance income 14,957 53,196 Finance expenses (10,974) (21,912) Result of subsidiary’s acquisition and remeasurement of related liabilities (965) 1,666 Gain on disposal of subsidiary 19,805 - Share of net income of joint ventures and associates 2,073 6,471 Depreciation and amortisation (35,486) (34,996) Impairment of property, plant and equipment (164) (1,502) Impairment of assets held for sale (180) -
Profit before income tax 149,917 142,552
Geographical information. All of the Group’s production facilities are located in the Russian Federation.

PAO SIBUR HOLDING NOTES TO THE IFRS CONSOLIDATED FINANCIAL STATEMENTS (In millions of Russian roubles, unless otherwise stated)
27
9 SEGMENT INFORMATION (CONTINUED)
The breakdown of revenues by geographical regions is as follows: Year ended 31 December 2017 2016
Russia 262,862 237,843 Europe 135,989 117,680 Asia 29,193 28,146 CIS 23,888 22,462 Other 2,687 5,681 Total revenue 454,619 411,812
10 CONSTRUCTION CONTRACTS
The construction contracts revenue is recognized in accordance with IAS 11 “Construction Contracts” by reference to the stage of completion of the contract activity at the end of the reporting period within other revenue in the consolidated statement of profit or loss. The stage of completion of a contract was determined based on the proportion that contract costs incurred for work performed to date bear to the estimated total contract costs.
During 2017 and 2016, the following figures relate to the Group’s activities under construction contracts:
31 December 2017 31 December 2016 Construction contracts revenue 7,988 1,009 Contract cost expensed (6,773) (713)
Gross margin 1,215 296
The Group’s financial position with respect to construction contracts in progress was as follows:
31 December 2017 31 December 2016 Aggregate amount of contract costs incurred 7,486 713 Aggregate amount of recognized profits 1,511 296 Less: Progress billings (9,842) (1,009)
Gross amount due to customers for contract work (845) -
The gross amount due to customers for contract work is recognized within short-term advances received under project management services in the consolidated statement of financial position. As of 31 December 2017 and 2016, the amount of advances from customers, related to construction contracts, was RR 7,439 and RR 3,997, respectively.
11 EARNINGS PER SHARE
The basic and diluted earnings per share ratio has been calculated by dividing the profit for the reporting year attributable to equity holders of the parent company by the weighted average number of shares outstanding during the year, excluding treasury shares. The weighted average number of ordinary shares outstanding for the years ended 31 December 2017 and 2016 was 2,178,479,100.
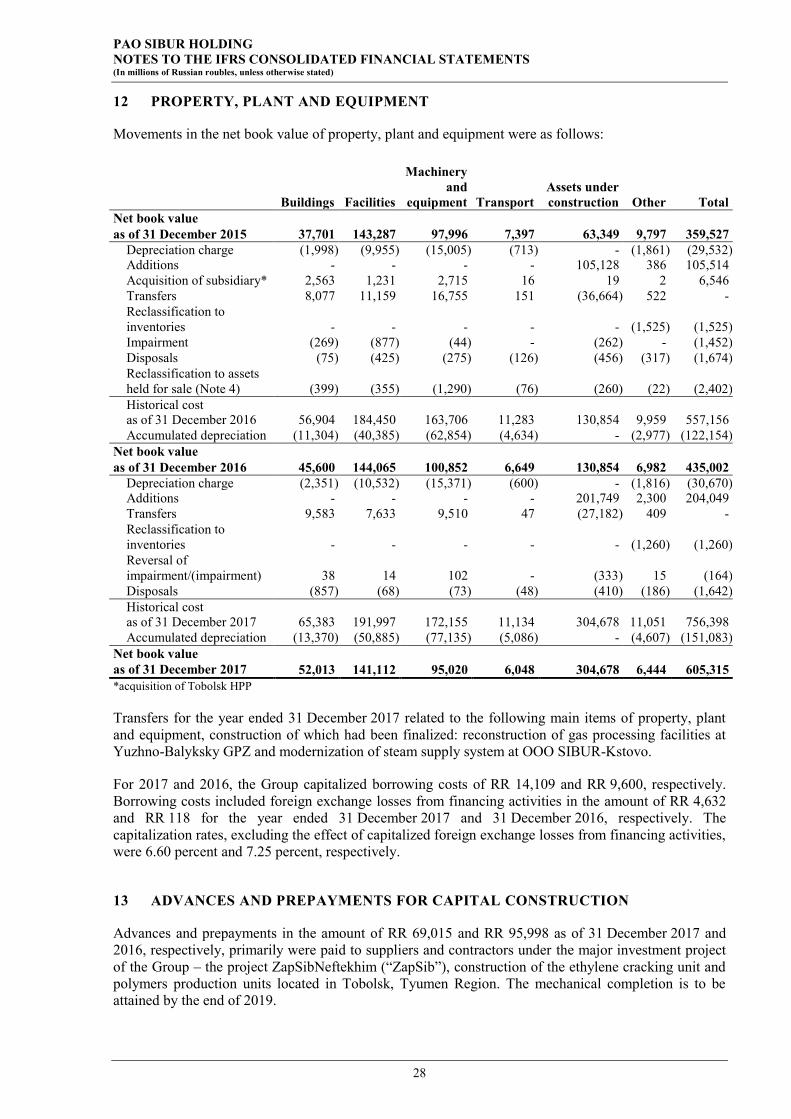
PAO SIBUR HOLDING NOTES TO THE IFRS CONSOLIDATED FINANCIAL STATEMENTS (In millions of Russian roubles, unless otherwise stated)
28
12 PROPERTY, PLANT AND EQUIPMENT
Movements in the net book value of property, plant and equipment were as follows:
Buildings Facilities
Machinery and
equipment Transport Assets under construction Other Total
Net book value
as of 31 December 2015 37,701 143,287 97,996 7,397 63,349 9,797 359,527 Depreciation charge (1,998) (9,955) (15,005) (713) - (1,861) (29,532) Additions - - - - 105,128 386 105,514 Acquisition of subsidiary* 2,563 1,231 2,715 16 19 2 6,546 Transfers 8,077 11,159 16,755 151 (36,664) 522 - Reclassification to inventories - - - - - (1,525) (1,525) Impairment (269) (877) (44) - (262) - (1,452) Disposals (75) (425) (275) (126) (456) (317) (1,674) Reclassification to assets held for sale (Note 4) (399) (355) (1,290) (76) (260) (22) (2,402) Historical cost
as of 31 December 2016 56,904 184,450 163,706 11,283 130,854 9,959 557,156 Accumulated depreciation (11,304) (40,385) (62,854) (4,634) - (2,977) (122,154)
Net book value
as of 31 December 2016 45,600 144,065 100,852 6,649 130,854 6,982 435,002 Depreciation charge (2,351) (10,532) (15,371) (600) - (1,816) (30,670) Additions - - - - 201,749 2,300 204,049 Transfers 9,583 7,633 9,510 47 (27,182) 409 - Reclassification to inventories - - - - - (1,260) (1,260) Reversal of impairment/(impairment) 38 14 102 - (333) 15 (164) Disposals (857) (68) (73) (48) (410) (186) (1,642) Historical cost as of 31 December 2017 65,383 191,997 172,155 11,134 304,678 11,051 756,398 Accumulated depreciation (13,370) (50,885) (77,135) (5,086) - (4,607) (151,083)
Net book value as of 31 December 2017 52,013 141,112 95,020 6,048 304,678 6,444 605,315 *acquisition of Tobolsk HPP
Transfers for the year ended 31 December 2017 related to the following main items of property, plant and equipment, construction of which had been finalized: reconstruction of gas processing facilities at Yuzhno-Balyksky GPZ and modernization of steam supply system at OOO SIBUR-Kstovo.
For 2017 and 2016, the Group capitalized borrowing costs of RR 14,109 and RR 9,600, respectively. Borrowing costs included foreign exchange losses from financing activities in the amount of RR 4,632 and RR 118 for the year ended 31 December 2017 and 31 December 2016, respectively. The capitalization rates, excluding the effect of capitalized foreign exchange losses from financing activities, were 6.60 percent and 7.25 percent, respectively.
13 ADVANCES AND PREPAYMENTS FOR CAPITAL CONSTRUCTION
Advances and prepayments in the amount of RR 69,015 and RR 95,998 as of 31 December 2017 and 2016, respectively, primarily were paid to suppliers and contractors under the major investment project of the Group – the project ZapSibNeftekhim (“ZapSib”), construction of the ethylene cracking unit and polymers production units located in Tobolsk, Tyumen Region. The mechanical completion is to be attained by the end of 2019.
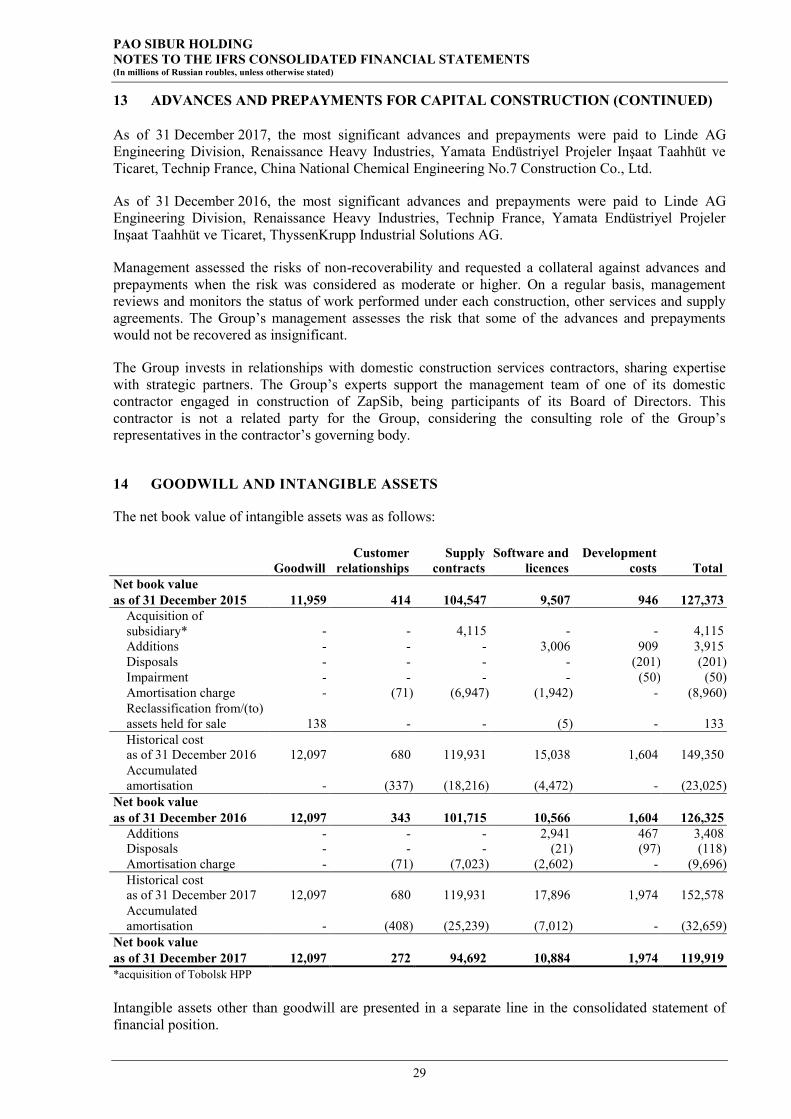
PAO SIBUR HOLDING NOTES TO THE IFRS CONSOLIDATED FINANCIAL STATEMENTS (In millions of Russian roubles, unless otherwise stated)
29
13 ADVANCES AND PREPAYMENTS FOR CAPITAL CONSTRUCTION (CONTINUED)
As of 31 December 2017, the most significant advances and prepayments were paid to Linde AG Engineering Division, Renaissance Heavy Industries, Yamata Endüstriyel Projeler Inşaat Taahhüt ve Ticaret, Technip France, China National Chemical Engineering No.7 Construction Co., Ltd.
As of 31 December 2016, the most significant advances and prepayments were paid to Linde AG Engineering Division, Renaissance Heavy Industries, Technip France, Yamata Endüstriyel Projeler Inşaat Taahhüt ve Ticaret, ThyssenKrupp Industrial Solutions AG.
Management assessed the risks of non-recoverability and requested a collateral against advances and prepayments when the risk was considered as moderate or higher. On a regular basis, management reviews and monitors the status of work performed under each construction, other services and supply agreements. The Group’s management assesses the risk that some of the advances and prepayments would not be recovered as insignificant.
The Group invests in relationships with domestic construction services contractors, sharing expertise with strategic partners. The Group’s experts support the management team of one of its domestic contractor engaged in construction of ZapSib, being participants of its Board of Directors. This contractor is not a related party for the Group, considering the consulting role of the Group’s representatives in the contractor’s governing body.
14 GOODWILL AND INTANGIBLE ASSETS
The net book value of intangible assets was as follows:
Goodwill
Customer relationships
Supply contracts
Software and licences
Development costs Total
Net book value as of 31 December 2015 11,959 414 104,547 9,507 946 127,373
Acquisition of subsidiary* - - 4,115 - - 4,115 Additions - - - 3,006 909 3,915 Disposals - - - - (201) (201) Impairment - - - - (50) (50) Amortisation charge - (71) (6,947) (1,942) - (8,960) Reclassification from/(to) assets held for sale 138 - - (5) - 133 Historical cost as of 31 December 2016 12,097 680 119,931 15,038 1,604 149,350 Accumulated amortisation - (337) (18,216) (4,472) - (23,025)
Net book value as of 31 December 2016 12,097 343 101,715 10,566 1,604 126,325
Additions - - - 2,941 467 3,408 Disposals - - - (21) (97) (118) Amortisation charge - (71) (7,023) (2,602) - (9,696) Historical cost
as of 31 December 2017 12,097 680 119,931 17,896 1,974 152,578 Accumulated amortisation - (408) (25,239) (7,012) - (32,659)
Net book value as of 31 December 2017 12,097 272 94,692 10,884 1,974 119,919 *acquisition of Tobolsk HPP
Intangible assets other than goodwill are presented in a separate line in the consolidated statement of financial position.
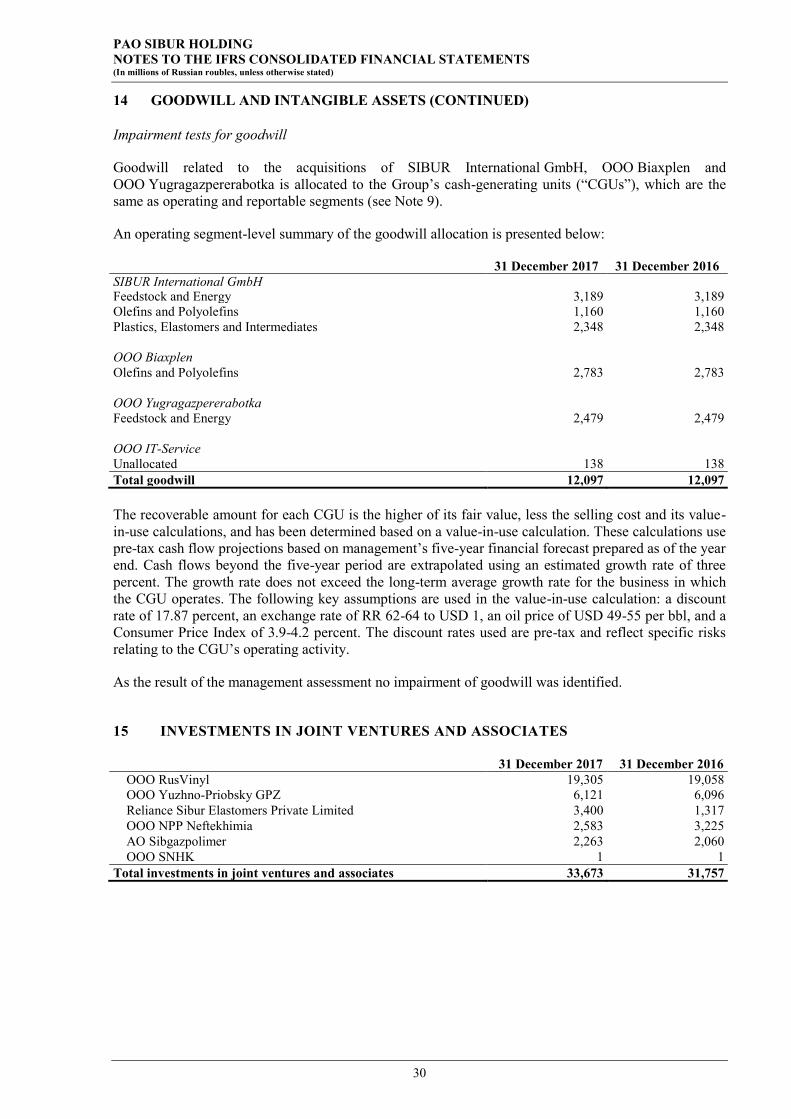
PAO SIBUR HOLDING NOTES TO THE IFRS CONSOLIDATED FINANCIAL STATEMENTS (In millions of Russian roubles, unless otherwise stated)
30
14 GOODWILL AND INTANGIBLE ASSETS (CONTINUED)
Impairment tests for goodwill
Goodwill related to the acquisitions of SIBUR International GmbH, OOO Biaxplen and OOO Yugragazpererabotka is allocated to the Group’s cash-generating units (“CGUs”), which are the same as operating and reportable segments (see Note 9).
An operating segment-level summary of the goodwill allocation is presented below:
31 December 2017 31 December 2016 SIBUR International GmbH Feedstock and Energy 3,189 3,189 Olefins and Polyolefins 1,160 1,160 Plastics, Elastomers and Intermediates 2,348 2,348 OOO Biaxplen Olefins and Polyolefins 2,783 2,783 OOO Yugragazpererabotka Feedstock and Energy 2,479 2,479 OOO IT-Service Unallocated 138 138 Total goodwill 12,097 12,097
The recoverable amount for each CGU is the higher of its fair value, less the selling cost and its value-in-use calculations, and has been determined based on a value-in-use calculation. These calculations use pre-tax cash flow projections based on management’s five-year financial forecast prepared as of the year end. Cash flows beyond the five-year period are extrapolated using an estimated growth rate of three percent. The growth rate does not exceed the long-term average growth rate for the business in which the CGU operates. The following key assumptions are used in the value-in-use calculation: a discount rate of 17.87 percent, an exchange rate of RR 62-64 to USD 1, an oil price of USD 49-55 per bbl, and a Consumer Price Index of 3.9-4.2 percent. The discount rates used are pre-tax and reflect specific risks relating to the CGU’s operating activity.
As the result of the management assessment no impairment of goodwill was identified.
15 INVESTMENTS IN JOINT VENTURES AND ASSOCIATES 31 December 2017 31 December 2016
OOO RusVinyl 19,305 19,058 OOO Yuzhno-Priobsky GPZ 6,121 6,096 Reliance Sibur Elastomers Private Limited 3,400 1,317 OOO NPP Neftekhimia 2,583 3,225 AO Sibgazpolimer 2,263 2,060 OOO SNHK 1 1
Total investments in joint ventures and associates 33,673 31,757
PAO SIBUR HOLDING NOTES TO THE IFRS CONSOLIDATED FINANCIAL STATEMENTS (In millions of Russian roubles, unless otherwise stated)
31
15 INVESTMENTS IN JOINT VENTURES AND ASSOCIATES (CONTINUED)
The table below summarises the movements in the carrying amount of the Group’s investment in associates and joint ventures.
2017 2016
Joint Ventures Associates
Joint Ventures Associates
Investments in joint ventures and associates as of the beginning of the year 30,440 1,317 25,905 1,159
Share of profit/(loss) of joint ventures and associates 2,080 (7) 6,461 10 Additions - 2,075 614 437 Dividends received from joint ventures and associates (2,247) - (2,540) - Translation differences - 15 - (289)
Investments in joint ventures and associates as of the end of the year 30,273 3,400 30,440 1,317
All individually material associates and joint ventures are private companies and, thus, there are no quoted prices for their shares. All of these entities have share capital consisting solely of ordinary shares, which are held directly by the shareholders.
The Group reviews its investments in joint ventures and associates for potential impairment indicators on a regular basis. As of 31 December 2017 there were no circumstances that would indicate the carrying value of investments in joint ventures and associates exceeds its recoverable amount.
The nature of the Group’s relationship with and the financial information of each individually material associate and joint venture are described below.
OOO RusVinyl. In June 2007, the Group formed a joint venture, OOO RusVinyl, with SolVin Holding Nederland B.V. (which is ultimately controlled by Solvay SA) for the construction of a polyvinyl chloride production complex in the Nizhny Novgorod Region. In September 2014, OOO RusVinyl began its operation.
In 2011, the Group issued a finance guarantee for 50 percent of loans obtained by OOO RusVinyl and pledged its share in the joint venture as security for the financial obligations of OOO RusVinyl. In December 2016, the coverage of the Group guarantee was decreased to 20 percentage of loans of OOO RusVinyl and in addition to that the Group issued EUR 32.5 million guarantee as a liquidity support undertaking.
As of 31 December 2017 and 31 December 2016, the maximum credit risk exposures due to financial guarantees issued for the OOO RusVinyl were RR 8,093 and RR 8,580, respectively.
In 2017, the Group issued loan to OOO RusVinyl (see Note 21) maturing in 2024 to finance its operating activity. The Group provided loan on an arm’s length basis and its ownership share remained unchanged.
PAO SIBUR HOLDING NOTES TO THE IFRS CONSOLIDATED FINANCIAL STATEMENTS (In millions of Russian roubles, unless otherwise stated)
32
15 INVESTMENTS IN JOINT VENTURES AND ASSOCIATES (CONTINUED)
The table below provides information on the statement of financial position and the results of OOO RusVinyl as of and for the years ended 31 December 2017 and 2016.
31 December 2017 31 December 2016 Assets Non-current assets Property, plant and equipment 64,952 67,898 Other non-current assets 2,429 2,636 Total non-current assets 67,381 70,534 Current assets Cash and cash equivalents 1,807 1,471 Other current assets 4,407 3,951 Total current assets 6,214 5,422 Total assets 73,595 75,956 Liabilities Non-current liabilities Financial liabilities 27,297 29,307 Total non-current liabilities 27,297 29,307 Current liabilities Financial liabilities 5,291 5,454 Other current liabilities 2,397 3,078 Total current liabilities 7,688 8,532 Total liabilities 34,985 37,839 Net assets 38,610 38,117
Reconciliation to carrying amounts:
Year ended 31 December 2017 2016 Opening net assets 38,117 31,180
Profit for the period 493 6,937 Closing net assets 38,610 38,117
Group's share in percent 50 50 Group's share 19,305 19,058
Carrying amount 19,305 19,058
Year ended 31 December 2017 2016
Revenue 22,578 22,621 Depreciation and amortisation (3,433) (3,423) Interest income 22 54 Interest expense (2,787) (3,183) Other finance expense (66) (88) Foreign exchange (loss)/gain (1,712) 6,101 Income tax expense (185) (1,800) Profit for the period 493 6,937
OOO Yuzhno-Priobsky GPZ. In 2007, the Group and the Gazprom Neft Group established a joint venture in the Khanty-Mansiysk Autonomous District to construct a gas processing plant based on Yuzhno-Priobskaya compressor station. On 3 September 2015, OOO Yuzhno-Priobsky GPZ began its operation.

PAO SIBUR HOLDING NOTES TO THE IFRS CONSOLIDATED FINANCIAL STATEMENTS (In millions of Russian roubles, unless otherwise stated)
33
15 INVESTMENTS IN JOINT VENTURES AND ASSOCIATES (CONTINUED)
In September 2014 and February 2015, the Gazprom Neft Group made additional contributions to the joint venture’s share capital of RR 4,810 and RR 1,240, respectively, thus the Group’s nominal ownership in the joint venture has temporarily decreased to 26 percent. According to the shareholders’ agreement, both shareholders are obligated to finance the joint venture on a parity basis. As a result, the Group recognized a liability for contributions to the share capital of OOO Yuzhno-Priobsky GPZ in the amount of RR 3,025 with a corresponding increase in the investments in joint ventures and associates line.
The Group paid to the Gazprom Neft Group RR 2,053 in 2014 and RR 972 during the first half of 2015 in cash, which were recognized as loans receivable. In April 2016, these loans were settled by Gazprom Neft Group and the Group has settled its liability for additional contribution to the share capital of OOO Yuzhno-Priobsky GPZ in the amount of RR 3,025. As a result, the Group’s stake in the joint venture has increased to 50 percent upon the transfer of the related portion of shares previously owned by the Gazprom Neft Group.
In September 2016, the Group and the Gazprom Neft Group each made additional contribution to the joint venture’s share capital in the amount of RR 614; the Group’s ownership share remained unchanged.
In 2017, the Group received dividends from OOO Yuzhno-Priobsky GPZ of RR 26.
The table below provides information on the statement of financial position and the results of OOO Yuzhno-Priobsky GPZ as of and for the years ended 31 December 2017 and 2016.
31 December 2017 31 December 2016 Assets Non-current assets Property, plant and equipment 8,655 9,802 Other non-current assets 298 258 Total non-current assets 8,953 10,060 Current assets Cash and cash equivalents 1 9 Other current assets 4,103 2,906 Total current assets 4,104 2,915 Total assets 13,057 12,975 Liabilities Non-current liabilities Other non-current liabilities 365 319 Total non-current liabilities 365 319 Current liabilities Other current liabilities 450 464 Total current liabilities 450 464 Total liabilities 815 783 Net assets 12,242 12,192
PAO SIBUR HOLDING NOTES TO THE IFRS CONSOLIDATED FINANCIAL STATEMENTS (In millions of Russian roubles, unless otherwise stated)
34
15 INVESTMENTS IN JOINT VENTURES AND ASSOCIATES (CONTINUED)
Reconciliation to carrying amounts:
Year ended 31 December 2017 2016 Opening net assets 12,192 10,856
Profit for the period 101 108 Additional contribution to the share capital - 1,228 Dividends paid (51) -
Closing net assets 12,242 12,192 Group's share in percent 50 50 Group's share 6,121 6,096
Carrying amount 6,121 6,096
Year ended 31 December 2017 2016
Revenue 2,004 2,160 Depreciation and amortisation (1,363) (1,255) Interest income - 20 Foreign exchange gain 1 - Income tax expense (23) (28) Profit for the period 101 108
OOO NPP Neftekhimia. In September 2010, the Group established a joint venture, OOO NPP Neftekhimia, with OAO Moskovskiy NPZ (later renamed as AO Gazpromneft-MNPZ), a member of Gazprom neft Group. The joint venture is a polypropylene producer located in Moscow, and the Group purchases substantially all of its production volumes.
In 2017 and 2016, the Group received dividends from OOO NPP Neftekhimia of RR 1,429 and RR 2,540, respectively.
The table below provides information on the statement of financial position and the results of OOO NPP Neftekhimia as of and for the years ended 31 December 2017 and 2016.
31 December 2017 31 December 2016 Assets Non-current assets Property, plant and equipment 1,495 1,531 Other non-current assets 68 96 Total non-current assets 1,563 1,627 Current assets Cash and cash equivalents 310 321 Other current assets 926 2,892 Total current assets 1,236 3,213 Total assets 2,799 4,840 Liabilities Non-current liabilities Other non-current liabilities 27 21 Total non-current liabilities 27 21 Current liabilities Other current liabilities 513 1,052 Total current liabilities 513 1,052 Total liabilities 540 1,073 Net assets 2,259 3,767

PAO SIBUR HOLDING NOTES TO THE IFRS CONSOLIDATED FINANCIAL STATEMENTS (In millions of Russian roubles, unless otherwise stated)
35
15 INVESTMENTS IN JOINT VENTURES AND ASSOCIATES (CONTINUED)
Reconciliation to carrying amounts:
Year ended 31 December 2017 2016 Opening net assets 3,767 5,498
Profit for the period 1,350 3,349 Dividends paid (2,858) (5,080)
Closing net assets 2,259 3,767 Group’s share in percent 50 50 Group’s share 1,130 1,883 Unrealised gain (119) (230) Goodwill 1,572 1,572
Carrying amount 2,583 3,225
Year ended 31 December 2017 2016
Revenue 6,451 8,186 Depreciation and amortisation (278) (264) Interest income 87 303 Foreign exchange (loss)/gain (4) 6 Income tax expense (403) (912) Profit for the period 1,350 3,349
Reliance Sibur Elastomers Private Limited. In February 2012, the Group and the Reliance Industries Limited established a company for the construction of butyl rubber production facility at Reliance Industries Limited’s integrated petrochemical site in Jamnagar, India. In 2017 and 2016, the Group made additional contributions to the associate’s share capital of RR 2,075 and RR 437, respectively; the Group’s ownership share remained unchanged.
AO Sibgazpolimer. In May 2014, AO Sibgazpolimer acquired a 50 percentage stake in OOO Poliom from AO GK Titan for a cash consideration of RR 2,297 and a contingent consideration of RR 2,131. Purchase price allocation resulted in recognition of goodwill in the amount of RR 5,960, which is included in carrying value of investment in OOO Poliom.
In 2017, the Group received dividends from AO Sibgazpolimer of RR 792.
Summarised financial information of these individually immaterial joint venture and associate is provided below.
As of and for the year ended 31 December 2017
Current
assets
Non-current
assets Current
liabilities
Non-current
liabilities Reve- nues
Oper. profit/ (loss)
Рrofit/ (loss)
Reliance Sibur Elastomers Private Limited 5,620 17,665 2,036 7,256 - (1) (22) AO Sibgazpolimer 3 6,795 - 2,272 2,212 2,212 1,990
As of and for the year ended 31 December 2016
Current
assets
Non-current
assets Current
liabilities
Non-current
liabilities Reve- nues
Oper. profit/ (loss) Profit
Reliance Sibur Elastomers Private Limited 1,195 10,036 4,047 1,518 55 53 38 AO Sibgazpolimer 12 6,167 2,059 - 3,040 3,039 2,990
PAO SIBUR HOLDING NOTES TO THE IFRS CONSOLIDATED FINANCIAL STATEMENTS (In millions of Russian roubles, unless otherwise stated)
36
15 INVESTMENTS IN JOINT VENTURES AND ASSOCIATES (CONTINUED)
The Group has a number of long-term contracts with joint ventures, including contracts for procurement of processing services and purchase of finished goods. Balances outstanding as of 31 December 2017 and 31 December 2016 and transactions for the years ended 31 December 2017 and 31 December 2016 with joint ventures and associates are disclosed in Note 37.
The Group will finance investments in its joint ventures and associates should these entities be unable to attract third parties’ financing. The Group’s commitments under these investment arrangements comprised RR 819 and RR 2,121 as of 31 December 2017 and 2016, respectively.
The table below summarizes information about the Group’s investments in joint ventures and associates.
Interest held (percent) as of
Country of incorporation and principal place of business
31 December 31 December business Nature of operations 2017 2016
Joint Venture: OOO RusVinyl Russia Polyvinyl chloride production 50 50 OOO Yuzhno-Priobsky GPZ Russia
Associated petroleum gas processing 50 50
OOO NPP Neftekhimia Russia Polypropylene production 50 50
AO Sibgazpolimer* Russia
Investments in Omsk polypropylene plant, OOO “Poliom” (50 percent stake) 50 50
OOO SNHK Russia Production of plastics and synthetic resins 50 50
Associate: Reliance Sibur Elastomers Private Limited India
Butyl rubber production (investment project) 25 25
* Special purpose vehicle established for investing in production entities.
The voting and ownership percentage in joint ventures and associates are the same.
16 ADVANCES ISSUED AND RECEIVED UNDER PROJECT MANAGEMENT SERVICES
In July 2015, OOO Gazprom Pererabotka Blagoveshchensk, a Gazprom Group’s subsidiary, and AO NIPIgazpererabotka, a Group’s subsidiary, signed a contract for managing a project of construction of the Amur Gas Processing Plant (Amur GPP), located near the town of Svobodny, Amur Region. Under this agreement, NIPIGAZ manages and supervises engineering work, the equipment and materials procurement and delivery to site and construction work until the transfer of the plant to OOO Gazprom Pererabotka Blagoveshchensk in a state of mechanical completion. Remuneration under this contract includes reimbursement of payments to subcontractors for services rendered and equipment delivered, and management services fee.
The Group’s management considered that under this project the customer has a significant control over the construction process, including approval by OOO Gazprom Pererabotka Blagoveshchensk of contracts with subcontractors and preapproval of services rendered and equipment delivered by subcontractors before the acceptance by NIPIGAZ; also the customer bears credit risk considering the financing of this contract in line with schedules stipulated in subcontractors’ agreements. Thus, part of the remuneration under this contract, which is received from the customer and transferred to subcontractors for construction services and equipment delivery, is not recognized as revenue in the consolidated statement of profit or loss. Remuneration for management services rendered by NIPIGAZ is recognized within other revenue in the consolidated statement of profit or loss.
PAO SIBUR HOLDING NOTES TO THE IFRS CONSOLIDATED FINANCIAL STATEMENTS (In millions of Russian roubles, unless otherwise stated)
37
16 ADVANCES ISSUED AND RECEIVED UNDER PROJECT MANAGEMENT SERVICES (CONTINUED)
Advances received from OOO Gazprom Pererabotka Blagoveshchensk under this contract were paid in full to suppliers and subcontractors as advances for their respective works. The Group’s management considers the terms of advances received and paid based on the expected date of its utilisation in full amount, linked to contractual terms.
As of 31 December 2017 and 31 December 2016, the total amount of advances received from OOO Gazprom Pererabotka Blagoveshchensk under this contract is presented in the long-term advances received under project management services line in the amount of RR 57,099 and RR 33,669, respectively, and in the short-term advances received under project management services line in the amount of RR 33,544 and RR 2,587, respectively, in the consolidated statement of financial position. Advances paid are presented in the long-term advances issued under project management services line in the amount of RR 52,027 and RR 33,109, respectively, and in the short-term advances issued under project management services line in the amount of RR 38,093 and RR 3,356, respectively, in the consolidated statement of financial position.
Advances issued and received under project management services also include advances under the project of construction of combined oil refining unit for AO Gazpromneft-MNPZ and the project of construction of utilities, infrastructure and offsites for AO Gazpromneft-ONPZ. Under these projects NIPIGAZ acts as Engineering, Procurement and Construction contractor.
17 PREPAID BORROWING COSTS
As of 31 December 2017 and 31 December 2016, prepaid borrowing costs of RR 6,762 and RR 7,141, respectively, included credit agencies premiums and fees for arranging long-term credit facilities for the Group’s subsidiary, ООО ZapSibNeftekhim, for the ZapSib execution. The current portion of prepaid borrowing costs of RR 4,455 and RR 3,709 as of 31 December 2017 and 31 December 2016, respectively, is accounted for under loans and borrowings within one year from the reporting date.
18 TRADE AND OTHER RECEIVABLES 31 December 2017 31 December 2016
Trade receivables (net of impairment provisions of RR241 and RR830 as of 31 December 2017 and 31 December 2016, respectively) 25,342 18,909 Other receivables (net of impairment provisions of RR263 and RR174 as of 31 December 2017 and 31 December 2016, respectively) 2,804 2,980
Total trade and other receivables 28,146 21,889 Less non-current portion: other receivables (Notes 4, 19 and 39) (2,408) (1,754)
25,738 20,135
The fair values of trade and other receivables approximate their carrying values. As of 31 December 2017 and 2016, respectively, RR 869 and RR 807 in trade receivables were secured by bank guarantees and other collaterals. All non-current receivables are due up to twenty years from reporting period date.
PAO SIBUR HOLDING NOTES TO THE IFRS CONSOLIDATED FINANCIAL STATEMENTS (In millions of Russian roubles, unless otherwise stated)
38
18 TRADE AND OTHER RECEIVABLES (CONTINUED)
The aging analysis of receivables that are past due but not impaired is as follows:
Trade receivables Other receivables Total As of 31 December 2017
Up to three months 1,572 12 1,583 Three to twelve months 88 3 91
Total 1,660 14 1,674 As of 31 December 2016
Up to three months 618 115 733 Three to twelve months 57 2 59
Total 675 117 792
Movements in the Group’s provision for impairment of receivables are as follows:
Trade receivables Other receivables Total As of 31 December 2015 232 177 409
Written off during the year as uncollectible (251) (28) (279) Unused amounts reversed (42) (41) (83) Acquisition of subsidiary 104 - 104 Impairment for receivables 787 66 853
As of 31 December 2016 830 174 1,004 Written off during the year as uncollectible (437) (2) (439) Unused amounts reversed (298) (91) (389) Impairment for receivables 146 182 328
As of 31 December 2017 241 263 504
The impairment provision was accrued on trade and other receivables that are more than 365 days past due or in case of specific impairment indicators for particular debtors. Accrual and release of the impairment provision have been recognized within other operating expenses in the consolidated statement of profit or loss. Amounts charged to the allowance account are generally written off, when there is no expectation of recovering additional cash.
19 OTHER NON-CURRENT ASSETS 31 December 2017 31 December 2016
Raw natural gas liquids in pipelines 1,977 1,975 Prepaid employee services 494 - Advances issued 175 112 Other 202 63
Total other non-current assets 2,848 2,150
In 2017, the Group announced a long-term incentive program for employees relocating to Tobolsk for launching and operating of ZapSib (“Program”). Under the Program, the Group provides to employees free of charge residential apartments located in Tobolsk during the five-year period from the relocation date. After five-year period from the relocation date an employee has an option to purchase apartment at a price lower than the Group cost incurred for the respective apartment (“Option”), payable during five-year period after the Option exercise date.
Under the Program the Group entered in the arrangement with Agency for Housing Mortgage Lending (“AHML”) who purchased from and leased-back to the Group apartments entitled under the Program to the Group’s employees. As of 31 December 2017, the Group recognized liability to AHML as payables under the Program in other non-current liabilities in the consolidated statement of financial position (see Note 28). The current portion of this liability was recognized in other payables in trade and other payables line of the consolidated statement of financial position.

PAO SIBUR HOLDING NOTES TO THE IFRS CONSOLIDATED FINANCIAL STATEMENTS (In millions of Russian roubles, unless otherwise stated)
39
19 OTHER NON-CURRENT ASSETS (CONTINUED)
Also, the Group recognized long-term receivables from employees in other long-term receivables in the consolidated statement of financial position in the amount of RR 187 as of 31 December 2017. Long-term receivables were recognized at present value of future cash flows payable by the Group’s employees under the Program if they exercise the Option.
The difference between the net book value of apartments sold to AHML and long-term receivables from employees recognized under the Program was accounted for as prepaid employee services in other non-current assets in the consolidated statement of financial position in the amount of RR 494 as of 31 December 2017. Prepaid employee services are expensed on a straight-line basis during ten-years from the relocation date. For the year ended 31 December 2017, the Group recognized RR 55 as expenses under the Program which were capitalized in cost of assets under construction of ZapSib.
20 INVENTORIES 31 December 2017 31 December 2016
Refined products and work in progress 17,822 16,689 Materials and supplies 11,855 12,670 Goods for resale 2,057 1,633
Total inventories 31,734 30,992
As of 31 December 2017 and 31 December 2016, inventory write-downs amounted to RR 357 and RR 281, respectively. No significant reversals of previous inventory write-downs were made during the years ended 31 December 2017 and 31 December 2016.
21 LOANS RECEIVABLE 31 December 2017 31 December 2016
OOO RusVinyl 1,499 - AO Sibgazpolimer - 846 Other 15 125
Total loans receivable 1,514 971 Less non-current portion: (1,501) - 13 -
In the first half 2016, the Group issued loans to entities controlled by several members of the Company’s Board of Directors and key management personnel for a total amount of RR 1,203, part of which was paid back in cash in the second half 2016. As of 31 December 2016, the outstanding balance of these loans was RR 120, which was paid back in cash in the first half 2017. The Group provided loans to its related parties on an arm’s length basis.
The fair values of loans receivable approximate their carrying value.
PAO SIBUR HOLDING NOTES TO THE IFRS CONSOLIDATED FINANCIAL STATEMENTS (In millions of Russian roubles, unless otherwise stated)
40
22 PREPAYMENTS AND OTHER CURRENT ASSETS 31 December 2017 31 December 2016 Non-financial assets
VAT receivable 8,818 6,477 Prepayments and advances to suppliers 7,828 4,637 Recoverable VAT 4,077 2,210 Prepaid excise 1,344 1,015 Recoverable excise 835 705 Other prepaid taxes and custom duties 750 944 Other current assets 224 177
Total non-financial assets 23,876 16,165 Financial assets
Other financial assets 209 216 Total financial assets 209 216 Total prepayments and other current assets 24,085 16,381
23 BANK DEPOSITS
In October 2016, the Group signed a USD 414 million long-term deposit agreement due in March 2023. The main terms of the deposit agreement, including maturity schedule and interest rate, matched with the respective terms of the agreement, under which the Group had obtained a loan from the same bank. This transaction meets the pass-through arrangement criteria defined in IAS 39 “Financial Instruments: Recognition and Measurement”. On the transaction date, therefore, the long-term deposit and long-term loan were derecognised by the Group from its consolidated statement of financial position.
In March 2017 bank released the Group from a payment of the loan portion in the amount of USD 23,5 million, simultaneously deposit was decreased by the same amount and rouble equivalent of RR 1,384 was returned to the Group; this development does not breach the pass-through arrangement criteria.
24 CASH AND CASH EQUIVALENTS
Cash and cash equivalents included deposits held in banks, which are readily convertible to cash and have an original maturity of less than three months, of RR 31,403 and RR 19,522 as of 31 December 2017 and 31 December 2016, respectively, and cash in transit in the amount of RR 1,798 as of 31 December 2017.
PAO SIBUR HOLDING NOTES TO THE IFRS CONSOLIDATED FINANCIAL STATEMENTS (In millions of Russian roubles, unless otherwise stated)
41
25 LONG-TERM DEBT EXCLUDING RELATED TO ZAPSIBNEFTEKHIM Long-term debt payable to Currency Due 31 December 2017 31 December 2016 Variable rate
Bank GPB RR 2023 22,000 - Raiffeisen Bank USD 2021 5,760 6,043 Deutsche Bank EUR 2014-2023 4,589 5,058 ING Bank Group EUR, USD 2011-2021 531 767 UniCredit Bank EUR 2013-2019 445 618 NPP Neftekhimia RR 2020 175 825 VTB Bank RR 2021 - 5,000 Sberbank of Russia RR 2018-2021 - 1,415
Fixed rate Russian rouble bonds RR 2019-2021 30,000 30,000 Eurobonds 2023 USD 2023 28,616 - Eurobonds 2018 USD 2018 25,528 37,352 Alfa-Bank USD 2019 14,400 15,164 UniCredit Bank Group RR 2022 4,974 12,917 Sberbank of Russia RR 2020-2022 1,896 20,000 Gazprom mezhregiongaz RR 2011-2018 233 544 Bank GPB RR 2021 - 22,000 VTB Bank RR 2021 - 4,988 Other USD 2031 - 26
Total long-term debt excluding related to ZapSibNeftekhim 139,147 162,717
Less: current portion (Note 30) (27,361) (1,862) 111,786 160,855
Eurobonds 2018. On 31 January 2013, the Group issued notes worth USD 1 billion on the Irish Stock Exchange, bearing 3.914 percent annual interest and maturing in 2018. The Group used the aggregate net proceeds from the notes issue to refinance short-term debt and for general corporate purposes. In 2016, the Group placed an offer to buy back notes before its original maturity date in the amount of USD 193.8 million in September at nominal value and USD 190 million in December at USD 1,017.5 per note with nominal value of USD 1,000 each. These bought-back notes were redeemed in full in 2016, and related loss on early redemption was recognized in the amount of RR 205 within other finance expenses in the consolidated statement of profit or loss for the year ended 31 December 2016.
In September 2017, the Group placed an offer to buy back notes before its original maturity date at USD 1,009 per note with nominal value of USD 1,000 each. The tender offer was accepted by the holders of notes worth of USD 172 million nominal value. These bought-back notes were redeemed in full in 2017, and related loss on early redemption was recognized in the amount of RR 90 within other finance expenses in the consolidated statement of profit or loss for the year ended 31 December 2017. The nominal amount of notes outstanding as of 31 December 2017 was USD 443.2 million. In January 2018, the outstanding amount of Eurobonds 2018 was paid in full.
Eurobonds 2023. On 05 October 2017, the Group issued notes worth USD 500 million on the Irish Stock Exchange, bearing 4.125 percent annual interest and maturing in 2023. The Group used the aggregate net proceeds from the notes issue for an early redemption of the Eurobonds 2018 issue and for general corporate purposes. The nominal amount of notes outstanding as of 31 December 2017 was USD 500 million.
Russian rouble bonds. In 2016, the Group placed three 10-year, non-convertible, rouble-denominated bond issues in the amount of RR 10,000 each on Moscow Exchange with an annual fixed coupons payable on a semi-annual basis. The first issue was on 29 March 2016 with a coupon rate of 10.5 percent for 5 subsequent years, the second and third issues were on 3 August 2016 and 28 September 2016 with a coupon rates of 9.65 percent for 3 and 3.5 subsequent years, respectively. At the end of periods with defined coupon rate, bondholders may request that the Group redeems the bonds. The Group allocated the aggregate net proceeds from the bond issue toward refinancing its long-term debt.

PAO SIBUR HOLDING NOTES TO THE IFRS CONSOLIDATED FINANCIAL STATEMENTS (In millions of Russian roubles, unless otherwise stated)
42
25 LONG-TERM DEBT EXCLUDING RELATED TO ZAPSIBNEFTEKHIM (CONTINUED)
The Group had no subordinated debt and no debts that may be converted into an equity interest in the Group.
The scheduled maturities of long-term debt excluding related to the ZapSib as of 31 December 2017 and 31 December 2016 are presented below:
31 December 2017 31 December 2016 Due for repayment:
Between one and two years 25,639 39,074 Between two and five years 35,258 114,868 More than five years 50,889 6,913
Total long-term debt excluding related to ZapSibNeftekhim 111,786 160,855
The carrying amounts of long-term fixed-rate borrowings approximate their fair value as of 31 December 2017 and 31 December 2016, except for those, which fair value is disclosed in Note 39.
The carrying amounts of long-term debts with variable interest rates linked to LIBOR, EURIBOR or the Central Bank of Russia key interest rate approximate their fair value.
As of 31 December 2017 and 31 December 2016, the Group had the following committed long-term credit facilities excluding related to the ZapSib:
Credit limit Undrawn amount As of 31 December 2017
USD-denominated (in millions of USD) 349 249 RR-denominated (in millions of RR) 6,000 6,000
As of 31 December 2016 USD-denominated (in millions of USD) 175 175 RR-denominated (in millions of RR) 9,300 7,885
As of 31 December 2017 and 31 December 2016, the total rouble equivalent of the Group’s undrawn committed long-term credit facilities excluding related to the ZapSib was RR 20,320 and RR 18,500, respectively.
26 LONG-TERM ZAPSIBNEFTEKHIM RELATED DEBT Long-term debt payable to Currency Due 31 December 2017 31 December 2016 Variable rate
National Wealth Fund financing USD 2030 100,800 106,150 Deutsche Bank (ECA financing) EUR 2020-2029 49,096 36,391 ING Bank Group (ECA financing) EUR 2013-2029 2,246 2,417 Citibank (ECA financing) USD 2013-2023 1,612 1,989
Fixed rate Russian Direct Investment Fund USD 2018-2020 12,096 12,738 Credit Agricole (ECA financing) EUR 2019-2029 7,347 -
Total long-term ZapSibNeftekhim related debt 173,197 159,685
Less: current portion (2,485) (915) 170,712 158,770
National Wealth Fund. On 4 December 2015, OOO ZapSibNeftekhim issued 15-year bonds worth USD 1,750 million to the Russian Federation Ministry of Finance. As a result, the Group received financing from Russia’s National Wealth Fund.

PAO SIBUR HOLDING NOTES TO THE IFRS CONSOLIDATED FINANCIAL STATEMENTS (In millions of Russian roubles, unless otherwise stated)
43
26 LONG-TERM ZAPSIBNEFTEKHIM RELATED DEBT (CONTINUED)
Deutsche Bank. In December 2014, the Group signed an agreement with a consortium of European banks led by Deutsche Bank to raise a long-term export credit agency financing (“ECA financing”) credit facility in the amount of EUR 1,575 million, which was increased in October 2015 by EUR 101 million to a total amount of EUR 1,676 million. As of 31 December 2017 and 31 December 2016, the Company had drawn down EUR 764 and EUR 615 million from this credit facility.
Russian Direct Investment Fund. In November 2015, a consortium of investors, consisting of the Russian Direct Investment Fund and leading Middle Eastern sovereign wealth funds, provided a loan to OOO ZapSibNeftekhim in the amount of USD 210 million.
The scheduled maturities of long-term ZapSib related debt as of 31 December 2017 and 31 December 2016 are presented below:
31 December 2017 31 December 2016 Due for repayment:
Between one and two years 7,382 2,506 Between two and five years 23,078 20,543 Between five and ten years 28,488 18,655 More than ten years 111,764 117,066
Total long-term ZapSibNeftekhim related debt 170,712 158,770
The carrying amounts of long-term fixed-rate borrowings approximate their fair value as of 31 December 2017 and 31 December 2016.
The carrying amounts of long-term debt with variable interest rates linked to LIBOR, EURIBOR or USA CPI approximate their fair value.
As of 31 December 2017 and 31 December 2016, the Group had the following committed long-term ZapSib related credit facilities:
Credit limit Undrawn amount As of 31 December 2017
EUR-denominated (in millions of EUR) 2,166 1,284 USD-denominated (in millions of USD) 400 400
As of 31 December 2016 EUR-denominated (in millions of EUR) 2,088 1,473
As of 31 December 2017 and 31 December 2016, the total rouble equivalent of the Group’s undrawn committed long-term ZapSib related credit facilities was RR 111,495 and RR 93,967, respectively.
Total Group’s long-term debt both including and excluding related to the ZapSib bore the following average interest rates: RR-denominated of 9.3 percent and 10.9 percent as of 31 December 2017 and 31 December 2016, respectively; USD-denominated of 4.0 percent and 3.3 percent as of 31 December 2017 and 31 December 2016, respectively; and EUR-denominated of 1.2 percent and 1.1 percent as of 31 December 2017 and 31 December 2016, respectively.

PAO SIBUR HOLDING NOTES TO THE IFRS CONSOLIDATED FINANCIAL STATEMENTS (In millions of Russian roubles, unless otherwise stated)
44
27 GRANTS AND SUBSIDIES
As a major investor in infrastructure and social projects in the regions where it operates, the Group has signed cooperation agreements with a number of regional authorities, including investment and financial support agreements. Under these agreements, the Group is entitled to a partial refund of capital expenditures and finance expenses incurred in the respective regions subject to certain conditions. Such refunds are made, either in the form of an income tax rebate or a direct grant of public funds, after the Group submits appropriate supporting documents to the relevant regional authority.
2017 2016 Grants and subsidies as of 1 January 41,082 42,096
Grants and subsidies received 11,274 1,723 Recognized in profit or loss (depreciation) (3,636) (2,737)
Grants and subsidies as of 31 December 48,720 41,082
28 OTHER NON-CURRENT LIABILITIES 31 December 2017 31 December 2016 Financial liabilities
Payables for acquisition of subsidiaries 5,792 6,496 Accounts payable to contractors and suppliers of property, plant and equipment 2,778 1,988 Payables under accommodation program (Note 19) 2,278 - Trade payables 1,137 - Other liabilities 6 -
Total financial non-current liabilities 11,991 8,484 Non-financial liabilities
Post-employment obligations 2,401 2,121 Payables to employees 2,181 1,773 Advances received 2 12
Total non-financial non-current liabilities 4,584 3,906 Total other non-current liabilities 16,575 12,390
As of 31 December 2017 and 2016, payables for the acquisition of subsidiaries included payables for the acquisition of OOO Tobolsk HPP of RR 4,674 and RR 4,798, respectively, and AO Polief of RR 1,060 and RR 1,645, respectively.
The Group maintains a cash-settled long-term incentive (LTI) plan. Among other factors, remuneration under the LTI plan is contingent upon the contribution that management makes toward increases in the Group’s business fair value, which is measured by changes in the Group’s business fair value divided by the median change in the business fair values of certain other international corporations operating in the petrochemical industry. The LTI plan requires that participants provide services to the Group within a specific time period. Remuneration granted is vested to each participant on an annual basis and in separate tranches. Each tranche equals 33.3 percent of the total remuneration granted, provided that the participant is continuously employed by the Group from the grant date until the applicable vesting date. Each tranche is accounted for as a separate arrangement and expensed, together with a corresponding increase within payables to employees in other non-current liabilities. The current portion of liabilities under the long-term incentive plan is classified within payables to employees in trade and other payables. For the years ended 31 December 2017 and 31 December 2016, the Group recognized RR 915 and RR 290, respectively, as expenses under the LTI plan.
The carrying amounts of other non-current liabilities approximate their fair value.

PAO SIBUR HOLDING NOTES TO THE IFRS CONSOLIDATED FINANCIAL STATEMENTS (In millions of Russian roubles, unless otherwise stated)
45
29 TRADE AND OTHER PAYABLES 31 December 2017 31 December 2016 Financial liabilities
Accounts payable to contractors and suppliers of property, plant and equipment 41,009 11,605 Trade payables 34,711 19,377 Payables for acquisition of subsidiaries (Note 4) 2,619 2,104 Interest payable 2,087 2,182 Other payables 514 1,406
Total financial trade and other payables 80,940 36,674 Non-financial liabilities
Payables to employees 7,948 6,818 Advances from customers 5,163 4,951 Other payables 1,309 1,564
Total non-financial trade and other payables 14,420 13,333 Total trade and other payables 95,360 50,007
As of 31 December 2017 and 2016, payables for the acquisition of subsidiaries included payables for the acquisition of OOO Tobolsk HPP of RR 1,881 and RR 1,985, respectively, and AO Polief of RR 738 and RR 119 respectively.
As of 31 December 2017 and 2016, payables to employees included provisions for annual bonuses, other bonuses and vacation accruals (including provisions for social taxes) of RR 7,948 and RR 6,818, respectively.
30 SHORT-TERM DEBT AND CURRENT PORTION OF LONG-TERM DEBT EXCLUDING RELATED TO ZAPSIBNEFTEKHIM
31 December 2017 31 December 2016 Short-term debt:
USD-denominated debt - 19,411 Total short-term debt - 19,411
Current portion of long-term debt excluding related to ZapSibNeftekhim (Note 25) 27,361 1,862
27,361 21,273
Short-term USD-denominated debt bore average interest rate of 1.5 percent as of 31 December 2016. The carrying amount of short-term debt approximates its fair value.
As of 31 December 2017 and 31 December 2016, the Group had no committed short-term credit facilities.
31 TAXES OTHER THAN INCOME TAX PAYABLE 31 December 2017 31 December 2016
VAT 6,918 4,676 Property tax 919 355 Social taxes 620 500 Other taxes 93 84
Total taxes other than income tax payable 8,550 5,615
PAO SIBUR HOLDING NOTES TO THE IFRS CONSOLIDATED FINANCIAL STATEMENTS (In millions of Russian roubles, unless otherwise stated)
46
32 SHAREHOLDERS’ EQUITY
On 14 December 2016, the Group’s shareholders entered into the sale of 10 percent stake in the Company’s share capital to the Silk Road Fund, an investment fund registered in China. The transaction was finalized in January 2017.
As of 31 December 2017 and 31 December 2016, the Group didn’t have direct parent company and an ultimate controlling shareholder.
Share capital. The share capital of PAO SIBUR Holding (authorised, issued and paid-in) was RR 21,784 as of 31 December 2017 and 31 December 2016, and consisted of 2,178,479,100 ordinary shares, each with a par value of ten Russian roubles.
Dividends. Dividends in the amount of RR 19,171 (8.80 Russian roubles per share) and RR 14,313 (6.57 Russian roubles per share) were paid during years ended 31 December 2017 and 31 December 2016, respectively.
Equity-settled share-based payment plans for directors and key management. On 28 June 2013, a company beneficially owned by Mr Leonid V. Mikhelson and Mr Gennady N. Timchenko granted equity-settled share-based payment plans to certain current and former members of the Group’s key management. The plan required that the participants provided services to the Group within a certain time period. The shares granted were vested to each participant annually in tranches. Each tranche was accounted for as a separate arrangement and expensed, together with a corresponding increase in shareholders’ equity, on a straight-line basis over the vesting periods. In the first quarter of 2015, the plan was modified by shareholders. As a result the shares granted were immediately vested and the remaining tranches were expensed and recognized in the consolidated statement of profit or loss with a corresponding increase in shareholders’ equity.

PAO SIBUR HOLDING NOTES TO THE IFRS CONSOLIDATED FINANCIAL STATEMENTS (In millions of Russian roubles, unless otherwise stated)
47
33 NON-CONTROLLING INTEREST
The following table provides information about each subsidiary with a non-controlling interest:
Place of
busi-ness
Propor-tion of
non-control-
ling interest, percent
Proportion of non-
controlling interest’s
voting rights held,
percent
Total comprehen-sive income attributab-
le to non-controlling
interest
Transac-tions with
non-control-
ling interest
Divi-dends
Accumula-ted non-
controlling interest in
the subsidiary
Year ended 31 December 2017
AO NIPIgazpererabotka Russia 55 50 3,182 - (513) 4,749 AO Krasnoyarsk Synthetic Rubbers Plant Russia 25 25 43 - (25) 192 OOO PlasticGeosintetika Russia 33 33 (16) - - 65 OOO SIBUR Krasnodar* Russia 55 50 24 - - (53) OOO LNG NOVAENGINEERING* Russia 55 50 99 - - 99
3,332 - (538) 5,052 Year ended 31 December 2016
AO Polief** Russia - - - (693) - - AO NIPIgazpererabotka Russia 55 50 2,050 1,628 (1,850) 2,080 AO Krasnoyarsk Synthetic Rubbers Plant Russia 25 25 (3) - - 174 OOO PlasticGeosintetika Russia 33 33 (13) - - 81 OOO SIBUR Krasnodar* Russia 55 50 (77) - - (77)
1,957 935 (1,850) 2,258 *a subsidiary of AO NIPIgazpererabotka **remaining interest was purchased by the Group in 2016 (see Note 4)
During the year ended 31 December 2017 and 2016 the Group’s subsidiary AO NIPIgazpererabotka distributed dividends in the amount of RR 513 and RR 1,850 respectively to non-controlling shareholders including those that simultaneously serve as senior management of the Group.
The summarised financial information of AO NIPIgazpererabotka before inter-company eliminations was as follows:
As of and for the year ended 31 December 2017 31 December 2016 Non-current assets 71,439 40,952 Current assets 52,000 10,831 Non-current liabilities 60,437 35,894 Current liabilities 54,292 12,028 Revenue 26,184 14,220

PAO SIBUR HOLDING NOTES TO THE IFRS CONSOLIDATED FINANCIAL STATEMENTS (In millions of Russian roubles, unless otherwise stated)
48
34 INCOME TAX
The movement in deferred income tax assets and liabilities during the year was as follows:
31 December
2017
Decon-solidation and
disposal of subsidiaries
(Charged)/ credited to
profit or loss/equity
Reclassifi-cations to
assets held for sale
31 December 2016
Business combinations
and acquisi-tions
(Charged)/ credited to
profit or loss/equity
Reclassifi-cations to / from assets
held for sale 31 December
2015 Tax effects of taxable temporary differences
Property, plant and equipment (26,088) 20 (3,255) - (22,853) (445) (2,461) 216 (20,163) Intangible assets (19,099) - 1,188 - (20,287) (823) 1,524 - (20,988) Trade and other receivables (6,600) - (3,762) 304 (3,142) - (59) - (3,083) Prepaid borrowing costs (1,349) - 29 - (1,378) - 315 - (1,693) Debt (858) - (103) - (755) - (443) - (312) Inventory (163) - 186 - (349) (29) (158) - (162) Others (106) - 31 - (137) - 104 - (241)
Deferred tax liabilities (54,263) 20 (5,686) 304 (48,901) (1,297) (1,178) 216 (46,642) Less: deferred tax assets offset 15,533 - 1,283 (296) 14,546 195 33 14,318
Total deferred tax liabilities (38,730) 20 (4,403) 8 (34,355) (1,297) (983) 249 (32,324) Tax effects of deductible temporary differences
Tax loss carry-forwards 14,560 - (631) - 15,191 - (3,182) 55 18,318 Grants and subsidies 7,029 - (232) - 7,261 - (624) - 7,885 Payables to employees 2,184 - 342 - 1,842 - (219) - 2,061 Trade and other payables 1,605 - 930 - 675 - 675 - - Inventory 1,266 - 850 - 416 - (523) (6) 945 Intangible assets 126 - (21) - 147 - (50) - 197 Others 494 (10) 705 (296) 95 10 (267) - 352
Deferred tax assets 27,264 (10) 1,943 (296) 25,627 10 (4,190) 49 29,758 Less: deferred tax liabilities offset (15,533) - (1,283) 296 (14,546) - (195) (33) (14,318)
Total deferred tax assets 11,731 (10) 660 - 11,081 10 (4,385) 16 15,440 Total net deferred tax liabilities (26,999) 10 (3,743) 8 (23,274) (1,287) (5,368) 265 (16,884)
Differences between recognition criteria under Russian tax regulations and under IFRS have given rise to temporary differences between the carrying value of certain assets and liabilities for financial reporting and income tax purposes. The tax effect of changes in these temporary differences is recorded at the applicable statutory tax rate.
Deferred income tax assets are recognized for tax loss carry-forwards to the extent that the realisation of the related tax benefits through future taxable profits is probable. Under the Russian Tax Code, during the period from 1 January 2017 to 31 December 2020 only up to 50% of a taxable income can be covered by tax losses carry-forward from previous periods. After 31 December 2020 a tax income can be covered by tax losses carry-forward from previous periods in full amount. Tax losses can be carried forward until fully recognized without time limitation.

PAO SIBUR HOLDING NOTES TO THE IFRS CONSOLIDATED FINANCIAL STATEMENTS (In millions of Russian roubles, unless otherwise stated)
49
34 INCOME TAX (CONTINUED)
Year ended 31 December 2017 2016 Current income tax:
Current income tax on profits for the year 25,971 24,228 Adjustments for prior years (43) (85)
Total current income tax 25,928 24,143 Deferred income tax:
Accrual of temporary differences 3,743 5,320 Total deferred income tax 3,743 5,320 Total income tax expense 29,671 29,463
The tax on the Group’s profit before income tax differs from the theoretical amount that would arise if the Russian statutory tax rate to the consolidated profit was used as follows:
Year ended 31 December 2017 2016 Profit before income tax 149,917 142,552
Theoretical income tax expense at statutory rate of 20 percent (29,983) (28,510) Tax effect of items which are not deductible or assessable for taxation purposes: Non-deductible expenses (667) (3,930) Other non-taxable income 979 2,977
Total income tax (expense) (29,671) (29,463)
As of 31 December 2017 and 2016 the Group prepaid income tax of RR 2,334 and RR 5,523, respectively. This prepayment may not be utilised by the Group within 12 months as it depends on the Group’s profit earned within 12 months. The Group did not classify this portion of prepaid income tax as non-current asset as it expects to realise this asset in its normal operating cycle.
Deferred income tax assets and liabilities are offset when there is a legally enforceable right to offset current tax assets against current tax liabilities, and when the deferred income tax assets and liabilities relate to income taxes within one entity.

PAO SIBUR HOLDING NOTES TO THE IFRS CONSOLIDATED FINANCIAL STATEMENTS (In millions of Russian roubles, unless otherwise stated)
50
35 CASH GENERATED FROM OPERATIONS AND NET DEBT RECONCILIATION
Year ended 31 December Notes 2017 2016
Profit before income tax 149,917 142,552 Adjustments to profit before income tax
7 Depreciation and amortization 35,486 34,996 8 Interest expense 6,416 13,880
28, 29 Accrual of bonuses 1,668 1,005 8 Unwinding of discount on non-current accounts payable 1,178 1,094
4, 39 Result of subsidiary’s acquisition and remeasurement of related liabilities 965 (1,666)
8 Bank commissions 783 3,619 7 Loss on disposal of property, plant and equipment 319 172 8 Pension liabilities 191 209
5, 7 Impairment of assets held for sale 180 - 7 Impairment of property, plant and equipment 164 1,502 8 Loss on derivative financial instruments - realized - 2,084 8 Change in fair value of derivative financial instruments - (2,188)
18 (Reversal of impairment)/impairment of trade and other receivables (72) 616 Discount on borrowings and non-current accounts payable (93) -
8 Unwinding of discount on loans receivable and non-current accounts receivable (142) (247)
Provision for court decisions (201) 677 8, 23 Gain on the loan release (1,384) -
8 Interest income (2,012) (1,013) 15 Share of net income of joint ventures and associates (2,073) (6,471) 8 Foreign exchange gain from investing and financing activities, net (9,495) (48,968) 4 Gain on disposal of subsidiary (19,805) -
Other adjustments (50) 289 Operating cash flows before working capital changes 161,940 142,142 Changes in working capital Increase in advances received under project management services 56,670 41,412 Increase in trade and other payables 17,660 2,699 Increase in taxes payable 2,878 2,316 (Increase)/decrease in trade and other receivables (3,944) 1,016 Increase in prepayments and other current assets (7,744) (87) Increase in inventories (1,156) (1,153) Increase in advances issued under project management services (53,987) (37,739) Total changes in working capital 10,377 8,464
Cash generated from operating activities before income tax payment 172,317 150,606
Income tax paid (19,640) (12,912) Net cash from operating activities 152,677 137,694
For the years ended 31 December 2017 and 31 December 2016, the reconciliation of net debt was as follows:
Cash and cash equivalents
Long-term and short-term debt Net debt
As of 31 December 2015 172,083 (457,149) (285,066) Cash flows (109,267) 64,036 (45,231) Foreign exchange adjustments (2,181) 47,817 45,636 Other non-cash movements - 3,483 3,483
As of 31 December 2016 60,635 (341,813) (281,178) Cash flows (11,132) 23,087 11,955 Foreign exchange adjustments (1,047) 5,758 4,711 Other non-cash movements - 624 624
As of 31 December 2017 48,456 (312,344) (263,888)
PAO SIBUR HOLDING NOTES TO THE IFRS CONSOLIDATED FINANCIAL STATEMENTS (In millions of Russian roubles, unless otherwise stated)
51
36 PRINCIPAL SUBSIDIARIES
Principal wholly owned operating subsidiaries of the Group:
OOO BIAXPLEN OOO SIBUR Tobolsk OOO BIAXPLEN T OOO SIBUR Togliatti OOO SIBUR GEOSINT OOO Tomskneftekhim SIBUR International GmbH AO Sibur-Himprom AO Sibur-Neftehim AO Voronezhsintezkauchuk AO SIBUR-PET AO Siburenergomenedgment AO SIBUR-Trans OOO Belozerny Gas Processing Complex OOO SIBUR-Kstovo OOO Nizhnevartovsky Gas Processing Complex OOO Zapsibtransgaz OOO Nyagangazpererabotka AO SiburTyumenGaz OOO ZapSibNeftekhim AO Polief
Other principal operating subsidiaries of the Group:
Effective percent of share capital held by the Group as of
31 December 2017 31 December 2016 AO NIPIgazpererabotka 45 45 AO Krasnoyarsk Synthetic Rubbers Plant 75 75 OOO PlasticGeosintetika 67 67
The changes in the composition of the Group and changes in the ownership interest in the subsidiaries are disclosed in Notes 3 and 4.
As of 31 December 2017 and 31 December 2016 the voting and ownership percentage in the Group’s subsidiaries with a non-controlling interest are the same, except for AO NIPIgazpererabotka in which the Group had 50 percentage voting rights (see Note 3).
The Group’s operating subsidiaries are registered and located in the Russian Federation, except for SIBUR International GmbH, an export trading company of the Group registered in Austria.
37 RELATED PARTIES
For the purposes of these consolidated financial statements, parties are generally considered to be related if the party is part of the Group’s key management or the Board of Directors; the party has the ability to control or jointly control the other party; both parties are under common control; or one party can exercise significant influence over the other party in the financial and operational decision-making process. In considering each possible related-party relationship, the Group’s management pays attention to the substance of the relationship, and not merely the entities’ legal form.
Related parties may enter into transactions that unrelated parties may not enter into, and transactions between related parties may not be effected on the same terms, conditions and amounts as transactions between unrelated parties.
The nature of the related-party relationships for those related parties with whom the Group entered into significant transactions during the years ended 31 December 2017 and 2016, or had significant balances outstanding as of 31 December 2017 and 31 December 2016, are presented below.

PAO SIBUR HOLDING NOTES TO THE IFRS CONSOLIDATED FINANCIAL STATEMENTS (In millions of Russian roubles, unless otherwise stated)
52
37 RELATED PARTIES (CONTINUED)
a) Significant transactions with parties under control or joint control of Mr Gennady N. Timchenko
During the years ended 31 December 2017 and 31 December 2016, the Group entered into transactions with AO Stroytransgaz and its subsidiaries (jointly, the AO “Stroytransgaz Group”), controlled by Mr G. N. Timchenko, who is a member of key management personnel of the Group. These transactions primarily included purchases by the Group from AO Stroytransgaz Group of construction, repair and maintenance services.
The Group had the following transactions with AO Stroytransgaz Group for years ended 31 December 2017 and 2016:
Year ended 31 December 2017 2016
Operating and investing activities Sales of other goods and services 1 4 Purchases of construction and repair and maintenance services (2) (680)
As of 31 December 2017 and 2016 the Group didn’t have balances and contractual capital commitments with AO Stroytransgaz Group.
b) Remuneration of directors and key management
During 2017 the Company’s Board of Directors comprised eleven individuals (in 2016 comprised ten individuals), including shareholder representatives. Members of the Board of Directors are entitled to annual compensation, as approved by the Annual General Shareholders’ Meeting.
In 2017 and 2016, the Company accrued RR 98 and RR 88 net of social taxes, respectively, to Board of Directors members as part of their compensation for the years ended 31 December 2017 and 2016.
In January 2017, the number of key management personnel comprised 16 individuals and since February 2017 comprised 15 individuals. During the first six month of 2016 the number of key management personnel comprised 15 individuals and during the second half of the year ended 31 December 2016 comprised 16 individuals. Key management personnel are entitled to salaries, bonuses, voluntary medical insurance and other employee benefits (see Notes 28 and 29). Remuneration for key management personnel is determined by the terms set out in the relevant employment contracts and is substantially linked to the financial performance of the Group. Remuneration of key management personnel amounted to RR 1,836 and RR 1,401 net of social taxes for the years ended 31 December 2017 and 2016, respectively, including adjustments for accruals of provision for previous years. The growth of the remuneration of key management personnel for the year ended 31 December 2017 is due to increased financial results of the Group.

PAO SIBUR HOLDING NOTES TO THE IFRS CONSOLIDATED FINANCIAL STATEMENTS (In millions of Russian roubles, unless otherwise stated)
53
37 RELATED PARTIES (CONTINUED)
c) Joint ventures
In 2017 and 2016, the Group had the following transactions with its joint ventures:
Year ended 31 December 2017 2016
Operating and investing activities Purchases of materials, goods and services (6,489) (8,129) Purchases of processing services (996) (949) Sales of materials, goods and services 8,413 7,186 Interest income 60 94 Interest expense (34) (135) Other financial income - 5 Other expense (4) (59)
As of 31 December 2017 and 2016, the Group had the following balances with its joint ventures:
31 December 2017 31 December 2016 Trade and other receivables 702 1,843 Loans receivable 1,507 846 Trade and other payables 2,322 1,621 Long-term debt - 825 Short-term debt 175 -
The Group provided and received loans to and from its joint ventures on market terms.
The Group has several agency arrangements with its joint ventures under which the Group is providing marketing, selling, construction management and procurement services. The agent remuneration earned by the Group under the agent arrangements is included in sales of materials line. The balances outstanding under the agent arrangements are included into trade and other payables and receivables.
38 FINANCIAL INSTRUMENTS AND FINANCIAL RISK FACTORS Financial assets 31 December 2017 31 December 2016 Non-current financial assets
Trade and other receivables 1,672 1,035 Loans receivable 1,501 - Non-current financial assets classified as available for sale 736 719 Other non-current financial assets 23 26
Total non-current financial assets 3,932 1,780 Current financial assets
Cash and cash equivalents 48,456 60,635 Trade and other receivables 25,738 20,135 Loans receivable 13 971 Other current financial assets 209 216
Total current financial assets 74,416 81,957 Total current and non-current financial assets 78,348 83,737
PAO SIBUR HOLDING NOTES TO THE IFRS CONSOLIDATED FINANCIAL STATEMENTS (In millions of Russian roubles, unless otherwise stated)
54
38 FINANCIAL INSTRUMENTS AND FINANCIAL RISK FACTORS (CONTINUED)
Financial liabilities 31 December 2017 31 December 2016 Non-current financial liabilities
Other non-current liabilities 11,991 8,484 Debt 282,498 319,625
Total non-current financial liabilities 294,489 328,109 Current financial liabilities
Trade and other payables 80,940 36,674 Debt 29,846 22,188
Total current financial liabilities 110,786 58,862 Total current and non-current financial liabilities 405,275 386,971
The Group’s activities are exposed to a variety of financial risks: market risk (including foreign currency exchange risk, cash flow and fair value interest rate risk), credit risk and liquidity risk. The Group’s overall risk management focuses on financial market unpredictability, and seeks to minimise potential adverse effects on its financial performance. The Group focuses on managing exposure to risks that could lead to a potential loss of RR 1 billion or more.
Financial risk management is carried out by the central finance function. The Group’s treasury manages credit risks related to transactions with financial institutions and liquidity risk. Relevant business units manage credit risks related to operating activities in accordance with the Group policies.
Foreign exchange risk. As the Group operates internationally, exports its products to Europe and Asia, and has a substantial amount of foreign currency-denominated debt, it is exposed to foreign exchange risk.
The table below summarises the Group’s exposure to foreign currency exchange risk at the reporting date: Denominated in As of 31 December 2017 USD EUR Other currency
Cash and cash equivalents 26,501 1,957 92 Trade and other receivables 3,667 3,126 429 Non-current financial asset classified as available for sale 736 - -
Total financial assets 30,904 5,083 521 Trade and other payables 5,915 26,653 1,824 Debt 188,857 64,208 -
Total financial liabilities 194,772 90,861 1,824
Denominated in As of 31 December 2016 USD EUR Other currency
Cash and cash equivalents 16,581 779 72 Trade and other receivables 3,287 1,795 491 Non-current financial asset classified as available for sale 719 - -
Total financial assets 20,587 2,574 563 Trade and other payables 4,695 5,955 23 Debt 198,968 45,156 -
Total financial liabilities 203,663 51,111 23
The sensitivity analysis given in the table below reflects the hypothetical gain/loss that would occur assuming the Russian rouble had weakened/strengthened by 20 percent against the US dollar and euro and that there were no changes in the securities portfolio and other variables as of 31 December 2017 and 2016, respectively.

PAO SIBUR HOLDING NOTES TO THE IFRS CONSOLIDATED FINANCIAL STATEMENTS (In millions of Russian roubles, unless otherwise stated)
55
38 FINANCIAL INSTRUMENTS AND FINANCIAL RISK FACTORS (CONTINUED)
Increase in exchange rate 31 December 2017 31 December 2016 Effect on profit before income tax
RR / USD 20 percent (32,774) (36,615) RR / EUR 20 percent (17,156) (9,707)
Decrease in exchange rate 31 December 2017 31 December 2016
Effect on profit before income tax RR / USD 20 percent 32,774 36,615 RR / EUR 20 percent 17,156 9,707
Cash flow and fair value interest rate risk. The Group is exposed to interest rate risk primarily due to short- and long-term debt at variable rates. Debt issued at fixed rates exposes the Group to fair value interest rate risk. As of 31 December 2017 and 2016, the Group’s debt at variable rates was denominated in Russian roubles, US dollars and euro (see Notes 25, 26, 30). As of 31 December 2017 and 2016, the Group’s interest-bearing assets were primarily comprised by loans receivable and cash deposits. The Group analyses its interest rate exposure on a regular basis. The Group’s management makes financial decisions after careful consideration of various scenarios, which may include refinancing, renewing existing positions or alternative financing.
If variable interest rates were higher/lower, assuming all other variables remain constant, the Group’s profit before income tax would change as follows:
Increase in floating rates by 31 December 2017 31 December 2016 Effect on profit before income tax
RUR-denominated debt 10 percent (172) (63) USD-denominated debt 10 percent (223) (120)
Decrease in floating rates by 31 December 2017 31 December 2016
Effect on profit before income tax RUR-denominated debt 10 percent 172 63 USD-denominated debt 10 percent 223 14
Credit risk. The Group is exposed to credit risk primarily due to cash and cash equivalents, loans issued and customers credit risks.
The Group deposits cash and cash equivalents only in banks that have minimal risk of default within set credit limits at the deposit date.
A large portion of the Group’s receivables from domestic sales relates to large companies such as Rosneft, Gazprom Pererabotka and Novatek, with low credit risks. The Group’s export customers are also key market players such as BOREALIS AG, SHV Gas Supply & Risk Management, Gunvor SA. The Group sells its products on export sales based on prepayments or advances received or secures its export sales by letters of credit. The Group assesses the credit quality of its customers based on market segment, customer’s financial position, its market share past experience and other relevant factors. Although economic factors affecting the Group’s customers influence cash collection of the Group’s accounts receivable, the Group’s management assesses that there is no significant risk of loss other than bad debts provided as of 31 December 2017.
As of 31 December 2017 and 2016, the maximum credit risk exposure due to accounts receivable was RR 28,378 and RR 22,129 respectively.
The Group estimates the fair value of its financial liabilities as a close-out amount that does not incorporate changes in credit risks.
PAO SIBUR HOLDING NOTES TO THE IFRS CONSOLIDATED FINANCIAL STATEMENTS (In millions of Russian roubles, unless otherwise stated)
56
38 FINANCIAL INSTRUMENTS AND FINANCIAL RISK FACTORS (CONTINUED)
The credit risk posed by off-balance sheet financial instruments is defined as the possibility of sustaining a loss as a result of another party to a financial instrument failing to adhere to the relevant contract. The Group uses the same credit policies in assuming conditional obligations as it does for on-balance sheet financial instruments, through established credit approvals, risk control limits and monitoring procedures.
The table below shows the credit limit and balance of cash and cash equivalents of the Group’s major counterparty groups as of the reporting date.
As of and for the year ended 31 December 2017
Bank equity Rating Credit limit for one bank Balance Major banks >=25,000 A+,BBB-,
BB+, BB USD 200 mln, in individual cases
-unlimited 48,346
Other banks Not set Not set Individually set 110 Total cash and cash equivalents 48,456
As of and for the year ended 31 December 2016
Bank equity Rating Credit limit for one bank Balance Major banks >=25,000 BBB-, BB- USD 200 mln, in individual cases
-unlimited 60,606
Other banks Not set Not set Individually set 29 Total cash and cash equivalents 60,635
The Group did no exceed its credit limits during the reporting period, and the Group’s management does not expect any losses resulting from these counterparties’ non-performance. As of 31 December 2017 and 2016, the maximum credit risk exposure due to cash and cash equivalents was RR 48,456 and RR 60,635, respectively.
Liquidity risk and capital risk management. Liquidity risk management includes maintaining sufficient cash balances, available funding from an adequate amount of committed credit facilities, and the ability to close out market positions. Due to the dynamic nature of the underlying businesses, the Group’s management maintains funding flexibility by ensuring funds availability under committed credit lines and expected cash flows from operating activities. Management monitors rolling forecasts of the Group’s liquidity reserve, comprising the undrawn debt facilities (see Notes 25, 26, 30), and cash and cash equivalents on the basis of expected cash flow. This is carried out at the Group level on a monthly and annual basis. In addition, the Group’s liquidity management policy involves projecting cash flows in major currencies and considering the level of liquid assets necessary to meet cash requirements while maintaining debt financing plans.
The table below analyses the Group’s non-derivative financial liabilities in relevant maturity groupings based on the remaining period at the reporting date up to the contractual maturity date.
Less than Between one Between two As of 31 December 2017 one year and two years and five years Over five years
Debt 41,949 44,601 83,950 222,096 Trade and other payables 78,698 4,749 6,974 5,939
Total 120,647 49,350 90,924 228,035 As of 31 December 2016
Debt 39,432 57,794 163,217 165,285 Trade and other payables 34,492 3,015 6,884 1,938
Total 73,924 60,809 170,101 167,223
Guarantees issued by the Group as of 31 December 2017 and 31 December 2016 are disclosed in Note 15.

PAO SIBUR HOLDING NOTES TO THE IFRS CONSOLIDATED FINANCIAL STATEMENTS (In millions of Russian roubles, unless otherwise stated)
57
38 FINANCIAL INSTRUMENTS AND FINANCIAL RISK FACTORS (CONTINUED)
As the amounts in the table represent contractual undiscounted cash flows, they may not reconcile with those disclosed in the consolidated statement of financial position on debt and trade and other payables.
The Group monitors liquidity on the basis of the net debt to EBITDA ratio, which was calculated as net debt divided by EBITDA. Net debt is calculated as total debt less cash and cash equivalents.
EBITDA for any period means the Group’s profit or loss for the period adjusted for income tax expense, finance income and expenses, share of net income/loss of joint ventures and associates, depreciation and amortisation, impairment of property, plant and equipment, profit or loss on disposal of investments and other exceptional items.
In accordance with the Group’s financial policy the Group shall maintain a net debt to EBITDA ratio of no higher than 2.5 and an EBITDA to interest accrued ratio of no lower than 7. This policy is stricter than the relevant contractual requirements. The net debt to EBITDA ratio was 1.64 and 2.01 as of 31 December 2017 and 2016, respectively. The EBITDA to interest accrued ratio was 10.6 and 6.4 for the years ended 31 December 2017 and 2016, respectively.
The primary objectives of the Group’s liquidity management policy is to ensure a strong liquidity base to fund and sustain its business operations through prudent investment decisions as well as to maintain investor, market and creditor confidence to support its business activities.
39 FAIR VALUE OF FINANCIAL INSTRUMENTS
Recurring fair value measurements
Recurring fair value measurements are those that are required or permitted under the relevant accounting standards in the consolidated statement of financial position at the end of each reporting period.
a) Financial instruments carried at fair value
Swap agreements. In 2014-2015, the Group entered into several arrangements with Sberbank of Russia, Nordea Bank and Promsvyazbank. In accordance with those arrangements, the Group swaps principal amounts and interest payable in US dollars to Russian roubles at a fixed rate.
The Group recognized swap arrangements as derivatives at fair value through profit or loss determined based on Level 2 measurements. Fair value was calculated based on projected cash flows defined in accordance with the contractual terms, discounted at the risk-free rates denominated in the relevant currencies and converted at the prevailing spot currency exchange rate as at the reporting date.
In the first half of 2016, these agreements were settled. The Group recognized gain on derivative financial instruments in the amount of RR 104 as finance income in the consolidated statement of profit or loss as a result of the settlement.
Contingent consideration for the sale of OOO SIBUR-Portenergo. In November 2015, the Group recognized the contingent consideration in the amount of RR 698 as a financial asset classified as available for sale within non-current trade and other receivables in the consolidated statement of financial position as the part of the consideration from disposal of its subsidiary OOO SIBUR-Portenergo (see Note 4).

PAO SIBUR HOLDING NOTES TO THE IFRS CONSOLIDATED FINANCIAL STATEMENTS (In millions of Russian roubles, unless otherwise stated)
58
39 FAIR VALUE OF FINANCIAL INSTRUMENTS (CONTINUED)
Fair value of this financial instrument was determined using Level 3 measurements, as the sum of potential outcomes determined in the share purchase agreement weighted by the corresponding probability of each scenario. As of 31 December 2017 and 31 December 2016, the fair value of this contingent consideration was assessed as RR 736 and RR 719, respectively. The unwinding of discount in the amount of RR 54 and RR 54 was recognized as finance income in the consolidated statement of profit or loss for the years ended 31 December 2017 and 2016, respectively. A forex loss in the amount of RR 37 and RR 135 was recognized as finance expense in the consolidated statement of profit or loss for the years ended 31 December 2017 and 2016, respectively.
Contingent consideration for the purchase of OOO Tobolsk HPP. In February 2016, the Group recognized a contingent consideration in the amount of RR 585 as a financial liability within other non-current liabilities in the consolidated statement of financial position as a part of the total purchase consideration for the acquisition of its subsidiary OOO Tobolsk HPP (see Note 4).
The fair value of this financial instrument was determined using Level 3 measurements, as the sum of potential outcomes for different scenarios in which the Group realises synergies from integrating Tobolsk HPP into its production site infrastructure in Tobolsk, multiplied by the probability of each scenario. In 2017, the Company reassessed the probability of each scenario, and as a result, recognized loss of RR 1,045 in the result of subsidiary’s acquisition and remeasurement of related liabilities line of the consolidated statement of profit or loss. As of 31 December 2017 and 2016, the fair value of this contingent consideration was assessed as RR 1,818 and RR 666, respectively. Correspondingly, the unwinding of discount amounting to RR 107 and RR 81 was recognized as a financial expense in the consolidated statement of profit or loss for the year ended 31 December 2017 and 2016.
b) Assets and liabilities not measured at fair value but for which fair value is disclosed
Liabilities carried at amortised cost. As of 31 December 2017 and 31 December 2016, the fair value of the Eurobonds 2018 (see Note 25) was RR 25,736 and RR 38,477, respectively. As of 31 December 2017, the fair value of the Eurobonds 2023 (see Note 25) was RR 28,945. It was calculated based on Level 1 measurements such as quoted market prices. The fair values of other long-term and short-term debt carried at amortised cost were determined using valuation techniques. The estimated fair value of variable interest rate instruments linked to LIBOR, EURIBOR, USA CPI or the Central Bank of Russia key interest rate with stated maturity was estimated based on Level 2 measurements as expected cash flows discounted at current LIBOR, EURIBOR, USA CPI or the Central Bank of Russia key interest rate increased by the margin stipulated by the corresponding loan agreement. The estimated fair value of fixed interest rate instruments with stated maturity was estimated based on Level 3 measurements as expected cash flows discounted at current interest rates for new instruments with similar credit risk and remaining maturity. As of 31 December 2017, the fair value of the Russian rouble bonds with maturity date 26 March 2021 (see Note 25) was RR 10,729. As of 31 December 2017 the fair value of Credit Agricole Loan (ECA financing) was RR 8,107. The carrying amounts of other long-term and short-term liabilities carried at amortised cost in the consolidated statement of financial position approximate their fair value.
Other financial assets and liabilities. The carrying amounts of other financial assets and liabilities in the consolidated statement of financial position approximate their fair value, as determined based on Level 3 measurements.
40 COMMITMENTS, CONTINGENCIES AND OPERATING RISKS
Operating environment. The Russian Federation displays certain characteristics of an emerging market. Its economy is particularly sensitive to oil and gas prices. The legal, tax and regulatory frameworks continue to develop and are subject to varying interpretations.

PAO SIBUR HOLDING NOTES TO THE IFRS CONSOLIDATED FINANCIAL STATEMENTS (In millions of Russian roubles, unless otherwise stated)
59
40 COMMITMENTS, CONTINGENCIES AND OPERATING RISKS (CONTINUED)
The Russian economy was growing in 2017, after overcoming the economic recession of 2015 and 2016. The economy is negatively impacted by low oil prices, ongoing political tension in the region and international sanctions against certain Russian companies and individuals. The financial markets continue to be volatile.
In the year 2014, the USA and the EU imposed a number of sectorial and personal sanctions against some of Russian companies and Russian citizens. These sanctions restrict certain US and EU persons and companies from providing financing, goods and services to certain entities. The Group considers these sanctions in its activities, continuously monitors them and analyses the effect of the sanctions on the Group’s financial position and results of operations. As of 31 December 2017 the Group was not subject to economic sanctions and restrictions imposed by the USA and the EU.
Russia’s future economic development is dependent upon both external factors and government measures to sustain growth and change the tax, legal and regulatory environment. Management believes it is taking all necessary measures to support the sustainability and development of the Group’s business in the current business and economic environment. However, the future effects of the current economic situation are difficult to predict and management’s current expectations and estimates could differ from actual results.
Legal proceedings. During the reporting period, the Group was involved in a number of lawsuits (as both plaintiff and defendant) arising in the ordinary course of business. Management believes there are no current legal proceedings or other outstanding claims that could have a material adverse effect on the Group’s operational results or financial position, and which have not been accrued or disclosed in the consolidated financial statements.
Certain agreements under which the Group has disposed of various businesses and assets contain warranties and indemnities in favour of purchasers related to title, environmental and other matters. Although the Group’s potential obligations under such warranties and indemnities may be material, the scope of such potential obligations cannot be accurately assessed until a specific claim is filed.
Taxation. Russian tax, currency and customs legislation is subject to varying interpretations and frequent changes. The Group management’s interpretation of such legislation, as applied to the Group’s transactions and activity, may be challenged by the relevant federal and regional authorities.
The Russian tax authorities may take a more assertive position in their interpretation of the law and assessments, and it is possible that transactions and activities that have not been challenged in the past may now be challenged. As a result, significant additional taxes, penalties and interest may be assessed. Fiscal periods remain open to review by the authorities in respect of taxes for the three calendar years preceding the year under review. However, earlier periods also could be reviewed under certain conditions. According to the Group’s management as at 31 December 2017 their interpretation of relevant legislation is correct and the Group’s position will be stable from tax, currency and customs legislation standpoint.
The Russian transfer pricing legislation is generally aligned with the international transfer pricing principles developed by the Organisation for Economic Cooperation and Development (OECD), although it has specific features. This legislation provides for the possibility of additional tax assessments for controlled transactions (transactions between related parties and certain transactions between unrelated parties) if such transactions are not on an arm’s-length basis. The Management has implemented internal controls to be in compliance with this transfer pricing legislation.
Tax liabilities arising from controlled transactions are determined based on their actual transaction prices. It is possible, with the evolution of the interpretation of the transfer pricing rules, that such transfer prices could be challenged. The impact of any such challenge cannot be reliably estimated; however, it may be significant to the financial position and/or the overall operations of the Group.
PAO SIBUR HOLDING NOTES TO THE IFRS CONSOLIDATED FINANCIAL STATEMENTS (In millions of Russian roubles, unless otherwise stated)
60
40 COMMITMENTS, CONTINGENCIES AND OPERATING RISKS (CONTINUED)
The Group includes companies incorporated outside of Russia. The Group’s tax liabilities are determined on the assumption that these companies are not subject to Russian income tax, if they are not permanently established in Russia. Russian tax law does not provide detailed rules on the taxation of foreign companies. With the evolution of the interpretation of these rules and changes in the Russian tax authorities’ approach, it is possible that the non-taxable status of some or all of the Group’s foreign companies in Russia may be challenged. The impact of any such challenge cannot be reliably assessed; however, it may be significant to the financial condition and/or overall operations of the Group.
Russian tax legislation provides wide range of incentives related to specific types of taxable property, while, there is an uncertainty in classification criteria for assets eligible for such preferential taxation. Group management adopts its internal policy to classify assets subject to the beneficial tax treatment. With the evolution of the interpretation of these rules and changes in the Russian tax authorities’ approach, it is possible that the eligibility of such assets to be taxed beneficially may be challenged. The impact of any such challenge was assessed as not significant to the financial condition and/or overall operations of the Group.
The Group’s management believes that its interpretation of the relevant legislation is appropriate and that the Group’s tax, currency and customs positions will be sustained. Where the Group’s management believes it is probable that a position cannot be sustained, an appropriate amount has been accrued for in these consolidated financial statements.
Environmental matters. The enforcement of environmental regulations in the Russian Federation is evolving, and the enforcement posture of government authorities is continually being reconsidered. The Group periodically evaluates its obligations under environmental regulations. Obligations are recognized as soon as they are determined. Potential liabilities that could arise as a result of changes in existing regulations, civil litigation or legislation, cannot be estimated, but could be material.
Management believes that there are no likely liabilities for environmental damage, that would have a materially adverse impact on the Group’s financial position or operating results.
Social commitments. The Group contributes to the maintenance and upkeep of the local infrastructure and the welfare of employees in those areas where it has production operations, including contributions to the construction, development and maintenance of housing, hospitals, transport services, recreational facilities and other social infrastructure. Such funding is expensed as incurred.
Compliance with covenants. The Group is subject to certain covenants primarily related to its debt. Non-compliance with such covenants may result in negative consequences for the Group, i.e. increased borrowing costs. Management believes that the Group is in compliance with its covenants.
Operating lease commitments. Where the Group is a lessee in a lease that does not substantially transfer all risks and rewards incidental to ownership from the lessor to the Company, the total lease payments (as specified in a lease contract) are charged to profit or loss for the year on a straight-line basis over the lease term. The Company has two types of lease contracts in place: fixed-term agreements and continuous contracts. The vast majority of fixed-term contracts are non-cancellable before the expiry date and only a few of them may be terminated by the lessee at its sole discretion. The continuous contracts may be terminated by either party by giving proper notice of termination. The lease term is the non-cancellable period for which the lessee has contracted to lease the asset together with any further terms for which the lessee has the option to continue to lease the asset, with or without further payment, when at the inception of the lease it is reasonably certain that the lessee will exercise the option. Lease payments include payments for non-lease elements in the arrangement such as scheduled maintenance expenses, insurance expenses, pollution charges and related taxes. Payments for the non-lease elements are not specifically predetermined in the contracts and may vary depending on the level of servicing required. Accordingly, it would not be practicable to disclose them separately.

PAO SIBUR HOLDING NOTES TO THE IFRS CONSOLIDATED FINANCIAL STATEMENTS (In millions of Russian roubles, unless otherwise stated)
61
40 COMMITMENTS, CONTINGENCIES AND OPERATING RISKS (CONTINUED)
The Group’s operating lease commitments as of 31 December 2017 and 31 December 2016 were as follows:
31 December 2017 31 December 2016 Less than 1 year 10,254 8,642 From 1 year to 5 years 23,368 26,121 More than 5 years 1,218 2,742
Total operating lease commitments 34,839 37,505
The majority of the Group’s lease contracts are for rail cars and shipping vessels that the Group uses to transport its produced goods to customers. Related expenses are accounted as transportation and logistics within operating expenses in the consolidated statement of profit or loss.
As long as the Group has lease operations, there will be impact on the Group’s consolidated financial statements from adoption of the new standard IFRS 16 “Leases” that is effective for annual periods beginning on or after 1 January 2019. The Group is currently in the process of development of methodology for an accounting under the new standard. In accordance with the current estimates, which are still under discussion, in case the new accounting rules were effective since 01 January 2017 financial lease liability would approximate RR 40 billion as of 31 December 2017, also for the year ended 31 December 2017 EBITDA would approximate RR 173 billion.
Capital commitments. The Group has entered into contracts for the purchase of property, plant and equipment and construction services. As of 31 December 2017, the Group had contractual capital expenditure commitments of RR 182,913, including RR 174,855 related to the ZapSib (as of 31 December 2016: RR 218,308, including RR 213,703 related to the ZapSib), calculated as the contractual amount of construction contracts less cash paid under these contracts. The capital commitments should not be considered as binding since they can be cancelled on the sole management’s decision without any significant losses for the Group, except those liabilities, which were already recognized in the consolidated statement of financial position.
41 NEW ACCOUNTING DEVELOPMENTS
The following amended standards became effective from 1 January 2017, but did not have a material impact on the Group:
Disclosure Initiative – Amendments to IAS 7 (issued on 29 January 2016 and effective for annual periods beginning on or after 1 January 2017). The new disclosures are included in Note 35.
Recognition of Deferred Tax Assets for Unrealised Losses – Amendment to IAS 12 (issued on 19 January 2016 and effective for annual periods beginning on or after 1 January 2017).
Amendments to IFRS 12 included in Annual Improvements to IFRSs 2014-2016 cycle (issued on 8 December 2016 and effective for annual periods beginning on or after 1 January 2017).
42 NEW ACCOUNTING PRONOUNCEMENTS
Certain new standards and interpretations have been issued that are mandatory for the annual periods beginning on or after 1 January 2018 or later, and which the Group has not early adopted.
The Group is currently assessing the impact of the amendments and new standards on its consolidated financial statements.

PAO SIBUR HOLDING NOTES TO THE IFRS CONSOLIDATED FINANCIAL STATEMENTS (In millions of Russian roubles, unless otherwise stated)
62
42 NEW ACCOUNTING PRONOUNCEMENTS (CONTINUED)
IFRS 9 “Financial Instruments: Classification and Measurement” (amended in July 2014 and effective for annual periods beginning on or after 1 January 2018). Key features of the new standard are:
Financial assets are required to be classified into three measurement categories: those to be measured subsequently at amortised cost, those to be measured subsequently at fair value through other comprehensive income (FVOCI) and those to be measured subsequently at fair value through profit or loss (FVPL).
Classification for debt instruments is driven by the entity’s business model for managing the financial assets and whether the contractual cash flows represent solely payments of principal and interest (SPPI). If a debt instrument is held to collect, it may be carried at amortised cost if it also meets the SPPI requirement. Debt instruments that meet the SPPI requirement that are held in a portfolio where an entity both holds to collect assets’ cash flows and sells assets may be classified as FVOCI. Financial assets that do not contain cash flows that are SPPI must be measured at FVPL (for example, derivatives). Embedded derivatives are no longer separated from financial assets but will be included in assessing the SPPI condition.
Investments in equity instruments are always measured at fair value. However, management can make an irrevocable election to present changes in fair value in other comprehensive income, provided the instrument is not held for trading. If the equity instrument is held for trading, changes in fair value are presented in profit or loss.
Most of the requirements in IAS 39 for classification and measurement of financial liabilities were carried forward unchanged to IFRS 9. The key change is that an entity will be required to present the effects of changes in own credit risk of financial liabilities designated at fair value through profit or loss in other comprehensive income.
IFRS 9 introduces a new model for the recognition of impairment losses – the expected credit losses (ECL) model. There is a ‘three stage’ approach which is based on the change in credit quality of financial assets since initial recognition. In practice, the new rules mean that entities will have to record an immediate loss equal to the 12-month ECL on initial recognition of financial assets that are not credit impaired (or lifetime ECL for trade receivables). Where there has been a significant increase in credit risk, impairment is measured using lifetime ECL rather than 12-month ECL. The model includes operational simplifications for lease and trade receivables.
Hedge accounting requirements were amended to align accounting more closely with risk management. The standard provides entities with an accounting policy choice between applying the hedge accounting requirements of IFRS 9 and continuing to apply IAS 39 to all hedges because the standard currently does not address accounting for macro hedging.
IFRS 17 "Insurance Contracts" (issued on 18 May 2017 and effective for annual periods beginning on or after 1 January 2021). IFRS 17 replaces IFRS 4, which has given companies dispensation to carry on accounting for insurance contracts using existing practices. As a consequence, it was difficult for investors to compare and contrast the financial performance of otherwise similar insurance companies. IFRS 17 is a single principle-based standard to account for all types of insurance contracts, including reinsurance contracts that an insurer holds. The standard requires recognition and measurement of groups of insurance contracts at: (i) a risk-adjusted present value of the future cash flows (the fulfilment cash flows) that incorporates all of the available information about the fulfilment cash flows in a way that is consistent with observable market information; plus (if this value is a liability) or minus (if this value is an asset) (ii) an amount representing the unearned profit in the group of contracts (the contractual service margin). Insurers will be recognising the profit from a group of insurance contracts over the period they provide insurance coverage, and as they are released from risk. If a group of contracts is or becomes loss-making, an entity will be recognising the loss immediately.

PAO SIBUR HOLDING NOTES TO THE IFRS CONSOLIDATED FINANCIAL STATEMENTS (In millions of Russian roubles, unless otherwise stated)
63
42 NEW ACCOUNTING PRONOUNCEMENTS (CONTINUED)
IFRIC 23 "Uncertainty over Income Tax Treatments" (issued on 7 June 2017 and effective for annual periods beginning on or after 1 January 2019). IAS 12 specifies how to account for current and deferred tax, but not how to reflect the effects of uncertainty. The interpretation clarifies how to apply the recognition and measurement requirements in IAS 12 when there is uncertainty over income tax treatments. An entity should determine whether to consider each uncertain tax treatment separately or together with one or more other uncertain tax treatments based on which approach better predicts the resolution of the uncertainty. An entity should assume that a taxation authority will examine amounts it has a right to examine and have full knowledge of all related information when making those examinations. If an entity concludes it is not probable that the taxation authority will accept an uncertain tax treatment, the effect of uncertainty will be reflected in determining the related taxable profit or loss, tax bases, unused tax losses, unused tax credits or tax rates, by using either the most likely amount or the expected value, depending on which method the entity expects to better predict the resolution of the uncertainty. An entity will reflect the effect of a change in facts and circumstances or of new information that affects the judgments or estimates required by the interpretation as a change in accounting estimate. Examples of changes in facts and circumstances or new information that can result in the reassessment of a judgment or estimate include, but are not limited to, examinations or actions by a taxation authority, changes in rules established by a taxation authority or the expiry of a taxation authority's right to examine or re-examine a tax treatment. The absence of agreement or disagreement by a taxation authority with a tax treatment, in isolation, is unlikely to constitute a change in facts and circumstances or new information that affects the judgments and estimates required by the Interpretation.
IFRS 16 “Leases” (issued on 13 January 2016 and effective for annual periods beginning on or after 1 January 2019). The new standard sets out the principles for the recognition, measurement, presentation and disclosure of leases. All leases result in the lessee obtaining the right to use an asset at the start of the lease and, if lease payments are made over time, also obtaining financing. Accordingly, IFRS 16 eliminates the classification of leases as either operating leases or finance leases as is required by IAS 17 and, instead, introduces a single lessee accounting model. Lessees will be required to recognise: (a) assets and liabilities for all leases with a term of more than 12 months, unless the underlying asset is of low value; and (b) depreciation of lease assets separately from interest on lease liabilities in the income statement. IFRS 16 substantially carries forward the lessor accounting requirements in IAS 17. Accordingly, a lessor continues to classify its leases as operating leases or finance leases, and to account for those two types of leases differently. The Group is currently assessing the impact of this new standard on its consolidated financial statements (see Note 40).
Annual Improvements to IFRSs 2015-2017 cycle - amendments to IFRS 3, IFRS 11, IAS 12 and IAS 23 (issued on 12 December 2017 and effective for annual periods beginning on or after 1 January 2019). The narrow scope amendments impact four standards. IFRS 3 was clarified that an acquirer should remeasure its previously held interest in a joint operation when it obtains control of the business. Conversely, IFRS 11 now explicitly explains that the investor should not remeasure its previously held interest when it obtains joint control of a joint operation, similarly to the existing requirements when an associate becomes a joint venture and vice versa. The amended IAS 12 explains that an entity recognises all income tax consequences of dividends where it has recognised the transactions or events that generated the related distributable profits, eg in profit or loss or in other comprehensive income. It is now clear that this requirement applies in all circumstances as long as payments on financial instruments classified as equity are distributions of profits, and not only in cases when the tax consequences are a result of different tax rates for distributed and undistributed profits. The revised IAS 23 now includes explicit guidance that the borrowings obtained specifically for funding a specified asset are excluded from the pool of general borrowings costs eligible for capitalisation only until the specific asset is substantially complete.

PAO SIBUR HOLDING NOTES TO THE IFRS CONSOLIDATED FINANCIAL STATEMENTS (In millions of Russian roubles, unless otherwise stated)
64
42 NEW ACCOUNTING PRONOUNCEMENTS (CONTINUED)
The following other new pronouncements are not expected to have any material impact on the Group when adopted:
IFRS 15 “Revenue from Contracts with Customers” (issued on 28 May 2014 and effective for the periods beginning on or after 1 January 2018). Amendments to IFRS 15, Revenue from Contracts with Customers (issued on 12 April 2016 and effective for annual periods beginning on or after 1 January 2018).
Sale or Contribution of Assets between an Investor and its Associate or Joint Venture – Amendments to IFRS 10 and IAS 28 (issued on 11 September 2014 and effective for annual periods beginning on or after a date to be determined by the IASB).
Amendments to IFRS 2 “Share-based Payment” (issued on 20 June 2016 and effective for annual periods beginning on or after 1 January 2018).
Applying IFRS 9 “Financial Instruments” with IFRS 4 “Insurance Contracts” – Amendments to IFRS 4 (issued on 12 September 2016 and effective, depending on the approach, for annual periods beginning on or after 1 January 2018 for entities that choose to apply temporary exemption option, or when the entity first applies IFRS 9 for entities that choose to apply the overlay approach).
Transfers of Investment Property – Amendments to IAS 40 (issued on 8 December 2016 and effective for annual periods beginning on or after 1 January 2018).
Annual Improvements to IFRSs 2014-2016 cycle – Amendments to IFRS 1 and IAS 28 (issued on 8 December 2016 and effective for annual periods beginning on or after 1 January 2018).
Prepayment Features with Negative Compensation – Amendments to IFRS 9 (issued on 12 October 2017 and effective for annual periods beginning on or after 1 January 2019).
Long-term Interests in Associates and Joint Ventures – Amendments to IAS 28 (issued on 12 October 2017 and effective for annual periods beginning on or after 1 January 2019).
IFRIC 22 "Foreign currency transactions and advance consideration” (issued on 8 December 2016 and effective for annual periods beginning on or after 1 January 2018).
CONTACT INFO
The Group’s Head Office:
PAO SIBUR Holding 16/1 Krzhizhanovskogo St. Moscow, GSP-7, 117997 Russia Tel./fax: +7 (495) 777 5500 Website: www.sibur.ru (Russian) www.sibur.com (English)