1
Background: McGill CARICOM Food Security project The goal of the project is to improve nutrition and health outcomes of CARICOM (Caribbean Community) populations through an integrated, gender equal, environmentally sustainable systems approach to food availability, safety and quality. The project is funded by IDRC and CIDA through the Canadian International Food Security Research Fund (CIFSRF). Irrigation, water, and soil management theme Water, both in excess and in deficit, is a constraint to food production in Guyana and the Eastern Caribbean. Drip-irrigation systems are being installed on farms in Guyana, St. Lucia, and St. Kitts and Nevis with the following objectives: To introduce sustainable water savings technologies Provide technical advice on irrigation water requirements To train farmers, extension officers, technicians, and university/college students on advanced water management systems for food security. Baseline environmental component Monitoring of soil and water quality will provide information on threats to water and land degradation, and this will allow for the design and recommendations of environmentally sustainable farming practices. Guyana: Baseline soil and water characterization Larissa Jarvis 1 , Chandra Madramootoo 2 , Raffaella Carvalho 1 SOIL: Black Bush Polder [Figure 5] is a region of reclaimed land that is located in the eastern coastal area. Soils 3 are classified as Skeldon or Corentyne Clay series, which are humic gley soils, though soils of the region do not have peat topsoils as in Parika. Soils are generally poorly drained, strongly acidic, heavy clay. Some subsoils have high levels of salts. The area is generally considered moderately fertile if adequately drained Acknowledgements This component was completed under the supervision and guidance of Dr. Chandra Madramootoo, Dean of the Faculty of Agriculture and Environmental Sciences at McGill University. Dr. Oudho Homenauth and NAREI staff provided essential assistance and support in completing the objectives. Additional guidance and support was provided by members of the McGill CARICOM project team. This internship was completed in fulfillment of the program requirements for the MSc Integrated Water Resources Management non-thesis program in the faculty of Bioresource Engineering at McGill University. Approach Soil: Composite samples for chemical analysis and soil cores for bulk density were taken at both the 0-15cm and 15- 30 cm depths. Analysis of samples was carried out between May and August 2012. Bulk density and soil organic matter (OM) were analyzed at NAREI, while pH, total nitrogen (TN), total phosphorus (TP), total salts (TS) in water extract, calcium (Ca), magnesium (Mg), sodium (Na), potassium (K), and aluminum (Al) were completed at GuySuCo (Guyana Sugar Corporation) laboratories. Water: To date, water samples were collected on two occasions. Where possible, irrigation water was collected directly from water tanks in order to characterize water that will be used in drip irrigation systems. Sampling dates and sample source (canal, tank, etc.) are included with water results. PH and electrical conductivity (EC) were analyzed at NAREI, while TN and TP were analyzed at GUYSUCO. SOIL: Soils 3 are classified as Brickery Clay or Mara Clay series, both consisting of humic gley soils (clayey to silty-clay soils with up to 12 inches of peat as topsoil). Soil is poorly drained with high amounts of sulphate, generally acidic, with low availability of nutrients, especially calcium, potassium, and phosphorus. The lower mineral layer has low permeability, and is listed as being poorly suitable for crop production. 0 0.5 1 1.5 2 2.5 3 3.5 0 2 4 6 meq/100g Site # K Al Mg Na Ca Table 1: Soil results for Parika Site Depth Bulk density pH Total salts OM TN TP K cm g/cm ppm % mg/Kg 1 0-15 0.82 4.80 120 6.17 6188 45.52 258 15-30 0.82 4.68 78 6.86 4855 38.04 168 2 0-15 0.85 4.86 50 4.79 5815 46.17 172 15-30 0.9 4.69 91 5.48 5433 40.95 158 3 0-15 0.57 4.79 1205 3.43 6823 34.57 197 15-30 0.64 4.66 116 4.79 3674 45.24 175 4 0-15 0.81 5.06 89 4.11 7714 36.31 210 15-30 0.97 4.83 92 2.73 4269 49.56 157 5 0-15 0.98 4.86 68 4.79 6453 41.59 259 15-30 1.07 4.48 80 4.11 5417 34.25 222 *Colours indicate values higher and lower than general values expected in soils Table 2: Soil results for Parika Site Depth Bulk density * pH Total salts OM TN TP K cm g/cm ppm % mg/Kg 1 0-15 cm 1.15 5.29 249 4.79 3169 9.88 188 15-30 cm 1.21 5.46 409 3.43 4180 8.75 163 2 0-15 cm 0.97 4.72 316 5.48 4325 13.37 246 15-30 cm 0.99 4.93 1433 4.79 4300 6.71 211 3 0-15 cm 1.03 6.15 503 6.86 4214 9.66 281 15-30 cm 1.2 5.4 795 5.48 3885 15.92 270 4 0-15 cm 0.94 5.54 322 4.11 4840 17.61 232 15-30 cm 1.12 5.62 653 4.11 5534 9.94 195 5 0-15 cm 1.19 5.29 201 6.17 3936 9.13 437 15-30 cm 1.16 5.76 685 4.79 3526 6.44 218 *Colours indicate values higher and lower than general values expected in soils 0 2 4 6 8 10 0 2 4 6 meq/100g Site # K Al Mg Na Ca Introduction: Guyana’s climate is classified as tropical, with average annual temperatures in the coastal region ranging from 24.0 C to 29.6 C, and humidity averaging 70%. The annual rainfall in the coastal region is 2 290 mm. The two rainy seasons are from April to August and December to January. Of the 215 000 Km 2 of territory, the majority of the populations (90%) resides in the 10% occupied by the Coastal Lowland region [USACE, 1998]. Approximately 90% of farms are also located in this region [Homenauth, 2007]. Drip irrigation systems are bing installed at five different farms in both the Parika [Figure 2] and Black Bush Polder [Figure 5] areas under the supervision of the National Agricultural Research and Extension Institute (NAREI). 0.00 1.00 2.00 3.00 4.00 5.00 6.00 7.00 1 2 3 4 5 pH Parika- pH 0.00 5.00 10.00 15.00 20.00 25.00 30.00 35.00 40.00 1 2 3 4 5 mg/L TN Parika- TN 12-05-17 12-06-05 0.00 1.00 2.00 3.00 4.00 5.00 6.00 7.00 8.00 1 2 3 4 5 Canal pH pH 0.00 10.00 20.00 30.00 40.00 50.00 1 2 3 4 5 Canal mg/L TN TN 12-05-15 12-06-21 Black Bush Polder Figure 3: Parika water results based on sampling date. No data available for second sampling date at site 4. Letter indicates sources: T= tank, D= ditch, c=canal. Figure 4: Abundance of K, Al, Mg, Na, Ca for Parika sites Figure 2: Parika project sites. Source: Google earth. Figure 5: Black Bush Polder project sites. Source: Google earth. Figure 6: Black Bush Polder water results based on sampling date. Missing data denotes no sample taken, not 0 values. Letter indicates sources: T= tank, D= ditch, c=canal. Figure 7: Abundance of K, Al, Mg, Na, Ca for Black Bush Polder sites Parika References Andriesse, J.P. (1988), Nature and management of tropical peat soils, FAO Soils Bulletin 59, Food and Agriculture Organization of the United Nations (FAO): Rome, Italy. Ayers, R.S. & D.W. Westcot (1985), Water Quality for Agriculture, FAO Irrigation and Drainage Paper, Food and Agriculture Organization of the United Nations (FAO): Rome, Italy. Delavalle, Nat. B. (1992) Reference Methods for Soil Analysis, Soil and Plant Analysis Council, Inc., Athens, Georgia, USA. Homenauth, Oudho (2007), Agricultural Water Management Institutions-Guyana, FAO/CARICOM/CARIFORUM/GOI Food Security Project, National Agricultural Research and Extension Institute (NAREI), Mon Repos, Guyana. Juo, A. S. R., and K. Franzluebbers (2003), Tropical Soils: Properties and Management for Sustainable Agriculture, 281 pp., Oxford University Press, New York, New York. Roy, R.N., A. Finck, G.J. Blair & H.L.S Tandon (2006), Plant nutrition for food security: A guide for nutrient management, FAO Fertilizer and Plant Nutrition Bulletin 16, Food and Agriculture Organization of the United Nations (FAO): Rome, Italy. Tan, K. H. (2009), Environmental Soil Science, 3 ed., 557 pp., CRC Press, Taylor & Francis Group, Boca Raton, Florida. Troeh, F. R., and L. M. Thompson (2005), Soils and Soil Fertility, 6 ed., 489 pp., Blackwell Publishing, Iowa, USA. USACE (1998), Water Resources Assessment of Guyana, United States Army Corps of Engineers: Mobile District & Topographic Engineering Center, Alexandria, Virginia. 1 MSc., Integrated Water Resoucres Management, Department of Bioresource Engineering, McGill University. Contact: [email protected] Results [Table 2] show TN and especially TP values lower than Parika. Higher pH (most sites classify as moderately acidic), lower Al, and higher total abundance of other nutrients indicate less leached soils. Abundance of Mg, Ca, Na, K, and Al (decreasing order) was more uniform than in Parika [Figure 7]. Total salts indicate saline soils in some sites, which not seen in Parika. WATER: Irrigation water is pumped from the Canje River, with some additional supply from the Berbice River via the Torani Canal. Drainage is towards the coast through one of three main drainage canals, controlled by sluice gates and pumps when necessary [Mott MacDonald, 2003]. Results to date [Figure 6] show generally consistent pH. All TP values above 0.1 mg/L threshold, indicating larger influence of agricultural runoff on water sources. All TN values increased at second sapling date, similar to Parika. Total salts (not shown) were between 0.15 and 0.31 parts per thousand, which is expected due to brackish influence of rivers in the area. WATER: The irrigation water source is the Boerasirie conservancy shown in Figure 2. Water flows from the conservancy through agricultural areas via irrigation canals. Irrigation ditches distribute water from main irrigation canals to individual farms. Results [Figure 3] show low pH values, expected due to nature of water source. TN generally increased at second sampling date and values varied more between sites, which could indicate influence of farmer management. Lower TP values than BBP region may indicate less influence of runoff on irrigation water. One very high TP value is unexplained, and had returned to normal in subsequent sampling. Sampling is to continue on a monthly basis for better characterization of water sources and changes with time. 0.00 0.05 0.10 0.15 0.20 0.25 0.30 0.35 0.40 0.45 0.50 1 2 3 4 5 mg/L TP Parika- TP 0.00 0.05 0.10 0.15 0.20 0.25 0.30 0.35 0.40 1 2 3 4 5 Canal mg/L TP TP Rainfall (mm) 24hr 48hr 7 day 2012/05/17 31.40 31.40 64.60 2012/06/05 0.60 3.20 67.40 Rainfall (mm) 24hr 48hr 7 day 2012/05/15 - - - 2012/06/21 0.20 21.80 136.80 0.1 mg/L: Recommended threshold for controlling aquatic plant growth. 0.1 mg/L: Recommended threshold for controlling aquatic plant growth. Results [Table 1] show low bulk density values, though fields had been ploughed and beds established at time of sampling. All soils moderately to strongly acidic. Higher TN, very high Al (35-68 mg/Kg), low TP and low abundance of other nutrients [Figure 4] consistent with characteristics of leached tropical soils. Only one site indicates issues with salinity. T T D D C T T T T D T D C D C D C C 3 Soil classification was provided by Mr. David Fredericks, soil scientist at NAREI. Figure 1: Location of project sites in Guyana. Source: Google earth.

Guyana: Baseline soil and water characterization › globalfoodsecurity › files › ... · Andriesse, J.P. (1988), Nature and management of tropical peat soils, FAO Soils Bulletin

  • Upload
    others

  • View
    2

  • Download
    0

Embed Size (px)

Citation preview

Background: McGill CARICOM Food Security project The goal of the project is to improve nutrition and health outcomes of CARICOM (Caribbean Community) populations through an integrated, gender equal, environmentally sustainable systems approach to food availability, safety and quality. The project is funded by IDRC and CIDA through the Canadian International Food Security Research Fund (CIFSRF).

Irrigation, water, and soil management theme Water, both in excess and in deficit, is a constraint to food production in Guyana and the Eastern Caribbean. Drip-irrigation systems are being installed on farms in Guyana, St. Lucia, and St. Kitts and Nevis with the following objectives:

• To introduce sustainable water savings technologies • Provide technical advice on irrigation water requirements • To train farmers, extension officers, technicians, and university/college students on

advanced water management systems for food security.

Baseline environmental component Monitoring of soil and water quality will provide information on threats to water and land degradation, and this will allow for the design and recommendations of environmentally sustainable farming practices.

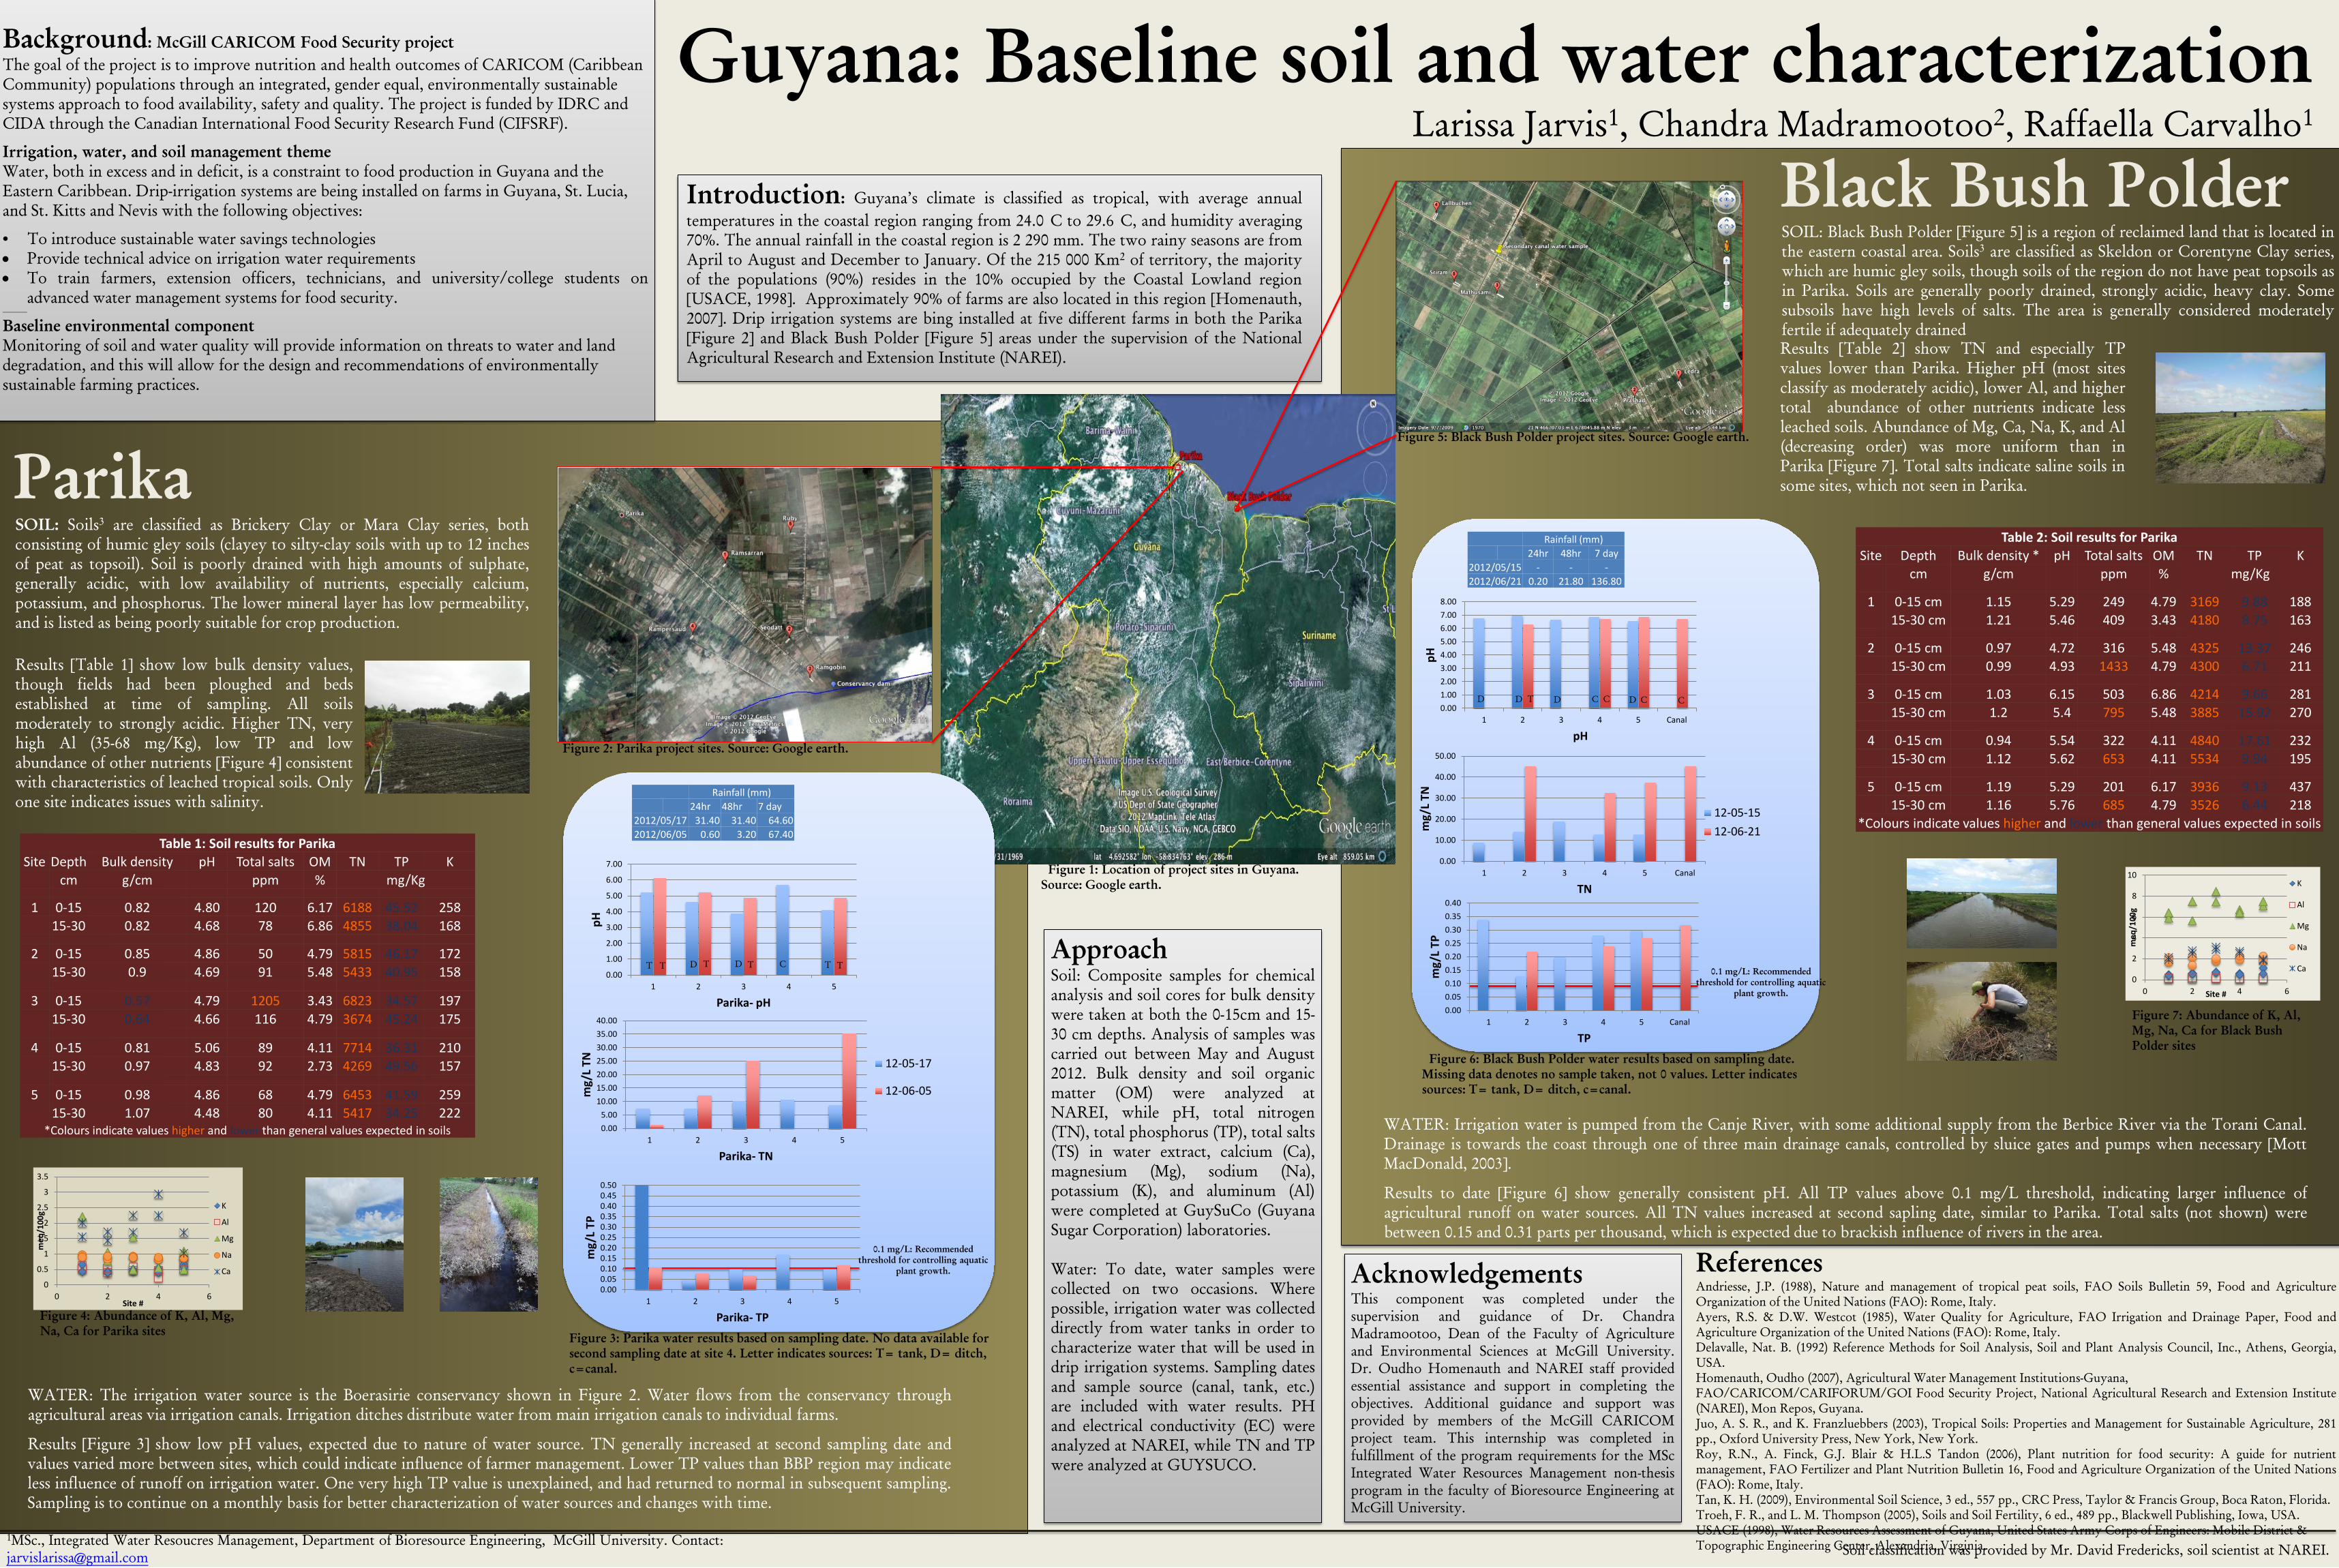
Guyana: Baseline soil and water characterization Larissa Jarvis1, Chandra Madramootoo2, Raffaella Carvalho1

SOIL: Black Bush Polder [Figure 5] is a region of reclaimed land that is located in the eastern coastal area. Soils3 are classified as Skeldon or Corentyne Clay series, which are humic gley soils, though soils of the region do not have peat topsoils as in Parika. Soils are generally poorly drained, strongly acidic, heavy clay. Some subsoils have high levels of salts. The area is generally considered moderately fertile if adequately drained

Acknowledgements This component was completed under the supervision and guidance of Dr. Chandra Madramootoo, Dean of the Faculty of Agriculture and Environmental Sciences at McGill University. Dr. Oudho Homenauth and NAREI staff provided essential assistance and support in completing the objectives. Additional guidance and support was provided by members of the McGill CARICOM project team. This internship was completed in fulfillment of the program requirements for the MSc Integrated Water Resources Management non-thesis program in the faculty of Bioresource Engineering at McGill University.

Approach Soil: Composite samples for chemical analysis and soil cores for bulk density were taken at both the 0-15cm and 15-30 cm depths. Analysis of samples was carried out between May and August 2012. Bulk density and soil organic matter (OM) were analyzed at NAREI, while pH, total nitrogen (TN), total phosphorus (TP), total salts (TS) in water extract, calcium (Ca), magnesium (Mg), sodium (Na), potassium (K), and aluminum (Al) were completed at GuySuCo (Guyana Sugar Corporation) laboratories. Water: To date, water samples were collected on two occasions. Where possible, irrigation water was collected directly from water tanks in order to characterize water that will be used in drip irrigation systems. Sampling dates and sample source (canal, tank, etc.) are included with water results. PH and electrical conductivity (EC) were analyzed at NAREI, while TN and TP were analyzed at GUYSUCO.

SOIL: Soils3 are classified as Brickery Clay or Mara Clay series, both consisting of humic gley soils (clayey to silty-clay soils with up to 12 inches of peat as topsoil). Soil is poorly drained with high amounts of sulphate, generally acidic, with low availability of nutrients, especially calcium, potassium, and phosphorus. The lower mineral layer has low permeability, and is listed as being poorly suitable for crop production.

0

0.5

1

1.5

2

2.5

3

3.5

0 2 4 6

meq

/100

g

Site #

K

Al

Mg

Na

Ca

Table 1: Soil results for Parika Site Depth Bulk density pH Total salts OM TN TP K

cm g/cm ppm % mg/Kg

1 0-15 0.82 4.80 120 6.17 6188 45.52 258 15-30 0.82 4.68 78 6.86 4855 38.04 168

2 0-15 0.85 4.86 50 4.79 5815 46.17 172

15-30 0.9 4.69 91 5.48 5433 40.95 158

3 0-15 0.57 4.79 1205 3.43 6823 34.57 197 15-30 0.64 4.66 116 4.79 3674 45.24 175

4 0-15 0.81 5.06 89 4.11 7714 36.31 210

15-30 0.97 4.83 92 2.73 4269 49.56 157

5 0-15 0.98 4.86 68 4.79 6453 41.59 259 15-30 1.07 4.48 80 4.11 5417 34.25 222

*Colours indicate values higher and lower than general values expected in soils

Table 2: Soil results for Parika Site Depth Bulk density * pH Total salts OM TN TP K

cm g/cm ppm % mg/Kg

1 0-15 cm 1.15 5.29 249 4.79 3169 9.88 188 15-30 cm 1.21 5.46 409 3.43 4180 8.75 163

2 0-15 cm 0.97 4.72 316 5.48 4325 13.37 246 15-30 cm 0.99 4.93 1433 4.79 4300 6.71 211

3 0-15 cm 1.03 6.15 503 6.86 4214 9.66 281 15-30 cm 1.2 5.4 795 5.48 3885 15.92 270

4 0-15 cm 0.94 5.54 322 4.11 4840 17.61 232 15-30 cm 1.12 5.62 653 4.11 5534 9.94 195

5 0-15 cm 1.19 5.29 201 6.17 3936 9.13 437 15-30 cm 1.16 5.76 685 4.79 3526 6.44 218

*Colours indicate values higher and lower than general values expected in soils

0

2

4

6

8

10

0 2 4 6

meq

/100

g

Site #

K

Al

Mg

Na

Ca

Introduction: Guyana’s climate is classified as tropical, with average annual temperatures in the coastal region ranging from 24.0

C to 29.6

C, and humidity averaging 70%. The annual rainfall in the coastal region is 2 290 mm. The two rainy seasons are from April to August and December to January. Of the 215 000 Km2 of territory, the majority of the populations (90%) resides in the 10% occupied by the Coastal Lowland region [USACE, 1998]. Approximately 90% of farms are also located in this region [Homenauth, 2007]. Drip irrigation systems are bing installed at five different farms in both the Parika [Figure 2] and Black Bush Polder [Figure 5] areas under the supervision of the National Agricultural Research and Extension Institute (NAREI).

0.00

1.00

2.00

3.00

4.00

5.00

6.00

7.00

1 2 3 4 5

pH

Parika- pH

0.005.00

10.0015.0020.0025.0030.0035.0040.00

1 2 3 4 5

mg/

L TN

Parika- TN

12-05-17

12-06-05

0.001.002.003.004.005.006.007.008.00

1 2 3 4 5 Canal

pH

pH

0.00

10.00

20.00

30.00

40.00

50.00

1 2 3 4 5 Canal

mg/

L TN

TN

12-05-1512-06-21

Black Bush Polder

Figure 3: Parika water results based on sampling date. No data available for second sampling date at site 4. Letter indicates sources: T= tank, D= ditch, c=canal.

Figure 4: Abundance of K, Al, Mg, Na, Ca for Parika sites

Figure 2: Parika project sites. Source: Google earth.

Figure 5: Black Bush Polder project sites. Source: Google earth.

Figure 6: Black Bush Polder water results based on sampling date. Missing data denotes no sample taken, not 0 values. Letter indicates sources: T= tank, D= ditch, c=canal.

Figure 7: Abundance of K, Al, Mg, Na, Ca for Black Bush Polder sites

Parika

References Andriesse, J.P. (1988), Nature and management of tropical peat soils, FAO Soils Bulletin 59, Food and Agriculture Organization of the United Nations (FAO): Rome, Italy. Ayers, R.S. & D.W. Westcot (1985), Water Quality for Agriculture, FAO Irrigation and Drainage Paper, Food and Agriculture Organization of the United Nations (FAO): Rome, Italy. Delavalle, Nat. B. (1992) Reference Methods for Soil Analysis, Soil and Plant Analysis Council, Inc., Athens, Georgia, USA. Homenauth, Oudho (2007), Agricultural Water Management Institutions-Guyana, FAO/CARICOM/CARIFORUM/GOI Food Security Project, National Agricultural Research and Extension Institute (NAREI), Mon Repos, Guyana. Juo, A. S. R., and K. Franzluebbers (2003), Tropical Soils: Properties and Management for Sustainable Agriculture, 281 pp., Oxford University Press, New York, New York. Roy, R.N., A. Finck, G.J. Blair & H.L.S Tandon (2006), Plant nutrition for food security: A guide for nutrient management, FAO Fertilizer and Plant Nutrition Bulletin 16, Food and Agriculture Organization of the United Nations (FAO): Rome, Italy. Tan, K. H. (2009), Environmental Soil Science, 3 ed., 557 pp., CRC Press, Taylor & Francis Group, Boca Raton, Florida. Troeh, F. R., and L. M. Thompson (2005), Soils and Soil Fertility, 6 ed., 489 pp., Blackwell Publishing, Iowa, USA. USACE (1998), Water Resources Assessment of Guyana, United States Army Corps of Engineers: Mobile District & Topographic Engineering Center, Alexandria, Virginia.

1MSc., Integrated Water Resoucres Management, Department of Bioresource Engineering, McGill University. Contact: [email protected]

Results [Table 2] show TN and especially TP values lower than Parika. Higher pH (most sites classify as moderately acidic), lower Al, and higher total abundance of other nutrients indicate less leached soils. Abundance of Mg, Ca, Na, K, and Al (decreasing order) was more uniform than in Parika [Figure 7]. Total salts indicate saline soils in some sites, which not seen in Parika.

WATER: Irrigation water is pumped from the Canje River, with some additional supply from the Berbice River via the Torani Canal. Drainage is towards the coast through one of three main drainage canals, controlled by sluice gates and pumps when necessary [Mott MacDonald, 2003].

Results to date [Figure 6] show generally consistent pH. All TP values above 0.1 mg/L threshold, indicating larger influence of agricultural runoff on water sources. All TN values increased at second sapling date, similar to Parika. Total salts (not shown) were between 0.15 and 0.31 parts per thousand, which is expected due to brackish influence of rivers in the area.

WATER: The irrigation water source is the Boerasirie conservancy shown in Figure 2. Water flows from the conservancy through agricultural areas via irrigation canals. Irrigation ditches distribute water from main irrigation canals to individual farms.

Results [Figure 3] show low pH values, expected due to nature of water source. TN generally increased at second sampling date and values varied more between sites, which could indicate influence of farmer management. Lower TP values than BBP region may indicate less influence of runoff on irrigation water. One very high TP value is unexplained, and had returned to normal in subsequent sampling. Sampling is to continue on a monthly basis for better characterization of water sources and changes with time.

0.000.050.100.150.200.250.300.350.400.450.50

1 2 3 4 5

mg/

L TP

Parika- TP

0.000.050.100.150.200.250.300.350.40

1 2 3 4 5 Canal

mg/

L TP

TP

Rainfall (mm) 24hr 48hr 7 day

2012/05/17 31.40 31.40 64.60 2012/06/05 0.60 3.20 67.40

Rainfall (mm) 24hr 48hr 7 day

2012/05/15 - - - 2012/06/21 0.20 21.80 136.80

0.1 mg/L: Recommended threshold for controlling aquatic

plant growth.

0.1 mg/L: Recommended threshold for controlling aquatic

plant growth.

Results [Table 1] show low bulk density values, though fields had been ploughed and beds established at time of sampling. All soils moderately to strongly acidic. Higher TN, very high Al (35-68 mg/Kg), low TP and low abundance of other nutrients [Figure 4] consistent with characteristics of leached tropical soils. Only one site indicates issues with salinity.

T T D D C T T T T

D T D C D C D C C

3Soil classification was provided by Mr. David Fredericks, soil scientist at NAREI.

Figure 1: Location of project sites in Guyana. Source: Google earth.