Embed Size (px)
Citation preview
Biogeosciences, 15, 703–719, 2018https://doi.org/10.5194/bg-15-703-2018© Author(s) 2018. This work is distributed underthe Creative Commons Attribution 3.0 License.
Peat decomposability in managed organic soils in relation to landuse, organic matter composition and temperatureCédric Bader1,2, Moritz Müller3, Rainer Schulin2, and Jens Leifeld1
1Agroscope, Climate and Agriculture Group, Zurich 8046, Switzerland2Inst Terr Ecosyst, ETH Zürich, Zurich 8092, Switzerland3School of Agricultural, Forest and Food Sciences, Bern University of Applied Sciences, Zollikofen 3052, Switzerland
Correspondence: Jens Leifeld ([email protected])
Received: 14 May 2017 – Discussion started: 14 June 2017Revised: 26 October 2017 – Accepted: 13 December 2017 – Published: 5 February 2018
Abstract. Organic soils comprise a large yet fragile carbon(C) store in the global C cycle. Drainage, necessary for agri-culture and forestry, triggers rapid decomposition of soil or-ganic matter (SOM), typically increasing in the order for-est < grassland < cropland. However, there is also large vari-ation in decomposition due to differences in hydrologicalconditions, climate and specific management. Here we stud-ied the role of SOM composition on peat decomposabilityin a variety of differently managed drained organic soils.We collected a total of 560 samples from 21 organic crop-land, grassland and forest soils in Switzerland, monitoredtheir CO2 emission rates in lab incubation experiments over 6months at two temperatures (10 and 20 ◦C) and related themto various soil characteristics, including bulk density, pH, soilorganic carbon (SOC) content and elemental ratios (C /N,H /C and O /C). CO2 release ranged from 6 to 195 mg CO2-C g−1 SOC at 10 ◦C and from 12 to 423 mg g−1 at 20 ◦C.This variation occurring under controlled conditions suggeststhat besides soil water regime, weather and management,SOM composition may be an underestimated factor that de-termines CO2 fluxes measured in field experiments. How-ever, correlations between the investigated chemical SOMcharacteristics and CO2 emissions were weak. The latter alsodid not show a dependence on land-use type, although peatunder forest was decomposed the least. High CO2 emissionsin some topsoils were probably related to the accrual of la-bile crop residues. A comparison with published CO2 ratesfrom incubated mineral soils indicated no difference in SOMdecomposability between these soil classes, suggesting thataccumulation of recent, labile plant materials that presum-ably account for most of the evolved CO2 is not systemati-
cally different between mineral and organic soils. In our dataset, temperature sensitivity of decomposition (Q10 on aver-age 2.57± 0.05) was the same for all land uses but lowestbelow 60 cm in croplands and grasslands. This, in turn, indi-cates a relative accumulation of recalcitrant peat in topsoils.
1 Introduction
Organic soils represent a major global sink for atmosphericcarbon (C). Although they cover only 3 % of the earth’s ter-restrial surface (Tubiello et al., 2016), they store up to 30 %of the global soil organic carbon (SOC) pool (Parish et al.,2008). In Europe, more than 50 % of the former peatlandarea has been degraded by peat mining and conversion ofland use, including drainage, to improve their suitability foragriculture or forestry (Joosten, 2010). Drainage aerates thesoil so that plants of interest for agriculture and forestry cangrow and make these soils manageable. The change fromanaerobic to aerobic conditions, however, triggers rapid de-composition of peat that had accumulated under the con-ditions of waterlogging. This transforms the former C-sinkinto a major source of atmospheric carbon dioxide (CO2)and makes peatlands an important contributor to global cli-mate change (Freeman et al., 2004). Around 85 % of theglobal annual CO2 emission of 915 Mt CO2-C from drainedpeatlands are estimated to originate from organic soils nowused as croplands (Tubiello et al., 2016). With rates of 6.5–9.4 t C ha−1 a−1 net CO2 fluxes from organic soils now usedas croplands were on average found to be higher than fromorganic soils under grassland, which were estimated to vary
Published by Copernicus Publications on behalf of the European Geosciences Union.
704 C. Bader et al.: Peat decomposability in managed organic soils
between 1.8 and 7.3 t C ha−1 a−1 (IPCC, 2014). However, re-cent studies reported emission rates of 7.6± 2.0 t C ha−1 a−1
on organic soils managed as grassland in Germany and thusmuch higher rates than previously found for this type of landuse (Tiemeyer et al., 2016). Drained organic soils under for-est can act as both net sinks or sources of atmospheric CO2(Cannell et al., 1993; Minkkinen and Laine, 1998; Minkki-nen et al., 1999; Wüst-Galley et al., 2016), although theyare in general considered to represent a source with aver-age net CO2 emissions of 2.0–3.3 t C ha−1 a−1 in the tem-perate zone (IPCC, 2014). Temperature and soil moistureregime, which depends on drainage depth, among other fac-tors, have the greatest influence on peat decay in drainedorganic soils (Hogg et al., 1992; Berglund, 1995; Scanlonand Moore, 2000; Chimner and Cooper, 2003; Couwenberget al., 2010; Leifeld et al., 2012). However, there are sub-stantial differences in CO2 emissions from organic soils withsimilar drainage and cultivation properties. The protection oforganic matter (OM) against decomposition by mechanismssuch as occlusion in aggregates and binding to mineral sur-faces, which are important for the stabilization of OM inmineral soils (Six et al., 2002), are of minor importance inorganic soils due to the lack or low abundance of minerals(Han et al., 2016). Therefore, the intrinsic decomposabilityof organic matter is considered another major factor influenc-ing the rate of peat decomposition and a major cause of sub-stantial variation in CO2 emissions at different sites (Chim-ner and Cooper, 2003; Byrne and Farrell, 2005; Höper, 2007;Wickland and Neff, 2008; Reiche et al., 2010).
Although intrinsic decomposability of SOM cannot be ad-dressed directly, useful indicators of the latter are the relativeabundances of labile and recalcitrant C moieties, which shifttowards progressively higher proportions of the recalcitrantC with decomposition (Beer et al., 2008; Tfaily et al., 2014)and result in selective enrichment and depletion of specificfunctionalities (Leifeld et al., 2017; McAnallen et al., 2017).It is important to recognize that during peat formation, mostof the net primary production contained in the initial massof plant residues are lost due to mineralization, and only 10–20 % is transformed and accumulated as peat in the water-saturated zone of a peat bog or fen (Clymo, 1984). Althoughdecomposition acts slowly on accumulating peat of undis-turbed (i.e. water-saturated organic) soils, it is believed thatprimarily the most labile OM moieties are lost. Due to freshpeat layers accumulating on top of older ones, age and de-pletion in labile compounds increase with soil depth. Incu-bation studies of peat samples and carbon loss studies withundisturbed organic soils found smaller CO2 emission ratesfrom deeper peat layers, which was related to the absenceof labile compounds i.e. a lower intrinsic decomposability ofsoil organic matter (SOM) (Hogg et al., 1992; Scanlon andMoore, 2000; Wang et al., 2010; Hardie et al., 2011; Leifeldet al., 2012). Using solid-state 13C-NMR, DRIFT/FTIR spec-troscopy and pyrolysis-GC/MS, various studies of OM com-position of undisturbed peat profiles have shown a gradual
change with increasing depth towards a relative enrichmentof compounds that are recalcitrant against decomposition un-der anoxic conditions, such as lignins and polyphenols (Free-man et al., 2004), while the contents of labile oxygen-richcompounds, such as polysaccharides, were found to decrease(Leifeld et al., 2012; Biester et al., 2014; Sjögersten et al.,2016).
Elemental ratios of oxygen (O), hydrogen (H), and nitro-gen (N) to carbon are widely used as indicators of the relativeabundance of different groups of compounds such as phe-nols, lipids and polysaccharides, and proteins. Lignins andpolyphenols have molar O /C ratios in the range of 0.2–0.6and H /C ratios between 0.9 and 1.5, while the respectiveratios of carbohydrates range from 0.8 to 0.9 for O /C andfrom 1.4 to 1.8 for H /C (Kim et al., 2003). In line withthe molecular and spectroscopic analyses mentioned before,both ratios were found to decrease with increasing depth inpeat (Klavins et al., 2008; Biester et al., 2014; Wüst-Galleyet al., 2016). On the other hand, both fresh plant residuesand undisturbed peat usually have high C /N ratios (Loiselet al., 2012). When peat becomes exposed to oxic conditions,mineralization seems to lead to relative enrichment of N, ex-plaining why decreased C /N ratios are found in organic top-soils compared to undrained peat layers or bottom layers ofdrained organic soils (Malmer and Holm, 1984; Kuhry andVitt, 1996; Krueger et al., 2015). While undisturbed organicsoils have a low bulk density, drainage leads to subsidenceprocesses and increasing bulk densities in the topsoils (Ro-giers et al., 2008; Leifeld et al., 2011a, b).
The temperature sensitivity of peat mineralization, as ex-pressed by its Q10 value, is a useful parameter for charac-terizing the intrinsic decomposability of SOM (Hogg et al.,1992; Biasi et al., 2005; Davidson and Janssens, 2006; Co-nant et al., 2008; Boddy et al., 2008; Karhu et al., 2010; Hi-lasvuori et al., 2013). In line with the biochemical and ele-mental evidence reviewed above, it was reported to increasewith increasing resistance of peat soils against OM decom-position (Scanlon and Moore, 2000), soil depth and peat age(Hardie et al., 2011; Hilasvuori et al., 2013).
Despite its likely important role in determining future Closses from drained peatland, the influence of SOM compo-sition on peat decomposition in managed organic soils is notwell studied. While decomposition rates seem to decline withincreasing peat age, i.e. profile depth, the oxic conditions,occurring after drainage onset, lead to fast SOM decompo-sition. As for undisturbed organic soils, we expect that postdrainage decomposition primarily acts on the most labile OMmoieties. However, the much faster decomposition of labileSOM might alter the depth interaction found in undisturbedpeat soils. Further, recent inputs from plant residues may sup-ply the topsoils with labile OM. Around 20 % of carbon inorganic soils under agriculture is derived from crop residuesand thus decomposes more rapidly (Bader et al., 2017). Thefractions of OM derived from peat and recent inputs and theirdecomposability in drained organic soils may, however, sub-
Biogeosciences, 15, 703–719, 2018 www.biogeosciences.net/15/703/2018/
C. Bader et al.: Peat decomposability in managed organic soils 705
stantially vary with land use, site conditions and time sinceland use conversion. Schulze et al. (2009) reported that inputsof fresh organic matter residues were smaller in croplandsthan in grasslands or forests, suggesting that SOM might beon average more aged and thus less decomposable. In situmeasurements of CO2 fluxes from managed organic soils re-veal slower decomposition of peat under forest (IPCC, 2014).Together, smaller peat loss rates and higher residue inputmake us expect that SOM decomposition rates under con-trolled conditions are fastest in forest topsoils.
In this study, we analysed the relationship between SOMproperties, specific decomposition rates (CO2-C mg−1 SOC)and their temperature sensitivities to peat samples taken fromdepths between 0 and 200 cm of 21 drained organic soils inSwitzerland managed as cropland, perennial grassland or for-est. These sites embody three major uses for drained peat-lands as they occur in Europe (Joosten, 2010) and are alsorepresentative of the situation in Switzerland where most for-mer peatlands are drained and managed (Wüst-Galley et al.,2015). We measured decomposition rates in incubation ex-periments under standardized lab conditions and interpretedthe current decomposition status of peat using SOM proper-ties such as (i) carbon stocks, bulk densities and the elementalratios O /C, H /C and C /N as well as (ii) the temperaturesensitivity towards decomposition, expecting that
1. specific decomposition rates of SOM decline withdepth,
2. specific decomposition rates of SOM in managed or-ganic soils correlate with its composition and are in-versely related to the temperature sensitivity of decom-position,
3. specific decomposition rates of topsoil SOM are largestin the forest and smallest in the croplands.
2 Methods
2.1 Sampling sites
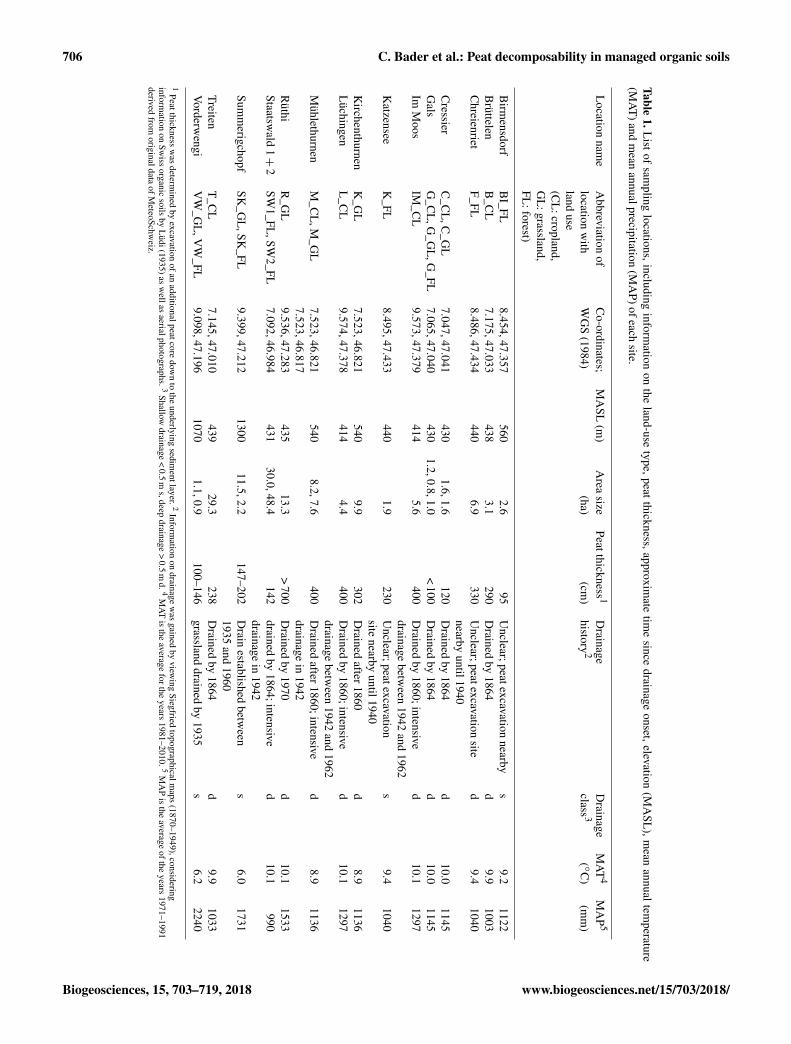
The soil samples used for this study were taken from organicsoils distributed across Switzerland that were identified us-ing the map of Wüst et al. (2015). Apart from current landuse (grassland, cropland, forest), they differed in the type ofdrainage system (ditches in forest, pipes in crop- and grass-land), time since drainage onset and drainage intensity, alti-tude (MASL) and climate (Table 1). All sites were classifiedas fens, although we found bog-derived peat layers withinthe top 30 and 40 cm of the soil profiles at two sites (SK_FL,K_FL). Cropland management comprised rotations typicalfor Switzerland with maize, winter wheat, ley and rapeseedas major crops. Sites were conventionally tilled. Grasslandswere used for cutting and haymaking, not grazing, and arefertilized according to the Swiss Fertilization Recommen-
dations (Flisch et al., 2009). Forest sites were managed andtheir vegetation was not peat-forming.
2.2 Soil sampling
Between October 2013 and June 2015, we sampled a to-tal of 84 peat cores from all 21 sites (4 cores per site). Allcores were taken to a maximum depth of 1 m. If the under-lying mineral layer was reached before 1 m depth, coringwas discontinued. We used a Belarusian peat corer (cuts ahalf-cylindrical undisturbed core of diameter 4 cm) for soilswith low bulk densities and a motorized Humax corer (cuts acylindrical core of diameter 5 cm) for denser soils. The sam-ples were stored at 4 ◦C for up to 2 months until analysis. Weapplied the method of Rogiers et al. (2008) to account forsoil compaction during sampling for any sample and dividedthe cores into segments corresponding to 5–10 cm depth in-crements. This corresponded, depending on the type of soilcorer used and length of the increment, to sample volumes ofbetween 31 and 196 cm3 per segment. In total this resultedin 1605 soil samples. Some cores had interlayers of mineralsediment identified by a different colour (grey), a high bulkdensity and their SOC content was lower than 150 g kg−1.These interlayers were excluded from the analysis. The soilof one site (BI_FL) had no limnic layer and therefore wasclassified as a murshic Histosol; all others were classified asmurshic limnic Histosols (WRB, 2014).
2.3 Soil analysis
Soil pH was measured for two to three samples of each core(307 samples in total) using a flat surface electrode (pH 100,Extech Instruments, USA) calibrated at pH 7.00 and pH 4.01.Aliquots of fresh soil (10 g dry matter) were diluted in dis-tilled water (2.5 parts water to 1 part material by mass),shaken, left for 20 h and shaken again, before the pH mea-surements were carried out.
Prior to further chemical analysis, the samples wereoven-dried at 105 ◦C and weighed to determine bulk den-sity (g cm−3). The dried samples were ground for 2 min at25 rotations s−1 in a ball mill (Retsch MM400) and subsam-pled to determine total carbon (Ctot), SOC, hydrogen (H),nitrogen (N) and oxygen (O) contents. Ctot, H and N wereanalysed after dry combustion of ground subsamples in an el-emental analyser (Hekatech, Germany). To determine SOC,we hydrolysed ground aliquots with 36 % HCl (acid fumi-gation) in a desiccator to remove any carbonates before thesamples were analysed in the elemental analyser. A third setof ground subsamples were used to determine the O contentsby means of the same analyser after pyrolysis at 1000 ◦C. Wecorrected O contents for inorganic O, assuming that all inor-ganic O was present in form of CaCO3. The O /C and H /Cratios given in this paper represent mole ratios, whereas theC /N ratios represent mass ratios. For analysis O /C ratiosand H /C ratios of samples having a SOC content lower than
www.biogeosciences.net/15/703/2018/ Biogeosciences, 15, 703–719, 2018
706 C. Bader et al.: Peat decomposability in managed organic soils
Table1.L
istofsam
plinglocations,including
information
onthe
land-usetype,peatthickness,approxim
atetim
esince
drainageonset,elevation
(MA
SL),m
eanannualtem
perature(M
AT
)andm
eanannualprecipitation
(MA
P)ofeachsite.
Location
name
Abbreviation
ofC
o-ordinates;M
ASL
(m)
Area
sizePeatthickness 1
Drainage
Drainage
MA
T4
MA
P5
locationw
ithW
GS
(1984)(ha)
(cm)
history 2class 3
(◦C
)(m
m)
landuse
(CL
:cropland,G
L:grassland,
FL:forest)
Birm
ensdorfB
I_FL8.454,47.357
5602.6
95U
nclear;peatexcavationnearby
s9.2
1122B
rüttelenB
_CL
7.175,47.033438
3.1290
Drained
by1864
d9.9
1003C
hreienrietF_FL
8.486,47.434440
6.9330
Unclear;peatexcavation
sited
9.41040
nearbyuntil1940
Cressier
C_C
L,C
_GL
7.047,47.041430
1.6,1.6120
Drained
by1864
d10.0
1145G
alsG
_CL
,G_G
L,G
_FL7.065,47.040
4301.2,0.8,1.0
<100
Drained
by1864
d10.0
1145Im
Moos
IM_C
L9.573,47.379
4145.6
400D
rainedby
1860;intensived
10.11297
drainagebetw
een1942
and1962
Katzensee
K_FL
8.495,47.433440
1.9230
Unclear;peatexcavation
s9.4
1040site
nearbyuntil1940
Kirchenthurnen
K_G
L7.523,46.821
5409.9
302D
rainedafter1860
d8.9
1136L
üchingenL
_CL
9.574,47.378414
4.4400
Drained
by1860;intensive
d10.1
1297drainage
between
1942and
1962M
ühlethurnenM
_CL
,M_G
L7.523,46.821
5408.2,7.6
400D
rainedafter1860;intensive
d8.9
11367.523,46.817
drainagein
1942R
üthiR
_GL
9.536,47.283435
13.3>
700D
rainedby
1970d
10.11533
Staatswald
1+
2SW
1_FL,SW
2_FL7.092,46.984
43130.0,48.4
142drained
by1864;intensive
d10.1
990drainage
in1942
Summ
erigchopfSK
_GL
,SK_FL
9.399,47.2121300
11.5,2.2147–202
Drain
establishedbetw
eens
6.01731
1935and
1960Treiten
T_C
L7.145,47.010
43929.3
238D
rainedby
1864d
9.91033
Vorderwengi
VW
_GL
,VW
_FL9.098,47.196
10701.1,0.9
100–146grassland
drainedby
1935s
6.22240
1Peatthickness
was
determined
byexcavation
ofanadditionalpeatcore
down
tothe
underlyingsedim
entlayer. 2Inform
ationon
drainagew
asgained
byview
ingSiegfried
topographicalmaps
(1870–1949),consideringinform
ationon
Swiss
organicsoils
byL
üdi(1935)asw
ellasaerialphotographs. 3
Shallowdrainage
<0.5
ms,deep
drainage>
0.5m
d. 4M
AT
isthe
averageforthe
years1981–2010. 5
MA
Pis
theaverage
oftheyears
1971–1991derived
fromoriginaldata
ofMeteoSchw
eiz.
Biogeosciences, 15, 703–719, 2018 www.biogeosciences.net/15/703/2018/
C. Bader et al.: Peat decomposability in managed organic soils 707
150 g kg−1 were excluded from analysis. Soil carbon stocks(t C ha−1) refer to the organic horizons summed over eachprofile and thus do not include sediment layers that inter-spersed the profiles.
2.4 Incubation experiment
We selected at least two soil segments of each soil corefrom depths between 0–30, 30–60 and 60–100 cm for incuba-tion to determine SOM decomposability. Each segment wasdivided in two subsegments, whereas one subsegment wasincubated at 10 ◦C and the other subsegment at 20 ◦C forbetween 6 and 13 months. From the one location (M_CL)where we had taken cores of > 100 cm length, we selected sixadditional samples from the depth below 100 cm for incuba-tion, resulting in a total of 560 incubated samples. Prior to in-cubation, we thoroughly mixed every segment, removed vis-ible roots and adjusted the water potential to−10 kPa using ahanging water column. The sample weight was 53.9± 0.7 g(mean± standard error) at−10 kPa. Following the method ofChapman (1971), we measured CO2 emission rates by meansof a Respicond VII analyser (Nordgren Innovation, Sweden)over three to four measurement cycles of several weeks be-tween November 2013 and March 2016. The measurementprinciple is based on the change in electrical conductivity ofthe NaOH solution with increasing uptake of CO2. In eachcycle, we vented the alkali CO2 traps (NaOH 0.6 M) of theanalyser regularly after 50–60 mg of CO2 had been emitted toprevent O2 deficiency. In addition, we exchanged the NaOHsolution while the traps were vented. Between measurementcycles, we kept the soil samples at the same temperature andmoisture level as during the cycles.
2.5 Data analysis
We only used CO2 data taken after the first 3 days of eachmeasurement cycle for data analysis to avoid artefacts thatmight have resulted from moving the samples and adjust-ing their water content. Furthermore, we excluded all neg-ative emission rate values (0.45 % out of 1700 CO2 measure-ments taken on average per sample). Data gaps (83 % of thetimeline) between measurement cycles were filled by meansof interpolation using a robust linear regression on the log-transformed data. The specific amount of SOC which wasemitted from a sample as CO2 during 10 000 h of incubationat 10 or 20 ◦C [mg CO2-C g−1 SOC], L, was calculated as
L=(CO2 sample−CO2 blank)×
12.0144.01
SOCsample×msample, (1)
where CO2 sample is the amount of CO2 emitted from thesample over 10 000 h of incubation [mg CO2-C g−1 SOC],CO2 blank is the median of ambient CO2 accumulation col-lected in six blank vessels over more than 6 months and ex-trapolated to 10 000 h (on average 27 mg), SOCsample is the
SOC content of the sample [g kg−1], and msample is the massof the soil sample [kg].
To determine Q10 values we applied the method used byothers (e.g. Hogg et al., 1992; Scanlon and Moore, 2000;Wang et al., 2010; Wetterstedt et al., 2010; Hardie et al.,2011), dividing the 10 000 h length of the incubation periodat 10 ◦C by the time span over which samples incubatedat 20 ◦C emitted the same amount of CO2-C per mg SOCas those incubated at 10 ◦C emitted during 10 000 h. Giventhat the same amount of SOC is lost at both temperatures,changes in OM composition during incubation are also as-sumed to be the same and thus differences in the rates areassumed to reflect only the influence of temperature and notthat of differences in composition. Q10 values are known todepend on incubation temperatures. In order to compare ourresults with those of other studies we calculated the activa-tion energy (Ea in kJ mol−1) required for decomposition ofSOC using Q10 values.
While R is the gas constant (8.314 J K−1 mol−1) and T isthe temperature used for incubation (K).
Ea=R×
ln(Q10)( 1T 1−
1T 2 )
1000(2)
Mixed linear models were used to analyse the effects of thevarious soil parameters on SOM mineralization and their in-teractions with land use. The function lmer from the pack-age lme4 (Bates et al., 2015) was implemented using thesoftware R (R core Team, 2015) to run mixed linear mod-els. Heteroscedasticity or departure from normality was as-sessed graphically. In order to avoid heteroscedasticity, welog-transformed topsoil C stocks and bulk density data. Wetested whether the factor “land use” had a significant in-fluence on the variation of each of the analysed variables(α = 0.05). To do this, the following two mixed models,2 and 3, were run for each dependent variable and comparedusing an ANOVA.
variable∼ land.use + random effects (3)variable∼ random effects (4)
Sampling depth, sampling location and site repetition wereincluded as random effects to account for the dependenceamong segments of the same core and among cores fromthe same sampling location, respectively. In addition, we in-cluded bulk density, SOC, nitrogen, hydrogen and oxygencontents as well as the emitted CO2 as further random effects,given that there was no collinearity with the tested variableand that the Akaikes criterion (AIC) of the models revealedsmaller scores with additional random effects. The additionalrandom effects used for each model are given in Tables 2and 3. Further, we determined the significance of land-use-specific differences (CL vs. FL, CL vs. GL, FL vs. GL) usinga least square means test for linear models (lsmeans pack-age).
www.biogeosciences.net/15/703/2018/ Biogeosciences, 15, 703–719, 2018
708 C. Bader et al.: Peat decomposability in managed organic soils
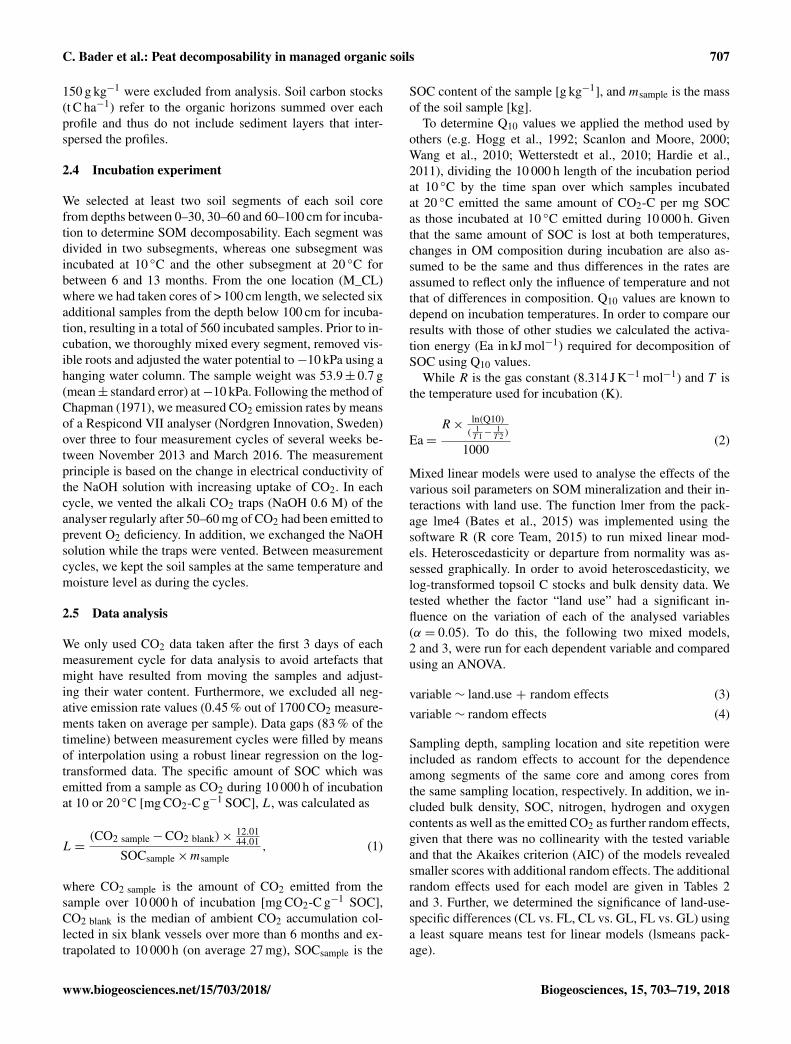
Figure 1. Soil pH, bulk density, SOC content, cumulated C stocks, C /N ratios, CO2 emissions and temperature sensitivity (Q10) displayedfor the three land-use types (cropland, grassland and forest) in relation to the profile depth (cm, y axis). CO2 emissions are displayed at 10(open symbols) and 20 ◦C (black symbols), while the area between dashed lines and error bars represents the standard errors of the mean.
Biogeosciences, 15, 703–719, 2018 www.biogeosciences.net/15/703/2018/
C. Bader et al.: Peat decomposability in managed organic soils 709
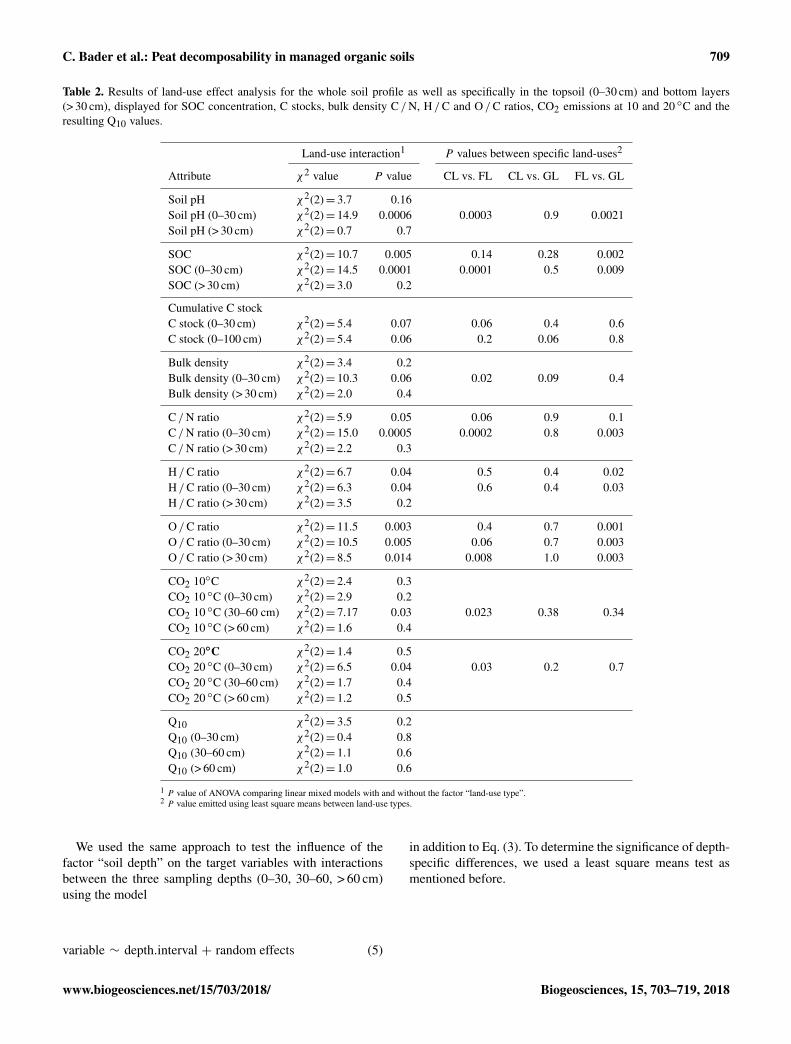
Table 2. Results of land-use effect analysis for the whole soil profile as well as specifically in the topsoil (0–30 cm) and bottom layers(> 30 cm), displayed for SOC concentration, C stocks, bulk density C /N, H /C and O /C ratios, CO2 emissions at 10 and 20 ◦C and theresulting Q10 values.
Land-use interaction1 P values between specific land-uses2
Attribute χ2 value P value CL vs. FL CL vs. GL FL vs. GL
Soil pH χ2(2)= 3.7 0.16Soil pH (0–30 cm) χ2(2)= 14.9 0.0006 0.0003 0.9 0.0021Soil pH (> 30 cm) χ2(2)= 0.7 0.7
SOC χ2(2)= 10.7 0.005 0.14 0.28 0.002SOC (0–30 cm) χ2(2)= 14.5 0.0001 0.0001 0.5 0.009SOC (> 30 cm) χ2(2)= 3.0 0.2
Cumulative C stockC stock (0–30 cm) χ2(2)= 5.4 0.07 0.06 0.4 0.6C stock (0–100 cm) χ2(2)= 5.4 0.06 0.2 0.06 0.8
Bulk density χ2(2)= 3.4 0.2Bulk density (0–30 cm) χ2(2)= 10.3 0.06 0.02 0.09 0.4Bulk density (> 30 cm) χ2(2)= 2.0 0.4
C /N ratio χ2(2)= 5.9 0.05 0.06 0.9 0.1C /N ratio (0–30 cm) χ2(2)= 15.0 0.0005 0.0002 0.8 0.003C /N ratio (> 30 cm) χ2(2)= 2.2 0.3
H /C ratio χ2(2)= 6.7 0.04 0.5 0.4 0.02H /C ratio (0–30 cm) χ2(2)= 6.3 0.04 0.6 0.4 0.03H /C ratio (> 30 cm) χ2(2)= 3.5 0.2
O /C ratio χ2(2)= 11.5 0.003 0.4 0.7 0.001O /C ratio (0–30 cm) χ2(2)= 10.5 0.005 0.06 0.7 0.003O /C ratio (> 30 cm) χ2(2)= 8.5 0.014 0.008 1.0 0.003
CO2 10◦C χ2(2)= 2.4 0.3CO2 10 ◦C (0–30 cm) χ2(2)= 2.9 0.2CO2 10 ◦C (30–60 cm) χ2(2)= 7.17 0.03 0.023 0.38 0.34CO2 10 ◦C (> 60 cm) χ2(2)= 1.6 0.4
CO2 20◦C χ2(2)= 1.4 0.5CO2 20 ◦C (0–30 cm) χ2(2)= 6.5 0.04 0.03 0.2 0.7CO2 20 ◦C (30–60 cm) χ2(2)= 1.7 0.4CO2 20 ◦C (> 60 cm) χ2(2)= 1.2 0.5
Q10 χ2(2)= 3.5 0.2Q10 (0–30 cm) χ2(2)= 0.4 0.8Q10 (30–60 cm) χ2(2)= 1.1 0.6Q10 (> 60 cm) χ2(2)= 1.0 0.6
1 P value of ANOVA comparing linear mixed models with and without the factor “land-use type”.2 P value emitted using least square means between land-use types.
We used the same approach to test the influence of thefactor “soil depth” on the target variables with interactionsbetween the three sampling depths (0–30, 30–60, > 60 cm)using the model
variable ∼ depth.interval + random effects (5)
in addition to Eq. (3). To determine the significance of depth-specific differences, we used a least square means test asmentioned before.
www.biogeosciences.net/15/703/2018/ Biogeosciences, 15, 703–719, 2018
710 C. Bader et al.: Peat decomposability in managed organic soils
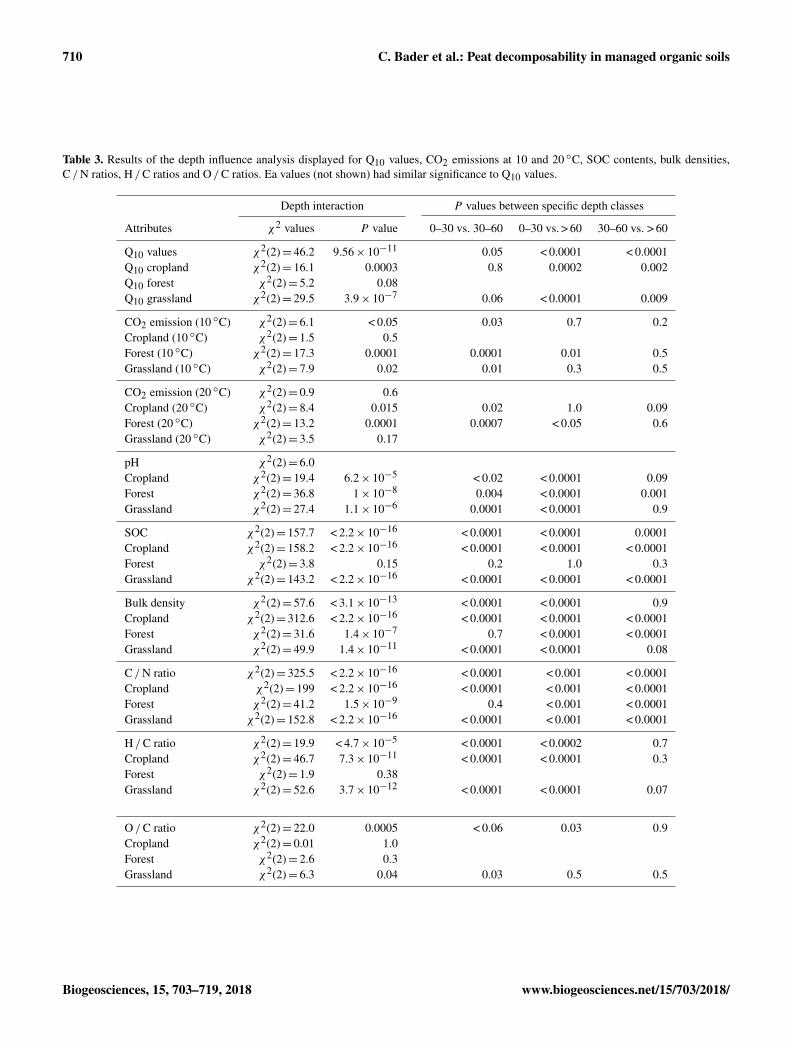
Table 3. Results of the depth influence analysis displayed for Q10 values, CO2 emissions at 10 and 20 ◦C, SOC contents, bulk densities,C /N ratios, H /C ratios and O /C ratios. Ea values (not shown) had similar significance to Q10 values.
Depth interaction P values between specific depth classes
Attributes χ2 values P value 0–30 vs. 30–60 0–30 vs. > 60 30–60 vs. > 60
Q10 values χ2(2)= 46.2 9.56× 10⁻¹¹ 0.05 < 0.0001 < 0.0001Q10 cropland χ2(2)= 16.1 0.0003 0.8 0.0002 0.002Q10 forest χ2(2)= 5.2 0.08Q10 grassland χ2(2)= 29.5 3.9× 10⁻⁷ 0.06 < 0.0001 0.009
CO2 emission (10 ◦C) χ2(2)= 6.1 < 0.05 0.03 0.7 0.2Cropland (10 ◦C) χ2(2)= 1.5 0.5Forest (10 ◦C) χ2(2)= 17.3 0.0001 0.0001 0.01 0.5Grassland (10 ◦C) χ2(2)= 7.9 0.02 0.01 0.3 0.5
CO2 emission (20 ◦C) χ2(2)= 0.9 0.6Cropland (20 ◦C) χ2(2)= 8.4 0.015 0.02 1.0 0.09Forest (20 ◦C) χ2(2)= 13.2 0.0001 0.0007 < 0.05 0.6Grassland (20 ◦C) χ2(2)= 3.5 0.17
pH χ2(2)= 6.0Cropland χ2(2)= 19.4 6.2× 10⁻⁵ < 0.02 < 0.0001 0.09Forest χ2(2)= 36.8 1× 10⁻⁸ 0.004 < 0.0001 0.001Grassland χ2(2)= 27.4 1.1× 10⁻⁶ 0.0001 < 0.0001 0.9
SOC χ2(2)= 157.7 < 2.2× 10⁻¹⁶ < 0.0001 < 0.0001 0.0001Cropland χ2(2)= 158.2 < 2.2× 10⁻¹⁶ < 0.0001 < 0.0001 < 0.0001Forest χ2(2)= 3.8 0.15 0.2 1.0 0.3Grassland χ2(2)= 143.2 < 2.2× 10⁻¹⁶ < 0.0001 < 0.0001 < 0.0001
Bulk density χ2(2)= 57.6 < 3.1× 10⁻¹³ < 0.0001 < 0.0001 0.9Cropland χ2(2)= 312.6 < 2.2× 10⁻¹⁶ < 0.0001 < 0.0001 < 0.0001Forest χ2(2)= 31.6 1.4× 10⁻⁷ 0.7 < 0.0001 < 0.0001Grassland χ2(2)= 49.9 1.4× 10⁻¹¹ < 0.0001 < 0.0001 0.08
C /N ratio χ2(2)= 325.5 < 2.2× 10⁻¹⁶ < 0.0001 < 0.001 < 0.0001Cropland χ2(2)= 199 < 2.2× 10⁻¹⁶ < 0.0001 < 0.001 < 0.0001Forest χ2(2)= 41.2 1.5× 10⁻⁹ 0.4 < 0.001 < 0.0001Grassland χ2(2)= 152.8 < 2.2× 10⁻¹⁶ < 0.0001 < 0.001 < 0.0001
H /C ratio χ2(2)= 19.9 < 4.7× 10⁻⁵ < 0.0001 < 0.0002 0.7Cropland χ2(2)= 46.7 7.3× 10⁻¹¹ < 0.0001 < 0.0001 0.3Forest χ2(2)= 1.9 0.38Grassland χ2(2)= 52.6 3.7× 10⁻¹² < 0.0001 < 0.0001 0.07
O /C ratio χ2(2)= 22.0 0.0005 < 0.06 0.03 0.9Cropland χ2(2)= 0.01 1.0Forest χ2(2)= 2.6 0.3Grassland χ2(2)= 6.3 0.04 0.03 0.5 0.5
Biogeosciences, 15, 703–719, 2018 www.biogeosciences.net/15/703/2018/
C. Bader et al.: Peat decomposability in managed organic soils 711
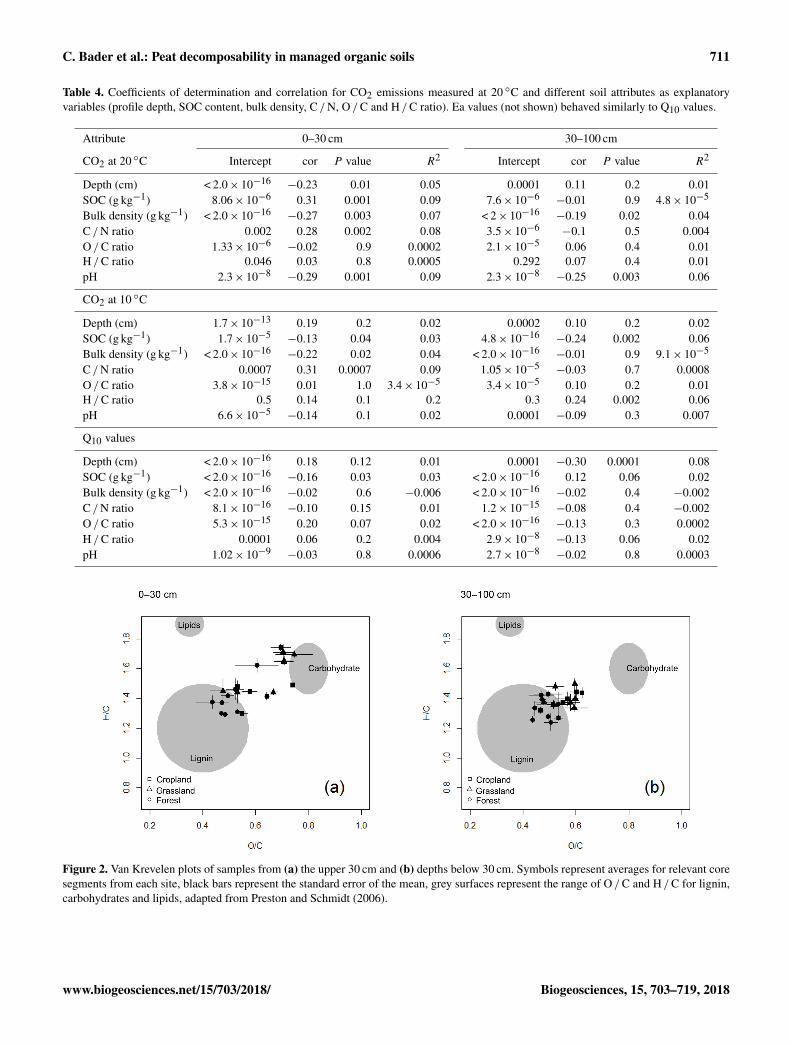
Table 4. Coefficients of determination and correlation for CO2 emissions measured at 20 ◦C and different soil attributes as explanatoryvariables (profile depth, SOC content, bulk density, C /N, O /C and H /C ratio). Ea values (not shown) behaved similarly to Q10 values.
Attribute 0–30 cm 30–100 cm
CO2 at 20 ◦C Intercept cor P value R2 Intercept cor P value R2
Depth (cm) < 2.0× 10⁻¹⁶−0.23 0.01 0.05 0.0001 0.11 0.2 0.01
SOC (g kg−1) 8.06× 10⁻⁶ 0.31 0.001 0.09 7.6× 10⁻⁶−0.01 0.9 4.8× 10⁻⁵
Bulk density (g kg−1) < 2.0× 10⁻¹⁶−0.27 0.003 0.07 < 2× 10⁻¹⁶
−0.19 0.02 0.04C /N ratio 0.002 0.28 0.002 0.08 3.5× 10⁻⁶
−0.1 0.5 0.004O /C ratio 1.33× 10⁻⁶
−0.02 0.9 0.0002 2.1× 10⁻⁵ 0.06 0.4 0.01H /C ratio 0.046 0.03 0.8 0.0005 0.292 0.07 0.4 0.01pH 2.3× 10⁻⁸
−0.29 0.001 0.09 2.3× 10⁻⁸−0.25 0.003 0.06
CO2 at 10 ◦C
Depth (cm) 1.7× 10⁻¹³ 0.19 0.2 0.02 0.0002 0.10 0.2 0.02SOC (g kg−1) 1.7× 10⁻⁵
−0.13 0.04 0.03 4.8× 10⁻¹⁶−0.24 0.002 0.06
Bulk density (g kg−1) < 2.0× 10⁻¹⁶−0.22 0.02 0.04 < 2.0× 10⁻¹⁶
−0.01 0.9 9.1× 10⁻⁵
C /N ratio 0.0007 0.31 0.0007 0.09 1.05× 10⁻⁵−0.03 0.7 0.0008
O /C ratio 3.8× 10⁻¹⁵ 0.01 1.0 3.4× 10⁻⁵ 3.4× 10⁻⁵ 0.10 0.2 0.01H /C ratio 0.5 0.14 0.1 0.2 0.3 0.24 0.002 0.06pH 6.6× 10⁻⁵
−0.14 0.1 0.02 0.0001 −0.09 0.3 0.007
Q10 values
Depth (cm) < 2.0× 10⁻¹⁶ 0.18 0.12 0.01 0.0001 −0.30 0.0001 0.08SOC (g kg−1) < 2.0× 10⁻¹⁶
−0.16 0.03 0.03 < 2.0× 10⁻¹⁶ 0.12 0.06 0.02Bulk density (g kg−1) < 2.0× 10⁻¹⁶
−0.02 0.6 −0.006 < 2.0× 10⁻¹⁶−0.02 0.4 −0.002
C /N ratio 8.1× 10⁻¹⁶−0.10 0.15 0.01 1.2× 10⁻¹⁵
−0.08 0.4 −0.002O /C ratio 5.3× 10⁻¹⁵ 0.20 0.07 0.02 < 2.0× 10⁻¹⁶
−0.13 0.3 0.0002H /C ratio 0.0001 0.06 0.2 0.004 2.9× 10⁻⁸
−0.13 0.06 0.02pH 1.02× 10⁻⁹
−0.03 0.8 0.0006 2.7× 10⁻⁸−0.02 0.8 0.0003
Figure 2. Van Krevelen plots of samples from (a) the upper 30 cm and (b) depths below 30 cm. Symbols represent averages for relevant coresegments from each site, black bars represent the standard error of the mean, grey surfaces represent the range of O /C and H /C for lignin,carbohydrates and lipids, adapted from Preston and Schmidt (2006).
www.biogeosciences.net/15/703/2018/ Biogeosciences, 15, 703–719, 2018
712 C. Bader et al.: Peat decomposability in managed organic soils
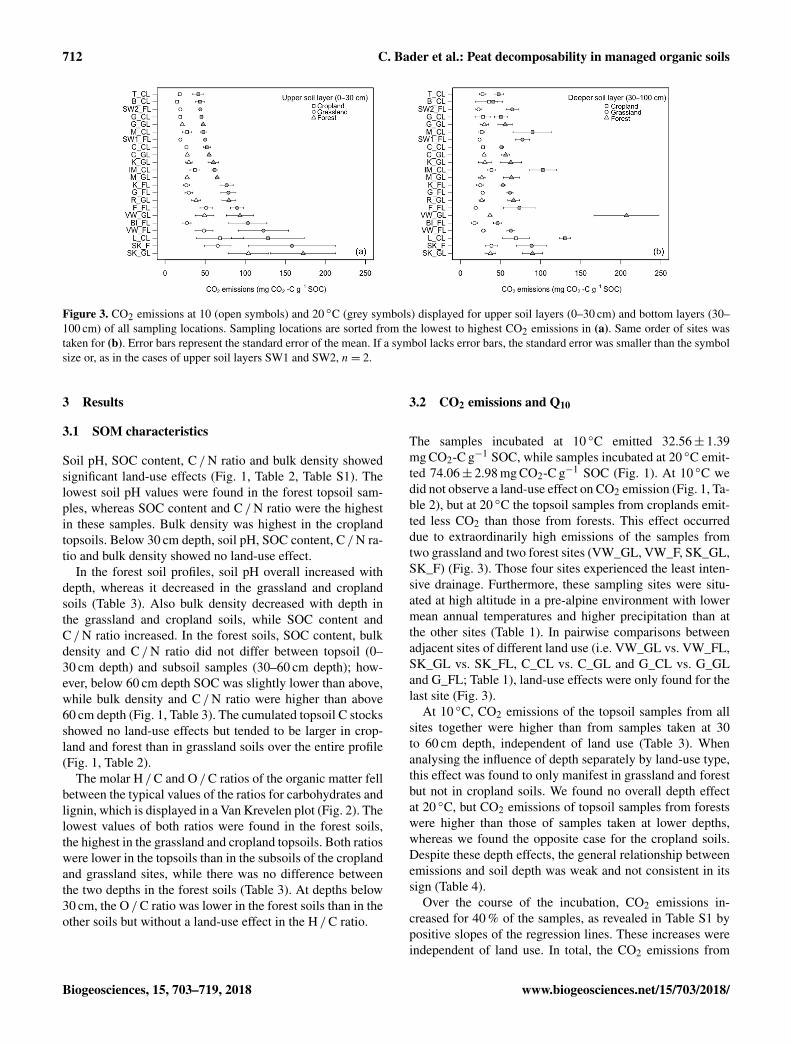
Figure 3. CO2 emissions at 10 (open symbols) and 20 ◦C (grey symbols) displayed for upper soil layers (0–30 cm) and bottom layers (30–100 cm) of all sampling locations. Sampling locations are sorted from the lowest to highest CO2 emissions in (a). Same order of sites wastaken for (b). Error bars represent the standard error of the mean. If a symbol lacks error bars, the standard error was smaller than the symbolsize or, as in the cases of upper soil layers SW1 and SW2, n= 2.
3 Results
3.1 SOM characteristics
Soil pH, SOC content, C /N ratio and bulk density showedsignificant land-use effects (Fig. 1, Table 2, Table S1). Thelowest soil pH values were found in the forest topsoil sam-ples, whereas SOC content and C /N ratio were the highestin these samples. Bulk density was highest in the croplandtopsoils. Below 30 cm depth, soil pH, SOC content, C /N ra-tio and bulk density showed no land-use effect.
In the forest soil profiles, soil pH overall increased withdepth, whereas it decreased in the grassland and croplandsoils (Table 3). Also bulk density decreased with depth inthe grassland and cropland soils, while SOC content andC /N ratio increased. In the forest soils, SOC content, bulkdensity and C /N ratio did not differ between topsoil (0–30 cm depth) and subsoil samples (30–60 cm depth); how-ever, below 60 cm depth SOC was slightly lower than above,while bulk density and C /N ratio were higher than above60 cm depth (Fig. 1, Table 3). The cumulated topsoil C stocksshowed no land-use effects but tended to be larger in crop-land and forest than in grassland soils over the entire profile(Fig. 1, Table 2).
The molar H /C and O /C ratios of the organic matter fellbetween the typical values of the ratios for carbohydrates andlignin, which is displayed in a Van Krevelen plot (Fig. 2). Thelowest values of both ratios were found in the forest soils,the highest in the grassland and cropland topsoils. Both ratioswere lower in the topsoils than in the subsoils of the croplandand grassland sites, while there was no difference betweenthe two depths in the forest soils (Table 3). At depths below30 cm, the O /C ratio was lower in the forest soils than in theother soils but without a land-use effect in the H /C ratio.
3.2 CO2 emissions and Q10
The samples incubated at 10 ◦C emitted 32.56± 1.39mg CO2-C g−1 SOC, while samples incubated at 20 ◦C emit-ted 74.06± 2.98 mg CO2-C g−1 SOC (Fig. 1). At 10 ◦C wedid not observe a land-use effect on CO2 emission (Fig. 1, Ta-ble 2), but at 20 ◦C the topsoil samples from croplands emit-ted less CO2 than those from forests. This effect occurreddue to extraordinarily high emissions of the samples fromtwo grassland and two forest sites (VW_GL, VW_F, SK_GL,SK_F) (Fig. 3). Those four sites experienced the least inten-sive drainage. Furthermore, these sampling sites were situ-ated at high altitude in a pre-alpine environment with lowermean annual temperatures and higher precipitation than atthe other sites (Table 1). In pairwise comparisons betweenadjacent sites of different land use (i.e. VW_GL vs. VW_FL,SK_GL vs. SK_FL, C_CL vs. C_GL and G_CL vs. G_GLand G_FL; Table 1), land-use effects were only found for thelast site (Fig. 3).
At 10 ◦C, CO2 emissions of the topsoil samples from allsites together were higher than from samples taken at 30to 60 cm depth, independent of land use (Table 3). Whenanalysing the influence of depth separately by land-use type,this effect was found to only manifest in grassland and forestbut not in cropland soils. We found no overall depth effectat 20 ◦C, but CO2 emissions of topsoil samples from forestswere higher than those of samples taken at lower depths,whereas we found the opposite case for the cropland soils.Despite these depth effects, the general relationship betweenemissions and soil depth was weak and not consistent in itssign (Table 4).
Over the course of the incubation, CO2 emissions in-creased for 40 % of the samples, as revealed in Table S1 bypositive slopes of the regression lines. These increases wereindependent of land use. In total, the CO2 emissions from
Biogeosciences, 15, 703–719, 2018 www.biogeosciences.net/15/703/2018/
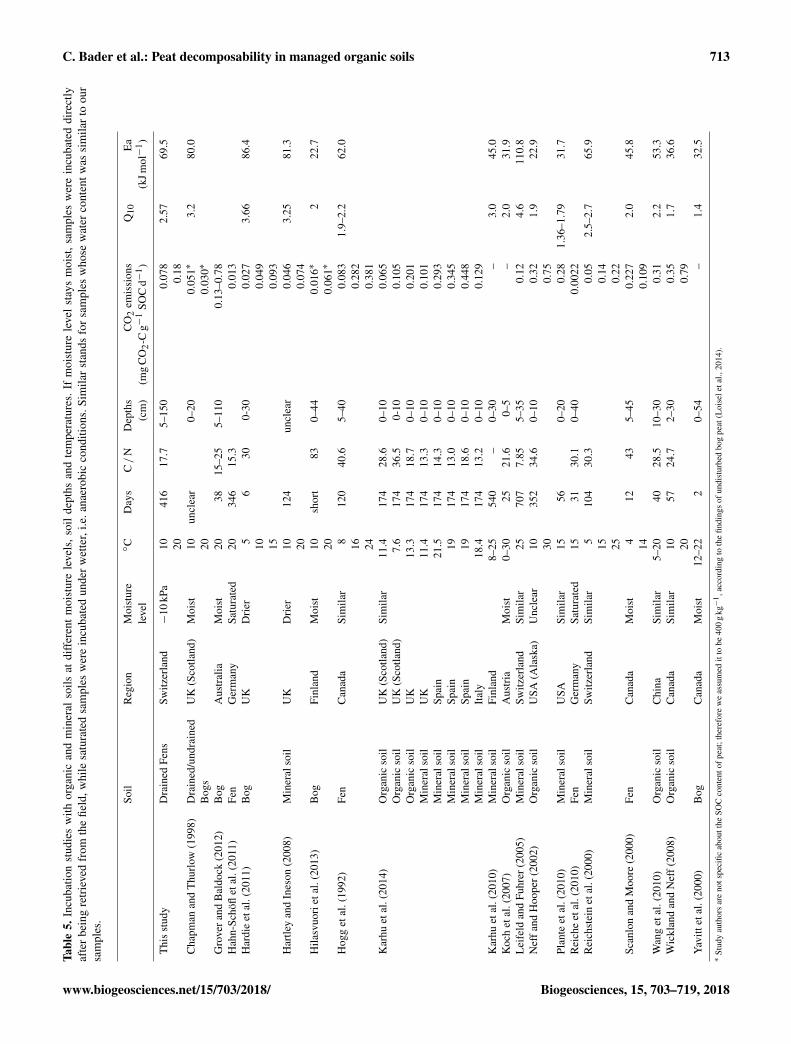
C. Bader et al.: Peat decomposability in managed organic soils 713Ta
ble
5.In
cuba
tion
stud
ies
with
orga
nic
and
min
eral
soils
atdi
ffer
ent
moi
stur
ele
vels
,soi
lde
pths
and
tem
pera
ture
s.If
moi
stur
ele
vel
stay
sm
oist
,sam
ples
wer
ein
cuba
ted
dire
ctly
afte
rbe
ing
retr
ieve
dfr
omth
efie
ld,w
hile
satu
rate
dsa
mpl
esw
ere
incu
bate
dun
der
wet
ter,
i.e.a
naer
obic
cond
ition
s.Si
mila
rst
ands
for
sam
ples
who
sew
ater
cont
entw
assi
mila
rto
our
sam
ples
.
Soil
Reg
ion
Moi
stur
e◦C
Day
sC/
ND
epth
sC
O2
emis
sion
sQ
10E
ale
vel
(cm
)(m
gC
O2-
Cg−
1SO
Cd−
1 )(k
Jmol−
1 )
Thi
sst
udy
Dra
ined
Fens
Switz
erla
nd−
10kP
a10
416
17.7
5–15
00.
078
2.57
69.5
200.
18C
hapm
anan
dT
hurl
ow(1
998)
Dra
ined
/und
rain
edU
K(S
cotla
nd)
Moi
st10
uncl
ear
0–20
0.05
1∗3.
280
.0B
ogs
200.
030∗
Gro
vera
ndB
aldo
ck(2
012)
Bog
Aus
tral
iaM
oist
2038
15–2
55–
110
0.13
–0.7
8H
ahn-
Schö
flet
al.(
2011
)Fe
nG
erm
any
Satu
rate
d20
346
15.3
0.01
3H
ardi
eet
al.(
2011
)B
ogU
KD
rier
56
300-
300.
027
3.66
86.4
100.
049
150.
093
Har
tley
and
Ines
on(2
008)
Min
eral
soil
UK
Dri
er10
124
uncl
ear
0.04
63.
2581
.320
0.07
4H
ilasv
uori
etal
.(20
13)
Bog
Finl
and
Moi
st10
shor
t83
0–44
0.01
6∗2
22.7
200.
061∗
Hog
get
al.(
1992
)Fe
nC
anad
aSi
mila
r8
120
40.6
5–40
0.08
31.
9–2.
262
.016
0.28
224
0.38
1K
arhu
etal
.(20
14)
Org
anic
soil
UK
(Sco
tland
)Si
mila
r11
.417
428
.60–
100.
065
Org
anic
soil
UK
(Sco
tland
)7.
617
436
.50-
100.
105
Org
anic
soil
UK
13.3
174
18.7
0–10
0.20
1M
iner
also
ilU
K11
.417
413
.30–
100.
101
Min
eral
soil
Spai
n21
.517
414
.30–
100.
293
Min
eral
soil
Spai
n19
174
13.0
0–10
0.34
5M
iner
also
ilSp
ain
1917
418
.60–
100.
448
Min
eral
soil
Ital
y18
.417
413
.20–
100.
129
Kar
huet
al.(
2010
)M
iner
also
ilFi
nlan
d8–
2554
0–
0–30
–3.
045
.0K
och
etal
.(20
07)
Org
anic
soil
Aus
tria
Moi
st0–
3025
21.6
0–5
–2.
031
.9L
eife
ldan
dFu
hrer
(200
5)M
iner
also
ilSw
itzer
land
Sim
ilar
2570
77.
855–
350.
124.
611
0.8
Nef
fand
Hoo
per(
2002
)O
rgan
icso
ilU
SA(A
lask
a)U
ncle
ar10
352
34.6
0–10
0.32
1.9
22.9
300.
75Pl
ante
etal
.(20
10)
Min
eral
soil
USA
Sim
ilar
1556
0–20
0.28
1.36
–1.7
931
.7R
eich
eet
al.(
2010
)Fe
nG
erm
any
Satu
rate
d15
3130
.10–
400.
0022
Rei
chst
ein
etal
.(20
00)
Min
eral
soil
Switz
erla
ndSi
mila
r5
104
30.3
0.05
2.5–
2.7
65.9
150.
1425
0.22
Scan
lon
and
Moo
re(2
000)
Fen
Can
ada
Moi
st4
1243
5–45
0.22
72.
045
.814
0.10
9W
ang
etal
.(20
10)
Org
anic
soil
Chi
naSi
mila
r5–
2040
28.5
10–3
00.
312.
253
.3W
ickl
and
and
Nef
f(20
08)
Org
anic
soil
Can
ada
Sim
ilar
1057
24.7
2–30
0.35
1.7
36.6
200.
79Y
avitt
etal
.(20
00)
Bog
Can
ada
Moi
st12
–22
20–
54–
1.4
32.5
∗St
udy
auth
ors
are
nots
peci
ficab
outt
heSO
Cco
nten
tofp
eat;
ther
efor
ew
eas
sum
edit
tobe
400
gkg−
1 ,ac
cord
ing
toth
efin
ding
sof
undi
stur
bed
bog
peat
(Loi
sele
tal.,
2014
).
www.biogeosciences.net/15/703/2018/ Biogeosciences, 15, 703–719, 2018
714 C. Bader et al.: Peat decomposability in managed organic soils
these samples were almost 50 % higher than those from theother samples that instead showed a trend of decreasing emis-sions.
Mean Q10 values were 2.57± 0.05. The Q10 did not differbetween the three land use types. It was lower below 60 cmdepth in the cropland and grassland but not in the forest soils(Fig. 1, Table 3). Activation energies (Ea) calculated fromQ10 values ranged around 48.1 and 123.5 kJ mol−1 and likeQ10 values decreased with depth. There were significant re-lationships between CO2 emission and SOC content, bulkdensity and C /N ratio in general but they were weak (Ta-ble 4). The Q10 values showed similar relationships to thesesoil variables as CO2 emission.
4 Discussion
4.1 SOM characteristics
The SOC contents, bulk densities and C /N ratios found inthe deeper parts of soil profiles presented here were closeto values that are typical for undisturbed peat (Grover andBaldock, 2012; Loisel et al., 2014). They also indicate thatsoils of our study sites were characteristic of European fensand resembled typical properties of managed organic soils(Berglund, 1995; Kechavarzi et al., 2010; Eickenscheidt etal., 2015; Krueger et al., 2015; Wüst-Galley et al., 2016;Brouns et al., 2016). Several studies assume that deeper layerpeat of managed organic soils is less decomposed (Ewing andVepraskas, 2006; Rogiers et al., 2008; Leifeld et al., 2011a, b;Krueger et al., 2015; Wüst-Galley et al., 2016). We thereforeinterpret the different SOM characteristics found in the top-soils of our samples as indicators of advanced decompositiontriggered by drainage.
The land-use-specific differences manifested in differenttopsoil SOC contents and C /N ratios (highest under forest)and topsoil bulk densities (lowest under forest). The higherforest C /N ratios might be explained by absence of the useof N fertilizers and lower bulk densities by lower traffic withfield machinery. In addition, differences in C /N betweenland-use types may also suggest that peat decomposition wasless advanced in forests compared to croplands and grass-lands. Further, depth effects are lowest in forest soils, indi-cating a lower impact of soil management that could alsoresult in a lower decomposition of forest topsoils. The rela-tively high carbon stocks found in cropland top soils are mostlikely the result of subsidence after drainage and compactionfrom field traffic, leading to increased soil bulk density inthe uppermost layers. This effect, with respect to C stocks,overrides the overall much smaller C concentration in agri-culturally managed organic soils.
The H /C and O /C ratios in the deeper layers of the stud-ied soils were similar to those found in undisturbed bogs anddrained bogs used for forestry in Switzerland (Zaccone et al.,2007; Wüst-Galley et al., 2016). They indicate an enrichment
of polyphenols and aromatic carbon with depth, which is inline with the current understanding of peat development inpeatlands (Cocozza et al., 2003; Zaccone et al., 2007; Klavinset al., 2008; Delarue et al., 2011; Leifeld et al., 2012, 2017).The increased H /C and O /C ratios in the grass- and crop-land topsoils can be attributed to inputs of fresh plant litterto the topsoil via above- and belowground residues, as suchresidues are rich in carbohydrates (Koegel-Knabner, 2002).In a previous study, in which we used stable and radiocarbonisotopes to label the SOC of two of the studied soils (C_CLand C_GL in Table 1), at least 20 % of topsoil organic mat-ter was not peat but derived from recent plant litter (Bader etal., 2017). The results further indicated that the OM derivedfrom these fresh plant residues was a source of labile C thatcontributed more to decomposition than the old, peat-derivedSOM.
The H /C and O /C ratios reflect the mixing ratio of thesetwo SOM sources. The H /C and O /C ratios in forest top-soils were lower than of those under cropland and grasslandand did not change with depth. Interpreting these lower H /Cand O /C ratios in the forest topsoils as indicators of moreadvanced peat decomposition (Klavins et al., 2008; Leifeldet al., 2012; Biester et al., 2014; Wüst-Galley et al., 2016)would be in contradiction to our conjecture that land manage-ment effects on peat decomposition, revealed by SOC, bulkdensity and C /N ratio, are less pronounced for forests. Werather argue that the reason for the low H /C and O /C ratioin the forest soils is a higher abundance of lignin rich (woodderived) plant residues. A second mechanism for comparablyhigher O /C and H /C ratios in cropland and grassland soilscould be that peat loss in the uppermost layers was higherunder agriculture than under forest, resulting in a relativelyhigher share of SOM from recent inputs. Considering all theavailable evidence of SOM characteristics, we conclude thatpeat decomposition is less advanced in forest soils than inagricultural soils and also in line with field flux measure-ments on managed organic soils that typically show fasterdecomposition in croplands and grasslands than in forests(IPCC, 2014).
4.2 CO2 emissions and temperature sensitivity ofdecomposition
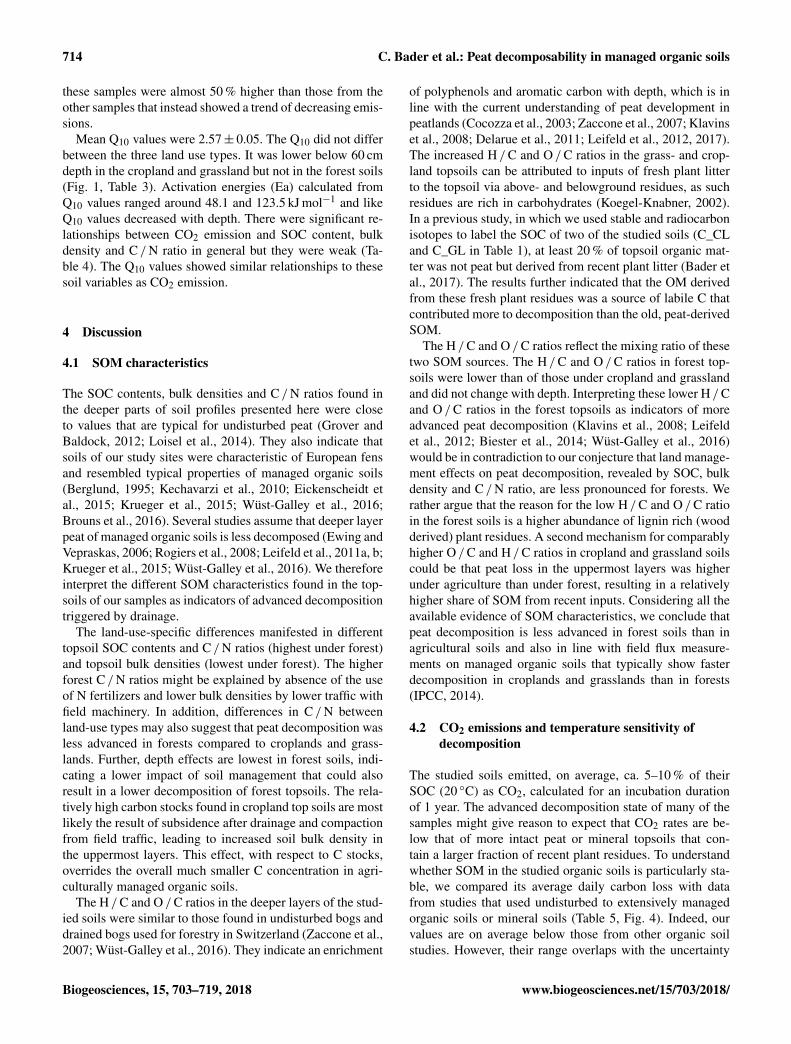
The studied soils emitted, on average, ca. 5–10 % of theirSOC (20 ◦C) as CO2, calculated for an incubation durationof 1 year. The advanced decomposition state of many of thesamples might give reason to expect that CO2 rates are be-low that of more intact peat or mineral topsoils that con-tain a larger fraction of recent plant residues. To understandwhether SOM in the studied organic soils is particularly sta-ble, we compared its average daily carbon loss with datafrom studies that used undisturbed to extensively managedorganic soils or mineral soils (Table 5, Fig. 4). Indeed, ourvalues are on average below those from other organic soilstudies. However, their range overlaps with the uncertainty
Biogeosciences, 15, 703–719, 2018 www.biogeosciences.net/15/703/2018/
C. Bader et al.: Peat decomposability in managed organic soils 715
Figure 4. Comparison of daily CO2 emission rates from this study (box plots) with rates found during other incubation studies (organicsoils and mineral soils). The curves represent the modelled CO2 emission rates for organic soils from other studies (solid thick line)rate= 0.06× 100.08t and mineral soils (dashed thin line) rate= 0.09× 100.05t for temperatures between 0 and 30 ◦C.
of the regression line that is plotted through results fromstudies from other, mostly intact or little degraded organicsoils. Hence, the pronounced oxidative decomposition afterlong periods of drainage might result in a relatively smallerlabile SOC pool, but the large variability between experi-mental set-ups, incubation lengths and water contents amongincubation studies prevents a stronger line of interpretation.Interestingly, the regression lines modelled for organic andmineral soils did not deviate significantly from each other.Therefore, the pools size of labile carbon, indicated by thedecomposition rates, seem not to differ between these soilclasses. This comparison suggests that accumulation of re-cent, labile plant materials that presumably account for mostof the evolved CO2 is not systematically different betweenmineral and organic soils.
Samples showing an increase in CO2 emission rate overtime were predominantly of subsoil origin, where SOC con-tents and C /N ratios indicate a lower decomposition than inthe topsoil. Furthermore, based on the information we haveon land use and drainage depths, it appears that most of thesesamples were taken from soil layers that were protected fromintensive decomposition by water saturation. The long incu-bation period in our study might have given aerobic decom-poser communities time to develop and grow, whereas timemight not have been sufficient in shorter studies.
Like other studies on extensively managed or undisturbedorganic soils that investigated depth interaction of decompo-
sition rates in the top 30 to 50 cm (Hogg et al., 1992; Scanlonand Moore, 2000; Wang et al., 2010; Hardie et al., 2011), wefound a decrease of specific CO2 release with depth. How-ever, the relationship between CO2 emissions and depth wasrather weak in our case and not consistent for both incuba-tion temperatures and the different land uses. Compared tothe studies on unmanaged organic soils, reporting declinesof a factor 2 to 30 (Hogg et al., 1992; Scanlon and Moore,2000; Wang et al., 2010; Hardie et al., 2011), our differ-ences were substantially smaller. Drainage and decadal agri-cultural use of the studied soils led to more intense decom-position processes in the topsoil, resulting in little depth in-teraction or, for croplands, sometimes maybe even a reversalof decomposability. Further, the abundance and decompos-ability of crop residues have to be considered as a substan-tial CO2 source. For two topsoils (C_GL and C_CL), Baderet al. (2017) showed that at least 20 % of the SOM is cropresidue derived and responsible for 40 % of the emitted CO2.Assuming that the abundance of crop and plant residues ishighest in topsoils, it might be possible that decomposabil-ity of peat-derived SOM either does not depend on depth ortopsoil peat decomposes at smaller rates. Therefore, we can-not confirm our first hypothesis of decreasing decompositionrates with depth.
As Table 5 shows, the Q10 values found in our study(2.74± 0.06) were higher than Q10 values found elsewherefor similar sampling depths but in unmanaged organic soils
www.biogeosciences.net/15/703/2018/ Biogeosciences, 15, 703–719, 2018
716 C. Bader et al.: Peat decomposability in managed organic soils
(Chapman and Thurlow, 1998; Hamdi et al., 2013; Hardieet al., 2011; Hilasvuori et al., 2013; Hogg et al., 1992;Scanlon and Moore, 2000; Yavitt et al., 2000). Also thetemperature-independent Ea was higher in the studied sam-ples (69.4± 3 kJ mol−1) than in most other studies on undis-turbed organic soils (47.4± 7.2 kJ mol−1) (Table 5). How-ever, three studies (Chapman, 1971; Hardie et al., 2011;Hogg et al., 1992) found similar or higher Ea values innorthern organic soils. In the case of Chapman and Thur-low (1998) they were also managed as grassland or forest,whereas the other studies used peat from undisturbed or-ganic soils. Nevertheless, the high Ea of the studied samplesmight reflect the change in chemical peat composition withdecomposition after drainage towards higher recalcitrance.In contrast to other studies on unmanaged organic soils re-porting no trend or increasing Q10 values with depth (Scan-lon and Moore, 2000; Wang et al., 2010; Hardie et al., 2011;Hilasvuori et al., 2013), the cropland and grassland profilesin our study had a lower Q10 below the 60 cm depth. Var-ious studies on SOM decomposition used Q10 values as anindicator of SOM recalcitrance (Hogg et al., 1992; Biasi etal., 2005; Davidson and Janssens, 2006; Conant et al., 2008,2011; Hartley and Ineson, 2008; Hilasvuori et al., 2013).Considering that the presence of labile crop residues woulddecrease Q10 in the topsoil rather than in the subsoil, thehigher topsoil Q10 may be explained by an extended accu-mulation of recalcitrant moieties. This proposed a high abun-dance of recalcitrant moieties in topsoils of degrading or-ganic soils is in line with the reported differences in SOMcomposition in different layers as well with the pattern ofCO2 emissions. The latter show no substantial differencewith depth and indicate that a higher fraction of recent andlabile plant residues in topsoils is counterbalanced by a highrecalcitrance of the highly degraded peat. Comparing radio-carbon concentrations in SOC and emitted CO2 of two sitesalso used for this study (C_CL, C_GL), Bader et al. (2017)estimated that SOC from plant residue inputs is more labilethan peat. The measured radiocarbon contents for SOC were75 to 80 pMC and therefore indicated that peat of the topsoilmust have experienced a substantial decomposition.
It is remarkable that despite the controlled conditions inour incubation experiment the variation in cumulative loss ofinitial SOC of between 0.6 and 42.3 % (Fig. 4) was similarto or even larger than that observed in field flux measure-ments (IPCC, 2014). This large variability suggests that thecomposition of SOM is of similar importance to drainage,climate and other site factors in controlling CO2 emissionsfrom drained organic soils. Nevertheless, the relationshipsbetween the measured SOM parameters used to assess thebiochemical decomposability, CO2 emissions and Q10 valueswere rather weak and thus do not support our second hypoth-esis. This stands in contrast to other studies which concludedthat chemical composition is a major factor of SOM decom-posability in organic soils (Scanlon and Moore, 2000; Kochet al., 2007; Reiche et al., 2010; Hardie et al., 2011; Leifeld et
al., 2012). However, these studies focused mainly on singleprofiles of undisturbed or extensively used organic soils. Arecent study investigated relationships between SOM param-eters and decomposition rates of German organic soils undercontrolled conditions (Säurich et al., 2017). These authorsmostly studied strongly disturbed fens with similar proper-ties to the soils in our study. Besides SOC contents, soil pHand C /N ratios, Säurich et al. (2017) focused on other soilnutrients, stable isotopes and microbial biomass. In line withour results, they could not identify strong proxies for SOCdecomposition by means of simple chemical attributes.
In order to explain the weak relationships between SOMcomposition and CO2 release it should be considered that, inour case, the emitted CO2 comprised, on average, only 3.2–7.4 % of the total SOC, while the analysed SOM parametersin this and other studies represent bulk SOM. Our methodsallowed us to gain a broad overview of the chemical compo-sition of SOM, while decomposition might more tightly bebound to the abundance of specific OM moieties.
Although land-use-affected SOM characteristics, such aselemental contents and their ratios, the amount of CO2 emit-ted from the soils did not differ among the three types of landuse. We therefore have to also reject our third hypothesis ofa higher SOM decomposition rate in forest topsoils. We as-sume that long-lasting drainage and management might haveresulted in an equivalent decomposition of most of the labileOM, along with its intrinsic decomposability.
5 Conclusions
Chemical characteristics of SOM indicated advanced peatdecomposition in the uppermost layers of drained organicsoils used as cropland or grasslands. Under controlled mois-ture and temperature conditions, CO2 emissions from peatsamples had a similar variability, as found for in situ CO2flux experiments on drained organic soils. Therefore, car-bon loss from drained organic soils cannot be explained en-tirely by climate or drainage depth. However, simple chem-ical characteristics of SOM, as used in this study, were notspecific enough to explain the variability in CO2 emissionsor the temperature sensitivity of decomposition under con-trolled conditions. Despite CO2 emissions being occasion-ally higher in topsoils, probably derived from accrual of la-bile plant residues, the remarkable decrease of Q10 valueswith depth suggested that the relative content of recalcitrantpeat-derived SOM was high in topsoils of managed organicsoils, indicating advanced degradation in these uppermostlayers. It is therefore necessary to quantify the fraction ofpeat-derived SOM throughout a drained soil profile in orderto verify this assumption. Yet we understand from the simi-lar magnitude of CO2 emission rates found above and below30 cm depth that future peat loss will occur at similar or evenfaster rates, assuming an increasing mean annual tempera-ture.
Biogeosciences, 15, 703–719, 2018 www.biogeosciences.net/15/703/2018/
C. Bader et al.: Peat decomposability in managed organic soils 717
Data availability. The underlying research data are provided in thesupplement.
The Supplement related to this article is available onlineat https://doi.org/10.5194/bg-15-703-2018-supplement.
Competing interests. The authors declare that they have no conflictof interest.
Acknowledgements. This study was funded by the Swiss NationalScience Foundation in the framework of the National ResearchProgramme “Sustainable Use of Soil as a Resource”, grant number406840_143145. We are grateful to Chloé Wüst-Galley for helpwith site selection and her statistical support, and to Robin Gigerfor analysing the soil samples.
Edited by: Jens-Arne SubkeReviewed by: three anonymous referees
References
Bader, C., Müller, M., Schulin, R., and Leifeld, J.: Amount and sta-bility of recent and aged plant residues in degrading peatlandsoils, Soil Biol. Biochem., 109, 167–175, 2017.
Bates, D., Maechler, M., Bolker, B. M., and Walker, S. C.: FittingLinear Mixed-Effects Models Using lme4, J. Stat. Softw., 67, 1–48, 2015.
Beer, J., Lee, K., Whiticar, M., and Blodau, C.: Geochemical con-trols on anaerobic organic matter decomposition in a northernpeatland, Limnol. Oceanogr., 53, 1393–1407, 2008.
Berglund, K.: Optimal drainage depth of five cultivated organicsoils, Swed. J. Agr. Res., 25, 185–196, 1995.
Biasi, C., Rusalimova, O., Meyer, H., Kaiser, C., Wanek, W., Bar-sukov, P., Junger, H., and Richter, A.: Temperature-dependentshift from labile to recalcitrant carbon sources of arctic het-erotrophs, Rapid Commun. Mass Sp., 19, 1401–1408, 2005.
Biester, H., Knorr, K.-H., Schellekens, J., Basler, A., and Hermanns,Y.-M.: Comparison of different methods to determine the degreeof peat decomposition in peat bogs, Biogeosciences, 11, 2691–2707, https://doi.org/10.5194/bg-11-2691-2014, 2014.
Boddy, E., Roberts, P., Hill, P. W., Farrar, J., and Jones, D. L.:Turnover of low molecular weight dissolved organic C (DOC)and microbial C exhibit different temperature sensitivities in Arc-tic tundra soils, Soil Biol. Biochem., 40, 1557–1566, 2008.
Brouns, K., Keuskamp, J. A., Potkamp, G., Verhoeven, J. T. A., andHefting, M. M.: Peat origin and land use effects on microbial ac-tivity, respiration dynamics and exo-enzyme activities in drainedpeat soils in the Netherlands, Soil Biol. Biochem., 95, 144–155,2016.
Byrne, K. A. and Farrell, E. P.: The effect of afforestation on soilcarbon dioxide emissions in blanket peatland in Ireland, Forestry,78, 217–227, 2005.
Cannell, M., Dewar, R., and Pyatt, D.: Conifer Plantations onDrained Peatlands in Britain – a Net Gain or Loss, Forestry, 66,353–369, 1993.
Chapman, S. B.: A simple conductimetric soil respirometer for fielduse, Oikos, 22, 348–353, 1971.
Chapman, S. J. and Thurlow, M.: Peat respiration at low tempera-tures, Soil Biol. Biochem. 30, 1013–1021, 1998.
Chimner, R. A. and Cooper, D. J.: Influence of water table levels onCO2 emissions in a Colorado subalpine fen: an in situ microcosmstudy, Soil Biol. Biochem., 35, 345–351, 2003.
Clymo, R. S.: The limits to peat bog growth, Philos. T. Roy. Soc. B,303, 605–654, 1984.
Cocozza, C., D’Orazio, V., Miano, T. M., and Shotyk, W.: Char-acterization of solid and aqueous phases of a peat bog profileusing molecular fluorescence spectroscopy, ESR and FT-IR, andcomparison with physical properties, Org. Geochem., 34, 49–60,2003.
Conant, R. T., Drijber, R. A., Haddix, M. L., Parton, W. J., Paul,E. A., Plante, A. F., Six, J., and Steinweg, J. M.: Sensitivity oforganic matter decomposition to warming varies with its quality,Global Change Biol., 14, 868–877, 2008.
Conant, R. T., Ryan, M. G., Agren, G. I., Birge, H. E., Davidson,E. A., Eliasson, P. E., Evans, S. E., Frey, S. D., Giardina, C. P.,Hopkins, F. M., Hyvönen, R., Kirschbaum, M. U. F., Lavallee, J.M., Leifeld, J., Parton, W. J., Steinweg, M., Wallenstein, M. D.,Wetterstedt, J. Å. M., and Bradford, M. A.: Temperature and soilorganic matter decomposition rates–synthesis of current knowl-edge and a way forward, Global Change Biol., 17, 3392–3404,2011.
Couwenberg, J., Dommain, R., and Joosten, H.: Greenhouse gasfluxes from tropical peatlands in south-east Asia, Global ChangeBiol., 16, 1715–1732, 2010.
Davidson, E. A. and Janssens, I. A.: Temperature sensitivity of soilcarbon decomposition and feedbacks to climate change, Nature,440, 165–173, 2006.
Delarue, F., Laggoun-Défarge, F., Disnar, J. R., Lottier, N., andGogo, S.: Organic matter sources and decay assessment in aSphagnum-dominated peatland (Le Forbonnet, Jura Mountains,France): impact of moisture conditions, Biogeochemistry, 106,39–52, 2011.
Eickenscheidt, T., Heinichen, J., and Drösler, M.: The greenhousegas balance of a drained fen peatland is mainly controlled byland-use rather than soil organic carbon content, Biogeosciences,12, 5161–5184, https://doi.org/10.5194/bg-12-5161-2015, 2015.
Ewing, J. M. and Vepraskas, M. J.: Estimating primary and sec-ondary subsidence in an organic soil 15, 20, and 30 years afterdrainage, Wetlands, 26, 119–130, 2006.
Flisch, R., Sinaj, S., Charles, R., and Richner, W.: GRUDAF 2009.Grundlagen für die Düngung im Acker- und Futterbau, Agrar-forschung, 16, 1–100, 2009.
Freeman, C., Ostle, N. J., Fenner, N., and Kang, H.: A regulatoryrole for phenol oxidase during decomposition in peatlands, SoilBiol. Biochem., 36, 1663–1667, 2004.
Grover, S. P. P. and Baldock, J. A.: Carbon chemistry and mineral-ization of peat soils from the Australian Alps, Eur. J. Soil Sci.,63, 129–140, 2012.
Hahn-Schöfl, M., Zak, D., Minke, M., Gelbrecht, J., Augustin,J., and Freibauer, A.: Organic sediment formed during inunda-tion of a degraded fen grassland emits large fluxes of CH4 and
www.biogeosciences.net/15/703/2018/ Biogeosciences, 15, 703–719, 2018
718 C. Bader et al.: Peat decomposability in managed organic soils
CO2, Biogeosciences, 8, 1539–1550, https://doi.org/10.5194/bg-8-1539-2011, 2011.
Hamdi, S., Moyano, F., Sall, S., Bernoux, M., and Chevallier, T.:Synthesis analysis of the temperature sensitivity of soil respira-tion from laboratory studies in relation to incubation methodsand soil conditions, Soil Biol. Biochem., 58, 115–126, 2013.
Han, L., Sun, K., Jin, J., and Xing, B.: Some concepts of soil organiccarbon characteristics and mineral interaction from a review ofliterature, Soil Biol. Biochem., 94, 107–121, 2016.
Hardie, S. M. L., Garnett, M. H., Fallick, A. E., Rowland, A. P.,Ostle, N. J., and Flowers, T. H.: Abiotic drivers and their interac-tive effect on the flux and carbon isotope (14C and δ13C) compo-sition of peat-respired CO2, Soil Biol. Biochem., 43, 2432–2440,2011.
Hartley, I. P. and Ineson, P.: Substrate quality and the tempera-ture sensitivity of soil organic matter decomposition, Soil Biol.Biochem., 40, 1567–1574, 2008.
Hilasvuori, E., Akujärvi, A., Fritze, H., Karhu, K., Laiho, R., Mäki-ranta, P., Oinonen, M., Palonen, V., Vanhala, P., and Liski, J.:Temperature sensitivity of decomposition in a peat profile, SoilBiol. Biochem., 67, 47–54, 2013.
Hogg, E. H., Lieffers, V. J., and Wein, R. W.: Potential carbon lossesfrom peat profiles: effects of temperature, drought cycles, andfire, Ecol. Appl., 2, 298–306, 1992.
Höper, H.: Freisetzung von Treibhausgasen aus deutschen Mooren,Telma, 37, 85–116, 2007.
IPCC: 2013 Supplement to the 2006 IPCC Guidelines for NationalGreenhouse Gas Inventories, edited by: Wetlands, Hiraishi, T.,Krug, T., Tanabe, K., Srivastava, N., Baasansuren, J., Fukuda,M., and Troxler, T. G., IPCC, Switzerland, 2.1–2.79, 2014.
Joosten, H.: The global peatland CO2 picture. Peatland status anddrainage related emissions in all countries of the world, WetlandsInternational, Ede, NL, 36 pp., 2010.
Karhu, K., Fritze, H., Hämäläinen, K., Vanhala, P., Jungner, H.,Oinonen, M., Sonninen, E., Tuomi, M., Spetz, P., Kitunen, V.,and others: Temperature sensitivity of soil carbon fractions inboreal forest soil, Ecology, 91, 370–376, 2010.
Karhu, K., Auffret, M. D., Dungait, J. A., Hopkins, D. W., Prosser,J. I., Singh, B. K., Subke, J.-A., Wookey, P. A., Agren, G. I.,Sebastia, M.-T., Gouriveau, F. Bergkvist, G., Meir, P., Notting-ham, A. T., Salinas, N., and Hartley, I. P.: Temperature sensitiv-ity of soil respiration rates enhanced by microbial communityresponse, Nature, 513, 81–84, 2014.
Kechavarzi, C., Dawson, Q., Bartlett, M., and Leeds-Harrison, P.B.: The role of soil moisture, temperature and nutrient amend-ment on CO2 efflux from agricultural peat soil microcosms, Geo-derma, 154, 203–210, 2010.
Kim, S., Kramer, R. W., and Hatcher, P. G.: Graphical method foranalysis of ultrahigh-resolution broadband mass spectra of natu-ral organic matter, the van Krevelen diagram, Anal. Chem., 75,5336–5344, 2003.
Klavins, M., Sire, J., Purmalis, O., and Melecis, V.: Approaches toestimating humification indicators for peat, Mires Peat, 3, Art.07, 2008.
Koch, O., Tscherko, D., and Kandeler, E.: Temperaturesensitivity of microbial respiration, nitrogen mineral-ization, and potential soil enzyme activities in organicalpine soils, Global Biogeochem. Cy., 21, GB4017,https://doi.org/10.1029/2007GB002983, 2007.
Koegel-Knabner, I.: The macromolecular organic composition ofplant and microbial residues as inputs to soil organic matter, SoilBiol. Biochem., 34, 139–162, 2002.
Krueger, J. P., Leifeld, J., Glatzel, S., Szidat, S., and Alewell, C.:Biogeochemical indicators of peatland degradation – a case studyof a temperate bog in northern Germany, Biogeosciences, 12,2861–2871, https://doi.org/10.5194/bg-12-2861-2015, 2015.
Kuhry, P. and Vitt, D. H.: Fossil carbon/nitrogen ratios as a measureof peat decomposition, Ecology, 77, 271–275, 1996.
Leifeld, J. and Fuhrer, J.: The temperature response of CO2 produc-tion from bulk soils and soil fractions is related to soil organicmatter quality, Biogeochemistry, 75, 433–453, 2005.
Leifeld, J., Gubler, L., and Gruenig, A.: Organic matter lossesfrom temperate ombrotrophic peatlands: an evaluation of the ashresidue method, Plant Soil, 341, 349–361, 2011a.
Leifeld, J., Mueller, M., and Fuhrer, J.: Peatland subsidence andcarbon loss from drained temperate fens, Soil Use Manage., 27,170–176, 2011b.
Leifeld, J., Steffens, M., and Galego-Sala, A.: Sensitivity of peat-land carbon loss to organic matter quality, Geophys. Res. Lett.,39, L14704, https://doi.org/10.1029/2012gl051856, 2012.
Leifeld, J., Alewell, C., Bader, C., Krüger, J. P., Mueller, C. W.,Sommer, M., Steffens, M., and Szidat, S.: Pyrogenic carbon con-tributes substantially to carbon storage in intact and degradedNorthern peatlands, Land Degrad. Dev., doi:10.1002/ldr.2812,2017.
Loisel, J., Gallego-Sala, A. V., and Yu, Z.: Global-scale pattern ofpeatland Sphagnum growth driven by photosynthetically activeradiation and growing season length, Biogeosciences, 9, 2737–2746, https://doi.org/10.5194/bg-9-2737-2012, 2012.
Loisel, J., Yu, Z., Beilman, D. W., Camill, P., Alm, J., Amesbury,M. J., Anderson, D., Andersson, S., Bochicchio, C., Barber,K., Belyea, L. R. Bunbury, J., Chambers, F. M., Charman, D.J., De Vleeschouwer, F., Fiałkiewicz-Kozieł, B., Finkelstein, S.A., Gałka, M., Garneau, M., Hammarlund, D., Hinchcliffe, W.,Holmquist, J., Hughes, P., Jones, M. C., Klein, E. S., Kokfelt, U.,Korhola, A., Kuhry, P., Lamarre, A., Lamentowicz, M., Large,D., Lavoie, M., MacDonald, G., Magnan, G., Mäkilä, M., Mal-lon, G., Mathijssen, P., Mauquoy, D., McCarroll, J., Moore, T.R., Nichols, J., O’Reilly, B., Oksanen, P., Packalen, M., Peteet,D., Richard, P. J. H., Robinson, S., Ronkainen, T., Rundgren, M.,Sannel, A. B. K., Tarnocai, C., Thom, T., Tuittila, E. S., Turetsky,M., Väliranta, M., van der Linden, M., van Geel, B., van Bellen,S., Vitt, D., Zhao, Y., and Zhou, W.: A database and synthesis ofnorthern peatland soil properties and Holocene carbon and nitro-gen accumulation, The Holocene, 24, 1028–1042, 2014.
Lüdi, W.: Das Grosse Moos im westschweizerischen Seelande unddie Geschichte seiner Entstehung, Veröffentlichungen des Geob-otanischen Institutes Rübel in Zürich, 11, Heft, Hans Huber,Bern, Switzerland, 1935.
Malmer, N. and Holm, E.: Variation in the C /N-quotient of peat inrelation to decomposition rate and age determination with 210Pb,Oikos, 171–182, 1984.
McAnallen, L., Doherty, R., and Ogle, N.: Organic composition andmultiphase stable isotope analysis of active, degrading and re-stored blanket bog, Sci. Total Environ., 599, 1779–1790, 2017.
Minkkinen, K. and Laine, J.: Long-term effect of forest drainage onthe peat carbon stores of pine mires in Finland, Canad. J. ForestRes., 28, 1267–1275, 1998.
Biogeosciences, 15, 703–719, 2018 www.biogeosciences.net/15/703/2018/
C. Bader et al.: Peat decomposability in managed organic soils 719
Minkkinen, K., Vasander, H., Jauhiainen, S., Karsisto, M., andLaine, J.: Post-drainage changes in vegetation composition andcarbon balance in Lakkasuo mire, Central Finland, Plant Soil,207, 107–120, 1999.
Neff, J. C. and Hooper, D. U.: Vegetation and climate controls onpotential CO2, DOC and DON production in northern latitudesoils, Global Change Biol., 8, 872–884, 2002.
Parish, F., Sirin, A., Charman, D., Joosten, H., Minayeva, T., Sil-vius, M., and Stringer, L.: Assessment on Peatlands, Biodiversity,and Climate Change: Main Report, Global Environment Centre,Wetlands International, 179 pp., 2008.
Plante, A. F., Conant, R. T., Carlson, J., Greenwood, R., Shulman,J. M., Haddix, M. L., and Paul, E. A.: Decomposition tempera-ture sensitivity of isolated soil organic matter fractions, Soil Biol.Biochem., 42, 1991–1996, 2010.
Preston, C. M. and Schmidt, M. W. I.: Black (pyrogenic) carbon:a synthesis of current knowledge and uncertainties with spe-cial consideration of boreal regions, Biogeosciences, 3, 397–420,https://doi.org/10.5194/bg-3-397-2006, 2006.
R core Team: R: A language and environment for statistical comput-ing, available at: http://www.R-project.org/ (last access: 17 July2017), 2015.
Reiche, M., Gleixner, G., and Küsel, K.: Effect of peat qual-ity on microbial greenhouse gas formation in an acidic fen,Biogeosciences, 7, 187–198, https://doi.org/10.5194/bg-7-187-2010, 2010.
Reichstein, M., Bednorz, F., Broll, G., and Kätterer, T.: Temperaturedependence of carbon mineralisation: conclusions from a long-term incubation of subalpine soil samples, Soil Biol. Biochem.,32, 947–958, 2000.
Rogiers, N., Conen, F., Furger, M., Stöckli, R., and Eugster, W.:Impact of past and present land-management on the C-balanceof a grassland in the Swiss Alps, Global Change Biol., 14, 2613–2625, 2008.
Säurich, A., Tiemeyer, B., Don, A., Bechtold, M., Amelung, W.,and Freibauer, A.: Vulnerability of soil organic matter of anthro-pogenically disturbed organic soils, Biogeosciences Discuss.,https://doi.org/10.5194/bg-2017-127, 2017.
Scanlon, D. and Moore, T.: Carbon dioxide production from peat-land soil profiles: the influence of temperature, oxic/anoxic con-ditions and substrate, Soil Sci., 165, 153–160, 2000.
Schulze, E. D., Luyssaert, S., Ciais, P., Freibauer, A., Janssens, I.A., Soussana, J. F., Smith, P., Grace, J., Levin, I., Thiruchittam-palam, B., Heimann, M., Dolman, A. J., Valentini, R., Bousquet,P., Peylin, P., Peters, W., Rodenbeck, C., Etiope, G., Vuichard,N., Wattenbach, M., Nabuurs, G. J., Poussi, Z., Nieschulze, J.,and Gash, J. H.: Importance of methane and nitrous oxide forEurope’s terrestrial greenhouse-gas balance, Nature Geosci., 2,842–850, 2009.
Six, J., Conant, R. T., Paul, E. A., and Paustian, K.: Stabilizationmechanisms of soil organic matter: implications for C-saturationof soils, Plant Soil, 241, 155–176, 2002.
Sjögersten, S., Caul, S., Daniell, T. J., Jurd, A. P. S., O’Sullivan,O. S., Stapleton, C. S., and Titman, J. J.: Organic matter chem-istry controls greenhouse gas emissions from permafrost peat-lands, Soil Biol. Biochem., 98, 42–53, 2016.
Tfaily, M. M., Cooper, W. T., Kostka, J. E., Chanton, P. R., Schadt,C. W., Hanson, P. J., Iversen, C. M., and Chanton, J. P.: Organicmatter transformation in the peat column at Marcell Experimen-tal Forest: humification and vertical stratification, J. Geophys.Res.-Biogeosci., 119, 661–675, 2014.
Tiemeyer, B., Albiac Borraz, E., Augustin, J., Bechtold, M., Beetz,S., Beyer, C., Drösler, M., Ebli, M., Eickenscheidt, T., Fiedler,S., Förster, C., Freibauer, A., Giebels, M., Glatzel, S., Heinichen,J., Hoffmann, M., Höper, H., Jurasinski, G., Leiber-Sauheitl, K.,Peichl-Brak, M., Roßkopf, N., Sommer, M., and Zeitz, J.: Highemissions of greenhouse gases from grasslands on peat and otherorganic soils, Global Change Biol., 22, 4134–4149, 2016.
Tubiello, F. N., Biancalani, R., Salvatore, M., Rossi, S., andConchedda, G.: A worldwide assessment of greenhouse gasemissions from drained organic soils, Sustainability, 8, paper371, 2016.
Wang, X., Li, X., Hu, Y., Lv, J., Sun, J., Li, Z., and Wu, Z.: Effectof temperature and moisture on soil organic carbon mineraliza-tion of predominantly permafrost peatland in the Great Hing’anMountains, Northeastern China, J. Environ. Sci., 22, 1057–1066,2010.
Wetterstedt, J. A. M., Persson, T., and Agren, G. I.: Temperaturesensitivity and substrate quality in soil organic matter decompo-sition: results of an incubation study with three substrates, GlobalChange Biol., 16, 1806–1819, 2010.
Wickland, K. P. and Neff, J. C.: Decomposition of soil organic mat-ter from boreal black spruce forest: environmental and chemicalcontrols, Biogeochemistry, 87, 29–47, 2008.
WRB 2014: IUSS Working Group WRB, World Reference Basefor Soil Resources 2014, International soil classification systemfor naming soils and creating legends for soil maps, World SoilResources Reports No. 106, FAO, Rome, 193 pp, 2014.
Wüst-Galley, C., Grünig, A., and Leifeld, J.: Locating organic soilsfor the Swiss Greenhouse Gas Inventory, Agroscope Sci., 26, 1–99, 2015.
Wüst-Galley, C., Mossinger, E., and Leifeld, J.: Loss of the soil car-bon storage function of drained forested peatlands, Mires Peat,18, UNSP 07, 2016.
Yavitt, J. B., Williams, C. J., and Wieder, R. K.: Controls onmicrobial production of methane and carbon dioxide in threeSphagnum-dominated peatland ecosystems as revealed by a re-ciprocal field peat transplant experiment, Geomicrobiol. J., 17,61–88, 2000.
Zaccone, C., Miano, T. M., and Shotyk, W.: Qualitative comparisonbetween raw peat and related humic acids in an ombrotrophicbog profile, Org. Geochem., 38, 151–160, 2007.
www.biogeosciences.net/15/703/2018/ Biogeosciences, 15, 703–719, 2018