Embed Size (px)
Citation preview

GUIDELINES ON
URBAN FLOOD RISK
MANAGEMENT (UFRM)
(Third Order Draft)
January 2013
I
Contents
1. Introduction ((Susan. R. Espinueva and Liu Zhiyu) ................................................................ 1
1.1 Background ......................................................................................................................... 1
1.2 Climate Variability and Change .......................................................................................... 4
1.3 Background of the UFRM Project ...................................................................................... 5
1.4 Organization of the Report (UFRM Guidelines) ................................................................. 9
2. Framework of Urban Flood Risk Management (Cheng Xiaotao and Liu Zhiyu) ............... 11
2.1 Varying Features of Urban Floods .................................................................................... 11
2.2 Increasing Flood Risk on the Process of Urbanization ..................................................... 13
2.3 Effective Strategies to cope with Flood Risk in Urban Areas ........................................... 16
2.4 Integrated Urban Flood Risk Management ....................................................................... 17
3. Meteorological Monitoring and Rainfall Forecasting (Masashi Kunitsugu) ....................... 21
3.1 Forecasting, Monitoring, Analyzing and Warning Procedures for UFRM ........................ 21
3.2 Products for Forecasting, Monitoring, Analyzing and Warning Procedures ..................... 23
3.2.1 Meteorological Parameters for the Use of Forecasting Procedures ....................... 23
3.2.2 Meteorological Parameters for the Use of Monitoring, Analyzing and Warning
Procedures ....................................................................................................................... 25
3.3 Information Sharing and Delivery..................................................................................... 31
4. Urban Flood Monitoring, Forecasting and Warning (Yang-Su Kim) ................................... 33
4.1 Hydrological Monitoring .................................................................................................. 33
4.1.1 Measurement of water level ................................................................................... 33
4.1.2 Measurement of discharge ..................................................................................... 35
4.2 Flood Inundation Mapping ................................................................................................ 39
4.3 Flood Forecasting .............................................................................................................. 41
4.3.1 Rainfall-runoff models ........................................................................................... 42
4.3.2 Statistical model ..................................................................................................... 43
4.3.3 Automated flood warning system (AFWS) ............................................................ 43
4.3.4 Flash flood warning................................................................................................ 45
5. Disaster Risk Management for Urban Floods (Tae Sung Cheong, Cheng Xiaotao) ......... 46
5.1 GIS Based Urban Flood Risk Management System ......................................................... 46
5.1.1 Integrated information analysis .............................................................................. 46
5.1.2 Simulation for disaster risk management ............................................................... 48
5.1.3 GIS spatial analysis and visualization .................................................................... 49
5.1.4 Planning games ...................................................................................................... 51
5.2 Flood Management Measures ........................................................................................... 52
5.2.1 Structural measures ................................................................................................ 52
5.2.2 Non-structural measures ......................................................................................... 53
5.2.3 Urban flood management measures ....................................................................... 55
5.3 Alternatives for Flood Risk Management Measures ......................................................... 56
5.3.1 ALARP principle .................................................................................................... 57
5.3.2 Robust strategy ....................................................................................................... 57
5.4 Implementation of Flood Risk Management Measures .................................................... 58
II
5.4.1 Institutions .............................................................................................................. 58
5.4.2 Financing ................................................................................................................ 59
5.4.3 Maintenance ........................................................................................................... 60
5.5 Monitoring of Flood Risk Management Measures............................................................ 60
6. Flood Risk Analysis and Assessment (Tae Sung Cheong, Cheng Xiaotao) ........................... 61
6.1 Definition of Risk Considering the Feature of Floods ...................................................... 61
6.1.1 Hazard assessment ................................................................................................. 61
6.1.2 Vulnerability assessment ........................................................................................ 62
6.1.3 Disaster assessment ................................................................................................ 62
6.1.4 Risk assessment ...................................................................................................... 62
6.2 The Characteristics to be Considered in Urban Flood Risk Analysis................................ 63
6.2.1 Medium and small cities ........................................................................................ 63
6.2.2 Large cities ............................................................................................................. 64
6.3 Procedures of Urban Flood Risk Analysis ........................................................................ 65
6.3.1 Collection of basic data .......................................................................................... 65
6.3.2 Preliminary analysis ............................................................................................... 67
6.3.3 Detailed analysis .................................................................................................... 69
6.4 Procedures of Urban Flood Damage Analysis .................................................................. 70
6.4.1 Features of urban flood damage ............................................................................. 70
6.4.2 The limitation of urban flood damage analysis ...................................................... 70
6.4.3 The method of urban flood damage analysis .......................................................... 71
7. Decision Support System for UFRM (Wan Haotao, Tae Sung Cheong)............................ 74
7.1 Main Aspects of the DSS for UFRM ................................................................................ 74
7.2 Integration of Disaster-related Information ....................................................................... 76
7.3 GIS Based Information Management and Visualization ................................................... 78
7.4 Flood and Inundation Simulation ...................................................................................... 80
7.4.1 Basin based flood mitigation analysis .................................................................... 80
7.4.2 Urban area storm waterlogging analysis ................................................................ 81
7.5 Risk Prediction and Assessment ........................................................................................ 81
7.6 Warning and Emergency Response ................................................................................... 82
7.7 GeoLinking System (GLS) ............................................................................................... 83
8. Training and Research in Support of UFRM (Edwin ST Lai) ........................................... 85
8.1 Gaps in Typhoon Committee Area .............................................................................. 85
8.2 General Training Resources for Capacity-building ........................................................... 87
8.3 Training Strategies under the Typhoon Committee ........................................................ 88
8.3.1 Existing resources under Training and Research Coordination Group (TRCG)
88
8.3.2 Initiatives in support of UFRM ....................................................................... 88
9. Conclusion and Way Forward (Susan and Liu) .................................................................. 90
REFERENCES .............................................................................................................................. 92
Appendix A .................................................................................................................................... 95
Appendix B .................................................................................................................................... 98

1
1. Introduction (Susan. R. Espinueva and Liu Zhiyu)
1.1 Background
The Asia Pacific region accounted for 91% of the world’s total death and 49%
of the world’s total damage due to natural disasters in the last century. It was noted
in recent years that there was significant increase in the intensity and/or frequency of
many extreme events such as heat waves, tropical cyclones, prolonged dry spells,
intense rainfall, tornadoes, thunderstorms, and severe dust storms in the region. The
series of devastating flooding in Vietnam, Cambodia and Thailand in 2011,
flashfloods/landslides in the Philippines from 2009 to 2012, etc. are manifestations
that variability in the climate will pose a serious and additional threat in urban areas.
Climate change is in fact emerging as the pre-eminent development issue in the region.
Impacts of such disasters range from hunger and susceptibility to disease, to loss of
income and human livelihoods.
Fig. 1-1. Global frequency of intense natural disasters
Among the natural hazards classified as geophysical, hydro-meteorological, and
biological by the Emergency Event Database (EM-DAT) established by the Centre for
Research on the Epidemiology of Disasters (CRED), there was a 66 percent global
increase of intense hydro-meteorological disasters of 1210 during 1991–2000 to 2004
during 2001–2010. The Asia and Pacific accounted for about two-thirds of the 1.6
million lives lost to intense natural disasters from 1991 to2000. Fig. 1-1 shows that
global trends are largely due to the rise in intense hydro-meteorological disasters.
It was noted that the increasing impacts of hydro-meteorological-related hazards
are being experienced in highly urban areas with unabated economic development.

2
It was noted that in 2008, the urban population of the world exceeded its rural
population for the first time. Fig. 1-2 indicates the increase in urban population as
the % of the global population over the last three decades. The significant rise is
recorded in Latin America & the Caribbean the Middle East & North Africa, and East
Asia and the Pacific.
Fig. 1-2. Urban population as a % of total population, by region
(Source: data from World Bank development indicators 2012)
Based on United Nations report, urbanization will grow from about 50 % of the
world’s population today to about 60 % by 2030 (Fig 1-3). Asia’s urban population
has grown from 31.5% of the total in 1990 to 42.2% in 2010. Based on the UN
HABITAT report (2010), there is marked difference in urbanization patterns in the
region. For instance in Asia, China and India’s population alone account for 2.5
billion people equivalent to more than 37% of the world’s total population (Fig. 1-4).
In the Asia-Pacific region, the urban population grew an average of 2.8% a year
between 1990 and 2010 and is expected to increase by two-thirds over the next two
decades (i.e., between 2010 and 2030), which implies that 53% of the world’s urban
population growth will occur in Asia, or an addition of 840 million annually, or a
daily increase of 115,000 (United Nations, 2010). This setting will definitely pose
considerable challenge to local and national governments.
3
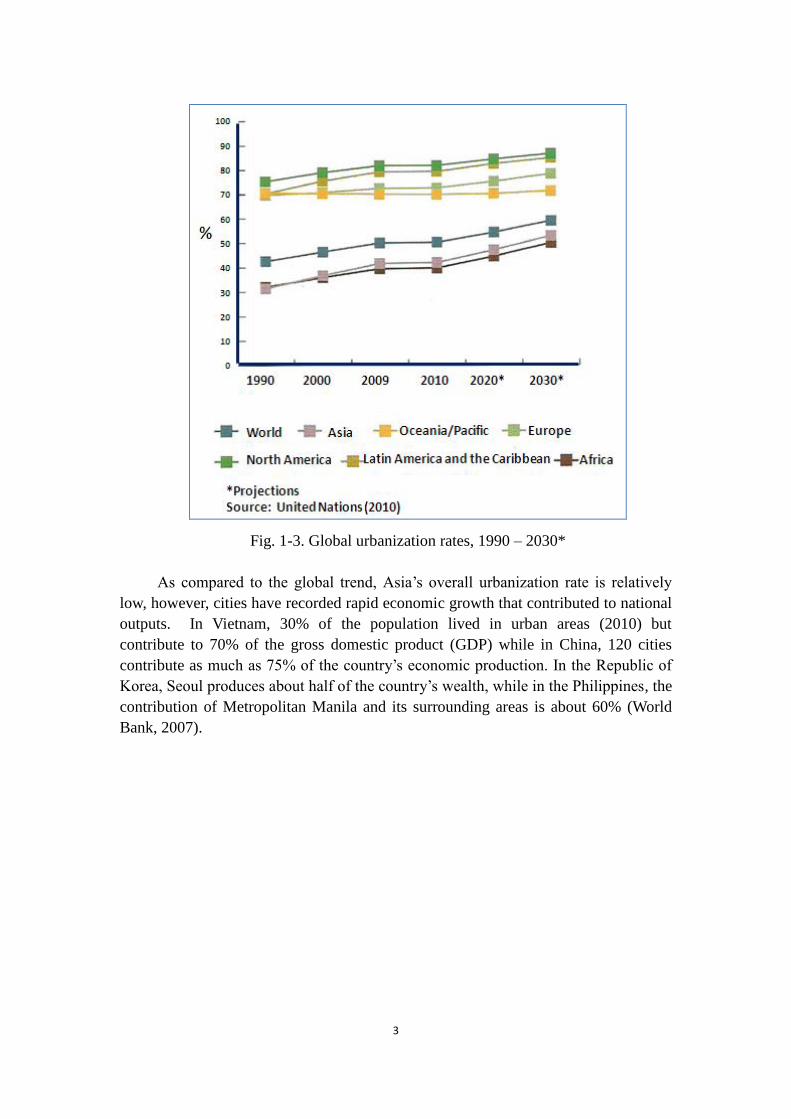
Fig. 1-3. Global urbanization rates, 1990 – 2030*
As compared to the global trend, Asia’s overall urbanization rate is relatively
low, however, cities have recorded rapid economic growth that contributed to national
outputs. In Vietnam, 30% of the population lived in urban areas (2010) but
contribute to 70% of the gross domestic product (GDP) while in China, 120 cities
contribute as much as 75% of the country’s economic production. In the Republic of
Korea, Seoul produces about half of the country’s wealth, while in the Philippines, the
contribution of Metropolitan Manila and its surrounding areas is about 60% (World
Bank, 2007).
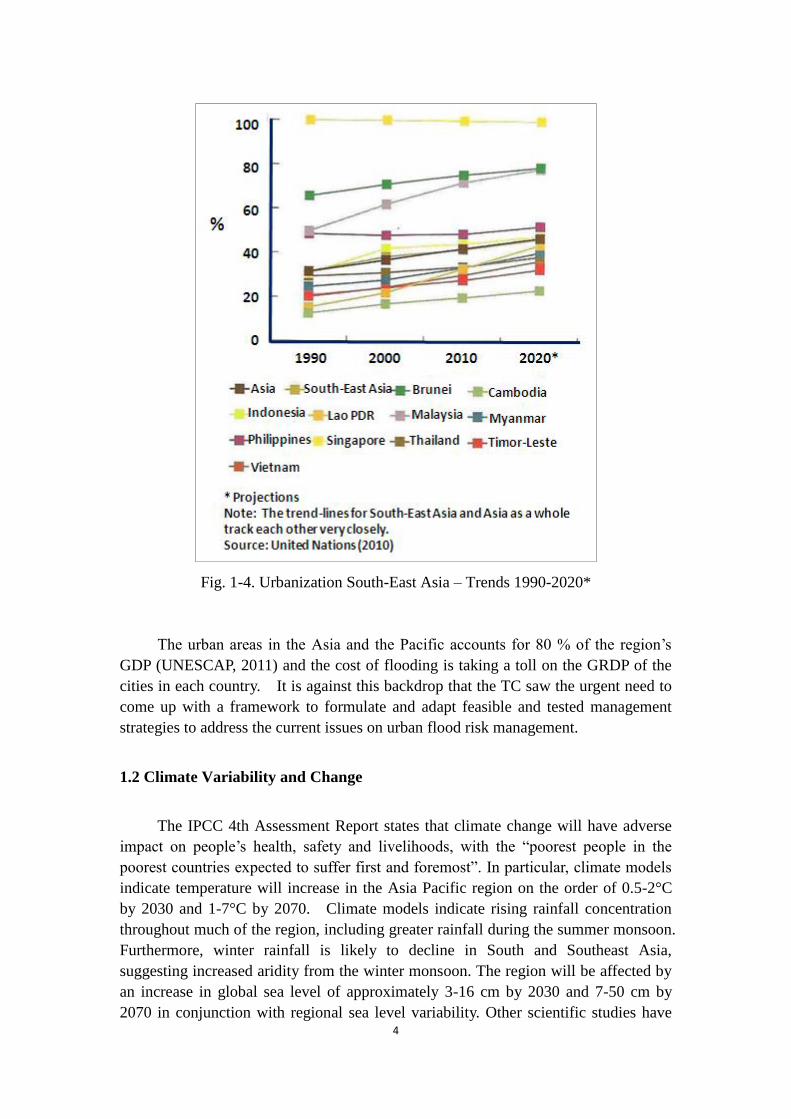
4
Fig. 1-4. Urbanization South-East Asia – Trends 1990-2020*
The urban areas in the Asia and the Pacific accounts for 80 % of the region’s
GDP (UNESCAP, 2011) and the cost of flooding is taking a toll on the GRDP of the
cities in each country. It is against this backdrop that the TC saw the urgent need to
come up with a framework to formulate and adapt feasible and tested management
strategies to address the current issues on urban flood risk management.
1.2 Climate Variability and Change
The IPCC 4th Assessment Report states that climate change will have adverse
impact on people’s health, safety and livelihoods, with the “poorest people in the
poorest countries expected to suffer first and foremost”. In particular, climate models
indicate temperature will increase in the Asia Pacific region on the order of 0.5-2°C
by 2030 and 1-7°C by 2070. Climate models indicate rising rainfall concentration
throughout much of the region, including greater rainfall during the summer monsoon.
Furthermore, winter rainfall is likely to decline in South and Southeast Asia,
suggesting increased aridity from the winter monsoon. The region will be affected by
an increase in global sea level of approximately 3-16 cm by 2030 and 7-50 cm by
2070 in conjunction with regional sea level variability. Other scientific studies have
5
also indicated the potential for more intense tropical cyclones and changes in
important modes of climate variability such as the El Niño-Southern Oscillation.
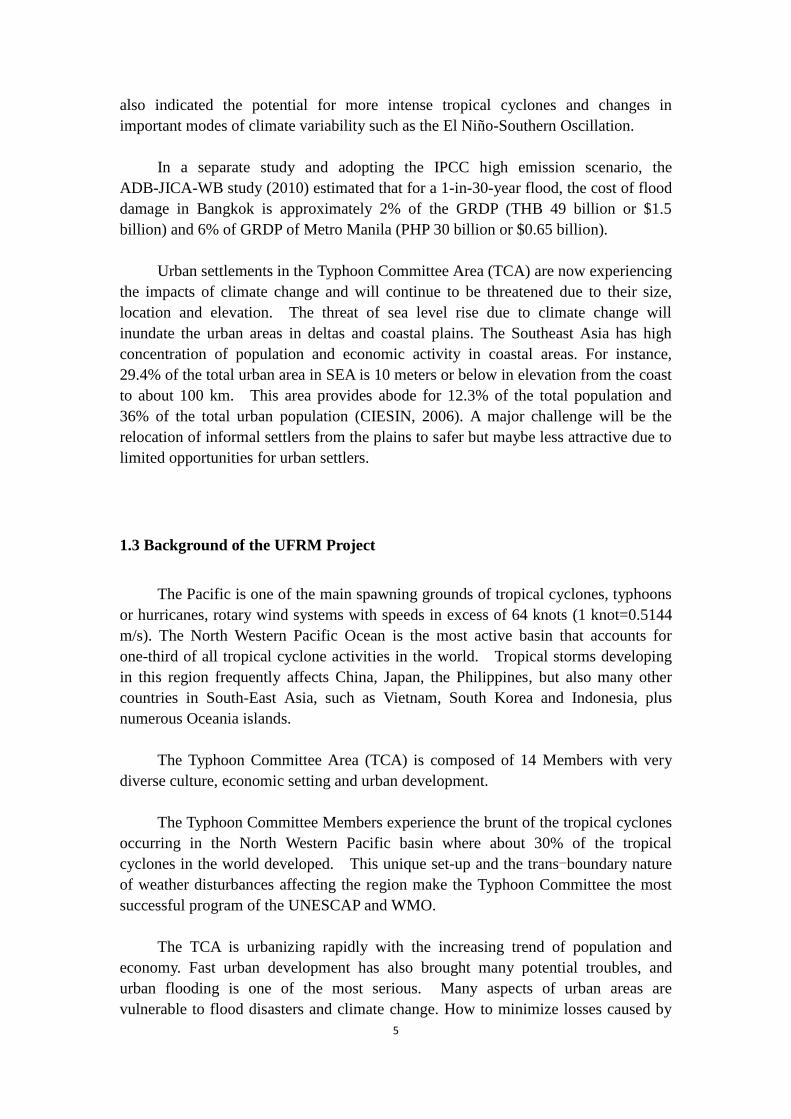
In a separate study and adopting the IPCC high emission scenario, the
ADB-JICA-WB study (2010) estimated that for a 1-in-30-year flood, the cost of flood
damage in Bangkok is approximately 2% of the GRDP (THB 49 billion or $1.5
billion) and 6% of GRDP of Metro Manila (PHP 30 billion or $0.65 billion).
Urban settlements in the Typhoon Committee Area (TCA) are now experiencing
the impacts of climate change and will continue to be threatened due to their size,
location and elevation. The threat of sea level rise due to climate change will
inundate the urban areas in deltas and coastal plains. The Southeast Asia has high
concentration of population and economic activity in coastal areas. For instance,
29.4% of the total urban area in SEA is 10 meters or below in elevation from the coast
to about 100 km. This area provides abode for 12.3% of the total population and
36% of the total urban population (CIESIN, 2006). A major challenge will be the
relocation of informal settlers from the plains to safer but maybe less attractive due to
limited opportunities for urban settlers.
1.3 Background of the UFRM Project
The Pacific is one of the main spawning grounds of tropical cyclones, typhoons
or hurricanes, rotary wind systems with speeds in excess of 64 knots (1 knot=0.5144
m/s). The North Western Pacific Ocean is the most active basin that accounts for
one-third of all tropical cyclone activities in the world. Tropical storms developing
in this region frequently affects China, Japan, the Philippines, but also many other
countries in South-East Asia, such as Vietnam, South Korea and Indonesia, plus
numerous Oceania islands.
The Typhoon Committee Area (TCA) is composed of 14 Members with very
diverse culture, economic setting and urban development.
The Typhoon Committee Members experience the brunt of the tropical cyclones
occurring in the North Western Pacific basin where about 30% of the tropical
cyclones in the world developed. This unique set-up and the trans-boundary nature
of weather disturbances affecting the region make the Typhoon Committee the most
successful program of the UNESCAP and WMO.
The TCA is urbanizing rapidly with the increasing trend of population and
economy. Fast urban development has also brought many potential troubles, and
urban flooding is one of the most serious. Many aspects of urban areas are
vulnerable to flood disasters and climate change. How to minimize losses caused by
6
urban floods and harmonize relationship between floods and socio-economic
development has been a significant problem that governments and international
organizations work on. In recent years, risk management ideas have been introduced
into flood management in the TCA.
During the forty-first session of the Typhoon Committee held in Chiang Mai,
Thailand in 2009, the project on Urban Flood Risk Management (UFRM) led by
China was formally launched as a cross-cutting one among Working Groups on
Meteorology, Hydrology and Disaster Risk Reduction of the committee. The goal of
the project is to exchange and share the experience on urban flood management
among the TC members including technology of urban flood monitoring, forecasting,
and warning; to enhance the capacity of urban flood management in the TC Members.
The expected outcome of the project is to prepare guidelines on flood management for
urban planning and development in the TCA.
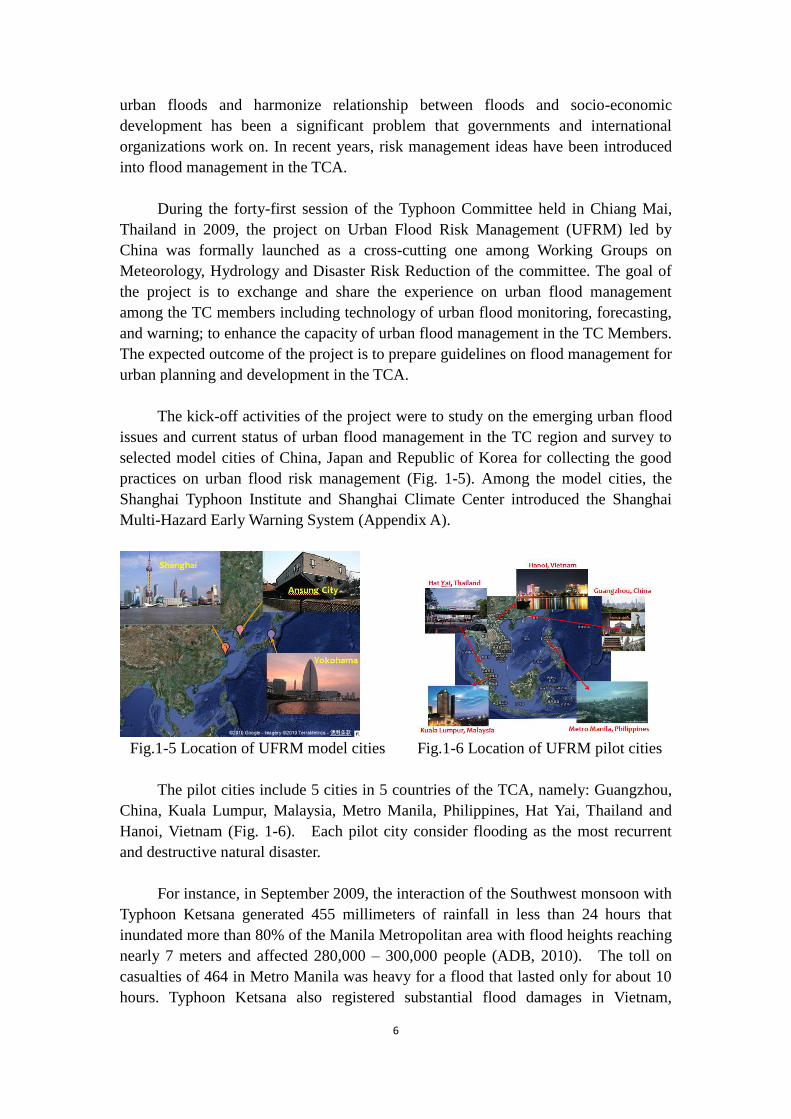
The kick-off activities of the project were to study on the emerging urban flood
issues and current status of urban flood management in the TC region and survey to
selected model cities of China, Japan and Republic of Korea for collecting the good
practices on urban flood risk management (Fig. 1-5). Among the model cities, the
Shanghai Typhoon Institute and Shanghai Climate Center introduced the Shanghai
Multi-Hazard Early Warning System (Appendix A).
Fig.1-5 Location of UFRM model cities Fig.1-6 Location of UFRM pilot cities
The pilot cities include 5 cities in 5 countries of the TCA, namely: Guangzhou,
China, Kuala Lumpur, Malaysia, Metro Manila, Philippines, Hat Yai, Thailand and
Hanoi, Vietnam (Fig. 1-6). Each pilot city consider flooding as the most recurrent
and destructive natural disaster.
For instance, in September 2009, the interaction of the Southwest monsoon with
Typhoon Ketsana generated 455 millimeters of rainfall in less than 24 hours that
inundated more than 80% of the Manila Metropolitan area with flood heights reaching
nearly 7 meters and affected 280,000 – 300,000 people (ADB, 2010). The toll on
casualties of 464 in Metro Manila was heavy for a flood that lasted only for about 10
hours. Typhoon Ketsana also registered substantial flood damages in Vietnam,
7
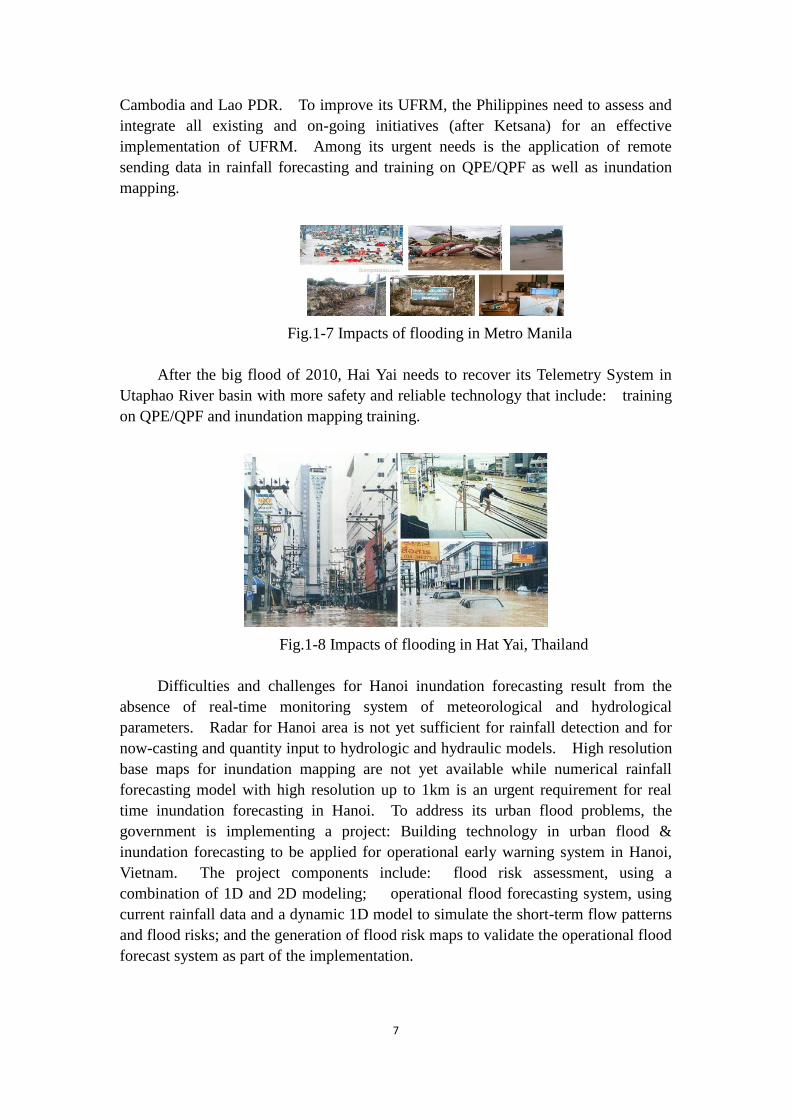
Cambodia and Lao PDR. To improve its UFRM, the Philippines need to assess and
integrate all existing and on-going initiatives (after Ketsana) for an effective
implementation of UFRM. Among its urgent needs is the application of remote
sending data in rainfall forecasting and training on QPE/QPF as well as inundation
mapping.
Fig.1-7 Impacts of flooding in Metro Manila
After the big flood of 2010, Hai Yai needs to recover its Telemetry System in
Utaphao River basin with more safety and reliable technology that include: training
on QPE/QPF and inundation mapping training.
Fig.1-8 Impacts of flooding in Hat Yai, Thailand
Difficulties and challenges for Hanoi inundation forecasting result from the
absence of real-time monitoring system of meteorological and hydrological
parameters. Radar for Hanoi area is not yet sufficient for rainfall detection and for
now-casting and quantity input to hydrologic and hydraulic models. High resolution
base maps for inundation mapping are not yet available while numerical rainfall
forecasting model with high resolution up to 1km is an urgent requirement for real
time inundation forecasting in Hanoi. To address its urban flood problems, the
government is implementing a project: Building technology in urban flood &
inundation forecasting to be applied for operational early warning system in Hanoi,
Vietnam. The project components include: flood risk assessment, using a
combination of 1D and 2D modeling; operational flood forecasting system, using
current rainfall data and a dynamic 1D model to simulate the short-term flow patterns
and flood risks; and the generation of flood risk maps to validate the operational flood
forecast system as part of the implementation.
8
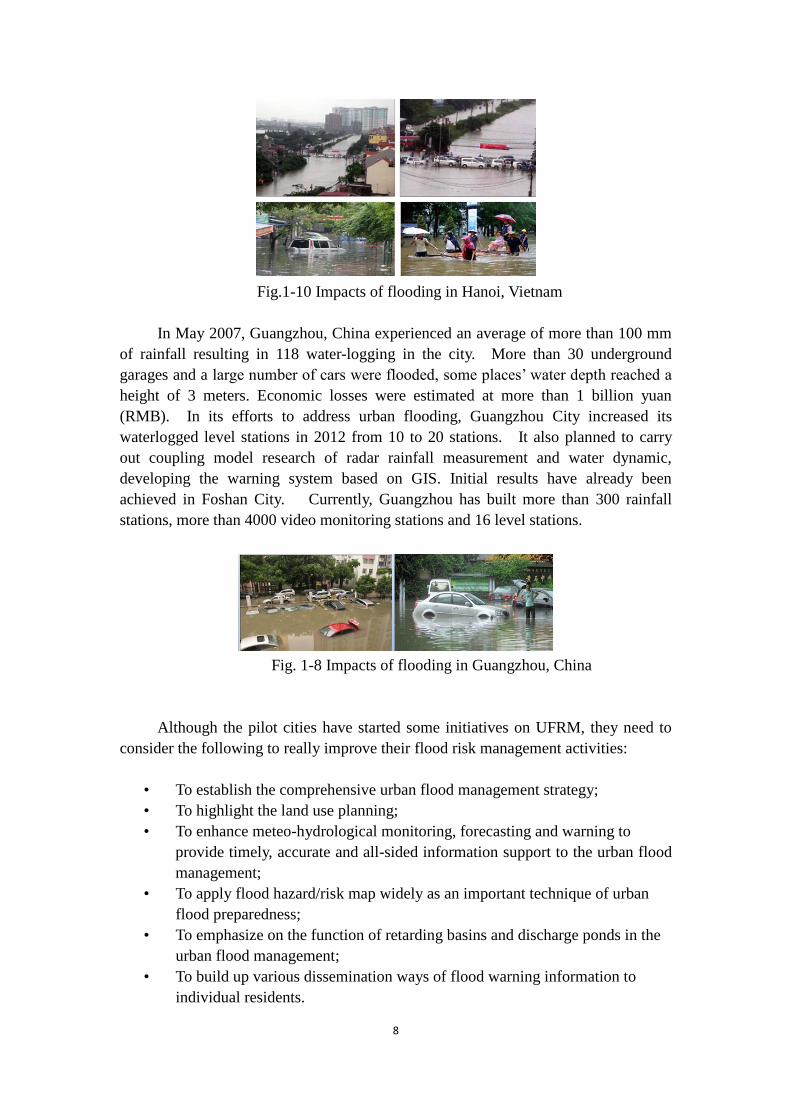
Fig.1-10 Impacts of flooding in Hanoi, Vietnam
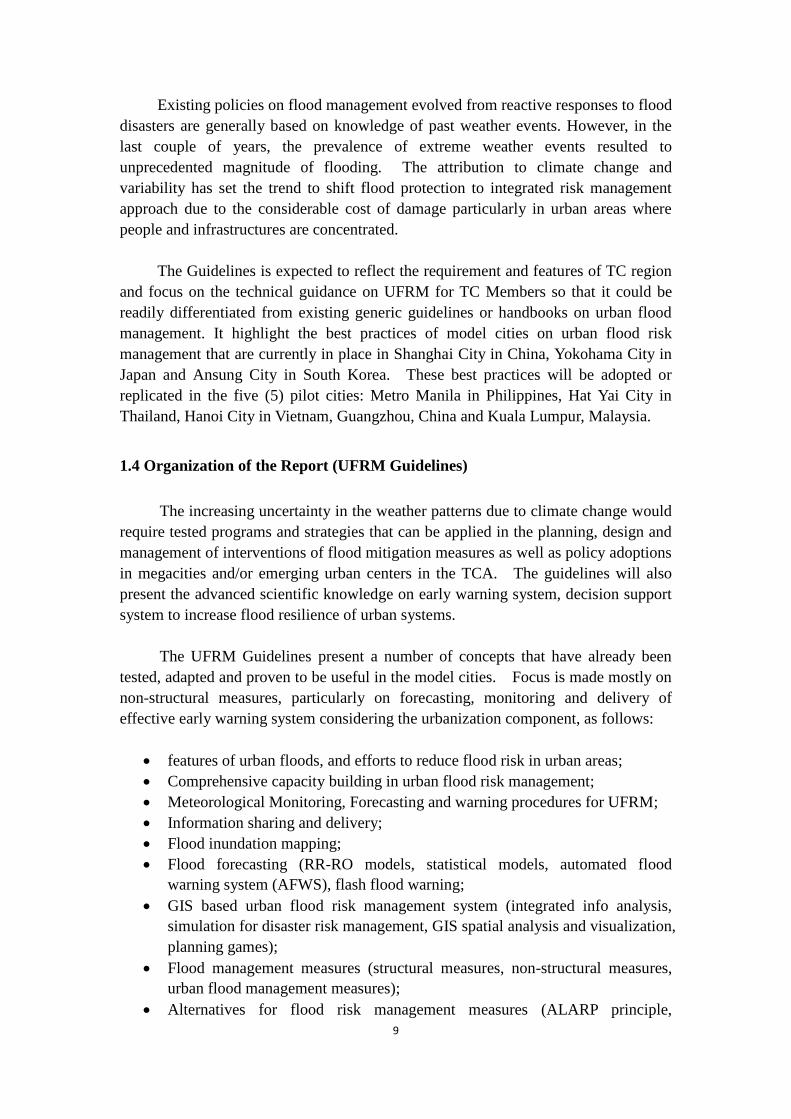
In May 2007, Guangzhou, China experienced an average of more than 100 mm
of rainfall resulting in 118 water-logging in the city. More than 30 underground
garages and a large number of cars were flooded, some places’ water depth reached a
height of 3 meters. Economic losses were estimated at more than 1 billion yuan
(RMB). In its efforts to address urban flooding, Guangzhou City increased its
waterlogged level stations in 2012 from 10 to 20 stations. It also planned to carry
out coupling model research of radar rainfall measurement and water dynamic,
developing the warning system based on GIS. Initial results have already been
achieved in Foshan City. Currently, Guangzhou has built more than 300 rainfall
stations, more than 4000 video monitoring stations and 16 level stations.
Fig. 1-8 Impacts of flooding in Guangzhou, China
Although the pilot cities have started some initiatives on UFRM, they need to
consider the following to really improve their flood risk management activities:
• To establish the comprehensive urban flood management strategy;
• To highlight the land use planning;
• To enhance meteo-hydrological monitoring, forecasting and warning to
provide timely, accurate and all-sided information support to the urban flood
management;
• To apply flood hazard/risk map widely as an important technique of urban
flood preparedness;
• To emphasize on the function of retarding basins and discharge ponds in the
urban flood management;
• To build up various dissemination ways of flood warning information to
individual residents.
9
Existing policies on flood management evolved from reactive responses to flood
disasters are generally based on knowledge of past weather events. However, in the
last couple of years, the prevalence of extreme weather events resulted to
unprecedented magnitude of flooding. The attribution to climate change and
variability has set the trend to shift flood protection to integrated risk management
approach due to the considerable cost of damage particularly in urban areas where
people and infrastructures are concentrated.
The Guidelines is expected to reflect the requirement and features of TC region
and focus on the technical guidance on UFRM for TC Members so that it could be
readily differentiated from existing generic guidelines or handbooks on urban flood
management. It highlight the best practices of model cities on urban flood risk
management that are currently in place in Shanghai City in China, Yokohama City in
Japan and Ansung City in South Korea. These best practices will be adopted or
replicated in the five (5) pilot cities: Metro Manila in Philippines, Hat Yai City in
Thailand, Hanoi City in Vietnam, Guangzhou, China and Kuala Lumpur, Malaysia.
1.4 Organization of the Report (UFRM Guidelines)
The increasing uncertainty in the weather patterns due to climate change would
require tested programs and strategies that can be applied in the planning, design and
management of interventions of flood mitigation measures as well as policy adoptions
in megacities and/or emerging urban centers in the TCA. The guidelines will also
present the advanced scientific knowledge on early warning system, decision support
system to increase flood resilience of urban systems.
The UFRM Guidelines present a number of concepts that have already been
tested, adapted and proven to be useful in the model cities. Focus is made mostly on
non-structural measures, particularly on forecasting, monitoring and delivery of
effective early warning system considering the urbanization component, as follows:
features of urban floods, and efforts to reduce flood risk in urban areas;
Comprehensive capacity building in urban flood risk management;
Meteorological Monitoring, Forecasting and warning procedures for UFRM;
Information sharing and delivery;
Flood inundation mapping;
Flood forecasting (RR-RO models, statistical models, automated flood
warning system (AFWS), flash flood warning;
GIS based urban flood risk management system (integrated info analysis,
simulation for disaster risk management, GIS spatial analysis and visualization,
planning games);
Flood management measures (structural measures, non-structural measures,
urban flood management measures);
Alternatives for flood risk management measures (ALARP principle,
10
ROBUST strategy);
Implementation of flood risk management measures (institutions, financing,
maintenance);
Flood risks change along with urbanization;
Characteristics to be considered in urban flood risk analysis (medium and
small cities, large cities);
Procedures of urban flood damage analysis (features of urban flood damages,
limitations of urban flood damage analysis, method of urban flood damage
analysis);
Decision Support System for UFRM - GeoLinking System (GLS);
Training and research I support of UFRM;
Gaps in TCA;
General training resources for capacity building;
Training strategies under TC (existing resources under Training and Research
Coordination Group (TRCG), initiatives in support of UFRM).
11
2. Framework of Urban Flood Risk Management (Cheng Xiaotao and Liu
Zhiyu)
People living in the typhoon prone countries in the Asia-Pacific region have to
live with floods in the long history and have accumulated rich experiences fighting
against them. However, the features of the catastrophic floods have changed
dramatically in recent decades, due to the large scale development in river basins,
rapid urbanization and the global warming (WMO & GWP, 2008). We have to face
more complicated situations and more unpredictable factors in flood control and
disaster mitigation. It is impossible to cope with the increasing urban flood damages
and adverse impacts only by experiences and traditional measures. That is why we
should establish a new framework of urban flood management, including concepts of
flood risks, integrated structural and non-structural measures, as well as
comprehensive capacity building.
2.1 Varying Features of Urban Floods
Rapid urban growth brings us not only the prosperities but also a series of
challenges, in which the water-related issues, including the escalation of water
hazards, the shortage of water supply and the aggravation of water pollution, have
become essential problems in connection with sustainable development. Floods are
common phenomena in water cycle over the world. Different type and scale of cities
located in mountain, hill or plain areas, and along rivers, lakes and coastal zone, face
different kinds of floods or their combination, such as fluvial flood, pluvial flood,
flash flood, high tide and storm surge, as well as snowmelt flood and ice flood, etc.,
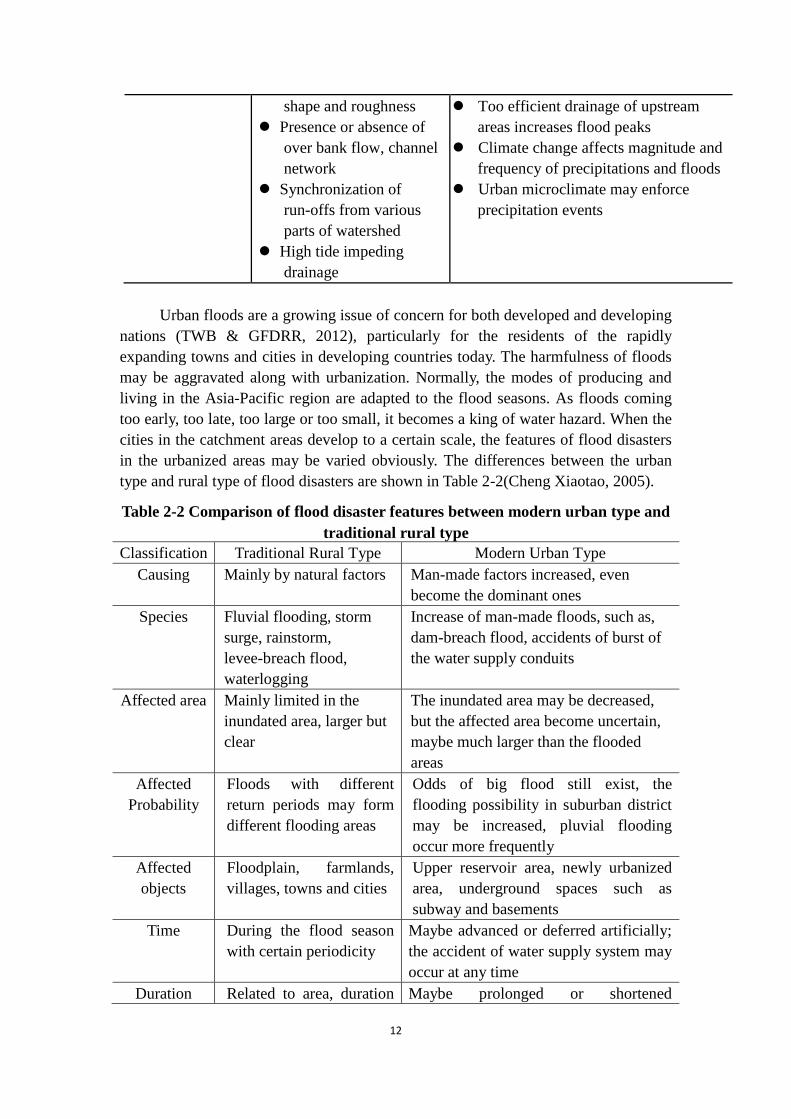
which are affected by both natural and human factors as shown in Table 2-1.
Table 2-1 Factors contributing to flooding (WMO & GWP, 2008)
Meteorological
Factors Hydrological Factors
Human Factors Aggravating Natural
Flood Hazards
Rainfall
Cyclonic
storms
Small-scale
storms
Temperature
Snowfall and
snowmelt
Soil moisture level
Groundwater level prior
to storm
Natural surface
infiltration rate
Presence of impervious
cover
Channel cross-sectional
Land-use changes (e.g. surface sealing
due to urbanization, deforestation)
increase run-off and may be
sedimentation
Occupation of the flood plain
obstructing flows
Inefficiency or non-maintenance of
infrastructure
12
shape and roughness
Presence or absence of
over bank flow, channel
network
Synchronization of
run-offs from various
parts of watershed
High tide impeding
drainage
Too efficient drainage of upstream
areas increases flood peaks
Climate change affects magnitude and
frequency of precipitations and floods
Urban microclimate may enforce
precipitation events
Urban floods are a growing issue of concern for both developed and developing
nations (TWB & GFDRR, 2012), particularly for the residents of the rapidly
expanding towns and cities in developing countries today. The harmfulness of floods
may be aggravated along with urbanization. Normally, the modes of producing and
living in the Asia-Pacific region are adapted to the flood seasons. As floods coming
too early, too late, too large or too small, it becomes a king of water hazard. When the
cities in the catchment areas develop to a certain scale, the features of flood disasters
in the urbanized areas may be varied obviously. The differences between the urban
type and rural type of flood disasters are shown in Table 2-2(Cheng Xiaotao, 2005).
Table 2-2 Comparison of flood disaster features between modern urban type and
traditional rural type
Classification Traditional Rural Type Modern Urban Type
Causing Mainly by natural factors Man-made factors increased, even
become the dominant ones
Species Fluvial flooding, storm
surge, rainstorm,
levee-breach flood,
waterlogging
Increase of man-made floods, such as,
dam-breach flood, accidents of burst of
the water supply conduits
Affected area Mainly limited in the
inundated area, larger but
clear
The inundated area may be decreased,
but the affected area become uncertain,
maybe much larger than the flooded
areas
Affected
Probability
Floods with different
return periods may form
different flooding areas
Odds of big flood still exist, the
flooding possibility in suburban district
may be increased, pluvial flooding
occur more frequently
Affected
objects
Floodplain, farmlands,
villages, towns and cities
Upper reservoir area, newly urbanized
area, underground spaces such as
subway and basements
Time During the flood season
with certain periodicity
Maybe advanced or deferred artificially;
the accident of water supply system may
occur at any time
Duration Related to area, duration Maybe prolonged or shortened
13
Classification Traditional Rural Type Modern Urban Type
of the rainfall and
geographic features
artificially
Damage
species
Mainly in crops,
farmhouses, farm tools,
and casualties of life
Assets of industry and commerce,
public facilities 、 family properties,
urban infrastructures of lifeline system,
indirect losses increased
Influences Causing famine, plague,
larger casualties, poverty,
transport interruption,
severely affected area
may be recovered in
several years
with duplex effects to enlarge or to
reduce the disaster,the total damage
increased, the affected area much more
exceed the flooded area, some losses
may be unable to recuperate, but can be
recovered rapidly
Flood control
measures
Flood control system in
lower level, flood
fighting
Flood control and drainage system and
regulated in higher level, flood proofing,
storm flood storage in city
Disaster
mitigation
Evacuation, victims have
to bear the damages
themselves
Disaster forecasting and warning
system, social safeguard system
consummated gradually
Since the land use conditions have been changed greatly by human activities,
the rainfall-runoff correlations in many river basins have been transformed. Not only
the impermeable surface increased in urbanized areas, but also decline of forestation
coefficient, the aggravation of soil erosions, and the rapid disappearance of wetlands
in catchment areas,which are all the consequences caused mainly by human activities,
have created new influences on flood control situations during urbanization process.
However, the conservancy and restoration of environments are restricted due to the
survival pressure and the lack of necessary investments especially in the developing
countries.
2.2 Increasing Flood Risk on the Process of Urbanization
Comparatively speaking, urbanization levels for most Asian countries are far
lower than those countries in Europe and America, see Fig. 2-1(WMO & GWP, 2008).
Even in East and Southeast Asia, the urbanization process is not synchronized. For
examples, Japan entered high-speed development in 1950s, and South Korea speeded
up in 1970s, and then the coastal region of China in 1990s, with more experiences in
coping with the growing risk of urban floods. Today, the urban population rate in
many developing countries in Asia, including China, are in between 30% to 60%,
which is the most dramatic urbanization stage as shown in Fig. 2-2.
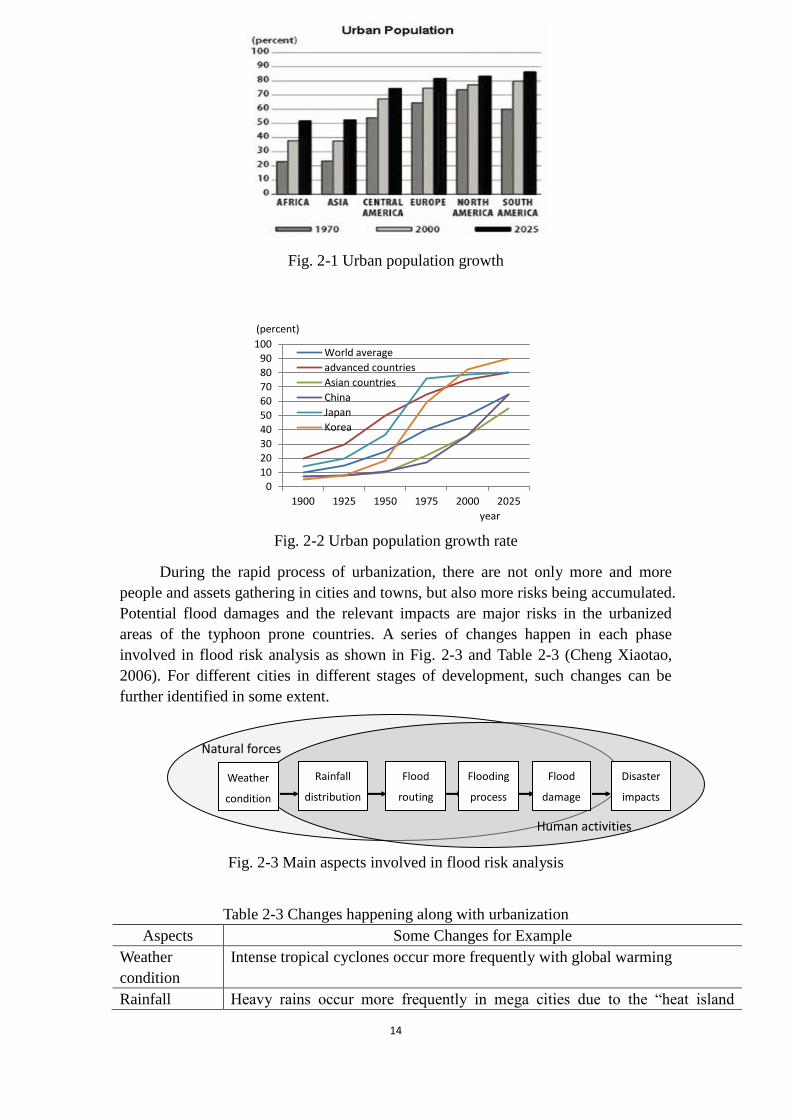
14
Fig. 2-1 Urban population growth
Fig. 2-2 Urban population growth rate
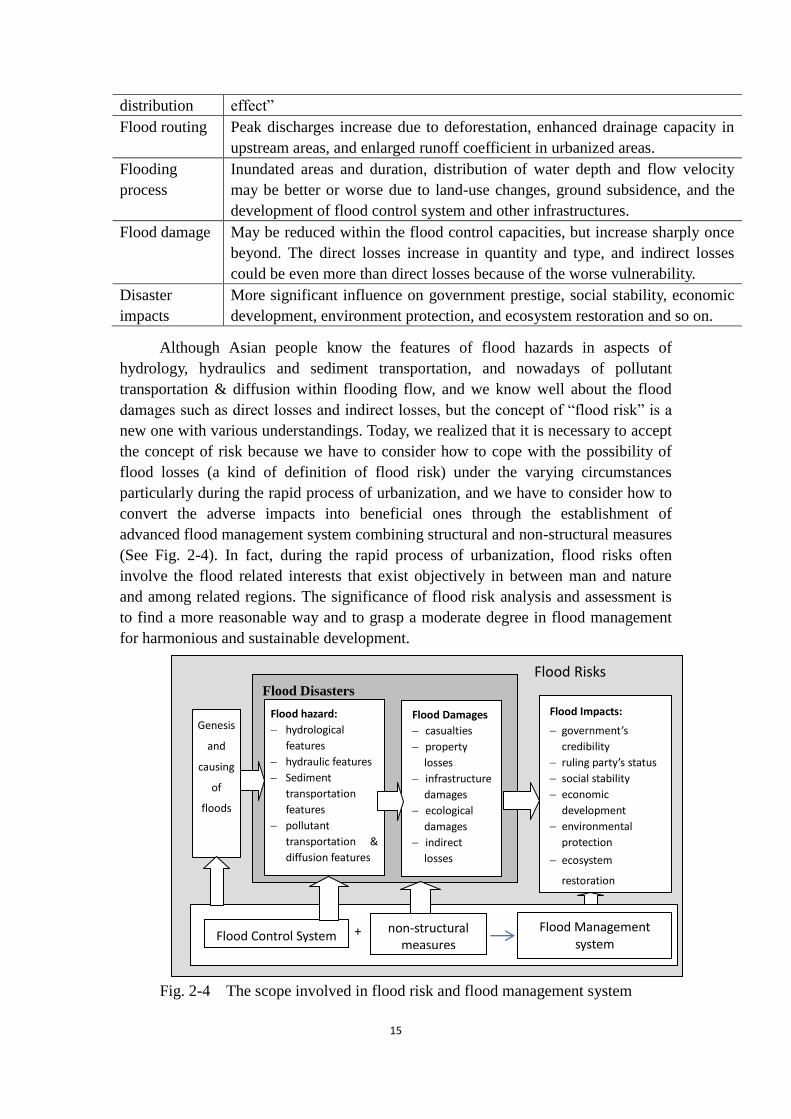
During the rapid process of urbanization, there are not only more and more
people and assets gathering in cities and towns, but also more risks being accumulated.
Potential flood damages and the relevant impacts are major risks in the urbanized
areas of the typhoon prone countries. A series of changes happen in each phase
involved in flood risk analysis as shown in Fig. 2-3 and Table 2-3 (Cheng Xiaotao,
2006). For different cities in different stages of development, such changes can be
further identified in some extent.
Fig. 2-3 Main aspects involved in flood risk analysis
Table 2-3 Changes happening along with urbanization
Aspects Some Changes for Example
Weather
condition
Intense tropical cyclones occur more frequently with global warming
Rainfall Heavy rains occur more frequently in mega cities due to the “heat island
Weather
condition
Rainfall
distribution
Flood
routing
Flooding
process
Flood
damage
Disaster
impacts
Natural forces
Human activities
0
10
20
30
40
50
60
70
80
90
100
1900 1925 1950 1975 2000 2025
(percent)
year
World average
advanced countries
Asian countries
China
Japan
Korea
15
distribution effect”
Flood routing Peak discharges increase due to deforestation, enhanced drainage capacity in
upstream areas, and enlarged runoff coefficient in urbanized areas.
Flooding
process
Inundated areas and duration, distribution of water depth and flow velocity
may be better or worse due to land-use changes, ground subsidence, and the
development of flood control system and other infrastructures.
Flood damage May be reduced within the flood control capacities, but increase sharply once
beyond. The direct losses increase in quantity and type, and indirect losses
could be even more than direct losses because of the worse vulnerability.
Disaster
impacts
More significant influence on government prestige, social stability, economic
development, environment protection, and ecosystem restoration and so on.
Although Asian people know the features of flood hazards in aspects of
hydrology, hydraulics and sediment transportation, and nowadays of pollutant
transportation & diffusion within flooding flow, and we know well about the flood
damages such as direct losses and indirect losses, but the concept of “flood risk” is a
new one with various understandings. Today, we realized that it is necessary to accept
the concept of risk because we have to consider how to cope with the possibility of
flood losses (a kind of definition of flood risk) under the varying circumstances
particularly during the rapid process of urbanization, and we have to consider how to
convert the adverse impacts into beneficial ones through the establishment of
advanced flood management system combining structural and non-structural measures
(See Fig. 2-4). In fact, during the rapid process of urbanization, flood risks often
involve the flood related interests that exist objectively in between man and nature
and among related regions. The significance of flood risk analysis and assessment is
to find a more reasonable way and to grasp a moderate degree in flood management
for harmonious and sustainable development.
Fig. 2-4 The scope involved in flood risk and flood management system
Flood Risks Flood Disasters
Flood hazard:
hydrological
features
hydraulic features
Sediment
transportation
features
pollutant
transportation &
diffusion features
Genesis
and
causing
of
floods
Flood Damages
casualties
property
losses
infrastructure
damages
ecological
damages
indirect
losses
Flood Impacts:
government’s
credibility
ruling party’s status
social stability
economic
development
environmental
protection
ecosystem
restoration
+ Flood Control System non-structural
measures
Flood Management system
16
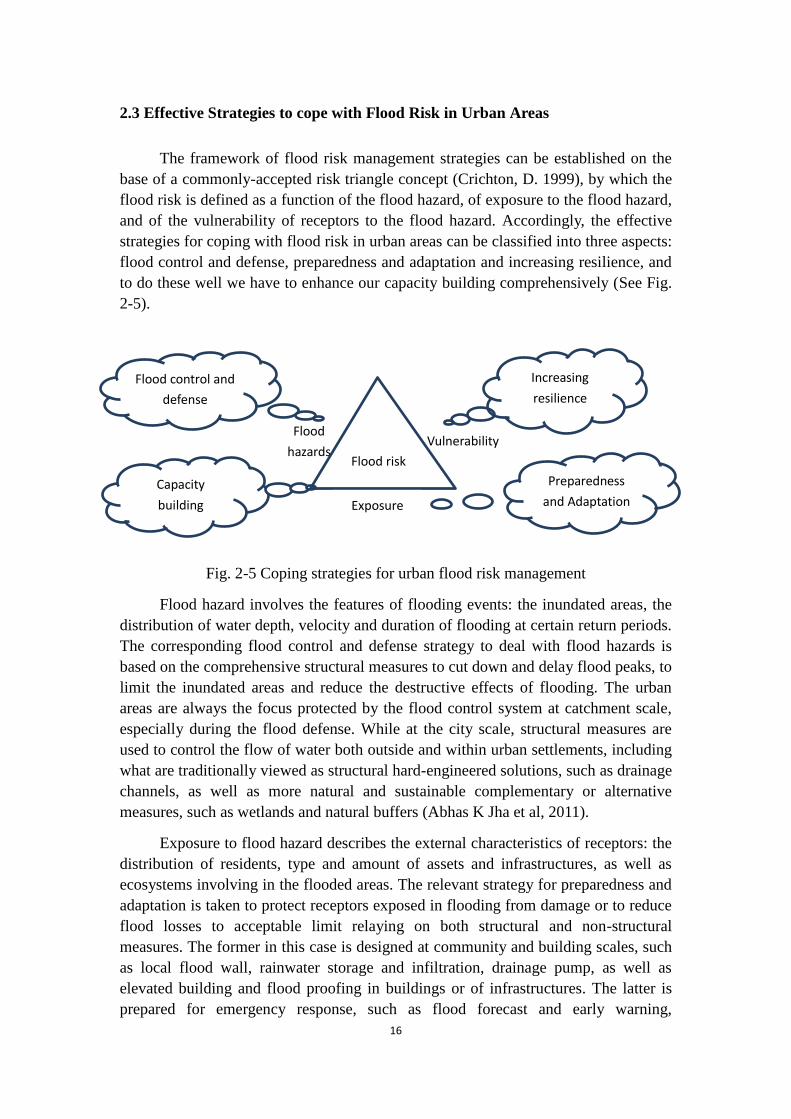
2.3 Effective Strategies to cope with Flood Risk in Urban Areas
The framework of flood risk management strategies can be established on the
base of a commonly-accepted risk triangle concept (Crichton, D. 1999), by which the
flood risk is defined as a function of the flood hazard, of exposure to the flood hazard,
and of the vulnerability of receptors to the flood hazard. Accordingly, the effective
strategies for coping with flood risk in urban areas can be classified into three aspects:
flood control and defense, preparedness and adaptation and increasing resilience, and
to do these well we have to enhance our capacity building comprehensively (See Fig.
2-5).
Fig. 2-5 Coping strategies for urban flood risk management
Flood hazard involves the features of flooding events: the inundated areas, the
distribution of water depth, velocity and duration of flooding at certain return periods.
The corresponding flood control and defense strategy to deal with flood hazards is
based on the comprehensive structural measures to cut down and delay flood peaks, to
limit the inundated areas and reduce the destructive effects of flooding. The urban
areas are always the focus protected by the flood control system at catchment scale,
especially during the flood defense. While at the city scale, structural measures are
used to control the flow of water both outside and within urban settlements, including
what are traditionally viewed as structural hard-engineered solutions, such as drainage
channels, as well as more natural and sustainable complementary or alternative
measures, such as wetlands and natural buffers (Abhas K Jha et al, 2011).
Exposure to flood hazard describes the external characteristics of receptors: the
distribution of residents, type and amount of assets and infrastructures, as well as
ecosystems involving in the flooded areas. The relevant strategy for preparedness and
adaptation is taken to protect receptors exposed in flooding from damage or to reduce
flood losses to acceptable limit relaying on both structural and non-structural
measures. The former in this case is designed at community and building scales, such
as local flood wall, rainwater storage and infiltration, drainage pump, as well as
elevated building and flood proofing in buildings or of infrastructures. The latter is
prepared for emergency response, such as flood forecast and early warning,
Vulnerability Flood
hazards
Increasing
resilience
Flood control and
defense
Preparedness
and Adaptation Capacity
building
Flood risk
Exposure
17
evacuation, rescue and land use management, and so on (Ivan Andjelkovic, 2001).
Vulnerability of receptors to flooding describes the inner properties of receptors:
the degree to which a system (in this case, people or assets) is susceptible to or unable
to cope with the adverse effects of flood hazard. Vulnerability to flooding is
particularly increased where inappropriate, or inadequately maintained infrastructure,
low-quality shelters, and lower resilience of the urban poor intertwine (World Bank,
2008). The corresponding strategy for increasing resilience is taken to enhance the
flood risk-bearing and quick recovery capacities of the system mainly relaying on
non-structural measure, such as flood awareness campaigns, flood insurance, risk
financing, compensation and tax relief, flood recovery and reconstruction, and so on.
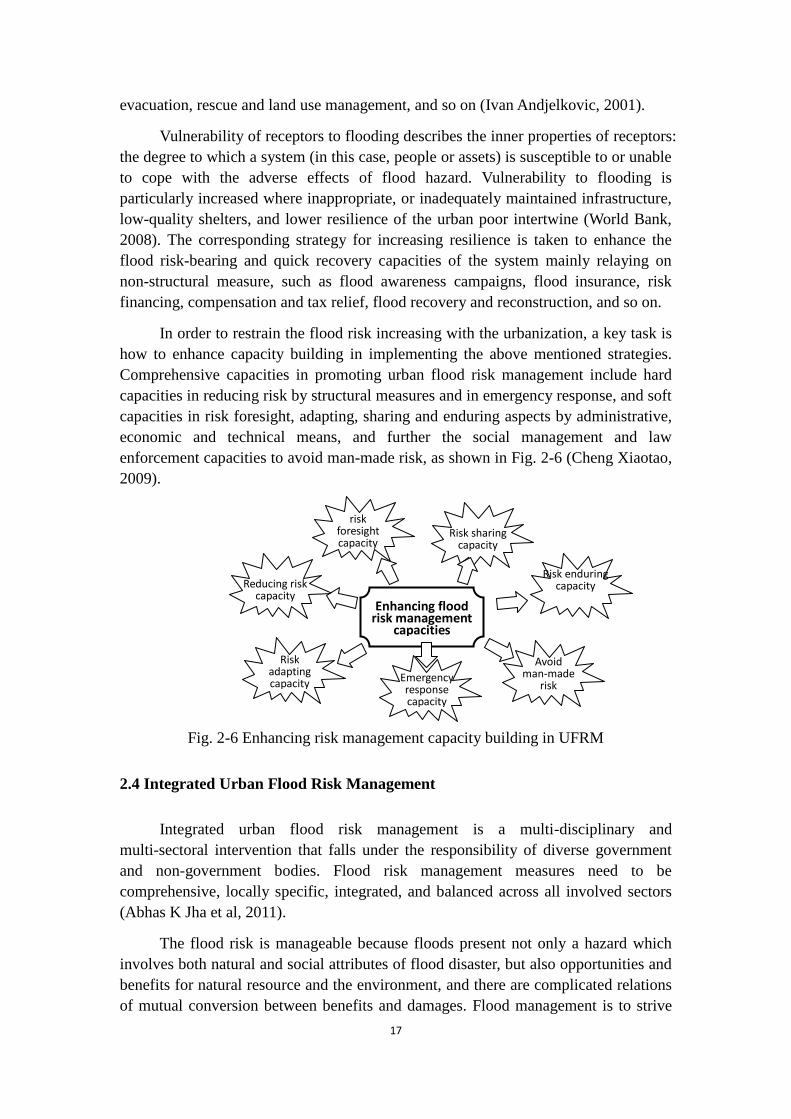
In order to restrain the flood risk increasing with the urbanization, a key task is
how to enhance capacity building in implementing the above mentioned strategies.
Comprehensive capacities in promoting urban flood risk management include hard
capacities in reducing risk by structural measures and in emergency response, and soft
capacities in risk foresight, adapting, sharing and enduring aspects by administrative,
economic and technical means, and further the social management and law
enforcement capacities to avoid man-made risk, as shown in Fig. 2-6 (Cheng Xiaotao,
2009).
Fig. 2-6 Enhancing risk management capacity building in UFRM
2.4 Integrated Urban Flood Risk Management
Integrated urban flood risk management is a multi-disciplinary and
multi-sectoral intervention that falls under the responsibility of diverse government
and non-government bodies. Flood risk management measures need to be
comprehensive, locally specific, integrated, and balanced across all involved sectors
(Abhas K Jha et al, 2011).
The flood risk is manageable because floods present not only a hazard which
involves both natural and social attributes of flood disaster, but also opportunities and
benefits for natural resource and the environment, and there are complicated relations
of mutual conversion between benefits and damages. Flood management is to strive
Reducing risk capacity
risk foresight capacity
Risk sharing capacity
Risk adapting capacity Emergency
response capacity
Avoid man-made
risk
Risk enduring capacity
Enhancing flood risk management
capacities
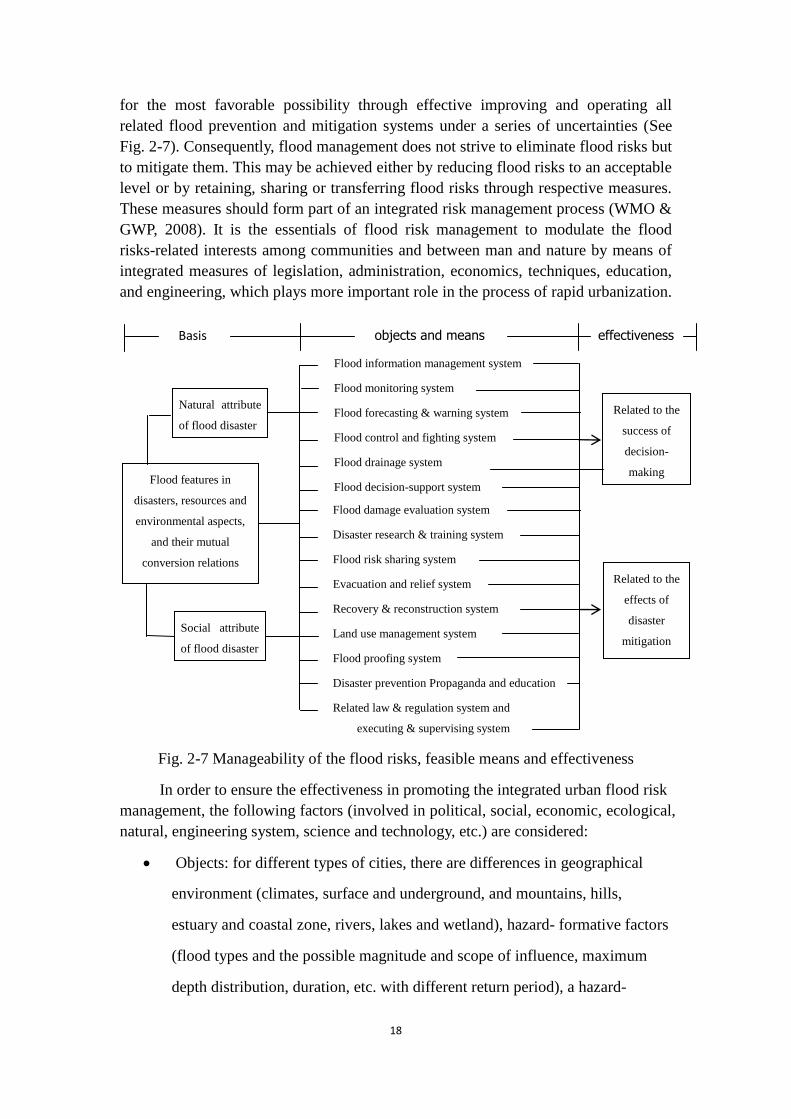
18
for the most favorable possibility through effective improving and operating all
related flood prevention and mitigation systems under a series of uncertainties (See
Fig. 2-7). Consequently, flood management does not strive to eliminate flood risks but
to mitigate them. This may be achieved either by reducing flood risks to an acceptable
level or by retaining, sharing or transferring flood risks through respective measures.
These measures should form part of an integrated risk management process (WMO &
GWP, 2008). It is the essentials of flood risk management to modulate the flood
risks-related interests among communities and between man and nature by means of
integrated measures of legislation, administration, economics, techniques, education,
and engineering, which plays more important role in the process of rapid urbanization.
Fig. 2-7 Manageability of the flood risks, feasible means and effectiveness
In order to ensure the effectiveness in promoting the integrated urban flood risk
management, the following factors (involved in political, social, economic, ecological,
natural, engineering system, science and technology, etc.) are considered:
Objects: for different types of cities, there are differences in geographical
environment (climates, surface and underground, and mountains, hills,
estuary and coastal zone, rivers, lakes and wetland), hazard- formative factors
(flood types and the possible magnitude and scope of influence, maximum
depth distribution, duration, etc. with different return period), a hazard-
Basis objects and means effectiveness
Flood information management system
Flood monitoring system
Flood forecasting & warning system
Flood control and fighting system
Flood drainage system
Flood decision-support system
Flood damage evaluation system
Disaster research & training system
Flood risk sharing system
Evacuation and relief system
Recovery & reconstruction system
Land use management system
Flood proofing system
Disaster prevention Propaganda and education
Related law & regulation system and
executing & supervising system
Related to the
success of
decision-
making
Related to the
effects of
disaster
mitigation
Flood features in
disasters, resources and
environmental aspects,
and their mutual
conversion relations
Natural attribute
of flood disaster
Social attribute
of flood disaster
19
affected body, (receptor, vulnerability) and disaster prevention capacities.
Scales: time scales (from hours, days, months to years) and spatial scales
(river basin, city, district, community, etc. ).
Levels: governments at all levels, the publics and NGO (rights and interests,
management system, joint management mechanism, etc. )
Government departments: authorities of water, weather, civil, urban planning
and construction, public utilities, public finance, power supply, housing
administration, public health and gardens, etc. (responsibility, planning,
operation, and stakes among them)
Stage: even for a certain region in different stages of social and economic
development, there are obvious changes in water management demands,
economic power, technical capacities, managerial level, operation
mechanism and human resources, etc.
Zoning: Different sub-regions in a river basin or city play different roles in
flood management system with different flood risks. The proper land use
pattern, the way and standard of flood protection should be determined
separately.
Values and cognitions: pursuing what kind of goals and choosing what kind
of approaches, depends on the decision maker’s values and cognitions in a
large measure, such as avoiding risk or bearing the risk.
Stakes: regional conflicts of flood related interests objectively exist between
upper and lower reaches, left and right banks, main stream and tributaries, as
well as urban and rural areas, which should be considered for the harmonious
implementation of UFRM.
Science and technology: available means in planning, design, construction,
maintenance, operation of flood control system, as well as decision support
in emergency response, are largely depends upon the level of science and
technology.
Regional development activities: Human development activities in a river
basin, even beyond the municipal limits, have significant impacts on urban
20
flood management. For instance, deforestation and mining in upper mountain
areas may increase soil erosion and peak discharge, and decrease the
flood-carrying capacity of the river channel; road and railway construction
may affect the intensity and distribution of flooding area.
Local governments in Asia face the common challenge of securing their
locality’s social, political and economic future against disaster (USAID & ADPC,
2010). It is a gradual process to shift from flood control to flood management,
implying the adjustment and improvement of conceptual frameworks, administration
systems and operating mechanisms. We should select a flood management approach
based on the risk of flooding in relation to the local conditions.
21
3. Meteorological Monitoring and Rainfall Forecasting (Masashi Kunitsugu)
3.1 Forecasting, Monitoring, Analyzing and Warning Procedures for UFRM
In this section, weather information including weather warnings/advisories
issued for disaster risk reduction (DRR) is reviewed from the view point of
forecasting procedures to be taken by meteorological authorities. Weather information
for urban flood areas to appropriately support DRR activities (e.g. evacuation
instruction) should be provided with sufficient lead time and higher resolution in
space and time. Therefore, weather information for the urban areas should be issued
objectively based on the automatic quantitative analysis and prediction. Forecasters
working on weather Decision Support System (DSS) should be able to select suitable
values among various kinds of objective analysis and prediction products, and to
monitor real-time weather situation continuously. Utilizing observed and analyzed
data, forecasters could modify or confirm their previous forecast scenario to adjust to
the real weather situation in the area. To make it convenient for forecasters to forecast,
monitor and issue warnings, DSS should automatically produce weather information
including warnings/advisories, alerting forecasters to the fact that forecasting values,
such as rainfall amount, exceeds the criteria of warnings/advisories for the targeted
area. Provided the DSS alerts forecasters to issuing warnings/advisories, forecasters
should check the validity of warnings/advisories produced by the system and then
decide to issue information.
To facilitate DRR activities in emergency situations such as torrential rainfall
and storm surges, sufficient lead time from issuance of warnings to occurrence of
disasters should be ensured. For a smooth operation to issue warnings, “weather
forecasting scenario (scenario)” should be developed. Scenario includes a time
sequential forecast, and should explain past, current and future weather situation
theoretically. Validity of the scenarios is checked with key-points of weather
phenomena in forecasting and warning/advisory procedures. According to the
scenario, forecasters should select the most suitable forecast values from various
products such as numerical weather prediction (NWP) outputs and Quantitative
Precipitation Forecast (QPF), and modify the values based on monitored and analyzed
weather situation. To do those procedures appropriately, forecasters are required to
improve their skills and expertise to develop scenarios. Conceptual approaches from
forecasting to warnings/advisories are:
To develop scenarios and to select/modify the most suitable forecast value
with the various products to be input to DSS;
To recognize increasing potential of hazardous phenomena such as torrential
22
rainfall and storm surge by monitoring current weather situation;
To issue warnings/advisories.
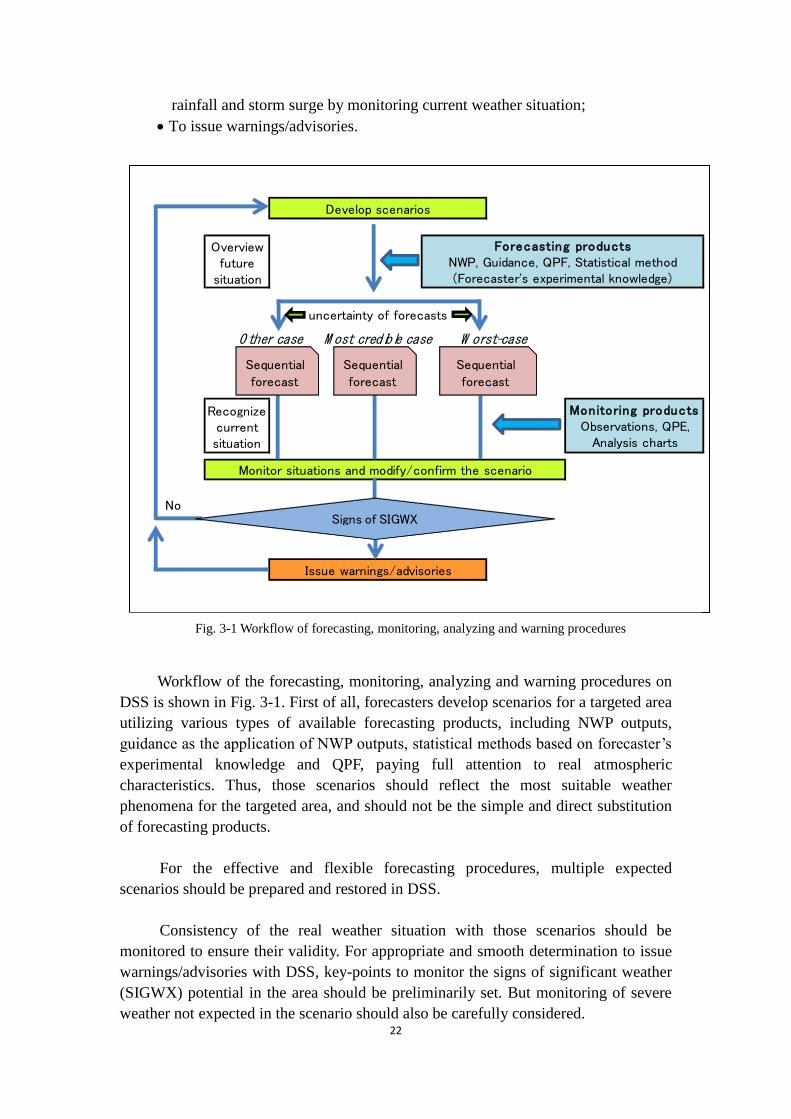
Workflow of the forecasting, monitoring, analyzing and warning procedures on
DSS is shown in Fig. 3-1. First of all, forecasters develop scenarios for a targeted area
utilizing various types of available forecasting products, including NWP outputs,
guidance as the application of NWP outputs, statistical methods based on forecaster’s
experimental knowledge and QPF, paying full attention to real atmospheric
characteristics. Thus, those scenarios should reflect the most suitable weather
phenomena for the targeted area, and should not be the simple and direct substitution
of forecasting products.
For the effective and flexible forecasting procedures, multiple expected
scenarios should be prepared and restored in DSS.
Consistency of the real weather situation with those scenarios should be
monitored to ensure their validity. For appropriate and smooth determination to issue
warnings/advisories with DSS, key-points to monitor the signs of significant weather
(SIGWX) potential in the area should be preliminarily set. But monitoring of severe
weather not expected in the scenario should also be carefully considered.
Overviewfuture
situation
O ther case M ost credible case W orst-case
Recognizecurrentsituation
No
Issue warnings/advisories
Develop scenarios
Forecasting productsNWP, Guidance, QPF, Statistical method(Forecaster's experimental knowledge)
uncertainty of forecasts
Monitoring productsObservations, QPE,
Analysis charts
Monitor situations and modify/confirm the scenario
Sequential
forecast
Signs of SIGWX
Sequential
forecast
Sequential
forecast
Fig. 3-1 Workflow of forecasting, monitoring, analyzing and warning procedures
23
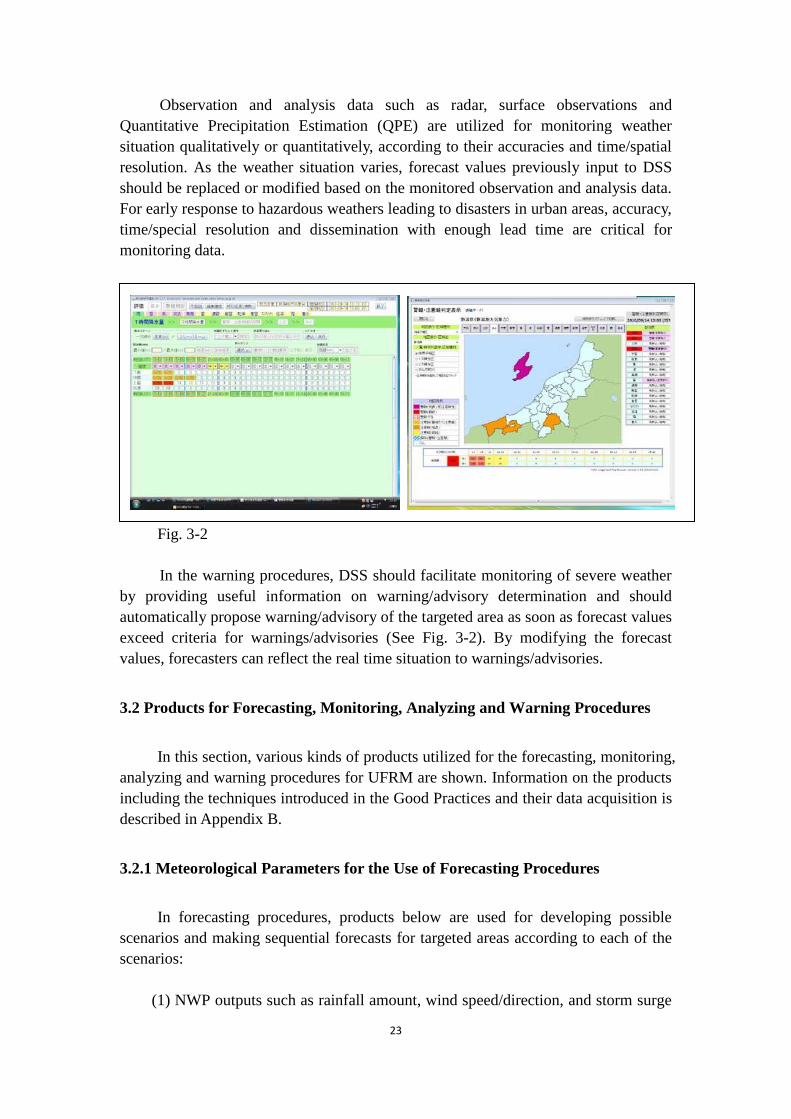
Observation and analysis data such as radar, surface observations and
Quantitative Precipitation Estimation (QPE) are utilized for monitoring weather
situation qualitatively or quantitatively, according to their accuracies and time/spatial
resolution. As the weather situation varies, forecast values previously input to DSS
should be replaced or modified based on the monitored observation and analysis data.
For early response to hazardous weathers leading to disasters in urban areas, accuracy,
time/special resolution and dissemination with enough lead time are critical for
monitoring data.
Fig. 3-2
In the warning procedures, DSS should facilitate monitoring of severe weather
by providing useful information on warning/advisory determination and should
automatically propose warning/advisory of the targeted area as soon as forecast values
exceed criteria for warnings/advisories (See Fig. 3-2). By modifying the forecast
values, forecasters can reflect the real time situation to warnings/advisories.
3.2 Products for Forecasting, Monitoring, Analyzing and Warning Procedures
In this section, various kinds of products utilized for the forecasting, monitoring,
analyzing and warning procedures for UFRM are shown. Information on the products
including the techniques introduced in the Good Practices and their data acquisition is
described in Appendix B.
3.2.1 Meteorological Parameters for the Use of Forecasting Procedures
In forecasting procedures, products below are used for developing possible
scenarios and making sequential forecasts for targeted areas according to each of the
scenarios:
(1) NWP outputs such as rainfall amount, wind speed/direction, and storm surge
24
in targeted areas can indicate possible areas of hazardous weather. They are utilized to
be input to DSS as a first guess of sequential forecasts, and are also available for the
inputs to hydrological models. Some indices indicating atmospheric stability
(Convective Available Potential Energy (CAPE), Showalter Stability Index (SSI),
etc.) and weather forecast guidance are calculated with the NWP outputs. Weather
maps drawn with NWP outputs are effective to understand and forecast atmospheric
structures such as synoptic and meso-scale systems (tropical cyclone, upper
trough/ridge, low level warm moist flow (potential temperature), vertical wind shear,
shear line, meso-scale low pressure system caused by the heating of the ground
surface, etc.). High resolution NWP models are especially used for short range
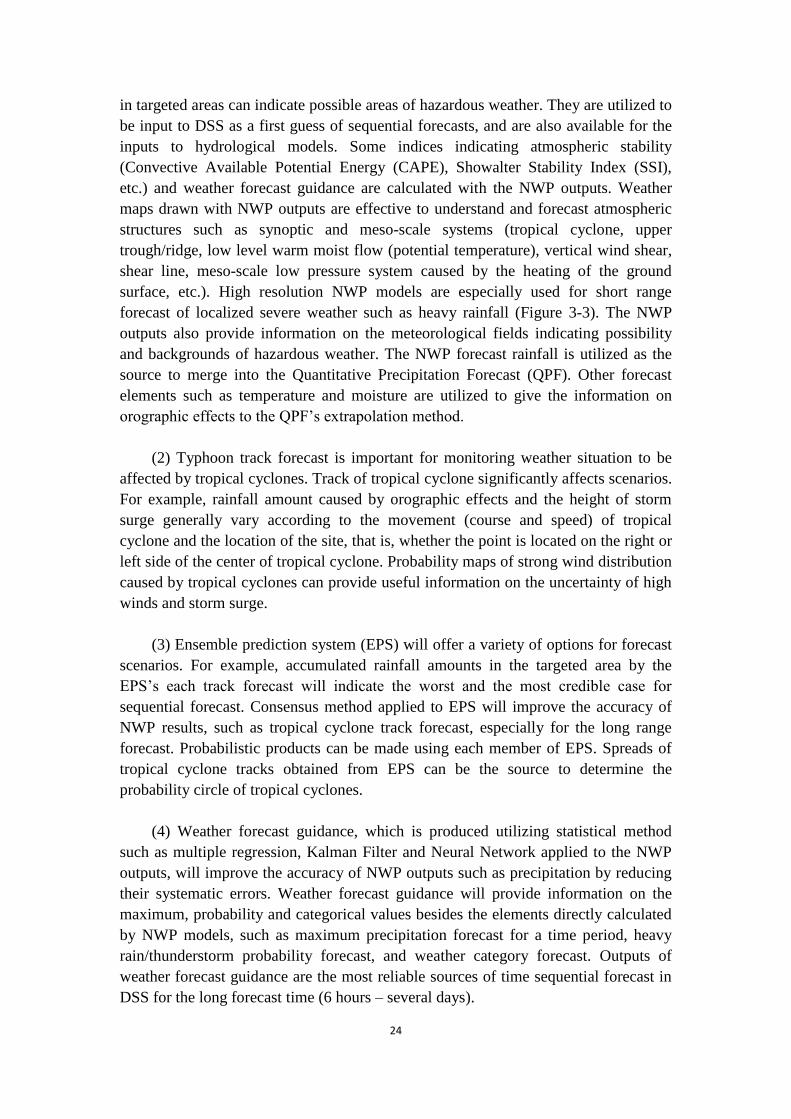
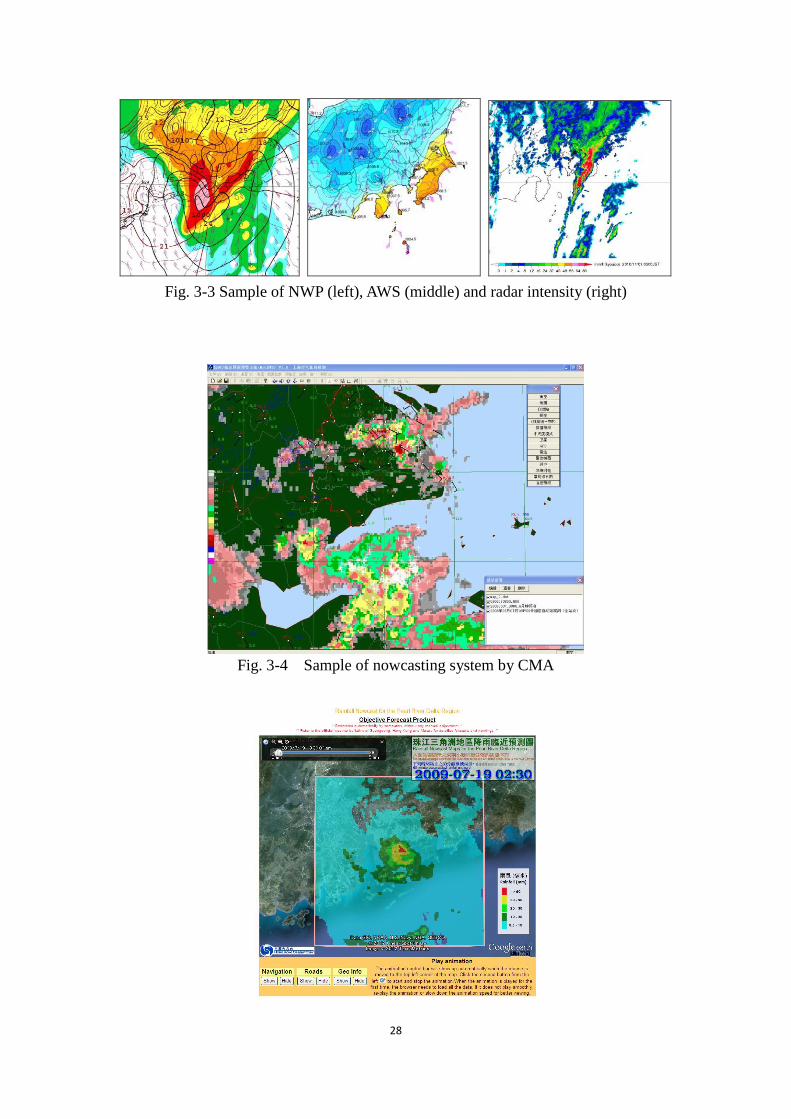
forecast of localized severe weather such as heavy rainfall (Figure 3-3). The NWP
outputs also provide information on the meteorological fields indicating possibility
and backgrounds of hazardous weather. The NWP forecast rainfall is utilized as the
source to merge into the Quantitative Precipitation Forecast (QPF). Other forecast
elements such as temperature and moisture are utilized to give the information on
orographic effects to the QPF’s extrapolation method.
(2) Typhoon track forecast is important for monitoring weather situation to be
affected by tropical cyclones. Track of tropical cyclone significantly affects scenarios.
For example, rainfall amount caused by orographic effects and the height of storm
surge generally vary according to the movement (course and speed) of tropical
cyclone and the location of the site, that is, whether the point is located on the right or
left side of the center of tropical cyclone. Probability maps of strong wind distribution
caused by tropical cyclones can provide useful information on the uncertainty of high
winds and storm surge.
(3) Ensemble prediction system (EPS) will offer a variety of options for forecast
scenarios. For example, accumulated rainfall amounts in the targeted area by the
EPS’s each track forecast will indicate the worst and the most credible case for
sequential forecast. Consensus method applied to EPS will improve the accuracy of
NWP results, such as tropical cyclone track forecast, especially for the long range
forecast. Probabilistic products can be made using each member of EPS. Spreads of
tropical cyclone tracks obtained from EPS can be the source to determine the
probability circle of tropical cyclones.
(4) Weather forecast guidance, which is produced utilizing statistical method
such as multiple regression, Kalman Filter and Neural Network applied to the NWP
outputs, will improve the accuracy of NWP outputs such as precipitation by reducing
their systematic errors. Weather forecast guidance will provide information on the
maximum, probability and categorical values besides the elements directly calculated
by NWP models, such as maximum precipitation forecast for a time period, heavy
rain/thunderstorm probability forecast, and weather category forecast. Outputs of
weather forecast guidance are the most reliable sources of time sequential forecast in
DSS for the long forecast time (6 hours – several days).
25
(5) QPF is calculated up to 6 – 12 hours with high time/spatial resolution GPV
format which is suitable for UFRM. The forecast precipitation of the extrapolation of
the rainfall distribution derived from QPE and of the high resolution NWP model are
blended considering their accuracies, because the accuracy of the extrapolation
methods is relatively high in the short forecast range (say, up to 3 hours) but decreases
rapidly as forecast time increases, while that of NWP is at first lower than that of the
extrapolation but is relatively constant with the longer forecast time. The accuracy for
the 3 or 4 hours QPF decreases to a critical level for the directly use in the issuance of
warnings/advisories, therefore, modification process of the QPF’s outputs on DSS by
forecasters are usually required. Samples operated by the meteorological agencies are
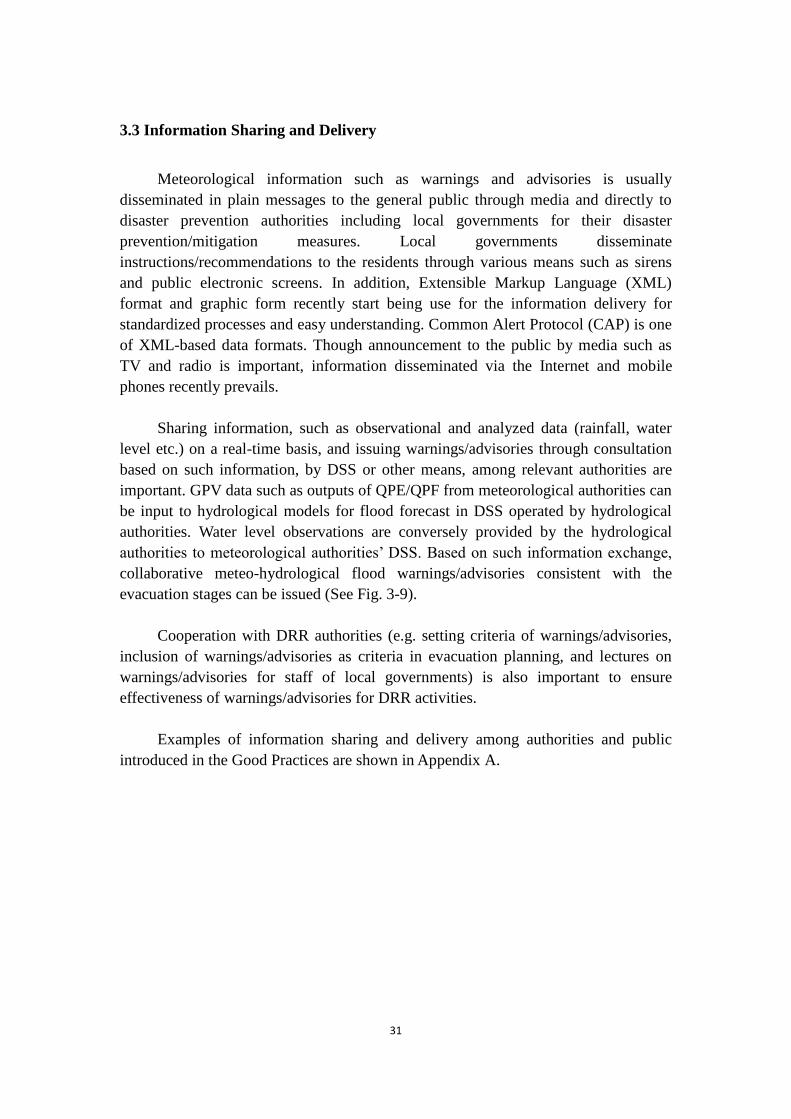
shown in Fig. 3-4, 3-5, 3-6, and 3-7. Satellite-based rainfall forecasts for tropical
cyclones are derived utilizing observations of several microwave sensors. Ensemble
and probability satellite-based precipitation products become available recently.
(6) A Storm surge model is calculated driven by the wind and pressure fields of
NWP outputs, or of the simple parametric tropical cyclone structure model. Storm
surge guidance assuming some cases of the tropical cyclone track with high resolution
NWP models will provide various scenarios for the targeted area precisely.
3.2.2 Meteorological Parameters for the Use of Monitoring, Analyzing and
Warning Procedures
The following products are used for monitoring procedures. Some products are
also input to time sequential forecast (analysis) in DSS for the issuance of
warnings/advisories:
(1) Surface observations at manned stations generally provide various elements
such as surface pressure, temperature, humidity, wind direction, wind speed,
precipitation, snow depth, snowfall amount, hours of sunlight, solar radiation, cloud,
visibility and atmospheric phenomena. Most of the elements can be observed
automatically in recent years. Though space and time resolutions of observation at
manned stations are relatively sparse, above elements are fundamental for analysis of
synoptic scale weather phenomena mainly recognized as the background causing
severe weather in the targeted area.
(2) Automated weather stations (AWS) are installed to collect meteorological
data automatically. Though it is difficult to catch the most intense storm areas, density
of AWS network, e.g. 10-20km spatial resolution, enables to detect meso-scale
weather phenomena leading to localized severe weather, such as shear lines and cold
outflows from convective clouds, and a part of convective rain areas (Figure 3-3). It
affects the accuracy of QPE through the calculation of the calibration factors or
26
coefficients of Z-R (reflectivity – rainfall) relationship of radar equation. Integration
of the raingauges operated by other organizations effectively and efficiently improves
the accuracy of QPE.
(3) Upper-air observation by radiosonde and wind profiler can be used to
overview the atmospheric structure causing heavy rain regarding atmospheric stability
or low level warm moist flow, including some indices such as CAPE, SSI, Lifting
Condensation Level at the observation points. Cross section charts to grasp synoptic
atmospheric structures are drawn using upper observation network. Upper observation
data are essential inputs to NWP models. GPS (Global Positioning System)
precipitable water vapor can indicates the possibility of heavy rain. Aircraft
observation, e.g. WMO Aircraft Meteorological Data Relay (AMDAR) and
reconnaissance observation are used for monitoring of atmospheric situations and
inputs to NWP models.
(4) Geostationary and polar orbital satellite observations are used to monitor and
analyze synoptic/meso scale weather phenomena such as low pressure/frontal systems,
tropical cyclones and CB clusters. Cloud patterns causing heavy rain such as
Meso-scale Convective Complex (MCC) including extensive CB clusters are
continuously and carefully monitored. Satellite images with short observation time
intervals (10 minutes) and high spatial resolution have possibility to detect the
generation of convective clouds leading to heavy rain. Satellite products such as
Satellite-Derived Atmospheric Motion Vector (AMV) and equivalent black body
temperature (TBB) by geostationary satellite (Clear Sky Radiation), microwave
imager, microwave/ IR sounder, microwave scattorometer wind products and GPS
occultation data are used for the NWP model analysis.
(5) Radar observation (echo intensity, echo top and Doppler wind) is important
to monitor abrupt disasters such as flush flood, because its observation time interval is
shorter than that of QPE (Figure 3-3). Observed echo intensities are mainly used
qualitatively. Observation time interval is generally a few minutes according to the
number of scanning elevations for a volume scan to make CAPPI (Constant Altitude
Plan Position Indicator). Echo intensification, generation, patterns (line, CB cluster,
etc.), movement and continuation and the height of echo top are monitored. Upper
level echo appearance and some indices induced by the volume scan such as Vertical
Integrated Liquid Water content (VIL) are effective for the early identification of
severe convective precipitations. Precipitation nowcasting up to 1-2 hours using
extrapolation of echo intensity is useful for early heavy rain warning. Radar data
(intensity and Doppler wind) are also utilized for the analysis of NWP models.
(6) QPE is the most reliable method to derive quantitative rainfall distributions in
GPV format, for the issuance of warnings/advisories as a direct input to DSS. It is
made by integrating surface observations and remote sensing observations such as
radar and satellite considering the pros and cons of both observations. Remote sensing
27
observations cover large detective ranges with higher spatial resolution compared to
the raingauge networks. As remote sensing observations measure the amount of rain
overhead, they are usually different from precipitation observed on the ground. On the
other hand, raingauge generally measures actual amounts of precipitation though it
observes precipitation at points. To produce radar-derived QPE, two procedures are
mainly used among Members. One adopts calibration factors calculated comparing
precipitation observed by raingauges and radars, considering radar beam height and
neighboring radars. The other uses Z-R relationship with coefficients varying
dynamically comparing precipitation observed by raingauges and a radar. In the
process of issuing warnings/advisories, anomalous values of QPE shall be rejected
considering the characteristics of the products in the area, e.g. radar intensity affected
by ground clutters and bright bands. Utilizing satellite-based precipitation
observations in place of ground-based observations are useful for the regions where
radars and raingauges are not sufficiently installed and in the sea. Satellite
precipitation data are derived by Precipitation Radar (PR) with quality, microwave
sensors and the Visible and Infrared Scanner (VIRS), though their time/spatial
resolution and dissemination time should be considered in the case of the immediate
use such as flash floods. Samples of PR/VIRS and microwave sensors are shown in
Figure 3-8.
(7) Synoptic weather maps including wave distribution map are used for
overview of atmospheric structure. Recently, weather maps using surface and upper
observation data are drawn automatically by NWP’s analysis at first and modified by
forecasters on man-machine systems. Localized weather maps using AWS data are
effective to analyze meso-scale weather phenomena which cause severe weather.
(8) NWP model assimilation methods are used to grasp the current atmospheric
structure including the input to calculate some indices of hazardous weather as the
application of NWP forecasts. Wind distributions derived from the analysis are
utilized for storm surge model and wind distribution maps.
(9) Hydrological indices such as Soil Water Index and Runoff Index are useful
time sequential data for forecasters to issue warnings/advisories. Because
precipitation data (QPE/QPF) alone do not provide enough information on the
sediment-related and flood disasters. Those indices calculated with hydrological
models such as tank models with the inputs of time/spatial high resolution QPE/QPF
(e.g. 10 minutes/1 km) are closely linked to the amount of soil moisture and water
flow which indicate disasters in the specified targeting area.
28
Fig. 3-3 Sample of NWP (left), AWS (middle) and radar intensity (right)
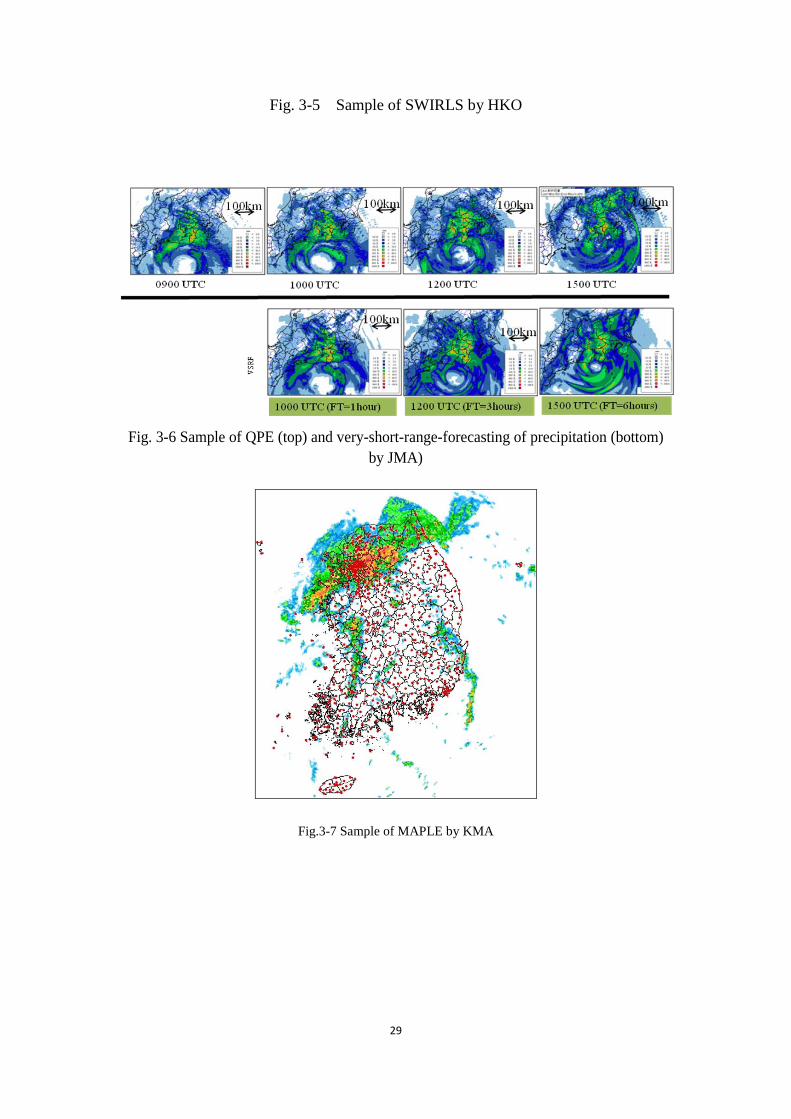
Fig. 3-4 Sample of nowcasting system by CMA
29
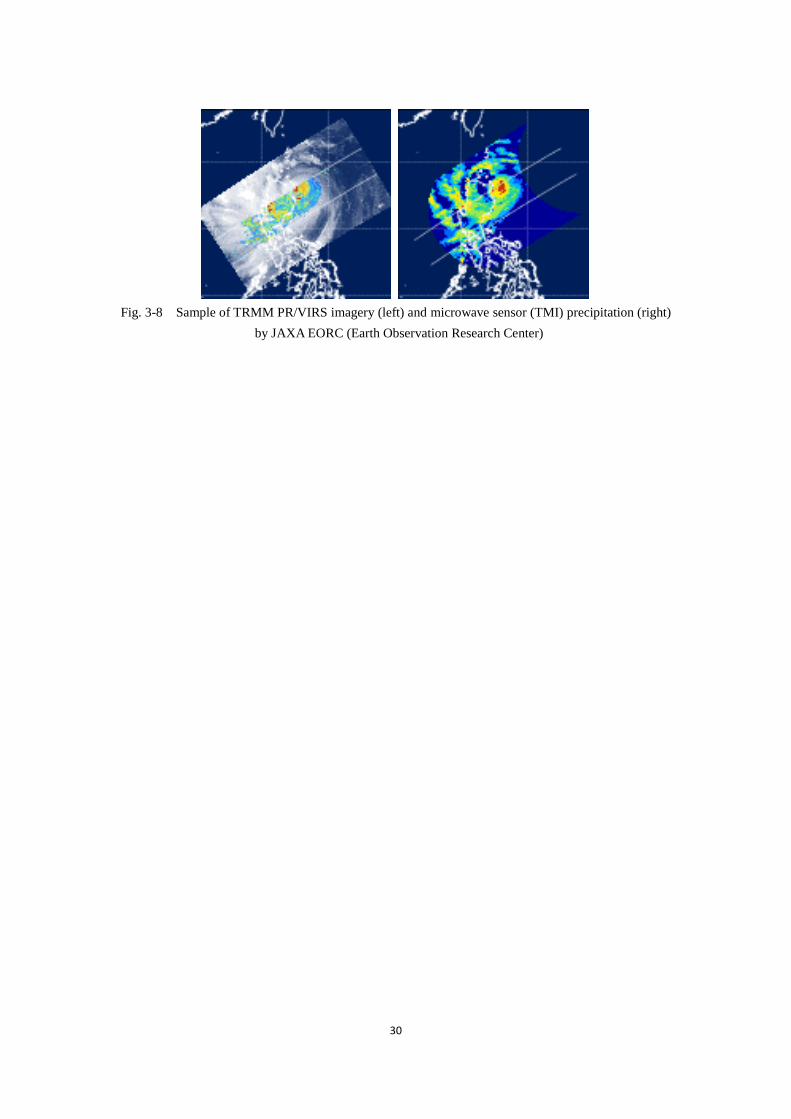
Fig. 3-5 Sample of SWIRLS by HKO
Fig. 3-6 Sample of QPE (top) and very-short-range-forecasting of precipitation (bottom)
by JMA)
Fig.3-7 Sample of MAPLE by KMA
30
Fig. 3-8 Sample of TRMM PR/VIRS imagery (left) and microwave sensor (TMI) precipitation (right)
by JAXA EORC (Earth Observation Research Center)
31
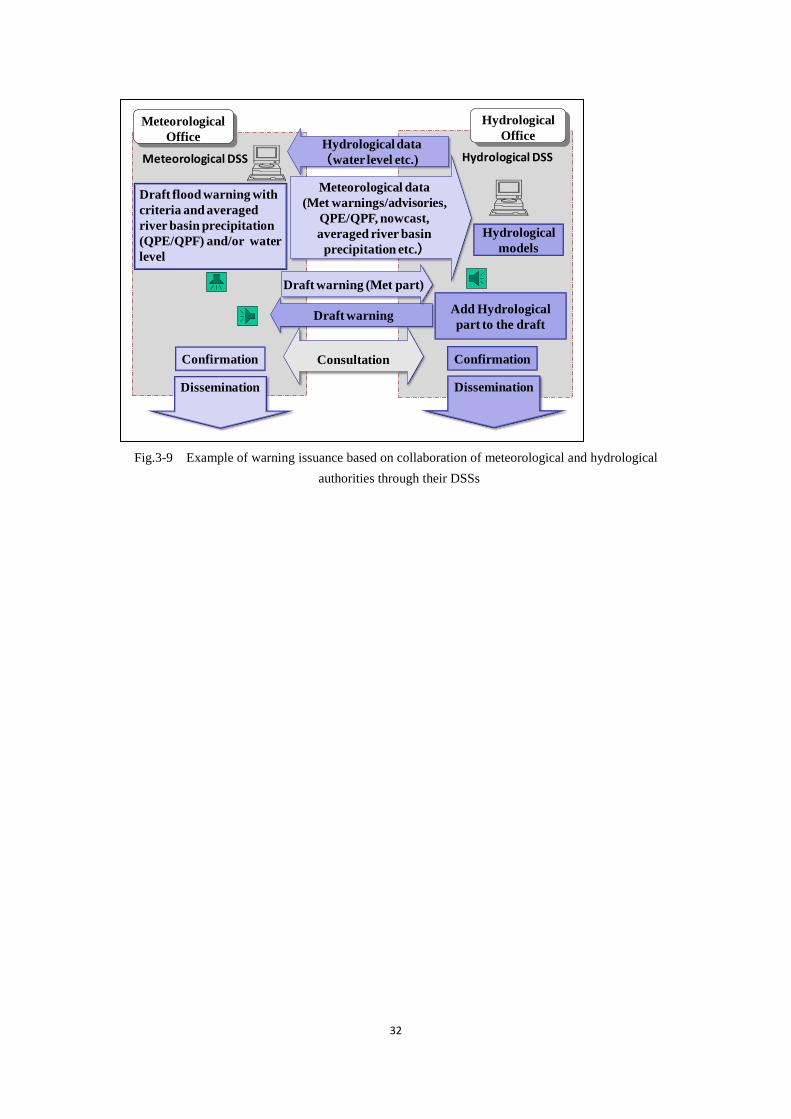
3.3 Information Sharing and Delivery
Meteorological information such as warnings and advisories is usually
disseminated in plain messages to the general public through media and directly to
disaster prevention authorities including local governments for their disaster
prevention/mitigation measures. Local governments disseminate
instructions/recommendations to the residents through various means such as sirens
and public electronic screens. In addition, Extensible Markup Language (XML)
format and graphic form recently start being use for the information delivery for
standardized processes and easy understanding. Common Alert Protocol (CAP) is one
of XML-based data formats. Though announcement to the public by media such as
TV and radio is important, information disseminated via the Internet and mobile
phones recently prevails.
Sharing information, such as observational and analyzed data (rainfall, water
level etc.) on a real-time basis, and issuing warnings/advisories through consultation
based on such information, by DSS or other means, among relevant authorities are
important. GPV data such as outputs of QPE/QPF from meteorological authorities can
be input to hydrological models for flood forecast in DSS operated by hydrological
authorities. Water level observations are conversely provided by the hydrological
authorities to meteorological authorities’ DSS. Based on such information exchange,
collaborative meteo-hydrological flood warnings/advisories consistent with the
evacuation stages can be issued (See Fig. 3-9).
Cooperation with DRR authorities (e.g. setting criteria of warnings/advisories,
inclusion of warnings/advisories as criteria in evacuation planning, and lectures on
warnings/advisories for staff of local governments) is also important to ensure
effectiveness of warnings/advisories for DRR activities.
Examples of information sharing and delivery among authorities and public
introduced in the Good Practices are shown in Appendix A.
32
Fig.3-9 Example of warning issuance based on collaboration of meteorological and hydrological
authorities through their DSSs
Draft warning
Hydrological DSS
Draft warning (Met part)
Meteorological DSS
Add Hydrological
part to the draft
Confirmation
Dissemination
Hydrological
OfficeMeteorological
OfficeHydrological data
(water level etc.)
Meteorological data
(Met warnings/advisories,
QPE/QPF, nowcast,
averaged river basin
precipitation etc.)
Draft flood warning with
criteria and averaged
river basin precipitation
(QPE/QPF) and/or water
level
Consultation
Dissemination
Confirmation
Hydrological
models
33
4. Urban Flood Monitoring, Forecasting and Warning (Yang-Su Kim)
4.1 Hydrological Monitoring
4.1.1 Measurement of water level
The water level is the free surface height from the arbitrary datum and water
depth is the height from the river bed. For flood management, water depth is more
important, however, the water level is usually measured because the river bed could
be moved. The water level is measured based on the mean sea level and river bed. If
the water level is measured from the mean sea level, the water level is called as
elevation (EL.) which should be written together with the water level. Since river bed
would be changed very easily by scouring or sedimentation, the reference point
should be selected and called as zero point. The zero point is the lowest point in the
river bed and it is very important for measuring the water level. If the river bed is
moved by sedimentation or scoring, the effect should be considered in the measured
water level.
The sensors of water level gauges are staff, float, bubble, pressure, acoustic,
ultrasonic, radar type, etc. The staff gauge is manual but another is automatic type
which could measure the water level automatically. Recently, most of the measuring
devices are the automatic. In case of the Republic of Korea, most the water level
gauge is a float gauge with stilling well whose installation expense is high, but the
function is stable. The installation price of other electric water level gauge is cheap
relatively therefore, the appropriate water level gauge should be selected with respect
to the importance, objective, and site condition of water measuring station.
The time step of water level measuring could be selected among 60, 30, 10
minutes. Recently, 10 minute is the most popular measuring step, however, the step
could be changed from the measuring machine.
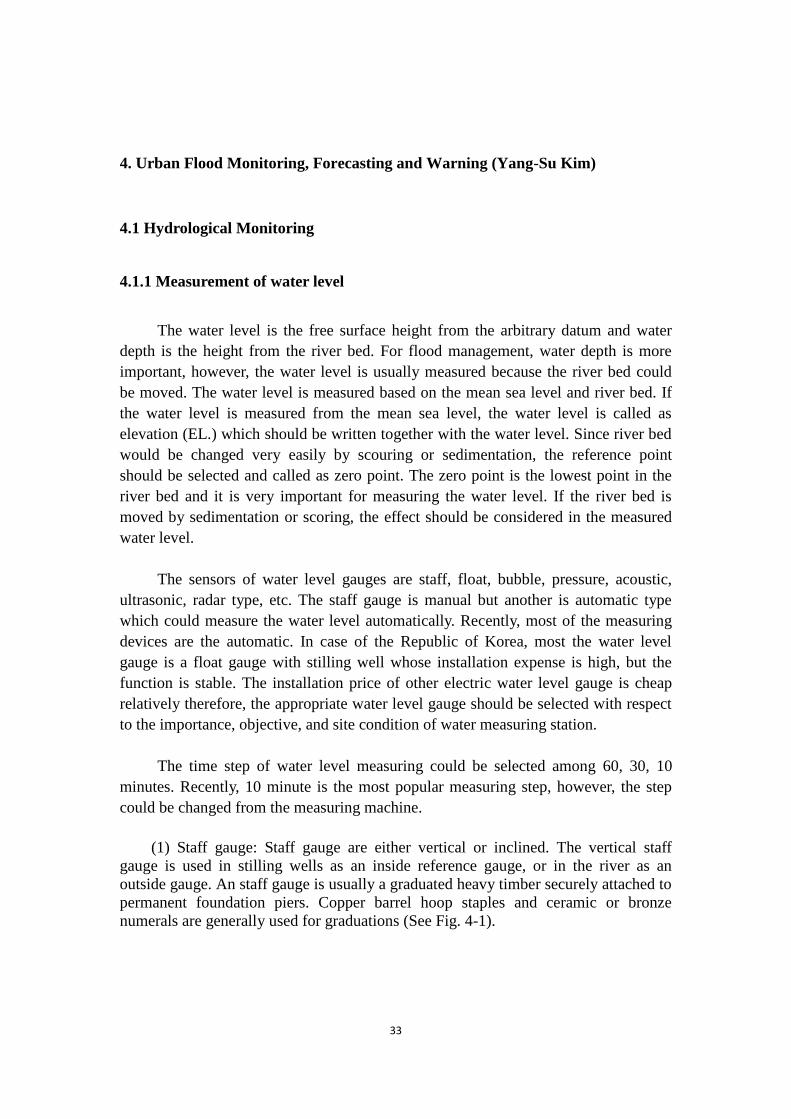
(1) Staff gauge: Staff gauge are either vertical or inclined. The vertical staff
gauge is used in stilling wells as an inside reference gauge, or in the river as an
outside gauge. An staff gauge is usually a graduated heavy timber securely attached to
permanent foundation piers. Copper barrel hoop staples and ceramic or bronze
numerals are generally used for graduations (See Fig. 4-1).
34
Fig. 4-1 Staff gauge
(2) Float gauge: The float gauge measures the water level by the floating device
which is moving with respect to the rising and descending the water level. The
floating device is made of cupper or plastic and the shape is a plat cone-shaped and
hollowed (See Fig. 4-2).
Fig. 4-2 Float gauge (with stilling well)
(3) Pressure gauge: The pressure changed by the water level is measured by the
submerged sensor. Resonant frequency of quartz vibrator is changed based on the
water pressure. Or semiconductor is also used to measure water level. The devices
should be calibrated using water temperature and concentration of water (See Fig. 3).
35
Fig. 4-3 Pressure gauge
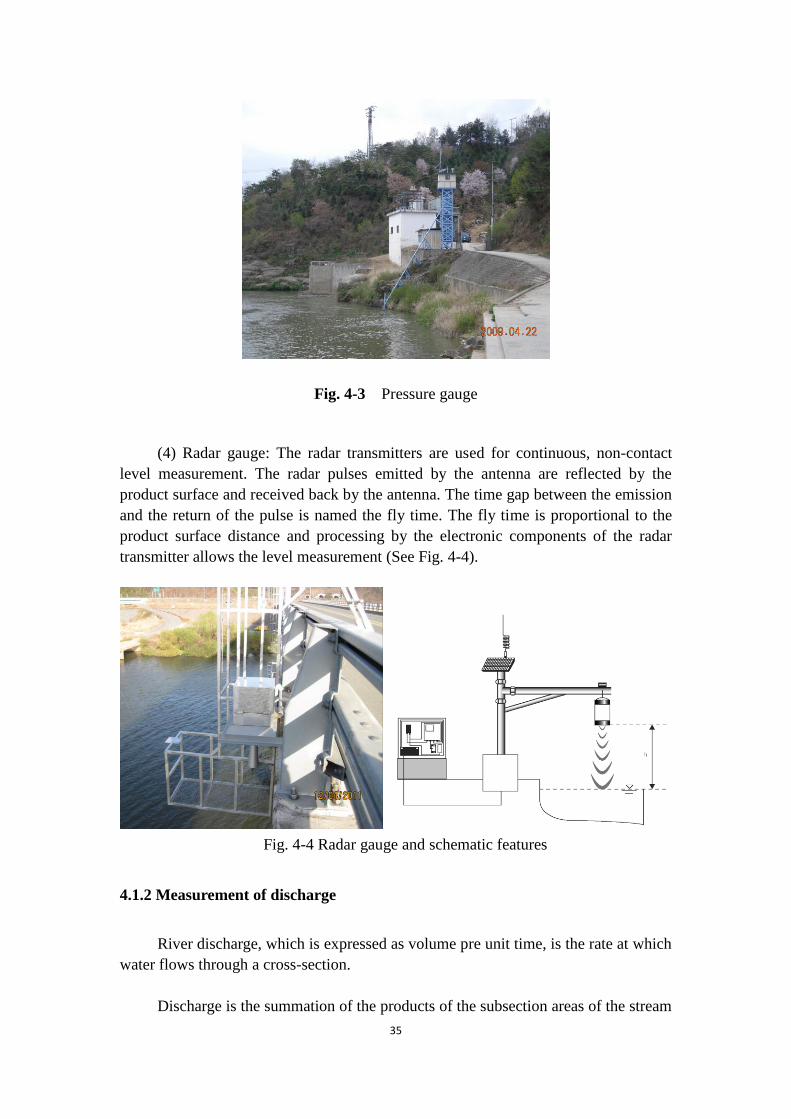
(4) Radar gauge: The radar transmitters are used for continuous, non-contact
level measurement. The radar pulses emitted by the antenna are reflected by the
product surface and received back by the antenna. The time gap between the emission
and the return of the pulse is named the fly time. The fly time is proportional to the
product surface distance and processing by the electronic components of the radar
transmitter allows the level measurement (See Fig. 4-4).
Fig. 4-4 Radar gauge and schematic features
4.1.2 Measurement of discharge
River discharge, which is expressed as volume pre unit time, is the rate at which
water flows through a cross-section.
Discharge is the summation of the products of the subsection areas of the stream
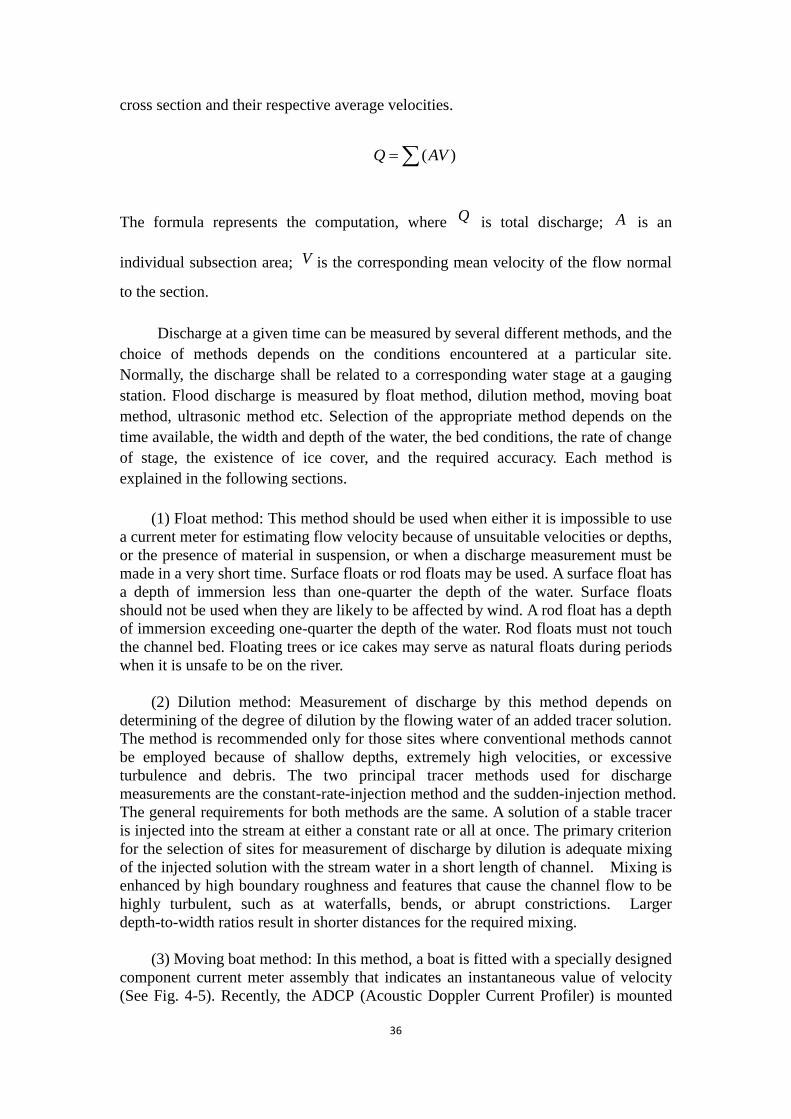
36
cross section and their respective average velocities.
)(AVQ
The formula represents the computation, where Q is total discharge; A is an
individual subsection area; V is the corresponding mean velocity of the flow normal
to the section.
Discharge at a given time can be measured by several different methods, and the
choice of methods depends on the conditions encountered at a particular site.
Normally, the discharge shall be related to a corresponding water stage at a gauging
station. Flood discharge is measured by float method, dilution method, moving boat
method, ultrasonic method etc. Selection of the appropriate method depends on the
time available, the width and depth of the water, the bed conditions, the rate of change
of stage, the existence of ice cover, and the required accuracy. Each method is
explained in the following sections.
(1) Float method: This method should be used when either it is impossible to use
a current meter for estimating flow velocity because of unsuitable velocities or depths,
or the presence of material in suspension, or when a discharge measurement must be
made in a very short time. Surface floats or rod floats may be used. A surface float has
a depth of immersion less than one-quarter the depth of the water. Surface floats
should not be used when they are likely to be affected by wind. A rod float has a depth
of immersion exceeding one-quarter the depth of the water. Rod floats must not touch
the channel bed. Floating trees or ice cakes may serve as natural floats during periods
when it is unsafe to be on the river.
(2) Dilution method: Measurement of discharge by this method depends on
determining of the degree of dilution by the flowing water of an added tracer solution.
The method is recommended only for those sites where conventional methods cannot
be employed because of shallow depths, extremely high velocities, or excessive
turbulence and debris. The two principal tracer methods used for discharge
measurements are the constant-rate-injection method and the sudden-injection method.
The general requirements for both methods are the same. A solution of a stable tracer
is injected into the stream at either a constant rate or all at once. The primary criterion
for the selection of sites for measurement of discharge by dilution is adequate mixing
of the injected solution with the stream water in a short length of channel. Mixing is
enhanced by high boundary roughness and features that cause the channel flow to be
highly turbulent, such as at waterfalls, bends, or abrupt constrictions. Larger
depth-to-width ratios result in shorter distances for the required mixing.
(3) Moving boat method: In this method, a boat is fitted with a specially designed
component current meter assembly that indicates an instantaneous value of velocity
(See Fig. 4-5). Recently, the ADCP (Acoustic Doppler Current Profiler) is mounted
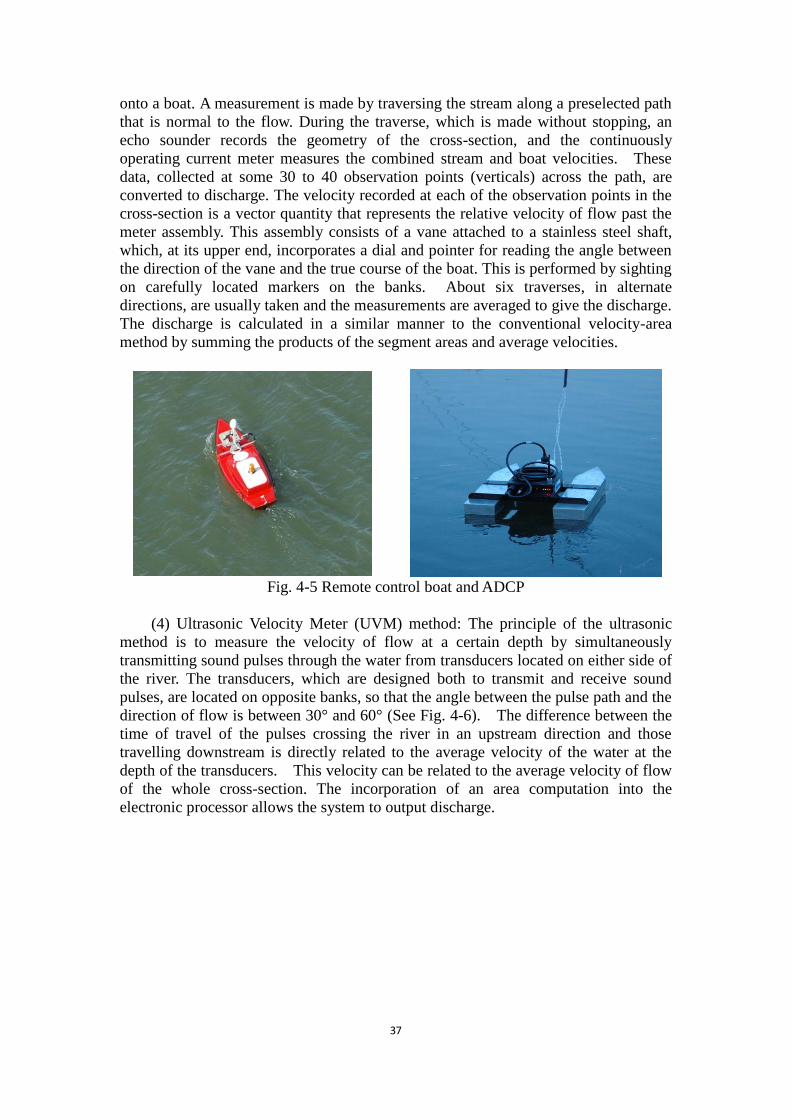
37
onto a boat. A measurement is made by traversing the stream along a preselected path
that is normal to the flow. During the traverse, which is made without stopping, an
echo sounder records the geometry of the cross-section, and the continuously
operating current meter measures the combined stream and boat velocities. These
data, collected at some 30 to 40 observation points (verticals) across the path, are
converted to discharge. The velocity recorded at each of the observation points in the
cross-section is a vector quantity that represents the relative velocity of flow past the
meter assembly. This assembly consists of a vane attached to a stainless steel shaft,
which, at its upper end, incorporates a dial and pointer for reading the angle between
the direction of the vane and the true course of the boat. This is performed by sighting
on carefully located markers on the banks. About six traverses, in alternate
directions, are usually taken and the measurements are averaged to give the discharge.
The discharge is calculated in a similar manner to the conventional velocity-area
method by summing the products of the segment areas and average velocities.
Fig. 4-5 Remote control boat and ADCP
(4) Ultrasonic Velocity Meter (UVM) method: The principle of the ultrasonic
method is to measure the velocity of flow at a certain depth by simultaneously
transmitting sound pulses through the water from transducers located on either side of
the river. The transducers, which are designed both to transmit and receive sound
pulses, are located on opposite banks, so that the angle between the pulse path and the
direction of flow is between 30° and 60° (See Fig. 4-6). The difference between the
time of travel of the pulses crossing the river in an upstream direction and those
travelling downstream is directly related to the average velocity of the water at the
depth of the transducers. This velocity can be related to the average velocity of flow
of the whole cross-section. The incorporation of an area computation into the
electronic processor allows the system to output discharge.
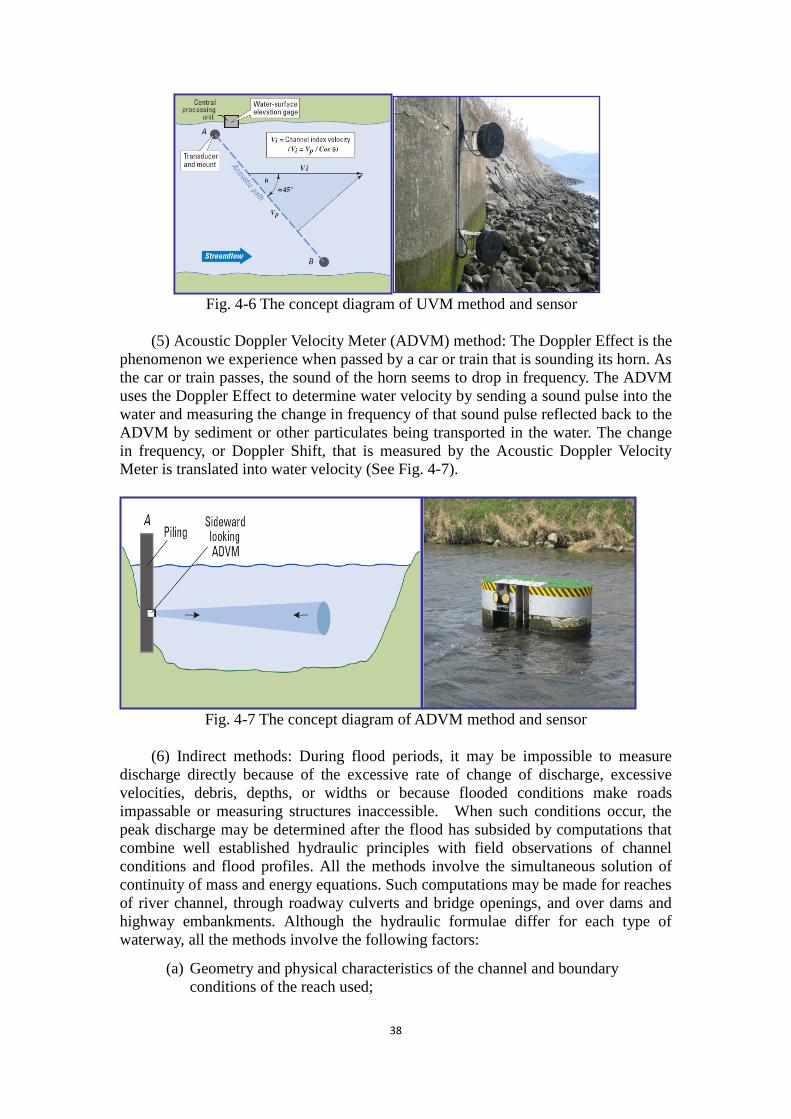
38
Fig. 4-6 The concept diagram of UVM method and sensor
(5) Acoustic Doppler Velocity Meter (ADVM) method: The Doppler Effect is the
phenomenon we experience when passed by a car or train that is sounding its horn. As
the car or train passes, the sound of the horn seems to drop in frequency. The ADVM
uses the Doppler Effect to determine water velocity by sending a sound pulse into the
water and measuring the change in frequency of that sound pulse reflected back to the
ADVM by sediment or other particulates being transported in the water. The change
in frequency, or Doppler Shift, that is measured by the Acoustic Doppler Velocity
Meter is translated into water velocity (See Fig. 4-7).
Fig. 4-7 The concept diagram of ADVM method and sensor
(6) Indirect methods: During flood periods, it may be impossible to measure
discharge directly because of the excessive rate of change of discharge, excessive
velocities, debris, depths, or widths or because flooded conditions make roads
impassable or measuring structures inaccessible. When such conditions occur, the
peak discharge may be determined after the flood has subsided by computations that
combine well established hydraulic principles with field observations of channel
conditions and flood profiles. All the methods involve the simultaneous solution of
continuity of mass and energy equations. Such computations may be made for reaches
of river channel, through roadway culverts and bridge openings, and over dams and
highway embankments. Although the hydraulic formulae differ for each type of
waterway, all the methods involve the following factors:
(a) Geometry and physical characteristics of the channel and boundary
conditions of the reach used;
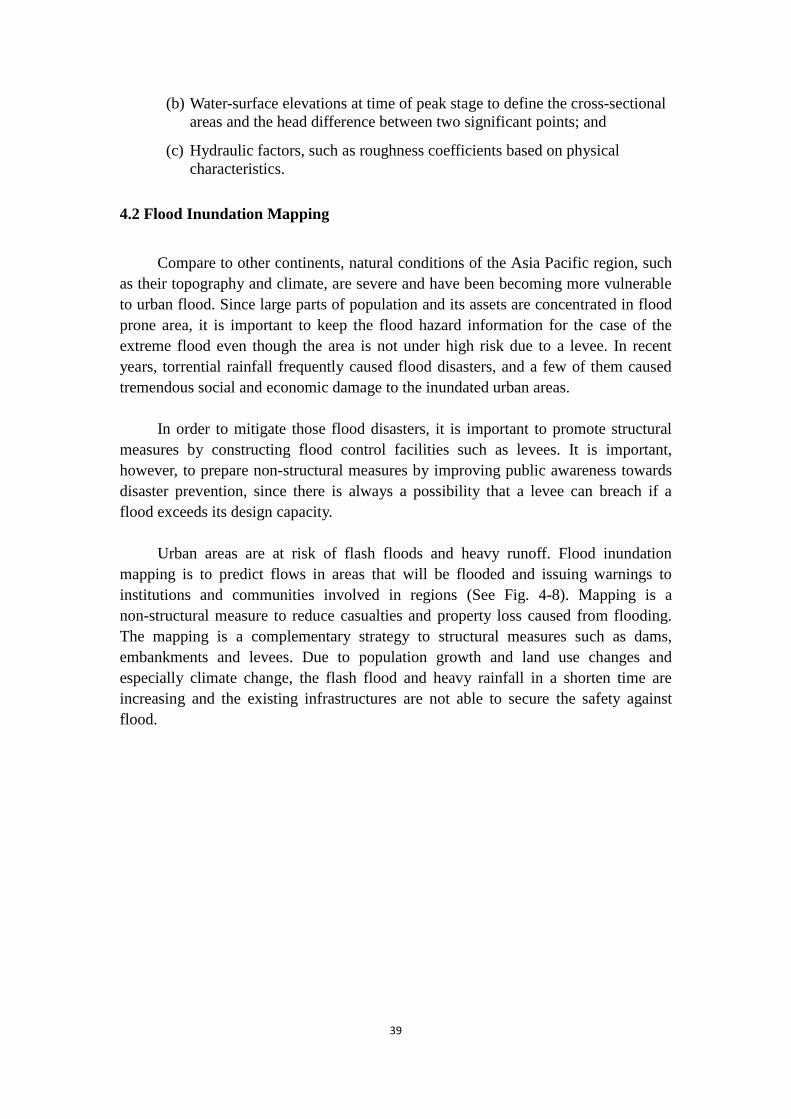
39
(b) Water-surface elevations at time of peak stage to define the cross-sectional
areas and the head difference between two significant points; and
(c) Hydraulic factors, such as roughness coefficients based on physical
characteristics.
4.2 Flood Inundation Mapping
Compare to other continents, natural conditions of the Asia Pacific region, such
as their topography and climate, are severe and have been becoming more vulnerable
to urban flood. Since large parts of population and its assets are concentrated in flood
prone area, it is important to keep the flood hazard information for the case of the
extreme flood even though the area is not under high risk due to a levee. In recent
years, torrential rainfall frequently caused flood disasters, and a few of them caused
tremendous social and economic damage to the inundated urban areas.
In order to mitigate those flood disasters, it is important to promote structural
measures by constructing flood control facilities such as levees. It is important,
however, to prepare non-structural measures by improving public awareness towards
disaster prevention, since there is always a possibility that a levee can breach if a
flood exceeds its design capacity.
Urban areas are at risk of flash floods and heavy runoff. Flood inundation
mapping is to predict flows in areas that will be flooded and issuing warnings to
institutions and communities involved in regions (See Fig. 4-8). Mapping is a
non-structural measure to reduce casualties and property loss caused from flooding.
The mapping is a complementary strategy to structural measures such as dams,
embankments and levees. Due to population growth and land use changes and
especially climate change, the flash flood and heavy rainfall in a shorten time are
increasing and the existing infrastructures are not able to secure the safety against
flood.
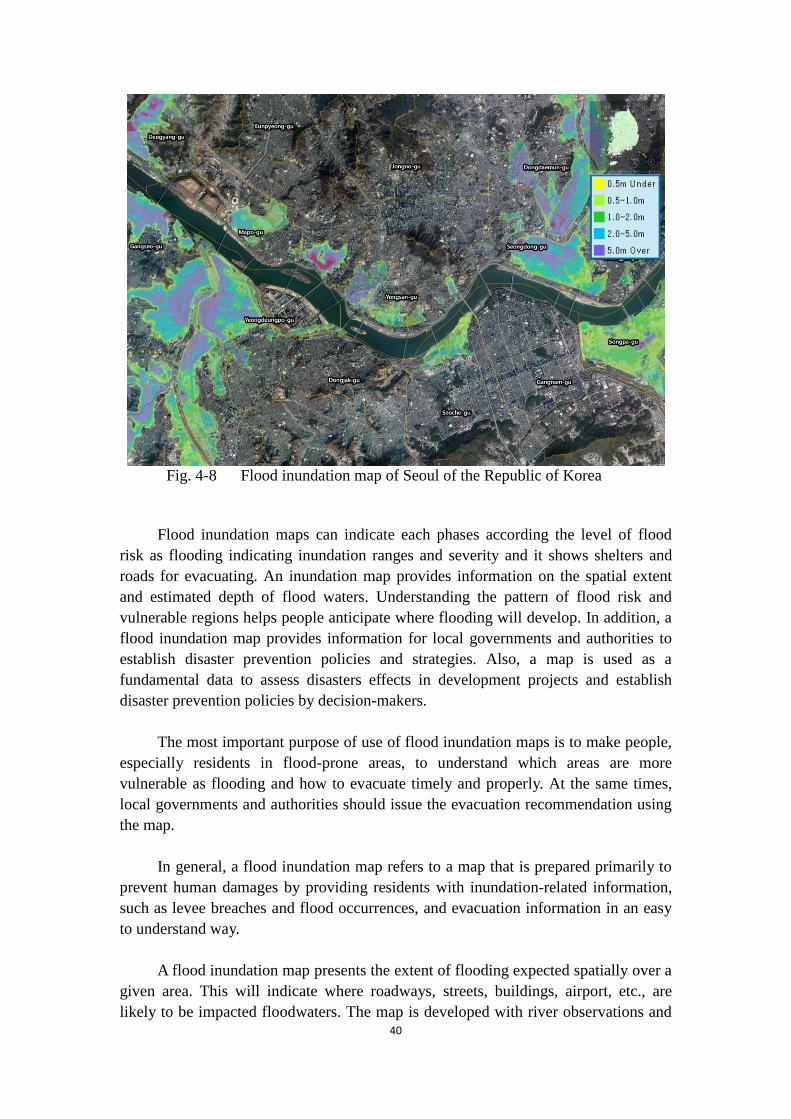
40
Fig. 4-8 Flood inundation map of Seoul of the Republic of Korea
Flood inundation maps can indicate each phases according the level of flood
risk as flooding indicating inundation ranges and severity and it shows shelters and
roads for evacuating. An inundation map provides information on the spatial extent
and estimated depth of flood waters. Understanding the pattern of flood risk and
vulnerable regions helps people anticipate where flooding will develop. In addition, a
flood inundation map provides information for local governments and authorities to
establish disaster prevention policies and strategies. Also, a map is used as a
fundamental data to assess disasters effects in development projects and establish
disaster prevention policies by decision-makers.
The most important purpose of use of flood inundation maps is to make people,
especially residents in flood-prone areas, to understand which areas are more
vulnerable as flooding and how to evacuate timely and properly. At the same times,
local governments and authorities should issue the evacuation recommendation using
the map.
In general, a flood inundation map refers to a map that is prepared primarily to
prevent human damages by providing residents with inundation-related information,
such as levee breaches and flood occurrences, and evacuation information in an easy
to understand way.
A flood inundation map presents the extent of flooding expected spatially over a
given area. This will indicate where roadways, streets, buildings, airport, etc., are
likely to be impacted floodwaters. The map is developed with river observations and
41
forecast, and it provides decision-makers additional information needed to better
mitigate the impacts of flooding and enforce resilience.
A flood hazard map is a map that graphically provides information on
inundation (predicted inundation areas, inundation depth, etc.), as well as on
evacuation (location of evacuation refuges, evacuation routes, dangerous spots on
evacuation routes, etc.) in an easy-to-understand format. The goal is to quickly
evacuate local residents in a safe and proper manner in the event of floods. The map is
produced and publicized through a joint effort by those in charge of disaster
prevention and those in charge of rivers and hydrology in the respective local
municipalities.
4.3 Flood Forecasting
Flood forecasting operations are centered on the timeliness and accuracy of the
forecast. The model to be used by forecasting organizations must be reliable, simple
and capable of providing sufficient warning time and a desired degree of accuracy.
The comprehensive model involving very detailed functions which may provide
increased warning time and greater of accuracy may have very elaborate input data
requirements. All input data for a specific model may not be available on a real time
basis. Therefore, from a practical point of view, a flood forecasting model should
satisfy the follows:
a) Provide reliable forecasts with sufficient warning time;
b) Have a reasonable degree of accuracy;
c) Meet data requirements within available data and financial means, both for
calibration and operational use;
d) Feature easy-to-understand functions;
e) Be simple enough to be operated by operational staff with moderate
training.
On the basis of the analytical approach used to develop a forecasting model,
flood forecasting methods can be classified as follows;
a) Methods based on a statistical approach;
b) Methods based on a mechanism of flood formation and propagation.
The statistical methods have been widely used in the past. These include simple
gauge-to-gauge relationship, gauge-to-gauge relationships with some additional
parameters and rainfall-peak stage relationships. These relationships can be easily
developed and are most commonly used as a starting point while establishing a flood
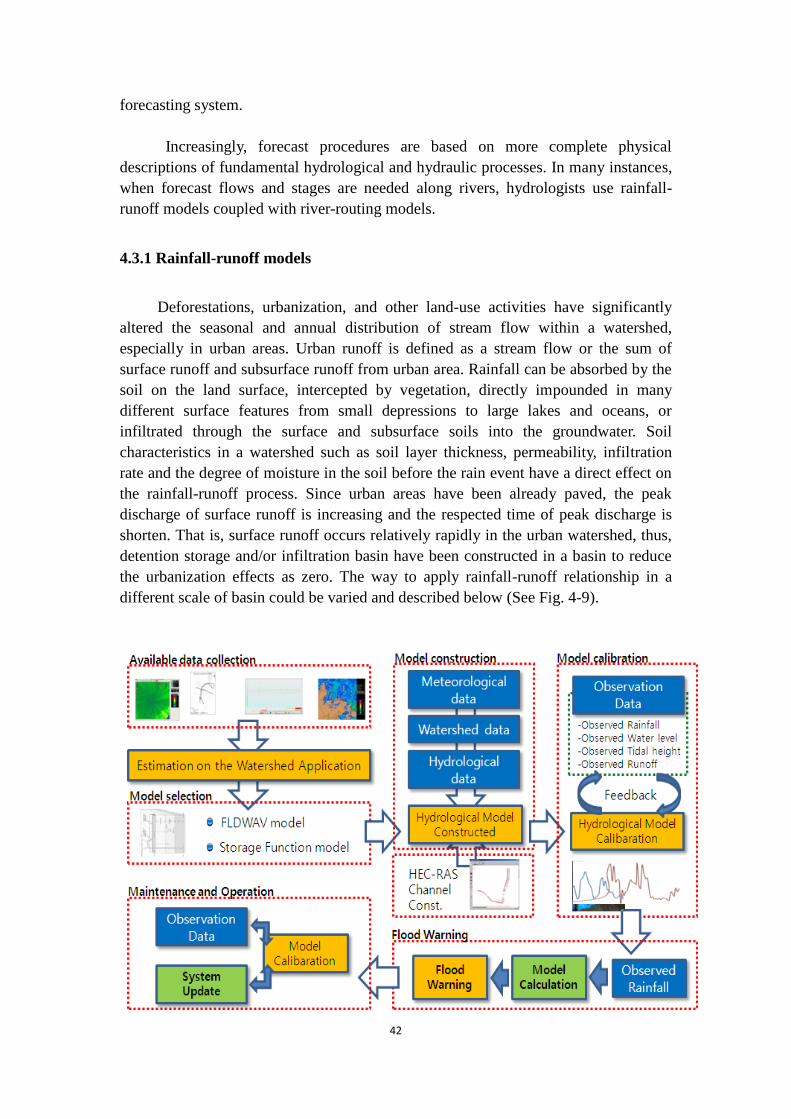
42
forecasting system.
Increasingly, forecast procedures are based on more complete physical
descriptions of fundamental hydrological and hydraulic processes. In many instances,
when forecast flows and stages are needed along rivers, hydrologists use rainfall-
runoff models coupled with river-routing models.
4.3.1 Rainfall-runoff models
Deforestations, urbanization, and other land-use activities have significantly
altered the seasonal and annual distribution of stream flow within a watershed,
especially in urban areas. Urban runoff is defined as a stream flow or the sum of
surface runoff and subsurface runoff from urban area. Rainfall can be absorbed by the
soil on the land surface, intercepted by vegetation, directly impounded in many
different surface features from small depressions to large lakes and oceans, or
infiltrated through the surface and subsurface soils into the groundwater. Soil
characteristics in a watershed such as soil layer thickness, permeability, infiltration
rate and the degree of moisture in the soil before the rain event have a direct effect on
the rainfall-runoff process. Since urban areas have been already paved, the peak
discharge of surface runoff is increasing and the respected time of peak discharge is
shorten. That is, surface runoff occurs relatively rapidly in the urban watershed, thus,
detention storage and/or infiltration basin have been constructed in a basin to reduce
the urbanization effects as zero. The way to apply rainfall-runoff relationship in a
different scale of basin could be varied and described below (See Fig. 4-9).
43
Fig. 4-9 Flow chart for the forecasting system (example)
① Available data collection: Data collect and analysis on the watershed
application;
② Model selection: Select a model based on the Metro-manila area;
③ Model construction: Hydrological and hydraulic model construct using
meteorological, watershed and channel characteristic, hydrological and
HEC-RAS channel data;
④ Model calibration: Model calibration from the observed data;
⑤ Flood warning: Warning based on flood-forecasting model;
⑥ Maintenance and operation.
4.3.2 Statistical model
Regression is an extension of correlation concept that provides formulae for
driving a variable of interest and regression equations have many applications in
hydrology. Their general form is as follows:
.....3322110 XbXbXbbY
where X refers to currently observed variables; Y is a future value of the variable
to be forecasted. Regression coefficients nb estimated from observed Y and X
values. The X variables may include upstream stage or discharge, rainfall, catchment
conditions etc.
In the Republic of Korea, the statistical forecasting model using precipitation
and upstream discharge or water level as independent variables is used for flood
forecasting of the tributaries.
ctRbtRbtQaTtQ )1()()()( 211
where, Q is discharge at a forecasted point; R isBasin averaged precipitation; 1a ,
1b , 2b , c are regression coefficients.
The regression coefficients are calculated using historical data. The discharge
)( TtQ in the forecasting time T is calculated in the current time t .
4.3.3 Automated flood warning system (AFWS)
The objective of an AFWS is to increase the amount of warning time given to
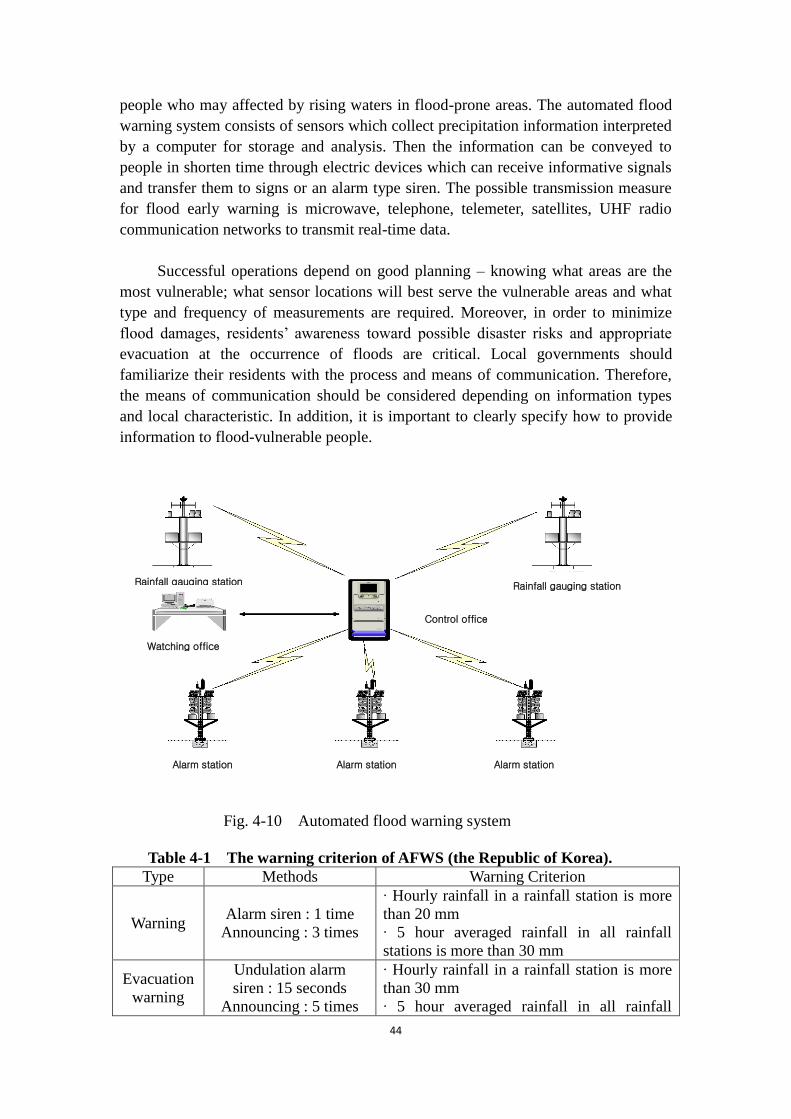
44
people who may affected by rising waters in flood-prone areas. The automated flood
warning system consists of sensors which collect precipitation information interpreted
by a computer for storage and analysis. Then the information can be conveyed to
people in shorten time through electric devices which can receive informative signals
and transfer them to signs or an alarm type siren. The possible transmission measure
for flood early warning is microwave, telephone, telemeter, satellites, UHF radio
communication networks to transmit real-time data.
Successful operations depend on good planning – knowing what areas are the
most vulnerable; what sensor locations will best serve the vulnerable areas and what
type and frequency of measurements are required. Moreover, in order to minimize
flood damages, residents’ awareness toward possible disaster risks and appropriate
evacuation at the occurrence of floods are critical. Local governments should
familiarize their residents with the process and means of communication. Therefore,
the means of communication should be considered depending on information types
and local characteristic. In addition, it is important to clearly specify how to provide
information to flood-vulnerable people.
Fig. 4-10 Automated flood warning system
Table 4-1 The warning criterion of AFWS (the Republic of Korea).
Type Methods Warning Criterion
Warning Alarm siren : 1 time
Announcing : 3 times
∙ Hourly rainfall in a rainfall station is more
than 20 mm
∙ 5 hour averaged rainfall in all rainfall
stations is more than 30 mm
Evacuation
warning
Undulation alarm
siren : 15 seconds
Announcing : 5 times
∙ Hourly rainfall in a rainfall station is more
than 30 mm
∙ 5 hour averaged rainfall in all rainfall
Rainfall gauging station Rainfall gauging station
Control office
Watching office
Alarm station Alarm station Alarm station
45
stations is more than 40 mm
∙ Water level is higher than a criterion.
4.3.4 Flash flood warning
The definition of flash flood provided by the United State National Weather
Service is “a flood caused by heavy or excessive rainfall in a short period of times,
generally less than six hours”. The transformation from rural areas to urban land use
due to population growth and industrialization has accelerated the occurrence
frequency of flash flood. As a significant decrease in pervious land in urban
catchments, the flood peak may transfer rapidly to surface waters within the short lead
times in highly populated regions. In densely populated areas, they are more
destructive because of their unpredictable characteristics of storm surge carrying out
large concentrations of sediment and debris, given little or no time for communities
living in its path to prepare for it and causing major destruction to infrastructure,
human and whatever else stands in their way.
Urbanization likely produce higher peak flow rates that exceed capacity of small
culverts under roads designed for unurbanized situation. While rapid industrial
development and population increase are likely to encourage unprecedented economic
prosperity in many cities, flash flood managements in urban regions turns out to be a
crucial challenge. To respond to flash flood hazards, an effective system is needed for
accurate, reliable and timely forecasts and warnings. The two key elements
contributing to flash flooding are rainfall intensity and duration. Also, topography, soil
conditions and types of ground cover are several factors resulting in flash flood.
One of the main reasons to cause flash flood in urban area is the inappropriate
drainage system. In developing countries, inadequate maintenance of the drainage
channels such as disposing debris and solid waste may degrade this situation. Warm
season flash floods are the result form intense rainfalls in a short period of times due
to slow moving thunderstorms. Flash floods warning and forecasting is a challenges
for hydrologist because it is not always caused simply by meteorological phenomena.
Flash floods are the result from both of meteorological and hydrological conditions.
Although heavy rainfall is usually a main factor, a given amount and duration of
rainfall may or may not result in a flash flood depending on the hydrologic
characteristics of the watershed.
46
5. Disaster Risk Management for Urban Floods (Tae Sung Cheong, Cheng
Xiaotao)
5.1 GIS Based Urban Flood Risk Management System
5.1.1 Integrated information analysis
Now, as disaster aspects show complex and compound disasters, integrated
disaster information analysis is very important. Creating a urban flood risk
management system needs to collect and integrate basic materials of the river region
where the urban areas and city are located. Specifically this will include flood control
planning, water planning, flood-control planning for the river region, water
modulation planning, geographical materials including landform, rivers, jurisdiction
boundary, and elevation, hydrological information, historical flooding information
(affected range and water level), draining engineering for flood control purpose (river
section, gauging stations distribution, location of embankment, water slucegate, and
pumping station, remote sense images, socio-economic information as follows:
Planning and Preparatory plan: Urban flood control planning, drainage
planning, flood-control preparatory plan, emergency response plan, water
modulation plan.
GIS information: (i) Landform: urban landform map on a big scale at lease
1:10000; (ii) Rivers: main stream and tributaries in the city and go-by rivers
that could affect urban water level; (iii) Road: Stem and general roads in the
city area Jurisdiction boundary: Boundaries at different levels of city, district,
and street.
Hydrological materials: (i) Gauge stations: location of hydrological stations
and rainfall stations; (ii) Rainfall information: Rainfall process, design rainfall
process; (iii) Hydrological information: Water level and discharge of key
stations, existing drainage capacity of rivers/waterways running through urban
areas and the water level; (iv) Historic and typical flooding: General situation,
flooded range, water level, loss, human damage and death.
Drainage engineering for flood-control purpose: (i) River section: Location
of key river sections and gauged section data; (ii) Embankment: Base
elevation, top elevation, width; (iii) Pumping station: Drainage capacity, use
policy, switch-on status; (iv) Sluice gate: Maximum drainage volume, use
policy, switch-on status; (v) Drainage area division: Run-off quotient,
47
drainage modulus, area; (vi) Reservoir: Capacity, water-drainage capability,
and information about the water catchments.
Remote sense images: Air-aviation/space remote sense images of 2.5m, 1.0 m,
0.6m, or even closer distance and higher resolution.
Urban socio-economic information Community Committee is the bottom unit
conducting statistics for socio-economic data survey, and subjects include
population, household, industry, fixed assets, amenities and public
infrastructure.
These information are not provided by one institute or one government
organization but by various institutes and government organizations who provide
information collected from monitoring, measuring and estimating from integrated
analyzing or/and modeling for their own objectives. For the urban flood disaster
management, these all information can be used for analyzing or integrating to create
new knowledge for warning and decision make supporting. The main issue is how can
collect the information to share and analysis. It is not easy to combine systems
themselves because systems have different input-output data formats but to link
among databases of various institutes and government organizations. For combining
and integrating the information in an analytical system to create new knowledge,
standard data format is useful to access and integrate the information conveniently.
Using the geographical definition, it is possible to make combine and integrate the
information in an analytical system. Also national level network system is essential to
share and integrate the information in real time in anywhere.
To reduce disaster risk due to climate and environmental changes, National
Emergency Management Agency (NEMA), Korea has been developing National
Disaster Management System (NDMS) as a comprehensive nationwide information
system to support disaster management processes in terms of prevention, preparation,
response and recovery. NDMS services information as follows:
Real time monitoring information such as river stage, flow, wind speed, rainfall,
dam water level, CCTV images and satellite images;
Statistical information analyzed by period and disaster type;
Resources information such as emergent recovery equipments, relief goods,
refugee facilities;
Localized risk information such as forest fire risk map, landslide risk map,
flood risk map and wind related disaster risk map;
Real-time disaster information such as flood, typhoon, heavy rain, landslide,
earthquake, forest fire;
Other information such as media, communication and special weather report.
National Disaster Management Institute (NDMI), Korea developed GIS based

48
disaster information analysis system to assess disaster risk. For example, the rainfall
data with three hours leading time forecasted by MAPLE were used for flash flood
warning especially in the mountain area which area has severe flood risk because
water depth in stream suddenly increase and many people enjoy leisure in the
mountain valley. The rainfall data also were used for input data of this integrated
system to simulate rainfall-runoff and estimate water surface elevation and flow and
velocity data were used for calibration and validation of it. Some information such as
GIS and images was integrated with simulated and estimated results to create new
knowledge and support decision making. Inundation area represented by this system
can overlap on the GIS information such as population, land use, vacancy of hospital,
school and utilities to support effective decision making for urban flood risk
management and can estimate damages from disaster for efficient emergency
recovering.
Effective disaster management, integrated network system to link the CCTVs
especially established in riverside and flood risk area and integrate analysis is needed.
Detecting technology to capture trig point of disaster automatically, for example
automatically detecting water depth over limit line in the river is also important
because numerous real-time images from various regions are presented in same time
and longtime monitoring through CCTV is not easy. For operation of integrate
network system, the role of each governmental organization at city, province and
nation is defined as (i) national disaster agency monitor all images of CCTVs in a
country to detect disaster situation for supporting decision making, (ii) province
manage all CCTVs in the province to monitor and send the video images to the
organizations and institutes to share information, and (iii) city collect video data from
CCTV installed at disaster risk area, stage gauges, major bridges and control CCTV
for rotation, angle and camera zooming for monitoring area condition.
5.1.2 Simulation for disaster risk management
For flood managing cities located on major rivers, river region hydrological and
hydraulic coupling model is used to simulate flooding and inundating. The
hydrological model works to predict rainfall-runoff discharges in upper streams,
floods in key hydrological stations, inflow discharges into key reservoirs, and flow
outlets from key tributaries linked to major rivers. An one dimensional hydraulic
model calculates the only stem waterway flood evolution process and which results
are integrated with hydrological prediction results to simulate the conflux process. A
two dimensional flood simulation model can simulate the flooding process in water
retention area and connect with the one dimensional river model to analyze and
simulate the effect of water storage in reservoir or water retention area on the lower
reaches urban water ways. A two dimensional hydraulic model can be used for
early-warning and prediction of urban storm water logging and possible risk/impact
when levees of urban water ways breaks. The hydraulic model should be able to
reflect the impact caused by various buildings and structures such as road, railway,
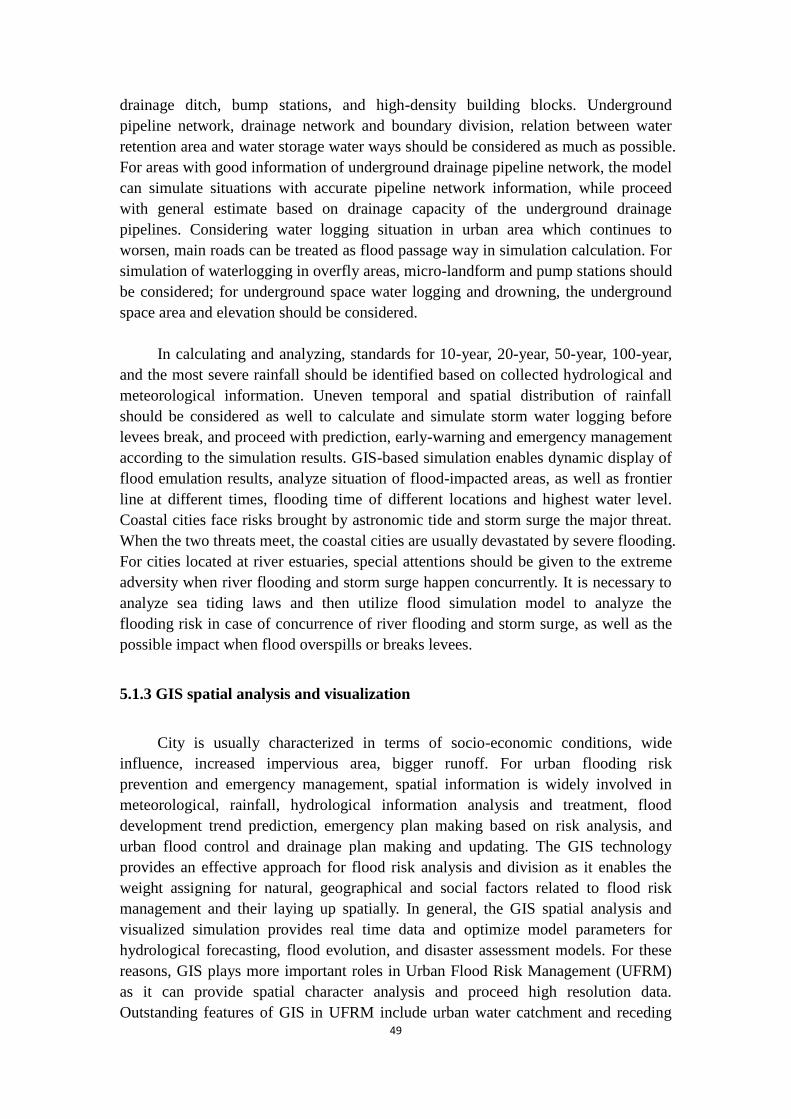
49
drainage ditch, bump stations, and high-density building blocks. Underground
pipeline network, drainage network and boundary division, relation between water
retention area and water storage water ways should be considered as much as possible.
For areas with good information of underground drainage pipeline network, the model
can simulate situations with accurate pipeline network information, while proceed
with general estimate based on drainage capacity of the underground drainage
pipelines. Considering water logging situation in urban area which continues to
worsen, main roads can be treated as flood passage way in simulation calculation. For
simulation of waterlogging in overfly areas, micro-landform and pump stations should
be considered; for underground space water logging and drowning, the underground
space area and elevation should be considered.
In calculating and analyzing, standards for 10-year, 20-year, 50-year, 100-year,
and the most severe rainfall should be identified based on collected hydrological and
meteorological information. Uneven temporal and spatial distribution of rainfall
should be considered as well to calculate and simulate storm water logging before
levees break, and proceed with prediction, early-warning and emergency management
according to the simulation results. GIS-based simulation enables dynamic display of
flood emulation results, analyze situation of flood-impacted areas, as well as frontier
line at different times, flooding time of different locations and highest water level.
Coastal cities face risks brought by astronomic tide and storm surge the major threat.
When the two threats meet, the coastal cities are usually devastated by severe flooding.
For cities located at river estuaries, special attentions should be given to the extreme
adversity when river flooding and storm surge happen concurrently. It is necessary to
analyze sea tiding laws and then utilize flood simulation model to analyze the
flooding risk in case of concurrence of river flooding and storm surge, as well as the
possible impact when flood overspills or breaks levees.
5.1.3 GIS spatial analysis and visualization
City is usually characterized in terms of socio-economic conditions, wide
influence, increased impervious area, bigger runoff. For urban flooding risk
prevention and emergency management, spatial information is widely involved in
meteorological, rainfall, hydrological information analysis and treatment, flood
development trend prediction, emergency plan making based on risk analysis, and
urban flood control and drainage plan making and updating. The GIS technology
provides an effective approach for flood risk analysis and division as it enables the
weight assigning for natural, geographical and social factors related to flood risk
management and their laying up spatially. In general, the GIS spatial analysis and
visualized simulation provides real time data and optimize model parameters for
hydrological forecasting, flood evolution, and disaster assessment models. For these
reasons, GIS plays more important roles in Urban Flood Risk Management (UFRM)
as it can provide spatial character analysis and proceed high resolution data.
Outstanding features of GIS in UFRM include urban water catchment and receding
50
prediction, existing drainage facilities (pipelines and pump) information management,
water drainage facilities planning, design and construction management, 4D storm
temporal-spatial analysis, socio-economic data spatial distribution by
community/block, storm distribution and visualized presentation of water-logged
community, and storage, maintenance and management of high-resolution, layered,
multi-sourced, and frequently updated data.
A computer aided mapping tool for recording, collating, analyzing and
displaying spatial information. Generally, the figures show GIS layers indicating land
ownership and flood depths that was used to inform the designs for an integrated
urban plan over the next some years and simultaneously reduce flood risk,
contamination and provide environmental enhancements. In order to assess disaster
and share the disaster regarding information, Geo-Linking approaches shown in Fig.
5-1 is powerful. The information is stored in database of Geo-Linking system
including GIS. All information is converted to GIS information and overlapped to the
various GIS information such as utilities, populations, land use, damage photos etc.
The Geo-Linking system enables user to choose region or province of interest, the
enhance view of which is shown to allow user to select any particular data displayed
in the map such as photos, media, report and portal information can be presented in
this system.
In order to assess typhoon related disaster and share the typhoon related disaster
information, Typhoon Committee Working Group on Disaster Risk Reduction
(WGDRR) was established WEB GIS Based Typhoon Disaster Information System
(WGTCDIS) by using Geo-Linking approaches. The typhoon information menu in the
WGTCDIS has all the information of the typhoons such as trajectory, rainfall, wind,
damages etc. since 1951, which are stored in database of Geo-Linking system
including GIS information. Similar typhoon can be checked out by the computer
program running in background mode. The predicted track and the estimation of loss
can be simulated and then compared with observation data and all historical typhoon
trajectory and damages. To understand current typhoon's characteristics by comparing
with historical typhoon, the information of the historical typhoons can be checked by
either click a name of typhoon or insert specific period from one date to another date.
The localized damages are estimated by localized KDFs of typhoon-related damages
in the local regions and these results are converted to GIS map and overlapped to the
various GIS information such as utilities, populations, land use, etc. Also
WGTCDIS enables user to choose region or province of interest, the enhance view of
which is shown to allow user to select any particular data displayed in the map.
Another way of display the disaster information is to select a particular typhoon and
then, related disaster data and information are shown in the WGTCDIS.
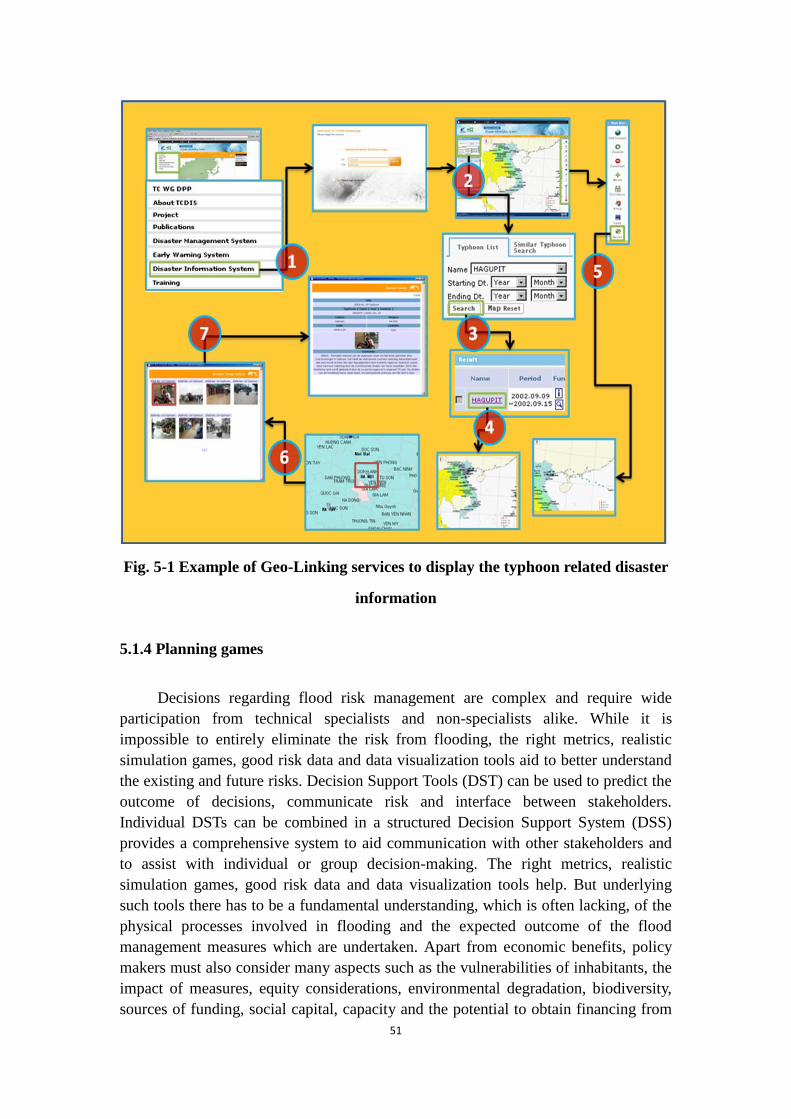
51
Fig. 5-1 Example of Geo-Linking services to display the typhoon related disaster
information
5.1.4 Planning games
Decisions regarding flood risk management are complex and require wide
participation from technical specialists and non-specialists alike. While it is
impossible to entirely eliminate the risk from flooding, the right metrics, realistic
simulation games, good risk data and data visualization tools aid to better understand
the existing and future risks. Decision Support Tools (DST) can be used to predict the
outcome of decisions, communicate risk and interface between stakeholders.
Individual DSTs can be combined in a structured Decision Support System (DSS)
provides a comprehensive system to aid communication with other stakeholders and
to assist with individual or group decision-making. The right metrics, realistic
simulation games, good risk data and data visualization tools help. But underlying
such tools there has to be a fundamental understanding, which is often lacking, of the
physical processes involved in flooding and the expected outcome of the flood
management measures which are undertaken. Apart from economic benefits, policy
makers must also consider many aspects such as the vulnerabilities of inhabitants, the
impact of measures, equity considerations, environmental degradation, biodiversity,
sources of funding, social capital, capacity and the potential to obtain financing from
52
third parties.
5.2 Flood Management Measures
Flood management measures are typically described as either structural or
non-structural and can be complementary in function. Structural measures are used to
control the flow of water from both outside and within urban settlements.
Non-structural measures manage risk by building the capacity of people to cope with
flooding through better planning and management. Tools are available to assess the
impact of these measures.
An integrated approach to urban flood risk management recognizes that risk can
never be entirely eliminated and that resilience to flood risk can include enhancing the
capacity of people and communities to adapt to and cope with flooding. It focuses on
finding the right balance between structural and non-structural flood management
measures. Fig. 5-2 illustrates four capacities for reduced vulnerability and increased
resilience.
Fig. 5-2 The four capacities towards increased resilience, source: cities and
flooding
5.2.1 Structural measures
Structural measures range from hard engineered structures to ecosystem
management approaches that cover water management at the catchment and urban
level. Hard engineered flood management structures include: (i) flood conveyance
designed to route floodwaters away from areas of risk via natural or artificial
channels; (ii) flood storage that reduce the peak of flood flows; (iii) urban drainage
systems that increase infiltration; (iv) ground water management to prevent land
53
subsidence; (v) flood resilient building design; and (vi) flood defenses. Ecosystem
management approaches include utilizing wetlands and creating environmental
buffers. Structural measures can be highly effective when used appropriately, as the
well-documented success of Korea river management system developed by the four
major river restoration project.
Dependence on traditionally used structural flood management measures, such
as flood defenses, can be inadequate and can be overtopped by events outside their
design capacity. In Japan in 2011, although concrete sea walls, breakwaters and other
structures had been constructed along more than 40% of Japan’s coastline, the
tsunami overtopped these walls. The unprecedented crisis in the Fukushima nuclear
plant highlights the risk of dependence on seawalls in particular, and other structural
measures in general. Many structural measures also transfer flood risk by reducing
flood risk in one location only to increase it in another. Structural solutions can also
have a high upfront cost; they can sometimes induce complacency by their presence.
5.2.2 Non-structural measures
There always remains a residual flood risk in using structural measures that
necessitates incorporation of non-structural measures into any strategy. The
non-structural measures often do not require huge investment upfront and can be more
effective at lower costs. Non-structural measures can be classified under four main
categories:
Increased preparedness via awareness campaigns such as the ISDR campaign
on "Making Cities Resilient". A campaign on awareness of flood risk
reduction measures In Vietnam was successful in encouraging home-owners
to invest in flood and typhoon resistant buildings. Korea identified 537 sites
most susceptible to inundation, collapse, and isolation by typhoons and floods,
and labeled them as "Disaster Prone Areas". These areas are classified and
managed by type, grade, managing entity, size, etc. Under this plan, $141
billion has been invested to improve 488 disaster prone areas from 1998 to
2011.
Flood avoidance via flood resilient land use planning and regulation of new
development is a central measure in addition to resettlement. In Chengdu,
China, slum residents along the river bank were resettled successfully with
community engagement and the riverside developed as a public park and
green buffer zone with water purification facilities.
Emergency planning and management, including early warning and evacuation;
early warning systems can be the first step in protecting people in the absence
of more expensive structural measures as well as to manage residual risk from
54
structural measures. When river levels were identified as dangerously high in
community in Korea, the community leader went through the flood-prone
community with a loud speaker asking people to evacuate. With just three
hours before notice, the population of can able to leave. When floodwaters
arrived, physical damage occurred, but not loss of life. The WEB GIS Based
Typhoon Disaster Information System (WGTCDIS) developed by NDMI
incorporates an approach to enable its users to share disaster information and
disaster risk assessment results. Nearest Neighbor Method (NNM) is used to
estimate long-term typhoon trajectories for the early warning of typhoon
disasters and the Kernel density function (KDF) is used to estimate the
damages considering the localized damages of the region of interest for the
urban flood disaster risk management. The localized KDFs of damages can be
established by using historical data. Assuming that the regional conditions
such as terrain has not changed much, the estimation can be made based on the
trend in the past. The damages can be inferred from the historical data for each
region. In this system, the most similar typhoon of past can be statistically
found, the damage of the typhoon can be rough estimation of projected
damages.
Speeding up recovery and using recovery to increase resilience by `building
back better’ through better planning and building standards and risk financing.
In Korea, to cope with the disasters due to the heavy rains and the 15th
typhoon RUSA in 2002, the "Special Disaster Area" declaration was started.
The declaration is for the areas where an ordinary support may not be enough
for the appropriate recovery and response activities. Through the
comprehensive supportive ways, that is, including the administrative and
financial supports, the government intends to encourage the citizen's
self-supporting intention, recover the damaged infrastructures more rapidly,
and stabilize the livelihood of the sufferers at the damaged area.
Decision Support System (DSS) for UFRM is based on computer network, GIS,
flood monitoring and early-warning model, prediction and modulation model,
flood disaster assessment model and database management technology. The
details will be discussed in Chapter 7.
Nonstructural measures can be challenging to implement. They rely on:
Good understanding of urban flood hazard and on adequate forecasting systems,
for example, an emergency evacuation plan cannot function without some
advance warning;
55
Community engagement and agreement of stakeholders and their institutions is
critical for implementation;
Lack of culture of compliance with land use regulations;
Value of long-term investments such as maintaining resources, awareness and
preparedness over decades without a flood event, bearing in mind that the
memory of disaster tends to weaken over time;
Most non-structural measures are designed to minimize but not prevent damage,
and therefore most people would instinctively prefer a structural measure.
5.2.3 Urban flood management measures
Many urban flood management measures offer co-benefits with other urban
environmental objectives.
Multi-purpose retarding basins that store flood water for outflow control when
necessary, offer effective utilization of limited land available in densely
populated cities/ urban areas for other purposes. In Tsurumi River Basin, a
retarding basin is used for sport and leisure facilities or car parking at other
times.
Rainwater harvesting can also be seen as an innovative measure to prevent
urban flooding. It forms part of a sustainable drainage system and can
simultaneously be used for non-drinking purposes, resulting in water
conservation.
Groundwater management can prevent land subsidence which mitigates flood
risk in low-lying areas but also protects buildings and infrastructure from
subsidence-induced failure, as for example has been attempted in Bangkok.
Wetlands, bio-shields, environmental buffer zones and other “urban greening”
measures produce environmental and health benefits in urban areas, while
reducing flood impacts. These include reducing the urban heat island effect
and the level of CO2 emissions, and thus creating a healthier urban
environment, as for example has been attempted in Korea.
Investment in better urban management, such as for solid waste, also reduces
urban flood risk and green growth can have health and environmental benefits,
and can be used to create employment and relieve poverty.
56
5.3 Alternatives for Flood Risk Management Measures
Government decisions about management of urban flood risk need to be
balanced against competing and often more pressing claims on scarce resources as
well as other priorities in terms of land use and economic development. Tools and
techniques exist which can predict the outcome of decisions, communicate risk and
create linkages between stakeholders and allow policy makers and their technical
specialists to decide between alternatives, and to assess their costs.
Cost-Benefit Analysis (CBA) evaluates costs and benefits in monetary terms. It
is the industry standard analysis tool for flood risk management measures. The
purpose of CBA is to assess, over its lifetime, the monetary value of all of the costs
involved in the development, construction and maintenance, and the monetary value
of all of the benefits to be gained from a flood risk solution, in order to determine
whether its benefits outweigh its costs. This is the main form of assessment used by
decision makers to determine whether a project is worth proceeding with, and if so,
when it should be started. Cost-benefit analysis can make the decision-making process
more transparent and accountable. However, structural measures proved not to be cost
beneficial.
A limitation of CBA is that traditionally it has been unconcerned with the
distribution of costs and benefits: for example, it neither considers who pays for the
risk reduction measures, nor who benefits from them. Also, by taking as its basis the
economic costs and benefits, it artificially weights the preferences of the wealthy over
those of the less well off. Urban flood defenses will be provided more to the rich
because the assets of the rich are greater and therefore the damage prevention
potential within wealthy neighborhoods is much greater than that in poorer ones.
Multi-Criteria Analysis (MCA) assigns weights and ranks to aspects that
cannot be quantified MCA is a complementary approach to CBA that incorporate less
formal consideration of social and environmental issues into project evaluation. MCA
is used to balance the needs of multiple stakeholders and to allow consideration of
costs and benefits that do not ordinarily have an market value, such as biodiversity,
well-being or community spirit. MCA aims to establish the goals and objectives of all
of the stakeholders that may be affected by both the urban flood risk and the
associated risk reduction measure. Consensual weighting is then determined for
various elements, through discussion with stakeholders.
To reduce subjective weightings in an MCA, it is vitally important to gain
representation from a sample of all stakeholders and to brief them thoroughly on the
purpose and details of the proposed schemes. The multi-actor participation explicit in
MCA, and the need for buy-in to the weighting analysis and results, means that
transparency and public involvement from an early stage are essential.
57
5.3.1 ALARP principle
Governments have limited resources and will often choose not to implement
schemes which may be cost beneficial because of the lack of available funds to do so
or because there are other priorities which take precedence. It will also apply in
developing countries where resources may be much more limited, or may depend on
international donors with their own agendas to satisfy. Therefore it becomes necessary
to determine an acceptable level of flood risk and to decide between alternatives,
while taking into account wider policy, equity, and social issues and uncertainties. In
deciding on an acceptable level of risk for populations to bear, the principle of ‘As
Low As Reasonably Practical(ALARP)’ can be adopted. With this approach, the
acceptance of risk can be expressed as a three tier system which requires definition of:
An upper band of unacceptable risk;
A lower band of broadly acceptable risk;
An intermediate band of tolerability which is tolerable if risk reduction is
impractical or the Coast-Benefit (CB) ratio is close to one.
5.3.2 Robust strategy
Errors in forecasting of an event, for example stage or time of arrival, may lead
to under-preparation (at the cost of otherwise avoidable damage) or over-preparation
(resulting in unnecessary anxiety). The balance between failure to warn adequately in
advance and the corrosive effects of too many false alarms must be carefully managed.
Flood risk managers must therefore consider measures that are robust to uncertainty
and to different flooding scenarios.
Evaluation of the costs and benefits of each measure, or combination of
measures, must be integral to a wider strategy which sets future targets for investment
in measures and prioritizes spending on the most urgent and effective of these
activities. Robustness, that is finding alternatives that perform well under all scenarios,
then becomes a preferred strategy rather than finding the optimal solution, bearing in
mind that the ALARP concept may ensure that robust solutions do not result in risks
in the intolerable band. An optimal solution might perform well in most scenarios but
be disastrous under some assumptions.
In managing urban flood risk today, and in planning for the future, a balance
must be struck between common sense approaches that minimize impacts through
better urban management and the maintenance of existing flood mitigation
infrastructure, and far-sighted approaches which anticipate and defend against future
flood hazard by building new flood mitigation infrastructure or by radically reshaping
the urban environment. The balance will be different for each city or town at risk.
58
This will lead to the preference for flexible and so-called `no-regrets’ approaches that
will include measures which will be cost effective regardless of changes in future
urban flood risk. Examples of such approaches are forecasting and early warning
systems which these are not sensitive to future flood risk and are relatively low in cost
to set up; informal settlement upgrading or clearance by rivers also has many benefits
over and above the flood management role; restoring wetlands that may also have
amenity value; installation of wider foundations for flood defenses so that they can be
raised later without strengthening the base builds in flexibility; the purchase of
temporary flood defense barriers can also be seen as a flexible alternative as they can
be deployed when and where necessary as flood risks change; and improved solid
waste management systems have many benefits for environmental health regardless of
flood risk. Such no regret measures yield benefits over and above their costs,
independent of future changes in urban flood risk.
5.4 Implementation of Flood Risk Management Measures
5.4.1 Institutions
In implementing an integrated approach, the role of well-functioning institutions,
the participation of stakeholders, and the engagement of affected communities are
vital. Identifying which institutions are most effective in the delivery of these
measures is fundamental to success. Institutional mapping is a tool that can be used to
identify the awareness and perception of these key institutions, both formal and
informal, as well as that of key individuals, inside and outside of a community, a city,
a province or a country. It will also help to identify the relationships and importance
of these different actors to one another or to individuals.
Multi-jurisdictional cooperation: Integrated urban flood risk management
takes place at a range of scales, including the community, local/ municipal, river basin
and water catchment, region and nation as a whole. This is due to the fact that the
source of flooding may be at some distance from the city or town. Often the best
option may be to tackle flooding before it reaches the urban setting. Structural
measures such as flood defenses and conveyance systems can form a long-term
response to flood risk. However, these require large investments which will not
always be available in one jurisdiction. Further flood defenses in one location could
increase risk elsewhere.
Multi-stakeholder cooperation: Integrated flood risk management requires
coordination between national governments, city governments, public sector
companies, including utilities, along with civil society, non-government organizations
(NGOs), educational institutions and the private sector. Engagement of the
community at all stages through risk assessment through implementation to will
ensure that the undertaken measures are equitable and effective, and meet the needs
59
and priorities of the entire affected population. It may also generate extra knowledge
and resources, as will the utilization of measures that are community-designed and
implemented. Very often residents are unwilling to move from already-developed
locations in floodplain areas, which are vulnerable and contravene the land use
regulations drafted by decision makers and planners. This situation can involve poorer
residents, living on riverbanks close to economic opportunities, or wealthier people
who have houses on seafronts. Generating the necessary attitudinal and behavioral
change requires time and investment in wide communication and multi-stakeholder
consultation through a participatory process.
The Associated Program on Flood Management (APFM) is making an effort to
provide guidance tools for flood managers and various other specialists working in
flood management. Integrated Flood Management (IFM) requires various specialists
to work together under a joint flood management strategy or policy. While the overall
aims and objectives of such policy are usually explicitly provided, the consequences
for the application of various principles are far less understood. In Bangkok, the
engagement of the community strengthened urban flood risk management activities
and led to the development of greater local capacity to cope with flooding. Time
constraints are an issue that needs to be considered by decision makers in relation to
the involvement of communities and other stakeholders in flood risk management.
The time that people, especially poorer people, have to participate in flood risk
management measures, in public consultations and other activities, is often limited.
Moreover, mobilization of the community to engage in voluntary service is also a
challenge. The role of the private sector in the implementation and delivery of urban
infrastructure has been increasingly recognized. In flood risk reduction, public-private
partnerships can provide to the private sector a better understanding of their
interdependence with locally critical infrastructure, and improve coordination with the
local stakeholders before, during, and after a disaster. In Metro Manila,
multi-stakeholder collaboration for better Flood Risk Management leveraged public
private partnerships successfully.
5.4.2 Financing
The sources of finance for integrated flood risk management are broad and can
benefit from a partnership approach which includes contributions from multiple
stakeholders as well as international donors. Flood and other disaster risk reduction
activities are long-term processes that increase the sustainability of development
interventions, and donors therefore need to incorporate this perspective into their
plans and programs. The fact that flood risk management measures may not offer
quick returns to donors and governments can limit available funding opportunities.
The notion of “Not in my Term of Office” may lead to politicians and government
officials placing flood risk management lower on the agenda than other, more tangible
or immediate programs, and deferring or delaying action.
60
Flood risk management spending does not always have to be explicit: it can be
form part of broader municipal budgeting for development spending, climate change
adaptation spending, integrated water projects, slum upgrading, or education. In Palo,
Philippines, to reduce the impacts of flooding, the municipality initiated a review of
their local planning and development tools to incorporate DRR. After the assessment,
the most appropriate measures were identified and responsibilities were allocated
amongst relevant administrative bodies and incorporated into the municipality’s
Annual Investment Plan. Microfinance arrangements have the potential to empower
individuals and communities to implement flood risk management solutions for
themselves. A community-owned disaster fund can be set up which can accept funds
from multiple sources including micro investments from the community. Allocation of
grants and micro credits towards flood or other disaster mitigation can be determined
by the community organization controlling the fund.
5.4.3 Maintenance
Implementing processes for adequate long-term Operations & Maintenance (O
& M) is a critical aspect of implementation. Flood mitigation infrastructure requires
regular repair and maintenance on a risk-assessed basis, so that the most critical
elements are inspected and maintained and repaired at the most frequent intervals. The
cost of operation and maintenance is a critical aspect in the long term, so there will be
a preference for designs that minimize maintenance. Unfortunately, despite
appropriate design, high maintenance requirements are often introduced at the
procurement and construction stages through the constraints of the bidding process,
poor contractual enforcement, and the desire for low-cost solutions with little regard
to subsequent upkeep. The maintenance requirement may not become obvious for
some years after construction when project funds have been finalized and the
maintenance responsibilities passed to the municipal authorities.
5.5 Monitoring of Flood Risk Management Measures
Monitoring of flood risk management programs needs to be twofold: firstly, the
implementation of measures must be monitored and evaluated; secondly, and perhaps
more importantly the fitness of purpose of the implemented system (i.e., its ability to
reduce risk) must be monitored in the long term, as systems may not be regularly
tested by actual flood events. Just as deterioration of levees can lead to early breaches,
and drainage systems can become blocked, other measures and systems can also
become prone to failure. This may be due to inattention to maintenance, to
obsolescence, or to the departure of experienced individuals. The responsibility for
carrying out a monitoring program is, ideally, delegated to the agency which is
responsible for maintaining and operating the risk reduction solution. However, it may
be appropriate for the requirements and design of the monitoring protocol to be
enshrined in regulation or legislation.
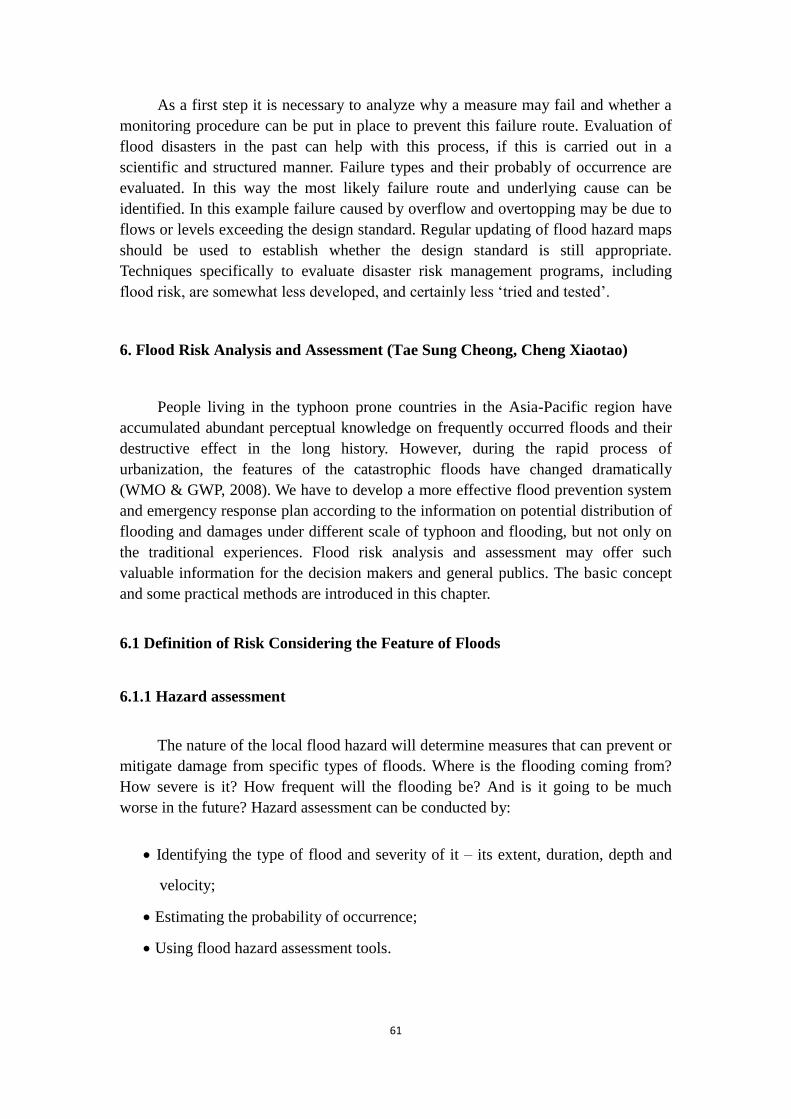
61
As a first step it is necessary to analyze why a measure may fail and whether a
monitoring procedure can be put in place to prevent this failure route. Evaluation of
flood disasters in the past can help with this process, if this is carried out in a
scientific and structured manner. Failure types and their probably of occurrence are
evaluated. In this way the most likely failure route and underlying cause can be
identified. In this example failure caused by overflow and overtopping may be due to
flows or levels exceeding the design standard. Regular updating of flood hazard maps
should be used to establish whether the design standard is still appropriate.
Techniques specifically to evaluate disaster risk management programs, including
flood risk, are somewhat less developed, and certainly less ‘tried and tested’.
6. Flood Risk Analysis and Assessment (Tae Sung Cheong, Cheng Xiaotao)
People living in the typhoon prone countries in the Asia-Pacific region have
accumulated abundant perceptual knowledge on frequently occurred floods and their
destructive effect in the long history. However, during the rapid process of
urbanization, the features of the catastrophic floods have changed dramatically
(WMO & GWP, 2008). We have to develop a more effective flood prevention system
and emergency response plan according to the information on potential distribution of
flooding and damages under different scale of typhoon and flooding, but not only on
the traditional experiences. Flood risk analysis and assessment may offer such
valuable information for the decision makers and general publics. The basic concept
and some practical methods are introduced in this chapter.
6.1 Definition of Risk Considering the Feature of Floods
6.1.1 Hazard assessment
The nature of the local flood hazard will determine measures that can prevent or
mitigate damage from specific types of floods. Where is the flooding coming from?
How severe is it? How frequent will the flooding be? And is it going to be much
worse in the future? Hazard assessment can be conducted by:
Identifying the type of flood and severity of it – its extent, duration, depth and
velocity;
Estimating the probability of occurrence;
Using flood hazard assessment tools.
62
6.1.2 Vulnerability assessment
Location of flood events and vulnerable populations are important to determine
the necessity, urgency and priority for implementing flood risk management measures.
What can be the impacts of flooding? What population and assets occupy the
potentially affected areas? How vulnerable are these communities and settlements?
How are these planned or developed? And what do they already do towards flood risk
reduction? Vulnerability assessment is conducted by:
Understanding flood impacts;
Flood damage assessment;
Vulnerability assessment & mapping.
The framework of risk assessment illustrated by WMO (1999) indicates that
evaluation of hazards and vulnerability assessment should proceed as parallel
activities, in a consistent manner, so that results may be combined and comparable.
The important thing for vulnerability assessment is the availability of organized data.
6.1.3 Disaster assessment
The decision-making process also depends upon other factors, such as
perception of risk in relation to cost-benefit analysis, measures taken for risk
reduction strategies or alternatives available for risk mitigation. It is recommended to
include pre-disaster assessment and in-disaster assessment modules in a
decision-making support platform for urban flood management.
Pre-disaster assessment: Disaster assessment ahead of flood disaster happening.
That is to analyze the economical losses and impacts under different flood
scenarios by using a GIS-based disaster analysis module, which can be realized
based on the data of water depth, inundation area and duration simulated by
two-dimension flood simulation models, and , with the help of displaying the
social-economic data on the spatial layers.
In-disaster assessment: Disaster assessment just in the process of disaster
happening. In the process of flood disaster, the real-time flood inundation area can
be estimated based on the remote-sensing images. So, the disaster assessment can
be undertaken by analyzing social-economic impact of flood over the inundation
area with the help of GIS and spatial data base.
6.1.4 Risk assessment
Flood risk is commonly understood as a function of the flood hazard, of
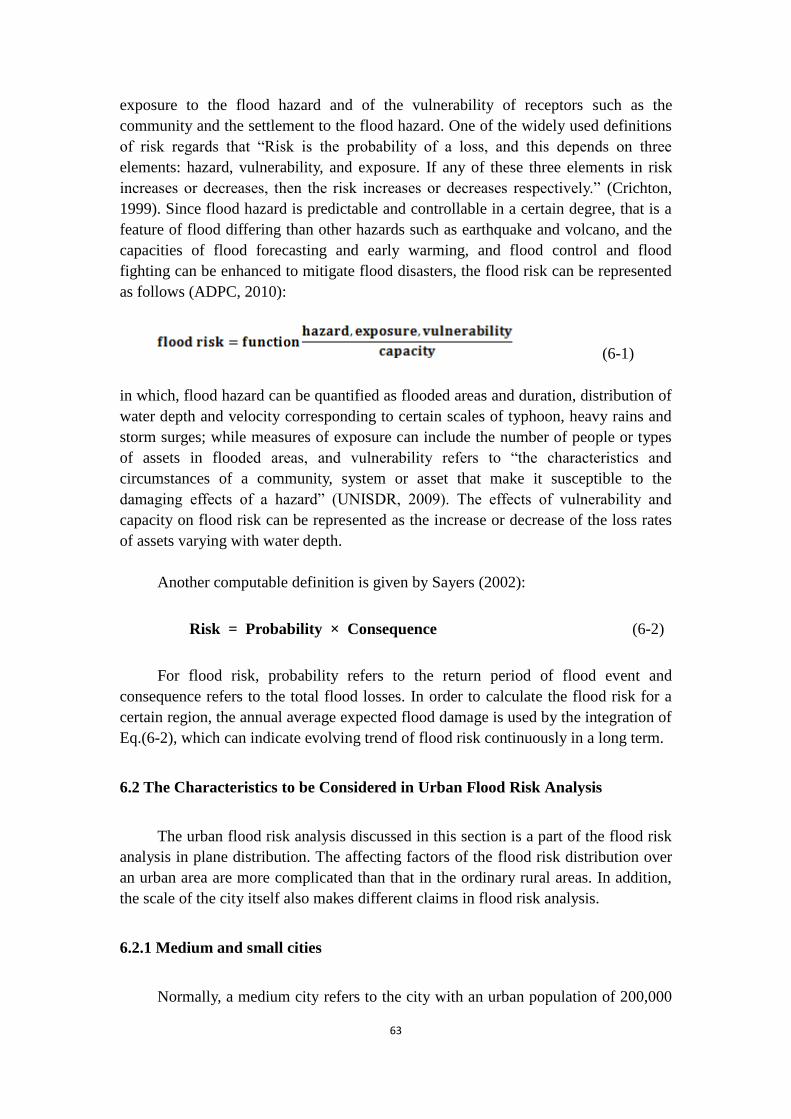
63
exposure to the flood hazard and of the vulnerability of receptors such as the
community and the settlement to the flood hazard. One of the widely used definitions
of risk regards that “Risk is the probability of a loss, and this depends on three
elements: hazard, vulnerability, and exposure. If any of these three elements in risk
increases or decreases, then the risk increases or decreases respectively.” (Crichton,
1999). Since flood hazard is predictable and controllable in a certain degree, that is a
feature of flood differing than other hazards such as earthquake and volcano, and the
capacities of flood forecasting and early warming, and flood control and flood
fighting can be enhanced to mitigate flood disasters, the flood risk can be represented
as follows (ADPC, 2010):
(6-1)
in which, flood hazard can be quantified as flooded areas and duration, distribution of
water depth and velocity corresponding to certain scales of typhoon, heavy rains and
storm surges; while measures of exposure can include the number of people or types
of assets in flooded areas, and vulnerability refers to “the characteristics and
circumstances of a community, system or asset that make it susceptible to the
damaging effects of a hazard” (UNISDR, 2009). The effects of vulnerability and
capacity on flood risk can be represented as the increase or decrease of the loss rates
of assets varying with water depth.
Another computable definition is given by Sayers (2002):
Risk = Probability × Consequence (6-2)
For flood risk, probability refers to the return period of flood event and
consequence refers to the total flood losses. In order to calculate the flood risk for a
certain region, the annual average expected flood damage is used by the integration of
Eq.(6-2), which can indicate evolving trend of flood risk continuously in a long term.
6.2 The Characteristics to be Considered in Urban Flood Risk Analysis
The urban flood risk analysis discussed in this section is a part of the flood risk
analysis in plane distribution. The affecting factors of the flood risk distribution over
an urban area are more complicated than that in the ordinary rural areas. In addition,
the scale of the city itself also makes different claims in flood risk analysis.
6.2.1 Medium and small cities
Normally, a medium city refers to the city with an urban population of 200,000
64
to 500,000; a small city refers to the city with an urban population less than 200,000.
The features of flood risk are as follows:
(1) The medium and small cities are usually the local centers of the politics,
economy and the cultures, as well as the hubs of communications. The urban areas of
the cities are not so large in size, but the density of the population and assets are
relatively higher. Among them, there are many newly developed cities in recent years
with lower level of the flood control capacities and higher damages induced by
flooding.
(2) Generally, the flood control standard for the medium cities is assigned
against 50 to 100-year flood events and small cities against 20 to 50-year food events.
However, limited by the economic and technical capabilities, most of the medium and
small cities have not reached the statutable standards in the developing countries.
There are obvious gaps between the demands of development and the real situations
of the urban flood control and drainage systems. Today, the flood disasters hit the
medium and small cities more frequently than the large cities, and cause the damages
much higher than those in the former rural areas.
(3) The medium and small cities are widely scattered all over the vast plains,
hills, deltas and coastal areas, with quite different environmental conditions for flood
hazards and the differences of the flood risk features. Because of the unbalanced
economic developments, the demands and the investments on the flood control system
construction are also different among them. The flood risk analysis methods should be
carefully selected to suit the local conditions.
6.2.2 Large cities
Among the large cities, the major cities refer to the city with an urban
population of 500,000 to 1,500,000 and the essential major cities with an urban
population over 1,500,000. The features of flood risk for large cities are as follows:
(1) The large cities are usually the national or regional centers of politics,
economy and cultures, as well as the major hubs of the communications, with wide
urban area and a high density of population and assets. In case a large city hit by a
severe flood hazard, it will cause not only the extensive losses to the city of its own,
but also the adverse impacts of the flood disaster exceeding far from those on the
inundated areas.
(2) The flood control standards are required relatively higher for the large cities.
The flood control standards for the major cities are assigned against 100 to 200-year
flood events and the essential major cities against over 200-year food events. During
the flood-fighting period, the large cities are always the key protected objectives.
65
(3) The large cities have commonly built relatively systematical flood control
and drainage facilities in certain scales. However, most of them up to now have not
reached the statutable standards. Some flood control facilities built in a former period
are unable to meet the demands of urban development today. The newly expanded
urbanized areas with lower flood control capabilities are facing higher flood risks.
(4) The large cities always suffer from flood hazards for different causes, such
as river flooding, local rainstorm, torrential flood, debris flow, and storm surge, as
well as their combinations. Each kind of floods or their composition may hit different
part of the city.
For the large cities, in the flood risk analysis, we should consider not only
various causes of the flood hazards and their compositions, but also the changes of the
flood risks associated with the exploitation in river basin, expanding of the urban
areas and the construction of the flood control works. Thus, the flood risk research for
the large cities should adopt advanced means as much as possible.
6.3 Procedures of Urban Flood Risk Analysis
The procedure of the urban flood risk analysis includes basic data collecting,
preliminary analysis and detailed analysis. In addition, the urban flood damage
analysis should be considered if necessary.
6.3.1 Collection of basic data
Data collecting is a very important fundamental step, or even the most difficult
step in flood risk analysis, particularly in developing countries. We require the local
agencies to collect data as much as possible so that we can have more chances to
compare, recruit and check the reliability of the data collected.
(1) Maps of the city. The topographic map and administrative division map of
the objective city should be collected. It should be enlarged to the extent that includes
all the areas necessary for the urban flood analysis. The scale of the maps should meet
the needs of distinguishing the topographic level, the surface cover types, the
urbanized region, the density of buildings, and the location of the flood control works.
Generally, the scale of the maps should not be less than 1:10000. For some important
parts, it should supplement maps with larger scale of 1:5000 or 1:2000.
Because of the rapid changes in urban areas, the maps collected should be
processed artificially according to the latest aerial and/or satellite photographs, or
information from urban planning authorities and other associated units. The newly
expanded urban areas, highways, railways, bridges should be added on the maps. For
the regions with rapid changes in elevation, the original data of elevation on the maps

66
should be emended according to the present collected and measured elevation. The
major flood protecting units, works, schools, hospitals, and so on, should be marked
on the maps.
(2) Hydrological data for the stochastic features of floods. Firstly, the flood
rainstorm and hydrological data adopted in frequency analysis for urban flood/tide
control planning or the present flood frequency analysis results should be collected.
Then, the methods applied in former analysis, and the time series of data should be
evaluated. If the method is suitable, and the time series is longer enough and there are
not obvious changes since the former analysis, the present result can be used directly.
Otherwise, it is necessary to collect the latest data and make an analysis again.
(3) River bed data. Data concerning river, such as cross-section, gradient and
bed material, as well as the deformation of riverbed should be collected for those
rivers which flow through the urban area, or for those overflows which may threaten
the city. Because of the expansion of the urban area, some rivers that used to be the
floodway out of the city in the past and have become drainage channels in the city
today should be particularly surveyed.
(4) Large structures with effects on urban flooding and drainage. Data
concerned with dike, levee and the embankments of railway, highway and conveying
channel should be collected, such as the time of construction, the top level, the
structures and qualities, and the foundation. The practically maintained flood control
standards and possibility of failure should be evaluated for each reach of the river.
The dams concerned and the flood control operating and emergency discharging
schedules should be studied. The plan of sewerage system and the capacities should
be surveyed. The layouts of bridges that may cause the backwater level and the
culverts which cross the embankments should be collected. If there are detention areas
around the city, the operating criteria should be understood.
(5) Data of historical flood events. The survey reports and other findings
concerned with the flood events through history should be collected as much as
possible. They are necessary to understand the cause, the background, the magnitude,
the area inundated and the duration, the highest water stage distribution, and the
population affected and the losses of various properties of each flood event. All data
should be sorted out to sub-areas and categories. The reliability of the data should be
analyzed and illustrated.
In the case of no sufficient literature records, a particular flood mark
investigation should be organized to determine the range of the flooded areas and the
highest water stage of big flood events in the past. Combining with the frequency
analysis of flood peak discharges, the flood return period for the range of each
inundated event can be determined preliminarily.
67
(6) Urban Flood Control Planning. It includes the urban flood control planning
and the correlative river basin flood control planning, such as the construction plan of
the dams on the upper reaches, the main dikes along the rivers and the coastal lines,
detention projects, and river improvements.
(7) Relative Emergency Programs. The current emergency programs related to
the organizations of Urban Flood Prevention, Flood Fighting, Flood Evacuation and
Relief and Rescuing should be collected.
(8) Urban Developing Planning and other Relative Plans. Especially, the
construction plans of the lifeline systems, such as traffic facilities, power supply, gas
supply, water supply and communication facilities, should be collected.
(9) Statistical Yearbooks. The series of urban social and economic development
data can be found in the urban statistical yearbooks.
(10) Major Flood Protection Objects. The basic data of the major flood
protection objects including location, elevation, number of staffs and workers, as well
as values and vulnerability of properties exposed should be collected.
6.3.2 Preliminary analysis
(1) Data analysis. For the urban areas, the data related flood might usually be
collected from various sources with longer time series. However, the collected data
may be in conflict with each other, insufficient or even unreliable. Thus, it is
necessary to make a systematical analysis for all the collected data before to be
utilized.
For most of the cities, the flood frequency analysis have been carried out, and
for some of them, the flooding range maps associated with different typical flood
return periods have been prepared already. However, in the following cases, the flood
return periods and the associate flooding ranges should be reconsidered.
(a) The results have some irrationality that may be caused by hydrological
records with something wrong, insufficient time series, or inadequate
calculating methods.
(b) New data and advanced means can be used to find more reliable and detailed
conclusions that are different from the original results.
(c) Obvious changes have been viewed in landscapes of the city and
surrounding areas, as well as the carrying and storing capacities of the
riverbeds.
68
(d) The flood frequency features have been obviously changed because of the
dam construction, river regulation, and newly improved levee system and
drainage systems, and so on.
(2) Flood causing analysis. The flood causing analysis should be carried out
mainly depending upon the local flood events in the past, which follows the
procedures as below:
(a) To learn the inundated ranges, the distribution of the highest water stages,
and the flood routing processes, and flood damages of the previous flood
events as detailed as possible.
(b) To recognize the causing of each flood event, such as flash flood and inner
flood caused by the local rainstorm, overflow and levee breach caused by
heavy rainfall or the emergency discharge of the dam in the upper stream
which leads floods in excess of design standards of the urban streams, storm
surge caused by typhoon in coastal cities. Actually, the floods occurred in
urban areas are usually the combination of several causes noted above.
(c) To recognize the return period of each causing factor through the time series
analysis.
Through the flood causing analysis, we may roughly understand about the types,
the intensities, and the distributions of flood risks for a certain urban area.
(3) Flood risk factors variation analysis. At present, most of the cities in the
coastal regions in Asian developing countries are in the rapid development period.
They are the places where the flood risk causing factors have changed most obviously.
The changes of the flood risk are usually resulted from both natural factors and
man-made factors. The following factors should be stressed:
(a) The reservoirs being built upstream of the cities: Reservoirs can be operated
to modify the peak discharge of big floods to reduce the flood risk for the
downstream cities. However, since many reservoirs have turned to take
water supply as their main functions, the possibility of emergency
discharges during the flood season increases; in case of the dam failure, an
extreme flood event may occur.
(b) The developments of the urban flood control and drainage systems:
construction of the levee and dike, water gates, pump stations, bypass
floodway, diverging channel, flood detention areas, may enhance the flood
protection level of the large cities. But the real flood protection level of a
city should be proofed, including the variation of the levees (freeboard,
structure, quality, stability of the foundation, and maintenance state etc.),
69
variation of the drainage level (drainage capacities, storage capacities, etc.),
changes of rainfall-runoff features in urbanized areas (increase of peak
discharge, sharpness of the peak shape, decrease of the corresponding
protection level), and so on.
(c) The structural works constructed in or along the riverbed and river
floodplains, and the variation of the river channel: the regulation of the
urban river channels may increase the flood carrying capacities, and
improve the urban flood protection level. However, the design flood
hydrograph may be changed by newly constructed bridges, docks, or pipes
across the river, silting up the riverbed, and so on.
(d) Newly urbanized areas and the economic developing districts of the city:
such kinds of new districts are commonly expanded to the lower land with
higher flood risk. In particular, development of the new urban districts may
increase the flood risk of the old urban areas.
6.3.3 Detailed analysis
The aim of detailed analysis is to evaluate the intensity of a typical flood event
with a certain return period, including inundated area, distribution of maximum water
depth, duration of inundation, population afflicted, economic losses and the impact
degree, and so on.
In the phase of detailed analysis, the typical flood events should be selected
according to the practical flood control standard of the city concerned. Generally, a
100-year flood event is used as a based flood. Meanwhile, the 10-, 20-, 50-, 500-year
flood events are asked for analysis. The detailed analysis is composed of hydrological
feature analysis and hydraulic feature analysis.
(1) Hydrological feature analysis. Through the preliminary analysis, if the flood
risk factors have changed obviously, the urban floods statistical analysis should be
conducted again. At this time, the rainfall-runoff model should be used instead of the
simplified data analysis. If such a kind of model does not exist or the existing model
cannot reflect the influence of urbanization on the rainfall-runoff features, new model
should be established.
(2) Hydraulic feature analysis. For the cities along rivers and surrounded by
mountains and hills, the flooding extension might be limited in a narrow belt. In this
case, the flood prone area might be estimated simply by the flood discharge
hydrograph with different return periods, or calculated by one-dimensional hydraulic
model. But for the plain cities, two-dimensional hydraulic model is needed.
The two-dimensional model for the simulation of flooding in an urban area
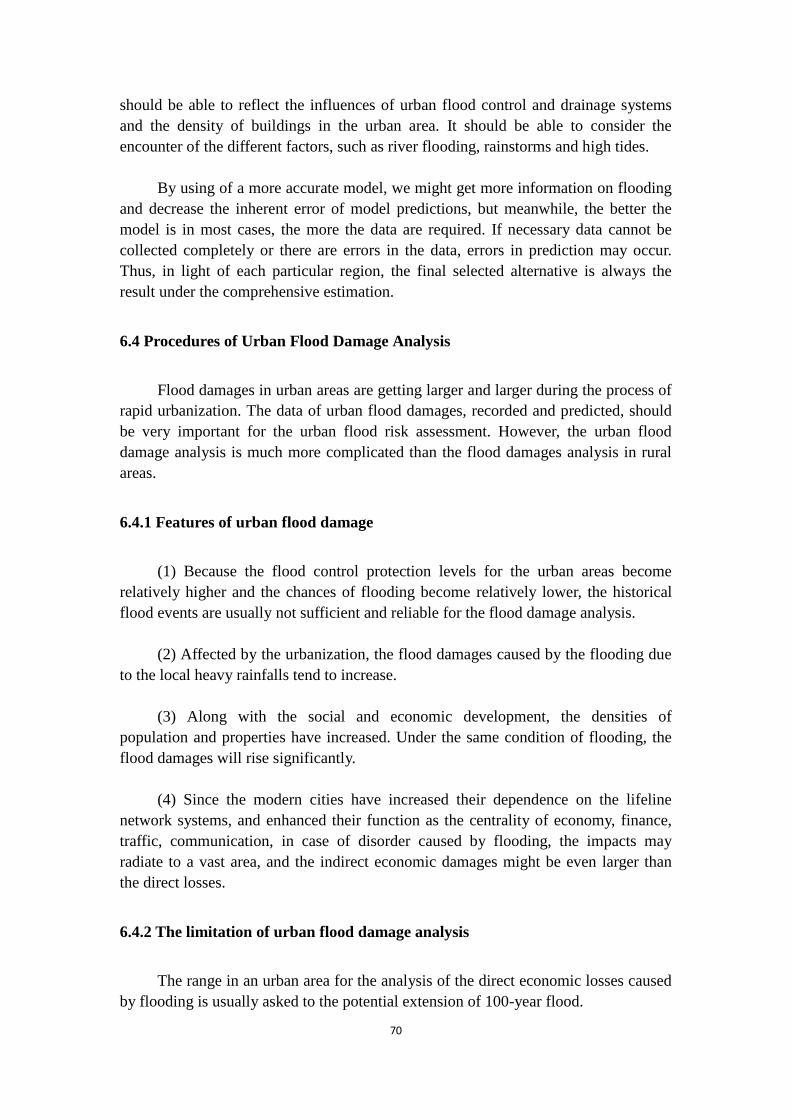
70
should be able to reflect the influences of urban flood control and drainage systems
and the density of buildings in the urban area. It should be able to consider the
encounter of the different factors, such as river flooding, rainstorms and high tides.
By using of a more accurate model, we might get more information on flooding
and decrease the inherent error of model predictions, but meanwhile, the better the
model is in most cases, the more the data are required. If necessary data cannot be
collected completely or there are errors in the data, errors in prediction may occur.
Thus, in light of each particular region, the final selected alternative is always the
result under the comprehensive estimation.
6.4 Procedures of Urban Flood Damage Analysis
Flood damages in urban areas are getting larger and larger during the process of
rapid urbanization. The data of urban flood damages, recorded and predicted, should
be very important for the urban flood risk assessment. However, the urban flood
damage analysis is much more complicated than the flood damages analysis in rural
areas.
6.4.1 Features of urban flood damage
(1) Because the flood control protection levels for the urban areas become
relatively higher and the chances of flooding become relatively lower, the historical
flood events are usually not sufficient and reliable for the flood damage analysis.
(2) Affected by the urbanization, the flood damages caused by the flooding due
to the local heavy rainfalls tend to increase.
(3) Along with the social and economic development, the densities of
population and properties have increased. Under the same condition of flooding, the
flood damages will rise significantly.
(4) Since the modern cities have increased their dependence on the lifeline
network systems, and enhanced their function as the centrality of economy, finance,
traffic, communication, in case of disorder caused by flooding, the impacts may
radiate to a vast area, and the indirect economic damages might be even larger than
the direct losses.
6.4.2 The limitation of urban flood damage analysis
The range in an urban area for the analysis of the direct economic losses caused
by flooding is usually asked to the potential extension of 100-year flood.
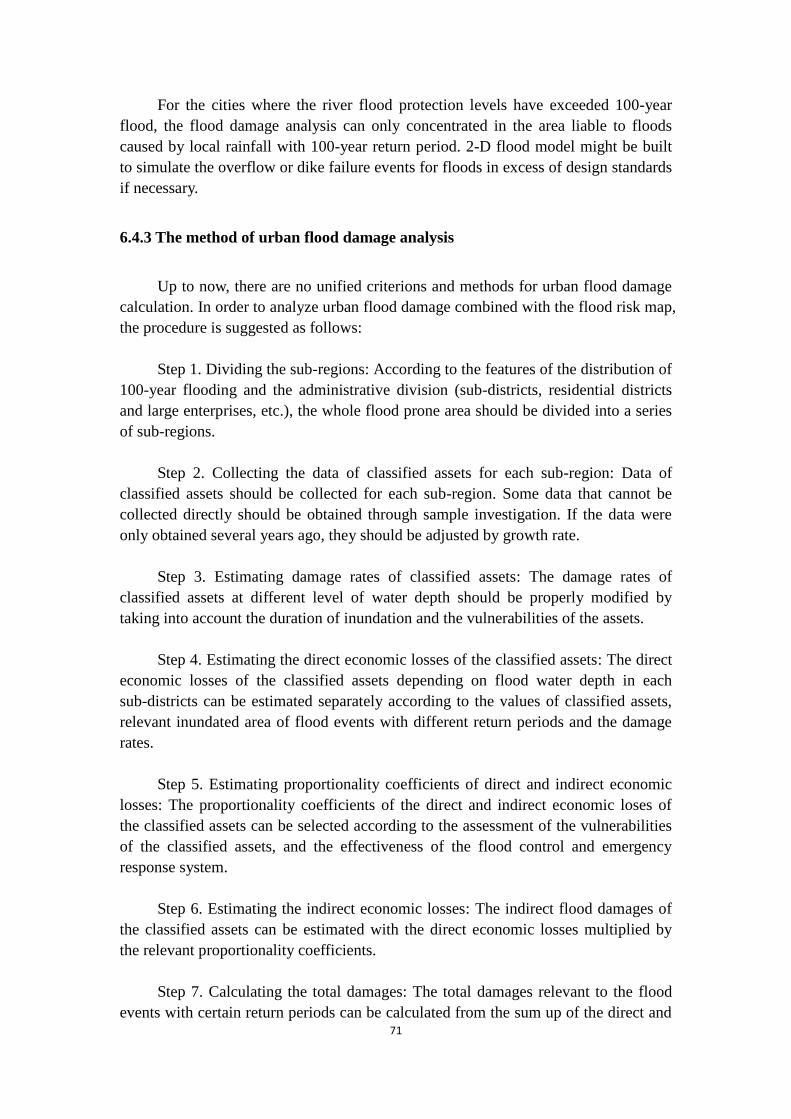
71
For the cities where the river flood protection levels have exceeded 100-year
flood, the flood damage analysis can only concentrated in the area liable to floods
caused by local rainfall with 100-year return period. 2-D flood model might be built
to simulate the overflow or dike failure events for floods in excess of design standards
if necessary.
6.4.3 The method of urban flood damage analysis
Up to now, there are no unified criterions and methods for urban flood damage
calculation. In order to analyze urban flood damage combined with the flood risk map,
the procedure is suggested as follows:
Step 1. Dividing the sub-regions: According to the features of the distribution of
100-year flooding and the administrative division (sub-districts, residential districts
and large enterprises, etc.), the whole flood prone area should be divided into a series
of sub-regions.
Step 2. Collecting the data of classified assets for each sub-region: Data of
classified assets should be collected for each sub-region. Some data that cannot be
collected directly should be obtained through sample investigation. If the data were
only obtained several years ago, they should be adjusted by growth rate.
Step 3. Estimating damage rates of classified assets: The damage rates of
classified assets at different level of water depth should be properly modified by
taking into account the duration of inundation and the vulnerabilities of the assets.
Step 4. Estimating the direct economic losses of the classified assets: The direct
economic losses of the classified assets depending on flood water depth in each
sub-districts can be estimated separately according to the values of classified assets,
relevant inundated area of flood events with different return periods and the damage
rates.
Step 5. Estimating proportionality coefficients of direct and indirect economic
losses: The proportionality coefficients of the direct and indirect economic loses of
the classified assets can be selected according to the assessment of the vulnerabilities
of the classified assets, and the effectiveness of the flood control and emergency
response system.
Step 6. Estimating the indirect economic losses: The indirect flood damages of
the classified assets can be estimated with the direct economic losses multiplied by
the relevant proportionality coefficients.
Step 7. Calculating the total damages: The total damages relevant to the flood
events with certain return periods can be calculated from the sum up of the direct and
72
indirect flood damages of the classified assists in all sub-districts.
Step 8. Data updating: The data of the estimated flood damages should be
updated. Since it is impossible to make an investigation for the flood damage
assessment every year, the procedures from the Step 3 to Step 7 should be repeated by
the use of the new growth rates.
It should be pointed out that the urban flood damage statistical data published in
many developing countries up to now are in the form of self-reported by the local
agencies. It is too rough to be used in making an analysis along the time axis or for
comparison among the regions. To improve the above-mentioned schedule of urban
flood damage analysis through sample investigation, and then, to combine Urban
Flood Damage Model with the Flood Simulation Model will contribute to a
reasonable assessment of the urban floods as shown in Fig. 6-1.
A
1
2
3
R, I, B
R1, I1, B1
R2, I2, B2
R3, I3, B3
A1
A2
A3
+
+
Spatial distribution of Properties Spatial distribution of flood depth
Spatial overlap analysis
Spatial overlap result Flood depth damage data
Flood Damage (D)
0
ij
n
i
m
j
ij
n
i
i VDD
1 11
(Crop land)
(Built-up area)
D1
Flood Depth Category
1 2 3
A 1,1 2,1
3,1
R 1,2 2,2
3,2
I 1,3 2,3
3,3
B 1,4 2,4
3,,4
D2 D3 Dn
Fig. 6-1 Flow diagram for flood damage assessment model
Note: A=Agriculture output; B=Residential property; I=Industry assets;
B=Business assets; Di=flood damage in category i; ij, Vij=Loss rate, assets in
category i under depth j, respectively.

73
74
7. Decision Support System for UFRM (Wan Haotao, Tae Sung Cheong)
7.1 Main Aspects of the DSS for UFRM
DSS for UFRM is based on computer network, GIS, flood monitoring and
early-warning model, prediction and modulation model, flood disaster assessment
model and database management technology. Through human-computer interaction,
an information management platform is created according to same standards and
norms to integrate and utilize information and data of rainfall, hydrology, engineering,
danger degree, disaster conditions and socio-economy which are related to
flood-control decision making. As a result, a visualized urban flood risk management
system is created to support decision-making, and the system consists of
functionalities of rainfall information, hydrological information, flood monitoring and
early-warning, river flooding prediction, water project operation for flood control,
urban storm water inundation model, disaster assessment, and emergency response.
Fig. 7.1 DSS System General Functionality Organization
Rainfall information consulting: Provide rainfall information of the urban areas
and key rainfall gauge stations on rivers running through the city.
Em
ergen
ce
Resp
on
se
Riv
er Flo
od
Fo
recasting
Flo
od
Mo
nito
ring
and
Warn
ing
Flo
od
Disaster
Assessm
ent
Flo
od
Simu
lation
Hy
dro
log
ical
Info
rmatio
n
Water P
roject
op
eration
info
rmatio
n
Urban Flood Management System-DSS
Water P
roject
Op
eration
Rain
fall
Info
rmatio
n
75
Hydrological information consulting: Provide water level and discharge of the
rivers running through urban areas and the key hydrological stations.
Engineering information consulting: Provide information of engineering related
to flood control for the urban areas and the river region the city is in.
Flooding monitoring and early-warning: Provide real-time rainfall and
hydrological monitoring for key stations and compare gauged and predicted situation
with actual water level. Early warning will be given when the water level exceeds
warning value.
River flooding prediction: Forecast water level and discharge through key
stations on the upper and down streams of the river(s) running through the city.
Water project operation for flood control purpose: Modulate water for the
reservoir(s) and water storage area(s) that is related to urban flood control. This is
mainly a simulation and analysis of influences that could happen when upper stream
reservoir discharge and downstream tributary flooding meet and when water is
diverted by water storage areas.
Flood simulation: Simulate through an urban flooding simulation model which
can simulate flooding in different situations and the impact on the city. The model
provides dynamic display of GIS-based simulated flooding to analysis flooding areas,
front line at different times, timing of flood locations and highest water level.
Disaster assessment: A GIS-based disaster impact analysis module can utilize
disaster analysis results and the city socio-economic data to proceed quantitative
analysis about flooding consequences.
Emergency response: Classify early-warning and emergency management
levels according to severity degree and impact range. This leveled early-warning and
emergency response system is supported by a set of different quantitative initiating
standards.
76
7.2 Integration of Disaster-related Information
Now, as disaster aspects show complex and compound disasters, integrated
disaster information analysis is very important. The information regarding on urban
flood disaster risk management are (i) the hydrologic and hydraulic characteristics of
the river basin, (ii) strategy for risk management such as land-use planning, stream
code, building code and guideline for enhancement of river basin, (iii) utilities such as
natural drainage system within an urban area, (iv) urban flood risk management
policy, and (v) the economic, political, socio-cultural and ecological environment of
the flood prone area. These information are not provided by one institute or one
government organization but by various institutes and government organizations who
they provide information collected from monitoring and measuring, determined or
estimated from integrated analyzing or/and modeling for their own objectives. For the
urban flood disaster management.
Creating a flood-control decision-making system needs to collect and integrate
basic materials of the river region where the urban areas and city are located.
Specifically this will include flood control planning, water planning, flood-control
planning for the river region, water modulation planning, geographical materials
including landform, rivers, jurisdiction boundary, and elevation, hydrological
information, historical flooding information (affected range and water level), draining
engineering for flood control purpose (river section, gauging stations distribution,
location of embankment, water slucegate, and pumping station, remote sense images,
socio-economic information.
(1) Planning and preparatory plan
Urban flood control planning, drainage planning, flood-control preparatory
plan, emergency response plan, and water modulation plan.
(2) GIS information
Landform: Urban landform map on a big scale at lease 1:10000
77
Rivers: Main stream and tributaries in the city and go-by rivers that could
affect urban water level.
Road: Stem and general roads in the city area
Jurisdiction boundary: Boundaries at different levels of city, district, and
street.
(3) Hydrological materials
Gauge stations: location of hydrological stations and rainfall stations.
Rainfall information: Rainfall process, design rainfall process.
Hydrological information: Water level and discharge of key stations, existing
drainage capacity of rivers/waterways running through urban areas and the water
level.
Historic and Typical flooding: General situation, flooded range, water level,
loss, human damage and death.
(4) Drainage engineering for flood-control purpose
River section: Location of key river sections and gauged section data.
Embankment: Base elevation, top elevation, width
Pumping station: Drainage capacity, use policy, switch-on status
Sluice gate: Maximum drainage volume, use policy, switch-on status
Drainage area division: Run-off quotient, drainage modulus, area
Reservoir: Capacity, water-drainage capability, and information about the
water catchments.
(5) Remote sense images
Air-aviation/space remote sense images of 2.5m, 1.0 m, 0.6m, or even closer
distance and higher resolution.
78
(6) Urban socio-economic information
Community Committee is the bottom unit conducting statistics for
socio-economic data survey, and subjects include population, household, industry,
fixed assets, amenities and public infrastructure. 9 industries are included: Industry
and Mining, Commerce, Transportation, Communication, Construction, Government,
Culture and Education, Agriculture (including grain and oil storage, seeds,
agricultural machinery), goods storage and logistics.
7.3 GIS Based Information Management and Visualization
Geographic Information System (GIS) is a system that utilizes computer and its
accessories to collect, store, analyze and describe the surface and spatial information
of the whole or parts of the earth. For urban flooding risk prevention and emergency
management, spatial information is widely involved in meteorological, rainfall,
hydrological information analysis and treatment, flood development trend prediction,
emergency plan making based on risk analysis, and urban flood control and drainage
plan making and updating. GIS technique can manage, consult, analyze and present
visually related data, explore hidden relationship among the data, thus provides a new
supporting method for urban flooding risk management and decision-making.
The auxiliary tools for DSS for UFRM include:
(1) GIS-based Urban Flood Risk Management
The urban flood risk management database includes all types of hydrological
data, disaster data, socio-economic data, and many kinds of image data, spatial data
and experts data. For a city, such data could be of many types and forms with large
volume and complicated relationship. How to manage and utilized them is one of the
fundamental tasks of Decision Support System for UFRM.
The urban flood risk management system needs to establish and describe
relationship between/among different kinds of subjects. To be specific, it is to define
the urban flood risk information temporal and spatial data model structure and
changes, event description/presentation method, change types definition and
presentation methods, change dynamics description method. Based on the defined
79
temporal-spatial data model, management of huge volume of data, temporal or spatial
index, temporal-spatial element co-relating, consulting, and temporal sequence
analysis, the urban flood risk management database is established that includes basic
geographic data, hydrological and rainfall data, engineering data, meteorological data,
modeling data, emergency response data, and flood simulating results data to handle,
consult, search, update and maintain the spatial data, providing comprehensive data
support for urban flood risk management.
(2) GIS Spatial Analysis and Visualization
The GIS technology provides an effective approach for flood risk analysis and
division as it enables the weight assigning for natural, geographical and social factors
related to flood risk management and their laying up spatially. In general, the GIS
spatial analysis and visualized simulation provides real time data and optimize model
parameters for hydrological forecasting, flood evolution, and disaster assessment
models.
City is usually characterized in terms of socio-economic conditions, wide
influence, increased impervious area, bigger runoff. For these reasons, GIS plays
more important roles in urban flood risk management as it can provide spatial
character analysis and proceed high resolution data. Outstanding features of GIS in
UFRM include urban water catchment and receding prediction, existing drainage
facilities (pipelines and pumping stations) information management, water drainage
facilities planning, design and construction management, 4D storm temporal-spatial
analysis, socio-economic data spatial distribution by community/block, storm
distribution and visualized presentation of water-logged community, and storage,
maintenance and management of high-resolution, layered, multi-sourced, and
frequently updated data.
The GIS spatial analysis and visualization techniques specially needed by urban
flood risk management decision-making support system include hydrological analysis,
space layering analysis, neighboring area calculation, data embedding and eccryption,
network analysis, resource allocation, high-resolution data description,
multi-dimension data presentation, real-time dynamic treatment, concurrent
technology, interactive technology, and data visualization.
80
7.4 Flood and Inundation Simulation
7.4.1 Basin based flood mitigation analysis
Urban flood control standards are usually higher than those for rural areas of the
same river region. When extraordinary flood happens, measures can be taken to lower
water level and flow in the rivers to minimize flooding impact on the city. Such
measures include cutting peak by upper stream reservoir water diversion and
modulation, diverting flood through the spillway, and diverting/storing water in water
retention area.
For flood-controlling cities located on major rivers, river region hydrological and
hydraulic coupling model is created to simulate flooding. The hydrological model
work for upper stream runoff prediction, key hydrological station flood prediction,
key reservoir inflow process prediction, and outlets of key tributaries flow process
prediction. A 1-dimension hydraulic model displays the stem waterway flood
evolution process and is integrated with hydrological predictions results to simulate
the conflux process. A 2-dimension flood simulation flood simulation model can
simulate the flooding process in water retention area and connect with the
1-dimension river model to analyze and simulate the effect of water storage in
reservoir or water retention area on the lower reaches urban water ways. A
2-dimension flood simulating model can connect with the above said 1-D and 2-D
models to simulate flood prediction and modulation for going-thru rivers and
analyze/calculate possible impact when flood overflows or breaks levees. The
GIS-based system enables dynamic display of flood emulation results, analyze
situation of flood-impacted areas, as well as frontier line at different times, flooding
time of different locations and highest water level.
Coastal cities face risks brought by astronomic tide and storm surge the major
threat. When the two threats meet, the coastal cities are usually devastated by severe
flooding. For cities located at river estuaries, special attentions should be given to the
extreme adversity when river flooding and storm surge happen concurrently. It is
necessary to analyze sea tiding laws and then utilize flood simulation model to
analyze the flooding risk in case of concurrence of river flooding and storm surge, as
well as the possible impact when flood overspills or breaks levees.

81
7.4.2 Urban area storm waterlogging analysis
A 2-D hydraulic model can be used for early-warning and prediction of urban
storm water logging and possible risk/impact when levees of urban water ways breaks.
The hydraulic model should be able to reflect the impact caused by various buildings
and structures such as road, railway, drainage ditch, bump stations, and high-density
building blocks. Underground pipeline network, drainage network and boundary
division, relation between water retention area and water storage water ways should
be considered as much as possible. For areas with good information of underground
drainage pipeline network, the model can simulate situations with accurate pipeline
network information, while proceed with general estimate based on drainage capacity
of the underground drainage pipelines. Considering water logging situation in urban
area which continues to worsen, main roads can be treated as flood passage way in
simulation calculation. For simulation of waterlogging in overfly areas,
micro-landform and pump stations should be considered; for underground space water
logging and drowning, the underground space area and elevation should be
considered.
In calculating and analyzing, standards for 10-year, 20-year, 50-year, 100-year,
and the most severe rainfall should be identified based on collected hydrological and
meteorological information. Uneven temporal and spatial distribution of rainfall
should be considered as well to calculate and simulate storm water logging before
levees break, and proceed with prediction, early-warning and emergency management
according to the simulation results.
7.5 Risk Prediction and Assessment
Disaster assessment is one of the key components of the decision-supporting
system, which can be used to assess the flood and water-logging disasters in different
stages, i.e. pre-disaster, in-disaster and post-disaster.
Pre-disaster assessment is to perform flood simulation and simulate the flood
inundation process by using flood analysis models. In-disaster assessment is to
82
undertake flood disaster loss assessment based on the real-time flood inundation
monitored by means of remote-sensing. Post-disaster is to perform flood disaster
analysis based on the investigated damage data after the disaster.
It is recommended to include pre-disaster assessment and in-disaster assessment
modules in a decision-making support platform for urban flood management.
Pre-disaster assessment:disaster assessment ahead of flood disaster happening.
That is to analyze the economical losses and impacts under different flood scenarios
by using a GIS-based disaster analysis module, which can be realized based on the
data of water depth, inundation area and duration simulated by two-dimension flood
simulation models, and , with the help of displaying the social-economic data on the
spatial layers.
In-disaster assessment:disaster assessment just in the process of disaster
happening. In the process of flood disaster, the real-time flood inundation area can be
estimated based on the remote-sensing images. So, the disaster assessment can be
undertaken by analyzing social-economic impact of flood over the inundation area
with the help of GIS and spatial data base.
7.6 Warning and Emergency Response
On the basis of geographic information system of urban flood, flood forecasting
ad simulation system, flood dispatching system and database system, decision-making
support system for urban flood risk management realizes the analysis of possible
consequences under various water projects operation scenarios based on rainfall and
hydrological information for a urban area, and drawing up emergency response
countermeasures for supporting emergency action.
Emergency response can be considered as a series of sub-plans that address
communication and public information management, search and rescue co-ordination,
shelter management, stockpiling and distributing of food and supplies, contacting and
requesting additional support, debris management, financial management, volunteers
co-ordination and donations management.
83
The foundations of a flood emergency action are a mobilisation plan,
comprehensive disaster plan and well co-ordinated and trained flood fighting corps.
A flood fighting corps may be mobilised to a state of alert with various stages:
mobilisation, preparation and stand-by and dismissal. It is useful to have powers to
call up the inhabitants when high water threatens, with preference given to volunteers.
Organisation and training of search and rescue teams are done locally, regionally
or nationally but in real flood conditions, participation of volunteers, citizens and
relatives is significant, thus requiring the co-ordination to develop as the action
proceeds.
7.7 GeoLinking System (GLS)
In order to assess typhoon related disaster and share the typhoon related disaster
information, GeoLinking approaches is powerful. The Typhoon Information menu has
all the information of the typhoons from 1951 to 2010, which are stored in database of
GeoLinking system including GIS. Similar typhoon can be checked out by the
computer program running in background mode. The predicted track and the
estimation of loss can be simulated and then compared with observation data and all
historical typhoon trajectory and damages which all the typhoon information from
1951 to 2010 are listed below the system. You either click a name of typhoon or you
can insert specific period from one date to another date, then the information on the
typhoon will be shown. The character “I” icon is clicked, detailed information will be
shown in table which includes latitude, longitude and central pressure and be shown.
When you select the Similar Typhoon search tab, a box will be displayed to insert the
date, longitude and latitude, and central pressure can be inserted as shown in ③ of
Figure 1. To facilitate the input process, the text file can be imported. The detailed
track information can be saved and exported as a text file format. Disaster Information
shows all the damage related information based on the data obtained from the member
countries.
84
Web GIS based system enables user to choose region or province of interest, the
enhance view of which is shown to allow user to select any particular data displayed
in the map. Another way of display the disaster information is to select a particular
typhoon and then, related disaster data and information are shown in the Web GIS
based system. The localized damages are estimated by localized KDFs of
typhoon-related damages in the local regions and the results are converted to GIS map
and overlapped to the various GIS information such as utilities, populations, land use,
etc.
The GeoLinking system incorporates such an approach to enable disaster
manager to access disaster information. The Web GIS based system enables user to
choose region or province of interest, the enhance view of which is shown to allow
user to select any particular data displayed in the map. When user click any
interesting image icon displaced in the GIS map, the photo images and information
such as media, report and portal information will be presented shown in ⑥ of Figure
5.1.
85
8. Training and Research in Support of UFRM (Edwin ST Lai)
8.1 Gaps in Typhoon Committee Area
There are in general two major aspects of development works relating to the
UFRM project: (i) improvement in infrastructural measures, facilities and
organization (e.g. river training, drainage systems, dykes, dams, coastal engineering
works, reservoir management, etc.); and (ii) preparedness and emergency response to
triggering events, such as tropical rainstorms or heavy rain associated with tropical
cyclones (e.g. observation, monitoring, analysis, weather and hydrological forecasting,
warning delivery, etc.), that may lead to critical urban and coastal flood risks.
In consideration of the scope of activities under the Typhoon Committee,
discussion here will focus on the second aspect. Early Warning System (EWS), or
sometimes referred to as Multi-Hazard Early Warning System (MHEWS) to give
emphasis on the multi-facet capability of specific systems, is now often coined as a
generic term for all kinds of technical systems to provide warnings and alerts for
natural disasters (directly or indirectly related to weather, climate, climate change, as
well as hydrological, oceanographic, geophysical and seismic activities).
Given that there will always be uncertainty in forecasts and warnings, a critical
consideration in designing a good EWS is therefore in its ability and flexibility to
make plans accordingly given the uncertainty involved. Forecasters should be able
to update the warnings in a consistent and timely manner, as well communicating the
uncertainty or confidence level effectively as more information comes in; and the
relevant stakeholders should be placed at the appropriate level of readiness to make
risk assessment and adjust plans for the best possible cost-benefit outcome.
An increasingly popular trend is to stress on the importance of an effective and
efficient end-to-end warning service, hence from observation, analysis, forecast,
warning, information flow, all the way to users’ adequate awareness, understanding,
and response to the warnings. As such, EWS is not just about accurate and timely
forecasts and warnings. A comprehensive well-structured EWS should contain the
following three key components:
(a) Issuance of warnings: adequate and reliable observational data in real time,
with timely updated forecasts and warnings based on sound scientific
analyses (often, for weather-related disasters in particular, the responsibility
rests with the national meteorological services);
86
(b) Interpretation of warnings: good understanding of the risk and vulnerability
over a certain target region under different natural disaster scenarios
(requiring scientific expertise in specialized fields with substantial local
knowledge, e.g. hydrological assessment for flood forecasting given the
varying intensity and distribution of rainfall over a river basin or catchment
area); and
(c) Communication of warnings: efficient information flow, an operation
increasingly automated through the use of computers and information
technology, between forecasters and key decision-makers, among
stakeholders and operational units, as well as to user communities at risk (in
most cases coordinated by a body comprising government departments,
emergency response agencies and NGOs).
Underpinning all three key components is the human resources and capacity
required in developing, operating and maintaining the EWS. In general, technical
capacity needs to be built up in the following aspects:
(a) awareness of warnings and alerts by users and recipients;
(b) updated and well-maintained observational networks and systems;
(c) usage of satellite/radar data, particularly for rainfall estimates;
(d) application of global NWP data;
(e) human resources and training, especially for forecasters and other technical
support staff at the national/provincial levels;
(f) hydrological modelling capacity;
(g) power supply assurance during inclement weather situation;
(h) coordinated reservoir management for flood control;
(i) scenario assessment for risk management purpose;
(j) communication between provinces and communes, and among technical
professionals, emergency units and key decision-makers; and
(k) collaboration with academic institutes in leveraging resources for training
and research support.
With emphasis on urban flooding and coastal inundation, the forecasting and
warning challenges are: (1) wind and storm surge associated with tropical cyclones
over the coastal region; (2) quantitative precipitation estimates and forecasts (QPE
and QPF); (3) communication of warnings as well as forecast uncertainty; and (4) the
need for effective large scale monitoring and forecasting capability in support of small
scale region-specific EWS.
There is apparently limited capacity in hydrological forecasting techniques as
well, relying mostly on statistical methods and lacking the more sophisticated
approaches based on hydrological modelling. Inefficient information flow between
87
the meteorological and hydrological communities can also sometimes lead to delays
and misjudgment in flood risk assessment.
8.2 General Training Resources for Capacity-building
A major barrier to capacity-building in the region is the limited language
proficiency such as English to facilitate an accelerated process of learning and to take
advantage of technology transfer from abroad. While opportunities exist for
overseas exposure, relatively few can really benefit. Under the circumstances, the
more likely course would be: (1) establishing a regional EWS training hub in East
Asia such that developing countries in the region may have the opportunity to become
familiar with the latest technology available; (2) through a combination of
“train-the-trainer” and “learning-by-doing” approaches, technical staff with sufficient
English proficiency to be trained and re-trained at the regional hub on short-term
attachment and assignment; and (3) through regular planned programmes, the trained
trainer to train up local staff and technicians. The conceptual idea of a regional EWS
hub may require collaboration with relevant WMO programs and funding support
from potential donors.
Admittedly, for many Typhoon Committee Members, limited technical capacity
remains an area of concern at both the national and provincial levels where tight
manning situations also inhibit extended staff release for local, regional as well as
overseas training opportunities. Progress will inevitably take time, but the hope is
that relevant knowledge, skill and techniques will become more widely available as
the national capacity is built up, and that pilot projects strategically aimed at specific
regions of priority (e.g. the WMO Severe Weather Forecast Demonstration Project for
South East Asia countries in Viet Nam, Cambodia, Lao PDR and Thailand) will help
to establish much needed facilities and resources in disaster-prone areas.
Apart from taught courses and attachment training in other countries, expert
missions and visits to target regions, as well as better utilization of online resources
are also viable alternatives that would help to build up the technical capacity of
operational personnel. Expert missions are most fruitful if strategic long-term
collaboration can be established with advanced meteorological and hydrological
centres, in many cases through sponsorship by international funding agencies. Such
missions allow experts to get familiarized with local conditions and propose solutions
to address specific needs. Follow-up actions can then be pursued for technology
transfer or tailored training.
Even though online training resources are becoming more widely available
these days (e.g. NOAA’s COMET modules), there is a general feeling that such
material is still very much under-utilized. Admittedly, these resources are often
based on more sophisticated and well-equipped conditions in the developed world.
88
However, the underlying principles and concepts can still be very useful for general
education purpose. If English proficiency is a hurdle, then it may be useful to set up
local study groups to work on the basic translation of such online resources, or
facilitate the learning process through interpretation by members in the study groups
who have a better understanding of the English language.
8.3 Training Strategies under the Typhoon Committee
8.3.1 Existing resources under Training and Research Coordination Group
(TRCG)
TRCG plans to have more cross-cutting training and research initiatives among
the meteorological, hydrological and DRR components of the Typhoon Committee,
including the organization of joint meetings/activities. To maintain continuity and to
encourage sustainable capacity building, follow-up activities will be pursued where
feasible in support of training/research topics covered in roving seminars and ad hoc
workshops; e.g. through more purposely planned research fellowship projects. For
high priority project (e.g. UFRM) and research areas, the setting up of task forces
comprising nominated experts from Members or through the mobilization of the
TRCG list of resource persons can also be explored.
Roving seminars are primarily for capacity building purposes, with
knowledgeable experts visiting Members’ countries, and delivering lectures and
training on subjects of topical interest. With financial support from the Typhoon
Committee Trust Fund (TCTF), the travelling schedule of the annually held roving
seminars aims to cover and serve as many Members as possible. For any seminar
venue, participants from Members in the neighbouring regions are also invited and
encouraged to attend.
Research fellowships serve to promote operational development works through
the attachment of visiting scientists based on short-term bilateral arrangements, often
with funding and logistic support offered by host Members. One of the merits of the
scheme is that the visiting fellow has a chance to work closely with experienced
scientists at the host’s facilities. This provides an opportunity to acquire knowledge
and skill with hands-on experience, and to transfer technology and latest research
findings back home for operational applications.
8.3.2 Initiatives in support of UFRM
To best utilize the resources available to the Typhoon Committee and to take
advantage of the mechanisms already established under the TRCG framework, past
and anticipated training and research initiatives in support of UFRM are highlighted
89
as follows:
Roving Seminar 2011 was organized with the theme “Heavy Rain and Flood
Hazards associated with Landfalling Tropical Cyclones”, with participants
from the UFRM pilot cities also attending. Key results and suggestions
arising from the seminar were presented and discussed in a one-day
QPE/QPF workshop held in conjunction with the Integrated Workshop in
late 2011.
The Sentinel Asia Typhoon Committee Urban Flood DRR Workshop was
successfully held in Macao China on 27 Feb – 2 Mar 2012.
Research fellowships with emphasis on QPE/QPF and relevant technology
transfer will be actively pursued and promoted where feasible.
More strategic planning in support of UFRM and other related cross-cutting
initiatives will be taken into consideration in formulating the new 4-year
cycle of TRCG work plan (2014 – 2017).
Based on the feedback gathered and the experience gained from the pilot phase,
more long-term strategic planning for continuing training and research in support of
Members’ capacity-building can be mapped out. Guidance material and best
practices can then be compiled and updated for reference as the UFRM project
gradually extends to other cities within the Typhoon Committee area.
90
9. Conclusion and Way Forward (Susan and Liu)
Urban flood risks keep an increasing trend in the developing countries in the
Asian-Pacific region. During the process of rapid urbanization, the cities accumulate
not only high density of population and properties, but also the risks. Although every
city has paid some efforts in protection against urban floods, as a matter of fact, the
gaps between the higher security demands and worse risk situations are extending.
There are pressing needs to give security against urban floods through the capacity
building in enhancing Urban Flood Risk Management (UFRM).
Many of the cities in the Typhoon Committee Area (TCA) are suffered from
different urban flood issues, and some data showed that urban flood events increased
in recent years. Great achievements have been made on the structural measures for
urban flood management in the TCA. And it was also proved that flood warning
system was a very effective non-structural measure for avoiding damages caused by
urban floods.
Flood risk management is an integrated approach to the development of flood
risk strategies that involve engineering, settlement, development, public
administration, community-based strategies and land use planning with environmental
consideration. The best and holistic approach in URFM is an integration of
structural and non-structural measures. Although the best solution may be condition
specific, which may depend on factors such as climate, topography, geology and the
level of development or urbanization. In recent years, soft approaches such as
monitoring and forecasting, flood risk and inundation mapping, effective early
warning system and enhanced education and awareness have proven to be effective.
Structural measures for flood control and drainage are still key measures to
reduce flood risk especially in urban areas at present stage for most of the cities in the
developing countries. While, the reasonable disposition and operation of the flood
control and drainage system will put forward higher requirement for the development
of the information management system, and flood risk assessment system and
decision support system.
Recent survey to some TC Members on the improvement of urban flood risk
management suggests the following needs Increase of budget allocation;
Enhancement of the awareness and preparedness of communities in flood-prone areas;
Enhancement of flood control planning in urban area; River management measures
(maintenance, management and quality improvement of levees, maintenance of flood
control channel and facilities). Among these needs, increasing budget allocation was
regarded as the most important one in urban flood management. It should be
emphasized that the budget should be properly reallocated for both structural and
nonstructural measures, such as flood forecasting and warning system.

91
The major challenges for the improvement of urban flood monitoring and
forecasting/warning system in the TCA included needs for Development of real-time
flood forecasting system; Utilization of diversified data such as radar precipitation
data, weather forecast, topographical data and land-use data; Announcement of
evacuation advisory and instruction, distribution of flood information to local
residents; Producing real-time flood-inundation warning maps for cities; and
Establishment of a community based flood early warning system.
92
REFERENCES
[1] Adhas K. Jha, Robin Bloch, Jessica Lamond. Cities and Flooding : A Guide to
Integrated Urban Flood Risk Management for the 21st Century. TWB & GFDRR.
Feb 2012.
[2] Crichton, D. The Risk Triangle. In: Ingleton, J. [Ed.]. Natural Disaster
Management. Tudor Rose. 102-103. 1999.
[3] Ivan Andjelkovic. Guidelines on Non-Structural Measures in Urban Flood
Management. IHP-V, Technical Documents in Hydrology , No. 50, UNESCO,
Paris, 2001.
[4] USAID & ADPC. Urban Governance and Community Resilience Guides, World
Disaster Reduction Campaign on Making Cities Resilient, UNISDR, 2010
[5] WMO & GWP. Urban Flood Risk Management: A Tool for Integrated
Management. Associated Programme on Flood Management. March 2008.
[6] World Bank. 2008. Climate Resilient Cities: 2008 Primer Reducing
Vulnerabilities to Climate Change Impacts and Strengthening Disaster Risk
Management in East Asian Cities. Washington, DC: World Bank, FGDRR and
UNISDR.
[7] Xiaotao Cheng. Changes of Flood Control Situations & Adjustments of Flood
Management Strategies in China, Water International, Vol.30, Number 1, March
2005.
[8] Xiaotao Cheng. Recent Progress in Flood Management in China, Irrigation and
Drainage, Vol.55: S75-S82, July 2006.
[9] Xiaotao Cheng. Urban Flood Prediction and its Risk Analysis in the Coastal Areas
of China. China Water Power Press, 2009.
[10] World Meteorological Organization, 2009, Guide to Hydrological Practices,
Sixth edition, ,WMO-No. 168, Geneva, Switzerland.
[11] U. S. Geological Survey, 1982, Measurement and Computation of Stream flow :
Volume 2. Computation of Discharge, Geological Survey Water-Supply Paper
2175, Washington .
[12] Hydrological Survey Center of the Republic of Korea, 2012, Guideline of
Hydrological Survey, Seoul.
93
[13] Han River Flood Forecasting Office, 2012, Flood Forecasting Manual, Seoul, the
Republic of Korea.
[14] Cheng Xiaotao, 2001. Prevention of Urban Water Disasters- Changes of Flood
Control Situation in China & Adjustments of Flood Management Strategies in 21
Century, China Water Conservancy, 7.
[15] Cheng Xiaotao,2008. Recent Progress in Flood and Drought Management
Research, Journal of China Institute of Water Resources and Hydropower
Research, 6(3).
[16] Liu, Z., 2009: Strategies and countermeasures for integrated urban flood
management in China. Paper presented at the Economic and Social Commission
for Asia and the Pacific Expert Group Meeting on Innovative Strategies towards
Flood Resilient Cities in Asia-Pacific, Bangkok, 21-23 July 2009. Available from
www.unescap.org/idd/events/2009_EGM-DRR/China-Zhiyu-Liu-Innovative-Stra
tegies-for-Effective-Urban-Flood-Management-in-China-Liu-final.pdf.
[17] Information and Communications Technology and Disaster Risk Reduction
(IDD), ESCAP, 2010: Water Resources Series No. 86 - Developing Innovative
Strategies for Flood-resilient Cities. United Nation publication printed in
Thailand, 29 pp.
[18] MunichRe, 2005. Megacities – Megarisks: Trends and Challenges for Insurances
and Risk Management, http://www.munichre.com/publications/302-04271_en.
pdf.
[19] National Bureau of Statistics of China (NBSC), 2009. The statisticsgazette on
nationaleconomy and societydevelopment in 2008.
[20] WMO, 2008. Urban Flood Risk Management - A Tool for Integrated Flood
Management. APFM Technical Document No. 11, Flood Management Tools
Series.
[21] Climate Risks Adaptation in Asian Coastal Cities: A Synthesis Report, 2010.
ADB, JICA and WB.
[22] Matsumoto Asian Monsoon Years (2007-2012): Vietnam Philippines Rainfall
Experiment 2010 (VPREX2010).
[23] UNESCAP, 2011. Fifth Asia-Pacific Urban Forum, Bangkok, Thailand.
[24] ADPC. Urban Governance and Community Resilience Guides: Risk Assessment
in Cities. 2010.
[25] Crichton, D. “The Risk Triangle”, pp. 102-103 in Ingleton, J. (ed.), Natural
Disaster Management, Tudor Rose, London. 1999.
[26] Sayers, P.B., B.P. Gouldby, J.D. Simm, I. Meadowcroft, and J. Hall. Risk,
94
Performance and Uncertainty in Flood and Coastal Defence – A Review. R&D
Technical Report FD2302/TR1 (HR Wallingford Report SR587), Crown
copyright, London, U.K. See also Sayers, P., J. Hall, and I. Meadowcroft. 2002
(May). “Towards Risk-Based Flood Hazard Management in the U.K.”.
Proceedings of the Institution of Civil Engineers, vol. 150, special issue 1, pp.
36-42. 2002.
[27] UNISDR. Terminology on Disaster Risk Reduction, http://www.unisdr.org/we/
inform/erminology, 2009.
[28] WMO & GWP. Urban Flood Risk Management: A Tool for Integrated Flood
Management, APFM Technical Document No.11, Flood Management Tools
Series. 2008.
[29] Cheng Xiaotao. Urban Flood Prediction and its Risk Analysis in the Coastal
Areas of China. China WaterPower Press, 2009.
95
Appendix A
Good practice on UFRM from model cities study
Three model cities, namely Ansung of the Republic of Korea, Shanghai of China and
Yokohoma of Japan, were selected for the sake of collecting good practices on UFRM this
study.
a. Developing Comprehensive Urban Flood Management Strategies
In China, risk management ideas have been introduced into flood prevention and
mitigation since 2003. A comprehensive strategy has been taken to manage urban flood,
which is to combine strategies for flood risk and hazard mitigation, urban development, and
countermeasures coping with climate change Flood risk management and disaster recovery
and compensation are more stressed (Cheng, 2001, 2008). In flooding areas, community
management is introduced to regulate human activities. Appropriate and feasible flood control
standards were established together with flood prevention schemes and flood regulation plans,
where a variety of measures are taken to ensure safety under the established flood control
standard and minimize loss caused by exceeding-standard flood. Meanwhile, efforts are also
being taken to utilize storm water as a complementary resource for water supply.
In Japan, comprehensive flood disaster prevention plans have been developed based on
related acts. Preventive measures to basin such as installation of retarding basins and
discharge ponds are promoted.
b. Highlighting Land Use Planning and Regulation
All the three model cities have taken the land use regulation as measures for avoiding
damages by urban flood. In Yokohama city, according to the “Act on Countermeasures
against Flood Damage of Specified Rivers Running Across Cities”, developers must construct
rainwater storage and infiltration facilities if the area is over 1,000 m3 and owners of
discharge ponds over 100 m3 are obliged to maintain their function. The city has an ordinance
to coordinate development by private sectors with city planning to promote creation of ideal
urban environment. Based on the ordinance, the city directs developers to construct rainwater
runoff control facilities and maintain open spaces to grow trees. Besides, Yokohama city
designates “urbanization promotion area” and “urbanization restricted area”, according to the
city planning act. The designation functions as land use control to prevent development of
areas to retain their function to flood damage alleviation such as conservation of forests,
agricultural lands, and so on.
c. Improvement of Meteor-Hydrological Monitoring, Forecasting and Warning
In Korea, the National Institute of Meteorology Research (NIMR) uses MAPLE (McGill
Algorithm for Precipitation nowcasting and Lagrangian Extrapolation) method to combine the
point rainfall observed at the rain gages and the rainfall estimated by meteorological radar for
96
better estimation of areal rainfall. This technique has been used in improving urban flood
forecasting and warning for Ansung city. Operationally, hydrologic data wirelessly
transmitted in real-time from the observation stations are sent and processed automatically
into the database of Ansung Stream Flood Control Office. After that, the water level of rivers
and flooding scale are calculated for the flood forecasting areas by using a distributed
rainfall-runoff model. When water level rises over a pre-defined threshold, flood-warning or
flood-alarm will be announced to the public through the mass media (broadcast, newspaper,
etc) and related agencies so that citizens can prepare and evacuate against flood.
In China, an integrated typhoon and heavy rain Monitoring &Detection System was
developed and has been put into operation in Shanghai Meteorology Bureau (SMB) for years.
Based on WRF (Weather Research Forecast) meso-scale model a seamless prediction system
has been established by Shanghai Typhoon Institute (STI) and used in routine operation
named STI-WARR for 1-12h, STI-WARMS for 3 days and STI-EnWARMS for 5 days
forecast, respectively. Some new numerical techniques for forecasting are developed, such as
digital filter, cloud analysis, ADAS-3DVAR and hourly assimilation cyclel. Except for
rainfall some special products are output from it, such as radar reflectivity, wind profile,
lightning index, and visibility and satellite-like. Also, STI is developing some new numerical
techniques for TC forecasting such as BDA (bogus data assimilation) technique, satellite data
assimilation, GRAPES_TCM TC model, relocation cycle, ensemble and air-land-sea coupled
model, with them the track and intensity forecasts are significantly improved.
d. Remote Sensing and GIS Application in Flood Hazard/Risk Mapping
A variety of Flood hazard/risk maps have been developed in all the three model cities,
which contribute to guidelines for land use planning and strengthening the capacity buildings
for specific regions.
Flood hazard mapping in Shanghai consists of the one for downtown and Huangpu river
flood-walls and the other one for the coastal area. Flood hazard mapping for the downtown
area can be realized by using 2-D urban rainstorm flood simulation models to generate
probable flood inundating scope, inundating duration and process of dyke failure or city
rainstorm waterlogging under the condition of shanghai affected by rainstorm, tide and flood
from upstream according to the most likely and harmful principles, and it can be implemented
on GIS environment. Besides, flood hazard affected by tide in coastal area can be analyzed
through the principle of hydrology and geography from the angel of genetic analysis;
accordingly flood hazard mapping can be implemented. Additionally, another kind of flood
hazard map is provided by the Shanghai Meteorology Bureau, in which the factors such as
regional total rainfall, drainage capacity, and vulnerabilities were integrated to get the
comprehensive risk map.
In Yokohama city, publication of flood-prone area maps was accomplished by the
national government in 2007. Publication of flood hazard maps for each ward by Yokohama
city for riverine flooding, with subsidy from the national government and the prefectural
97
government.
In Ansung city, a flood hazard map of the Ansung Stream basin is being developed by
MLTMA (Ministry of Land, Transport and Maritime Affairs) of Korea, which shows
possibility for risk from flood.
e. Dissemination of Flood Warning Information to Individuals
Various public-level dissemination platforms have been established in each model city,
such as the mass media, government spokesman system and the Internet.
In Korea, when there is a possibility of the damage to lives and properties from flooding,
the announcement of flood-warning or flood-alarm will be issued to the public for prevention
or reduction of damages. When water level rises over defined point, the flood-warning or
flood-alarm will be announced to the public through the mass media (broadcast, newspaper,
etc) and related agencies so that citizens can prepare and evacuate against flood.
In Japan, Flood advisories, warnings and forecasts are transmitted to municipalities via
prefecture. FAX information from MLIT office is also sent to prefecture, cities and wards.
Yokohama city disaster prevention information system sends information directly to residents
by e-mailing information to mobile phones, and this information is also provided by the
Internet, CATV or sirens. The MLIT office disseminates alert information to registered users
by e-mail when rainfall, water level, inundation depth exceed certain values. Kohoku ward
provide information by internet fax to underground facilities that are mainly used by aged
people and infants.
In Shanghai, the spokesman system was developed by the flood control headquarters to
ensure authorized announcing about flood-related information timely, accurately, objectively
and roundly. Weather departments in SMB provide special services through multi agency
cooperation involving governmental departments, and communications departments facilitate
the distribution of early warning information in a timely fashion. The Public-level
Dissemination Platform is effectively established and in operation in Shanghai. The first
community warning light system of the nation has been constructed in Baoshan district,
Shanghai. The system will be extended to the tallest buildings in each district. Cell phone
massage dissemination mechanism for serious disasters has been implemented. Public
warning dissemination network includes public electronic screens, billboard TV screens, and
electronic road signs.
98
Appendix B
Information on the products in the forecasting, monitoring, analyzing and
warning procedures
a) NWP outputs
Techniques introduced in the Good Practices
・A seamless prediction system used in the routine operation forecast established
by Shanghai Typhoon Institute (STI) based on WRF meso-scale model, named
STI-WARR for 12hours, STI-WARMS for 3 days and STI-EnWARMS for 5
days forecast respectively in Shanghai. Model outputs in the webpage of
WMO Typhoon Landfall Demonstration Project (http://tlfdp.typhoon.gov.cn/
index.php?controller=listpic&pid=58);
・High resolution model named STI-WARR (STI WRF RAPID REFRESH) by
STI in Shanghai.
Other information
・NWP grid point value (GPV) at each meteorological center’s server under the
framework of WMO (ex. WIS Portal - GISC Tokyo: http://www.wis-jma.go.jp/
and Beijing WIS Portal: http://wisportal.cma.gov.cn/wis/);
・NWP models used by the Typhoon Committee Members in the Chapter 3 of the
Typhoon Committee Operational Manual (TOM http://www.wmo.int/pages/
prog/www/tcp/operational-plans.html);
・WMO Technical Progress Report on the Global Data-Processing and
Forecasting System (GDPFS) and Numerical Weather Prediction (NWP)
Research for 2010 (http://www.wmo.int/pages/prog/www/DPFS/Progress
Reports/2011/2010_GDPFS-NWP.html);
・NWP models operated by Hong Kong Observatory (HKO) : Operational
Regional Spectral Model (ORSM) and Non-Hydrostatic Model (NHM) shown
in http://www.hko.gov.hk/publica/reprint/r882.pdf. and that of NHM in
http://www.hko.gov.hk/publica/reprint/r882.pdf.;
・NWP models operated by Japan Meteorological Agency (JMA) : Global
Spectral Model and Meso-Scale Model in (http://www.jma.go.jp/jma/jma-eng/
jma-center/nwp/nwp-top.htm, http://www.jma.go.jp/jma/jma-eng/jma-center/
rsmc-hp-pub-eg/techrev/text11-1.pdf) Meso-Scale Model operated by JMA in
(http://www.jma.go.jp/jma/ jma-eng/jma-center/nwp/nwp-top.htm);
・Storm surge model for TCA operated by JMA in the Numerical Typhoon
Prediction Website (https://tynwp-web.kishou.go.jp/) and (http://www.jma.
go.jp/jma/jma-eng/jma-center/rsmc-hp-pub-eg/techrev/text11-3.pdf,
http://www.wmo.int/pages/prog/www/DPFS/ProgressReports/);
99
・NWP models operated by Korean Meteorological Administration (KMA) :
Global Prediction Model (GDAPS), Regional Prediction Model (RDAPS) and
Regional Tide/Surge Model (RTSM) in (http://web.kma.go.kr/eng/biz/
forecast_02.jsp, http://www.ral.ucar.edu/jnt/events/wgne27/presentations/mon/
KMA_CentreRep_27thWGNE.pdf), KLAPS (Korea Local Analysis and
Prediction System) with 5km spatial resolution (http://app.nimr.go.kr/
radar/Doc/11th_workshop/ session/f01.pdf) and VDRAS (Variational Doppler
Radar Assimilation System), specialized system for Seoul Metropolitan area
with 1km resolution (http://app.nimr.go.kr/radar/Doc/11th_workshop/session/
p05.pdf, http://ral.ucar.edu/projects/wind_energy_workshop/presentations/
VDRAS_for_Wind_Ramp_Nowcasting_Sun_26.pdf);
・Forecast model prediction for South China Sea region developed by KMA
(http://www.kma.go.kr/ema/nema03/rall/index.jsp);
・NWP maps CMA, KMA or JMA global models in the Numerical Typhoon
Prediction Website of Regional Specialized Meteorological Center (RSMC)
Tokyo – Typhoon Centre (https://tynwp-web.kishou.go.jp/) and WMO Typhoon
Landfall Demonstration Project (http://tlfdp.typhoon.gov.cn/index.php?
controller=listpic&pid=58) and Members websites);
・JMA upper level charts are shown in http://www.jma.go.jp/jp/metcht/kosou.
html;
・Information provided under the Severe Weather Forecasting Demonstration
Project ( SWFDP) in South-east Asia in http://www.wis-jma.go.jp/
swfdp/ra2_swfdp_sea.html and http://www.kma.go.kr/ema/nema03/swfdp/
index.jsp.
b) Typhoon track forecast
Techniques introduced in the Good Practices
・GRAPES_TCM TC model, etc. developed by STI in Shanghai.
Other information
・Information on the track forecast used by TC Members in Chapter 3 of the
TOM;
・Examples of probability maps of strong wind distribution by JMA in
http://www.jma.go.jp/jp/typh/typh_prob.html;
c) Ensemble prediction system (EPS)
Techniques introduced in the Good Practices
・STI-EnWARMS by STI in Shanghai.
Other information
・Information on the NWP EPS models in the WMO Technical Progress Report
on the GDPFS and NWP Research for 2010;
100
・Ensemble tropical cyclone track forecasts provided by WMO North Western
Pacific Tropical Cyclone Ensemble Forecast Project (NWP-TCEFP) in
http://tparc.mri-jma.go.jp/cyclone/login.php, and provided by WMO Typhoon
Landfall Demonstration Project in
http://tlfdp.typhoon.gov.cn/index.php?controller=listpic&pid=58;
・Consensus method applied to nine NWP centers’ track forecasts in the
Numerical Typhoon Prediction Website of RSMC Tokyo
(https://tynwp-web.kishou.go.jp/);
・Ensemble TC Strike Probability Map provided by WMO NWP-TCEFP in
http://tparc.mri-jma.go.jp/cyclone/login.php, and provided by WMO Typhoon
Landfall Demonstration Project in
http://tlfdp.typhoon.gov.cn/index.php?controller=listpic&pid=58;
・Multi-model (11 models) ensemble prediction developed by KMA in
http://web.kma.go.kr/eng/weather/typoon/prediction.jsp.
d) Weather forecast guidance
Other information
・Information on the forecast guidance in the WMO Technical Progress Report on
the GDPFS and NWP Research for 2010.
e) Quantitative Precipitation Forecast (QPF)
Techniques introduced in the Good Practices
・MAPLE (McGill Algorithm for Precipitation nowcasting and Lagrangian
Extrapolation) method developed by National Institute of Meteorology
Research (NIMR) in KMA (Korea Metrological Agency) and McGill
University in Ansung City in Korea
( ftp://ftp.wmo.int/Documents/PublicWeb/dra/rap/regionII/technical_conferenc
e/daegu2010/4-5_Chang_Korea.pdf )
Other information
・Very-Short-Range Forecasting Systems in the WMO Technical Progress Report
on the GDPFS and NWP Research for 2010
(http://www.wmo.int/pages/prog/www/DPFS/ProgressReports/2011/2010_GD
PFS-NWP.html);
・SWIRLS (Short-range Warning of Intense Rainstorms in Localized Systems) by
HKO (http://www.hko.gov.hk/nowcast/prd/api/index_e.htm);
・Very-short-range Forecasting of precipitation by JMA
(http://www.jma.go.jp/jma/jma-eng/jma-center/rsmc-hp-pub-eg/techrev/text13
-2.pdf and images are shown in http://www.jma.go.jp/en/radame/;
・Satellite-based Tropical Rainfall Potential (TRaP) and Ensemble Tropical
Rainfall Potential (eTRaP) in
http://www.ssd.noaa.gov/PS/TROP/trap-img.html and
101
http://www.ssd.noaa.gov/PS/TROP/etrap.html.
f) Storm surge model and guidance.
Techniques introduced in the Good Practices
・The Storm Surge Early Warning Subsystem used in Shanghai Meteorology
Bureau, storm surge forecasting model using Princeton Ocean Model (POM
http://www.aos.princeton.edu/WWWPUBLIC/htdocs.pom/) and Estuarine
Coastal and Ocean Model (ECOM
http://woodshole.er.usgs.gov/operations/modeling/ecomsi.html) in Shanghai.
Other information
・JMA’s storm surge prediction model and guidance in
http://www.jma.go.jp/jma/jma-eng/jma-center/rsmc-hp-pub-eg/techrev/text11-
3.pdf and the explanation in the SSWS page in the Numerical Typhoon
Prediction Website of RSMC Tokyo.
g) Surface observation by manned stations
Other information
・Surface observations (SYNOP, SHIP) are available at each meteorological
center’s servers under the framework of WMO (ex. WIS Portal - GISC Tokyo:
http://www.wis-jma.go.jp/ and Beijing WIS Portal:
http://wisportal.cma.gov.cn/wis/).
h) Automated weather stations (AWS)
Techniques introduced in the Good Practices
・98 auto-weather stations, 120 rain gauges installed in Shanghai under the
Monitoring & Detection System.
Other information
・Regional Weather in Hong Kong by HKO in
http://www.hko.gov.hk/contente.htm#, Auto Meteorological Data Acquisition
System (AMeDAS) by JMA in http://www.jma.go.jp/en/amedas/, and by
KMA in http://web.kma.go.kr/eng/biz/observation_01.jsp
i) Upper-air observation by radiosonde and wind profiler for the overview of
atmospheric structure
Other information
・Upper observations (TEMP) are available at each meteorological center’s
servers under the framework of WMO (ex. WIS Portal - GISC Tokyo:
http://www.wis-jma.go.jp/ and Beijing WIS Portal:
http://wisportal.cma.gov.cn/wis/).
102
j) Satellite observation and analysis
Techniques introduced in the Good Practices
・12 meteorological satellite receiving systems in Shanghai under the Monitoring
& Detection System.
Other information
・CMA Fengyun satellite in
http://www.nsmc.cma.gov.cn/NewSite/NSMC_EN/Home/Index.html
・JMA MTSAT in http://www.jma.go.jp/jp/gms/,
http://mscweb.kishou.go.jp/index.htm
・KMA COMS in http://www.kma.go.kr/weather/images/satellite_basic03.jsp
・Tropical cyclone satellite analysis operated by Members are summarized in the
documents in WMO International Workshop on Satellite Analysis of Tropical
Cyclones http://www.wmo.int/pages/prog/www/tcp/IWSATC.html
k) Radar observation
Techniques introduced in the Good Practices
・3 Doppler weather radars installed in Shanghai under the Monitoring &
Detection System.
Other information
・CMA radar composite maps in
http://www.weather.com.cn/static/en_product.php?class=JC_RADAR_CHN_JB
・HKO radar images in http://www.hko.gov.hk/wxinfo/radars/radar.htm
・JMA radar composite maps in http://www.jma.go.jp/en/radnowc/
・KMA radar composite maps in
http://www.kma.go.kr/weather/images/rader_composite_ppi0.jsp
・Department of Meteorology and Hydrology (DMH) of LAO P.D.R radar images
in http://dmhlao.etllao.com/index.html
・Malaysian Meteorological Department (MMD) radar composite maps in
http://www.met.gov.my/index.php?option=com_weathersatellite&purpose=R
ADAR-MALAYSIA&Itemid=911
・Thai Meteorological Department (TMD) radar images in
http://www2.tmd.go.th/radar/pkt120Loop.php
・Meteorological Service Singapore (MSS) radar images in
http://www.weather.gov.sg/wip/c/portal/layout?p_l_id=PUB.1023.5
l) Quantitative Precipitation Estimation (QPE)
Other information
・Very-Short-Range Forecasting Systems in the WMO Technical Progress Report
103
on the GDPFS and NWP Research for 2010
(http://www.wmo.int/pages/prog/www/DPFS/ProgressReports/2011/2010_GD
PFS-NWP.html)
・SWIRLS (Short-range Warning of Intense Rainstorms in Localized Systems) by
HKO (http://www.hko.gov.hk/nowcast/prd/api/index_e.htm)
・Radar/Raingauge-Analyzed precipitation by JMA in
http://www.jma.go.jp/jma/jma-eng/jma-center/rsmc-hp-pub-eg/techrev/text13-
2.pdf and images are shown in http://www.jma.go.jp/en/radame/
・Satellite-based precipitation for the flood monitoring operated by Sentinel Asia
in
https://sentinel.tksc.jaxa.jp/sentinel2/subsetControl.action?subset_name=Flood
Monitoring
m) Synoptic weather maps
Other information
・CMA weather charts in
http://www.nmc.gov.cn/publish/observations/weatherchart-h000.htm
・HKO weather charts in http://www.hko.gov.hk/wxinfo/currwx/wxcht.htm
・JMA weather charts in http://www.jma.go.jp/en/g3/ for surface and
http://www.jma.go.jp/jp/metcht/kosou.html for upper levels
n) NWP model assimilation
Other information
・Monitoring of synoptic weather maps as outputs of NWP model assimilation in:
JMA upper level charts are shown in
http://www.jma.go.jp/jp/metcht/kosou.html
o) Hydrological index
Other information
・Soil water index and runoff index operated by JMA in
http://www.jma.go.jp/jma/jma-eng/jma-center/rsmc-hp-pub-eg/techrev/text13-
2.pdf