Embed Size (px)
Citation preview
7/29/2019 Groupe Steria Sca 2011 Half Year Financial Report Ve 01
http://slidepdf.com/reader/full/groupe-steria-sca-2011-half-year-financial-report-ve-01 1/40
creativity_ simplicity_ independance_ respect_ open mindedness_
2011 Half-Year Financial Report _
Groupe Steria SCA
7/29/2019 Groupe Steria Sca 2011 Half Year Financial Report Ve 01
http://slidepdf.com/reader/full/groupe-steria-sca-2011-half-year-financial-report-ve-01 2/40
Page 2 / 40
GROUPE STERIA SCAPartnership limited by shares (Société en Commandite par Actions ) with a share capital of €30,137,434
Head office: 12, rue Paul Dautier – 78140 Vélizy Villacoublay344 110 655 RCS Versailles
FINANCIAL REPORTFOR THE HALF-YEAR ENDED 30 JUNE 2011
I. Management Report for the half-year ended 30 June 2011
A – Major events during the first six months of the year and their impact on the half-year financial statements
Key items:
• Like-for-like revenue increased by 3.4% in the first half of 2011 relative to the first half of
2010.
• Revenue growth saw a marked acceleration during the second quarter to +5.6% compared
with +1.3% during the first quarter thanks to a continued positive dynamic in Continental
Europe and a return to growth in the United Kingdom.
• The operating margin1
was stable versus the first half of 2010, leading to an operating
margin rate of 6.7%.
• First half 2011 attributable net income increased by 15.5% to €38.3 million.
• The pipeline, measured as a multiple of revenues, saw growth across all regions and stood
at 2.5 times versus 2.2 times at the end of June 2010.
On July 28, 2011, the Supervisory Board of Groupe Steria SCA examined the consolidated financial
statements submitted by the General Management.
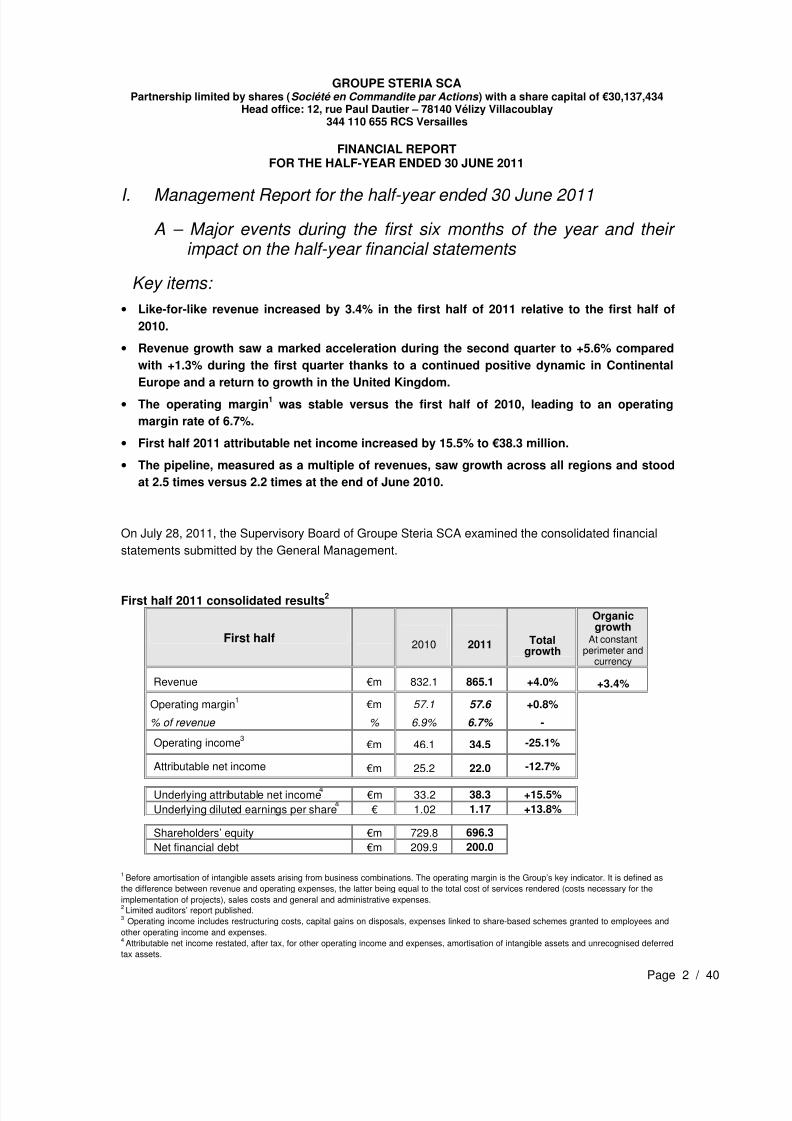
First half 2011 consolidated results2
First half 2010 2011 Total
growth
Organicgrowth
At constantperimeter and
currency
Revenue €m 832.1 865.1 +4.0% +3.4%
Operating margin1
% of revenue
€m
%
57.1
6.9%
57.6
6.7%
+0.8%
-
Operating income3 €m 46.1 34.5 -25.1%
Attributable net income €m 25.2 22.0 -12.7%
Underlying attributable net income €m 33.2 38.3 +15.5%
Underlying diluted earnings per share € 1.02 1.17 +13.8%
Shareholders’ equity €m 729.8 696.3
Net financial debt €m 209.9 200.0
1Before amortisation of intangible assets arising from business combinations. The operating margin is the Group’s key indicator. It is defined as
the difference between revenue and operating expenses, the latter being equal to the total cost of services rendered (costs necessary for the
implementation of projects), sales costs and general and administrative expenses.2Limited auditors’ report published.
3 Operating income includes restructuring costs, capital gains on disposals, expenses linked to share-based schemes granted to employees and
other operating income and expenses. 4Attributable net income restated, after tax, for other operating income and expenses, amortisation of intangible assets and unrecognised deferred
tax assets.
7/29/2019 Groupe Steria Sca 2011 Half Year Financial Report Ve 01
http://slidepdf.com/reader/full/groupe-steria-sca-2011-half-year-financial-report-ve-01 3/40
Page 3 / 40
Revenue
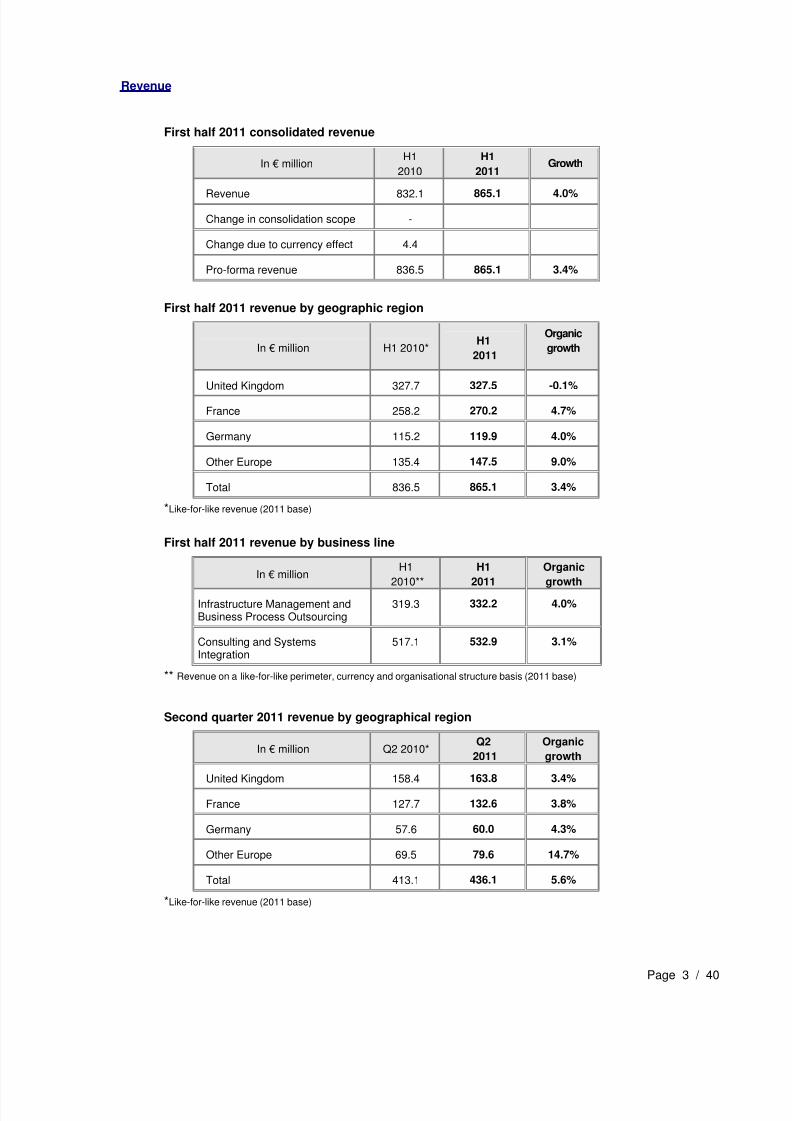
First half 2011 consolidated revenue
In € millionH1
2010
H1
2011Growth
Revenue 832.1 865.1 4.0%
Change in consolidation scope -
Change due to currency effect 4.4
Pro-forma revenue 836.5 865.1 3.4%
First half 2011 revenue by geographic region
In € million H1 2010*H1
2011
Organic
growth
United Kingdom 327.7 327.5 -0.1%
France 258.2 270.2 4.7%
Germany 115.2 119.9 4.0%
Other Europe 135.4 147.5 9.0%
Total 836.5 865.1 3.4%
*Like-for-like revenue (2011 base)
First half 2011 revenue by business line
In € millionH1
2010**
H1
2011
Organic
growth
Infrastructure Management andBusiness Process Outsourcing
319.3 332.2 4.0%
Consulting and SystemsIntegration
517.1 532.9 3.1%
** Revenue on a like-for-like perimeter, currency and organisational structure basis (2011 base)
Second quarter 2011 revenue by geographical region
In € million Q2 2010*Q2
2011
Organic
growth
United Kingdom 158.4 163.8 3.4%
France 127.7 132.6 3.8%
Germany 57.6 60.0 4.3%
Other Europe 69.5 79.6 14.7%
Total 413.1 436.1 5.6%
*Like-for-like revenue (2011 base)
7/29/2019 Groupe Steria Sca 2011 Half Year Financial Report Ve 01
http://slidepdf.com/reader/full/groupe-steria-sca-2011-half-year-financial-report-ve-01 4/40
Page 4 / 40
Second quarter 2011 activity
During the second quarter 2011, the Group enjoyed a good commercial dynamic which continued in
the month of June despite an unsettled European environment.
On a like-for-like basis, revenue growth in second quarter 2011 revenues saw a marked acceleration
to +5.6% compared with +1.3% during the first quarter of 2011. This increase was mainly explained by
a return to revenue growth in the United Kingdom and an acceleration in the revenue growth of the
Other Europe zone.
At the end of the first half 2011, the book to bill ratio stood at 1.03 (compared with 1.13 at June 30,
2010, a figure that had been significantly inflated during June 2010 by the Cleveland Police contract
amounting to €200 million).
At June 30, 2011, the pipeline, measured as a multiple of revenue, was up across all the Group’s
geographic areas and stood at 2.5 times versus 2.2 times in the previous year.
In the United Kingdom, excluding currency impact, revenue growth was in line with expectations,
returning to positive territory during the second quarter with growth of 3.4% versus the second
quarter of 2010. A significant highlight of the quarter was the first contract extension with the
Cleveland Police Authority increasing the scope of activities. This extension to the original contract
illustrates both the Group’s effectiveness in terms of service execution and the potential scope for
generating cost savings in the UK public sector via Business Process Outsourcing services. It
should also be noted that NHS SBS, Steria’s joint venture with the NHS, recorded 20.5% revenue
growth for the first half5. At June 30 2011, the book to bill ratio stood at 0.94 with the pipeline
increasing to 2.6 times revenue versus 2.3 times at June 30, 2010.
In France, organic revenue growth amounted to 3.8%. Second quarter activity remained dynamic
and was notably characterised by a strong trend in the public and financial sectors. At June 30,
2011, the book to bill ratio was similar to that of the previous year at 1.05.
In Germany, organic revenue growth was 4.3% driven by a strong dynamic in the public sector.
New orders saw a significant increase enabling the book to bill ratio to reach 1.16 at June 30,
2011 versus 0.98 in the previous year.
The Other Europe region made strong progress during the first half 2011 with like-for-like
revenue growth of 14.7%. Scandinavia, Belgium/Luxembourg and Switzerland all posted double-
digit growth rates whilst revenue in Spain decreased during the quarter. At June 30, 2011, the
book to bill ratio for the region stood at 1.09 versus 0.99 at June 30, 2010.
5NHS SBS is a joint venture 50% owned by Steria which generated revenue of €62 million in 2010. It is reported using the equity method and its
performance is therefore not fully consolidated in either Group revenue or operating margin but only 50% in net income.
7/29/2019 Groupe Steria Sca 2011 Half Year Financial Report Ve 01
http://slidepdf.com/reader/full/groupe-steria-sca-2011-half-year-financial-report-ve-01 5/40
Page 5 / 40
Results for the first half 2011
For the first half of 2011, the Group’s operating margin1
amounted to €57.6 million versus €57.1 million
in 2010, leading to an operating margin rate of 6.7%.
The other income and operating expenses for the half year notably included €7.8 million of non-recurring costs linked to the rationalisation and optimisation of premises during 2011 in France and
India within the framework of the transformation programmes implemented by the Group.
Net financial expense saw a significant improvement to -€1.7 million (versus -€9.7 million in the first
half 2010) mainly due to a marked reduction in the net cost of financing.
Attributable net income amounted to €22.0 million during the first half 2011 compared with €25.2
million in 2010. Excluding non-recurring items including those linked to the rationalisation of buildings,
attributable net income rose by 15.5% to €38.3 million.
7/29/2019 Groupe Steria Sca 2011 Half Year Financial Report Ve 01
http://slidepdf.com/reader/full/groupe-steria-sca-2011-half-year-financial-report-ve-01 6/40
Page 6 / 40
B – Outlook for the second half of 2011- Main risks and uncertainties
The Group confirms its full year 2011 guidance for organic revenue growth of between 3% and 4%
and an operating margin rate1at least equal to that of 2010.
Other than the uncertainties surrounding economic trends in the market, the main risks anduncertainties facing the Group during the second half of 2011 are presented in Section 5 of the 2010Registration Document.
C – Main transactions with related parties
Material transactions with related parties consist of remuneration paid to key management personnel
(General Manager and members of the Supervisory Board) and relations with NHS SBS, equityaccounted in the Groupe Steria consolidated financial statements. There was no major change in thenature of transactions with related parties during the first half of 2011 compared with 31 December2010 (as presented in Note 6 to the consolidated financial statements for the year ended 31December 2010).
7/29/2019 Groupe Steria Sca 2011 Half Year Financial Report Ve 01
http://slidepdf.com/reader/full/groupe-steria-sca-2011-half-year-financial-report-ve-01 7/40
Page 7 / 40
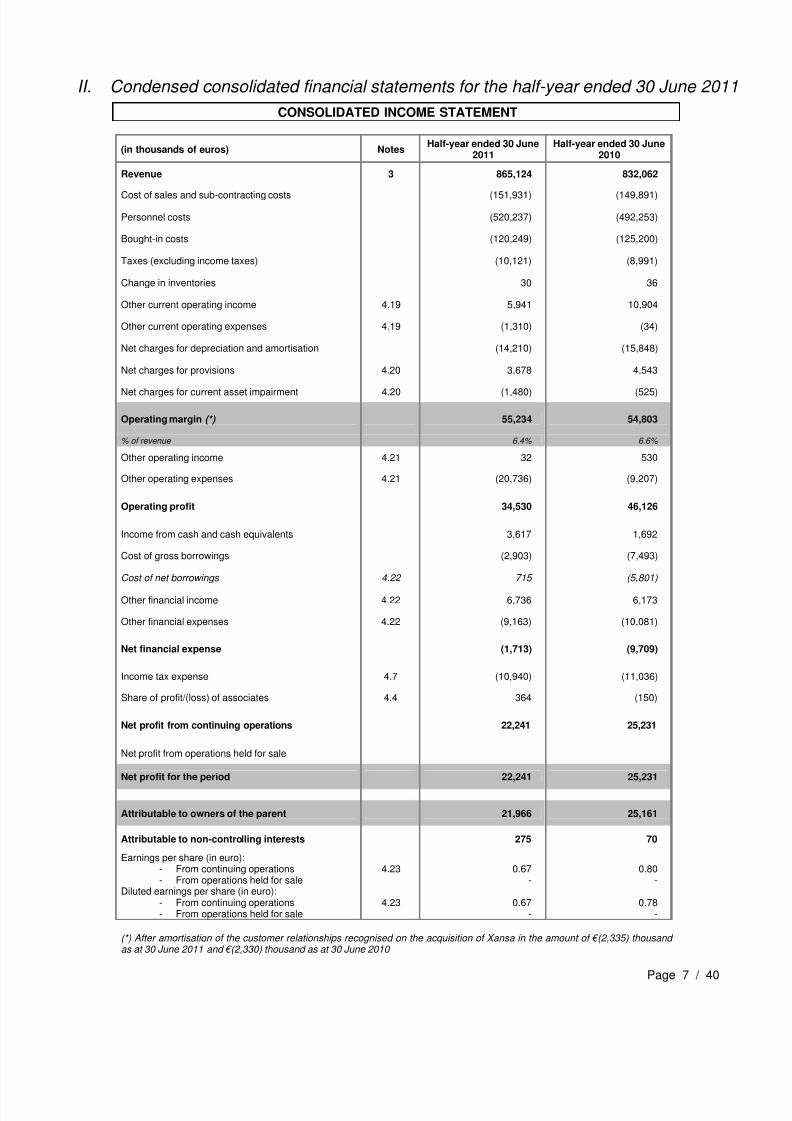
II. Condensed consolidated financial statements for the half-year ended 30 June 2011
CONSOLIDATED INCOME STATEMENT
(in thousands of euros) Notes Half-year ended 30 June
2011 Half-year ended 30 June
2010
Revenue 3 865,124 832,062
Cost of sales and sub-contracting costs (151,931) (149,891)
Personnel costs (520,237) (492,253)
Bought-in costs (120,249) (125,200)
Taxes (excluding income taxes) (10,121) (8,991)
Change in inventories 30 36
Other current operating income 4.19 5,941 10,904
Other current operating expenses 4.19 (1,310) (34)
Net charges for depreciation and amortisation (14,210) (15,848)
Net charges for provisions 4.20 3,678 4,543
Net charges for current asset impairment 4.20 (1,480) (525)
Operating margin (*) 55,234 54,803
% of revenue 6.4% 6.6%
Other operating income 4.21 32 530
Other operating expenses 4.21 (20,736) (9,207)
Operating profit 34,530 46,126
Income from cash and cash equivalents 3,617 1,692
Cost of gross borrowings (2,903) (7,493)
Cost of net borrowings 4.22 715 (5,801)
Other financial income 4.22 6,736 6,173
Other financial expenses 4.22 (9,163) (10,081)
Net financial expense (1,713) (9,709)
Income tax expense 4.7 (10,940) (11,036)
Share of profit/(loss) of associates 4.4 364 (150)
Net profit from continuing operations 22,241 25,231
Net profit from operations held for sale
Net profit for the period 22,241 25,231
Attributable to owners of the parent 21,966 25,161
Attributable to non-controlling interests 275 70
Earnings per share (in euro):- From continuing operations- From operations held for sale
4.23 0.67-
0.80-
Diluted earnings per share (in euro):
- From continuing operations- From operations held for sale
4.23 0.67-
0.78-
(*) After amortisation of the customer relationships recognised on the acquisition of Xansa in the amount of €(2,335) thousand as at 30 June 2011 and €(2,330) thousand as at 30 June 2010
7/29/2019 Groupe Steria Sca 2011 Half Year Financial Report Ve 01
http://slidepdf.com/reader/full/groupe-steria-sca-2011-half-year-financial-report-ve-01 8/40
Page 8 / 40
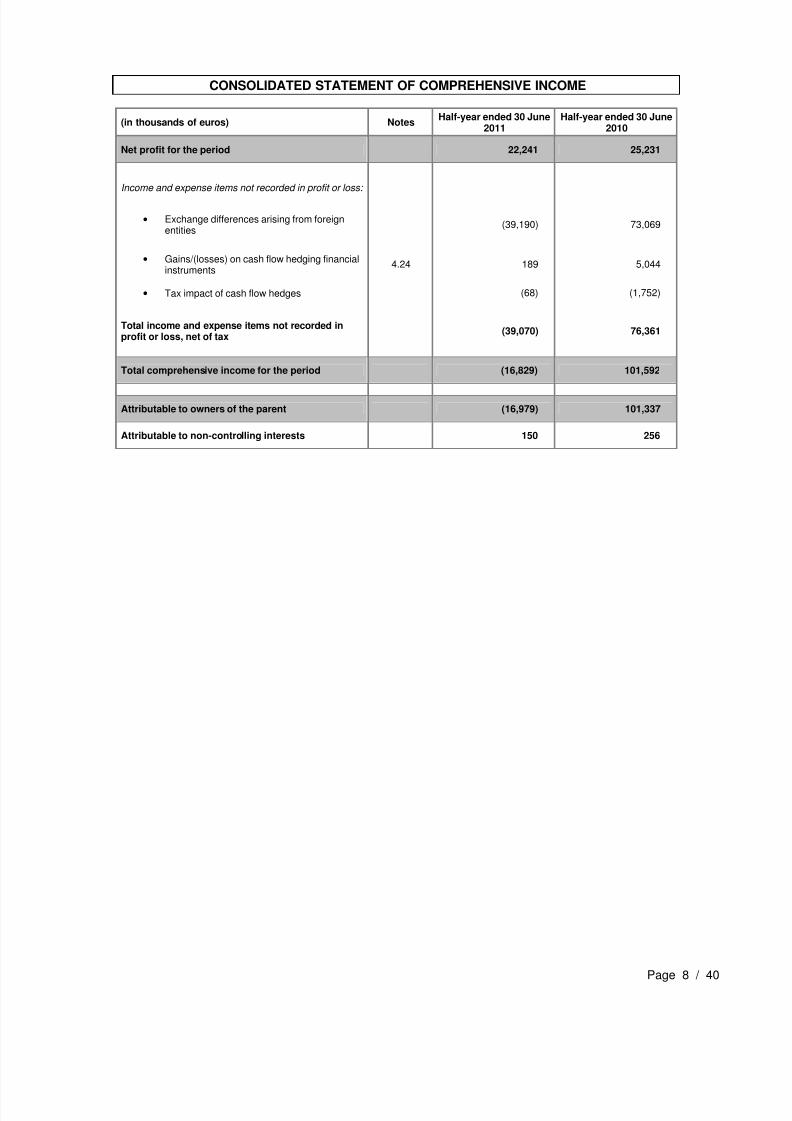
CONSOLIDATED STATEMENT OF COMPREHENSIVE INCOME
(in thousands of euros) Notes Half-year ended 30 June
2011 Half-year ended 30 June
2010
Net profit for the period 22,241 25,231
Income and expense items not recorded in profit or loss:
• Exchange differences arising from foreignentities
(39,190) 73,069
• Gains/(losses) on cash flow hedging financialinstruments
4.24 189 5,044
• Tax impact of cash flow hedges (68) (1,752)
Total income and expense items not recorded inprofit or loss, net of tax
(39,070) 76,361
Total comprehensive income for the period (16,829) 101,592
Attributable to owners of the parent (16,979) 101,337
Attributable to non-controlling interests 150 256
7/29/2019 Groupe Steria Sca 2011 Half Year Financial Report Ve 01
http://slidepdf.com/reader/full/groupe-steria-sca-2011-half-year-financial-report-ve-01 9/40
Page 9 / 40
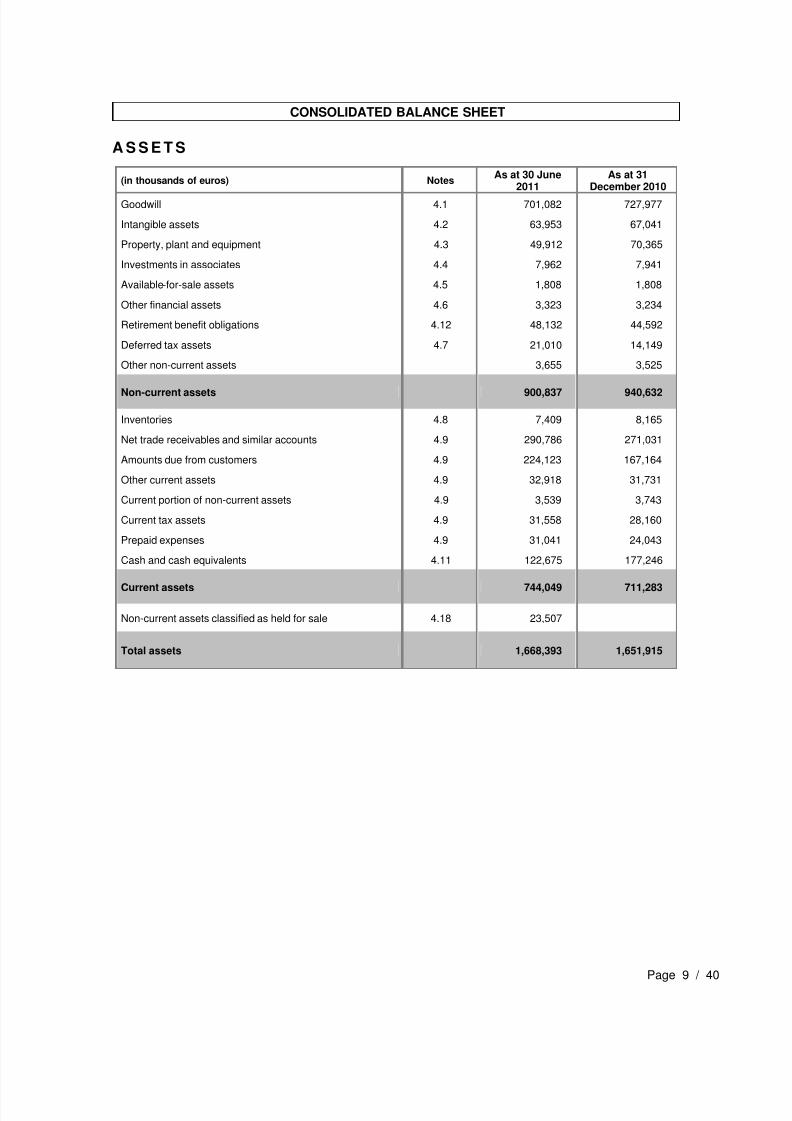
CONSOLIDATED BALANCE SHEET
A S S E T S
(in thousands of euros) Notes As at 30 June
2011 As at 31
December 2010
Goodwill 4.1 701,082 727,977
Intangible assets 4.2 63,953 67,041
Property, plant and equipment 4.3 49,912 70,365
Investments in associates 4.4 7,962 7,941
Available-for-sale assets 4.5 1,808 1,808
Other financial assets 4.6 3,323 3,234
Retirement benefit obligations 4.12 48,132 44,592
Deferred tax assets 4.7 21,010 14,149
Other non-current assets 3,655 3,525
Non-current assets 900,837 940,632
Inventories 4.8 7,409 8,165
Net trade receivables and similar accounts 4.9 290,786 271,031
Amounts due from customers 4.9 224,123 167,164
Other current assets 4.9 32,918 31,731
Current portion of non-current assets 4.9 3,539 3,743
Current tax assets 4.9 31,558 28,160
Prepaid expenses 4.9 31,041 24,043
Cash and cash equivalents 4.11 122,675 177,246
Current assets 744,049 711,283
Non-current assets classified as held for sale 4.18 23,507
Total assets 1,668,393 1,651,915
7/29/2019 Groupe Steria Sca 2011 Half Year Financial Report Ve 01
http://slidepdf.com/reader/full/groupe-steria-sca-2011-half-year-financial-report-ve-01 10/40
Page 10 / 40
CONSOLIDATED BALANCE SHEET
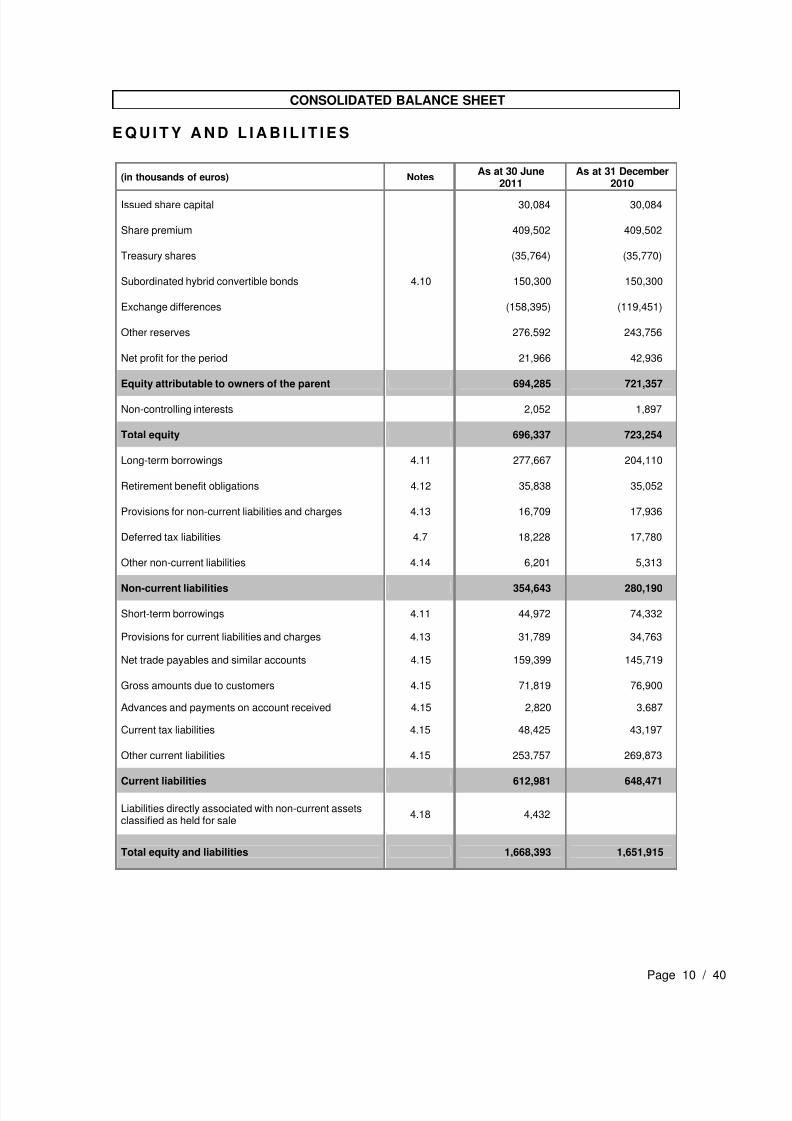
E Q U I T Y A N D L I A B I L I T I E S
(in thousands of euros) Notes
As at 30 June
2011
As at 31 December
2010
Issued share capital 30,084 30,084
Share premium 409,502 409,502
Treasury shares (35,764) (35,770)
Subordinated hybrid convertible bonds 4.10 150,300 150,300
Exchange differences (158,395) (119,451)
Other reserves 276,592 243,756
Net profit for the period 21,966 42,936
Equity attributable to owners of the parent 694,285 721,357
Non-controlling interests 2,052 1,897
Total equity 696,337 723,254
Long-term borrowings 4.11 277,667 204,110
Retirement benefit obligations 4.12 35,838 35,052
Provisions for non-current liabilities and charges 4.13 16,709 17,936
Deferred tax liabilities 4.7 18,228 17,780
Other non-current liabilities 4.14 6,201 5,313
Non-current liabilities 354,643 280,190
Short-term borrowings 4.11 44,972 74,332
Provisions for current liabilities and charges 4.13 31,789 34,763
Net trade payables and similar accounts 4.15 159,399 145,719
Gross amounts due to customers 4.15 71,819 76,900
Advances and payments on account received 4.15 2,820 3,687
Current tax liabilities 4.15 48,425 43,197
Other current liabilities 4.15 253,757 269,873
Current liabilities 612,981 648,471
Liabilities directly associated with non-current assetsclassified as held for sale
4.18 4,432
Total equity and liabilities 1,668,393 1,651,915
7/29/2019 Groupe Steria Sca 2011 Half Year Financial Report Ve 01
http://slidepdf.com/reader/full/groupe-steria-sca-2011-half-year-financial-report-ve-01 11/40
Page 11 / 40
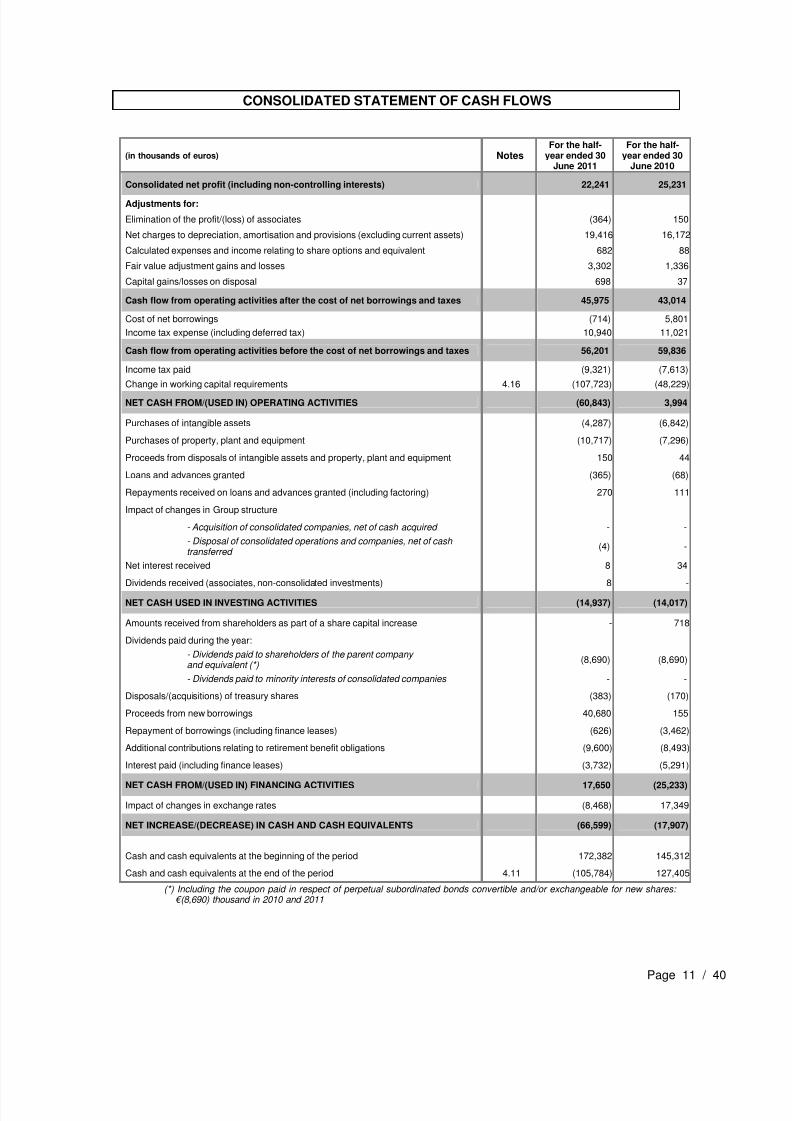
CONSOLIDATED STATEMENT OF CASH FLOWS
(in thousands of euros) Notes For the half-
year ended 30June 2011
For the half-year ended 30
June 2010
Consolidated net profit (including non-controlling interests) 22,241 25,231
Adjustments for:
Elimination of the profit/(loss) of associates (364) 150
Net charges to depreciation, amortisation and provisions (excluding current assets) 19,416 16,172
Calculated expenses and income relating to share options and equivalent 682 88
Fair value adjustment gains and losses 3,302 1,336
Capital gains/losses on disposal 698 37
Cash flow from operating activities after the cost of net borrowings and taxes 45,975 43,014
Cost of net borrowings (714) 5,801
Income tax expense (including deferred tax) 10,940 11,021
Cash flow from operating activities before the cost of net borrowings and taxes 56,201 59,836
Income tax paid (9,321) (7,613)
Change in working capital requirements 4.16 (107,723) (48,229)
NET CASH FROM/(USED IN) OPERATING ACTIVITIES (60,843) 3,994
Purchases of intangible assets (4,287) (6,842)
Purchases of property, plant and equipment (10,717) (7,296)
Proceeds from disposals of intangible assets and property, plant and equipment 150 44
Loans and advances granted (365) (68)
Repayments received on loans and advances granted (including factoring) 270 111
Impact of changes in Group structure
- Acquisition of consolidated companies, net of cash acquired - -
- Disposal of consolidated operations and companies, net of cash transferred
(4) -
Net interest received 8 34
Dividends received (associates, non-consolidated investments) 8 -
NET CASH USED IN INVESTING ACTIVITIES (14,937) (14,017)
Amounts received from shareholders as part of a share capital increase - 718
Dividends paid during the year:
- Dividends paid to shareholders of the parent company and equivalent (*)
(8,690) (8,690)
- Dividends paid to minority interests of consolidated companies - -
Disposals/(acquisitions) of treasury shares (383) (170)
Proceeds from new borrowings 40,680 155
Repayment of borrowings (including finance leases) (626) (3,462)
Additional contributions relating to retirement benefit obligations (9,600) (8,493)
Interest paid (including finance leases) (3,732) (5,291)
NET CASH FROM/(USED IN) FINANCING ACTIVITIES 17,650 (25,233)
Impact of changes in exchange rates (8,468) 17,349
NET INCREASE/(DECREASE) IN CASH AND CASH EQUIVALENTS (66,599) (17,907)
Cash and cash equivalents at the beginning of the period 172,382 145,312
Cash and cash equivalents at the end of the period 4.11 (105,784) 127,405
(*) Including the coupon paid in respect of perpetual subordinated bonds convertible and/or exchangeable for new shares:
€(8,690) thousand in 2010 and 2011
7/29/2019 Groupe Steria Sca 2011 Half Year Financial Report Ve 01
http://slidepdf.com/reader/full/groupe-steria-sca-2011-half-year-financial-report-ve-01 12/40
Page 12 / 40
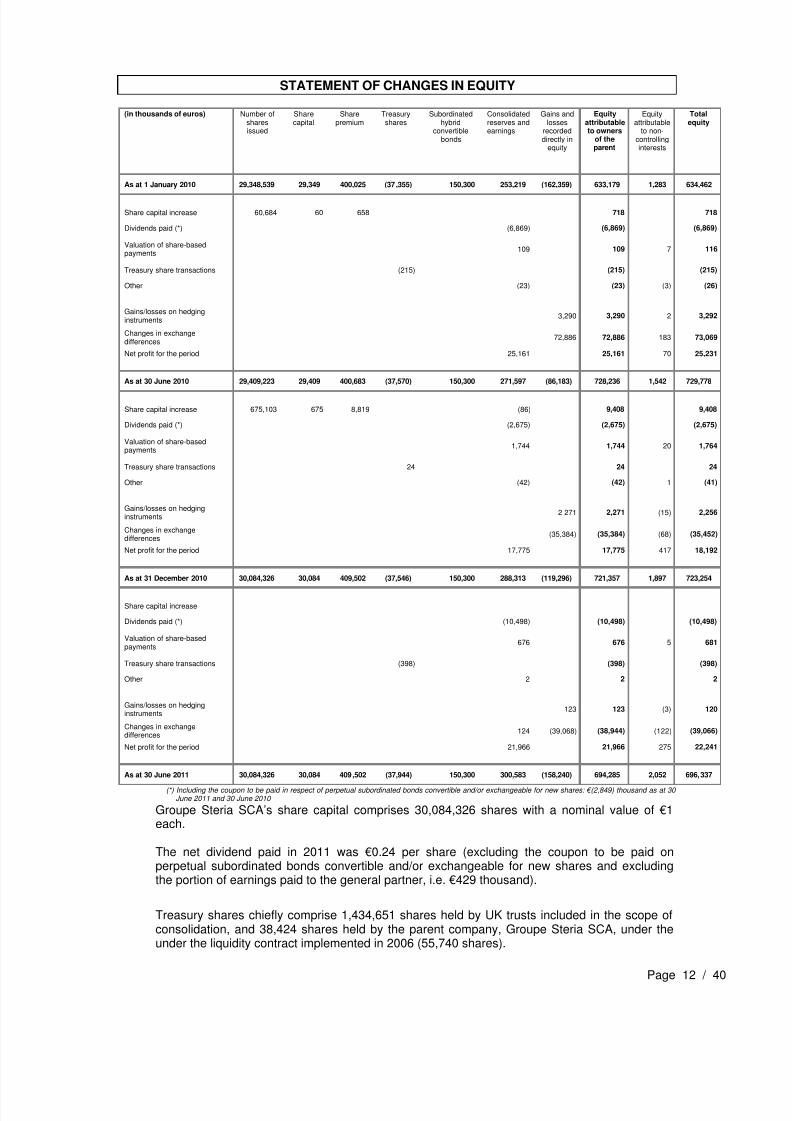
STATEMENT OF CHANGES IN EQUITY
(in thousands of euros) Number ofsharesissued
Sharecapital
Sharepremium
Treasuryshares
Subordinatedhybrid
convertiblebonds
Consolidatedreserves andearnings
Gains andlosses
recordeddirectly in
equity
Equityattributableto owners
of theparent
Equityattributable
to non-controllinginterests
Totalequity
As at 1 January 2010 29,348,539 29,349 400,025 (37,355) 150,300 253,219 (162,359) 633,179 1,283 634,462
Share capital increase 60,684 60 658 718 718
Dividends paid (*) (6,869) (6,869) (6,869)
Valuation of share-basedpayments
109 109 7 116
Treasury share transactions (215) (215) (215)
Other (23) (23) (3) (26)
Gains/losses on hedginginstruments
3,290 3,290 2 3,292
Changes in exchangedifferences
72,886 72,886 183 73,069
Net profit for the period 25,161 25,161 70 25,231
As at 30 June 2010 29,409,223 29,409 400,683 (37,570) 150,300 271,597 (86,183) 728,236 1,542 729,778
Share capital increase 675,103 675 8,819 (86) 9,408 9,408
Dividends paid (*) (2,675) (2,675) (2,675)
Valuation of share-basedpayments
1,744 1,744 20 1,764
Treasury share transactions 24 24 24
Other (42) (42) 1 (41)
Gains/losses on hedginginstruments
2 271 2,271 (15) 2,256
Changes in exchangedifferences
(35,384) (35,384) (68) (35,452)
Net profit for the period 17,775 17,775 417 18,192
As at 31 December 2010 30,084,326 30,084 409,502 (37,546) 150,300 288,313 (119,296) 721,357 1,897 723,254
Share capital increase
Dividends paid (*) (10,498) (10,498) (10,498)
Valuation of share-basedpayments
676 676 5 681
Treasury share transactions (398) (398) (398)
Other 2 2 2
Gains/losses on hedginginstruments
123 123 (3) 120
Changes in exchangedifferences
124 (39,068) (38,944) (122) (39,066)
Net profit for the period 21,966 21,966 275 22,241
As at 30 June 2011 30,084,326 30,084 409,502 (37,944) 150,300 300,583 (158,240) 694,285 2,052 696,337
(*) Including the coupon to be paid in respect of perpetual subordinated bonds convertible and/or exchangeable for new shares: €(2,849) thousand as at 30 June 2011 and 30 June 2010
Groupe Steria SCA’s share capital comprises 30,084,326 shares with a nominal value of €1each.
The net dividend paid in 2011 was €0.24 per share (excluding the coupon to be paid onperpetual subordinated bonds convertible and/or exchangeable for new shares and excludingthe portion of earnings paid to the general partner, i.e. €429 thousand).
Treasury shares chiefly comprise 1,434,651 shares held by UK trusts included in the scope ofconsolidation, and 38,424 shares held by the parent company, Groupe Steria SCA, under theunder the liquidity contract implemented in 2006 (55,740 shares).
7/29/2019 Groupe Steria Sca 2011 Half Year Financial Report Ve 01
http://slidepdf.com/reader/full/groupe-steria-sca-2011-half-year-financial-report-ve-01 13/40
Page 13 / 40
NNOOTTEESS TTOO TTHHEE CCOONNSSOOLLIIDDAATTEEDD FFIINNAANNCCIIAALL SSTTAATTEEMMEENNTTSS
.
NOTE 1: ACCOUNTING POLICIES
N1.1 Standards applied
The Groupe Steria SCA consolidated financial statements for the half-year ended 30 June 2011include Groupe Steria SCA and its subsidiaries (hereinafter referred to as "The Group") and theGroup's share in associates and jointly controlled companies.
The Groupe Steria SCA condensed consolidated financial statements for the half-year ended 30June 2011 have been prepared in accordance with the IFRS standard, IAS 34, on interimfinancial reporting, as adopted by the European Union, which can be consulted on thehttp://ec.europa.eu/internal_market/accounting/ias/index_fr.htm website. The accounting policiesand calculation methods applied to prepare the condensed consolidated financial statements forthe half-year ended 30 June 2011 are identical to those applied for the consolidated financial
statements for the year ended 31 December 2010, published in February 2010 (a description ofthese accounting policies and methods is provided in Note 1 to the consolidated financialstatements for the year ended 31 December 2010), with the exception of the following newstandards, amendments and interpretations, which have been of mandatory application since 1January 2011:
- IAS 24 revised – Related party disclosures,
- Amendment to IAS 32 – Classification of rights issues ,
- Amendment to IFRIC 14 – Prepayments of a Minimum Funding Requirement ,
- IFRIC 19 – Extinguishing Financial Liabilities with Equity Instruments .
- 2010 improvements, primarily amending IFRS 3 – Business combinations , IFRS 7 – Financial instruments: Disclosures , IAS 1 – Presentation of financial statements and IAS 34 – Interim financial reporting .
These amendments and interpretations did not impact the consolidated financial statements.
The Group consolidated financial statements for the half-year ended 30 June 2011 wereapproved by management on 28 July 2011 after consultation with the Supervisory Board.
N1.2 Material judgements and estimates
The preparation of the Group financial statements requires management to make judgements,estimates and assumptions that have an impact on the amounts of the assets, liabilities, incomeand expenses recorded therein as well as on the information provided in respect of contingentliabilities.
The estimates made as of 30 June 2011 are of the same nature as those detailed in the notesto the consolidated financial statements for the year ended 31 December 2010 and are nottherefore specific to half-year financial statements.
7/29/2019 Groupe Steria Sca 2011 Half Year Financial Report Ve 01
http://slidepdf.com/reader/full/groupe-steria-sca-2011-half-year-financial-report-ve-01 14/40
Page 14 / 40
NOTE 2: SCOPE OF CONSOLIDATION
In the first half of 2011, Group undertook the disposal of Iocore (Rest of Europe operatingsegment) in Sweden and the liquidation of dormant companies Deltaworth Ltd and GamutTechnologies Trust Company Ltd in the United Kingdom.
The immaterial impacts are presented in Note 4.21 Other operating income and expenses.
7/29/2019 Groupe Steria Sca 2011 Half Year Financial Report Ve 01
http://slidepdf.com/reader/full/groupe-steria-sca-2011-half-year-financial-report-ve-01 15/40
Page 15 / 40
NOTE 3: SEGMENT REPORTING
As required by IFRS 8, Operating segments , the information presented reflects the internalperformance reporting system used by management to assess the various segments. Segmentreporting is based on operating margin.
Groupe Steria SCA is managed on the basis of eight geographical operating segments. Threeare major individual countries: France, the UK and Germany. The other segments, comprisingSpain, Scandinavia (Norway, Sweden and Denmark), Benelux (Belgium and Luxembourg),Switzerland and Poland, have been grouped together in a joint geographical area denominated“Rest of Europe” for the requirements of the IFRS 8 presentation. Group companies primarilyoperate in the countries in which they are located. However, operations in Africa are undertakenby Steria SA, and Austrian operations by Steria Mummert Consulting AG. As these operationsare not yet material, they have been retained in the countries from which they are managed.
India is grouped with the UK given that its activity consists primarily in the provision ofindustrialised offshore services for customers under the operational management of the UKoperating segment.
Activities in Asia, previously included within the France operating segment, are now under theoperational control of the United Kingdom. Figures for the first half of 2010 were restatedfollowing this change.
Each segment conducts its activity in two businesses:
- Managed Services which involves managing all or part of the information technologyinfrastructure of companies or their business processes (Business ProcessOutsourcing)
- Systems Integration (SI) which involves designing, developing and implementingprojects for integration of systems and development of applications. SI includes Third-party Applications Maintenance, Consulting and any related equipment sales.
The columns of the table below present quantified information for each operating segment. The
operating segments identified are distinct Group components that earn revenues and incurexpenses, whose operating results are regularly reviewed by management and for whichseparate financial information is available.
The “Reconciling items” column includes intercompany eliminations and shared Groupexpenses. It enables segment information to be reconciled with the Group’s consolidatedfinancial statements.
7/29/2019 Groupe Steria Sca 2011 Half Year Financial Report Ve 01
http://slidepdf.com/reader/full/groupe-steria-sca-2011-half-year-financial-report-ve-01 16/40
Page 16 / 40
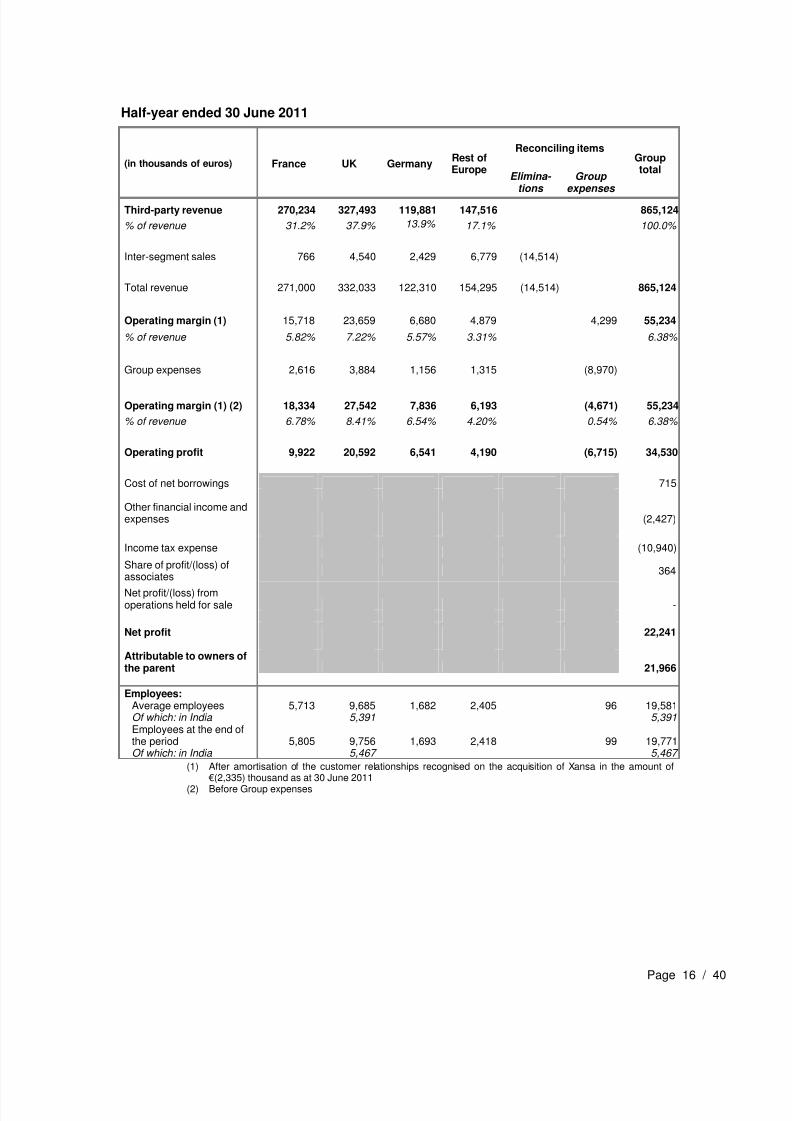
Half-year ended 30 June 2011
(in thousands of euros) France UK GermanyRest ofEurope
Reconciling itemsGrouptotal
Elimina- tions Group expenses
Third-party revenue 270,234 327,493 119,881 147,516 865,124
% of revenue 31.2% 37.9% 13.9% 17.1% 100.0%
Inter-segment sales 766 4,540 2,429 6,779 (14,514)
Total revenue 271,000 332,033 122,310 154,295 (14,514) 865,124
Operating margin (1) 15,718 23,659 6,680 4,879 4,299 55,234
% of revenue 5.82% 7.22% 5.57% 3.31% 6.38%
Group expenses 2,616 3,884 1,156 1,315 (8,970)
Operating margin (1) (2) 18,334 27,542 7,836 6,193 (4,671) 55,234
% of revenue 6.78% 8.41% 6.54% 4.20% 0.54% 6.38%
Operating profit 9,922 20,592 6,541 4,190 (6,715) 34,530
Cost of net borrowings 715
Other financial income andexpenses (2,427)
Income tax expense (10,940)
Share of profit/(loss) ofassociates
364
Net profit/(loss) fromoperations held for sale -
Net profit 22,241
Attributable to owners ofthe parent 21,966
Employees:Average employees 5,713 9,685 1,682 2,405 96 19,581Of which: in India 5,391 5,391Employees at the end ofthe period 5,805 9,756 1,693 2,418 99 19,771Of which: in India 5,467 5,467
(1) After amortisation of the customer relationships recognised on the acquisition of Xansa in the amount of€(2,335) thousand as at 30 June 2011
(2) Before Group expenses
7/29/2019 Groupe Steria Sca 2011 Half Year Financial Report Ve 01
http://slidepdf.com/reader/full/groupe-steria-sca-2011-half-year-financial-report-ve-01 17/40
Page 17 / 40
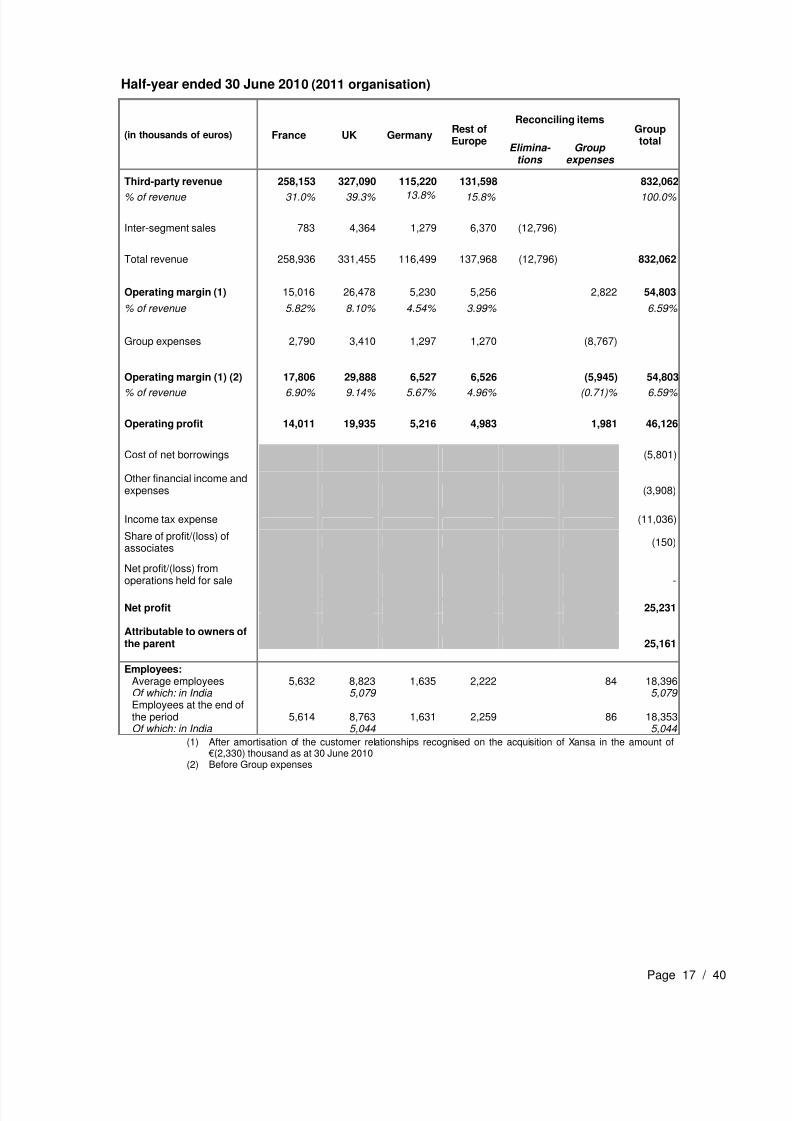
Half-year ended 30 June 2010 (2011 organisation)
(in thousands of euros) France UK GermanyRest ofEurope
Reconciling itemsGrouptotal
Elimina- tions
Group expenses
Third-party revenue 258,153 327,090 115,220 131,598 832,062% of revenue 31.0% 39.3% 13.8% 15.8% 100.0%
Inter-segment sales 783 4,364 1,279 6,370 (12,796)
Total revenue 258,936 331,455 116,499 137,968 (12,796) 832,062
Operating margin (1) 15,016 26,478 5,230 5,256 2,822 54,803
% of revenue 5.82% 8.10% 4.54% 3.99% 6.59%
Group expenses 2,790 3,410 1,297 1,270 (8,767)
Operating margin (1) (2) 17,806 29,888 6,527 6,526 (5,945) 54,803
% of revenue 6.90% 9.14% 5.67% 4.96% (0.71)% 6.59%
Operating profit 14,011 19,935 5,216 4,983 1,981 46,126
Cost of net borrowings (5,801)
Other financial income andexpenses (3,908)
Income tax expense (11,036)
Share of profit/(loss) ofassociates (150)
Net profit/(loss) fromoperations held for sale -
Net profit 25,231
Attributable to owners ofthe parent 25,161
Employees:Average employees 5,632 8,823 1,635 2,222 84 18,396Of which: in India 5,079 5,079 Employees at the end ofthe period 5,614 8,763 1,631 2,259 86 18,353Of which: in India 5,044 5,044
(1) After amortisation of the customer relationships recognised on the acquisition of Xansa in the amount of€(2,330) thousand as at 30 June 2010
(2) Before Group expenses
7/29/2019 Groupe Steria Sca 2011 Half Year Financial Report Ve 01
http://slidepdf.com/reader/full/groupe-steria-sca-2011-half-year-financial-report-ve-01 18/40
Page 18 / 40
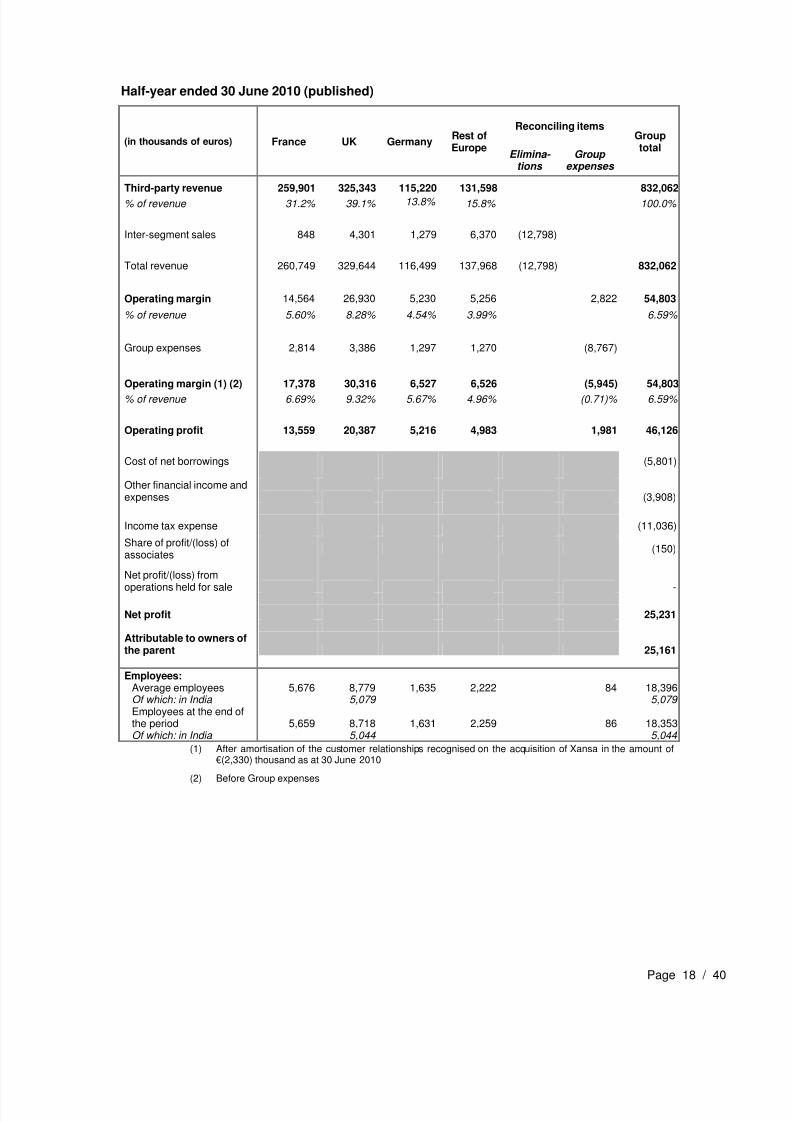
Half-year ended 30 June 2010 (published)
(in thousands of euros) France UK GermanyRest ofEurope
Reconciling itemsGrouptotal
Elimina- tions
Group expenses
Third-party revenue 259,901 325,343 115,220 131,598 832,062
% of revenue 31.2% 39.1% 13.8% 15.8% 100.0%
Inter-segment sales 848 4,301 1,279 6,370 (12,798)
Total revenue 260,749 329,644 116,499 137,968 (12,798) 832,062
Operating margin 14,564 26,930 5,230 5,256 2,822 54,803
% of revenue 5.60% 8.28% 4.54% 3.99% 6.59%
Group expenses 2,814 3,386 1,297 1,270 (8,767)
Operating margin (1) (2) 17,378 30,316 6,527 6,526 (5,945) 54,803
% of revenue 6.69% 9.32% 5.67% 4.96% (0.71)% 6.59%
Operating profit 13,559 20,387 5,216 4,983 1,981 46,126
Cost of net borrowings (5,801)
Other financial income andexpenses (3,908)
Income tax expense (11,036)
Share of profit/(loss) ofassociates
(150)
Net profit/(loss) fromoperations held for sale -
Net profit 25,231
Attributable to owners ofthe parent 25,161
Employees:Average employees 5,676 8,779 1,635 2,222 84 18,396Of which: in India 5,079 5,079 Employees at the end of
the period 5,659 8,718 1,631 2,259 86 18,353Of which: in India 5,044 5,044
(1) After amortisation of the customer relationships recognised on the acquisition of Xansa in the amount of€(2,330) thousand as at 30 June 2010
(2) Before Group expenses
7/29/2019 Groupe Steria Sca 2011 Half Year Financial Report Ve 01
http://slidepdf.com/reader/full/groupe-steria-sca-2011-half-year-financial-report-ve-01 19/40
Page 19 / 40
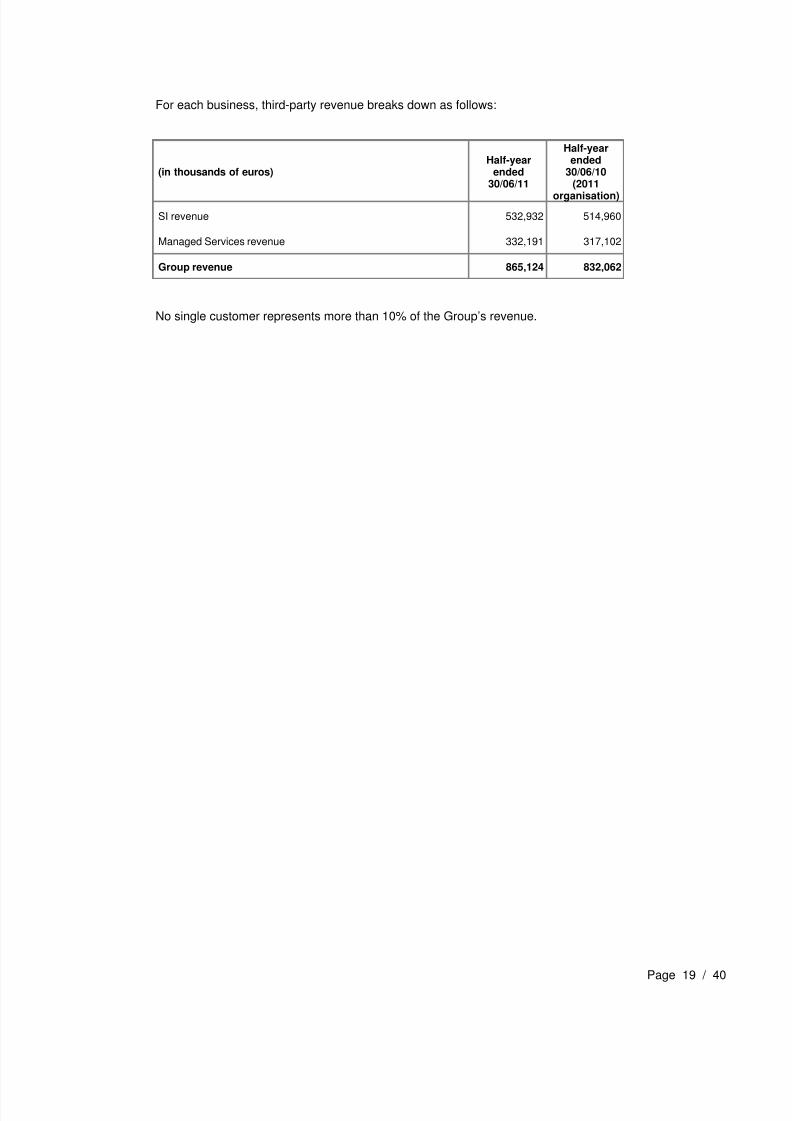
For each business, third-party revenue breaks down as follows:
(in thousands of euros) Half-year
ended
30/06/11
Half-yearended
30/06/10
(2011organisation)
SI revenue 532,932 514,960
Managed Services revenue 332,191 317,102
Group revenue 865,124 832,062
No single customer represents more than 10% of the Group’s revenue.
7/29/2019 Groupe Steria Sca 2011 Half Year Financial Report Ve 01
http://slidepdf.com/reader/full/groupe-steria-sca-2011-half-year-financial-report-ve-01 20/40
Page 20 / 40
NOTE 4: NOTES TO THE CONSOLIDATED FINANCIAL STATEMENTS
Preliminary comment: all amounts are expressed in thousands of euros, unless statedotherwise.
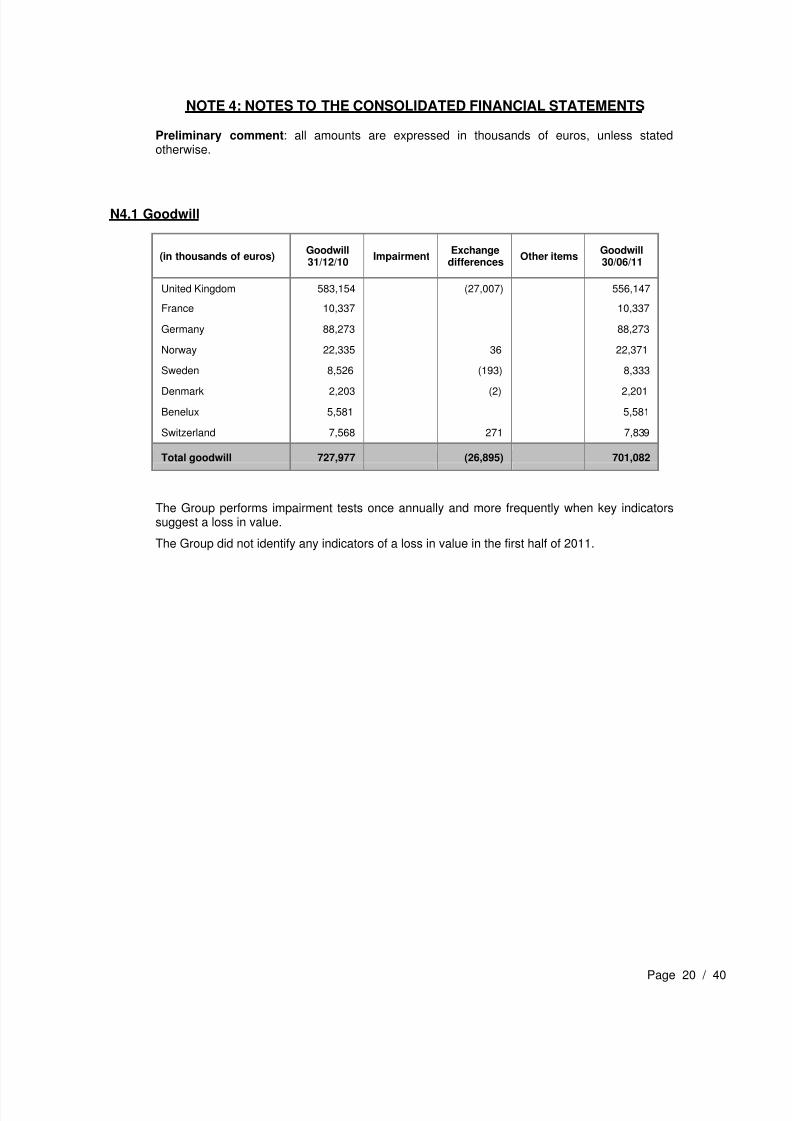
N4.1 Goodwill
(in thousands of euros) Goodwill31/12/10
ImpairmentExchange
differencesOther items
Goodwill30/06/11
United Kingdom 583,154 (27,007) 556,147
France 10,337 10,337
Germany 88,273 88,273
Norway 22,335 36 22,371
Sweden 8,526 (193) 8,333
Denmark 2,203 (2) 2,201
Benelux 5,581 5,581
Switzerland 7,568 271 7,839
Total goodwill 727,977 (26,895) 701,082
The Group performs impairment tests once annually and more frequently when key indicatorssuggest a loss in value.
The Group did not identify any indicators of a loss in value in the first half of 2011.
7/29/2019 Groupe Steria Sca 2011 Half Year Financial Report Ve 01
http://slidepdf.com/reader/full/groupe-steria-sca-2011-half-year-financial-report-ve-01 21/40
Page 21 / 40
N4.2 Other intangible assets
Intangible asset purchases totalled €4,287 thousand as at 30 June 2011 and mainly compriselicences and the development of solutions for the Group’s internal requirements.
The other changes in intangible assets primarily involve amortisation charges in the amount of€5,720 thousand, including €2,335 thousand for the customer relationship arising from theXansa acquisition and exchange rate fluctuations for €(1,682 thousand).
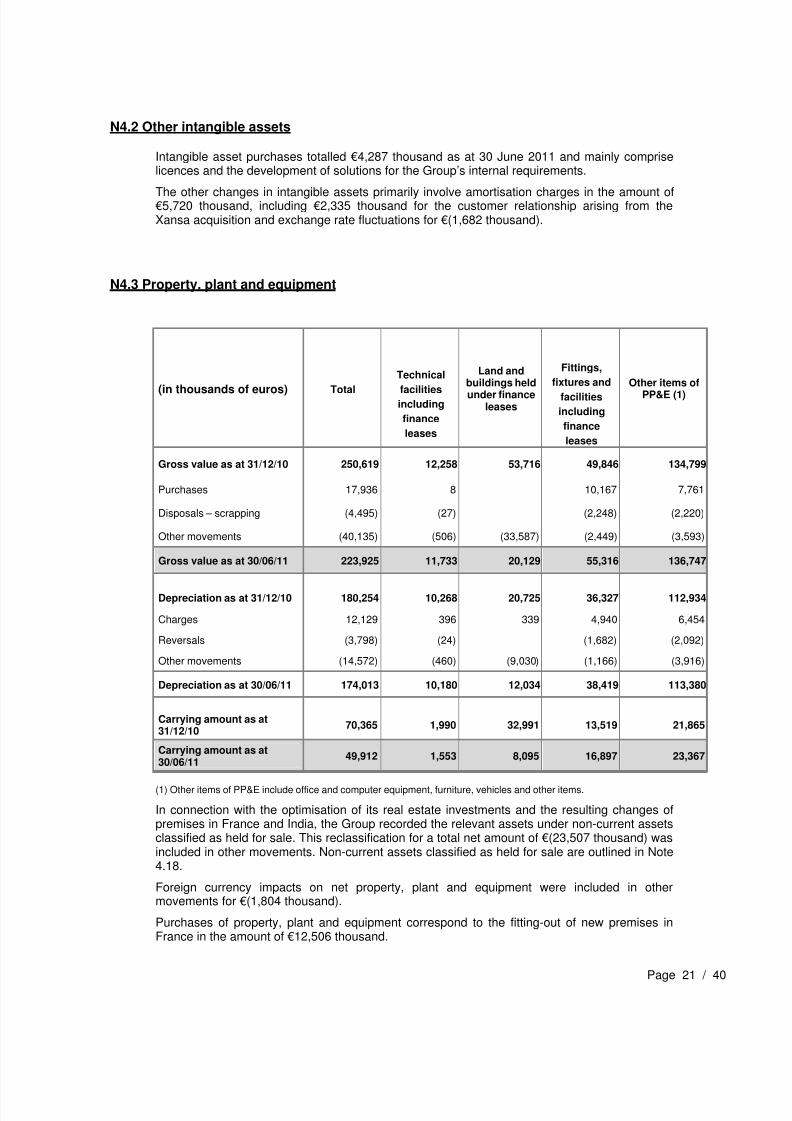
N4.3 Property, plant and equipment
(in thousands of euros) Total
Technical
facilities
including
finance
leases
Land andbuildings heldunder finance
leases
Fittings,
fixtures and
facilities
including
finance
leases
Other items ofPP&E (1)
Gross value as at 31/12/10 250,619 12,258 53,716 49,846 134,799
Purchases 17,936 8 10,167 7,761
Disposals – scrapping (4,495) (27) (2,248) (2,220)
Other movements (40,135) (506) (33,587) (2,449) (3,593)
Gross value as at 30/06/11 223,925 11,733 20,129 55,316 136,747
Depreciation as at 31/12/10 180,254 10,268 20,725 36,327 112,934
Charges 12,129 396 339 4,940 6,454
Reversals (3,798) (24) (1,682) (2,092)
Other movements (14,572) (460) (9,030) (1,166) (3,916)
Depreciation as at 30/06/11 174,013 10,180 12,034 38,419 113,380
Carrying amount as at31/12/10 70,365 1,990 32,991 13,519 21,865
Carrying amount as at30/06/11
49,912 1,553 8,095 16,897 23,367
(1) Other items of PP&E include office and computer equipment, furniture, vehicles and other items.
In connection with the optimisation of its real estate investments and the resulting changes ofpremises in France and India, the Group recorded the relevant assets under non-current assetsclassified as held for sale. This reclassification for a total net amount of €(23,507 thousand) wasincluded in other movements. Non-current assets classified as held for sale are outlined in Note4.18.
Foreign currency impacts on net property, plant and equipment were included in other
movements for €(1,804 thousand).Purchases of property, plant and equipment correspond to the fitting-out of new premises inFrance in the amount of €12,506 thousand.
7/29/2019 Groupe Steria Sca 2011 Half Year Financial Report Ve 01
http://slidepdf.com/reader/full/groupe-steria-sca-2011-half-year-financial-report-ve-01 22/40
Page 22 / 40
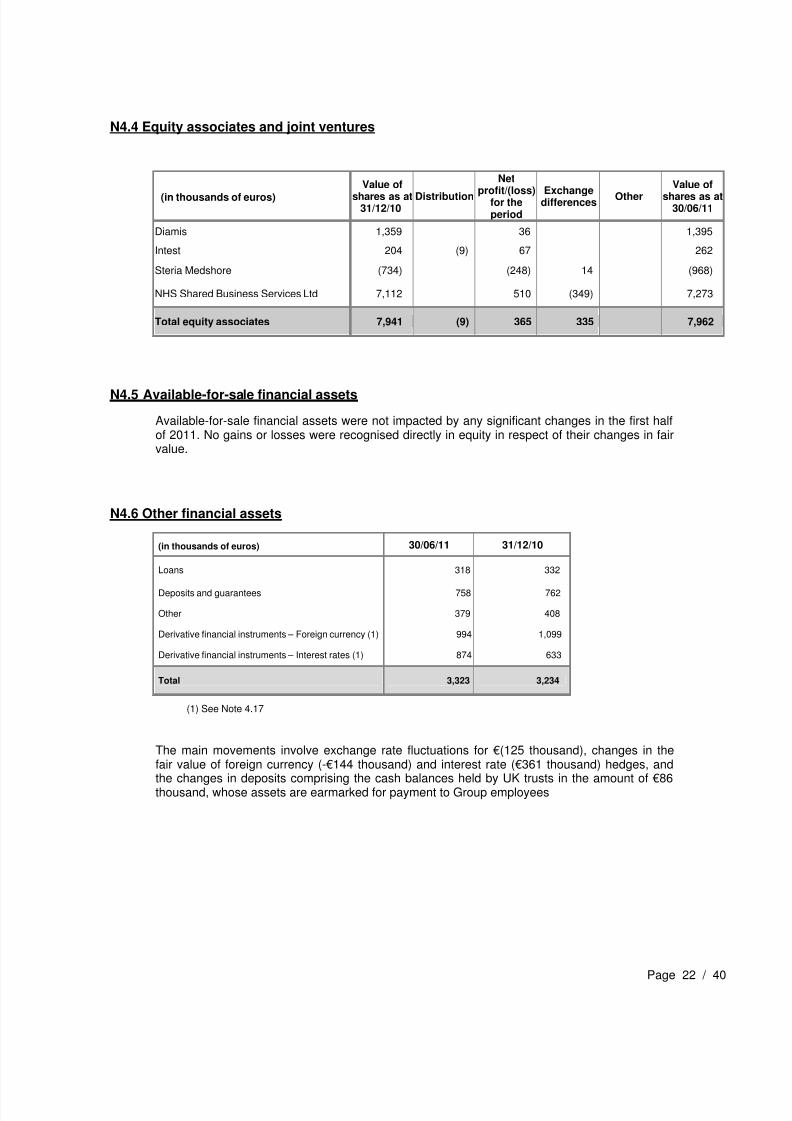
N4.4 Equity associates and joint ventures
(in thousands of euros) Value of
shares as at31/12/10
DistributionNet
profit/(loss)for theperiod
Exchangedifferences
OtherValue of
shares as at30/06/11
Diamis 1,359 36 1,395
Intest 204 (9) 67 262
Steria Medshore (734) (248) 14 (968)
NHS Shared Business Services Ltd 7,112 510 (349) 7,273
Total equity associates 7,941 (9) 365 335 7,962
N4.5 Available-for-sale financial assets
Available-for-sale financial assets were not impacted by any significant changes in the first halfof 2011. No gains or losses were recognised directly in equity in respect of their changes in fairvalue.
N4.6 Other financial assets
(in thousands of euros) 30/06/11 31/12/10
Loans 318 332
Deposits and guarantees 758 762
Other 379 408
Derivative financial instruments – Foreign currency (1) 994 1,099
Derivative financial instruments – Interest rates (1) 874 633
Total 3,323 3,234
(1) See Note 4.17
The main movements involve exchange rate fluctuations for €(125 thousand), changes in thefair value of foreign currency (-€144 thousand) and interest rate (€361 thousand) hedges, andthe changes in deposits comprising the cash balances held by UK trusts in the amount of €86thousand, whose assets are earmarked for payment to Group employees
7/29/2019 Groupe Steria Sca 2011 Half Year Financial Report Ve 01
http://slidepdf.com/reader/full/groupe-steria-sca-2011-half-year-financial-report-ve-01 23/40
Page 23 / 40
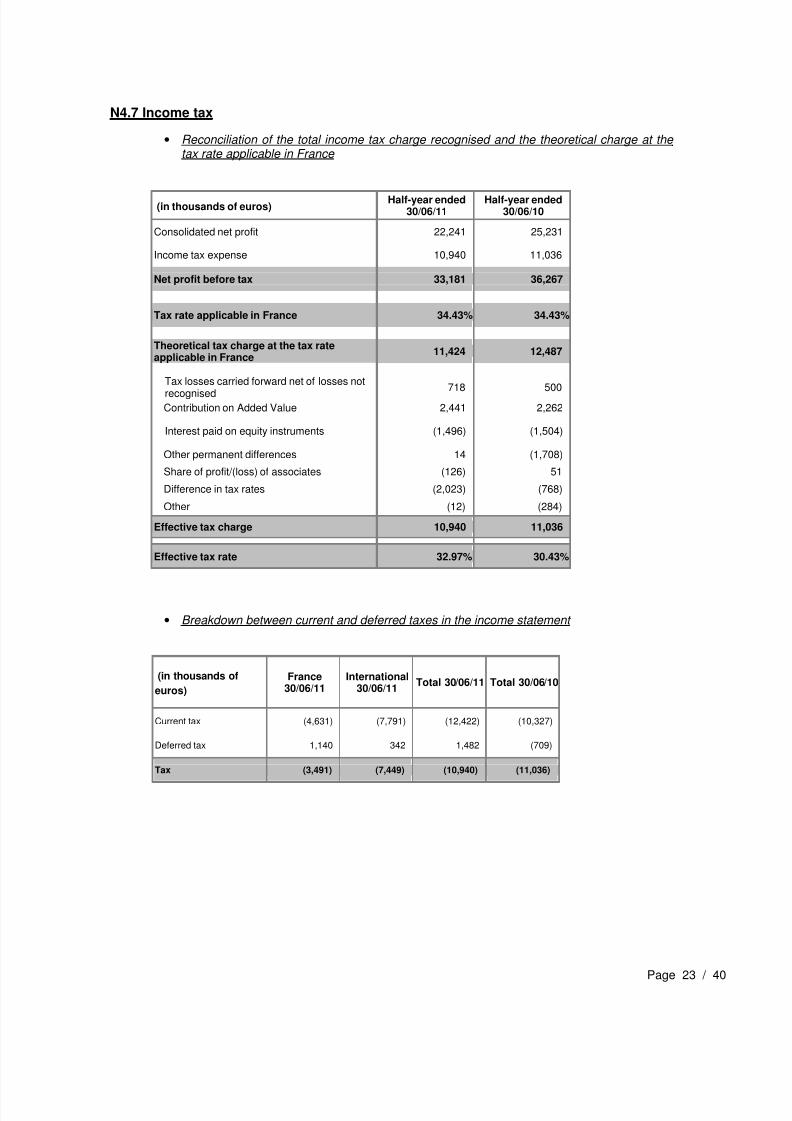
N4.7 Income tax
• Reconciliation of the total income tax charge recognised and the theoretical charge at the tax rate applicable in France
(in thousands of euros) Half-year ended
30/06/11Half-year ended
30/06/10
Consolidated net profit 22,241 25,231
Income tax expense 10,940 11,036
Net profit before tax 33,181 36,267
Tax rate applicable in France 34.43% 34.43%
Theoretical tax charge at the tax rate
applicable in France
11,424 12,487
Tax losses carried forward net of losses notrecognised
718 500
Contribution on Added Value 2,441 2,262
Interest paid on equity instruments (1,496) (1,504)
Other permanent differences 14 (1,708)
Share of profit/(loss) of associates (126) 51
Difference in tax rates (2,023) (768)
Other (12) (284)
Effective tax charge 10,940 11,036
Effective tax rate 32.97% 30.43%
• Breakdown between current and deferred taxes in the income statement
(in thousands of
euros)
France30/06/11
International30/06/11
Total 30/06/11 Total 30/06/10
Current tax (4,631) (7,791) (12,422) (10,327)
Deferred tax 1,140 342 1,482 (709)
Tax (3,491) (7,449) (10,940) (11,036)
7/29/2019 Groupe Steria Sca 2011 Half Year Financial Report Ve 01
http://slidepdf.com/reader/full/groupe-steria-sca-2011-half-year-financial-report-ve-01 24/40
Page 24 / 40
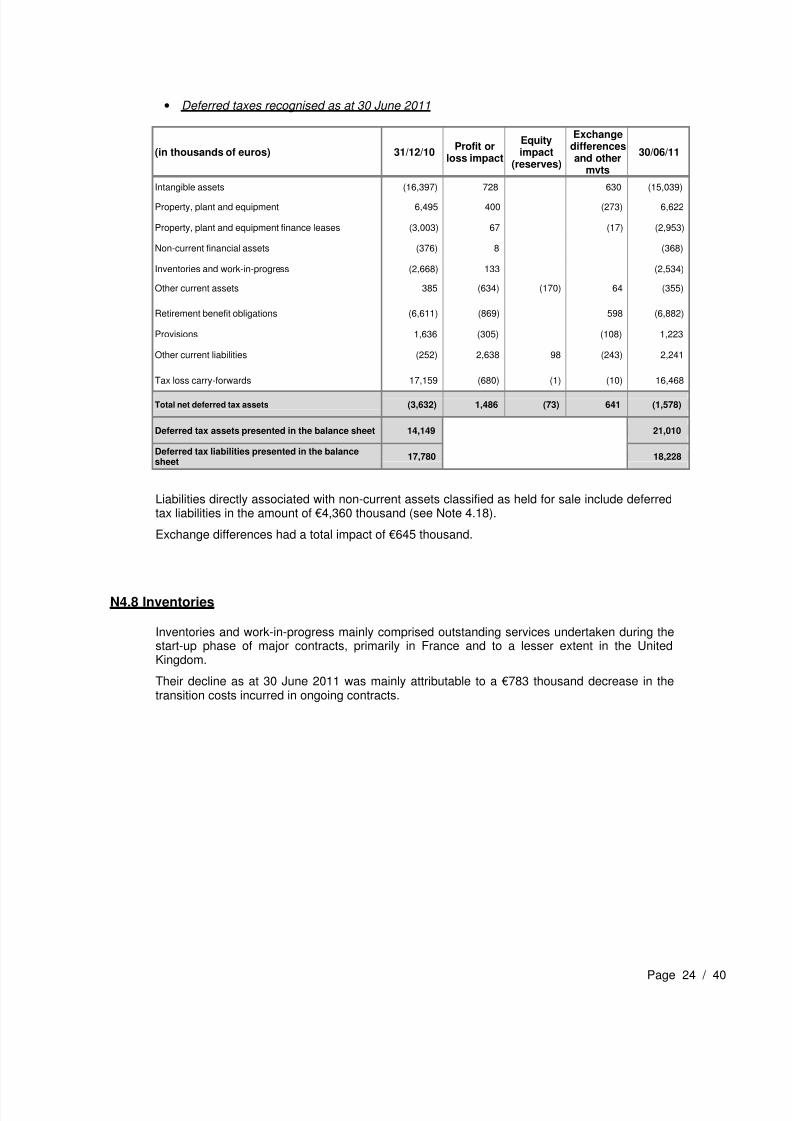
• Deferred taxes recognised as at 30 June 2011
(in thousands of euros) 31/12/10Profit or
loss impact
Equityimpact
(reserves)
Exchangedifferencesand other
mvts
30/06/11
Intangible assets (16,397) 728 630 (15,039)
Property, plant and equipment 6,495 400 (273) 6,622
Property, plant and equipment finance leases (3,003) 67 (17) (2,953)
Non-current financial assets (376) 8 (368)
Inventories and work-in-progress (2,668) 133 (2,534)
Other current assets 385 (634) (170) 64 (355)
Retirement benefit obligations (6,611) (869) 598 (6,882)
Provisions 1,636 (305) (108) 1,223
Other current liabilities (252) 2,638 98 (243) 2,241
Tax loss carry-forwards 17,159 (680) (1) (10) 16,468
Total net deferred tax assets (3,632) 1,486 (73) 641 (1,578)
Deferred tax assets presented in the balance sheet 14,149 21,010
Deferred tax liabilities presented in the balancesheet
17,780 18,228
Liabilities directly associated with non-current assets classified as held for sale include deferredtax liabilities in the amount of €4,360 thousand (see Note 4.18).
Exchange differences had a total impact of €645 thousand.
N4.8 Inventories
Inventories and work-in-progress mainly comprised outstanding services undertaken during thestart-up phase of major contracts, primarily in France and to a lesser extent in the UnitedKingdom.
Their decline as at 30 June 2011 was mainly attributable to a €783 thousand decrease in thetransition costs incurred in ongoing contracts.
7/29/2019 Groupe Steria Sca 2011 Half Year Financial Report Ve 01
http://slidepdf.com/reader/full/groupe-steria-sca-2011-half-year-financial-report-ve-01 25/40
Page 25 / 40
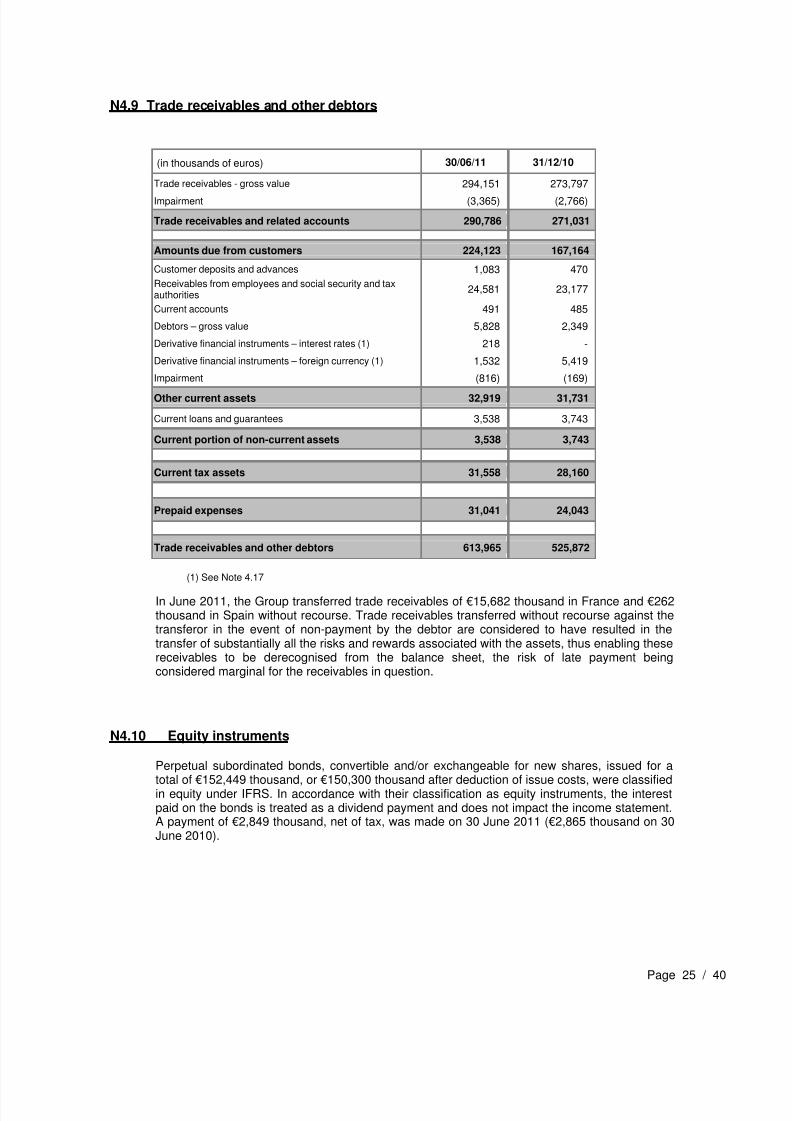
N4.9 Trade receivables and other debtors
(in thousands of euros) 30/06/11 31/12/10
Trade receivables - gross value 294,151 273,797
Impairment (3,365) (2,766)
Trade receivables and related accounts 290,786 271,031
Amounts due from customers 224,123 167,164
Customer deposits and advances 1,083 470
Receivables from employees and social security and taxauthorities
24,581 23,177
Current accounts 491 485
Debtors – gross value 5,828 2,349
Derivative financial instruments – interest rates (1) 218 -
Derivative financial instruments – foreign currency (1) 1,532 5,419Impairment (816) (169)
Other current assets 32,919 31,731
Current loans and guarantees 3,538 3,743
Current portion of non-current assets 3,538 3,743
Current tax assets 31,558 28,160
Prepaid expenses 31,041 24,043
Trade receivables and other debtors 613,965 525,872
(1) See Note 4.17
In June 2011, the Group transferred trade receivables of €15,682 thousand in France and €262thousand in Spain without recourse. Trade receivables transferred without recourse against thetransferor in the event of non-payment by the debtor are considered to have resulted in thetransfer of substantially all the risks and rewards associated with the assets, thus enabling thesereceivables to be derecognised from the balance sheet, the risk of late payment beingconsidered marginal for the receivables in question.
N4.10 Equity instruments
Perpetual subordinated bonds, convertible and/or exchangeable for new shares, issued for atotal of €152,449 thousand, or €150,300 thousand after deduction of issue costs, were classifiedin equity under IFRS. In accordance with their classification as equity instruments, the interestpaid on the bonds is treated as a dividend payment and does not impact the income statement.A payment of €2,849 thousand, net of tax, was made on 30 June 2011 (€2,865 thousand on 30June 2010).
7/29/2019 Groupe Steria Sca 2011 Half Year Financial Report Ve 01
http://slidepdf.com/reader/full/groupe-steria-sca-2011-half-year-financial-report-ve-01 26/40
Page 26 / 40
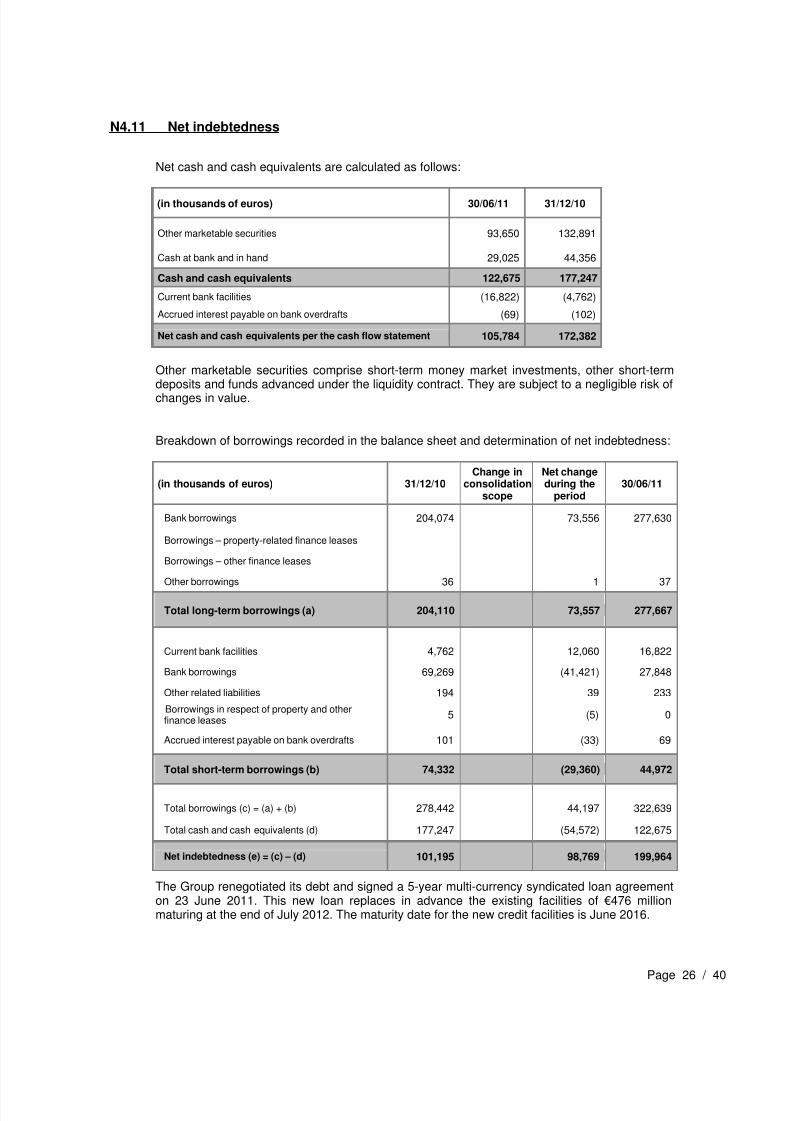
N4.11 Net indebtedness
Net cash and cash equivalents are calculated as follows:
(in thousands of euros) 30/06/11 31/12/10
Other marketable securities 93,650 132,891
Cash at bank and in hand 29,025 44,356
Cash and cash equivalents 122,675 177,247
Current bank facilities (16,822) (4,762)
Accrued interest payable on bank overdrafts (69) (102)
Net cash and cash equivalents per the cash flow statement 105,784 172,382
Other marketable securities comprise short-term money market investments, other short-termdeposits and funds advanced under the liquidity contract. They are subject to a negligible risk ofchanges in value.
Breakdown of borrowings recorded in the balance sheet and determination of net indebtedness:
(in thousands of euros) 31/12/10Change in
consolidationscope
Net changeduring the
period30/06/11
Bank borrowings 204,074 73,556 277,630
Borrowings – property-related finance leases
Borrowings – other finance leases
Other borrowings 36 1 37
Total long-term borrowings (a) 204,110 73,557 277,667
Current bank facilities 4,762 12,060 16,822
Bank borrowings 69,269 (41,421) 27,848
Other related liabilities 194 39 233
Borrowings in respect of property and other
finance leases
5 (5) 0
Accrued interest payable on bank overdrafts 101 (33) 69
Total short-term borrowings (b) 74,332 (29,360) 44,972
Total borrowings (c) = (a) + (b) 278,442 44,197 322,639
Total cash and cash equivalents (d) 177,247 (54,572) 122,675
Net indebtedness (e) = (c) – (d) 101,195 98,769 199,964
The Group renegotiated its debt and signed a 5-year multi-currency syndicated loan agreement
on 23 June 2011. This new loan replaces in advance the existing facilities of €476 millionmaturing at the end of July 2012. The maturity date for the new credit facilities is June 2016.
7/29/2019 Groupe Steria Sca 2011 Half Year Financial Report Ve 01
http://slidepdf.com/reader/full/groupe-steria-sca-2011-half-year-financial-report-ve-01 27/40
Page 27 / 40
The signed credit facilities include:
- An amortisable loan of €200 million,
- An amortisable loan of GBP 65 million,
- A multi-currency revolving credit facility of €325 million which will be used to satisfy theGroup’s various financing requirements, including the possible refinancing of the
perpetual subordinated bonds, convertible and/or exchangeable for new shares, issuedfor a total of €152,449 thousand.
In accordance with the provisions of IAS 39 Financial instruments: recognition and measurement (§40), the refinancing will not lead to any substantial change in the initial financialliability or its extinguishment.
New bond issue costs in the amount of €5,054 thousand were recognised, bringing the totalamount of issue costs to be amortised to €7,304 thousand as at 30 June 2011.
The bank terms and conditions to which the syndicated loan is subject notably include acommitment to comply with certain bank covenants.
The Company must comply with two financial ratios calculated every six months based on thepublished consolidated financial statements, on a 12-month rolling basis:
- the first, the leverage ratio, is equal to net debt/EBITDA,
- the second, the interest coverage ratio, is equal to operating margin before amortisationof customer relationships/cost of net borrowings.
The Group complied with all bank covenants as at 30 June 2011.
The Group has floating-rate credit facilities for a euro-equivalent of €645.1 million, which were51% drawn down as at 30 June 2011.
4.12 Retirement benefit obligations
Liabilities relating to retirement benefits cover the obligations of Groupe Steria towards itsemployees with respect to lump-sum retirement benefits in France and defined benefit plans inthe UK, Germany, Belgium and Norway.
Assets and obligations are valued annually at the year-end and the actuarial assumptions usedas at 31 December 2010 have been maintained to value obligations as at 30 June 2011. Theamounts recognised in the interim income statement and balance sheet are based on anextrapolation of the most recent annual actuarial valuation: service cost, interest cost on theliability and expected return on plan assets.
For the half-year ended 30 June 2011, the net charges recorded in the income statementinclude an amortisation charge relating to the €(3,339) thousand actuarial loss recorded in the
income statement under “Other operating expenses”. This charge totalled €(5,156) thousand forthe half-year ended 30 June 2010.
7/29/2019 Groupe Steria Sca 2011 Half Year Financial Report Ve 01
http://slidepdf.com/reader/full/groupe-steria-sca-2011-half-year-financial-report-ve-01 28/40
Page 28 / 40
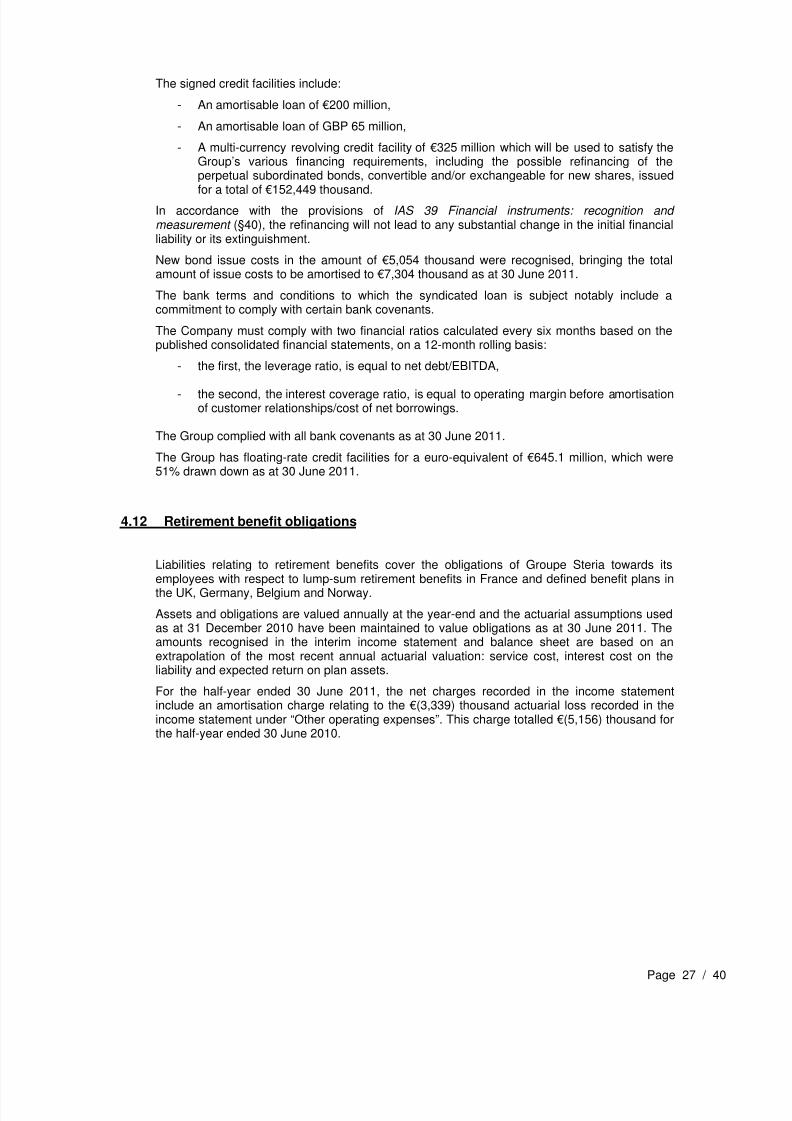
To recap, changes in net liabilities relating to the main retirement benefit obligations in the firsthalf of 2011 are presented in the following table:
(in thousands of euros)
Definedbenefit
pensionfunds -
UK
Definedbenefit
pensionfunds -
Germany
Retirementterminationbenefits -
France
Definedbenefit
pensionfunds - Norway
Definedbenefit
pensionfunds - Belgium
Net (asset)/liability as at 31/12/10 (44,593) 17,838 11,942 2,113 1,624
Net expense recognised in the incomestatement
4,667 697 1,201 104 207
Contributions and benefits (10,488) (450) (594) (374) (275)
Exchange rate fluctuations 2,281 2
Net (asset)/liability as at 30/06/11 (48,132) 18,085 12,550 1,845 1,556
N4.13 Provisions for liabilities and charges
In the first half of 2011, changes in provisions for liabilities and charges were as follows:
(in thousands of euros) 31/12/10 Charge Reversal Other
movementsExchange
differences30/06/11
Non- current
Current
Provisions for litigation 11,084 913 (487) (77) 11,433 1,723 9,710
Provisions for losses tocompletion on contracts
2,676 1,189 (1,370) (77) 2,418 2,418
Other provisions forliabilities
20,543 1,643 (5,560) (617) 16,009 11,457 4,552
Provisions forrestructuring
18,396 5,327 (4,796) (289) 18,638 3,529 15,109
Provisions for liabilities andcharges
52,699 9,072 (12,213) (1,060) 48,498 16,709 31,789
Provisions for litigation primarily concern employee disputes in France and the United Kingdomand major contract disputes deemed as non-recurring.
Provisions for losses to completion mainly involve the United Kingdom operating segment.
Other provisions for liabilities mainly concern trade receivable risks in France and the UnitedKingdom in the amount of €4,183 thousand and the cost of refurbishing UK premises in theamount of €9,926 thousand.
Provisions for restructuring mainly concern the cost of premises left vacant. In the UnitedKingdom, following the Xansa Group acquisition, premises left vacant were provided for in theamount of €4,968 thousand. In France, infrastructure and premise reorganisation measurescosting €10,323 thousand resulted in vacant premises and refurbishment costs. Finally,resource adaptation costs in France, the United Kingdom and Germany were provided for in theamount of €2,869 thousand.
Reversals of unused provisions for liabilities and charges totalled €4,435 thousand and wereattributable to the elimination of certain client risks. They correspond to other provisions forliabilities.
7/29/2019 Groupe Steria Sca 2011 Half Year Financial Report Ve 01
http://slidepdf.com/reader/full/groupe-steria-sca-2011-half-year-financial-report-ve-01 29/40
Page 29 / 40
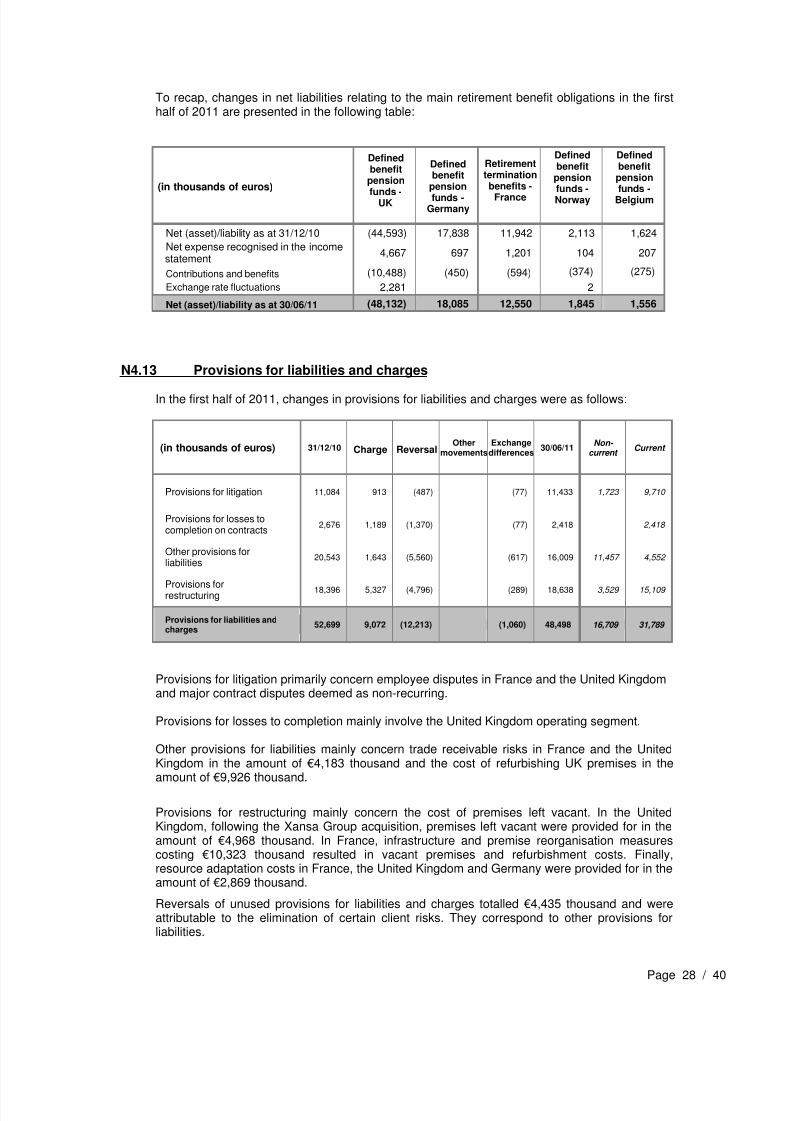
N4.14 Other non-current liabilities
(in thousands of euros) 30/06/11 31/12/10
Other long-term liabilities 5,495 4,104
Derivative financial instruments – interest rate (1) 115 251
Derivative financial instruments – foreign currency (1) 591 958
6,201 5,313
(1) See Note 4.17
Other non-current liabilities comprise, in particular, French profit-sharing liabilities in the amountof €5,491 thousand.
N4.15 Trade payables and other creditors
(in thousands of euros) 30/06/11 31/12/10
Suppliers of goods and services and related accounts 159,399 145,719
Gross amounts due to customers 71,819 76,900
Prepayments and advances received 2,820 3,687
Current tax liabilities, income tax 48,425 43,197
Employee-related liabilities 155,490 166,205
Tax-related liabilities 83,419 92,841
Interest payable - -
Dividends payable 12,564 9,287
Derivative financial instruments – interest rate (1) - 118
Derivative financial instruments – foreign currency (1) 900 465
Other sundry liabilities 1,384 957
Total other current liabilities 253,757 269,873
Total trade payables and other creditors 536,220 539,376
(1) See Note 4.17
7/29/2019 Groupe Steria Sca 2011 Half Year Financial Report Ve 01
http://slidepdf.com/reader/full/groupe-steria-sca-2011-half-year-financial-report-ve-01 30/40
Page 30 / 40
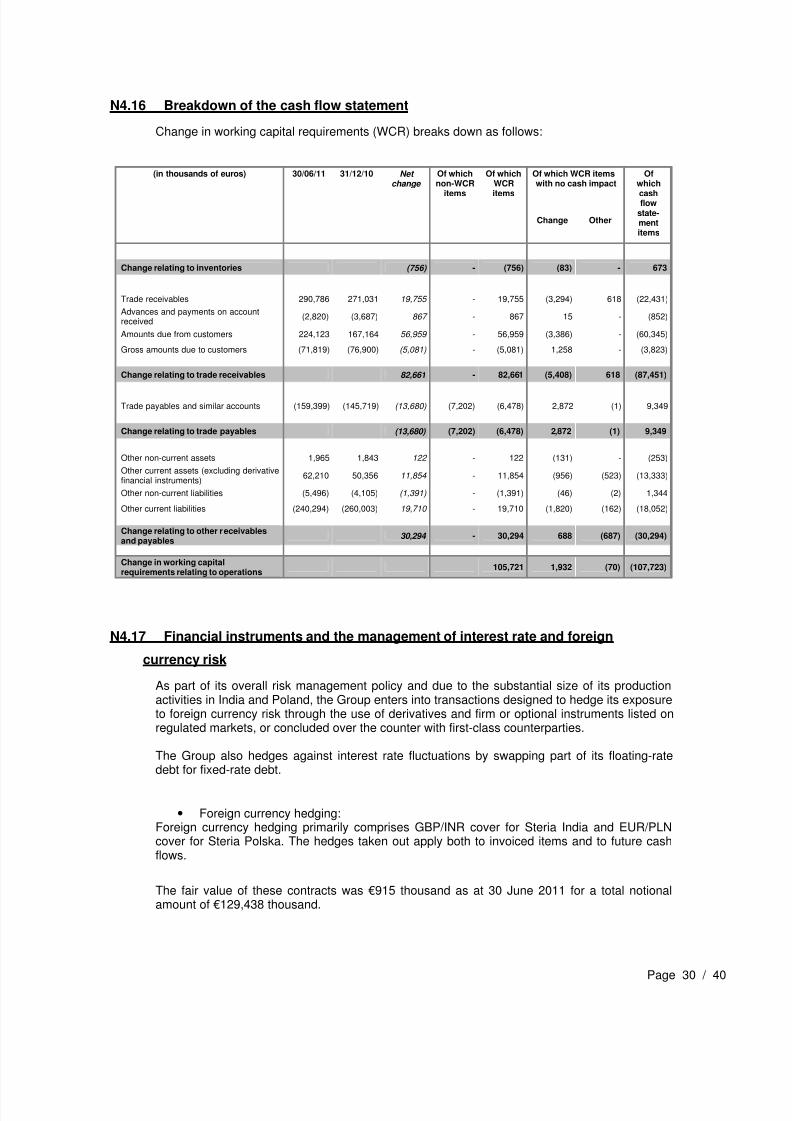
N4.16 Breakdown of the cash flow statement
Change in working capital requirements (WCR) breaks down as follows:
(in thousands of euros) 30/06/11 31/12/10 Net
change
Of which
non-WCRitems
Of which
WCRitems
Of which WCR items
with no cash impact
Of
whichcashflow
state-mentitems
Change Other
Change relating to inventories (756) - (756) (83) - 673
Trade receivables 290,786 271,031 19,755 - 19,755 (3,294) 618 (22,431)
Advances and payments on accountreceived
(2,820) (3,687) 867 - 867 15 - (852)
Amounts due from customers 224,123 167,164 56,959 - 56,959 (3,386) - (60,345)
Gross amounts due to customers (71,819) (76,900) (5,081) - (5,081) 1,258 - (3,823)
Change relating to trade receivables 82,661 - 82,661 (5,408) 618 (87,451)
Trade payables and similar accounts (159,399) (145,719) (13,680) (7,202) (6,478) 2,872 (1) 9,349
Change relating to trade payables (13,680) (7,202) (6,478) 2,872 (1) 9,349
Other non-current assets 1,965 1,843 122 - 122 (131) - (253)
Other current assets (excluding derivativefinancial instruments)
62,210 50,356 11,854 - 11,854 (956) (523) (13,333)
Other non-current liabilities (5,496) (4,105) (1,391) - (1,391) (46) (2) 1,344
Other current liabilities (240,294) (260,003) 19,710 - 19,710 (1,820) (162) (18,052)
Change relating to other receivables
and payables30,294 - 30,294 688 (687) (30,294)
Change in working capitalrequirements relating to operations
105,721 1,932 (70) (107,723)
N4.17 Financial instruments and the management of interest rate and foreign
currency risk
As part of its overall risk management policy and due to the substantial size of its productionactivities in India and Poland, the Group enters into transactions designed to hedge its exposureto foreign currency risk through the use of derivatives and firm or optional instruments listed onregulated markets, or concluded over the counter with first-class counterparties.
The Group also hedges against interest rate fluctuations by swapping part of its floating-ratedebt for fixed-rate debt.
• Foreign currency hedging:Foreign currency hedging primarily comprises GBP/INR cover for Steria India and EUR/PLNcover for Steria Polska. The hedges taken out apply both to invoiced items and to future cashflows.
The fair value of these contracts was €915 thousand as at 30 June 2011 for a total notional
amount of €129,438 thousand.
7/29/2019 Groupe Steria Sca 2011 Half Year Financial Report Ve 01
http://slidepdf.com/reader/full/groupe-steria-sca-2011-half-year-financial-report-ve-01 31/40
Page 31 / 40
• Interest rate hedging
As at 30 June 2011, the Group entered into several interest rate swaps, with a notional value ofGBP 40,000 thousand and €180,000 thousand and a fair value of €1,097 thousand.
Total gross borrowings subject to interest rate risk amount to €322.6 million. This exposure wasreduced to €98.3 million based on interest rate hedging agreements in place as at 30 June
2011.
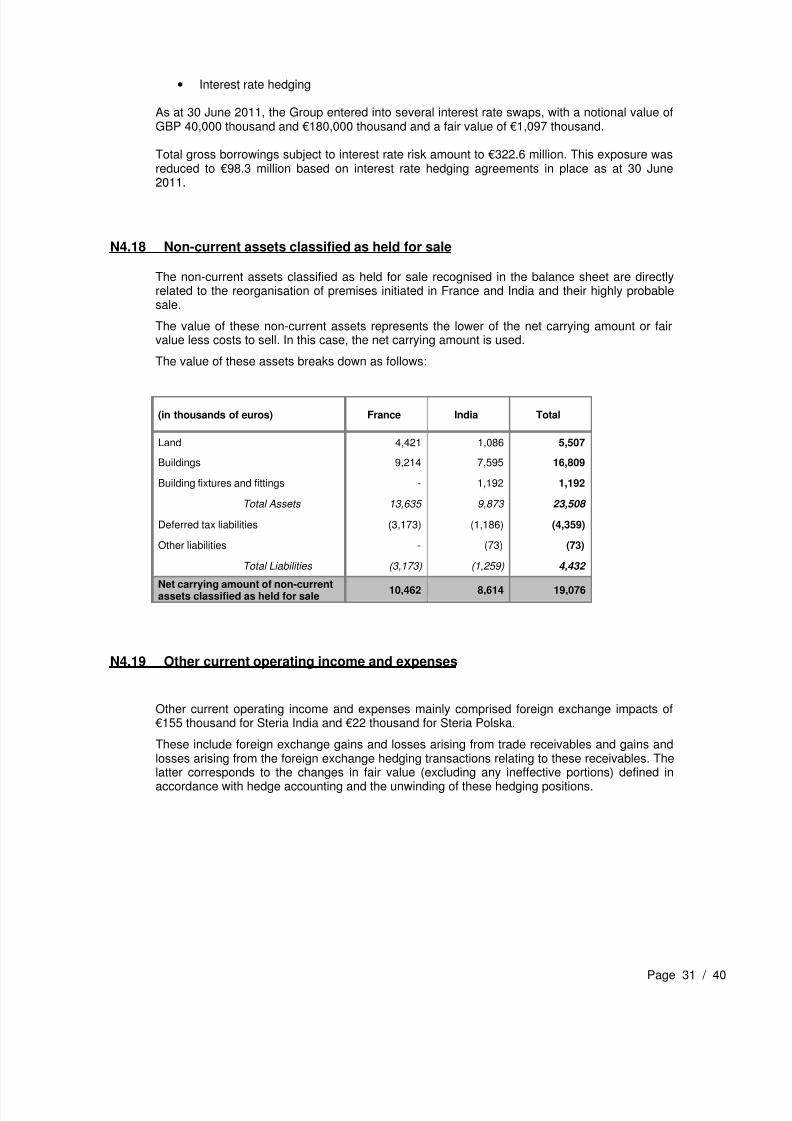
N4.18 Non-current assets classified as held for sale
The non-current assets classified as held for sale recognised in the balance sheet are directlyrelated to the reorganisation of premises initiated in France and India and their highly probablesale.
The value of these non-current assets represents the lower of the net carrying amount or fairvalue less costs to sell. In this case, the net carrying amount is used.
The value of these assets breaks down as follows:
(in thousands of euros) France India Total
Land 4,421 1,086 5,507
Buildings 9,214 7,595 16,809
Building fixtures and fittings - 1,192 1,192
Total Assets 13,635 9,873 23,508
Deferred tax liabilities (3,173) (1,186) (4,359)
Other liabilities - (73) (73)
Total Liabilities (3,173) (1,259) 4,432
Net carrying amount of non-currentassets classified as held for sale
10,462 8,614 19,076
N4.19 Other current operating income and expenses
Other current operating income and expenses mainly comprised foreign exchange impacts of
€155 thousand for Steria India and €22 thousand for Steria Polska.
These include foreign exchange gains and losses arising from trade receivables and gains andlosses arising from the foreign exchange hedging transactions relating to these receivables. Thelatter corresponds to the changes in fair value (excluding any ineffective portions) defined inaccordance with hedge accounting and the unwinding of these hedging positions.
7/29/2019 Groupe Steria Sca 2011 Half Year Financial Report Ve 01
http://slidepdf.com/reader/full/groupe-steria-sca-2011-half-year-financial-report-ve-01 32/40
Page 32 / 40
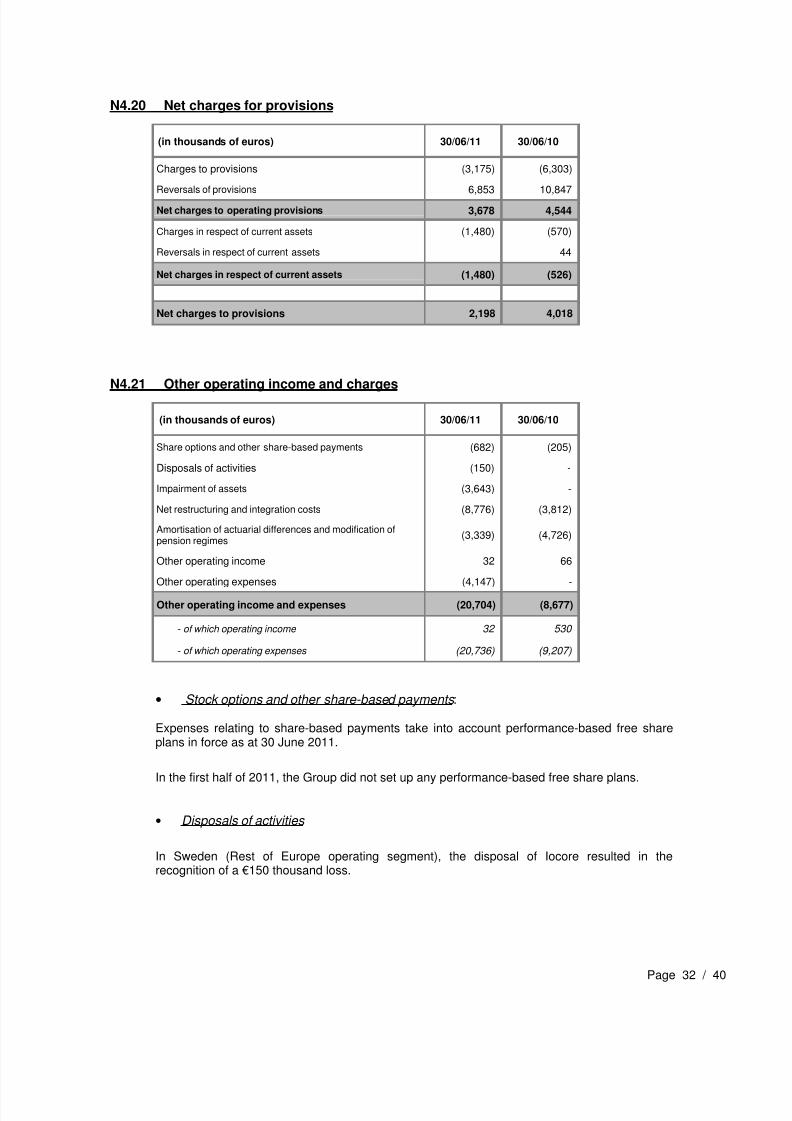
N4.20 Net charges for provisions
(in thousands of euros) 30/06/11 30/06/10
Charges to provisions (3,175) (6,303)
Reversals of provisions 6,853 10,847
Net charges to operating provisions 3,678 4,544
Charges in respect of current assets (1,480) (570)
Reversals in respect of current assets 44
Net charges in respect of current assets (1,480) (526)
Net charges to provisions 2,198 4,018
N4.21 Other operating income and charges
(in thousands of euros) 30/06/11 30/06/10
Share options and other share-based payments (682) (205)
Disposals of activities (150) -
Impairment of assets (3,643) -
Net restructuring and integration costs (8,776) (3,812)
Amortisation of actuarial differences and modification of
pension regimes (3,339) (4,726)
Other operating income 32 66
Other operating expenses (4,147) -
Other operating income and expenses (20,704) (8,677)
- of which operating income 32 530
- of which operating expenses (20,736) (9,207)
• Stock options and other share-based payments :
Expenses relating to share-based payments take into account performance-based free shareplans in force as at 30 June 2011.
In the first half of 2011, the Group did not set up any performance-based free share plans.
• Disposals of activities
In Sweden (Rest of Europe operating segment), the disposal of Iocore resulted in therecognition of a €150 thousand loss.
7/29/2019 Groupe Steria Sca 2011 Half Year Financial Report Ve 01
http://slidepdf.com/reader/full/groupe-steria-sca-2011-half-year-financial-report-ve-01 33/40
Page 33 / 40
• Impairment of assets
In connection with the change to premises planned in France and India, the Group recordedaccelerated depreciation charges for the scrapping of assets and fixtures and fittings that willnot be transferred to the future premises. As at 30 June 2011, the impact of this additional
depreciation compared to the initial useful life totalled €3,643 thousand.
• Net restructuring and integration costs:
The Group’s restructuring and integration efforts in the first half of 2011 continued to focus onthe reorganisation of operations following the acquisition of Xansa, in particular the streamliningof infrastructures. These costs totalled €4,173 thousand.
In addition, the Group undertook to adapt its resources over the period. These costs totalled€4,602 thousand.
• Amortisation of actuarial gains and losses and amendment of retirement plans (see
Note 4.12):
Corridor limits were exceeded due to changes in retirement obligations, mainly in the UnitedKingdom, and in the actuarial criteria used for their measurement. Thus, actuarial gains andlosses representing over 10% of the amount of obligations or the market value of theinvestments were recognised and amortised over the expected average working lives of theemployee beneficiaries. Accordingly, the Group recognised an actuarial loss of €3,339 thousand(of which €3,183 thousand for plans in the United Kingdom).
• Other operating expenses:
In connection with the change to premises planned in France in 2011 and to finance the related
costs, the Group provided for the impact of such changes in the amount of €3,161 thousand. Itmainly breaks down into double lease payments and property refurbishing costs.
In connection with the change to premises planned in India, the Group settled double leasepayments in the amount of €995 thousand.
7/29/2019 Groupe Steria Sca 2011 Half Year Financial Report Ve 01
http://slidepdf.com/reader/full/groupe-steria-sca-2011-half-year-financial-report-ve-01 34/40
Page 34 / 40
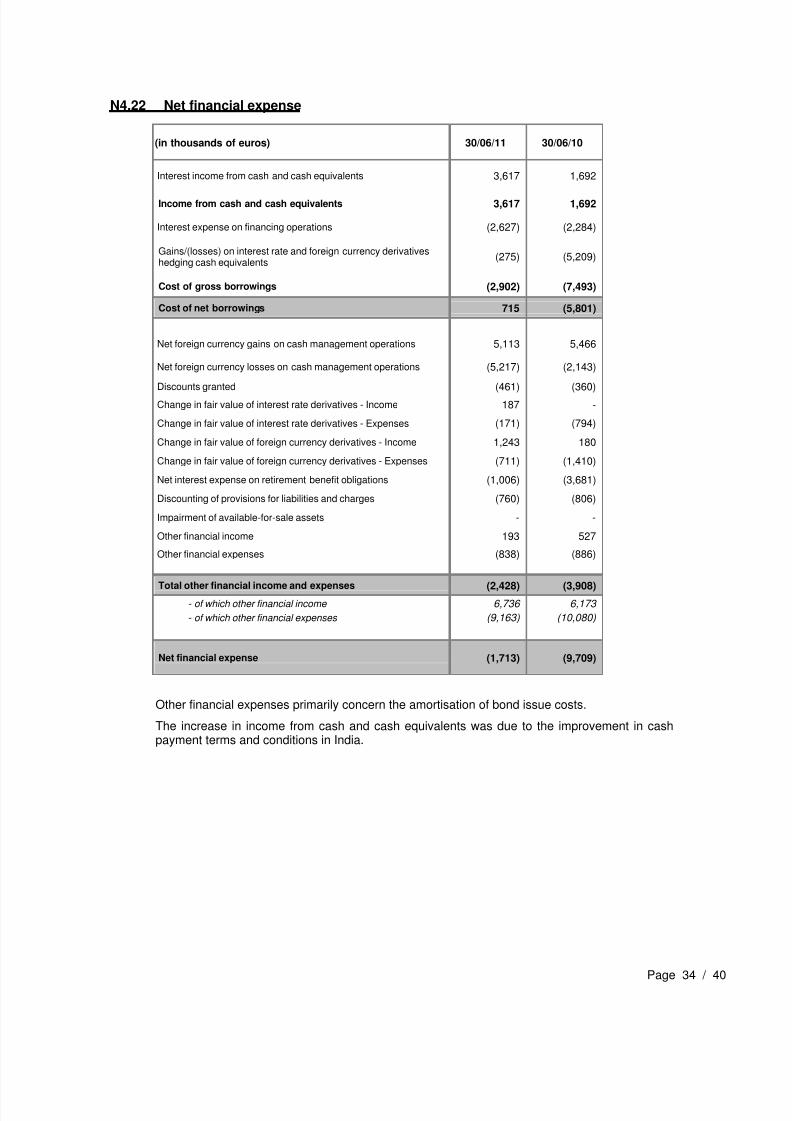
N4.22 Net financial expense
(in thousands of euros) 30/06/11 30/06/10
Interest income from cash and cash equivalents 3,617 1,692
Income from cash and cash equivalents 3,617 1,692
Interest expense on financing operations (2,627) (2,284)
Gains/(losses) on interest rate and foreign currency derivativeshedging cash equivalents
(275) (5,209)
Cost of gross borrowings (2,902) (7,493)
Cost of net borrowings 715 (5,801)
Net foreign currency gains on cash management operations 5,113 5,466
Net foreign currency losses on cash management operations (5,217) (2,143)
Discounts granted (461) (360)
Change in fair value of interest rate derivatives - Income 187 -
Change in fair value of interest rate derivatives - Expenses (171) (794)
Change in fair value of foreign currency derivatives - Income 1,243 180
Change in fair value of foreign currency derivatives - Expenses (711) (1,410)
Net interest expense on retirement benefit obligations (1,006) (3,681)
Discounting of provisions for liabilities and charges (760) (806)
Impairment of available-for-sale assets - -
Other financial income 193 527
Other financial expenses (838) (886)
Total other financial income and expenses (2,428) (3,908)
- of which other financial income 6,736 6,173
- of which other financial expenses (9,163) (10,080)
Net financial expense (1,713) (9,709)
Other financial expenses primarily concern the amortisation of bond issue costs.
The increase in income from cash and cash equivalents was due to the improvement in cashpayment terms and conditions in India.
7/29/2019 Groupe Steria Sca 2011 Half Year Financial Report Ve 01
http://slidepdf.com/reader/full/groupe-steria-sca-2011-half-year-financial-report-ve-01 35/40
Page 35 / 40
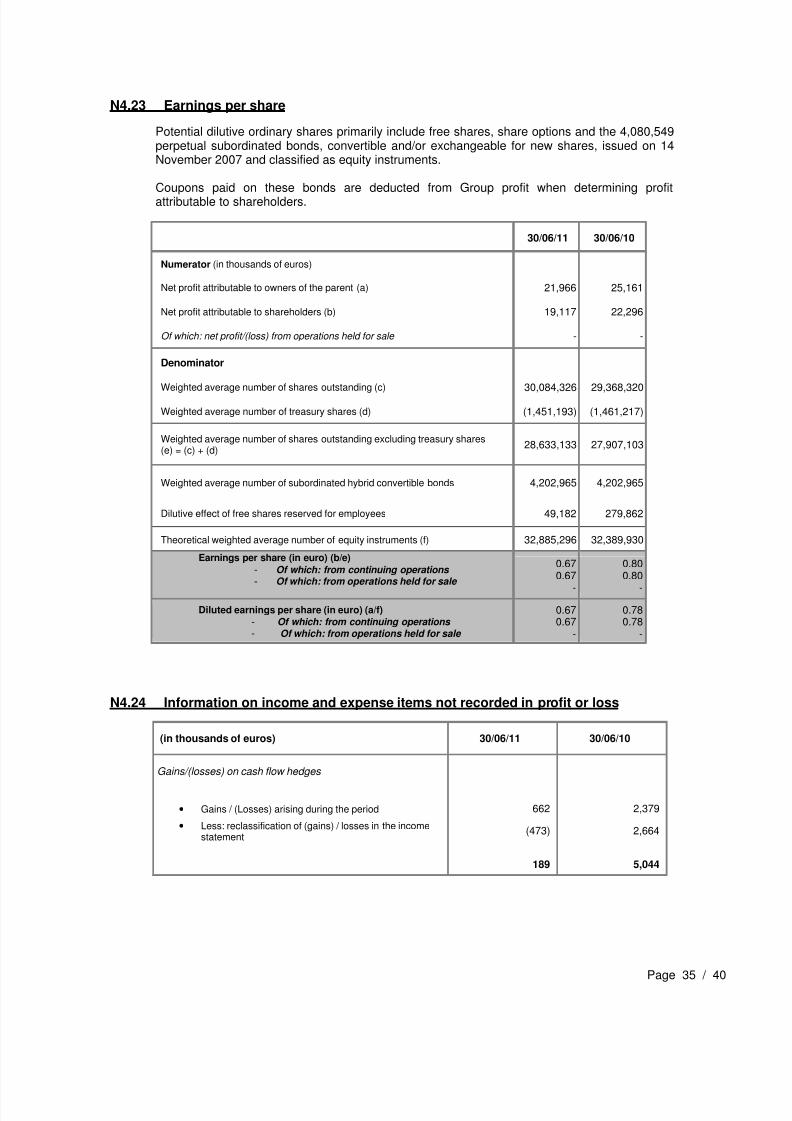
N4.23 Earnings per share
Potential dilutive ordinary shares primarily include free shares, share options and the 4,080,549perpetual subordinated bonds, convertible and/or exchangeable for new shares, issued on 14November 2007 and classified as equity instruments.
Coupons paid on these bonds are deducted from Group profit when determining profitattributable to shareholders.
30/06/11 30/06/10
Numerator (in thousands of euros)
Net profit attributable to owners of the parent (a) 21,966 25,161
Net profit attributable to shareholders (b) 19,117 22,296
Of which: net profit/(loss) from operations held for sale - -
Denominator
Weighted average number of shares outstanding (c) 30,084,326 29,368,320
Weighted average number of treasury shares (d) (1,451,193) (1,461,217)
Weighted average number of shares outstanding excluding treasury shares(e) = (c) + (d)
28,633,133 27,907,103
Weighted average number of subordinated hybrid convertible bonds 4,202,965 4,202,965
Dilutive effect of free shares reserved for employees 49,182 279,862
Theoretical weighted average number of equity instruments (f) 32,885,296 32,389,930Earnings per share (in euro) (b/e)
- Of which: from continuing operations - Of which: from operations held for sale
0.670.67
-
0.800.80
-
Diluted earnings per share (in euro) (a/f) - Of which: from continuing operations - Of which: from operations held for sale
0.670.67
-
0.780.78
-
N4.24 Information on income and expense items not recorded in profit or loss
(in thousands of euros) 30/06/11 30/06/10
Gains/(losses) on cash flow hedges
• Gains / (Losses) arising during the period 662 2,379
• Less: reclassification of (gains) / losses in the incomestatement
(473) 2,664
189 5,044
7/29/2019 Groupe Steria Sca 2011 Half Year Financial Report Ve 01
http://slidepdf.com/reader/full/groupe-steria-sca-2011-half-year-financial-report-ve-01 36/40
Page 36 / 40
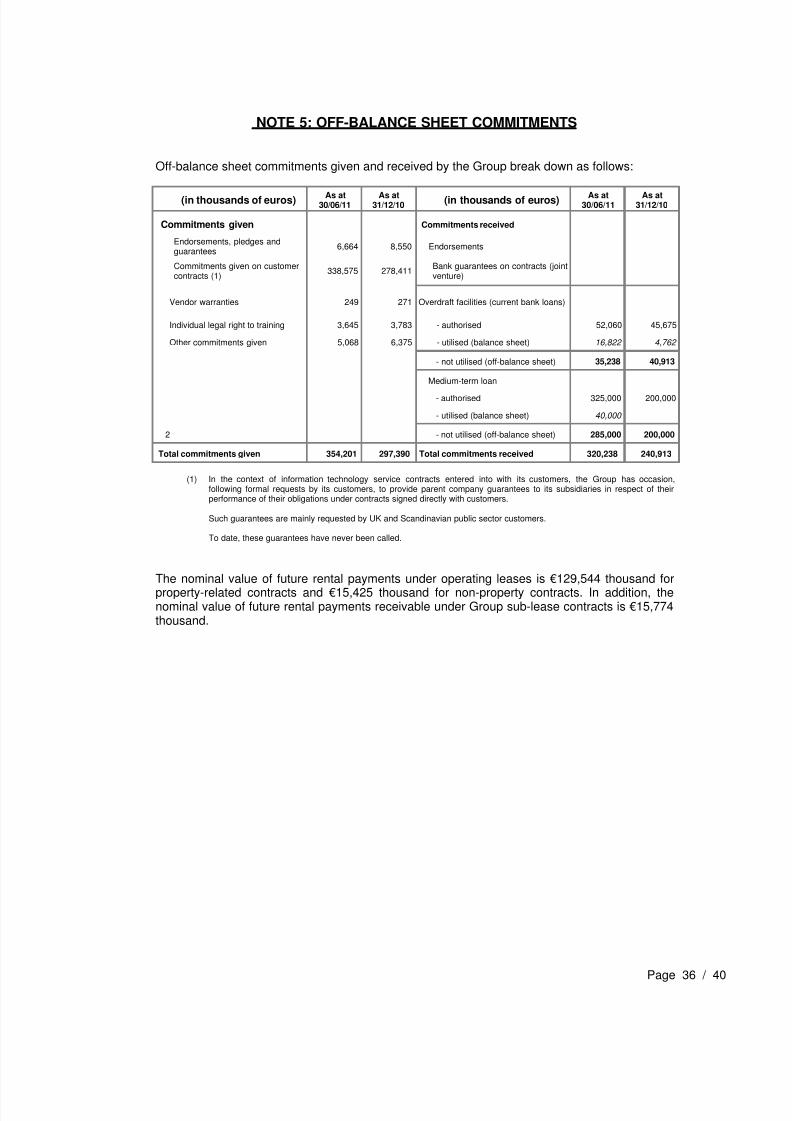
NOTE 5: OFF-BALANCE SHEET COMMITMENTS
Off-balance sheet commitments given and received by the Group break down as follows:
(in thousands of euros) As at
30/06/11As at
31/12/10(in thousands of euros)
As at30/06/11
As at31/12/10
Commitments given Commitments received
Endorsements, pledges andguarantees
6,664 8,550 Endorsements
Commitments given on customercontracts (1)
338,575 278,411Bank guarantees on contracts (jointventure)
Vendor warranties 249 271 Overdraft facilities (current bank loans)
Individual legal right to training 3,645 3,783 - authorised 52,060 45,675
Other commitments given 5,068 6,375 - utilised (balance sheet) 16,822 4,762
- not utilised (off-balance sheet) 35,238 40,913
Medium-term loan
- authorised 325,000 200,000
- utilised (balance sheet) 40,000
2 - not utilised (off-balance sheet) 285,000 200,000
Total commitments given 354,201 297,390 Total commitments received 320,238 240,913
(1) In the context of information technology service contracts entered into with its customers, the Group has occasion,following formal requests by its customers, to provide parent company guarantees to its subsidiaries in respect of theirperformance of their obligations under contracts signed directly with customers.
Such guarantees are mainly requested by UK and Scandinavian public sector customers.
To date, these guarantees have never been called.
The nominal value of future rental payments under operating leases is €129,544 thousand forproperty-related contracts and €15,425 thousand for non-property contracts. In addition, thenominal value of future rental payments receivable under Group sub-lease contracts is €15,774thousand.
7/29/2019 Groupe Steria Sca 2011 Half Year Financial Report Ve 01
http://slidepdf.com/reader/full/groupe-steria-sca-2011-half-year-financial-report-ve-01 37/40
Page 37 / 40
NOTE 6: POST-BALANCE SHEET EVENTS
No material events have taken place since 30 June 2011.
7/29/2019 Groupe Steria Sca 2011 Half Year Financial Report Ve 01
http://slidepdf.com/reader/full/groupe-steria-sca-2011-half-year-financial-report-ve-01 38/40
Page 38 / 40
III. Statutory Auditors’ Report on the financial information for the half- year ended 30 June 2011
This is a free translation into English of the statutory auditors' review report issued in French and is provided solely for the convenience of English-speaking users. This report should be read in conjunction with and construed in accordance with French law and professional auditing standards applicable in France
PIMPANEAU & ASSOCIESNEXIA INTERNATIONAL
23, rue Paul Valéry75116 Paris
S.A.S. au capital de € 120.000
Commissaire aux ComptesMembre de la compagnie
régionale de Paris
ERNST & YOUNG et Autres41, rue Ybry
92576 Neuilly-sur-Seine Cedex
S.A.S. à capital variable
Commissaire aux Comptes Membre de la compagnie
régionale de Versailles
Groupe Steria S.C.A.Period from January 1 to June 30, 2011
Statutory auditors' review report on the first half-yearly financial information
To the Shareholders,
In compliance with the assignment entrusted to us by your annual general meetings and in accordance with article L. 451-1-2
III of the French monetary and financial code (Code monétaire et financier ), we hereby report to you on:
• our review of the accompanying condensed half-yearly consolidated financial statements of Groupe Steria S.C.A., for the
period from January 1 to June 30, 2011, and
• the verification of the information contained in the interim management report.
These condensed half-yearly consolidated financial statements are the responsibility of management. Our role is to expressa conclusion on these financial statements based on our review.
1. Conclusion on the financial statements
We conducted our review in accordance with professional standards applicable in France. A review of interim financial
information consists in making inquiries, primarily of persons responsible for financial and accounting matters, and applying
analytical and other review procedures. A review is substantially less in scope than an audit conducted in accordance with
professional standards applicable in France and consequently does not enable us to obtain assurance that the financial
statements, taken as a whole, are free from material misstatements, as we would not become aware of all significant matters
that might be identified in an audit. Accordingly, we do not express an audit opinion.
7/29/2019 Groupe Steria Sca 2011 Half Year Financial Report Ve 01
http://slidepdf.com/reader/full/groupe-steria-sca-2011-half-year-financial-report-ve-01 39/40
Page 39 / 40
Based on our review, nothing has come to our attention that causes us to believe that these condensed half-yearly
consolidated financial statements are not prepared in all material respects in accordance with IAS 34 – IFRS as adopted by
the European Union applicable to interim financial information.
2. Specific verification
We have also verified the information provided in the interim management report in respect of the condensed half-yearly
consolidated financial statements that were the object of our review.
We have no matters to report on the fairness and consistency of this information with the condensed half-yearly consolidated
financial statements.
Paris and Neuilly-sur-Seine, July 28, 2011
The statutory auditors
French original signed by
PIMPANEAU ET ASSOCIES
NEXIA INTERNATIONAL
ERNST & YOUNG et Autres
Olivier Lelong Denis Thibon
7/29/2019 Groupe Steria Sca 2011 Half Year Financial Report Ve 01
http://slidepdf.com/reader/full/groupe-steria-sca-2011-half-year-financial-report-ve-01 40/40
IV. Declaration from the person responsible for the half-yearly financialreport
I hereby declare that to the best of my knowledge, the condensed consolidated financial statements
for the half year ended 30 June 2011 have been prepared in accordance with applicable accounting
standards and present a fair view of the assets, financial position and results of the company and all
companies included in the scope of consolidation and that the management report fairly presents all
major events during the first six months of the year, their impact on the accounts and the main
transactions between related parties and provides a description of the main risks and uncertainties
facing the Group in the remaining six months of the year.
28th July 2011,
_____________________ Mr. François EnaudGeneral Manager