Embed Size (px)
Citation preview
GreenTech made in Germany 2021Environmental Technology Atlas for Germany
GreenTech made in Germany 2021Environmental Technology Atlas for Germany
2 GreenTech made in Germany 2021
Publication details
Published byFederal Ministry for the Environment, Nature Conservation and Nuclear Safety (BMU) Division G I 4 · 11055 Berlin · Germany Email: [email protected] · Website: www.bmu.de/english
Edited byBMU, Division G I 4: Dr. Simon Marr, Sascha Klapproth
TextRoland Berger GmbH Ralph Büchele, Damien Schmidt, Anette von Löwenstern
Designdot.blue – communication & design
Picture creditsSee page 107
DateFebruary 2021
Download of this publicationwww.bmu.de/en/publications
NoticeThis publication of the Federal Ministry for the Environment, Nature Conservation and Nuclear Safety is distributed free of charge. It is not intended for sale and may not be used to canvass support for political parties or groups. Further information can be found at www.bmu.de/en/publications

3GreenTech made in Germany 2021
Contents
1 Preface 5
2 Executive summary 6
3 Mitigating climate change and protecting the environment: New opportunities, new challenges 10
3.1 Coronavirus and green stimulus packages 11
3.2 The European Green Deal 12
3.3 International sustainability strategies 13
3.4 The sustainability strategies of global corporations 13
3.5 Opportunities and risks for the German green tech industry 14
4 The global and national markets for environmental technology and resource efficiency 16
4.1 The lead markets for environmental technology and resource efficiency: Definitions and methodologies 17
4.2 Developments on international markets and in Germany 20
4.3 Focus on global and national lead markets 27
4.3.1 Environmentally friendly power generation, storage and distribution 27
4.3.2 Energy efficiency 33
4.3.3 Material efficiency 40
4.3.4 Sustainable mobility 45
4.3.5 Waste management and recycling 50
4.3.6 Sustainable water management 53
4.3.7 Sustainable agriculture and forestry 57
5 Survey of green tech providers: Inside view of a fast-growing industry 64
5.1 Environmental technology and resource efficiency players at a glance 65
5.1.1 Sales revenue and employees: Growth in the green tech industry 65
5.1.2 Green tech company portfolios: Knowledge-intensive services play a prominent role 69
5.2 Germany’s green tech industry: Business situation and business expectations 72
5.3 Global positioning and competitiveness of German green tech providers: “Green tech made in Germany” 76
Spotlight: How industry expertise and a profile as a system solution provider strengthen companies’ position on foreign markets 82
6 Green potential arising from the new transportation paradigm 84
6.1 How technology and services are helping us move toward “net zero” transportation 86
6.1.1 Drivetrain electrification and other alternative drive technologies 86
6.1.2 Developing, producing, reusing and recycling battery systems 87
6.1.3 Charging infrastructure and services 88
6.1.4 Integration in the energy sector 89
6.2 The road from private motorized traffic to individualized public transport 90
6.3 New digital business models in the mobility sector 92
6.4 Global market opportunities for the green tech industry in the mobility sector 93
List of tables and figures 94
Bibliography 98
Index of abbreviations 102
Sources 104
Picture credits 107


5GreenTech made in Germany 2021
-
-
--
-
1
PrefaceFor twelve years now, the GreenTech Atlas has been putting environmental technology and resource efficiency in the spotlight. It brings together the latest information on technologies, market sizes and expected growth rates in the industry’s various lead markets.
Environmental technology and the companies that operate in this space are of huge importance to Germany, contributing 15 percent to the country’s gross domestic product in 2020 – a figure that is still on the
rise, along with associated employment and revenue growth. In times of crisis, the green tech indus
try stabilizes economic development with its robust and sustainable business models. The Covid-19 pandemic, for example, has hit this industry much less hard than the economy as
a whole.
The green transformation is increasingly sweeping through areas of key social, economic and political relevance. Global challenges such as mitigating climate change and conserving resources demand complex solutions across different sectors. That is one reason why “green tech made in Germany” is so much in demand on the markets of the world: German companies deliver integrated solutions that are built around innovative products and services.
If Germany is to continue writing this success story, both its corporate community and the political echelons must ensure that the country’s environmental technology and resource efficiency industry maintains an ever sharper competitive edge. The GreenTech Atlas 2021 spells out both the vast growth potential afforded by green markets and the stand-out role that Germany plays in these markets. It documents the industry’s impressive capabilities and will help German companies make the most of global market and export opportunities.

2
Executive summary
Current political, social, technological and economic developments are driving the green tech industry as never before. These include the European Union’s Green Deal, but also increasing calls for sustainable development concepts as well as efforts to rebuild climate-friendly economies to overcome the Covid-19 pandemic.
7GreenTech made in Germany 2021
In the political context, the Green Deal proposed by the EU Commission – in conjunction with the multiannual financial framework already resolved by the European Union (EU) for the period from 2021-2027 and the stimulus package – will be of pivotal importance. Once finalized by the European Union, the scope and implications of this unprecedented bundle of measures and investments will usher in an era of ecological modernization, help low-carbon technologies make the breakthrough and, by 2050, establish Europe as the first climate-neutral continent.
-
-
-
On the social level, demand for new and sustainable ways of living and working has been on the rise for years. This is reflected not only in the success of the worldwide “Fridays for Future” movement: It can also be seen in more widespread use of new mobility concepts, which are booming in urban settings in particular. Digitalization, too, is accelerating this trend by opening up new business models and platform solutions.
-
Around the globe, there is a unique opportunity for climate change mitigation projects to be instrumental in rebuilding national economies after the Covid-19 pandemic. In the wake of the massive economic implosion at the start of last year, numerous development programs – first and foremost the EU’s stimulus package – are fostering hope of fresh impetus from selective investment in forward-looking technologies. This could shore up European providers’ ability to compete and either protect or create suitably qualified jobs. At a time when many other industries are struggling with the consequences of disruption, crumbling demand and changing consumer habits, the green tech industry faces sound growth prospects from which German companies in particular can benefit handsomely.
-
-
Forecasts of global and national market growth have received clear confirmation and continue to underpin a positive outlook
The global market volume for environmental technology and resource efficiency exceeded the 4 trillion euro mark for the first time in 2020. As current figures show, projected growth rates on both global and national green tech markets have consistently been surpassed. While the 2016 edition of the GreenTech Atlas predicted a market volume of 4,200 billion euros in 2020, the actual figure now stands at 4,628 billion euros. This new record continues the growth trajectory this cross-sector industry has experienced in recent years.
-
- -
Going forward, the outlook remains bright, with the green tech industry on course for further expansion. Market forecasts across the seven lead markets put the industry’s global market volume at 9.38 trillion euros in 2030, mirroring average annual growth of 7.3 percent. Green tech’s long-standing growth curve thus continues unabated, even as the key market drivers themselves are gathering new strength.
In Germany, the industry is even outpacing the dynamism of the global market. In 2020, Germany’s environmental technology and resource efficiency sector recorded a market volume of 392 billion euros. This figure will more than double to 856 billion euros by 2030, which works out at average annual growth of 8.1 percent. Energy efficiency remains the biggest lead market (117 billion euros), followed in second place by sustainable mobility (91 billion euros).
Buoyant technological development across the global lead markets
The energy transition is driving the lead market for environmentally friendly power generation, storage and distribution. Alongside renewable energies in the form of solar and wind power, storage technologies centered around batteries and hydrogen will further fuel the market in the future. Here, projected average annual growth of 8.5 percent through 2030 is above the average for the green tech industry as a whole. Additionally, extensive investment is needed to fund growing convergence in the generation, distribution and consumption of power and heat.
-
In the lead market for sustainable mobility, demand is shifting away from efficiency technologies and toward e-mobility. By far the fastest growth is taking place in alternative drive technologies. Between 2020 and 2030, annual average growth of 13.3 percent should boost this market segment to a global market volume of 623 billion euros (up from 34 billion euros in 2016).
Sustainable water management is constantly gaining in importance. Population growth, rising water consumption and increasing pollution are the causes of persistent strong demand and should see the global market volume top a trillion euros by 2030. Surging upward at an average rate of over 21 percent per year through 2030, efficiency gains in water usage is the segment with the greatest potential.

8 GreenTech made in Germany 2021
Constant growth highlights the value and economic importance of the green tech industry for Germany
Between now and 2025, the companies surveyed anticipate annual average revenue growth of 9.9 percent. Providers in the lead markets for sustainable mobility and energy efficiency expect to experience the strongest growth, with average annual growth of 12.9 percent projected in both markets through 2025. The number of employees will likewise continue to increase in the coming years, with companies in Germany expecting the workforce to expand by 6.8 percent per year on average through 2025. Firms focused on the lead market for energy efficiency predict the strongest growth (8.7 percent).
The German green tech industry is highly resilient. An online survey of around 400 companies conducted in spring 2020 shows that the industry has so far coped comparatively well with the crisis triggered by the Covid-19 pandemic. Nearly half of the respondent providers rate their current business situation as “satisfactory”, while 37 percent actually deem it to be “good”. Looking ahead, they expect negative fallout from the coronavirus to be much less pronounced in the green tech industry than for the macroeconomy. Whereas just under 40 percent of companies in the wider economy are bracing themselves for huge challenges in the wake of the pandemic, the comparable figure in environmental technology and resource efficiency is only 17 percent.
-
-
The green tech industry supplies systemic and crosssector solutions. The major social challenges of our day, such as mitigating climate change and conserving resources, can be mastered only by adopting a holistic
-
perspective of ecosystems. Green tech’s combination of cross-sector products and services is one of its success factors – a clear strength of Germany’s environmental technology and resource efficiency industry. Sustainable business models and groundbreaking innovations indeed give Germany a global leading position in this sector.
-
“Green tech made in Germany” is much in demand, but international competition is growing fiercer
German providers are successfully defending their position on the global market. Environmental technology and resource efficiency products, processes and services made in Germany command worldwide respect and underpin the German industry’s impressive export performance. While this country accounts for only around 3 percent of global economic output, its environmental technology and resource efficiency companies hold a 14 percent share of their market worldwide. Europe remains the foremost target market for German green tech providers, although Brazil, Mexico, Canada, Japan and South Korea are also gaining in importance, alongside Russia and China.
-
-
-
The EU’s Eco-Management and Audit Scheme (EMAS) is a voluntary premium environment management system rooted in an EU Regulation. EMAS supports companies to systematically evaluate every aspect of their direct and indirect impact on the environment, continually improve their environmental performance and submit yearly public reports. EMAS is therefore the right tool as the economy moves toward climate neutrality. The EMAS logo is awarded to companies that are successfully audited by third-party but state-approved environmental verifiers (see www.emas.de/en for more details).
International competition is heating up noticeably. An innovative green tech industry has sprung up in the United States of America and China in particular. These countries are penetrating the lead markets for waste management and recycling and for sustainable water management, for example, with products and services of their own. Global transformation processes, such as those in the energy sector and automotive engineering, are ramping up demand for new technologies. In the future, this will require a sharper focus on innovation
9GreenTech made in Germany 2021
and efficiency across the entire value chain: from customer acquisition through financing to operation and maintenance.
-
For German providers, the biggest challenge in the years ahead will be to defend their impressive position. To shore up their market success both at home and abroad in the future, German companies in the environmental technology and resource efficiency space need innovative products and, above all, a competitive cost structure. In product development, they must relentlessly optimize development costs and product designs as well as production and material costs. At the same time, process costs must be cut in purchasing, logistics, sales and the energy supply. It follows that digitalization, process efficiency and a rigorous focus on value are the most pressing challenges facing the industry if it is to stay competitive in the long term.
-
-
Green technologies are playing a key part in various environmental policies
Green technology brings economy and ecology together. The new transportation paradigm is a good example: Green mobility creates opportunities to substantially reduce greenhouse gas emissions that are harmful to the climate. But it also illustrates how the green tech industry is successfully positioning itself in the vanguard of tomorrow’s mobility system, which is also an attractive growth market. Germany has a worldwide reputation as a driver of innovation and ranks among the most innovative countries, according to the Global Innovation Index 2020.1 - German providers benefit from the fact that – from planning through implementation – the integrated, cross-sector and systemic solutions that are needed in the mobility sector number among their recognized strengths.
The mobility of the future is being crafted today by companies in the lead market for sustainable mobility. Their activities in e-mobility and the individualization of local public transport, coupled with the digital business models they devise, are making a significant contribution to the ecological transformation of the transport sector. In addition to electrification of the powertrain, hydrogen and fuel cells rank as two more key technologies, especially in areas where battery-powered electrification is not possible (such as in air transport, maritime transport, road haulage and industry). German companies also lead the field in the development, production, reuse and recycling of battery systems.
- -
Digital business models in the mobility space can drive greater sustainability. The constantly acceler-
ating pace of digitalization is enhancing the availability, quality and convenience of mobility offerings – for example by bundling services on a single platform. New smart mobility business models are springing up at the same time. The car-sharing market alone has expanded by over 10 percent per annum in recent years. In terms of its environmental impact in the mobility sector, digitalization is nevertheless a mixed blessing: It is true that the greater flexibility afforded by free-floating car-sharing models could encourage more people to opt against a car of their own, especially when autonomous driving takes off. On the other hand, such models will also compete with more energy-efficient modes of transport such as bicycles and local public transport. Another issue is that autonomous driving requires enormous quantities of data, which will in turn sharply increase power consumption in data centers. Policy decisions must therefore be well thought out if digitalized mobility is to genuinely serve the cause of sustainability.
-
-
-
The green transformation will protect the future viability of our society.Worries about the heavy consumption of resources tied to the way we currently live and work have long since joined concerns about climate change at the top of international policy agendas. Large swathes of the economic community, too, are stepping up to commit to better environmental protection, advancing a raft of initiatives – ultimately in the interest of protecting their own livelihood. While new technologies often used to be seen as the cause of the problem, they are now perceived as central to its resolution. Green technologies and innovative, resource-conserving business models are thus gaining in importance around the world. There can be no question: The success story and rapid growth of all lead markets for environmental technology and resource efficiency will continue. Why? Because without the support of this green economic powerhouse, the challenges of mitigating climate change and conserving natural resources simply cannot be mastered.
-
-

-
3
Mitigating climate change and protecting the environment: New opportunities, new challenges
How is the current Covid-19 pandemic affecting the green tech industry? And what political initiatives to mitigate climate change and protect the environment will influence the ongoing development of the market? This chapter outlines key environmental policies and provides an insight into the current corporate mood.
11GreenTech made in Germany 2021
3.1 Coronavirus and green stimulus packages
GreenTech made in Germany 2021
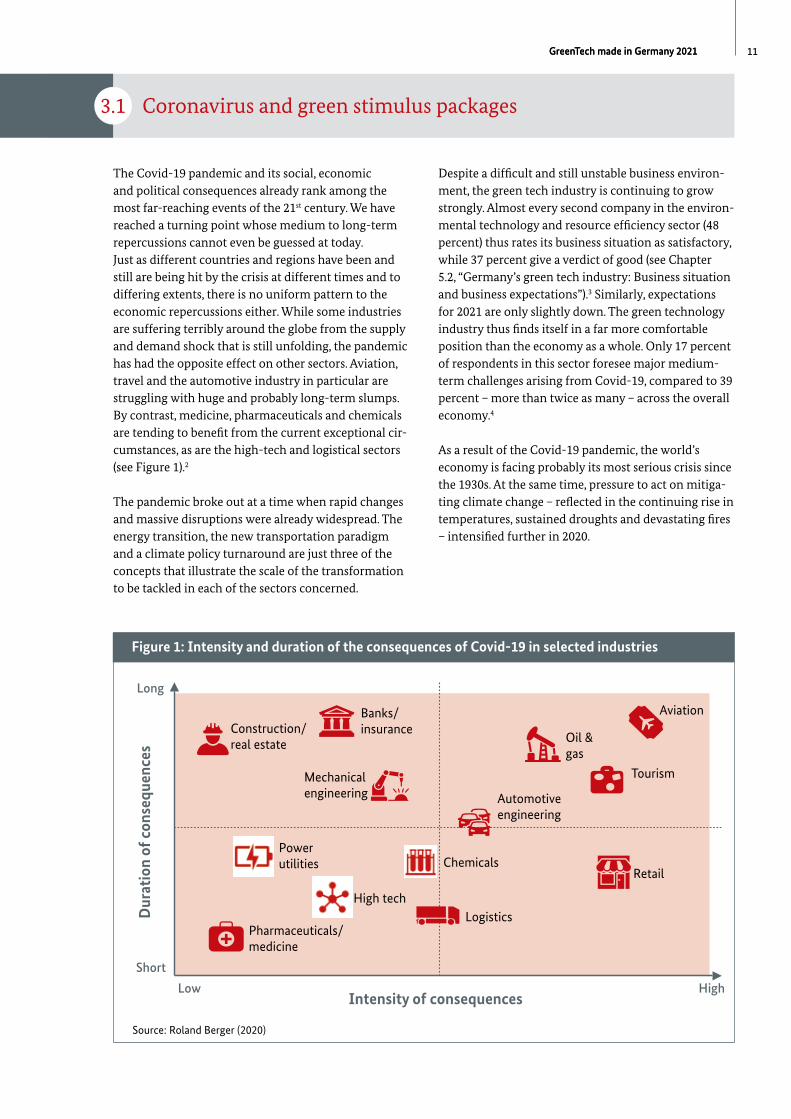
The Covid-19 pandemic and its social, economic and political consequences already rank among the most far-reaching events of the 21st century. We have reached a turning point whose medium to long-term repercussions cannot even be guessed at today. Just as different countries and regions have been and still are being hit by the crisis at different times and to differing extents, there is no uniform pattern to the economic repercussions either. While some industries are suffering terribly around the globe from the supply and demand shock that is still unfolding, the pandemic has had the opposite effect on other sectors. Aviation, travel and the automotive industry in particular are struggling with huge and probably long-term slumps. By contrast, medicine, pharmaceuticals and chemicals are tending to benefit from the current exceptional circumstances, as are the high-tech and logistical sectors (see Figure 1).2
-
-
-
-
-
Figure 1: Intensity and duration of the consequences of Covid-19 in selected industries
Source: Roland Berger (2020)
The pandemic broke out at a time when rapid changes and massive disruptions were already widespread. The energy transition, the new transportation paradigm and a climate policy turnaround are just three of the concepts that illustrate the scale of the transformation to be tackled in each of the sectors concerned.
Despite a difficult and still unstable business environment, the green tech industry is continuing to grow strongly. Almost every second company in the environmental technology and resource efficiency sector (48 percent) thus rates its business situation as satisfactory, while 37 percent give a verdict of good (see Chapter 5.2, “Germany’s green tech industry: Business situation and business expectations”).3 Similarly, expectations for 2021 are only slightly down. The green technology industry thus finds itself in a far more comfortable position than the economy as a whole. Only 17 percent of respondents in this sector foresee major mediumterm challenges arising from Covid-19, compared to 39 percent – more than twice as many – across the overall economy.4
As a result of the Covid-19 pandemic, the world’s economy is facing probably its most serious crisis since the 1930s. At the same time, pressure to act on mitigating climate change – reflected in the continuing rise in temperatures, sustained droughts and devastating fires – intensified further in 2020.
Figure 1: Intensity and duration of the consequences of Covid-19 in selected industries

12 GreenTech made in Germany 2021
In light of the economic challenges unleashed by the Covid-19 pandemic, experts and scientists5 are appealing for selective government investment programs to protect employment, ease the burden on the environment and promote climate-friendly innovation and technologies. The stimulus package ratified in June 2020 by the German government6, for example, envisages capital spending of around 50 billion euros in the industries of tomorrow. On the hydrogen front, spending of roughly 9 billion euros should help Germany become the world’s leading equipment provider for cutting-edge hydrogen technology. Between now and 2030, the plan is to set up production facilities capable
-
-
-
of implementing these technologies in Germany on an industrial scale. A network of hydrogen filling stations will be established in parallel to promote the use of hydrogen in heavy-duty traffic.
The expansion of renewable energies likewise continues to command high priority. In the stimulus package, the target for offshore wind power has been raised from 15 to 20 gigawatts per year by 2030. Designed to reduce carbon dioxide (CO2) emissions, the building modernization program for the years 2020 and 2021 has been ramped up from 1.5 to 2.5 billion euros.
-
3.2 The European Green Deal
Unquestionably the most powerful driver of the industry’s future development is the European Green Deal, unveiled by the EU Commission at the end of 2019 and supported by both the European Council and the European Parliament. The deal posits the EU’s new growth strategy on achieving climate neutrality by 2050, striking a balance between greenhouse gas emissions and the capture of those emissions, but also transitioning to a modern, resource-efficient and competitive economy and society.
-
-
-
Sectors and technologies
The Green Deal anticipates active contributions from every part of the economy. In the energy sector, it focuses on boosting energy efficiency and decarbonizing the energy system. To this end, massive support will be given to developing renewable energies and innovative technologies such as hydrogen networks, the capture, storage and use of CO2, and energy storage. Further action will be undertaken to anchor sustainable ways of living and working. These efforts will concentrate mainly on low-emission technologies and a working circular economy, especially in resource-intensive areas such as textiles, construction, electronics and plastics.
-
Other areas where action is needed include sustainable and smart mobility plus the development of a fair, healthy and ecologically sound food system. In addition, 35 million homes will have their energy systems refurbished as part of a large-scale renovation program over the next ten years.
-
Finance
The measures planned will demand a huge feat of financing. Published in January 2020, the Commission’s investment roadmap7 puts the total volume of private and public investments at one trillion euros through 2030. One key instrument in this process is what is known as the Just Transition Mechanism (JTM), which combines funds from the EU’s multiannual financial framework and the European Investment Bank (EIB). The JTM will also promote private investment. To cushion the socioeconomic impact of the “green transformation” in the period from 2021 through 2027, for example, some 100 billion euros will be channeled into those regions – such as coal-mining areas – that are worst affected by the structural transition.
-
13GreenTech made in Germany 2021
3.3 International sustainability strategies
Delegates from the 193 member states of the United Nations reached a further milestone along the path to sustainability when they ratified Agenda 2030 in 2015.8 This agenda stakes out the global framework for the international community’s environmental and development policy through 2030. Seventeen Sustainable Development Goals, or SDGs, are at the heart of Agenda 2030. The SDGs touch on all areas of policy, from economic, social and environmental policy through agricultural and consumer policy to aspects such as traffic and transport, urban development, education and healthcare.
-
In the same year, 2015, the “Paris Agreement” was signed at the Paris Climate Change Conference – the first comprehensive and legally binding worldwide climate change mitigation agreement to which industrial nations and emerging countries committed themselves.9 To mitigate climate change, the agreement seeks to keep the increase in average global temperatures well below two degrees Celsius in the long term, compared to preindustrial figures. Beyond this target, a concerted effort should also be made to keep the rise in temperature down to 1.5 degrees Celsius, and to improve countries’ ability to adapt to climate change.10 Moreover, global
-
-
-
financial flows are to be aligned with global climate change mitigation targets. The EU and its member states number among the nearly 190 signatories to the Paris Agreement.
By 2020, the signatory states were called on to present both revised climate change mitigation commitments for the decade to 2030 and a long-term strategy for the year 2050. In December 2020, the EU committed to reducing greenhouse gas emissions by at least 55 percent by 2030 compared to 1990 levels – a significantly higher target than the previously agreed minimum reduction of at least 40 percent.
-
At the 15th meeting of the Conference of the Parties in 2021,11 the 196 parties to the Convention on Biological Diversity (CBD) will also agree a new global framework for biodiversity for the period after 2020. This framework will be a global plan of action for the decades to come and will concern every relevant area of policy. Germany and the EU are advocating ambitious, measurable goals and clear implementation rules to ensure a reversal of the trend in the destruction of both nature and biodiversity.
-
3.4 The sustainability strategies of global corporations
Agenda 2030 also provides guidance to private companies as they move toward sustainable goals and activities. Progress toward reaching the global goals defined in the agenda will be tracked and measured with the aid of national sustainability strategies. Germany’s National Sustainable Development Strategy,12 updated in November 2018, specifies several indicators that can be used to record companies’ direct and indirect contributions, including gender equality, sustainable consumption and production patterns, and the promotion of sustained, inclusive and sustainable economic growth.
--
-
--
Many companies have launched their own initiatives to reduce greenhouse gas emissions that are harmful to the climate, make more efficient use of energy and cultivate a more responsible approach to materials
and resources. These enterprises have factored specific sustainability goals into their vision and corporate strategy. BASF is an example: One of the global chemical group’s plans, for example, is to achieve carbon-neutral growth by 2030. Another is to generate revenue of 22 billion euros from the sale of sustainable products by 2025.
-
Cleaning technology manufacturer Alfred Kärcher has applied an enterprise-wide “Sustainability Excellence” strategy since 2014. One result has been a more than 300 percent increase in the share of recycled plastics in its products.13 Symrise, the world’s leading provider of scents and flavorings for the perfume, cosmetics and food industries, uses plant-based feedstocks for the majority of its raw materials. These feedstocks are derived
-
14 GreenTech made in Germany 2021
from various ecosystems, where they are protected by a dedicated biodiversity agenda. As part of its climate strategy, Symrise aims to shave 18 percent off its CO2 emissions by 2030.
At Bosch, the largest automotive supplier in the world, the transformation toward sustainability is reflected above all in changes to its portfolio. Its range of e-mobility offerings is growing all the time. Beyond
that, the group is also actively involved in hydrogen and recently resolved to begin the volume production of fuel cells for cars and trucks. The entire group has been climate-neutral since 2020 thanks to energy-efficient buildings and plants.
3.5 Opportunities and risks for the German green tech industry
Over the years, the market development and growth figures presented in this series of publications bear witness to the continued rapid expansion of the green tech industry. Growth forecasts between now and 2030 average out at 7.3 percent per annum globally and 8.1 percent per annum for Germany. Some lead markets can look forward to substantially higher growth rates. For Germany’s green tech industry, too, innovation in electrification, hydrogen, the circular economy and smart city applications will create long-term sales and growth opportunities on the global market (see Chapters 4 and 5).
-
Let us take the lead market for sustainable mobility as an example. More and more countries have declared that combustion engines are to be discontinued: The United Kingdom and France want to have them banned for new vehicle registrations from 2040, with India doing the same from 2030 and Norway as early as 2025. Especially in Asia, relentless urbanization has brought mobility systems to the verge of collapse. Above all, new concepts are needed here to ensure that the mobility of the future remains climate-friendly in the long term. Two innovative mobility solutions are indicative of the market potential that exists worldwide: The global market volume for electric drive systems (batteries, motors, transmissions and charging devices) and shared mobility exceeds the potential in Germany alone by a factor of 24. The global shared mobility market alone is growing at a rate of 21 percent per annum (see Chapters 4.3.4 and 6.4).
-
-
At the same time, digitalization is paving the way to further dynamic development in the industry as it lays the basis for new products and services as well as innovative ways of using existing components. The Internet, software, apps and social networks, for example, are giving companies a digital interface to customers, creating opportunities to both selectively individualize
--
products and services and intensify interaction with market players. Digital ecosystems grow out of connectivity between machines and/or the sharing of data for various applications and users. One example from the lead market for sustainable mobility is Moovel. This app links the offerings of car-sharing provider Car2go, the Mytaxi start-up, German national rail carrier Deutsche Bahn and the local passenger transport utilities in many regions. In this way, systemically integrating an array of digital solutions, technologies, products and services is creating distinct digital ecosystems in the mobility space. Other useful illustrations include connected energy (the digital management of energy in buildings) and building information networks (connectivity systems for construction processes whose aim is to maximize the productivity of building materials as a resource throughout a building’s entire lifecycle).
-
-
-
-
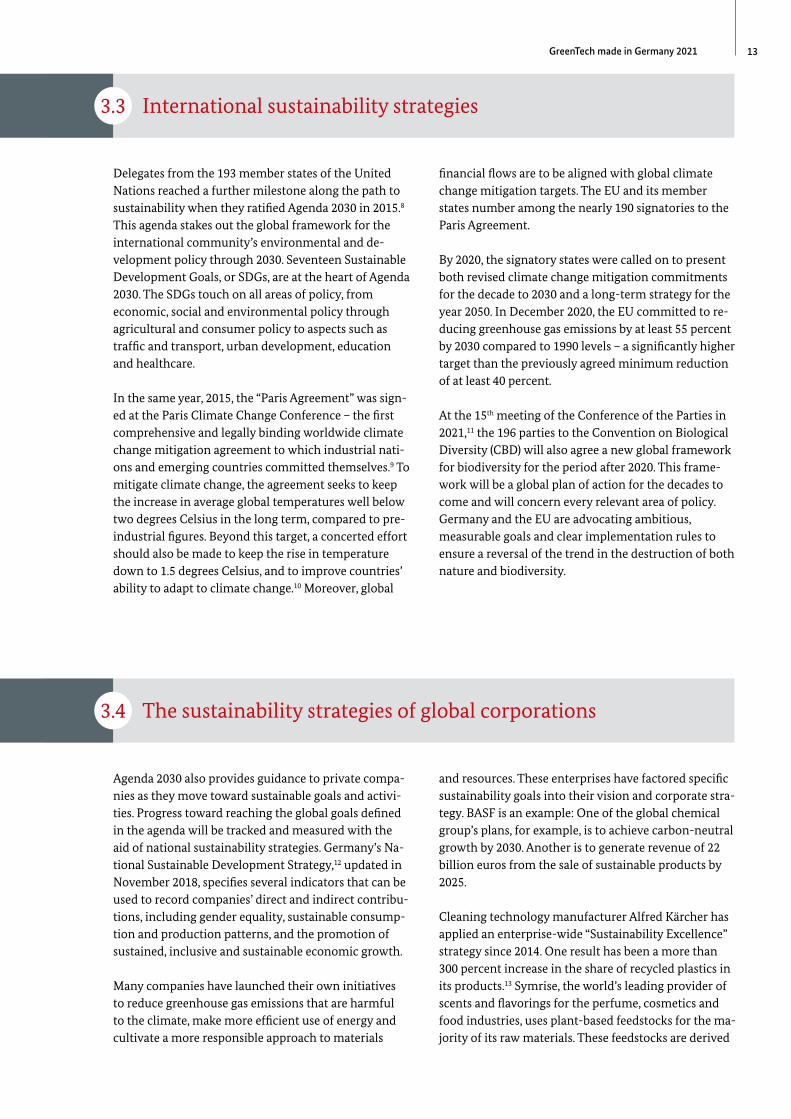
The topic of digitalization was also addressed in the company survey referred to above. A majority of the representatives of respondent companies evidently believe that digital technologies will improve their existing business models and service portfolios. 46 percent expect to see new sales channels and innovative forms of customer communication.14 Additionally, a large proportion of respondents anticipate that digitalization will open up new, data-driven business models as well as permitting further cost reductions and efficiency gains in internal processes (see Figure 2).
--
The challenge to the environmental technology and resource efficiency industry, however, is to genuinely realize the potential afforded by digitalization in order to sharpen its competitive edge in the international arena. Further advances are critical, especially in cost and process efficiency, to ensure that German companies stay profitable even as competition intensifies on international markets. While the industry is coming under pressure in particular from players in other Western European countries, competition from
-
-
-
15GreenTech made in Germany 2021
Eastern European, Russian and Chinese companies is also growing fiercer. Even players from other overseas countries (including South Korea, Japan and Mexico) will in future probably play a much weightier role on the markets of the world (see Chapter 5.3).
Figure 2: Company survey: Influence of climate policy instruments on corporate development in the green tech industry
To what extent do you agree with the following statements about the challenges that digitalization poses to your company?
-
-
-
-
- - + ++Digitalization harbors new security threats arising from a lack of data security
3%
16% 23% 34% 24%
Digitalization will increase energy consumption for data storage and data processing
5%17% 22% 35% 21%
Digitalization will add to innovative/competitive pressure from other market players, for example
7% 19% 27% 35% 12%
The digital transformation will necessitate greater voluntary commitments to mitigate climate change
9% 18% 32% 29% 11%
Digitalization will create new financing challenges and require heavy investment
11% 25% 33% 26% 5%
Digitalization will exacerbate the shortage of skilled labor by changing qualification requirements 20% 24% 29% 23%
4%Digitalization will (to some extent) pose a threat to our business model 40% 33% 19% 6%
2%Digitalization will mean that new sales channels/ intermediaries threaten existing customer access 52% 23% 17% 6%
2%
Disagree entirely - -
Agree to some extent -
Neutral o
Agree +
Strongly agree ++
Source: Company survey (337 respondents), Roland Berger (2020); bars in chart may vary due to rounding
Alongside the need for innovative products, German green tech companies can only operate successfully on the international market if they have competitive cost structures, as competition is increasing. Armed with innovative products and services, players from Europe, the USA and China are aggressively penetrating this attractive market – for example in the lead markets for waste management and recycling and sustainable water management. In terms of patents in the key environmental technologies, China has not only caught up with but actually overtaken the USA, which hitherto led the market.15 In recycling, this one country possesses about a quarter of all world-class patents.16 In water treatment, the corresponding figure is 36 percent. The implication is that, beside the ability to innovate, cost efficiency is likewise gaining ground as a pivotal competitive factor that will drive long-term profitability.
For the German green tech industry, this situation creates two challenges: In product development, it is essential to continually optimize development costs, product design and the cost of both production and materials. At the same time, a critical review of process costs in purchasing, logistics, sales and the power supply is equally necessary. Digitalization, operational excellence and a strict focus on value are among the most pressing topics that the industry must address in the future. The same goes for quality management and customer service. If the German industry fails to rise to these challenges, it runs the considerable risk of losing market share even as global growth gathers pace.
Figure 2: Company survey: Influence of climate policy instruments on corporate development in the green tech industry
34%
35%
35%
29%
26%
23%
6%
6%
24%
21%
12%
11%
5%
23%
22%
27%
32%
33%
29%
19%
17%
4
The global and national markets for environmental technology and resource efficiency
How is the environmental technology and resource efficiency industry structured? What are its various market segments? And what specific technologies make a tangible contribution to reducing resource consumption and mitigating climate change? This chapter explains the seven lead markets as a whole before zooming in on their individual importance and specific characteristics from a global and national perspective.
17GreenTech made in Germany 2021
-
-
-
-
-
-
4.1 The lead markets for environmental technology and resource
efficiency: Definitions and methodologies
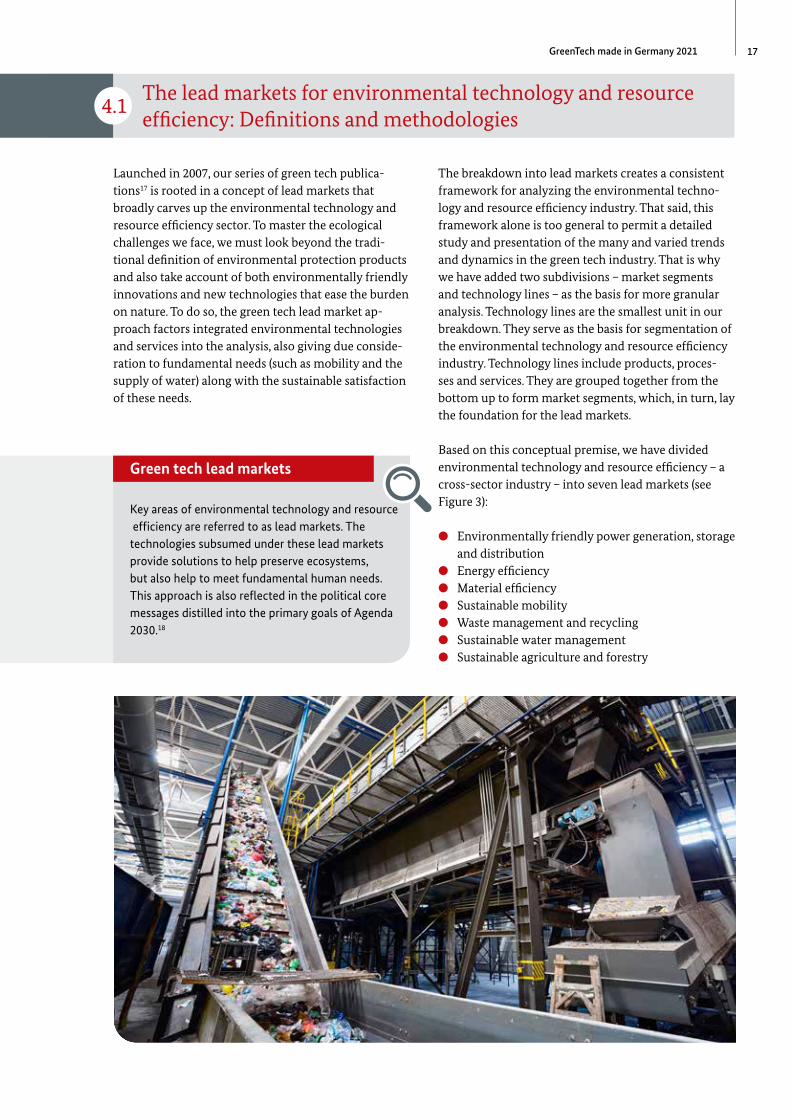
Launched in 2007, our series of green tech publications17 is rooted in a concept of lead markets that broadly carves up the environmental technology and resource efficiency sector. To master the ecological challenges we face, we must look beyond the traditional definition of environmental protection products and also take account of both environmentally friendly innovations and new technologies that ease the burden on nature. To do so, the green tech lead market approach factors integrated environmental technologies and services into the analysis, also giving due consideration to fundamental needs (such as mobility and the supply of water) along with the sustainable satisfaction of these needs.
Green tech lead markets
Key areas of environmental technology and resource efficiency are referred to as lead markets. The technologies subsumed under these lead markets provide solutions to help preserve ecosystems, but also help to meet fundamental human needs. This approach is also reflected in the political core messages distilled into the primary goals of Agenda 2030.18
The breakdown into lead markets creates a consistent framework for analyzing the environmental technology and resource efficiency industry. That said, this framework alone is too general to permit a detailed study and presentation of the many and varied trends and dynamics in the green tech industry. That is why we have added two subdivisions – market segments and technology lines – as the basis for more granular analysis. Technology lines are the smallest unit in our breakdown. They serve as the basis for segmentation of the environmental technology and resource efficiency industry. Technology lines include products, processes and services. They are grouped together from the bottom up to form market segments, which, in turn, lay the foundation for the lead markets.
Based on this conceptual premise, we have divided environmental technology and resource efficiency – a cross-sector industry – into seven lead markets (see Figure 3):
l Environmentally friendly power generation, storage and distribution
l Energy efficiencyl Material efficiencyl Sustainable mobilityl Waste management and recyclingl Sustainable water managementl Sustainable agriculture and forestry
Green tech lead markets

18 GreenTech made in Germany 2021
Figure 3: The seven lead markets for environmental technology and resource efficiency and their market segments
1 Environmentally friendly power generation, storage and distribution
· Renewable energies
· Ecofriendly use of fossil fuels
· Storage technologies
· Efficient grids
2 Energy efficiency
· Energy-efficient production processes
· Energy-efficient buildings
· Energy-efficient appliances
· Cross-sector components
3 Material efficiency
· Material-efficient processes
· Cross-application technologies
· Renewable resources
· Protection of environmental goods
· Climate-adapted infrastructure
4 Sustainable mobility
· Alternative drive technologies
· Renewable fuels
· Technologies to increase efficiency
· Transportation infrastructure and traffic management
5 Waste management and recycling
· Waste collection, transportation and separation
· Material recovery
· Energy recovery
· Landfill technologies
6 Sustainable water management
· Water production and treatment
· Water system
· Wastewater cleaning
· Wastewater treatment methods
· Efficiency gains in water usage
7 Sustainable agriculture and forestry
· Smart agricultural and forestry technologies
· Innovative forms of agriculture and forestry
· Sustainable fertilizers, crop protection and animal feed
Source: Roland Berger (2020)
Figure 3: The seven lead markets for environmental technology and resource efficiency and their market segments
19GreenTech made in Germany 2021
Now well established, the lead market approach facilitates comprehensive analysis of the cross-sector industry for environmental technology and resource efficiency from both the national and global perspectives. Integrated environmental protection products, processes and services can also be incorporated in this industry analysis – a vital consideration, given the growing importance of these integrated technologies. At the same time, this approach highlights the (close) links that exist between environmental technology and resource efficiency and the traditional branches of industry.
-
In some cases, there are substantial overlaps with key industries such as electrical, mechanical, plant and automotive engineering, as well as the chemical sector. These overlaps and touchpoints are indeed what identify environmental technology and resource efficiency as a typical cross-sector industry. It therefore stands to reason that the lead markets should not be understood as a hermetic partitioning system. On the contrary, approaches that transcend the boundaries of individual lead markets are tremendously important, especially as system solutions grow in importance. One example is an integrated view of the electricity, heating and mobility sectors.
-
-
-
-
-
Methodology: The basis for our market forecasts
The Roland Berger market model is a proven forecasting model developed specially for the environmental technology and resource efficiency industry. It covers current and future developments in the industry across all seven lead markets. For the 2021 edition of “GreenTech made in Germany”, the market model supplies market volume data for 2020 and projected growth rates through 2030 for both the national and global markets for environmental technology and resource efficiency. The primary data used was produced by Roland Berger exclusively for the GreenTech Atlas.
From the bottom up, a detailed model is provided of a total of 131 technology lines (products, processes and services), each of which can be examined individually. Analysis of sub-markets, lead markets and the overall market can be derived by aggregating the relevant technology lines.
The underlying data comes from German and international Roland Berger market studies, statistics and databases in the areas in question. To prepare market forecasts, Roland Berger uses a scenario planning approach built around varying future development trends, key trends in industry and a combination of internal and external views. The 2030 Trend Compendium established by Roland Berger serves as a good example: The methodological basis includes a 360-degree stakeholder analysis, analysis of trends and uncertainties (STEEP1) and a scenario evaluation matrix. The Roland Berger Institute (RBI), the Roland Berger Expert Network (www.rolandberger.com/de/About/Network/) and the Roland Berger Global Research Center were all involved in performing these analyses. Roland Berger’s international consultancy
team, featuring around 2,400 staff in 35 countries, operates in the most important markets and industries worldwide. Its 52 offices are located in the world’s leading business hubs.
The Roland Berger market model deliberately analyzes technologies at the lowest level of aggregation – not applications or goods for consumption, but simply technologies. Where a technology line – such as biomass – constitutes both a technology and a good for consumption, the market volume refers only to those aspects of the technology that are of relevance to green tech companies. For our purposes, the market volume in the technology line for biomass exploitation thus comprises generation technologies (biogas plants), means of transportation (special containers) and the use of biomass (such as firing chambers in cogeneration plants).
-
-
In some technology lines, green tech companies provide services to complement their products and processes. Other players specialize in consulting in the field of green tech applications. Services are structured and calculated on the basis of the study “Environmental technology services – Drivers of ecological modernization and employment”. Overall, this approach yields forecasts with a reliability of 95 percent – above all in highly dynamic markets such as e-mobility and hydrogen technology.
-
--
1STEEP = Social, Technological, Economic, Environmental,
Political/Legal
Methodology: The basis for our market forecasts
20 GreenTech made in Germany 2021
4.2 Developments on international markets and in Germany
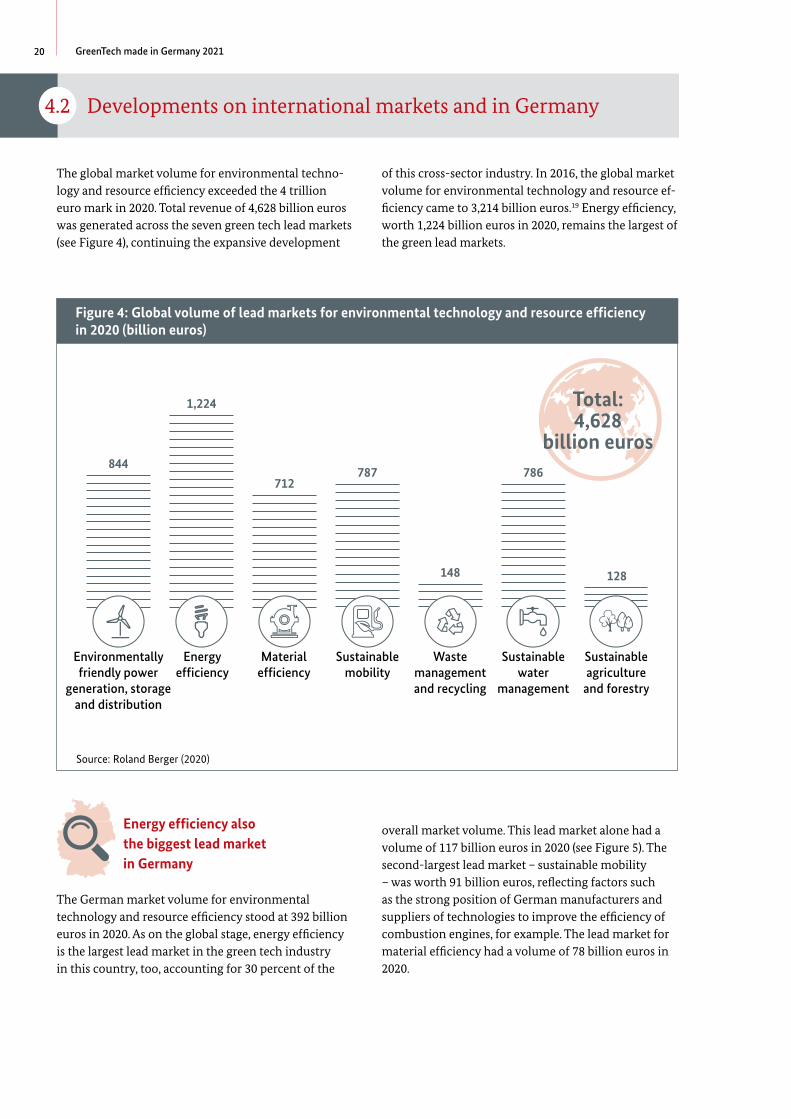
The global market volume for environmental technology and resource efficiency exceeded the 4 trillion euro mark in 2020. Total revenue of 4,628 billion euros was generated across the seven green tech lead markets (see Figure 4), continuing the expansive development
- of this cross-sector industry. In 2016, the global market volume for environmental technology and resource efficiency came to 3,214 billion euros.19 Energy efficiency, worth 1,224 billion euros in 2020, remains the largest of the green lead markets.
-
Figure 4: Global volume of lead markets for environmental technology and resource efficiency in 2020 (billion euros)
Environmentally friendly power
generation, storage and distribution
844
Energy efficiency
1,224
Material efficiency
712
Sustainable mobility
787
Waste management and recycling
148
Sustainable water
management
786
Sustainable agriculture
and forestry
128
Total: 4,628
billion euros
Source: Roland Berger (2020)
Energy efficiency also the biggest lead market in Germany
The German market volume for environmental technology and resource efficiency stood at 392 billion euros in 2020. As on the global stage, energy efficiency is the largest lead market in the green tech industry in this country, too, accounting for 30 percent of the
overall market volume. This lead market alone had a volume of 117 billion euros in 2020 (see Figure 5). The second-largest lead market – sustainable mobility – was worth 91 billion euros, reflecting factors such as the strong position of German manufacturers and suppliers of technologies to improve the efficiency of combustion engines, for example. The lead market for material efficiency had a volume of 78 billion euros in 2020.
Figure 4: Global volume of lead markets for environmental technology and resource efficiency in 2020 (billion euros)

21GreenTech made in Germany 2021
Figure 5: Volume of lead markets for environmental technology and resource efficiency in Germany in 2020 (billion euros)
Environmentally friendly power
generation, storage and distribution
40
Energy efficiency
117
Material efficiency
78
Sustainable mobility
91
Waste management and recycling
24
Sustainable water
management
39
Sustainable agriculture and
forestry
3
Total: 392
billion euros
Source: Roland Berger (2020)
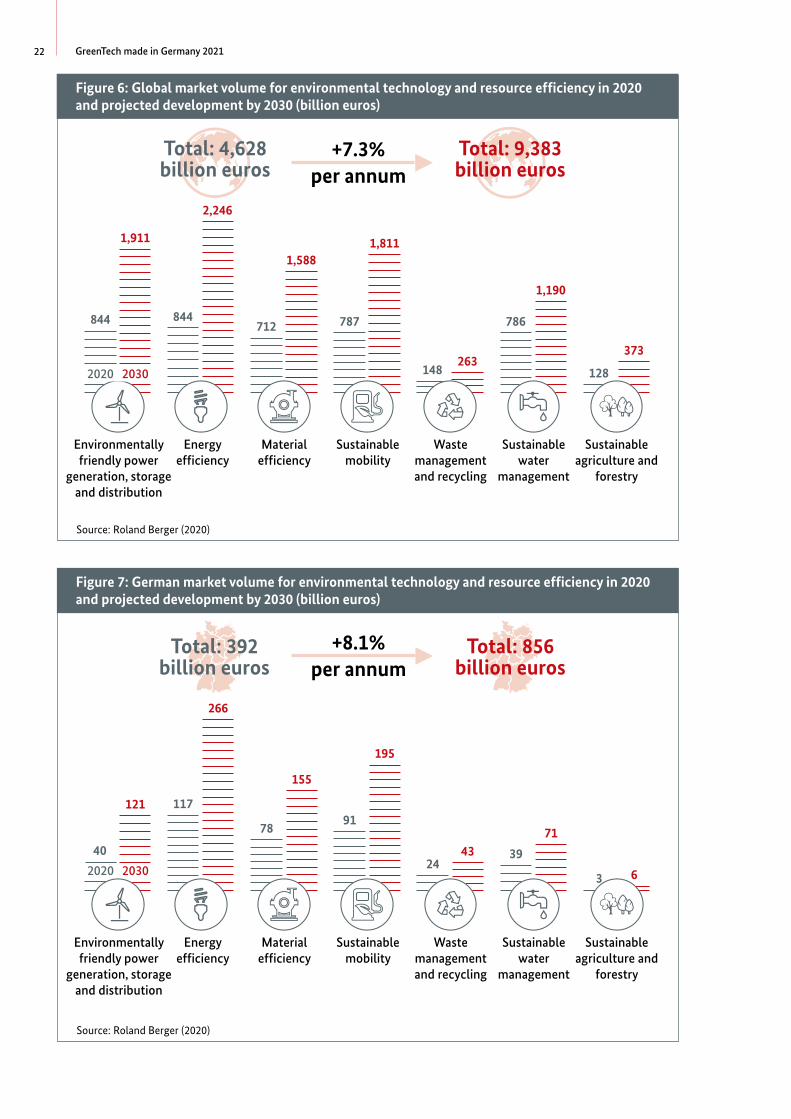
Demand for green products, processes and services will continue to increase in the years ahead. Backed by such fair winds, the green tech industry will proceed along its current growth trajectory both in the international arena and in Germany. The global market for environmental technology and resource efficiency will probably be worth 9,383 billion euros in 2030 (see Figure 6). In other words, this cross-sector industry will grow at an average annual rate of 7.3 percent in the period from 2020 through 2030.20
--
In Germany, environmental technology and resource efficiency will increase its market volume at an average annual rate of 8.1 percent through 2030 (see Figure 7). The rate of green tech expansion in this country will thus slightly outpace the global figure. This forecast mirrors the importance of an environmental policy that is supported by the regulatory framework and that creates reliable guidelines for business investment
decisions. At the same time, the expectations of customers in both the business-to-business and business-to-consumer segments will drive long-term demand for climate-friendly, environmentally compatible products and services.
Robust demand on their domestic market creates positive opportunities for green tech companies based in Germany. Enjoying far closer proximity to their customers, they can collaborate with users to tailor the development of new technologies to individual needs. Cooperation on their home market is also conducive to systemic approaches within the green tech industry. Thanks to their expertise in system solutions and their wealth of technological knowledge, German-based environmental technology providers in particular can enjoy international success while also tapping large shares of the domestic market volume.
Figure 5: Volume of lead markets for environmental technology and resource efficiency in Germany in 2020 (billion euros)
22 GreenTech made in Germany 2021
Figure 6: Global market volume for environmental technology and resource efficiency in 2020 and projected development by 2030 (billion euros)
2020 2030
Environmentally friendly power
generation, storage and distribution
844
1,911
Energy efficiency
844
2,246
Material efficiency
712
1,588
Sustainable mobility
787
1,811
Waste management and recycling
148263
Sustainable water
management
786
1,190
Sustainable agriculture and
forestry
128
373
Total: 4,628 billion euros
+7.3% per annum
Total: 9,383 billion euros
Source: Roland Berger (2020)
Figure 7: German market volume for environmental technology and resource efficiency in 2020 and projected development by 2030 (billion euros)
2020 2030
Environmentally friendly power
generation, storage and distribution
40
121
Energy efficiency
117
266
Material efficiency
78
155
Sustainable mobility
91
195
Waste management and recycling
2443
Sustainable water
management
39
71
Sustainable agriculture and
forestry
3 6
Total: 392 billion euros
+8.1% per annum
Total: 856 billion euros
Source: Roland Berger (2020)
Figure 6: Global market volume for environmental technology and resource efficiency in 2020 and projected development by 2030 (billion euros)
Figure 7: German market volume for environmental technology and resource efficiency in 2020 and projected development by 2030 (billion euros)
23GreenTech made in Germany 2021
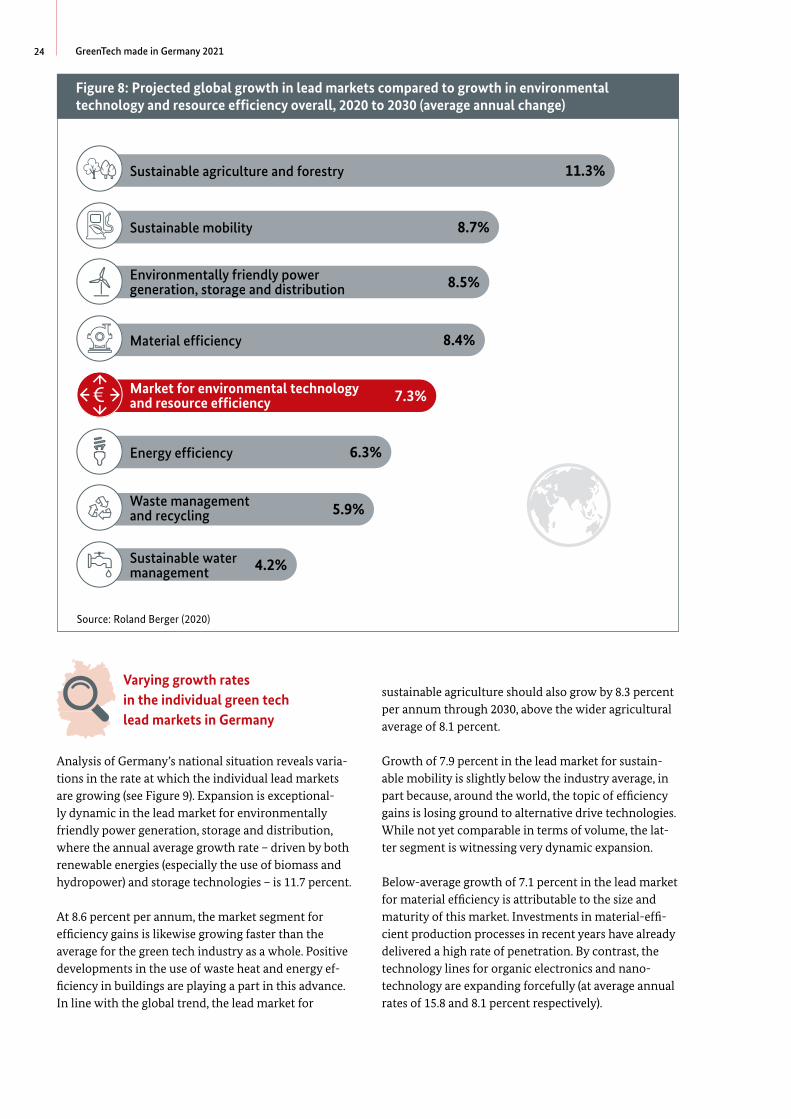
Within the overall market for environmental technology and resource efficiency, the individual lead markets are clearly growing at different rates on a global level. Expansion is fastest in the lead market for sustainable agriculture and forestry – one reason why it was included for the first time as a seventh lead market in this edition of the GreenTech Atlas. Between 2020 and 2030, sustainable agriculture will grow at an average annual rate of 11.3 percent (see Figure 8).
-
-
This rate of expansion reflects the efforts currently being made around the globe to redesign food production along sustainable lines, for example through smart farming technologies.
-
In second place is the lead market for sustainable mobility, with annual average growth of 8.7 percent. Alternative drive technologies play a central role in decarbonizing the transport sector, and growth in this segment is giving a boost to dynamic development across the entire lead market. This driver is itself backed by a shift in traffic policies in major markets, especially China. According to Chinese government plans, every fourth vehicle on the country’s roads should be an electric car by 2025.21
Growth in the lead market for environmentally friendly power generation, storage and distribution (at 8.5 percent) and the lead market for material efficiency (at 8.4 percent) is likewise above the average for the green tech industry as a whole. In the lead market for material efficiency, renewable resources – such as fuels and insulants from renewable materials, plus renewable resources used as feedstock for the chemical industry – play a stand-out role. The latter resources alone account for 10 percent of total energy costs in the chemical industry.
-
-
The lead market for energy efficiency is experiencing moderate growth on a high level, in part because many measures have already been implemented in energyintensive industries in particular. Waste management and recycling is the lead market with the smallest volume in the environmental technology and resource efficiency space. Its growth rate of 5.9 percent per annum is slightly below the average for the overall industry. The long innovation cycles needed above all for new recycling processes (such as plastics and battery recycling) are one reason for this discrepancy. How quickly new processes become established in practice depends heavily on the market and the political environment.
-
-
Growth in the lead market for material efficiency is a little above the average for environmental technology and resource efficiency as a whole. The average annual
rate of expansion through 2030 is 8.4 percent. The growth forecast of 10.8 percent for the market segment for cross-application technologies and methods is especially positive, although the strongest average annual growth projection of 16.8 percent is reserved for oils and fats from renewable resources.
24 GreenTech made in Germany 2021
Figure 8: Projected global growth in lead markets compared to growth in environmental technology and resource efficiency overall, 2020 to 2030 (average annual change)
Sustainable agriculture and forestry
11.3%
Sustainable mobility 8.7%
Environmentally friendly power generation, storage and distribution 8.5%
Material efficiency 8.4%
Market for environmental technology and resource efficiency 7.3%
Energy efficiency 6.3%
Waste management and recycling 5.9%
Sustainable water management 4.2%
Source: Roland Berger (2020)
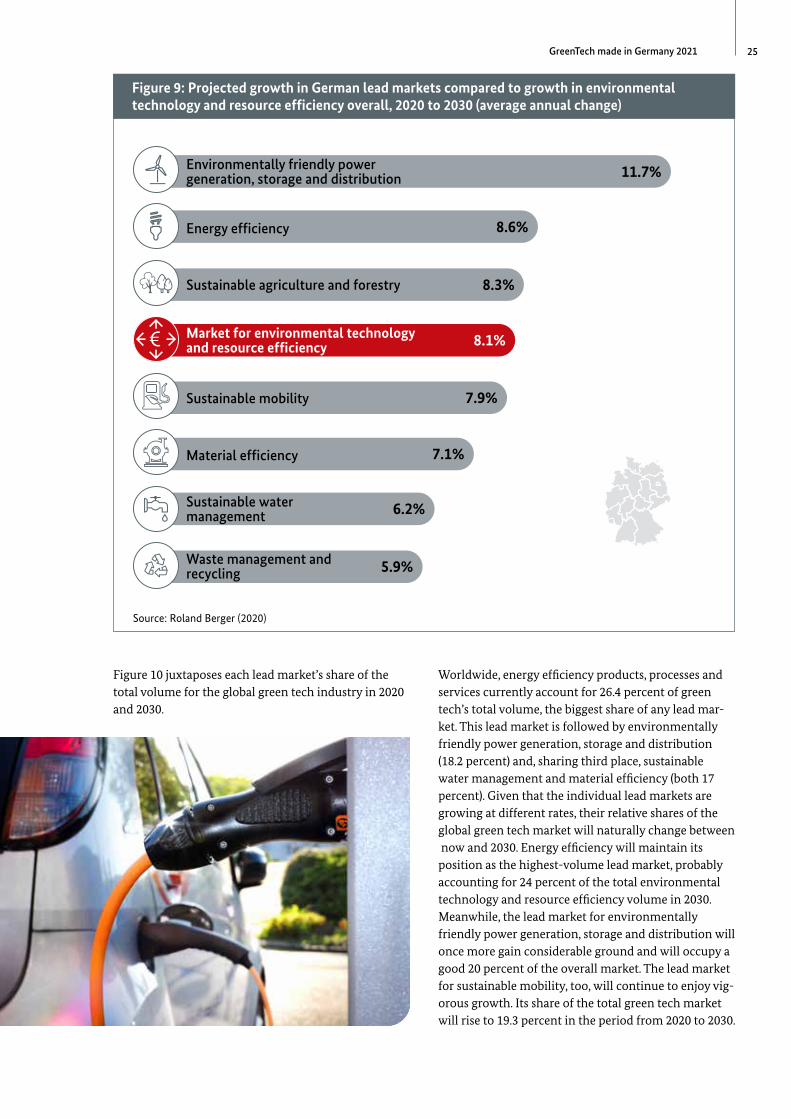
Varying growth rates in the individual green tech lead markets in Germany
Analysis of Germany’s national situation reveals variations in the rate at which the individual lead markets are growing (see Figure 9). Expansion is exceptionally dynamic in the lead market for environmentally friendly power generation, storage and distribution, where the annual average growth rate – driven by both renewable energies (especially the use of biomass and hydropower) and storage technologies – is 11.7 percent.
-
-
At 8.6 percent per annum, the market segment for efficiency gains is likewise growing faster than the average for the green tech industry as a whole. Positive developments in the use of waste heat and energy efficiency in buildings are playing a part in this advance. In line with the global trend, the lead market for
-
sustainable agriculture should also grow by 8.3 percent per annum through 2030, above the wider agricultural average of 8.1 percent.
Growth of 7.9 percent in the lead market for sustainable mobility is slightly below the industry average, in part because, around the world, the topic of efficiency gains is losing ground to alternative drive technologies. While not yet comparable in terms of volume, the latter segment is witnessing very dynamic expansion.
-
-
Below-average growth of 7.1 percent in the lead market for material efficiency is attributable to the size and maturity of this market. Investments in material-efficient production processes in recent years have already delivered a high rate of penetration. By contrast, the technology lines for organic electronics and nanotechnology are expanding forcefully (at average annual rates of 15.8 and 8.1 percent respectively).
-
-
Market for environmental technology and resource efficiency 7.3%
Figure 8: Projected global growth in lead markets compared to growth in environmental technology and resource efficiency overall, 2020 to 2030 (average annual change)
25GreenTech made in Germany 2021
Figure 9: Projected growth in German lead markets compared to growth in environmental technology and resource efficiency overall, 2020 to 2030 (average annual change)
Environmentally friendly power generation, storage and distribution 11.7%
Energy efficiency 8.6%
Sustainable agriculture and forestry 8.3%
Market for environmental technology and resource efficiency 8.1%
Sustainable mobility 7.9%
Material efficiency 7.1%
Sustainable water management 6.2%
Waste management and recycling 5.9%
Source: Roland Berger (2020)
Figure 10 juxtaposes each lead market’s share of the total volume for the global green tech industry in 2020 and 2030. -
-
Worldwide, energy efficiency products, processes and services currently account for 26.4 percent of green tech’s total volume, the biggest share of any lead market. This lead market is followed by environmentally friendly power generation, storage and distribution (18.2 percent) and, sharing third place, sustainable water management and material efficiency (both 17 percent). Given that the individual lead markets are growing at different rates, their relative shares of the global green tech market will naturally change between now and 2030. Energy efficiency will maintain its position as the highest-volume lead market, probably accounting for 24 percent of the total environmental technology and resource efficiency volume in 2030. Meanwhile, the lead market for environmentally friendly power generation, storage and distribution will once more gain considerable ground and will occupy a good 20 percent of the overall market. The lead market for sustainable mobility, too, will continue to enjoy vigorous growth. Its share of the total green tech market will rise to 19.3 percent in the period from 2020 to 2030.
Market for environmental technology and resource efficiency 8.1%
Figure 9: Projected growth in German lead markets compared to growth in environmental technology and resource efficiency overall, 2020 to 2030 (average annual change)

26 GreenTech made in Germany 2021
Figure 10: Lead markets’ share of the total global market for environmental technology and resource efficiency in 2020 and projected development by 2030
Global market volume in 2020: 4,628 billion euros
Energy efficiency
26.4%
-1 %pt*
24.0%
Sustainable water
management
17.0%
-4 %pt*
12.7%
Environmentally friendly power
generation, storage and distribution
18.2%
-1 %pt*
20.4%
Material efficiency
15.4%
+1 %pt*
16.9%
Sustainable mobility
17.0%
+4 %pt*
19.3%
Waste mgmt. and recycling
3.2%
+1 %pt*
2.8%
Sustainable agri
culture and forestry
2.8%
+1 %pt*
3.9%* Percentage point
Global market volume in 2030: 9,383 billion eurosSource: Roland Berger (2020)
-
- -
Technologies to adapt to the consequences of climate change
This section focuses on technologies across all the lead markets that support strategies to adapt to the consequences of climate change. Goods and services that support these strategies exist within a variety of lead markets.
As things stand, products, processes and services that help society adapt to the consequences of climate change account for 7 percent of the global market volume for environmental technology and resource efficiency (see Figure 11). By 2030, these technologies will probably increase their share of the total green tech market to 13 percent. The very pronounced consequences of global warming will drive this six-percentage-point increase compared to 2020. Some of these tangible effects will be the escalation of the water crisis in certain regions, the growing frequency of extreme weather events and their consequences (floods and droughts), and the advance of desertification. The goods and services needed to
-
realize adaptation strategies are found mainly in the lead market for sustainable water management. Half of the global volume in the market segments for water production and treatment and for the water system can be attributed to climate adaptation technologies. Three quarters of the technology line for water efficiency technologies in agriculture also relate to these technologies.
The other lead markets also have a number of market segments and/or technology lines whose goods and services will, by 2030, be crucial in helping us adapt to the consequences of climate change. Examples include efficient heating, air-conditioning and ventilation, measurement and control instrumentation, biotechnology, renewable resources used as feedstock for the chemical industry, soil protection, the prevention of air pollution, nature and landscape conservation, groundwater protection, water conservation, waste collection and waste transportation.
-
-
-
-
-
Figure 9: Projected growth in German lead markets compared to growth in environmental technology and resource efficiency overall, 2020 to 2030 (average annual change)
26.4% 17.0% 18.2% 15.4% 17.0%
-1 %pt*
-4 %pt*
-1 %pt*
+1 %pt
+4 %pt* *
+1 %pt*
+1 %pt*
24.0% 12.7% 20.4% 16.9% 19.3%

27GreenTech made in Germany 2021
Figure 11: Technologies to adapt to the consequences of climate change – Share of the global market for environmental technology and resource efficiency in 2020 and projected development by 2030
Technologies … … to adapt to the consequences of
climate change …
2020: 7%
2030: 13%
… as a share of the global market volume for environmental technology and resource efficiency
Source: Roland Berger (2020)
4.3 Focus on global and national lead markets
-
-
4.3.1 Environmentally friendly power generation, storage and distribution
Three market segments – renewable energies, efficient grids and storage technologies – together make up the
lead market for environmentally friendly power generation, storage and distribution (see Figure 12).
100%
Figure 12: Market segments and technology lines in the lead market for environmentally friendly power generation, storage and distribution
Environmentally friendly power generation, storage and distribution
Renewable energies
· Photovoltaics
· Solar thermal energy
· Solar thermal power plants
· Wind power (onshore)
· Wind power (offshore)
· Geothermal power
· Hydropower
Efficient grids
· Control technologies for grids
· Control technologies for plants
· Heating and cooling networks
· Metering and consumption measurement systems
· ICT (“Internet of Energy”)
Storage technologies
· Mechanical storage of energy
· Electrochemical storage of energy
· Electrical storage of energy
· Thermal storage of energy
· Chemical storage of energy
· Power2X technologies
Source: Roland Berger (2020)
Renewable energies
Efficient grids
Storage technologies
Figure 12: Market segments and technology lines in the lead market for environmentally friendly power generation, storage and distribution
Figure 11: Technologies to adapt to the consequences of climate change – Share of the global market for environmental technology and resource efficiency in 2020 and projected development by 2030
28 GreenTech made in Germany 2021
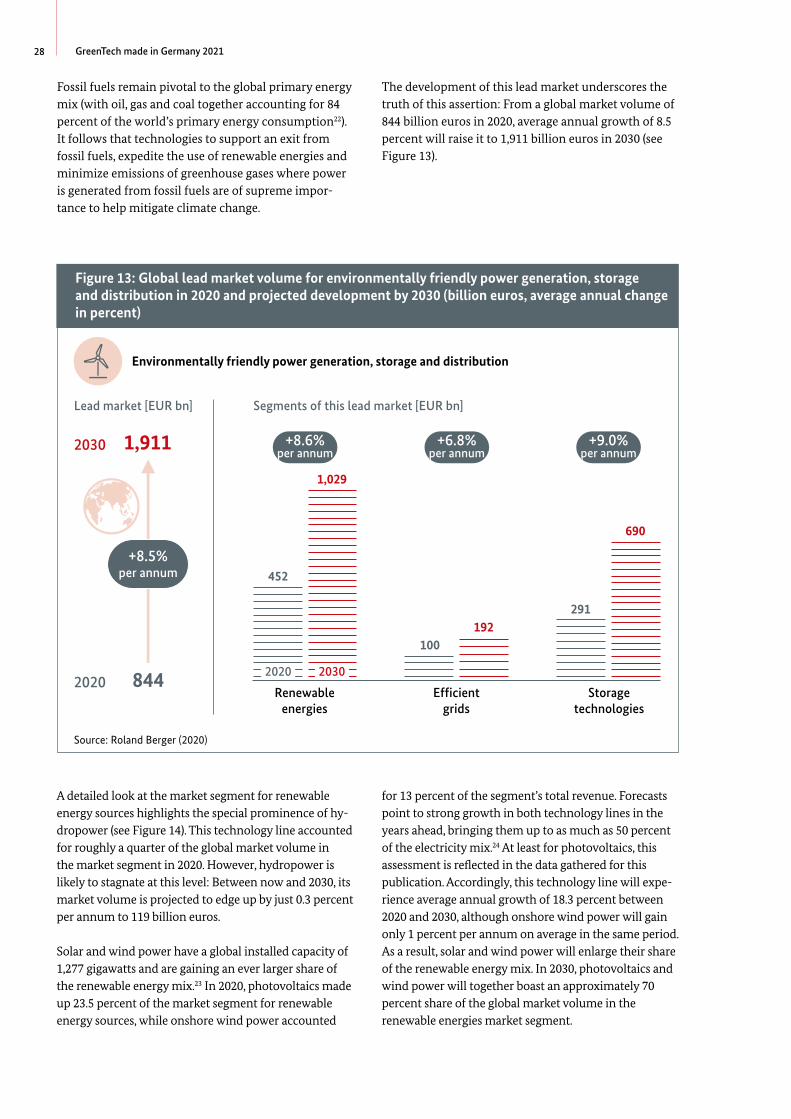
Fossil fuels remain pivotal to the global primary energy mix (with oil, gas and coal together accounting for 84 percent of the world’s primary energy consumption22). It follows that technologies to support an exit from fossil fuels, expedite the use of renewable energies and minimize emissions of greenhouse gases where power is generated from fossil fuels are of supreme importance to help mitigate climate change.
-
-
-
The development of this lead market underscores the truth of this assertion: From a global market volume of 844 billion euros in 2020, average annual growth of 8.5 percent will raise it to 1,911 billion euros in 2030 (see Figure 13).
Figure 13: Global lead market volume for environmentally friendly power generation, storage and distribution in 2020 and projected development by 2030 (billion euros, average annual change in percent)
Environmentally friendly power generation, storage and distribution
Lead market [EUR bn]
2020 844
+8.5%per annum
2030 1,911
Segments of this lead market [EUR bn]
2020 2030
Renewable energies
452
+8.6%per annum
1,029
Efficient
grids
100
+6.8%per annum
192
Storage technologies
291
+9.0%per annum
690
Source: Roland Berger (2020)
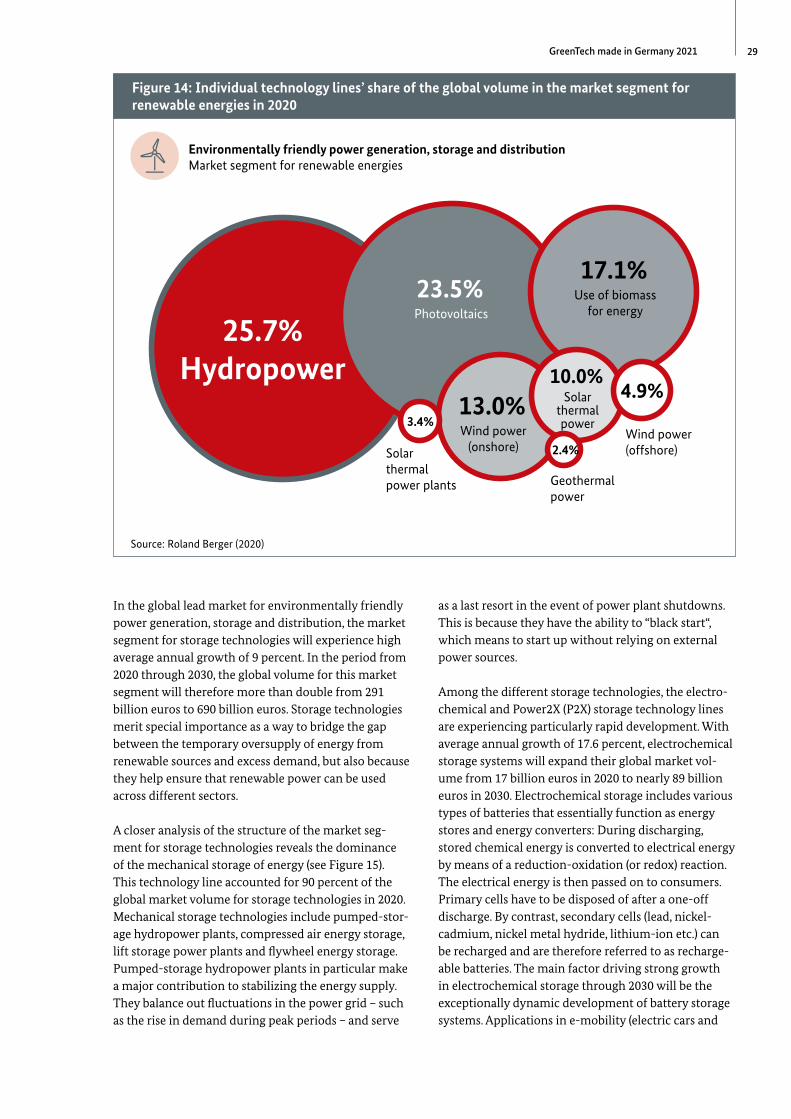
A detailed look at the market segment for renewable energy sources highlights the special prominence of hydropower (see Figure 14). This technology line accounted for roughly a quarter of the global market volume in the market segment in 2020. However, hydropower is likely to stagnate at this level: Between now and 2030, its market volume is projected to edge up by just 0.3 percent per annum to 119 billion euros.
Solar and wind power have a global installed capacity of 1,277 gigawatts and are gaining an ever larger share of the renewable energy mix.23 In 2020, photovoltaics made up 23.5 percent of the market segment for renewable energy sources, while onshore wind power accounted
for 13 percent of the segment’s total revenue. Forecasts point to strong growth in both technology lines in the years ahead, bringing them up to as much as 50 percent of the electricity mix.24 At least for photovoltaics, this assessment is reflected in the data gathered for this publication. Accordingly, this technology line will experience average annual growth of 18.3 percent between 2020 and 2030, although onshore wind power will gain only 1 percent per annum on average in the same period. As a result, solar and wind power will enlarge their share of the renewable energy mix. In 2030, photovoltaics and wind power will together boast an approximately 70 percent share of the global market volume in the renewable energies market segment.
Figure 13: Global lead market volume for environmentally friendly power generation, storage and distribution in 2020 and projected development by 2030 (billion euros, average annual change in percent)
+8.5%per annum
+8.6%per annum
+6.8%per annum
+9.0%per annum
29GreenTech made in Germany 2021
Figure 14: Individual technology lines’ share of the global volume in the market segment for renewable energies in 2020
Environmentally friendly power generation, storage and distributionMarket segment for renewable energies
25.7%
Hydropower
23.5%
Photovoltaics
17.1%
Use of biomassfor energy
13.0% Wind power
(onshore)
10.0% Solar thermal power
4.9%
Wind power (offshore)
3.4%
Solarthermal power plants
2.4%
Geothermalpower
Source: Roland Berger (2020)
In the global lead market for environmentally friendly power generation, storage and distribution, the market segment for storage technologies will experience high average annual growth of 9 percent. In the period from 2020 through 2030, the global volume for this market segment will therefore more than double from 291 billion euros to 690 billion euros. Storage technologies merit special importance as a way to bridge the gap between the temporary oversupply of energy from renewable sources and excess demand, but also because they help ensure that renewable power can be used across different sectors.
A closer analysis of the structure of the market segment for storage technologies reveals the dominance of the mechanical storage of energy (see Figure 15). This technology line accounted for 90 percent of the global market volume for storage technologies in 2020. Mechanical storage technologies include pumped-storage hydropower plants, compressed air energy storage, lift storage power plants and flywheel energy storage. Pumped-storage hydropower plants in particular make a major contribution to stabilizing the energy supply. They balance out fluctuations in the power grid – such as the rise in demand during peak periods – and serve
-
-
as a last resort in the event of power plant shutdowns. This is because they have the ability to “black start“, which means to start up without relying on external power sources.
Among the different storage technologies, the electrochemical and Power2X (P2X) storage technology lines are experiencing particularly rapid development. With average annual growth of 17.6 percent, electrochemical storage systems will expand their global market volume from 17 billion euros in 2020 to nearly 89 billion euros in 2030. Electrochemical storage includes various types of batteries that essentially function as energy stores and energy converters: During discharging, stored chemical energy is converted to electrical energy by means of a reduction-oxidation (or redox) reaction. The electrical energy is then passed on to consumers. Primary cells have to be disposed of after a one-off discharge. By contrast, secondary cells (lead, nickelcadmium, nickel metal hydride, lithium-ion etc.) can be recharged and are therefore referred to as rechargeable batteries. The main factor driving strong growth in electrochemical storage through 2030 will be the exceptionally dynamic development of battery storage systems. Applications in e-mobility (electric cars and
-
-
-
-
Figure 14: Individual technology lines’ share of the global volume in the market segment for renewable energies in 2020
25.7%
Hydropower
23.5%
Photovoltaics

30 GreenTech made in Germany 2021
e-bikes) and stationary energy storage will be responsible for most of this expansion. From an economic perspective, combining stationary storage solutions with autonomous power generation from renewable sources is an extremely attractive proposition that can help stabilize the power grid.
-
Growth in electrochemical storage will, however, be surpassed by the Power2X technology line, which is poised to jump to a volume of just under 4 billion euros at a growth rate of over 47 percent per annum through
2030 (see box “Green hydrogen” on page 32). The market segment for efficient grids recorded a global volume of 100 billion euros in 2020 and is set to grow at an average annual rate of 6.8 percent through 2030. Accordingly, the worldwide volume for this market segment is projected to reach 192 billion euros in 2030.
Figure 15: Individual technology lines’ share of the global volume in the market segment for storage technologies in 2020
Environmentally friendly power generation, storage and distributionMarket segment for storage technologies
90% Mechanical storage
of energy
6% Electrochemical storage of energy
2% Thermal storage of energy
2% Electrical storage of energy
<1% Power2X technologies
Source: Roland Berger (2020)
The lead market for environmentally friendly power generation, storage and distribution in Germany
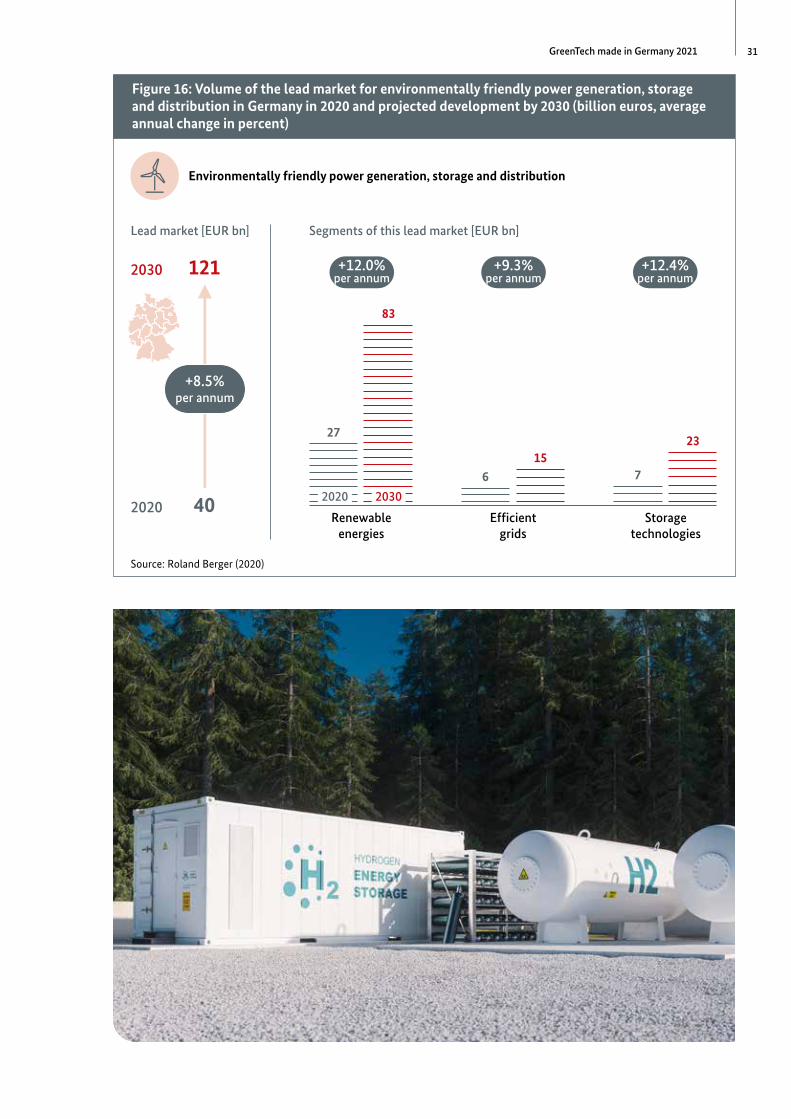
By and large, the development in the German lead market for environmentally friendly power generation, storage and distribution corresponds to the interna-
tional trends. In Germany, this lead market will expand at an average annual rate of 11.7 percent between 2020 and 2030 (see Figure 16). Its volume will thus rise from 40 billion euros to 121 billion euros in this period. On a low level, the market segment for storage technologies is seeing the fastest rate of growth (12.4 percent), followed by renewable energies, which should increase by 12 percent per year on average through 2030.
-
Figure 15: Individual technology lines’ share of the global volume in the market segment for storage technologies in 2020
90% Mechanical storage
of energy
31GreenTech made in Germany 2021
Figure 16: Volume of the lead market for environmentally friendly power generation, storage and distribution in Germany in 2020 and projected development by 2030 (billion euros, average annual change in percent)
Environmentally friendly power generation, storage and distribution
Lead market [EUR bn]
2020 40
+8.5% per annum
2030 121
Segments of this lead market [EUR bn]
2020 2030
Renewable energies
27
+12.0% per annum
83
Efficient grids
6
+9.3% per annum
15
Storage technologies
7
+12.4% per annum
23
Source: Roland Berger (2020)
Figure 16: Volume of the lead market for environmentally friendly power generation, storage and distribution in Germany in 2020 and projected development by 2030 (billion euros, average annual change in percent)
+12.4% per annum
+9.3% per annum
+8.5% per annum
+12.0% per annum

32 GreenTech made in Germany 2021
-
-
-
-
-
-
-
Green hydrogen
Hydrogen and fuel cells have emerged as key technologies of the 21st century. In the medium to long term, both can make a substantial contribution to meeting defined climate targets. Green hydrogen – generated from renewable electricity using climate-neutral techniques – offers significant potential in the industry and transportation sectors. It could be used directly or in the form of hydrogen-based synthetic base materials and fuels generated using renewable power (Power2Gas, Power2Liquid, Power2Chem) for applications whose energy needs are hard or impossible to meet with direct electric power.
Due to its outstanding importance to climate policy and as a result of ambitious hydrogen plans in many of the world’s leading markets (primarily Japan, South Korea, China, the USA and Germany/Europe), demand for hydrogen has grown rapidly in recent years. Compared to 2015 levels, annual demand is expected to increase tenfold to around 21,700 terawatt hours by 2050 (equivalent to 18 percent of the world’s final energy consumption).25 For the year 2030, the Hydrogen Council puts the global hydrogen and fuel cell market volume (including equipment and applications) at about 125 billion euros. Hydrogen and fuel cell applications will make up the bulk of this sum, followed (at some distance) by hydrogen production and storage, hydrogen transportation and distribution. A forecast published by Germany’s Federal Ministry for Economic Affairs indicates that the hydrogen industry could create 5.4 million jobs and generate annual revenue of 800 billion euros in Europe by 2050.26
In the industrial sector, hydrogen can be used to make many of those energy-intensive processes that cannot
be decarbonized by direct electrical applications more sustainable – for instance, in the cement and chemical industries as well as in the production of green steel. In the latter process, hydrogen replaces carbon as a reducing agent and energy carrier in blast furnaces. According to calculations by the German Energy Agency (DENA), direct reduction with green hydrogen can save up to 95 percent of CO2 emissions compared to steel production in a conventional blast furnace.27
-
In the transportation sector, green hydrogen is a good alternative wherever electrification will not be an option for the foreseeable future – in air travel, for example, and partly in heavy-duty traffic and maritime transport. With hydrogen as the raw material for synthetic fuels – or with a tank full of hydrogen – carbon dioxide emissions in these areas can be reduced by as much as 80 percent.28 Especially for heavy-duty and air traffic, hydrogen fuel cells are a reasonable alternative to electric propulsion. On the other hand, this technology is likely to reach the limits of economic viability for many segments of the private transport market. This is because far more electricity is needed to produce the hydrogen than is the case for electric drives.
-
-
-
Additionally, hydrogen can be used for chemical storage, one possibility being what is known as methanation – the generation of renewable natural gas from hydrogen. Viessmann, a German manufacturer of heating equipment, is very active in this field and has developed its own method of storing excess power in the gas grid. In a process known as biological methanation, highly specialized microorganisms convert hydrogen and carbon to pure methane under ambient pressure and at ambient temperatures.
-
-
Green hydrogen
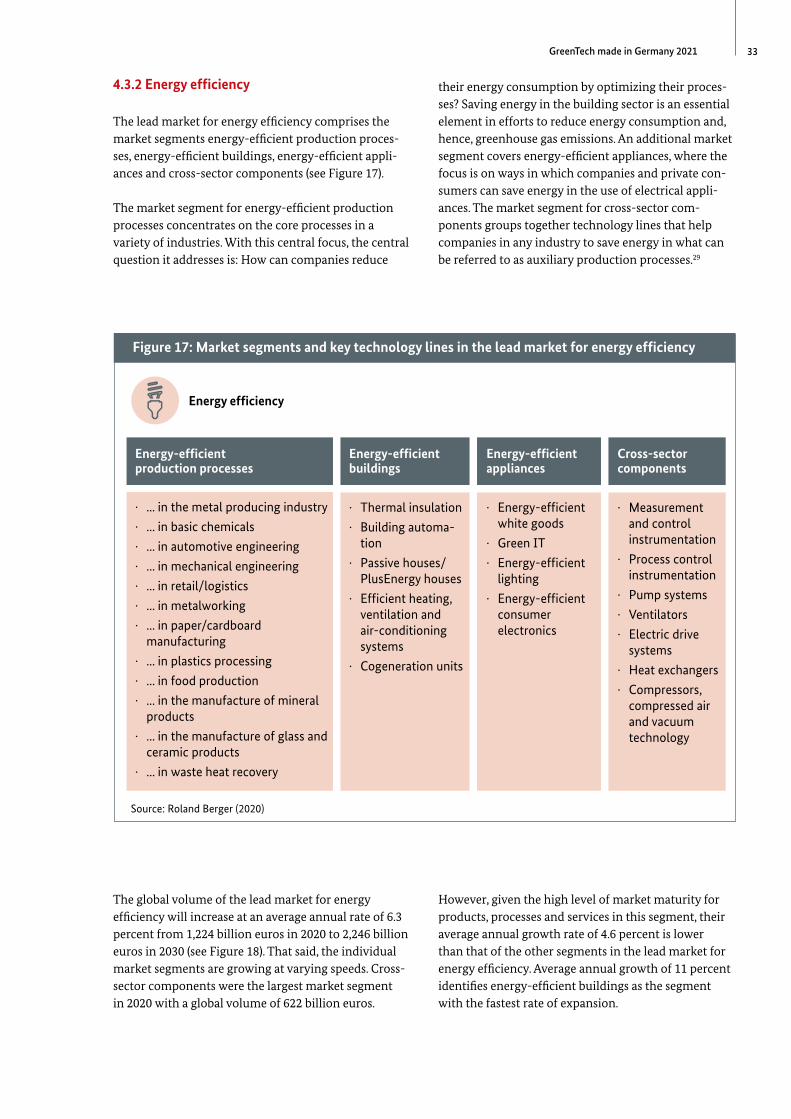
33GreenTech made in Germany 2021
4.3.2 Energy efficiency
The lead market for energy efficiency comprises the market segments energy-efficient production processes, energy-efficient buildings, energy-efficient appliances and cross-sector components (see Figure 17).
--
The market segment for energy-efficient production processes concentrates on the core processes in a variety of industries. With this central focus, the central question it addresses is: How can companies reduce
their energy consumption by optimizing their processes? Saving energy in the building sector is an essential element in efforts to reduce energy consumption and, hence, greenhouse gas emissions. An additional market segment covers energy-efficient appliances, where the focus is on ways in which companies and private consumers can save energy in the use of electrical appliances. The market segment for cross-sector components groups together technology lines that help companies in any industry to save energy in what can be referred to as auxiliary production processes.29
-
--
-
Figure 17: Market segments and key technology lines in the lead market for energy efficiency
Energy efficiency
Energy-efficient production processes
· ... in the metal producing industry
· ... in basic chemicals
· ... in automotive engineering
· ... in mechanical engineering
· ... in retail/logistics
· ... in metalworking
· ... in paper/cardboard manufacturing
· ... in plastics processing
· ... in food production
· ... in the manufacture of mineral products
· ... in the manufacture of glass and ceramic products
· ... in waste heat recovery
Energy-efficient buildings
· Thermal insulation
· Building automation
-
· Passive houses/PlusEnergy houses
· Efficient heating, ventilation and air-conditioning systems
· Cogeneration units
Energy-efficient appliances
· Energy-efficient white goods
· Green IT
· Energy-efficient lighting
· Energy-efficient consumer electronics
Cross-sector components
· Measurement and control instrumentation
· Process control instrumentation
· Pump systems
· Ventilators
· Electric drive systems
· Heat exchangers
· Compressors, compressed air and vacuum technology
Source: Roland Berger (2020)
The global volume of the lead market for energy efficiency will increase at an average annual rate of 6.3 percent from 1,224 billion euros in 2020 to 2,246 billion euros in 2030 (see Figure 18). That said, the individual market segments are growing at varying speeds. Crosssector components were the largest market segment in 2020 with a global volume of 622 billion euros.
-
However, given the high level of market maturity for products, processes and services in this segment, their average annual growth rate of 4.6 percent is lower than that of the other segments in the lead market for energy efficiency. Average annual growth of 11 percent identifies energy-efficient buildings as the segment with the fastest rate of expansion.
Figure 17: Market segments and key technology lines in the lead market for energy efficiency
Energy-efficient production processes
Energy-efficient buildings
Energy-efficient appliances
Cross-sector components
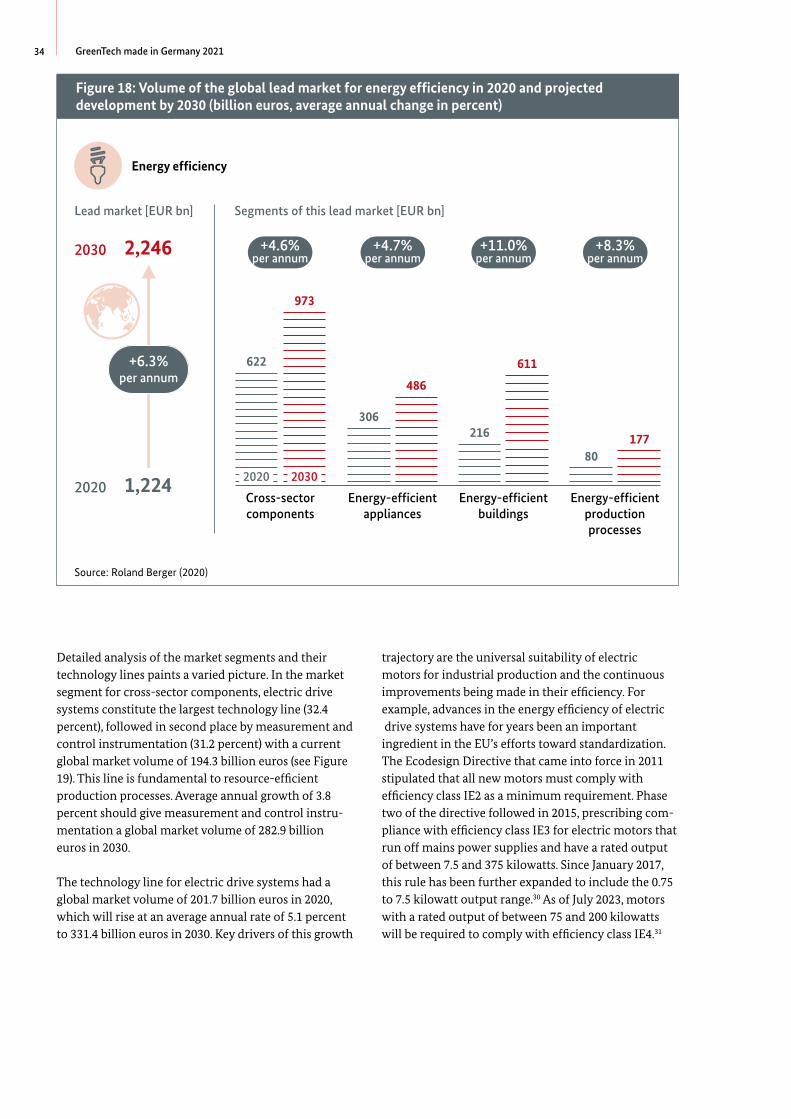
34 GreenTech made in Germany 2021
Figure 18: Volume of the global lead market for energy efficiency in 2020 and projected development by 2030 (billion euros, average annual change in percent)
Energy efficiency
Lead market [EUR bn]
2020 1,224
+6.3% per annum
2030 2,246
Segments of this lead market [EUR bn]
2020 2030
Cross-sector components
622
+4.6% per annum
973
Energy-efficient appliances
306
+4.7% per annum
486
Energy-efficient buildings
216
+11.0% per annum
611
Energy-efficient production processes
80
+8.3% per annum
177
Source: Roland Berger (2020)
Detailed analysis of the market segments and their technology lines paints a varied picture. In the market segment for cross-sector components, electric drive systems constitute the largest technology line (32.4 percent), followed in second place by measurement and control instrumentation (31.2 percent) with a current global market volume of 194.3 billion euros (see Figure 19). This line is fundamental to resource-efficient production processes. Average annual growth of 3.8 percent should give measurement and control instrumentation a global market volume of 282.9 billion euros in 2030.
-
The technology line for electric drive systems had a global market volume of 201.7 billion euros in 2020, which will rise at an average annual rate of 5.1 percent to 331.4 billion euros in 2030. Key drivers of this growth
trajectory are the universal suitability of electric motors for industrial production and the continuous improvements being made in their efficiency. For example, advances in the energy efficiency of electric drive systems have for years been an important ingredient in the EU’s efforts toward standardization. The Ecodesign Directive that came into force in 2011 stipulated that all new motors must comply with efficiency class IE2 as a minimum requirement. Phase two of the directive followed in 2015, prescribing compliance with efficiency class IE3 for electric motors that run off mains power supplies and have a rated output of between 7.5 and 375 kilowatts. Since January 2017, this rule has been further expanded to include the 0.75 to 7.5 kilowatt output range.30 As of July 2023, motors with a rated output of between 75 and 200 kilowatts will be required to comply with efficiency class IE4.31
-
Figure 18: Volume of the global lead market for energy efficiency in 2020 and projected development by 2030 (billion euros, average annual change in percent)
+11.0% per annum
+4.7% per annum
+6.3% per annum
+4.6% per annum
+8.3% per annum
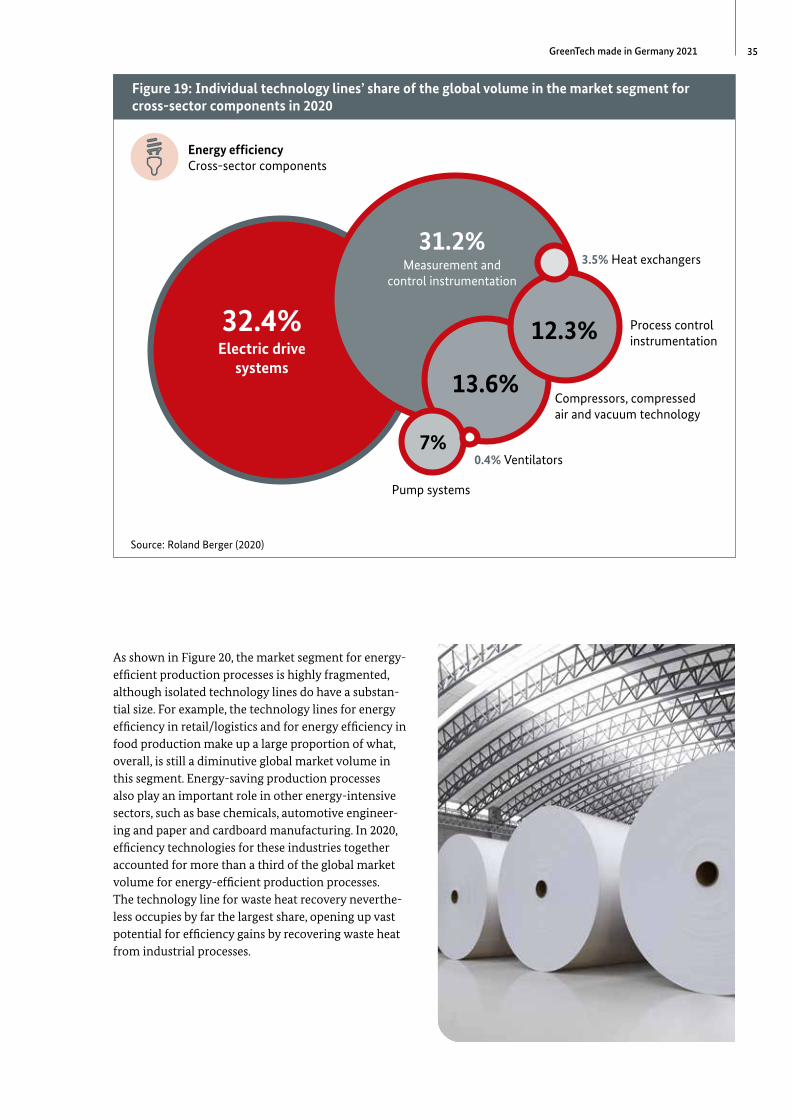
35GreenTech made in Germany 2021
Figure 19: Individual technology lines’ share of the global volume in the market segment for cross-sector components in 2020
Energy efficiencyCross-sector components
32.4%
Electric drive systems
31.2% Measurement and
control instrumentation
13.6% Compressors, compressed
air and vacuum technology
12.3% Process control instrumentation
7%
Pump systems
3.5% Heat exchangers
0.4% Ventilators
Source: Roland Berger (2020)
As shown in Figure 20, the market segment for energy-efficient production processes is highly fragmented, although isolated technology lines do have a substantial size. For example, the technology lines for energy efficiency in retail/logistics and for energy efficiency in food production make up a large proportion of what, overall, is still a diminutive global market volume in this segment. Energy-saving production processes also play an important role in other energy-intensive sectors, such as base chemicals, automotive engineering and paper and cardboard manufacturing. In 2020, efficiency technologies for these industries together accounted for more than a third of the global market volume for energy-efficient production processes. The technology line for waste heat recovery nevertheless occupies by far the largest share, opening up vast potential for efficiency gains by recovering waste heat from industrial processes.
-
-
-
32.4%
Electric drive systems
31.2% Measurement and
control instrumentation
Figure 19: Individual technology lines’ share of the global volume in the market segment for cross-sector components in 2020

36 GreenTech made in Germany 2021
Figure 20: Individual technology lines’ share of the global volume in the market segment for energy-efficient production processes in 2020
Energy efficiencyEnergy-efficient production processes
89.6%
Waste heat recovery
9.4%
Other energy-efficient production processes
--
Energy efficiency in food production
Energy efficiency in retail/logistics
Energy efficiency in basic chemicals
Energy efficiency in automotive engineering
Energy efficiency in the metal producing industry
Energy efficiency in plastics processing
Energy efficiency in mechanical engineering
Energy efficiency in the metal producing industry
Energy efficiency in the manufacture of glass and ceramic products
Energy efficiency in the manufacture of mineral products
1.8%
1.8%
1.5%
0.9%
0.8%
0.6%
0.6%
0.6%
0.3%
0.1%
= 9.4%Source: Roland Berger (2020)
In 2020, the technology line for energy-efficient white goods (household appliances) contributed the largest (33.7 percent) share of the global market volume in the market segment for energy-efficient appliances (see Figure 21). This line will grow at an average annual rate of 3.5 percent between 2020 and 2030, reaching a global market volume of 145.7 billion euros in 2030. Substantially stronger expansion of 6 percent per annum will be delivered by the technology line for energy-efficient lighting, whose global market volume will rise from 98 billion euros in 2020 to 176 billion euros in 2030. LED lamps’ increasing market penetration is the mainstay of this dynamic development. More and more of these lamps are now being deployed in production facilities and municipal contexts.
-
The market segment for energy-efficient buildings reached a global market volume of 216 billion euros in 2020. Average annual growth of 11 percent should see this volume rise to a projected 611 billion euros by
2030. In terms of market volume, heating, ventilation and air-conditioning (HVAC) systems is the most important technology line in this segment with an overall share of 45 percent (see Figure 22). Its prominent position is rooted in its considerable energy-saving potential coupled with relatively short payback periods. Rapid development with average annual growth of 6.6 percent will continue through 2030, by which time this technology line will have a global market volume of 171 billion euros.
The technology line for low-energy and passive houses will expand even more vigorously, posting an average annual growth rate of 32 percent in the period from 2020 through 2030. This is thus the fastest-growing technology line in the whole of the lead market for energy efficiency.
Figure 20: Individual technology lines’ share of the global volume in the market segment for energy-efficient production processes in 2020
89.6%
Waste heat recovery
9.4%

37GreenTech made in Germany 2021
Figure 21: Individual technology lines’ share of the global volume in the market segment for energy-efficient appliances in 2020
Energy efficiencyEnergy-efficient appliances
33.7%
Energy-efficient white goods
32.2%
Energy-efficient lighting
17.2%
Energy-efficient consumer electronics
17.1%
Green IT
Source: Roland Berger (2020)
Figure 22: Individual technology lines’ share of the global volume in the market segment for energy-efficient buildings in 2020
Energy efficiencyEnergy-efficient buildings
45% Heating, ventilation and air-conditioning
systems
26.5%
Thermal insulation
25.2%
Building automation
4.9%
Passive houses/PlusEnergy houses
1.5% Cogeneration units
Source: Roland Berger (2020)
Figure 22: Individual technology lines’ share of the global volume in the market segment for energy-efficient buildings in 2020
45% Heating, ventilation and air-conditioning
systems
26.5%
Thermal insulation
Figure 21: Individual technology lines’ share of the global volume in the market segment for energy-efficient appliances in 2020
33.7%
Energy-efficient white goods
32.2%
Energy-efficient lighting
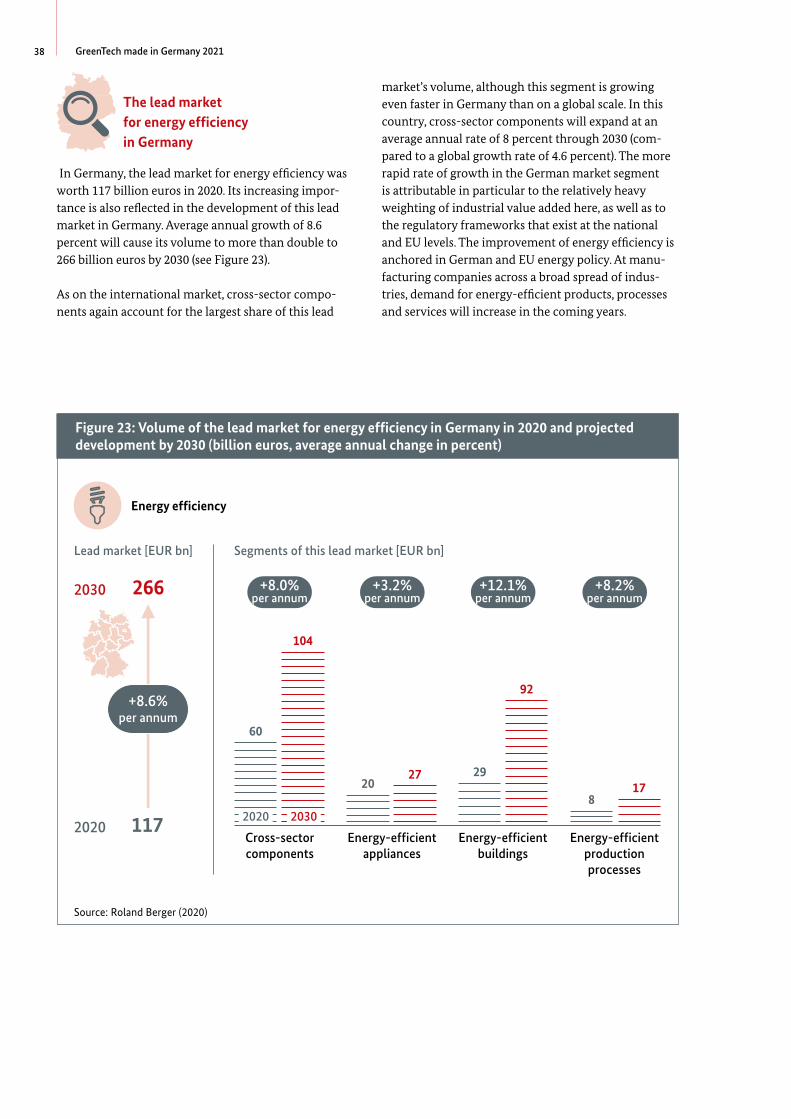
38 GreenTech made in Germany 2021
The lead market for energy efficiency in Germany
-
-
-
--
In Germany, the lead market for energy efficiency was worth 117 billion euros in 2020. Its increasing importance is also reflected in the development of this lead market in Germany. Average annual growth of 8.6 percent will cause its volume to more than double to 266 billion euros by 2030 (see Figure 23).
As on the international market, cross-sector components again account for the largest share of this lead
market’s volume, although this segment is growing even faster in Germany than on a global scale. In this country, cross-sector components will expand at an average annual rate of 8 percent through 2030 (compared to a global growth rate of 4.6 percent). The more rapid rate of growth in the German market segment is attributable in particular to the relatively heavy weighting of industrial value added here, as well as to the regulatory frameworks that exist at the national and EU levels. The improvement of energy efficiency is anchored in German and EU energy policy. At manufacturing companies across a broad spread of industries, demand for energy-efficient products, processes and services will increase in the coming years.
Figure 23: Volume of the lead market for energy efficiency in Germany in 2020 and projected development by 2030 (billion euros, average annual change in percent)
Energy efficiency
Lead market [EUR bn]
2020 117
+8.6% per annum
2030 266
Segments of this lead market [EUR bn]
2020 2030
Cross-sector components
60
+8.0% per annum
104
Energy-efficient appliances
20
+3.2% per annum
27
Energy-efficient buildings
29
+12.1% per annum
92
Energy-efficient production processes
8
+8.2% per annum
17
Source: Roland Berger (2020)
Figure 23: Volume of the lead market for energy efficiency in Germany in 2020 and projected development by 2030 (billion euros, average annual change in percent)
+8.6% per annum
+8.0% per annum
+3.2% per annum
+12.1% per annum
+8.2% per annum
39GreenTech made in Germany 2021
Energy efficiency services in manufacturing
Around the globe, resource efficiency is a vital factor in endeavors to help mitigate climate change. And since the manufacturing industry accounts for 45 percent of total power consumption in Germany, it must live up to its responsibility as a major consumer.32 The potential for efficiency gains to reduce energy consumption in this sector is considerable. In this country, recent years have thus seen the rise of a distinct market for energy efficiency services – a market that should grow at an annual average rate of 7 percent to a volume of 12 billion euros by 2025.33 While innovative technologies clearly have a decisive role to play, they are not the only consideration. Without suitable services, these technologies cannot be properly deployed.
Over time, five separate segments have taken shape within the market for energy efficiency services. Of these, software to manage energy efficiency services is the biggest and – with annual expansion of 14 percent – the fastest-growing segment. This software uses a combination of data capture, reporting, monitoring and optimization to improve the energy efficiency of individual devices and/or entire systems. Energy efficiency audits and consulting form the second segment, in which growth forecasts stand at 3 to 4 percent (from 2017 through 2025).
The engineering, procurement and construction of energy-efficient technologies – the third service
segment – is similarly attractive. This segment breaks down into energy-efficient technologies (electricity, heating, refrigeration, ventilation, lighting and production technology) and building services, as well as the charging infrastructure for e-mobility. Across Europe, average annual growth of 9 percent could push this market up to a volume approaching 19 billion euros by 2025. The process efficiency segment is still very new and includes services whose aim is to reduce companies’ energy consumption and costs. This segment is growing at an average annual rate of 6 percent in Germany and 8 percent in Europe. In the energy contracting segment, energy is supplied and/or energy efficiency services are provided on a contractual basis. The European market volume is projected to top 12 billion euros by 2025.
-
-
-
Innovative technologies born of digitalization will inject further massive growth stimulus into the industry in the years ahead. Smart, connected buildings and the Internet of Things (IoT), for example, will enable buildings to be monitored and controlled remotely. Two segments in particular – energy efficiency management software and the engineering, procurement and construction of energy efficiency technologies – will benefit from the new digital solutions. The additional market potential associated with this trend is put at 3.5 billion euros by 2025 alone.
Energy efficiency services in manufacturing
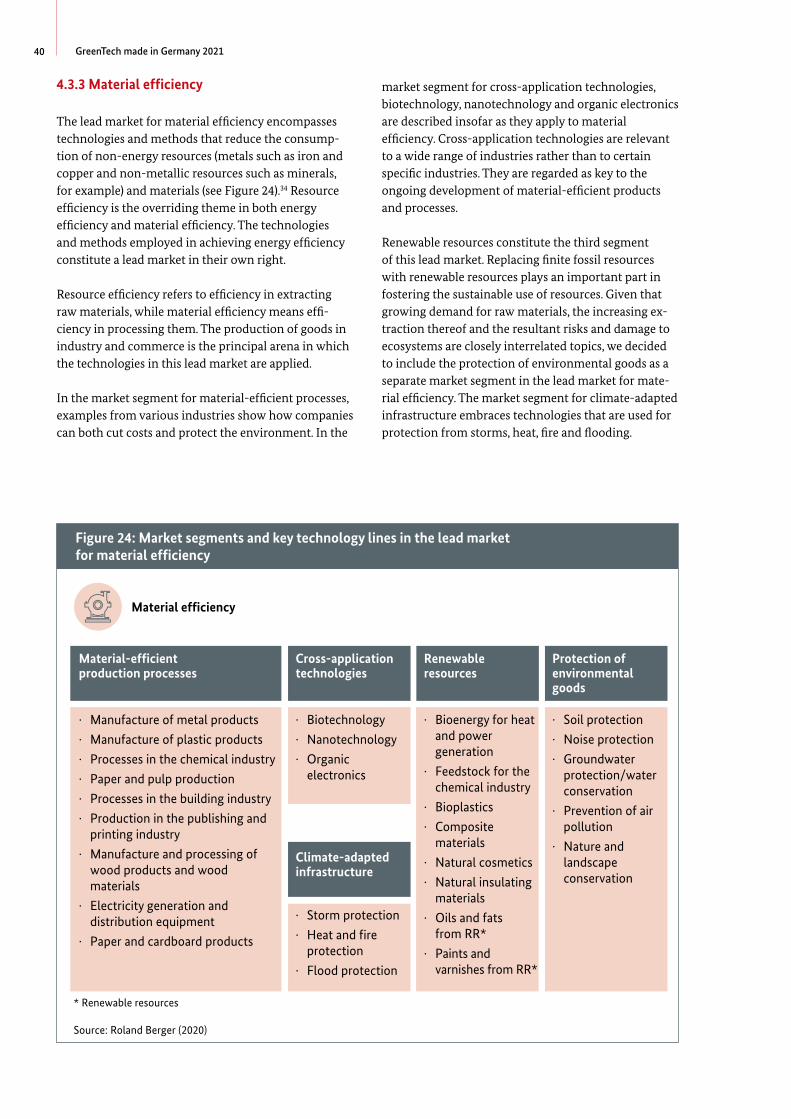
40 GreenTech made in Germany 2021
4.3.3 Material efficiency
The lead market for material efficiency encompasses technologies and methods that reduce the consumption of non-energy resources (metals such as iron and copper and non-metallic resources such as minerals, for example) and materials (see Figure 24).34 Resource efficiency is the overriding theme in both energy efficiency and material efficiency. The technologies and methods employed in achieving energy efficiency constitute a lead market in their own right.
-
-Resource efficiency refers to efficiency in extracting raw materials, while material efficiency means efficiency in processing them. The production of goods in industry and commerce is the principal arena in which the technologies in this lead market are applied.
In the market segment for material-efficient processes, examples from various industries show how companies can both cut costs and protect the environment. In the
market segment for cross-application technologies, biotechnology, nanotechnology and organic electronics are described insofar as they apply to material efficiency. Cross-application technologies are relevant to a wide range of industries rather than to certain specific industries. They are regarded as key to the ongoing development of material-efficient products and processes.
-
-
Renewable resources constitute the third segment of this lead market. Replacing finite fossil resources with renewable resources plays an important part in fostering the sustainable use of resources. Given that growing demand for raw materials, the increasing extraction thereof and the resultant risks and damage to ecosystems are closely interrelated topics, we decided to include the protection of environmental goods as a separate market segment in the lead market for material efficiency. The market segment for climate-adapted infrastructure embraces technologies that are used for protection from storms, heat, fire and flooding.
Figure 24: Market segments and key technology lines in the lead market for material efficiency
Material efficiency
Material-efficient production processes
· Manufacture of metal products
· Manufacture of plastic products
· Processes in the chemical industry
· Paper and pulp production
· Processes in the building industry
· Production in the publishing and printing industry
· Manufacture and processing of wood products and wood materials
· Electricity generation and distribution equipment
· Paper and cardboard products
Cross-application technologies
· Biotechnology
· Nanotechnology
· Organic electronics
Climate-adapted infrastructure
· Storm protection
· Heat and fire protection
· Flood protection
Renewable resources
· Bioenergy for heat and power generation
· Feedstock for the chemical industry
· Bioplastics
· Composite materials
· Natural cosmetics
· Natural insulating materials
· Oils and fats from RR*
· Paints and varnishes from RR*
Protection of environmental goods
· Soil protection
· Noise protection
· Groundwater protection/water conservation
· Prevention of air pollution
· Nature and landscape conservation
* Renewable resources
Source: Roland Berger (2020)
Figure 24: Market segments and key technology lines in the lead market for material efficiency
Material-efficient production processes
Cross-application technologies
Climate-adapted infrastructure
Renewable resources
Protection of environmental goods
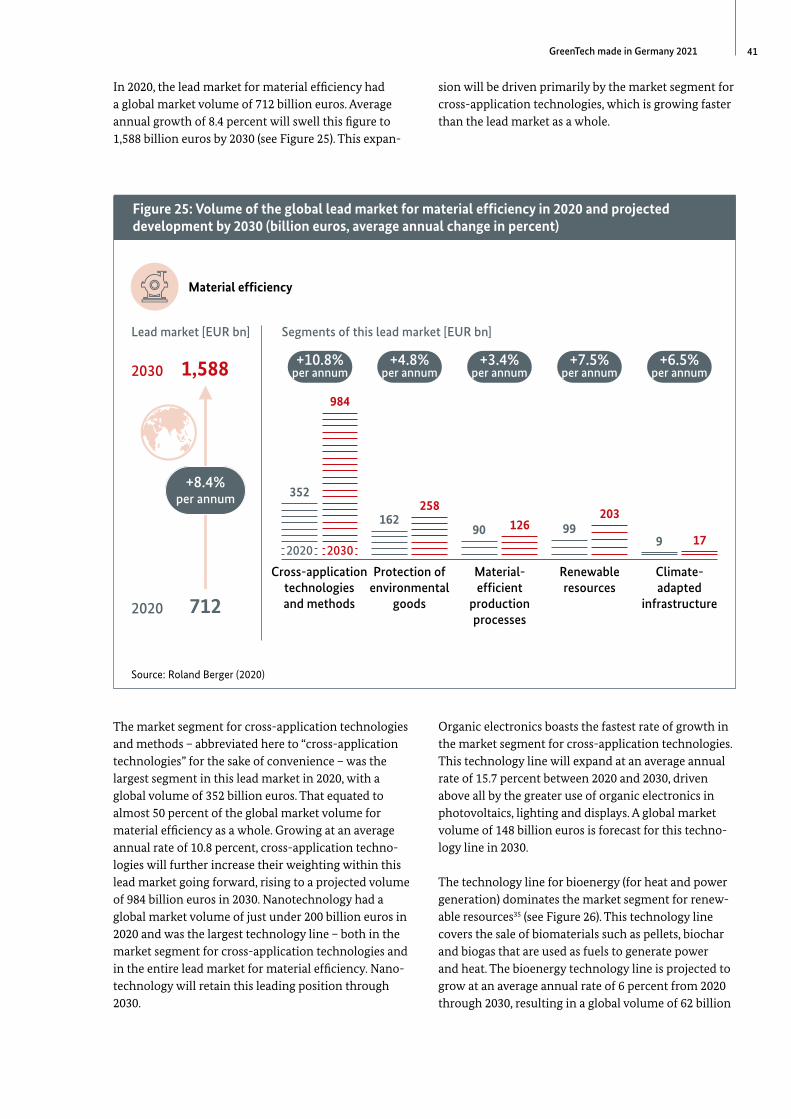
41GreenTech made in Germany 2021
In 2020, the lead market for material efficiency had a global market volume of 712 billion euros. Average annual growth of 8.4 percent will swell this figure to 1,588 billion euros by 2030 (see Figure 25). This expan-
sion will be driven primarily by the market segment for cross-application technologies, which is growing faster than the lead market as a whole.
Figure 25: Volume of the global lead market for material efficiency in 2020 and projected development by 2030 (billion euros, average annual change in percent)
Material efficiency
Lead market [EUR bn]
2020 712
+8.4% per annum
2030 1,588
-
Segments of this lead market [EUR bn]
2020 2030
Cross-application technologies and methods
352
+10.8% per annum
984
Protection of environmental
goods
162
+4.8% per annum
258
Materialefficient
production processes
90
+3.4% per annum
126
Renewable resources
99
+7.5% per annum
203
Climateadapted
infrastructure
9
+6.5% per annum
17
Source: Roland Berger (2020)
The market segment for cross-application technologies and methods – abbreviated here to “cross-application technologies” for the sake of convenience – was the largest segment in this lead market in 2020, with a global volume of 352 billion euros. That equated to almost 50 percent of the global market volume for material efficiency as a whole. Growing at an average annual rate of 10.8 percent, cross-application technologies will further increase their weighting within this lead market going forward, rising to a projected volume of 984 billion euros in 2030. Nanotechnology had a global market volume of just under 200 billion euros in 2020 and was the largest technology line – both in the market segment for cross-application technologies and in the entire lead market for material efficiency. Nanotechnology will retain this leading position through 2030.
Organic electronics boasts the fastest rate of growth in the market segment for cross-application technologies. This technology line will expand at an average annual rate of 15.7 percent between 2020 and 2030, driven above all by the greater use of organic electronics in photovoltaics, lighting and displays. A global market volume of 148 billion euros is forecast for this technology line in 2030.
The technology line for bioenergy (for heat and power generation) dominates the market segment for renewable resources35 (see Figure 26). This technology line covers the sale of biomaterials such as pellets, biochar and biogas that are used as fuels to generate power and heat. The bioenergy technology line is projected to grow at an average annual rate of 6 percent from 2020 through 2030, resulting in a global volume of 62 billion
-
-
-
-
-
Figure 25: Volume of the global lead market for material efficiency in 2020 and projected development by 2030 (billion euros, average annual change in percent)
+8.4% per annum
+10.8% per annum
+4.8% per annum
+3.4% per annum
+7.5% per annum
+6.5% per annum

42 GreenTech made in Germany 2021
euros in 2030. Demand is likewise increasing for paints and varnishes made from renewable resources, many of which are mixed with conventional paints. This trend is reflected in average annual growth of 7.4 percent, which will cause the global market volume for this technology line to more than double from 15 billion euros in 2020 to 32 billion euros in 2030.
The composite materials technology line currently has a nearly 10 percent share of the global market volume for material efficiency. Combining natural fibers with plastics creates composite materials (such as wood-plastic composite) that not only reduce the consumption of finite resources, but also often possess superior
qualities to conventional fiber composites, including lighter weights and greater stability.
-
In terms of global volume, natural cosmetics – worth 15 billion euros in 2020 – represent a sizeable share (16 percent) of the market segment for renewable resources. Growing consumer demand for cosmetic products with natural ingredients will continue to buoy this expansion with average annual growth of 10 percent. In 2030, the global market for natural cosmetics will be worth close to 40 billion euros. The growing importance consumers attach to transparency about ingredients is mirrored in this development.
-
Figure 26: Individual technology lines’ share of the global volume in the renewable resources market segment in 2020
Material efficiencyRenewable resources
35%
Bioenergy (heat and
power generation)
16% Paints and varnishes from RR*
16% Natural cosmetics
10%
Composite materials
9% Renewable feedstock for the chemical industry
7%
Bioplastics6% Natural insulating materials
1.5% Oils and fats from RR*
*Renewable resources
Source: Roland Berger (2020)
35%
Bioenergy (heat and
power generation)
Figure 26: Individual technology lines’ share of the global volume in the renewable resources market segment in 2020
16%
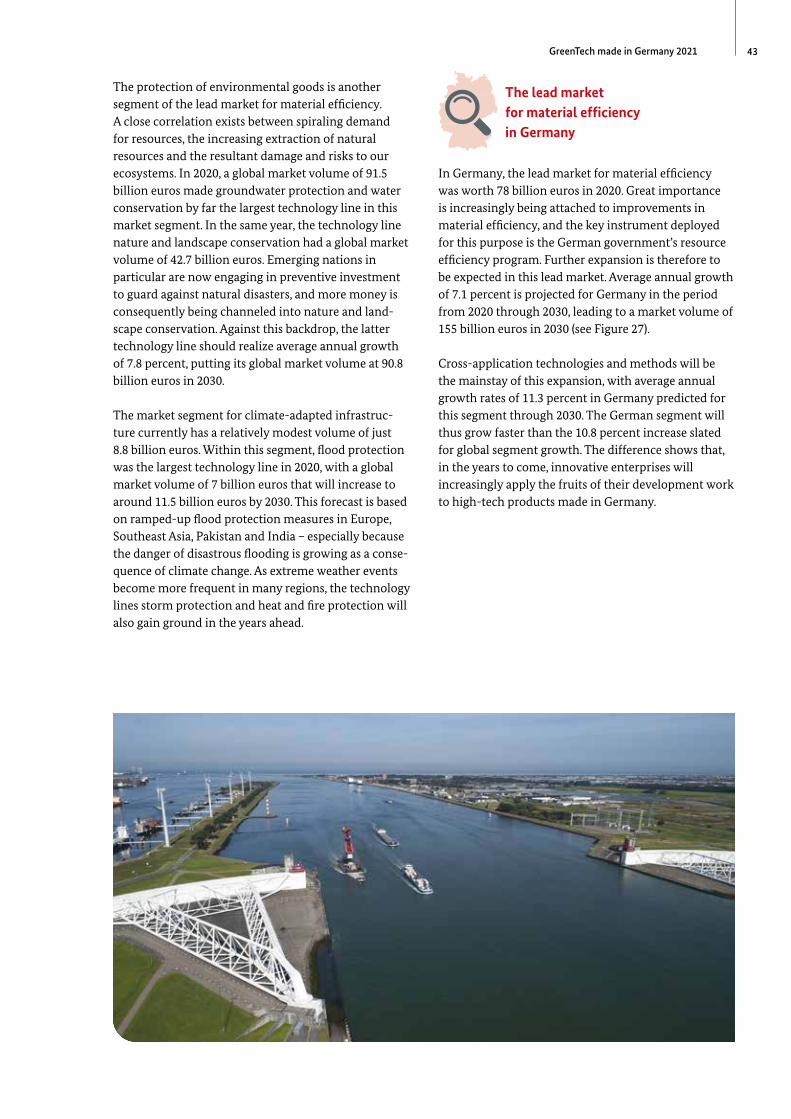
43GreenTech made in Germany 2021
The protection of environmental goods is another segment of the lead market for material efficiency. A close correlation exists between spiraling demand for resources, the increasing extraction of natural resources and the resultant damage and risks to our ecosystems. In 2020, a global market volume of 91.5 billion euros made groundwater protection and water conservation by far the largest technology line in this market segment. In the same year, the technology line nature and landscape conservation had a global market volume of 42.7 billion euros. Emerging nations in particular are now engaging in preventive investment to guard against natural disasters, and more money is consequently being channeled into nature and landscape conservation. Against this backdrop, the latter technology line should realize average annual growth of 7.8 percent, putting its global market volume at 90.8 billion euros in 2030.
-
-
-
The market segment for climate-adapted infrastructure currently has a relatively modest volume of just 8.8 billion euros. Within this segment, flood protection was the largest technology line in 2020, with a global market volume of 7 billion euros that will increase to around 11.5 billion euros by 2030. This forecast is based on ramped-up flood protection measures in Europe, Southeast Asia, Pakistan and India – especially because the danger of disastrous flooding is growing as a consequence of climate change. As extreme weather events become more frequent in many regions, the technology lines storm protection and heat and fire protection will also gain ground in the years ahead.
The lead market for material efficiency in Germany
In Germany, the lead market for material efficiency was worth 78 billion euros in 2020. Great importance is increasingly being attached to improvements in material efficiency, and the key instrument deployed for this purpose is the German government’s resource efficiency program. Further expansion is therefore to be expected in this lead market. Average annual growth of 7.1 percent is projected for Germany in the period from 2020 through 2030, leading to a market volume of 155 billion euros in 2030 (see Figure 27).
Cross-application technologies and methods will be the mainstay of this expansion, with average annual growth rates of 11.3 percent in Germany predicted for this segment through 2030. The German segment will thus grow faster than the 10.8 percent increase slated for global segment growth. The difference shows that, in the years to come, innovative enterprises will increasingly apply the fruits of their development work to high-tech products made in Germany.

44 GreenTech made in Germany 2021
Figure 27: Volume of the lead market for material efficiency in Germany in 2020 and projected development by 2030 (billion euros, average annual change in percent)
Material efficiency
Lead market [EUR bn]
2020 78
+7.1% per annum
2030 155
Segments of this lead market [EUR bn]
-
2020 2030
Protection of environmental
goods
21.5
+2.1% per annum
27.8
Crossapplication
technologies and methods
28.3
+11.3% per annum
82.8
Materialefficient
production processes
13.7
+3.6% per annum
19.5
Renewable resources
12.8
+6.4% per annum
23.7
Climateadapted
infrastructure
1
+1.3% per annum
1
- -
Source: Roland Berger (2020)
+7.1% per annum
+2.1% per annum
+11.3% per annum
+3.6% per annum
+1.3% per annum
Figure 27: Volume of the lead market for material efficiency in Germany in 2020 and projected development by 2030 (billion euros, average annual change in percent)
+6.4% per annum
45GreenTech made in Germany 2021
-
-
Circular construction
Wherever resources grow more scarce and the problems associated with extracting and disposing of materials become ever more pressing, a mindset rooted in the cycles of nature – the circular economy – takes on fresh significance. The goal of circular economy concepts is ultimately to value natural resources and, by reusing and recycling them, ensure that they remain available from the cradle to the cradle (for future generations, in other words). By uncoupling growth from the consumption of natural resources, the circular economy lays the foundation for sustainable economic practices. One study suggests that new technologies, processes and services in this field could generate up to 4.5 trillion US dollars in economic value added by 203036.
The focus is on exceptionally resource-intensive sectors such as the conventional, linear construction industry, which accounts for between 35 and 40 percent of total energy consumption and as much as 40 percent of CO2 emissions in Europe and the USA. Moreover, up to a third of all waste in the EU comes from construction and demolition work. Yet at the present time, only 40 percent of construction waste is recycled or reused37.
Not so in the context of circular construction. Literally from the ground up, infrastructure, land and buildings are being planned and built in such a way that both waste and emissions are minimized. Resource-efficient products are used, structural elements are reused and more and more renewable building materials such
as natural clay, wood and straw are deployed. These resources are used for as long as possible, in part by repurposing construction materials from existing buildings. Significant aspects of this strategy include designing for disassembly, modular construction designs and selective dismantling.
-
-
-
-
The potential is impressive. A circular economic approach to the construction industry could influence as much as 30 percent of all waste generated in the EU and up to 40 percent of emissions throughout the EU. Worldwide, circular construction is growing at a rate of 12 percent per annum. By 2025, it will have a market volume of 620 billion euros, of which 240 billion euros will be generated in Europe. Business models that use renewable and recycled building materials form the largest chunk of the market as a whole, whereas upcycled building materials exhibit the greatest growth potential.
Several German firms are among those whose innovations are driving forward the paradigm change toward circular economic practices. In collaboration with a number of recycling companies, one player has established a closed material cycle for construction. The company in question prepares the material and handles the logistical side, ensuring that raw materials remain in the possession of the customer and are channeled back into the production process. Another provider extends building lifecycles, for example by monitoring their condition via the Internet of Things.
4.3.4 Sustainable mobility
The lead market for sustainable mobility breaks down into four market segments: alternative drive technologies, renewable fuels, technologies to increase efficiency, and transportation infrastructure and traffic management (see Figure 28).
-
-
-
-
-
-
The market segment for alternative drive technologies comprises electric, hybrid and fuel cell drive systems. As these technologies develop, penetrate the market and increasingly constitute genuine alternatives to conventional combustion engines, this will help decarbonize the transport sector and roll back dependency on oil-based fuels. The technology lines in the renewable fuels market segment serve the same goal. At the same time, combustion engines must become
more efficient if CO2 emissions are to be minimized in the transport sector. The products and technologies needed to do so are subsumed under the market segment for technologies to increase efficiency. In the market segment for transportation infrastructure and traffic management, innovative measures and technologies will reduce mobility-related emissions. Smart transportation concepts that link up individual modes of transport have an important part to play here.
Second only to sustainable agriculture and forestry, sustainable mobility is the fastest-growing lead market in the green tech industry. Between 2020 and 2030, sustainable mobility will see average annual growth of 8.7 percent. The global volume for this lead market stood at 787 billion euros in 2020 and will climb to 1,811 billion euros in 2030 (see Figure 29).
Circular construction
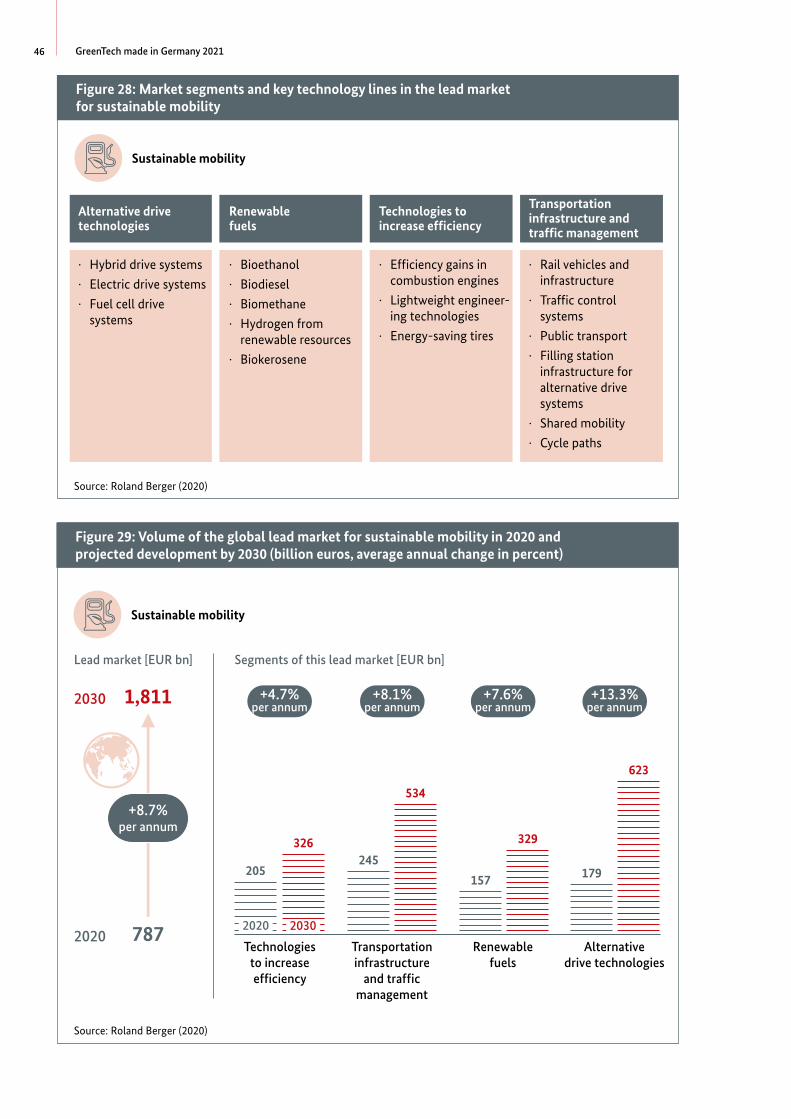
46 GreenTech made in Germany 2021
Figure 28: Market segments and key technology lines in the lead market for sustainable mobility
Sustainable mobility
Alternative drive technologies
· Hybrid drive systems
· Electric drive systems
· Fuel cell drive systems
Renewable fuels
· Bioethanol
· Biodiesel
· Biomethane
· Hydrogen from renewable resources
· Biokerosene
Technologies to increase efficiency
· Efficiency gains in combustion engines
· Lightweight engineering technologies
-
· Energy-saving tires
Transportation infrastructure and traffic management
· Rail vehicles and infrastructure
· Traffic control systems
· Public transport
· Filling station infrastructure for alternative drive systems
· Shared mobility
· Cycle paths
Source: Roland Berger (2020)
Figure 29: Volume of the global lead market for sustainable mobility in 2020 and projected development by 2030 (billion euros, average annual change in percent)
Sustainable mobility
Lead market [EUR bn]
2020 787
+8.7% per annum
2030 1,811
Segments of this lead market [EUR bn]
2020 2030
Technologies to increase efficiency
205
+4.7% per annum
326
Transportation infrastructure
and traffic management
245
+8.1% per annum
534
Renewable fuels
157
+7.6% per annum
329
Alternative drive technologies
179
+13.3% per annum
623
Source: Roland Berger (2020)
Figure 28: Market segments and key technology lines in the lead market for sustainable mobility
Alternative drive technologies
Renewable fuels
Technologies to increase efficiency
Transportation infrastructure and traffic management
Figure 29: Volume of the global lead market for sustainable mobility in 2020 and projected development by 2030 (billion euros, average annual change in percent)
+8.7% per annum
+7.6% per annum
+8.1% per annum
+4.7% per annum
+13.3% per annum
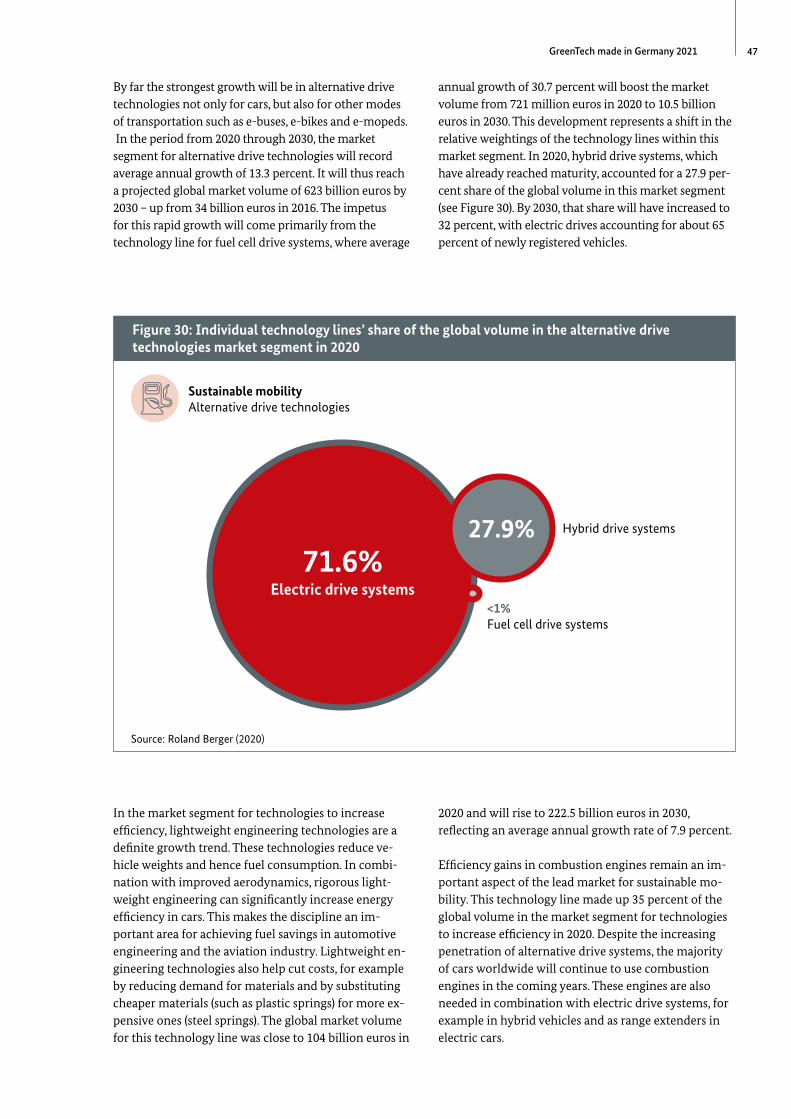
47GreenTech made in Germany 2021
By far the strongest growth will be in alternative drive technologies not only for cars, but also for other modes of transportation such as e-buses, e-bikes and e-mopeds. In the period from 2020 through 2030, the market segment for alternative drive technologies will record average annual growth of 13.3 percent. It will thus reach a projected global market volume of 623 billion euros by 2030 – up from 34 billion euros in 2016. The impetus for this rapid growth will come primarily from the technology line for fuel cell drive systems, where average
annual growth of 30.7 percent will boost the market volume from 721 million euros in 2020 to 10.5 billion euros in 2030. This development represents a shift in the relative weightings of the technology lines within this market segment. In 2020, hybrid drive systems, which have already reached maturity, accounted for a 27.9 percent share of the global volume in this market segment (see Figure 30). By 2030, that share will have increased to 32 percent, with electric drives accounting for about 65 percent of newly registered vehicles.
-
Figure 30: Individual technology lines’ share of the global volume in the alternative drive technologies market segment in 2020
Sustainable mobilityAlternative drive technologies
71.6% Electric drive systems
27.9% Hybrid drive systems
<1% Fuel cell drive systems
Source: Roland Berger (2020)
In the market segment for technologies to increase efficiency, lightweight engineering technologies are a definite growth trend. These technologies reduce vehicle weights and hence fuel consumption. In combination with improved aerodynamics, rigorous lightweight engineering can significantly increase energy efficiency in cars. This makes the discipline an important area for achieving fuel savings in automotive engineering and the aviation industry. Lightweight engineering technologies also help cut costs, for example by reducing demand for materials and by substituting cheaper materials (such as plastic springs) for more expensive ones (steel springs). The global market volume for this technology line was close to 104 billion euros in
- -
-
-
-
-
--
2020 and will rise to 222.5 billion euros in 2030, reflecting an average annual growth rate of 7.9 percent.
Efficiency gains in combustion engines remain an important aspect of the lead market for sustainable mobility. This technology line made up 35 percent of the global volume in the market segment for technologies to increase efficiency in 2020. Despite the increasing penetration of alternative drive systems, the majority of cars worldwide will continue to use combustion engines in the coming years. These engines are also needed in combination with electric drive systems, for example in hybrid vehicles and as range extenders in electric cars.
Figure 30: Individual technology lines’ share of the global volume in the alternative drive technologies market segment in 2020
71.6% Electric drive systems
27.9%
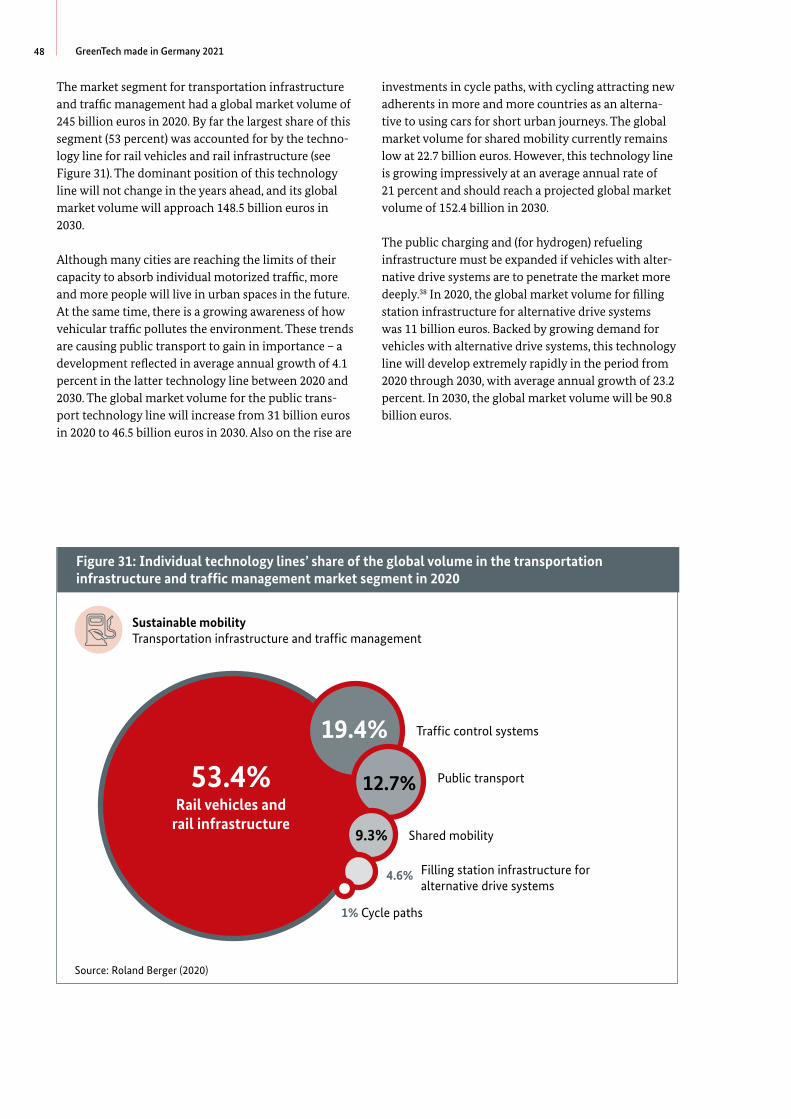
48 GreenTech made in Germany 2021
The market segment for transportation infrastructure and traffic management had a global market volume of 245 billion euros in 2020. By far the largest share of this segment (53 percent) was accounted for by the technology line for rail vehicles and rail infrastructure (see Figure 31). The dominant position of this technology line will not change in the years ahead, and its global market volume will approach 148.5 billion euros in 2030.
-
-
-
-Although many cities are reaching the limits of their capacity to absorb individual motorized traffic, more and more people will live in urban spaces in the future. At the same time, there is a growing awareness of how vehicular traffic pollutes the environment. These trends are causing public transport to gain in importance – a development reflected in average annual growth of 4.1 percent in the latter technology line between 2020 and 2030. The global market volume for the public transport technology line will increase from 31 billion euros in 2020 to 46.5 billion euros in 2030. Also on the rise are
investments in cycle paths, with cycling attracting new adherents in more and more countries as an alternative to using cars for short urban journeys. The global market volume for shared mobility currently remains low at 22.7 billion euros. However, this technology line is growing impressively at an average annual rate of 21 percent and should reach a projected global market volume of 152.4 billion in 2030.
The public charging and (for hydrogen) refueling infrastructure must be expanded if vehicles with alternative drive systems are to penetrate the market more deeply.38 In 2020, the global market volume for filling station infrastructure for alternative drive systems was 11 billion euros. Backed by growing demand for vehicles with alternative drive systems, this technology line will develop extremely rapidly in the period from 2020 through 2030, with average annual growth of 23.2 percent. In 2030, the global market volume will be 90.8 billion euros.
Figure 31: Individual technology lines’ share of the global volume in the transportation infrastructure and traffic management market segment in 2020
Sustainable mobilityTransportation infrastructure and traffic management
53.4% Rail vehicles and rail infrastructure
19.4% Traffic control systems
12.7% Public transport
9.3% Shared mobility
4.6% Filling station infrastructure for alternative drive systems
1% Cycle paths
Source: Roland Berger (2020)
Figure 31: Individual technology lines’ share of the global volume in the transportation infrastructure and traffic management market segment in 2020
53.4% Rail vehicles and rail infrastructure
19.4%
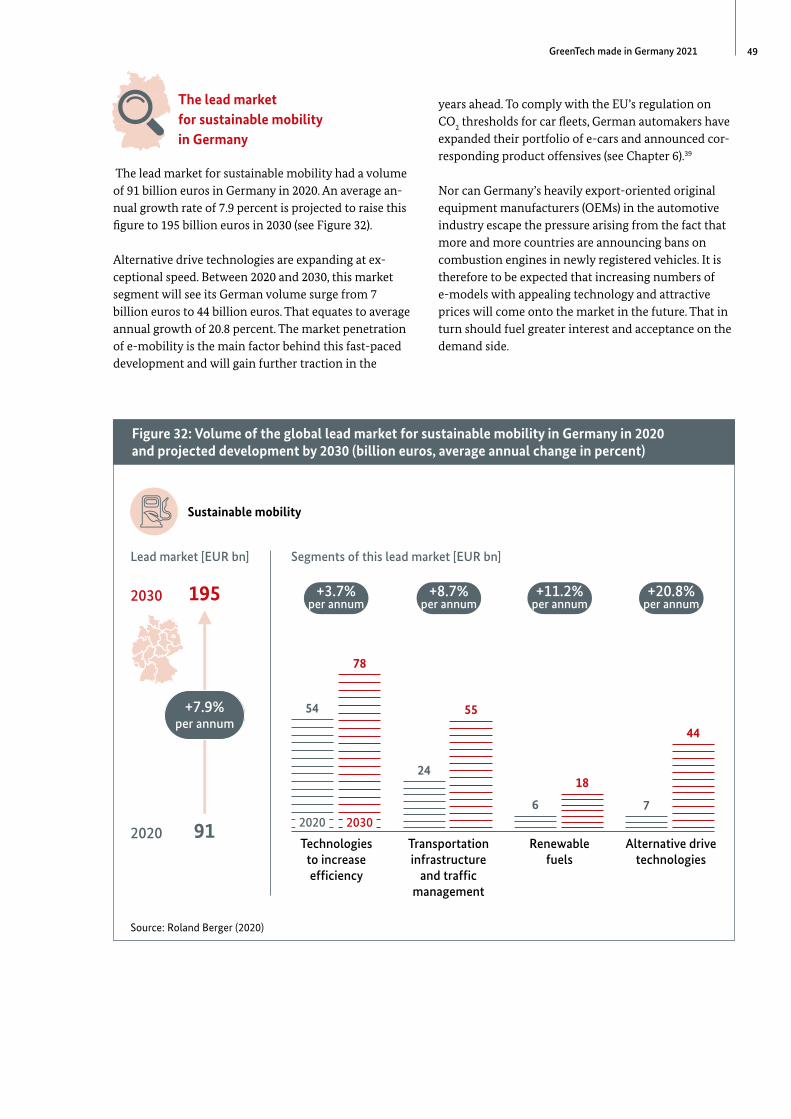
49GreenTech made in Germany 2021
The lead market for sustainable mobility in Germany
The lead market for sustainable mobility had a volume of 91 billion euros in Germany in 2020. An average annual growth rate of 7.9 percent is projected to raise this figure to 195 billion euros in 2030 (see Figure 32).
-
-
-
Figure 32: Volume of the global lead market for sustainable mobility in Germany in 2020 and projected development by 2030 (billion euros, average annual change in percent)
Sustainable mobility
Lead market [EUR bn]
2020 91
+7.9% per annum
2030 195
Segments of this lead market [EUR bn]
2020 2030
Technologies to increase efficiency
54
+3.7% per annum
78
Transportation infrastructure
and traffic management
24
+8.7% per annum
55
Renewable fuels
6
+11.2% per annum
18
Alternative drive technologies
7
+20.8% per annum
44
Source: Roland Berger (2020)
Alternative drive technologies are expanding at exceptional speed. Between 2020 and 2030, this market segment will see its German volume surge from 7 billion euros to 44 billion euros. That equates to average annual growth of 20.8 percent. The market penetration of e-mobility is the main factor behind this fast-paced development and will gain further traction in the
years ahead. To comply with the EU’s regulation on CO2 thresholds for car fleets, German automakers have expanded their portfolio of e-cars and announced corresponding product offensives (see Chapter 6).39
Nor can Germany’s heavily export-oriented original equipment manufacturers (OEMs) in the automotive industry escape the pressure arising from the fact that more and more countries are announcing bans on combustion engines in newly registered vehicles. It is therefore to be expected that increasing numbers of e-models with appealing technology and attractive prices will come onto the market in the future. That in turn should fuel greater interest and acceptance on the demand side.
Figure 32: Volume of the global lead market for sustainable mobility in Germany in 2020 and projected development by 2030 (billion euros, average annual change in percent)
+7.9% per annum
+3.7% per annum
+8.7% per annum
+11.2% per annum
+20.8% per annum
50 GreenTech made in Germany 2021
-
-
-
-
-
-
-
E-mobility
By 2030, the European Union plans to reduce emissions of greenhouse gases by 55 percent compared to 1990 levels. Climate neutrality is to be achieved by 2050. However, since the transportation sector is currently responsible for around 19 percent of such emissions, these goals will remain out of reach unless this sector makes a significant contribution. Alternative drive concepts – first and foremost the electric motor – are therefore central to any transition to an environment-ally friendly transportation system. Accordingly, more and more automakers are preparing themselves for a future of e-mobility only.
One leading German automotive group plans to fully withdraw from pure combustion engine propulsion by the year 2025 and will very soon build only carbonneutral e-cars. To do so, it will launch more than 70 pure-play electric models on the market between now and 2029. Three production facilities in Germany will be converted in full to the production of electric cars.
-
-
-
-
A special platform solution for all e-cars has been introduced to facilitate efficient and flexible production in the volume segment. This platform will enable the production of outwardly completely different body constructions, from compact cars to SUVs and even vans.
4.3.5 Waste management and recycling
The guiding principles established for waste management and recycling map out a five-tiered waste hierarchy with the following order of priority: prevention, preparation for reuse, recycling, other forms of recovery (in particular energy recovery) and disposal. This hierarchy creates a framework within which to identify distinct market segments in the lead market for waste management and recycling (see Figure 33). The services and infrastructures subsumed under the market segments for waste collection, transportation and separation lay the foundation for waste management and recycling in any and every form. The market segment for material recovery comprises the technology lines for mechanical recycling and feedstock recycling. Mechanical recycling refers to recycling processes in which the materials and their chemical structures are not altered. One example is the remelting of plastic waste to produce granulate. By contrast, feedstock recycling treats substances in a way that does change their chemical structure – deriving oils, waxes and gases from plastic waste, for example.
One widespread form of energy recovery is thermal waste treatment, which involves incinerating waste and harnessing the energy released by this process to supply heat and generate power. The use of organic waste in biogas plants is another variation on the same theme. Waste that is not suitable for material or energy recovery must be disposed of in an environmentally friendly manner. The landfill technologies market segment brings together those technology lines that serve this purpose.
Starting from a global market volume of 148 billion euros in 2020, this lead market will swell to 263 billion euros by 2030 at an average annual growth rate of 5.9 percent (see Figure 34). This expansion will be driven in part by new and innovative strategies such as the “whole-lifecycle approach” and what is known as “recyclability by design”.
Waste collection, transportation and separation remains the dominant segment in the lead market for waste management and recycling. The global volume for this market segment was 97 billion euros in 2020, giving it the largest share of the whole waste management and recycling industry. Between 2020 and 2030, the market segment for waste collection, transporta
E-mobility
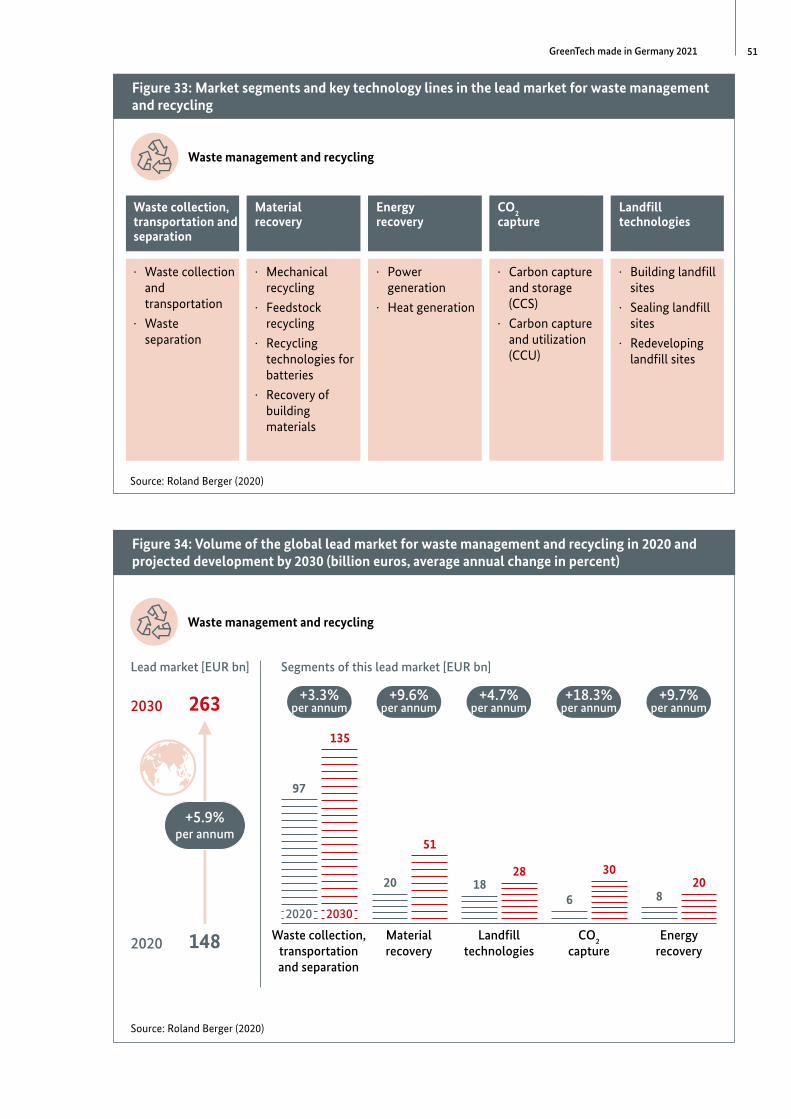
51GreenTech made in Germany 2021
Figure 33: Market segments and key technology lines in the lead market for waste management and recycling
Waste management and recycling
Waste collection, transportation and separation
· Waste collection and transportation
· Waste separation
Material recovery
· Mechanical recycling
· Feedstock recycling
· Recycling technologies for batteries
· Recovery of building materials
Energy recovery
· Power generation
· Heat generation
CO2 capture
· Carbon capture and storage (CCS)
· Carbon capture and utilization (CCU)
Landfill technologies
· Building landfill sites
· Sealing landfill sites
· Redeveloping landfill sites
Source: Roland Berger (2020)
Figure 34: Volume of the global lead market for waste management and recycling in 2020 and projected development by 2030 (billion euros, average annual change in percent)
Waste management and recycling
Lead market [EUR bn]
2020 148
+5.9% per annum
2030 263
Segments of this lead market [EUR bn]
2020 2030
Waste collection, transportation and separation
97
+3.3% per annum
135
Material recovery
20
+9.6% per annum
51
Landfill technologies
18
+4.7% per annum
28
CO2 capture
6
+18.3% per annum
30
Energy recovery
8
+9.7% per annum
20
Source: Roland Berger (2020)
Figure 33: Market segments and key technology lines in the lead market for waste management and recycling
Waste collection, transportation and separation
Material recovery
Energy recovery
CO2 capture
Landfill technologies
Figure 34: Volume of the global lead market for waste management and recycling in 2020 and projected development by 2030 (billion euros, average annual change in percent)
+5.9% per annum
+3.3% per annum
+9.6% per annum
+4.7% per annum
+18.3% per annum
+9.7% per annum
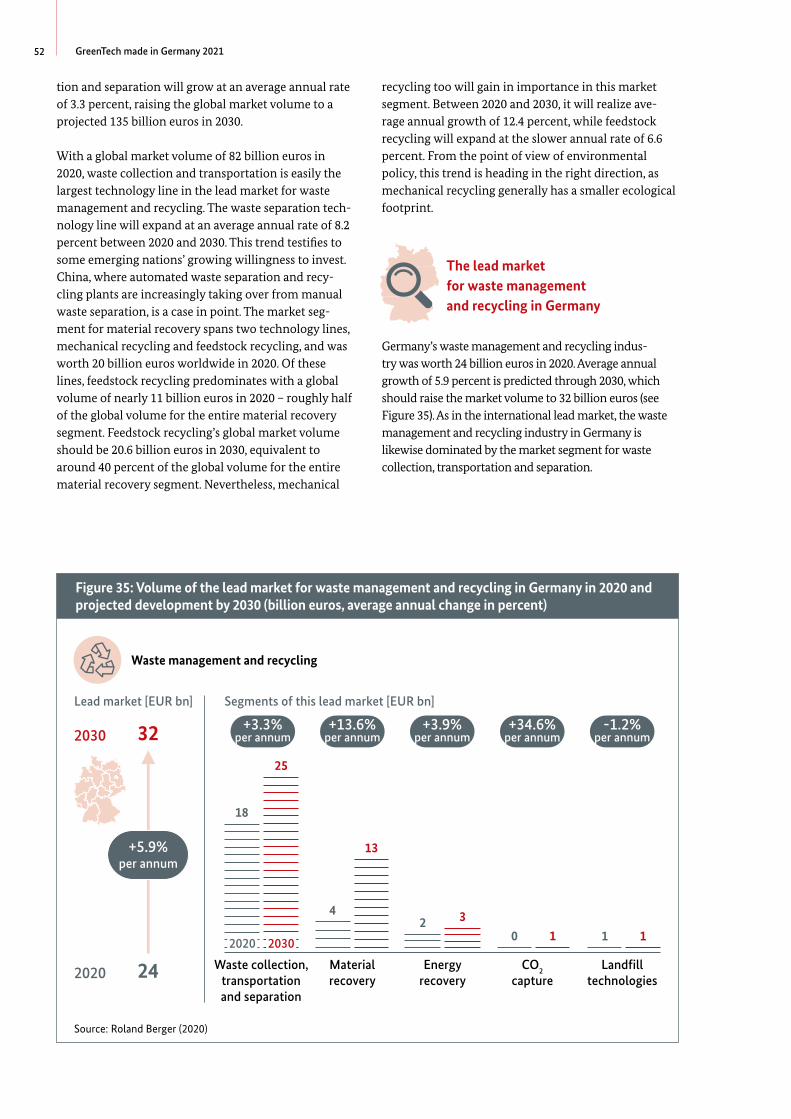
52 GreenTech made in Germany 2021
tion and separation will grow at an average annual rate of 3.3 percent, raising the global market volume to a projected 135 billion euros in 2030.
With a global market volume of 82 billion euros in 2020, waste collection and transportation is easily the largest technology line in the lead market for waste management and recycling. The waste separation technology line will expand at an average annual rate of 8.2 percent between 2020 and 2030. This trend testifies to some emerging nations’ growing willingness to invest. China, where automated waste separation and recycling plants are increasingly taking over from manual waste separation, is a case in point. The market segment for material recovery spans two technology lines, mechanical recycling and feedstock recycling, and was worth 20 billion euros worldwide in 2020. Of these lines, feedstock recycling predominates with a global volume of nearly 11 billion euros in 2020 – roughly half of the global volume for the entire material recovery segment. Feedstock recycling’s global market volume should be 20.6 billion euros in 2030, equivalent to around 40 percent of the global volume for the entire material recovery segment. Nevertheless, mechanical
-
-
-
-
-
recycling too will gain in importance in this market segment. Between 2020 and 2030, it will realize average annual growth of 12.4 percent, while feedstock recycling will expand at the slower annual rate of 6.6 percent. From the point of view of environmental policy, this trend is heading in the right direction, as mechanical recycling generally has a smaller ecological footprint.
The lead market for waste management and recycling in Germany
Germany’s waste management and recycling industry was worth 24 billion euros in 2020. Average annual growth of 5.9 percent is predicted through 2030, which should raise the market volume to 32 billion euros (see Figure 35). As in the international lead market, the waste management and recycling industry in Germany is likewise dominated by the market segment for waste collection, transportation and separation.
Figure 35: Volume of the lead market for waste management and recycling in Germany in 2020 and projected development by 2030 (billion euros, average annual change in percent)
Waste management and recycling
Lead market [EUR bn]
2020 24
+5.9% per annum
2030 32
Segments of this lead market [EUR bn]
2020 2030
Waste collection, transportation and separation
18
+3.3% per annum
25
Material recovery
4
+13.6% per annum
13
Energy recovery
2
+3.9% per annum
3
CO2 capture
0
+34.6% per annum
1
Landfill technologies
1
-1.2% per annum
1
Source: Roland Berger (2020)
Figure 35: Volume of the lead market for waste management and recycling in Germany in 2020 and projected development by 2030 (billion euros, average annual change in percent)
+5.9% per annum
+3.3% per annum
+13.6% per annum
+3.9% per annum
+34.6% per annum
-1.2% per annum
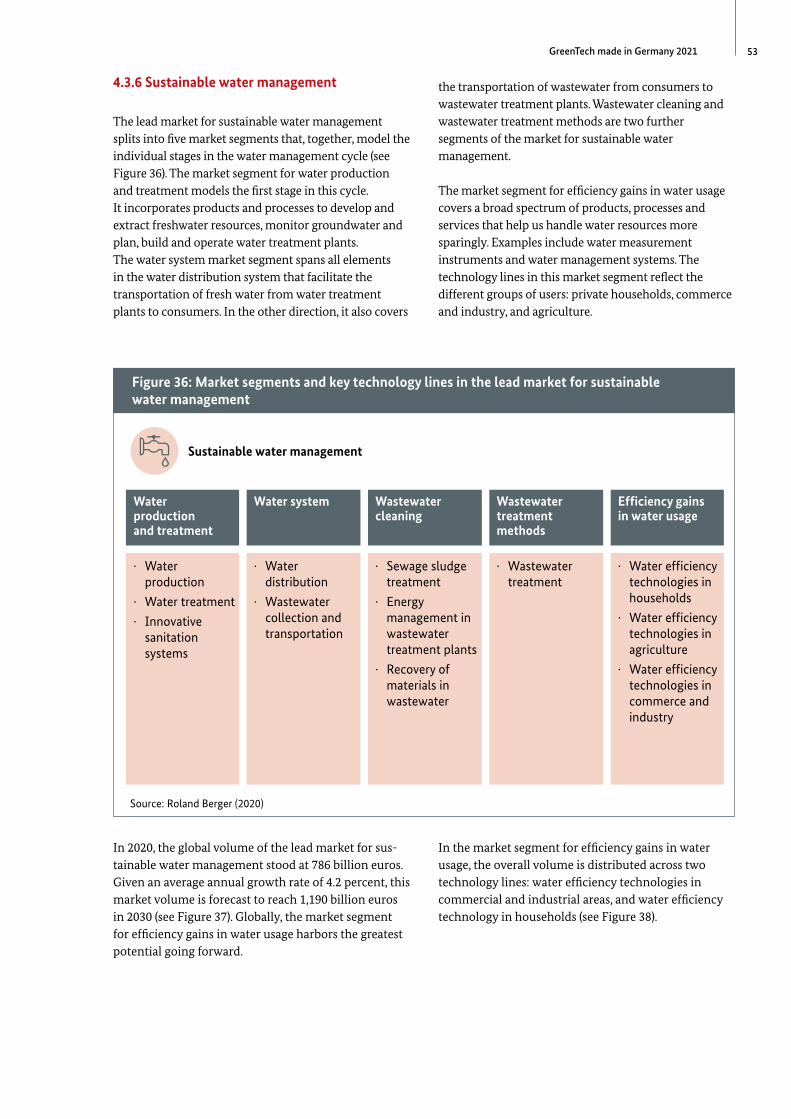
53GreenTech made in Germany 2021
4.3.6 Sustainable water management
The lead market for sustainable water management splits into five market segments that, together, model the individual stages in the water management cycle (see Figure 36). The market segment for water production and treatment models the first stage in this cycle. It incorporates products and processes to develop and extract freshwater resources, monitor groundwater and plan, build and operate water treatment plants. The water system market segment spans all elements in the water distribution system that facilitate the transportation of fresh water from water treatment plants to consumers. In the other direction, it also covers
the transportation of wastewater from consumers to wastewater treatment plants. Wastewater cleaning and wastewater treatment methods are two further segments of the market for sustainable water management.
Figure 36: Market segments and key technology lines in the lead market for sustainable water management
Sustainable water management
Water production and treatment
· Water production
· Water treatment
· Innovative sanitation systems
Water system
· Water distribution
· Wastewater collection and transportation
Wastewater cleaning
· Sewage sludge treatment
· Energy management in wastewater treatment plants
· Recovery of materials in wastewater
Wastewater treatment methods
· Wastewater treatment
Efficiency gains in water usage
· Water efficiency technologies in households
· Water efficiency technologies in agriculture
· Water efficiency technologies in commerce and industry
-
Source: Roland Berger (2020)
The market segment for efficiency gains in water usage covers a broad spectrum of products, processes and services that help us handle water resources more sparingly. Examples include water measurement instruments and water management systems. The technology lines in this market segment reflect the different groups of users: private households, commerce and industry, and agriculture.
In 2020, the global volume of the lead market for sustainable water management stood at 786 billion euros. Given an average annual growth rate of 4.2 percent, this market volume is forecast to reach 1,190 billion euros in 2030 (see Figure 37). Globally, the market segment for efficiency gains in water usage harbors the greatest potential going forward.
In the market segment for efficiency gains in water usage, the overall volume is distributed across two technology lines: water efficiency technologies in commercial and industrial areas, and water efficiency technology in households (see Figure 38).
Figure 36: Market segments and key technology lines in the lead market for sustainable water management
Water production and treatment
Water system Wastewater cleaning
Wastewater treatment methods
Efficiency gains in water usage
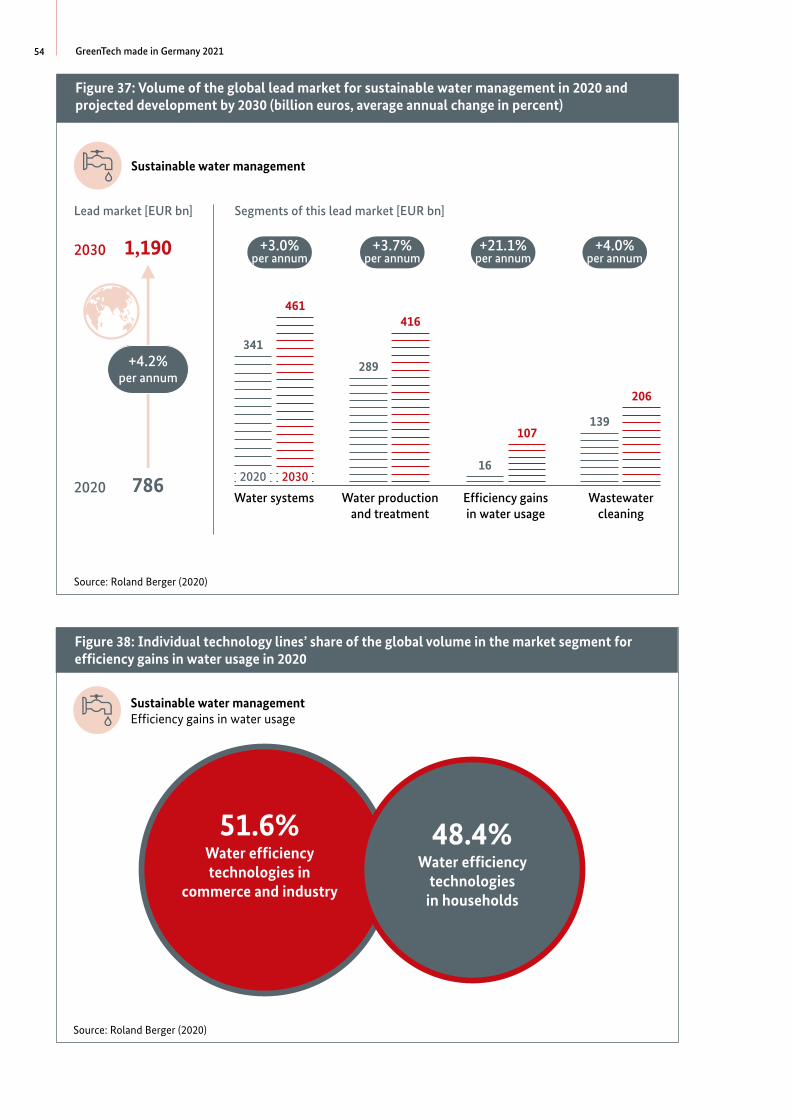
54 GreenTech made in Germany 2021
Figure 37: Volume of the global lead market for sustainable water management in 2020 and projected development by 2030 (billion euros, average annual change in percent)
Sustainable water management
Lead market [EUR bn]
2020 786
+4.2% per annum
2030 1,190
Segments of this lead market [EUR bn]
2020 2030
Water systems
341
+3.0% per annum
461
Water production and treatment
289
+3.7% per annum
416
Efficiency gains in water usage
16
+21.1% per annum
107
Wastewater cleaning
139
+4.0% per annum
206
Source: Roland Berger (2020)
Figure 38: Individual technology lines’ share of the global volume in the market segment for efficiency gains in water usage in 2020
Sustainable water managementEfficiency gains in water usage
51.6% Water efficiency
technologies in commerce and industry
48.4% Water efficiency
technologies in households
Source: Roland Berger (2020)
Figure 37: Volume of the global lead market for sustainable water management in 2020 and projected development by 2030 (billion euros, average annual change in percent)
+4.2% per annum
+3.0% per annum
+3.7% per annum
+21.1% per annum
+4.0% per annum
Figure 38: Individual technology lines’ share of the global volume in the market segment for efficiency gains in water usage in 2020
48.4% Water efficiency
technologies in households
51.6% Water efficiency
technologies in commerce and industry
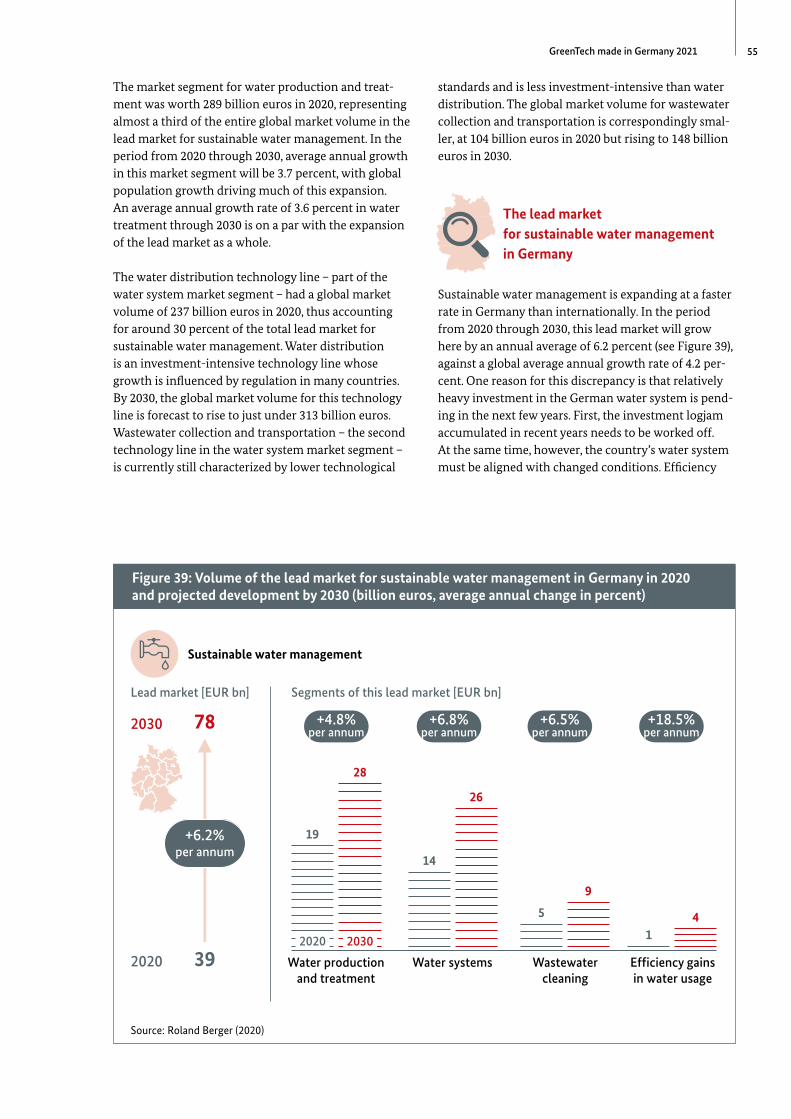
55GreenTech made in Germany 2021
The market segment for water production and treatment was worth 289 billion euros in 2020, representing almost a third of the entire global market volume in the lead market for sustainable water management. In the period from 2020 through 2030, average annual growth in this market segment will be 3.7 percent, with global population growth driving much of this expansion. An average annual growth rate of 3.6 percent in water treatment through 2030 is on a par with the expansion of the lead market as a whole.
-
The water distribution technology line – part of the water system market segment – had a global market volume of 237 billion euros in 2020, thus accounting for around 30 percent of the total lead market for sustainable water management. Water distribution is an investment-intensive technology line whose growth is influenced by regulation in many countries. By 2030, the global market volume for this technology line is forecast to rise to just under 313 billion euros. Wastewater collection and transportation – the second technology line in the water system market segment – is currently still characterized by lower technological
standards and is less investment-intensive than water distribution. The global market volume for wastewater collection and transportation is correspondingly smaller, at 104 billion euros in 2020 but rising to 148 billion euros in 2030.
-
-
-
The lead market for sustainable water management in Germany
Sustainable water management is expanding at a faster rate in Germany than internationally. In the period from 2020 through 2030, this lead market will grow here by an annual average of 6.2 percent (see Figure 39), against a global average annual growth rate of 4.2 percent. One reason for this discrepancy is that relatively heavy investment in the German water system is pending in the next few years. First, the investment logjam accumulated in recent years needs to be worked off. At the same time, however, the country’s water system must be aligned with changed conditions. Efficiency
Figure 39: Volume of the lead market for sustainable water management in Germany in 2020 and projected development by 2030 (billion euros, average annual change in percent)
Sustainable water management
Lead market [EUR bn]
2020 39
+6.2% per annum
2030 78
Segments of this lead market [EUR bn]
2020 2030
Water production and treatment
19
+4.8% per annum
28
Water systems
14
+6.8% per annum
26
Wastewater cleaning
5
+6.5% per annum
9
Efficiency gains in water usage
1
+18.5% per annum
4
Source: Roland Berger (2020)
Figure 39: Volume of the lead market for sustainable water management in Germany in 2020 and projected development by 2030 (billion euros, average annual change in percent)
+6.2% per annum
+4.8% per annum
+6.8% per annum
+6.5% per annum
+18.5% per annum
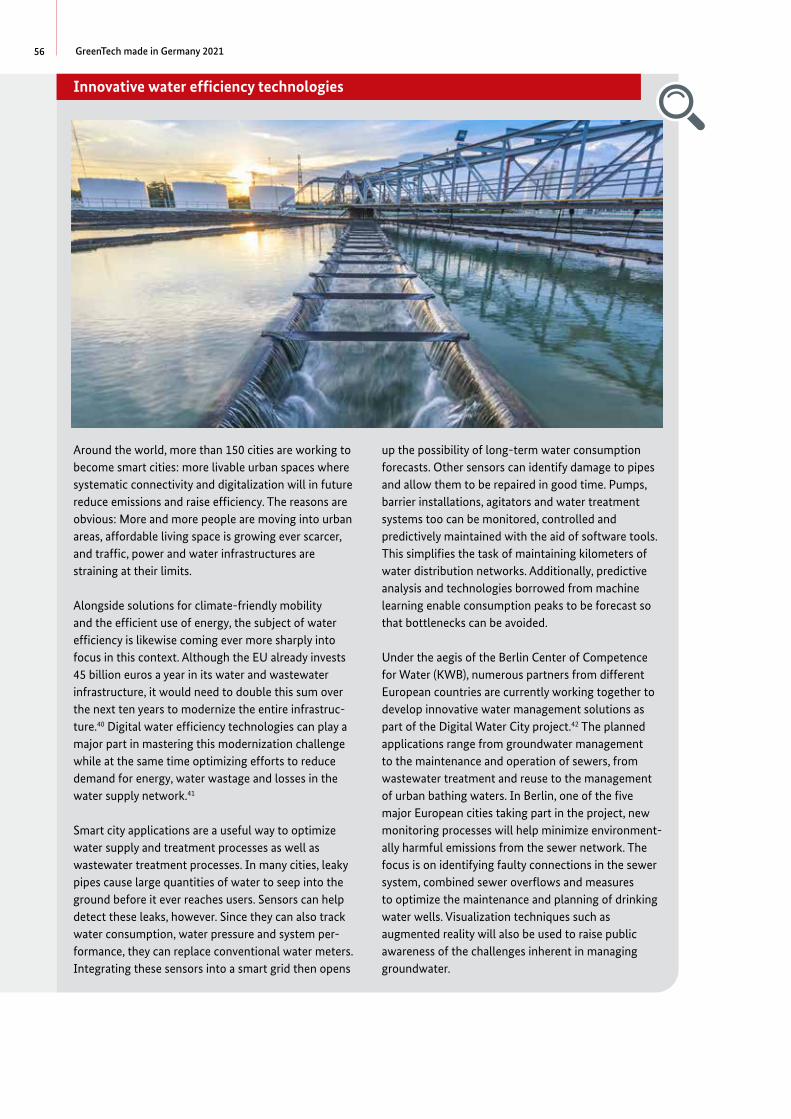
56 GreenTech made in Germany 2021
-
-
Innovative water efficiency technologies
-
Around the world, more than 150 cities are working to become smart cities: more livable urban spaces where systematic connectivity and digitalization will in future reduce emissions and raise efficiency. The reasons are obvious: More and more people are moving into urban areas, affordable living space is growing ever scarcer, and traffic, power and water infrastructures are straining at their limits.
Alongside solutions for climate-friendly mobility and the efficient use of energy, the subject of water efficiency is likewise coming ever more sharply into focus in this context. Although the EU already invests 45 billion euros a year in its water and wastewater infrastructure, it would need to double this sum over the next ten years to modernize the entire infrastructure.40 Digital water efficiency technologies can play a major part in mastering this modernization challenge while at the same time optimizing efforts to reduce demand for energy, water wastage and losses in the water supply network.41
Smart city applications are a useful way to optimize water supply and treatment processes as well as wastewater treatment processes. In many cities, leaky pipes cause large quantities of water to seep into the ground before it ever reaches users. Sensors can help detect these leaks, however. Since they can also track water consumption, water pressure and system performance, they can replace conventional water meters. Integrating these sensors into a smart grid then opens
up the possibility of long-term water consumption forecasts. Other sensors can identify damage to pipes and allow them to be repaired in good time. Pumps, barrier installations, agitators and water treatment systems too can be monitored, controlled and predictively maintained with the aid of software tools. This simplifies the task of maintaining kilometers of water distribution networks. Additionally, predictive analysis and technologies borrowed from machine learning enable consumption peaks to be forecast so that bottlenecks can be avoided.
Under the aegis of the Berlin Center of Competence for Water (KWB), numerous partners from different European countries are currently working together to develop innovative water management solutions as part of the Digital Water City project.42 The planned applications range from groundwater management to the maintenance and operation of sewers, from wastewater treatment and reuse to the management of urban bathing waters. In Berlin, one of the five major European cities taking part in the project, new monitoring processes will help minimize environmentally harmful emissions from the sewer network. The focus is on identifying faulty connections in the sewer system, combined sewer overflows and measures to optimize the maintenance and planning of drinking water wells. Visualization techniques such as augmented reality will also be used to raise public awareness of the challenges inherent in managing groundwater.
Innovative water efficiency technologies
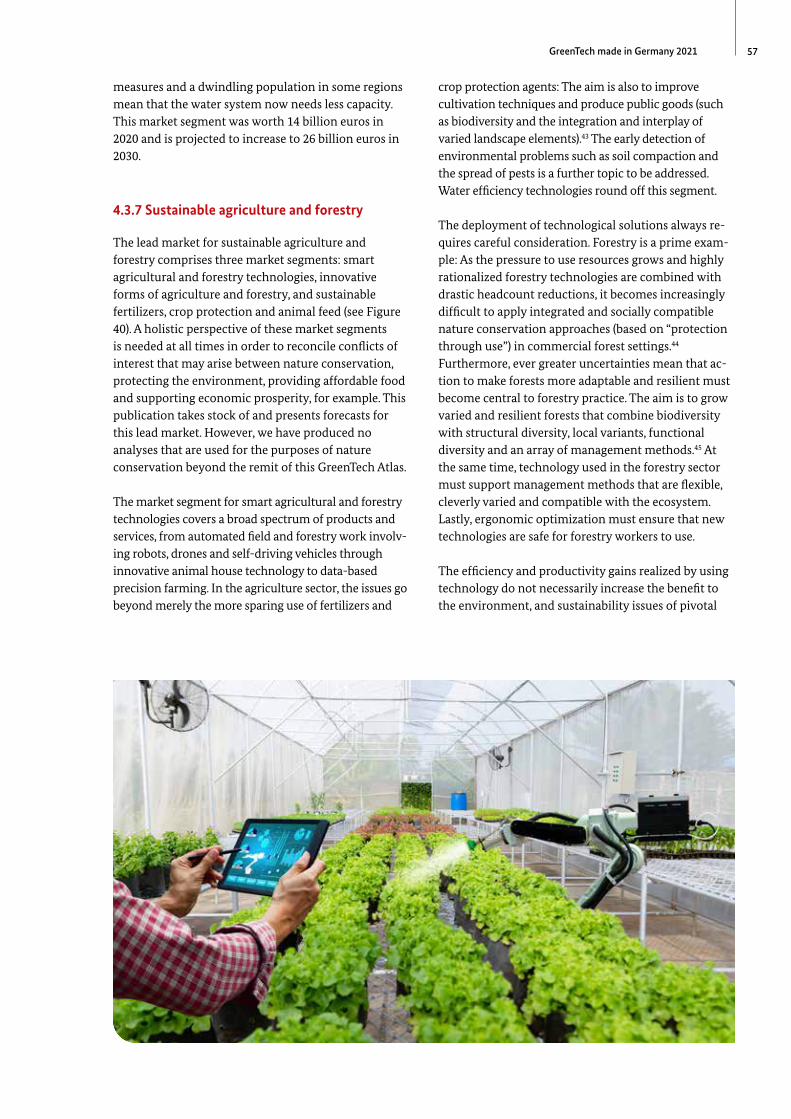
57GreenTech made in Germany 2021
measures and a dwindling population in some regions mean that the water system now needs less capacity. This market segment was worth 14 billion euros in 2020 and is projected to increase to 26 billion euros in 2030.
4.3.7 Sustainable agriculture and forestry
The lead market for sustainable agriculture and forestry comprises three market segments: smart agricultural and forestry technologies, innovative forms of agriculture and forestry, and sustainable fertilizers, crop protection and animal feed (see Figure 40). A holistic perspective of these market segments is needed at all times in order to reconcile conflicts of interest that may arise between nature conservation, protecting the environment, providing affordable food and supporting economic prosperity, for example. This publication takes stock of and presents forecasts for this lead market. However, we have produced no analyses that are used for the purposes of nature conservation beyond the remit of this GreenTech Atlas.
-
--
-
The market segment for smart agricultural and forestry technologies covers a broad spectrum of products and services, from automated field and forestry work involving robots, drones and self-driving vehicles through innovative animal house technology to data-based precision farming. In the agriculture sector, the issues go beyond merely the more sparing use of fertilizers and
crop protection agents: The aim is also to improve cultivation techniques and produce public goods (such as biodiversity and the integration and interplay of varied landscape elements).43 The early detection of environmental problems such as soil compaction and the spread of pests is a further topic to be addressed. Water efficiency technologies round off this segment.
The deployment of technological solutions always requires careful consideration. Forestry is a prime example: As the pressure to use resources grows and highly rationalized forestry technologies are combined with drastic headcount reductions, it becomes increasingly difficult to apply integrated and socially compatible nature conservation approaches (based on “protection through use”) in commercial forest settings.44
Furthermore, ever greater uncertainties mean that action to make forests more adaptable and resilient must become central to forestry practice. The aim is to grow varied and resilient forests that combine biodiversity with structural diversity, local variants, functional diversity and an array of management methods.45 At the same time, technology used in the forestry sector must support management methods that are flexible, cleverly varied and compatible with the ecosystem. Lastly, ergonomic optimization must ensure that new technologies are safe for forestry workers to use.
The efficiency and productivity gains realized by using technology do not necessarily increase the benefit to the environment, and sustainability issues of pivotal
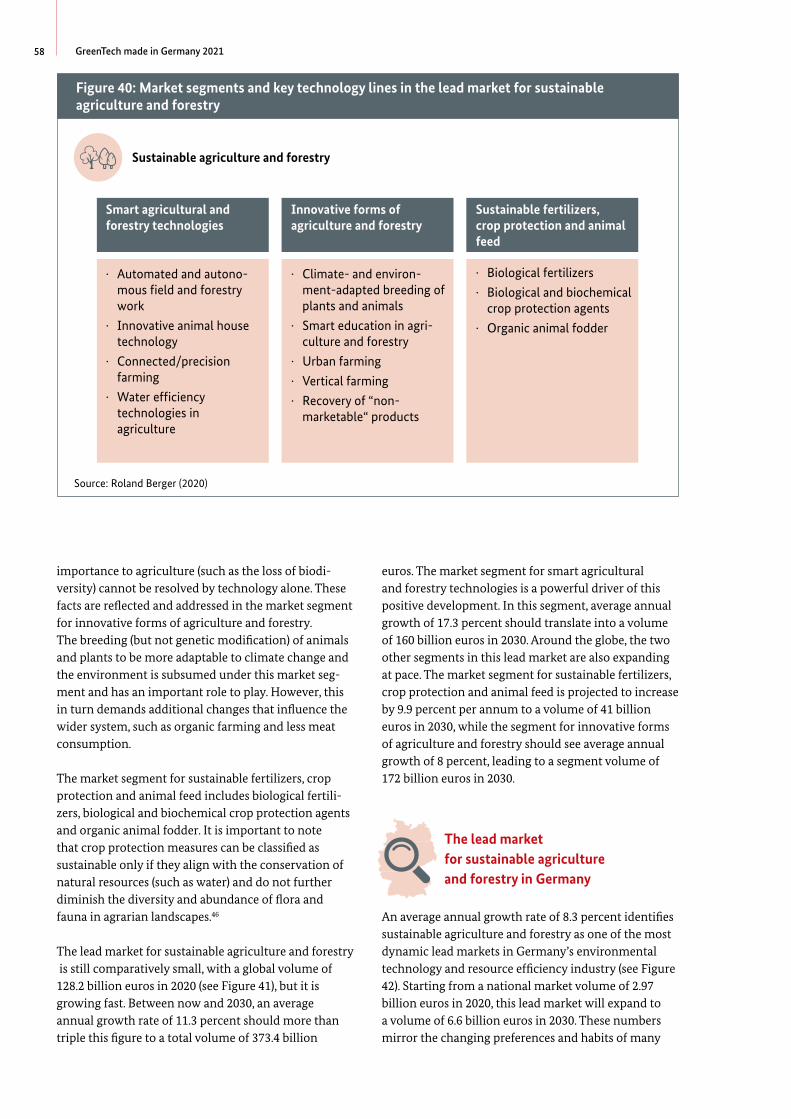
58 GreenTech made in Germany 2021
importance to agriculture (such as the loss of biodiversity) cannot be resolved by technology alone. These facts are reflected and addressed in the market segment for innovative forms of agriculture and forestry. The breeding (but not genetic modification) of animals and plants to be more adaptable to climate change and the environment is subsumed under this market segment and has an important role to play. However, this in turn demands additional changes that influence the wider system, such as organic farming and less meat consumption.
-
-
-
Figure 40: Market segments and key technology lines in the lead market for sustainable agriculture and forestry
Sustainable agriculture and forestry
Smart agricultural and forestry technologies
· Automated and autonomous field and forestry work
-
· Innovative animal house technology
· Connected/precision farming
· Water efficiency technologies in agriculture
Innovative forms of agriculture and forestry
· Climate- and environment-adapted breeding of plants and animals
-
· Smart education in agriculture and forestry
-
· Urban farming
· Vertical farming
· Recovery of “non-marketable“ products
Sustainable fertilizers, crop protection and animal feed
· Biological fertilizers
· Biological and biochemical crop protection agents
· Organic animal fodder
Source: Roland Berger (2020)
The market segment for sustainable fertilizers, crop protection and animal feed includes biological fertilizers, biological and biochemical crop protection agents and organic animal fodder. It is important to note that crop protection measures can be classified as sustainable only if they align with the conservation of natural resources (such as water) and do not further diminish the diversity and abundance of flora and fauna in agrarian landscapes.46
The lead market for sustainable agriculture and forestry is still comparatively small, with a global volume of 128.2 billion euros in 2020 (see Figure 41), but it is growing fast. Between now and 2030, an average annual growth rate of 11.3 percent should more than triple this figure to a total volume of 373.4 billion
euros. The market segment for smart agricultural and forestry technologies is a powerful driver of this positive development. In this segment, average annual growth of 17.3 percent should translate into a volume of 160 billion euros in 2030. Around the globe, the two other segments in this lead market are also expanding at pace. The market segment for sustainable fertilizers, crop protection and animal feed is projected to increase by 9.9 percent per annum to a volume of 41 billion euros in 2030, while the segment for innovative forms of agriculture and forestry should see average annual growth of 8 percent, leading to a segment volume of 172 billion euros in 2030.
The lead market for sustainable agriculture and forestry in Germany
An average annual growth rate of 8.3 percent identifies sustainable agriculture and forestry as one of the most dynamic lead markets in Germany’s environmental technology and resource efficiency industry (see Figure 42). Starting from a national market volume of 2.97 billion euros in 2020, this lead market will expand to a volume of 6.6 billion euros in 2030. These numbers mirror the changing preferences and habits of many
Figure 40: Market segments and key technology lines in the lead market for sustainable agriculture and forestry
Smart agricultural and forestry technologies
Innovative forms of agriculture and forestry
Sustainable fertilizers, crop protection and animal feed
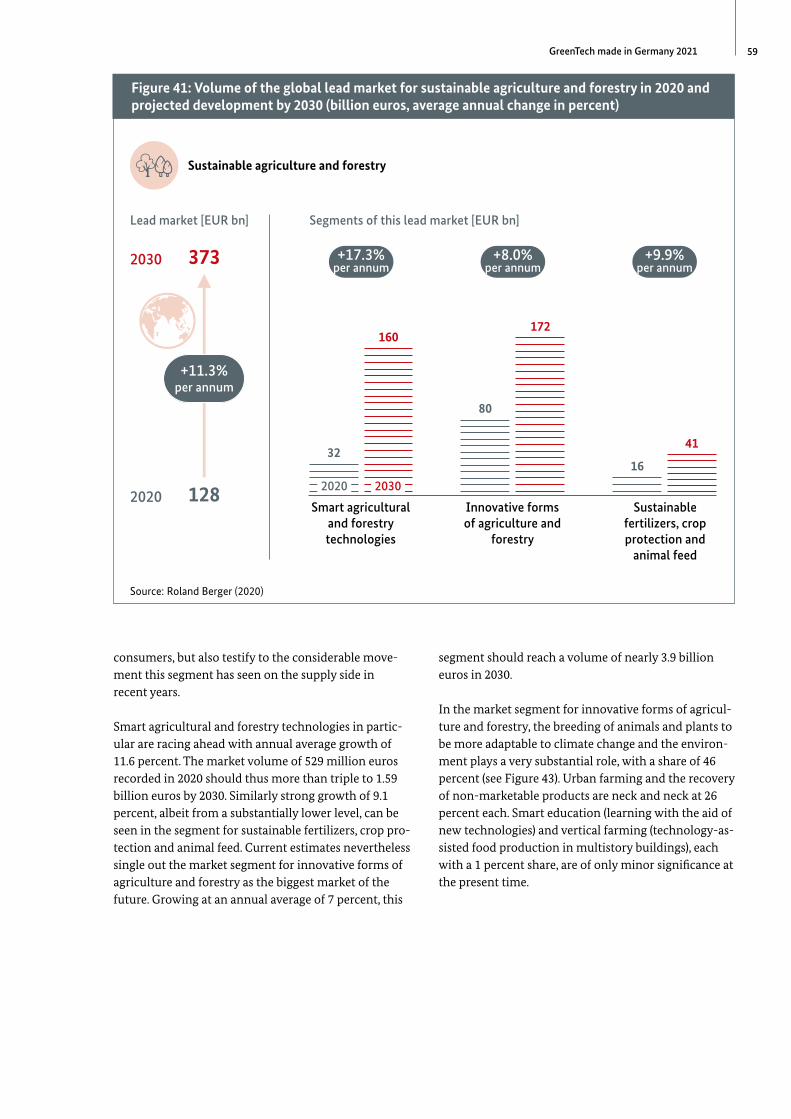
59GreenTech made in Germany 2021
consumers, but also testify to the considerable movement this segment has seen on the supply side in recent years.
-
-
-
-
-
-
Figure 41: Volume of the global lead market for sustainable agriculture and forestry in 2020 and projected development by 2030 (billion euros, average annual change in percent)
Sustainable agriculture and forestry
Lead market [EUR bn]
2020 128
+11.3% per annum
2030 373
Segments of this lead market [EUR bn]
2020 2030
Smart agricultural and forestry technologies
32
+17.3% per annum
160
Innovative forms of agriculture and
forestry
80
+8.0% per annum
172
Sustainable fertilizers, crop protection and
animal feed
16
+9.9% per annum
41
Source: Roland Berger (2020)
Smart agricultural and forestry technologies in particular are racing ahead with annual average growth of 11.6 percent. The market volume of 529 million euros recorded in 2020 should thus more than triple to 1.59 billion euros by 2030. Similarly strong growth of 9.1 percent, albeit from a substantially lower level, can be seen in the segment for sustainable fertilizers, crop protection and animal feed. Current estimates nevertheless single out the market segment for innovative forms of agriculture and forestry as the biggest market of the future. Growing at an annual average of 7 percent, this
segment should reach a volume of nearly 3.9 billion euros in 2030.
In the market segment for innovative forms of agriculture and forestry, the breeding of animals and plants to be more adaptable to climate change and the environment plays a very substantial role, with a share of 46 percent (see Figure 43). Urban farming and the recovery of non-marketable products are neck and neck at 26 percent each. Smart education (learning with the aid of new technologies) and vertical farming (technology-assisted food production in multistory buildings), each with a 1 percent share, are of only minor significance at the present time.
Figure 41: Volume of the global lead market for sustainable agriculture and forestry in 2020 and projected development by 2030 (billion euros, average annual change in percent)
+11.3% per annum
+17.3% per annum
+8.0% per annum
+9.9% per annum
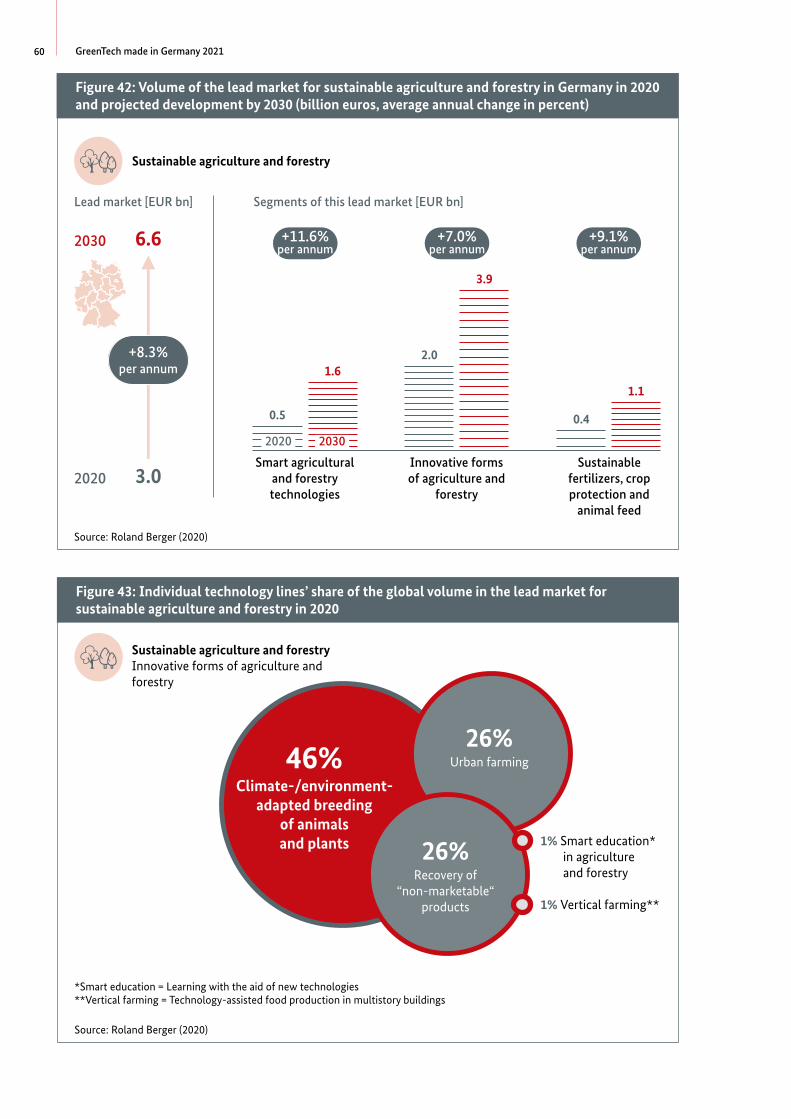
60 GreenTech made in Germany 2021
Figure 42: Volume of the lead market for sustainable agriculture and forestry in Germany in 2020 and projected development by 2030 (billion euros, average annual change in percent)
Sustainable agriculture and forestry
Lead market [EUR bn]
2020 3.0
+8.3% per annum
2030 6.6
Segments of this lead market [EUR bn]
2020 2030
Smart agricultural and forestry technologies
0.5
+11.6% per annum
1.6
Innovative forms of agriculture and
forestry
2.0
+7.0% per annum
3.9
Sustainable fertilizers, crop protection and
animal feed
0.4
+9.1% per annum
1.1
Source: Roland Berger (2020)
Figure 43: Individual technology lines’ share of the global volume in the lead market for sustainable agriculture and forestry in 2020
Sustainable agriculture and forestryInnovative forms of agriculture and forestry
46% Climate-/environment-
adapted breeding of animals and plants
26% Urban farming
26% Recovery of
“non-marketable“ products
1% Smart educationin agriculture and forestry
*
1% Vertical farming**
*Smart education = Learning with the aid of new technologies **Vertical farming = Technology-assisted food production in multistory buildings
Source: Roland Berger (2020)
Figure 42: Volume of the lead market for sustainable agriculture and forestry in Germany in 2020 and projected development by 2030 (billion euros, average annual change in percent)
+8.3% per annum
+11.6% per annum
+7.0% per annum
+9.1% per annum
46% Climate-/environment-
adapted breeding of animals and plants
26% Urban farming
26% Recovery of
“non-marketable“ products
Figure 43: Individual technology lines’ share of the global volume in the lead market for sustainable agriculture and forestry in 2020
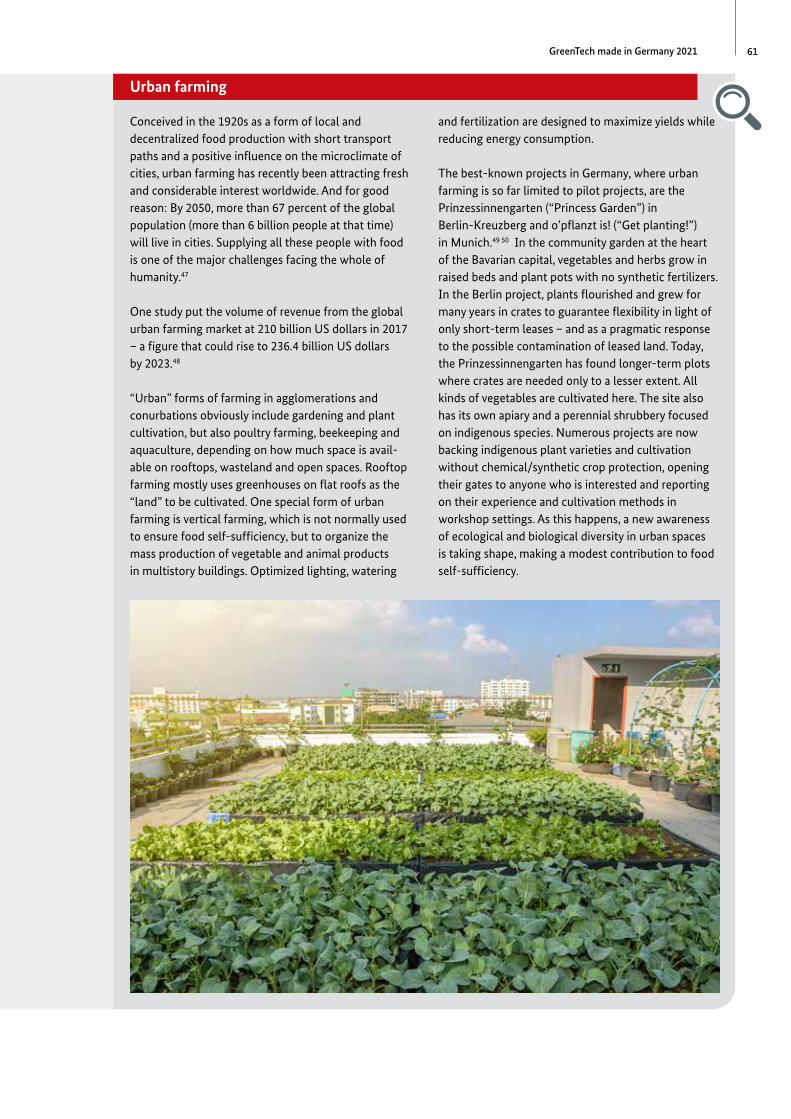
61GreenTech made in Germany 2021
-
Urban farming
Conceived in the 1920s as a form of local and decentralized food production with short transport paths and a positive influence on the microclimate of cities, urban farming has recently been attracting fresh and considerable interest worldwide. And for good reason: By 2050, more than 67 percent of the global population (more than 6 billion people at that time) will live in cities. Supplying all these people with food is one of the major challenges facing the whole of humanity.47
One study put the volume of revenue from the global urban farming market at 210 billion US dollars in 2017 – a figure that could rise to 236.4 billion US dollars by 2023.48
“Urban” forms of farming in agglomerations and conurbations obviously include gardening and plant cultivation, but also poultry farming, beekeeping and aquaculture, depending on how much space is available on rooftops, wasteland and open spaces. Rooftop farming mostly uses greenhouses on flat roofs as the “land” to be cultivated. One special form of urban farming is vertical farming, which is not normally used to ensure food self-sufficiency, but to organize the mass production of vegetable and animal products in multistory buildings. Optimized lighting, watering
and fertilization are designed to maximize yields while reducing energy consumption.
The best-known projects in Germany, where urban farming is so far limited to pilot projects, are the Prinzessinnengarten (“Princess Garden”) in Berlin-Kreuzberg and o’pflanzt is! (“Get planting!”) in Munich.49 50 In the community garden at the heart of the Bavarian capital, vegetables and herbs grow in raised beds and plant pots with no synthetic fertilizers. In the Berlin project, plants flourished and grew for many years in crates to guarantee flexibility in light of only short-term leases – and as a pragmatic response to the possible contamination of leased land. Today, the Prinzessinnengarten has found longer-term plots where crates are needed only to a lesser extent. All kinds of vegetables are cultivated here. The site also has its own apiary and a perennial shrubbery focused on indigenous species. Numerous projects are now backing indigenous plant varieties and cultivation without chemical/synthetic crop protection, opening their gates to anyone who is interested and reporting on their experience and cultivation methods in workshop settings. As this happens, a new awareness of ecological and biological diversity in urban spaces is taking shape, making a modest contribution to food self-sufficiency.
Urban farming
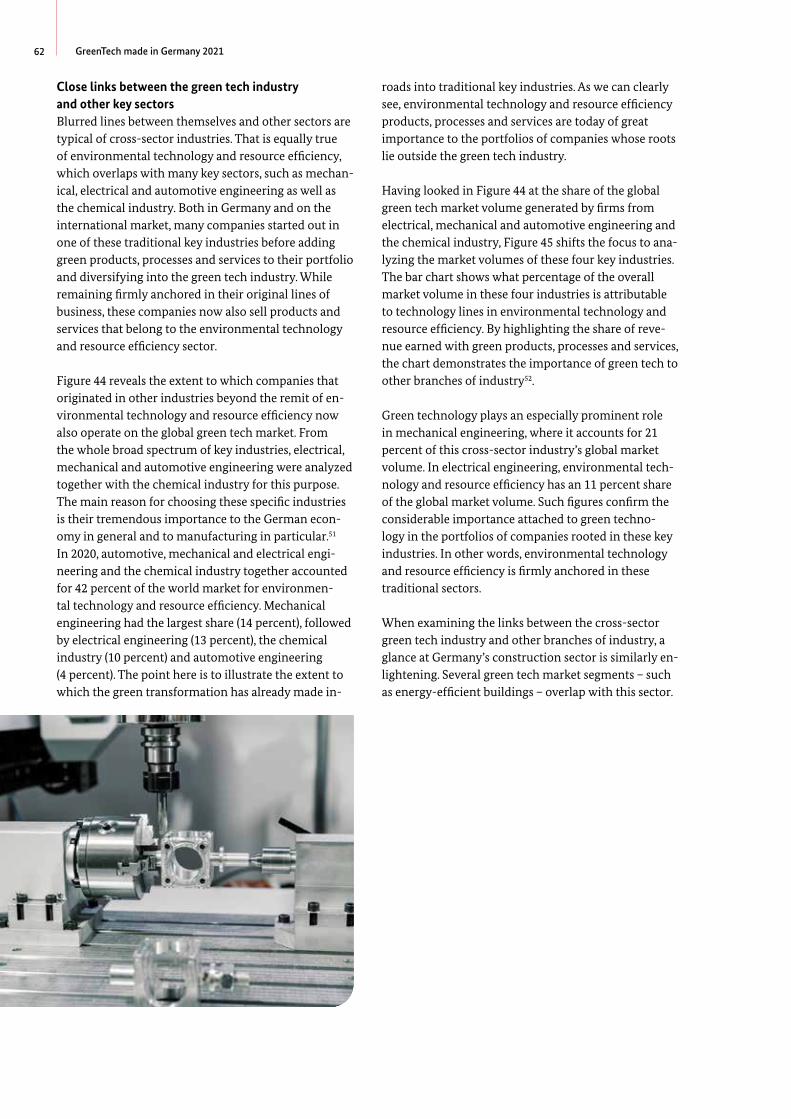
62 GreenTech made in Germany 2021
Close links between the green tech industry and other key sectors
-
-
-
-
-
-
Blurred lines between themselves and other sectors are typical of cross-sector industries. That is equally true of environmental technology and resource efficiency, which overlaps with many key sectors, such as mechanical, electrical and automotive engineering as well as the chemical industry. Both in Germany and on the international market, many companies started out in one of these traditional key industries before adding green products, processes and services to their portfolio and diversifying into the green tech industry. While remaining firmly anchored in their original lines of business, these companies now also sell products and services that belong to the environmental technology and resource efficiency sector.
Figure 44 reveals the extent to which companies that originated in other industries beyond the remit of environmental technology and resource efficiency now also operate on the global green tech market. From the whole broad spectrum of key industries, electrical, mechanical and automotive engineering were analyzed together with the chemical industry for this purpose. The main reason for choosing these specific industries is their tremendous importance to the German economy in general and to manufacturing in particular.51 In 2020, automotive, mechanical and electrical engineering and the chemical industry together accounted for 42 percent of the world market for environmental technology and resource efficiency. Mechanical engineering had the largest share (14 percent), followed by electrical engineering (13 percent), the chemical industry (10 percent) and automotive engineering (4 percent). The point here is to illustrate the extent to which the green transformation has already made in
roads into traditional key industries. As we can clearly see, environmental technology and resource efficiency products, processes and services are today of great importance to the portfolios of companies whose roots lie outside the green tech industry.
Having looked in Figure 44 at the share of the global green tech market volume generated by firms from electrical, mechanical and automotive engineering and the chemical industry, Figure 45 shifts the focus to analyzing the market volumes of these four key industries. The bar chart shows what percentage of the overall market volume in these four industries is attributable to technology lines in environmental technology and resource efficiency. By highlighting the share of revenue earned with green products, processes and services, the chart demonstrates the importance of green tech to other branches of industry52.
-
-
-
-
-
Green technology plays an especially prominent role in mechanical engineering, where it accounts for 21 percent of this cross-sector industry’s global market volume. In electrical engineering, environmental technology and resource efficiency has an 11 percent share of the global market volume. Such figures confirm the considerable importance attached to green technology in the portfolios of companies rooted in these key industries. In other words, environmental technology and resource efficiency is firmly anchored in these traditional sectors.
When examining the links between the cross-sector green tech industry and other branches of industry, a glance at Germany’s construction sector is similarly enlightening. Several green tech market segments – such as energy-efficient buildings – overlap with this sector.
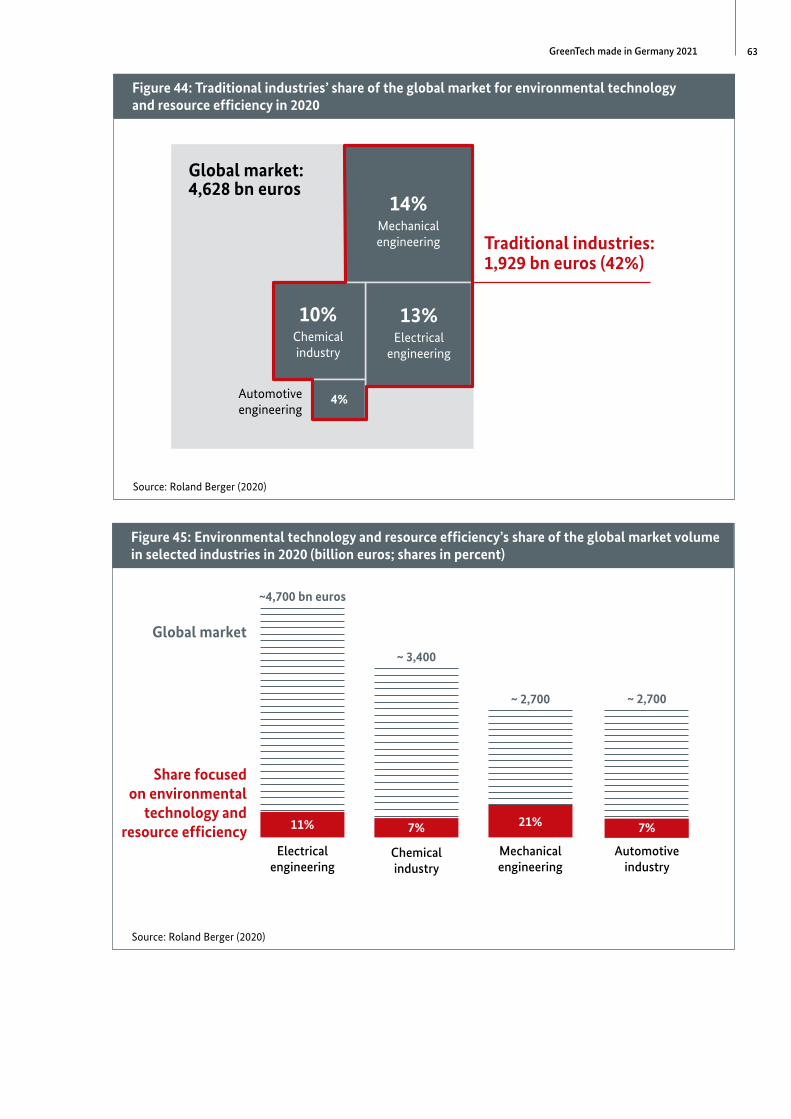
63GreenTech made in Germany 2021
Figure 44: Traditional industries’ share of the global market for environmental technology and resource efficiency in 2020
Global market: 4,628 bn euros
Traditional industries: 1,929 bn euros (42%)
14% Mechanical engineering
10% Chemical
industry
13% Electrical
engineering
4% Automotive engineering
Source: Roland Berger (2020)
Figure 45: Environmental technology and resource efficiency’s share of the global market volume in selected industries in 2020 (billion euros; shares in percent)
Electrical engineering
Chemical industry
Mechanical engineering
Automotive industry
Global market
~4,700 bn euros
~ 3,400
~ 2,700 ~ 2,700
Share focused on environmental
technology and resource efficiency 11% 7% 21% 7%
Source: Roland Berger (2020)
Figure 44: Traditional industries’ share of the global market for environmental technology and resource efficiency in 2020
14% Mechanical engineering
10% Chemical
industry
13% Electrical
engineering
4%
Figure 45: Environmental technology and resource efficiency’s share of the global market volume in selected industries in 2020 (billion euros; shares in percent)
11% 7% 21% 7%

-
-
5
Survey of green tech providers: Inside view of a fast-growing industry
What kind of companies form the green tech industry with their technologies, processes, products and services? What structural parameters identify them? How do they see their own future unfolding? And how are they positioned in the international competitive arena? This chapter takes a closer look at the supply side of the environmental technology and resource efficiency industry. The resultant portrait is based essentially on a spring 2020 analysis of a green tech database containing 2,700 corporate profiles.
65GreenTech made in Germany 2021
5.1
-
-
-
-
-
-
-
Environmental technology and resource efficiency players at a glance
Medium-sized companies play a powerful, formative role in Germany’s environmental technology and resource efficiency sector. 91 percent of the country’s green tech players are small and medium-sized enterprises (SMEs). Bonn-based SME research organization Institut für Mittelstandsforschung (IfM) defines small and medium-sized enterprises as companies with annual revenue of up to 50 million euros and no more than 500 employees.53 54 Measured in terms of revenue, SMEs make up by far the largest proportion of German players in environmental technology and resource efficiency. This breakdown in the green tech industry differs only marginally from the structure of the German economy as a whole: Companies that post annual revenues of up to 50 million euros account for 99 percent of all enterprises in Germany.55
5.1.1 Sales revenue and employees: Growth in the green tech industry
The sales revenue generated by the companies in Germany’s environmental technology and resource efficiency market is a key indicator in our analysis of this industry. Roughly every fourth green tech company in this country reports annual sales revenue of between one million euros and five million euros. Companies that post sales of between one million euros and 50 million euros make up 47 percent of the entire sector. 44 percent of green tech players turn over less than a million euros a year and are classed as small firms. The average green tech company in this country generates annual revenue of 23 million euros.
Companies citing sustainable mobility as their primary lead market generate the highest average annual revenue, at 45 million euros. This figure is significantly higher than the numbers for energy efficiency (13 million euros) and sustainable agriculture and forestry (12 million euros), for example. To paint as authentic a picture as possible of the environmental technology and resource efficiency space, we asked players in this industry to estimate their revenue development in the years ahead. The result? Between now and 2025, green tech companies in Germany anticipate average annual sales growth of 9.9 percent (see Figure 46). It seems that the Covid-19 pandemic, which has so adversely affected many other industries, has had less of an impact on the market for environmental technology and resource efficiency.
The strongest growth is expected by companies that focus on the lead markets for sustainable mobility and energy efficiency, both of which anticipate average annual sales growth of 12.9 percent through 2025. Among companies with a focus on the lead market for waste management and recycling, expectations are much more cautious. Providers in this market look forward to projected annual sales growth of only 7 percent – a clear acknowledgment of the fact that waste management and recycling is already a very mature market in Germany.
The different outlooks of companies focused on sustainable mobility on the one hand and those that concentrate on waste management and recycling on the other largely match the mood reflected in both lead

66 GreenTech made in Germany 2021
markets’ revenue expectations. They also mirror the widely differing points of departure in these two markets. In the lead market for sustainable mobility, providers are expecting a surge of growth largely driven by increasing demand for alternative drive technologies. New players marketing innovative mobility solutions to compete with automotive incumbents are adding even greater dynamism: Examples include Google in autonomous driving and Tesla in battery production. This type of new offering fuels expansion and drives additional innovation in sustainable mobility. In sharp contrast, waste management and recycling is a very mature lead market in which virtually no new international players are involved, all of which naturally dampens growth and innovation.
-
Figure 46: Average projected annual revenue growth per company by lead market focus, 2020 to 2025
Sustainable mobility 12.9%
Energy efficiency 12.9%
Environmentally friendly power generation, storage and distribution 11.4%
Market for environmental technology and resource efficiency 9.9%
Material efficiency 9.6%
Sustainable agriculture and forestry 8.6%
Sustainable water management 8.4%
Waste management and recycling 7.0%
Source: GreenTech database, Roland Berger (2020)
Besides assessing sales growth, headcount trends are another useful indicator of the industry’s mood. Current workforce forecasts were therefore also queried in the survey. Between now and 2025,
companies in the environmental technology and resource efficiency industry expect to see their headcount increase by an average of 6.8 percent per year (see Figure 47).56 Companies dedicated to the lead market for energy efficiency are setting the most ambitious goals, assuming that employee figures will increase by an annual average of 8.7 percent. Conversely, expectations are lowest among firms focused on waste management and recycling. Respondents in this lead market anticipate average annual workforce growth of 4.5 percent through 2025.
Low numbers of employees are a general structural attribute of firms in the green tech industry. 44 percent of the companies in this sector employ ten people at most. Providers of engineering and consulting services in particular usually have only a handful of employees. Only just over a quarter of companies employ more than 50 people, and only 6 percent have more than 500 employees on their payroll.
Figure 46: Average projected annual revenue growth per company by lead market focus, 2020 to 2025
Market for environmental technology and resource efficiency 9.9%
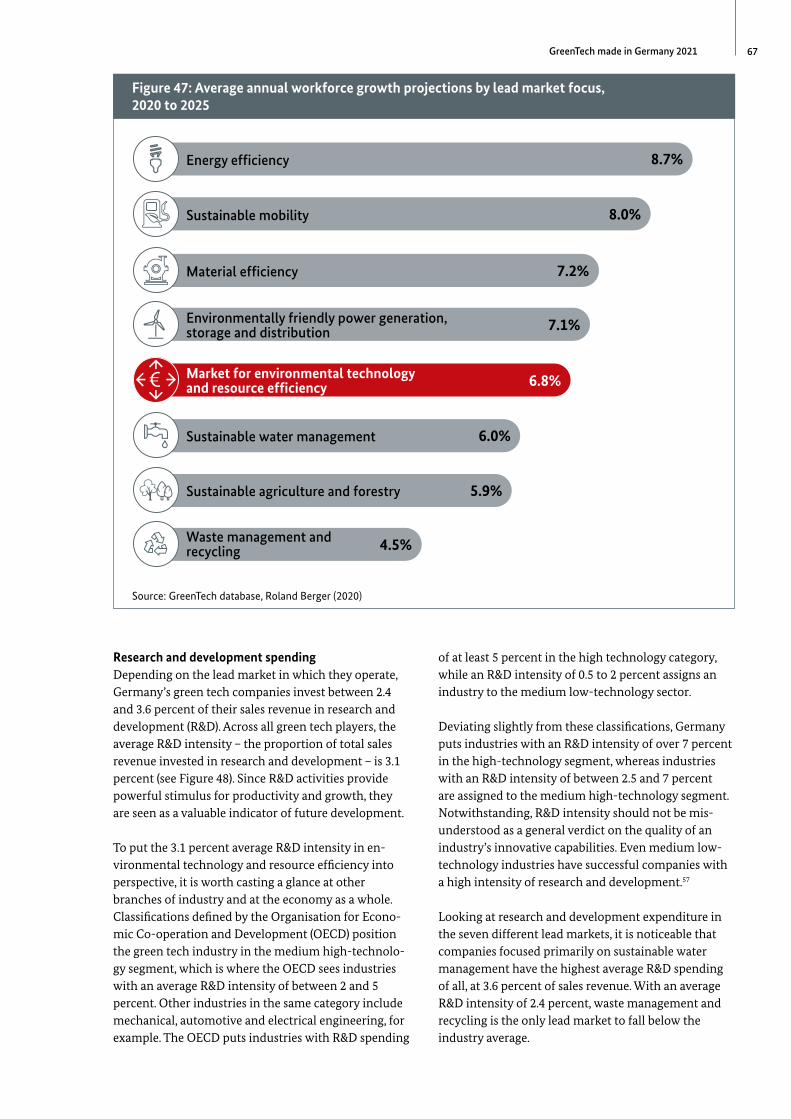
67GreenTech made in Germany 2021
Figure 47: Average annual workforce growth projections by lead market focus, 2020 to 2025
Energy efficiency 8.7%
Sustainable mobility 8.0%
Material efficiency 7.2%
Environmentally friendly power generation, storage and distribution 7.1%
Market for environmental technology and resource efficiency 6.8%
Sustainable water management 6.0%
Sustainable agriculture and forestry 5.9%
Waste management and recycling 4.5%
Source: GreenTech database, Roland Berger (2020)
Research and development spendingDepending on the lead market in which they operate, Germany’s green tech companies invest between 2.4 and 3.6 percent of their sales revenue in research and development (R&D). Across all green tech players, the average R&D intensity – the proportion of total sales revenue invested in research and development – is 3.1 percent (see Figure 48). Since R&D activities provide powerful stimulus for productivity and growth, they are seen as a valuable indicator of future development.
To put the 3.1 percent average R&D intensity in environmental technology and resource efficiency into perspective, it is worth casting a glance at other branches of industry and at the economy as a whole. Classifications defined by the Organisation for Economic Co-operation and Development (OECD) position the green tech industry in the medium high-technology segment, which is where the OECD sees industries with an average R&D intensity of between 2 and 5 percent. Other industries in the same category include mechanical, automotive and electrical engineering, for example. The OECD puts industries with R&D spending
-
-
-
of at least 5 percent in the high technology category, while an R&D intensity of 0.5 to 2 percent assigns an industry to the medium low-technology sector.
Deviating slightly from these classifications, Germany puts industries with an R&D intensity of over 7 percent in the high-technology segment, whereas industries with an R&D intensity of between 2.5 and 7 percent are assigned to the medium high-technology segment. Notwithstanding, R&D intensity should not be misunderstood as a general verdict on the quality of an industry’s innovative capabilities. Even medium low-technology industries have successful companies with a high intensity of research and development.57
-
Looking at research and development expenditure in the seven different lead markets, it is noticeable that companies focused primarily on sustainable water management have the highest average R&D spending of all, at 3.6 percent of sales revenue. With an average R&D intensity of 2.4 percent, waste management and recycling is the only lead market to fall below the industry average.
Figure 47: Average annual workforce growth projections by lead market focus, 2020 to 2025
Market for environmental technology and resource efficiency 6.8%
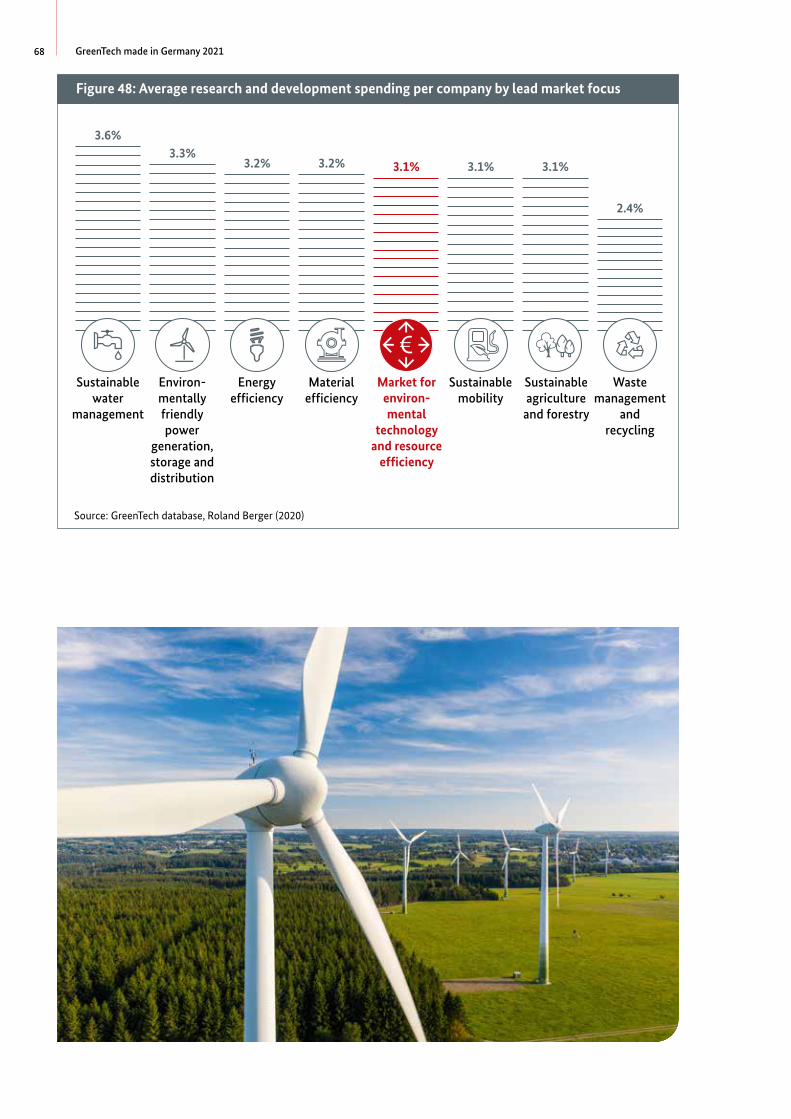
68 GreenTech made in Germany 2021
Figure 48: Average research and development spending per company by lead market focus
Sustainable water
management
3.6%
Environmentally friendly power
generation, storage and distribution
3.3%
- Energy efficiency
3.2%
Material efficiency
3.2%
Market for environmental
technology and resource
efficiency
3.1%
-Sustainable
mobility
3.1%
Sustainable agriculture
and forestry
3.1%
Waste management
and recycling
2.4%
Source: GreenTech database, Roland Berger (2020)
Figure 48: Average research and development spending per company by lead market focus
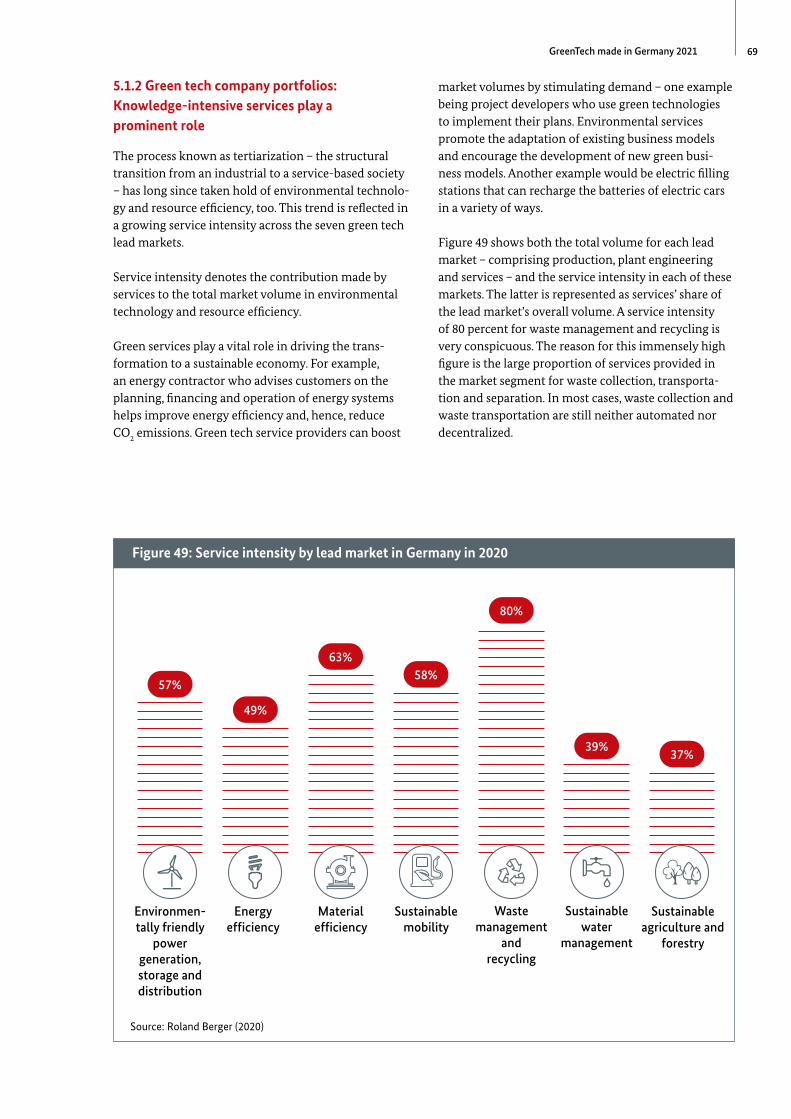
69GreenTech made in Germany 2021
5.1.2 Green tech company portfolios: Knowledge-intensive services play a prominent role
-
The process known as tertiarization – the structural transition from an industrial to a service-based society – has long since taken hold of environmental technology and resource efficiency, too. This trend is reflected in a growing service intensity across the seven green tech lead markets.
Service intensity denotes the contribution made by services to the total market volume in environmental technology and resource efficiency.
Green services play a vital role in driving the transformation to a sustainable economy. For example, an energy contractor who advises customers on the planning, financing and operation of energy systems helps improve energy efficiency and, hence, reduce CO2 emissions. Green tech service providers can boost
market volumes by stimulating demand – one example being project developers who use green technologies to implement their plans. Environmental services promote the adaptation of existing business models and encourage the development of new green business models. Another example would be electric filling stations that can recharge the batteries of electric cars in a variety of ways.
Figure 49 shows both the total volume for each lead market – comprising production, plant engineering and services – and the service intensity in each of these markets. The latter is represented as services’ share of the lead market’s overall volume. A service intensity of 80 percent for waste management and recycling is very conspicuous. The reason for this immensely high figure is the large proportion of services provided in the market segment for waste collection, transportation and separation. In most cases, waste collection and waste transportation are still neither automated nor decentralized.
-
-
-
Figure 49: Service intensity by lead market in Germany in 2020
Environmentally friendly
power generation, storage and distribution
57%
Energy efficiency
49%
Material efficiency
63%
Sustainable mobility
58%
Waste management
and recycling
80%
Sustainable water
management
39%
Sustainable agriculture and
forestry
37%
-
Source: Roland Berger (2020)
Figure 49: Service intensity by lead market in Germany in 2020
57%
49%
63%58%
80%
39%37%

70 GreenTech made in Germany 2021
One very interesting factor when analyzing the structure of supply in the environmental technology and resource efficiency industry is how German green tech providers’ total sales revenues break down across the individual lead markets. The reality is that 43 percent of the total sales volume for all survey respondents is generated in the lead market for environmentally friendly power generation, storage and distribution and the lead market for waste management and recycling (see Figure 50). The lowest contributions to total revenue volume are made by the lead markets for material
-
-
-
-
efficiency (9 percent) and sustainable water management (12 percent).
Figure 50: Breakdown of companies’ total revenue volume across the lead markets in Germany in 2020
23% Environmentally friendly power generation, storage
and distribution
20% Waste management
and recycling
20% Other
company activities
13% Energy
efficiency
12% Sustainable
water management
9% Material efficiency
3% Sustainable mobility
1% Sustainable agriculture and forestry
Source: GreenTech database, Roland Berger (2020)
The survey’s findings with regard to companies’ positioning along the value chain highlight the innovative strength of the environmental technology and resource efficiency sector. More than a third of the respondent companies provide planning and development services, for example – a figure that underscores the strongly knowledge-intensive and technology-oriented nature of this industry.
The green tech players analyzed in the survey are spread across the entire value chain (see Figure 51). While the vast majority of respondent companies say they provide services, considerably fewer mentions are given to production and plant engineering. Planning
and development activities are very heavily represented in the portfolio, in the categories technical planning and consulting, project development, and research and development. This finding explains the large number of engineering and consulting offices in the industry.
Figure 50: Breakdown of companies’ total revenue volume across the lead markets in Germany in 2020
20% Other
company activities
23% Environmentally friendly power generation, storage
and distribution
20% Waste management
and recycling

71GreenTech made in Germany 2021
Figure 51: Portfolio of companies’ services along the value chain in 2020
Production and plant engineering Services
Planning and development
Technical planning and consulting 58%
Project development 49%
Research and development 37%
Other services 36%
Plant engineering and systems integration 24%
Manufacture of end products 22%
Technical inspection and appraisal 22%
Design, installation 20%
Recycling and waste disposal 18%
Production of components and subsystems 15%
Retail 15%
Logistics 9%
Operation of technical plant as a primary process 8%
Provisioning of raw materials and supplies 7%
Operation of technical plant as a secondary process 6%
Financing 4%
Source: GreenTech database, Roland Berger (2020)
Figure 51: Portfolio of companies’ services along the value chain in 2020
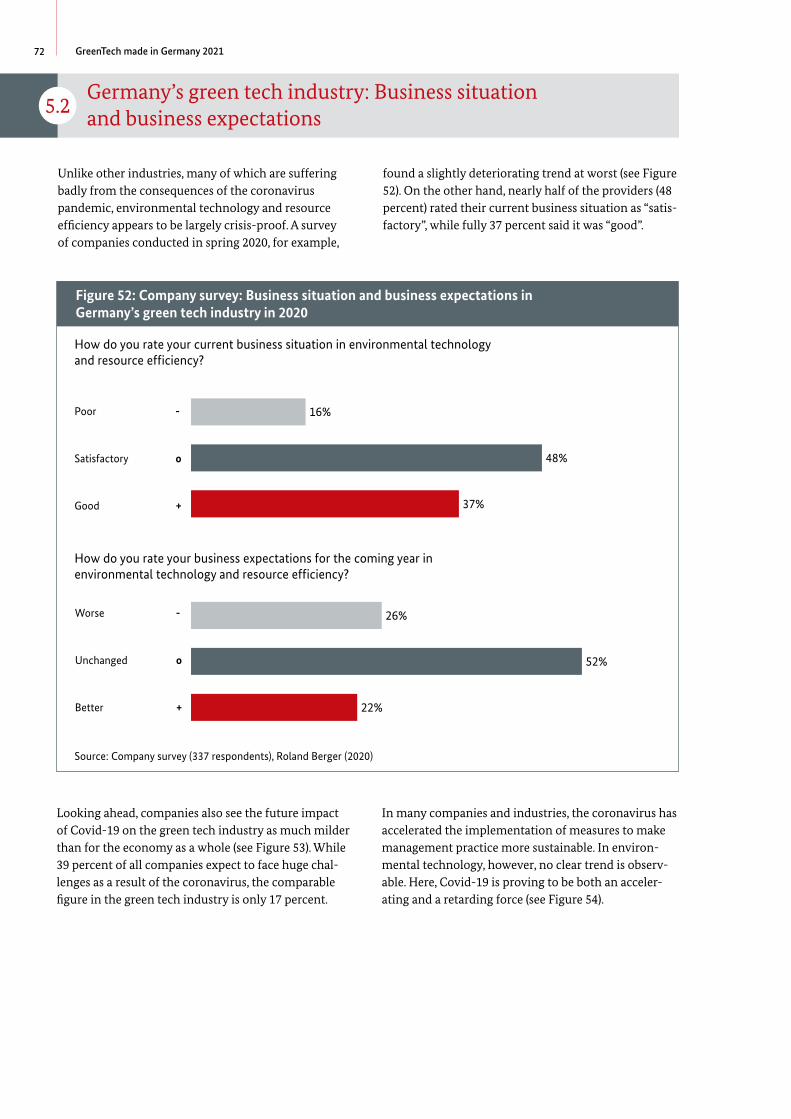
72 GreenTech made in Germany 2021
-
o
+
-
o
+
-
--
--
5.2 Germany’s green tech industry: Business situation and business expectations
Unlike other industries, many of which are suffering badly from the consequences of the coronavirus pandemic, environmental technology and resource efficiency appears to be largely crisis-proof. A survey of companies conducted in spring 2020, for example,
found a slightly deteriorating trend at worst (see Figure 52). On the other hand, nearly half of the providers (48 percent) rated their current business situation as “satisfactory”, while fully 37 percent said it was “good”.
Figure 52: Company survey: Business situation and business expectations in Germany’s green tech industry in 2020
How do you rate your current business situation in environmental technology and resource efficiency?
Poor 16%
Satisfactory 48%
Good 37%
How do you rate your business expectations for the coming year in environmental technology and resource efficiency?
Worse 26%
Unchanged 52%
Better 22%
Source: Company survey (337 respondents), Roland Berger (2020)
Looking ahead, companies also see the future impact of Covid-19 on the green tech industry as much milder than for the economy as a whole (see Figure 53). While 39 percent of all companies expect to face huge challenges as a result of the coronavirus, the comparable figure in the green tech industry is only 17 percent.
In many companies and industries, the coronavirus has accelerated the implementation of measures to make management practice more sustainable. In environmental technology, however, no clear trend is observable. Here, Covid-19 is proving to be both an accelerating and a retarding force (see Figure 54).
Figure 52: Company survey: Business situation and business expectations in Germany’s green tech industry in 2020
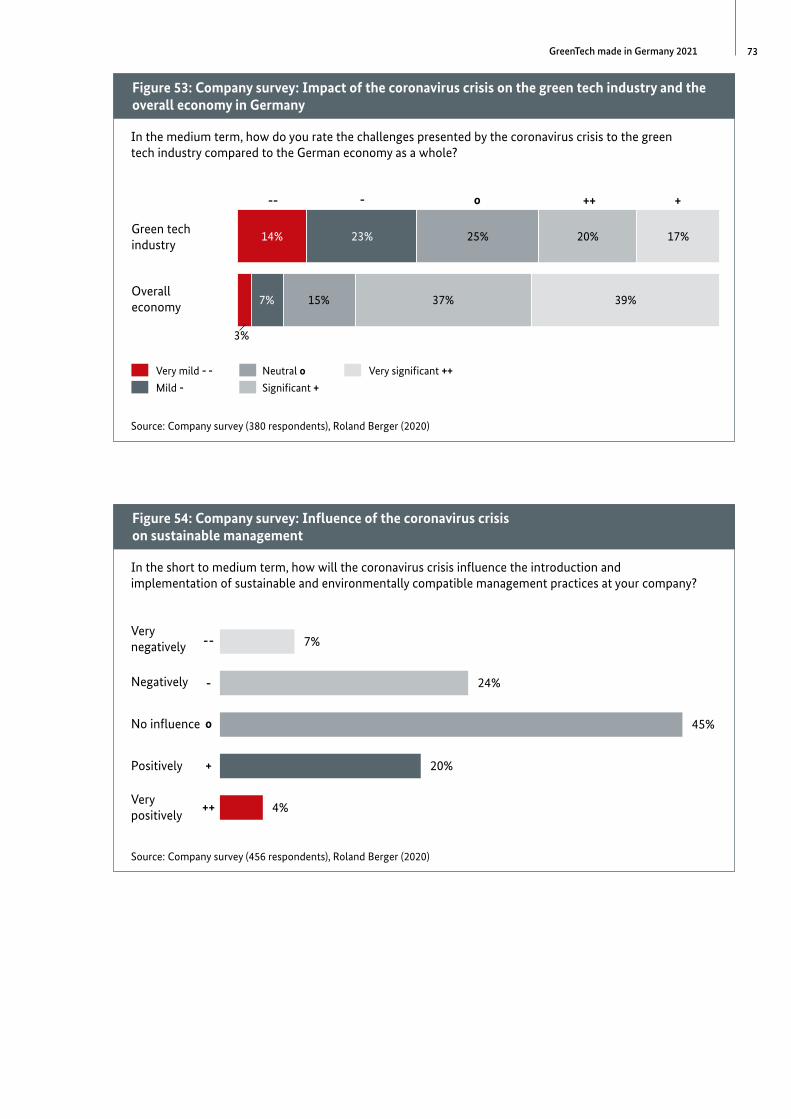
73GreenTech made in Germany 2021
Figure 53: Company survey: Impact of the coronavirus crisis on the green tech industry and the overall economy in Germany
In the medium term, how do you rate the challenges presented by the coronavirus crisis to the green tech industry compared to the German economy as a whole?
-- ++ +
Green tech industry
14% 23% 25% 20% 17%
Overall economy
3%
7% 15% 37% 39%
Very mild - -
Mild -
Neutral o
Significant +
Very significant ++
Source: Company survey (380 respondents), Roland Berger (2020)
Figure 54: Company survey: Influence of the coronavirus crisis on sustainable management
In the short to medium term, how will the coronavirus crisis influence the introduction and implementation of sustainable and environmentally compatible management practices at your company?
Very negatively 7%
Negatively 24%
No influence 45%
Positively 20%
Very positively
4%
Source: Company survey (456 respondents), Roland Berger (2020)
Figure 53: Company survey: Impact of the coronavirus crisis on the green tech industry and the overall economy in Germany
Figure 54: Company survey: Influence of the coronavirus crisis on sustainable management
23%
7%
14%
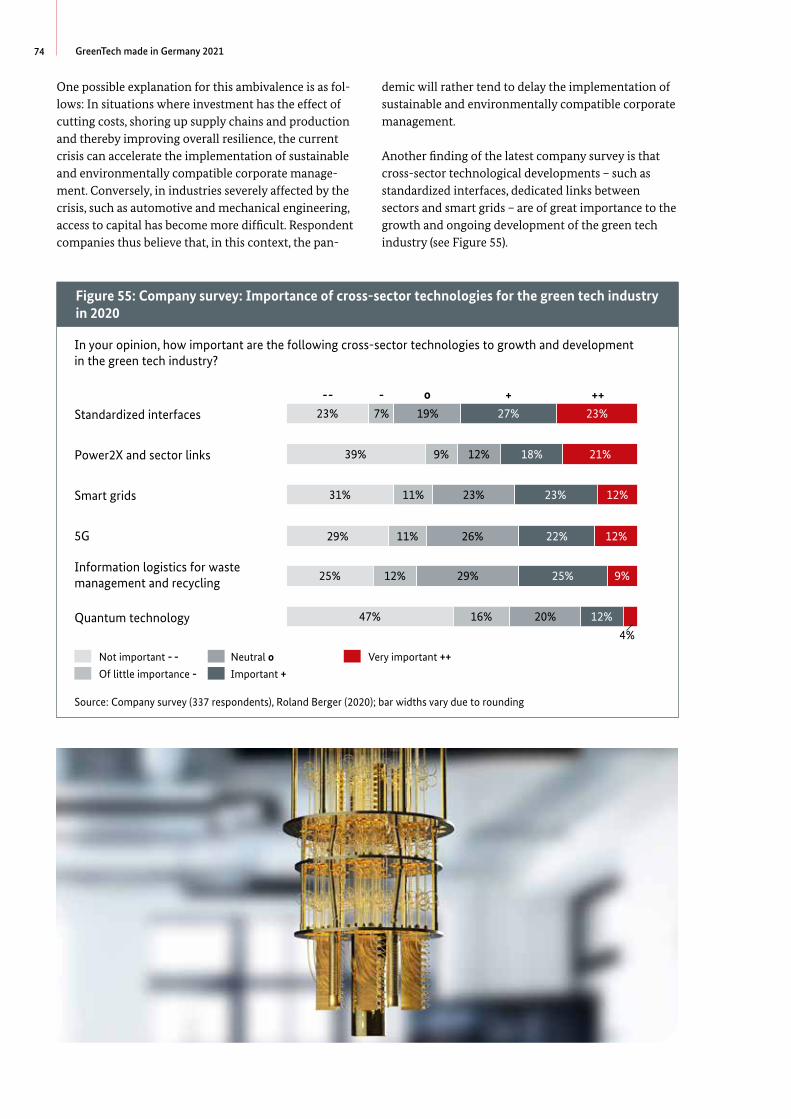
74 GreenTech made in Germany 2021
One possible explanation for this ambivalence is as follows: In situations where investment has the effect of cutting costs, shoring up supply chains and production and thereby improving overall resilience, the current crisis can accelerate the implementation of sustainable and environmentally compatible corporate management. Conversely, in industries severely affected by the crisis, such as automotive and mechanical engineering, access to capital has become more difficult. Respondent companies thus believe that, in this context, the pan
-
-
-
demic will rather tend to delay the implementation of sustainable and environmentally compatible corporate management.
Another finding of the latest company survey is that cross-sector technological developments – such as standardized interfaces, dedicated links between sectors and smart grids – are of great importance to the growth and ongoing development of the green tech industry (see Figure 55).
Figure 55: Company survey: Importance of cross-sector technologies for the green tech industry in 2020
In your opinion, how important are the following cross-sector technologies to growth and development in the green tech industry?
Standardized interfaces 23% 7% 19% 27% 23%
Power2X and sector links 39% 9% 12% 18% 21%
Smart grids 31% 11% 23% 23% 12%
5G 29% 11% 26% 22% 12%
Information logistics for waste management and recycling 25% 12% 29% 25% 9%
Quantum technology 47% 16% 20% 12%
4%
Not important - -
Of little importance -
Neutral o
Important +
Very important ++
Source: Company survey (337 respondents), Roland Berger (2020); bar widths vary due to rounding
Figure 55: Company survey: Importance of cross-sector technologies for the green tech industry in 2020
27%
18%
23%
22%
25%
12%
23%
21%
12%
12%
9%
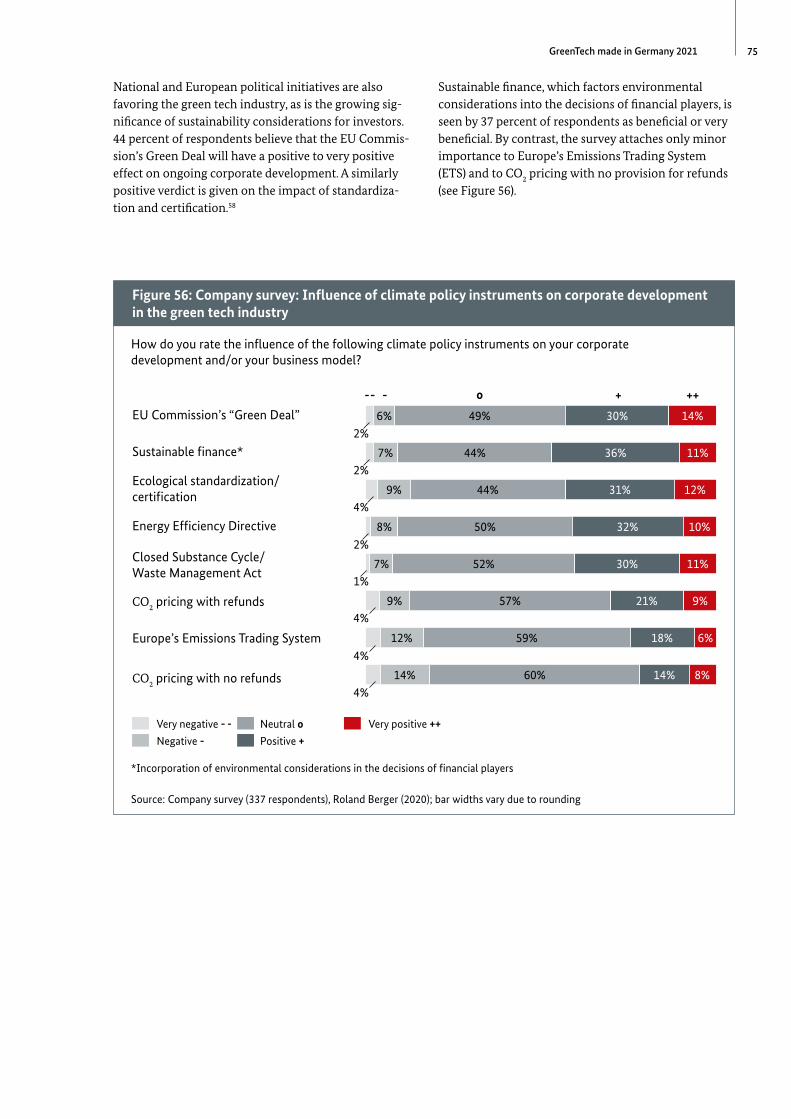
75GreenTech made in Germany 2021
National and European political initiatives are also favoring the green tech industry, as is the growing significance of sustainability considerations for investors. 44 percent of respondents believe that the EU Commission’s Green Deal will have a positive to very positive effect on ongoing corporate development. A similarly positive verdict is given on the impact of standardization and certification.58
-
-
-
Sustainable finance, which factors environmental considerations into the decisions of financial players, is seen by 37 percent of respondents as beneficial or very beneficial. By contrast, the survey attaches only minor importance to Europe’s Emissions Trading System (ETS) and to CO2 pricing with no provision for refunds (see Figure 56).
Figure 56: Company survey: Influence of climate policy instruments on corporate development in the green tech industry
How do you rate the influence of the following climate policy instruments on your corporate development and/or your business model?
EU Commission’s “Green Deal”2%
6% 49% 30% 14%
Sustainable finance*2%
7% 44% 36% 11%
Ecological standardization/certification
4%9% 44% 31% 12%
Energy Efficiency Directive2%
8% 50% 32% 10%
Closed Substance Cycle/Waste Management Act
1%7% 52% 30% 11%
CO2 pricing with refunds4%
9% 57% 21% 9%
Europe’s Emissions Trading System4%
12% 59% 18% 6%
CO2 pricing with no refunds4%
14% 60% 14% 8%
Very negative - -
Negative -
Neutral o
Positive +
Very positive ++
*Incorporation of environmental considerations in the decisions of financial players
Source: Company survey (337 respondents), Roland Berger (2020); bar widths vary due to rounding
Figure 56: Company survey: Influence of climate policy instruments on corporate development in the green tech industry
30%
36%
31%
32%
30%
21%
18%
14%
14%
11%
12%
10%
11%
9%
6%
8%
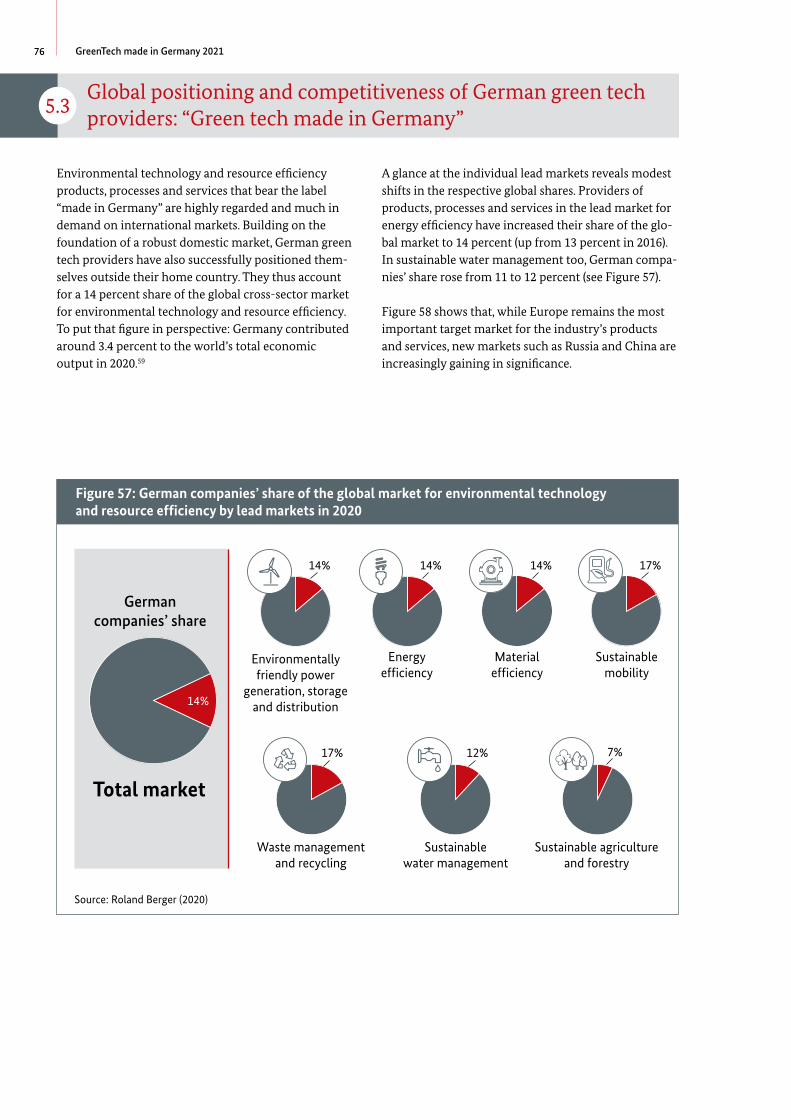
76 GreenTech made in Germany 2021
5.3
-
-
-
Global positioning and competitiveness of German green tech providers: “Green tech made in Germany”
Environmental technology and resource efficiency products, processes and services that bear the label “made in Germany” are highly regarded and much in demand on international markets. Building on the foundation of a robust domestic market, German green tech providers have also successfully positioned themselves outside their home country. They thus account for a 14 percent share of the global cross-sector market for environmental technology and resource efficiency. To put that figure in perspective: Germany contributed around 3.4 percent to the world’s total economic output in 2020.59
A glance at the individual lead markets reveals modest shifts in the respective global shares. Providers of products, processes and services in the lead market for energy efficiency have increased their share of the global market to 14 percent (up from 13 percent in 2016). In sustainable water management too, German companies’ share rose from 11 to 12 percent (see Figure 57).
Figure 57: German companies’ share of the global market for environmental technology and resource efficiency by lead markets in 2020
German companies’ share
Total market
14%
Environmentally friendly power
generation, storage and distribution
14%
Energy efficiency
14%
Material efficiency
14%
Sustainable mobility
17%
Waste management and recycling
17%
Sustainable water management
12%
Sustainable agriculture and forestry
7%
Source: Roland Berger (2020)
Figure 57: German companies’ share of the global market for environmental technology and resource efficiency by lead markets in 2020
14%
Figure 58 shows that, while Europe remains the most important target market for the industry’s products and services, new markets such as Russia and China are increasingly gaining in significance.
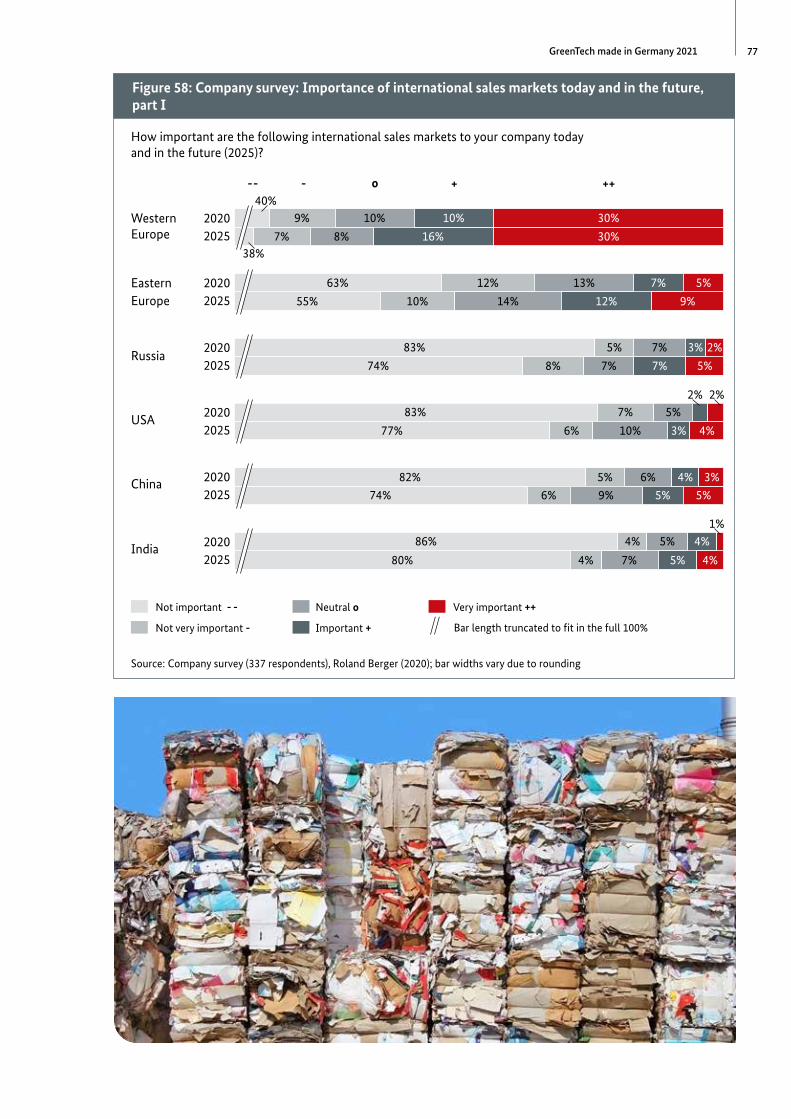
77GreenTech made in Germany 2021
Figure 58: Company survey: Importance of international sales markets today and in the future, part I
How important are the following international sales markets to your company today and in the future (2025)?
Western Europe
202040%
9% 10% 10% 30%
202538%
7% 8% 16% 30%
Eastern Europe
2020 63% 12% 13% 7% 5%
2025 55% 10% 14% 12% 9%
Russia2020 83% 5% 7% 3% 2%
2025 74% 8% 7% 7% 5%
USA2020 83% 7% 5%
2% 2%
2025 77% 6% 10% 3% 4%
China 2020 82% 5% 6% 4% 3%
2025 74% 6% 9% 5% 5%
India 2020 86% 4% 5% 4%1%
2025 80% 4% 7% 5% 4%
Bar length truncated to fit in the full 100%
Not important - -
Not very important -
Neutral o
Important +
Very important ++
Source: Company survey (337 respondents), Roland Berger (2020); bar widths vary due to rounding
Figure 58: Company survey: Importance of international sales markets today and in the future, part I
10%
16%
7%
12%
3%
7%
3%
4%
5%
4%
5%
30%
30%
5%
9%
2%
5%
4%
3%
5%
4%
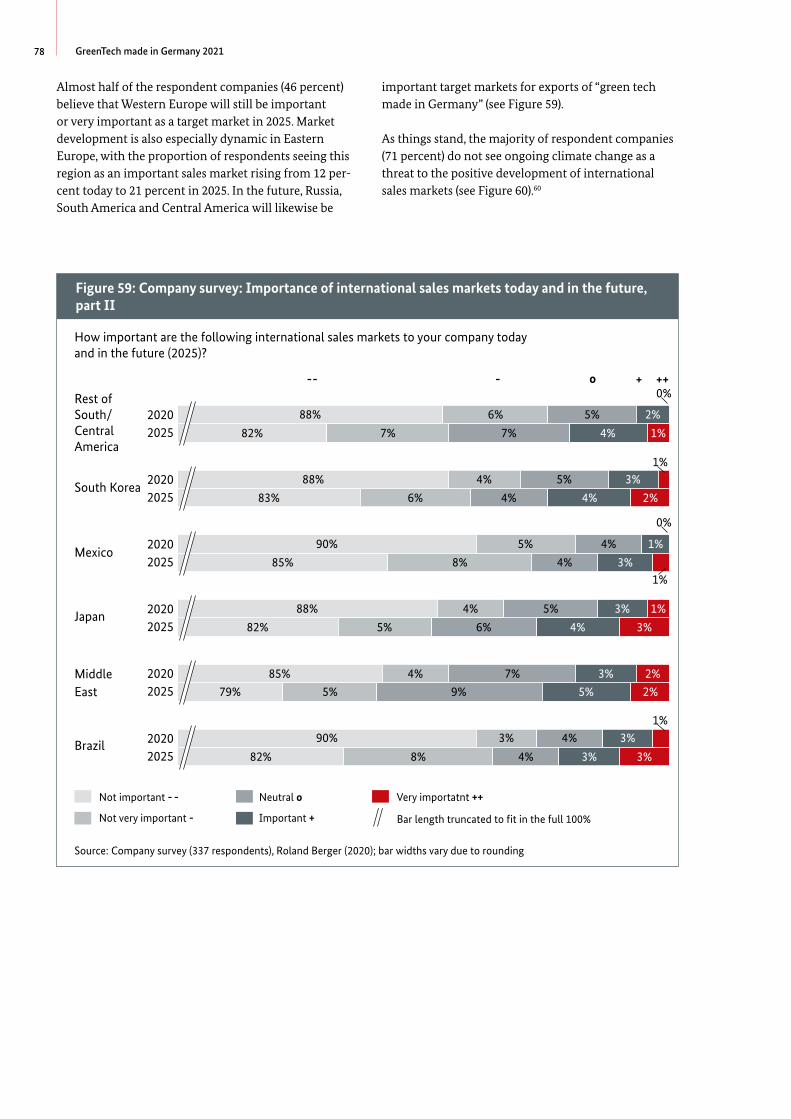
78 GreenTech made in Germany 2021
-
Almost half of the respondent companies (46 percent) believe that Western Europe will still be important or very important as a target market in 2025. Market development is also especially dynamic in Eastern Europe, with the proportion of respondents seeing this region as an important sales market rising from 12 percent today to 21 percent in 2025. In the future, Russia, South America and Central America will likewise be
important target markets for exports of “green tech made in Germany” (see Figure 59).
Figure 59: Company survey: Importance of international sales markets today and in the future, part II
How important are the following international sales markets to your company today and in the future (2025)?
Rest of South/Central America
2020 88% 6% 5% 2%
0%
2025 82% 7% 7% 4% 1%
South Korea2020 88% 4% 5% 3%
1%
2025 83% 6% 4% 4% 2%
Mexico2020 90% 5% 4% 1%
0%
2025 85% 8% 4% 3%1%
Japan2020 88% 4% 5% 3% 1%
2025 82% 5% 6% 4% 3%
Middle East
2020 85% 4% 7% 3% 2%
2025 79% 5% 9% 5% 2%
Brazil 2020 90% 3% 4% 3%1%
2025 82% 8% 4% 3% 3%
Bar length truncated to fit in the full 100%
Not important - -
Not very important -
Neutral o
Important +
Very importatnt ++
Source: Company survey (337 respondents), Roland Berger (2020); bar widths vary due to rounding
As things stand, the majority of respondent companies (71 percent) do not see ongoing climate change as a threat to the positive development of international sales markets (see Figure 60).60
Figure 59: Company survey: Importance of international sales markets today and in the future, part II
2%
4%
3%
4%
1%
3%
3%
4%
3%
5%
3%
3%
1%
2%
1%
3%
2%
2%
3%

79GreenTech made in Germany 2021
Figure 60: Company survey: Impact of climate change on international sales markets
Do you believe that the development of your company’s international sales markets is threatened by ongoing global climate change?
No threat 47%
Little threat 24%
Neutral 8%
Threat 7%
Serious threat 3%
Source: Company survey (337 respondents), Roland Berger (2020)
Figure 61 illustrates that, although about a quarter of all respondents currently operate their own companies
on the ground in foreign markets, traditional exports still remain the leading transfer channel.
Figure 61: Company survey: Use of transfer channels for exports
To what extent does your company currently use the following transfer channels to export products and services?
Exports 57% 11% 12% 10% 10%
Own country organizations
76% 4% 9% 4% 7%
Direct investment 77% 8% 9% 5%
2%
Joint ventures 78% 8% 8% 3% 3%
Licensing agreements 80% 7% 7% 3%
2%
Bar length truncated to fit in the full 100%
No use - -
Little use -
Neutral o
Some use +
Substantial use ++
Source: Company survey (330 respondents), Roland Berger (2020); bar widths vary due to rounding
Figure 60: Company survey: Impact of climate change on international sales markets
Figure 61: Company survey: Use of transfer channels for exports
10%
4%
5%
3%
3%
10%
7%
3%
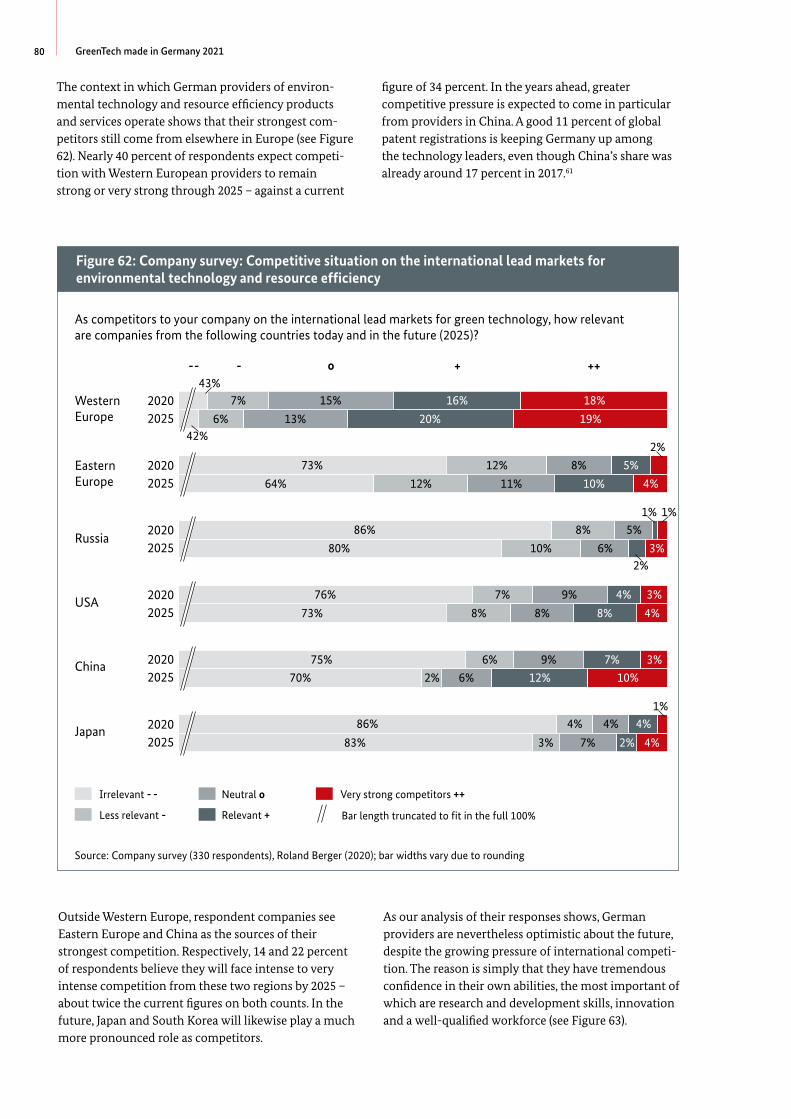
80 GreenTech made in Germany 2021
The context in which German providers of environmental technology and resource efficiency products and services operate shows that their strongest competitors still come from elsewhere in Europe (see Figure 62). Nearly 40 percent of respondents expect competition with Western European providers to remain strong or very strong through 2025 – against a current
figure of 34 percent. In the years ahead, greater competitive pressure is expected to come in particular from providers in China. A good 11 percent of global patent registrations is keeping Germany up among the technology leaders, even though China’s share was already around 17 percent in 2017.61
-
-
-
Figure 62: Company survey: Competitive situation on the international lead markets for environmental technology and resource efficiency
As competitors to your company on the international lead markets for green technology, how relevant are companies from the following countries today and in the future (2025)?
Western Europe
202043%
7% 15% 16% 18%
202542%
6% 13% 20% 19%
Eastern Europe
2020 73% 12% 8% 5%
2%
2025 64% 12% 11% 10% 4%
Russia2020 86% 8% 5%
1% 1%
2025 80% 10% 6%2%
3%
USA2020 76% 7% 9% 4% 3%
2025 73% 8% 8% 8% 4%
China 2020 75% 6% 9% 7% 3%
2025 70% 2% 6% 12% 10%
Japan 2020 86% 4% 4% 4%1%
2025 83% 3% 7% 2% 4%
Bar length truncated to fit in the full 100%
Irrelevant - -
Less relevant -
Neutral o
Relevant +
Very strong competitors ++
Source: Company survey (330 respondents), Roland Berger (2020); bar widths vary due to rounding
Outside Western Europe, respondent companies see Eastern Europe and China as the sources of their strongest competition. Respectively, 14 and 22 percent of respondents believe they will face intense to very intense competition from these two regions by 2025 – about twice the current figures on both counts. In the future, Japan and South Korea will likewise play a much more pronounced role as competitors.
As our analysis of their responses shows, German providers are nevertheless optimistic about the future, despite the growing pressure of international competition. The reason is simply that they have tremendous confidence in their own abilities, the most important of which are research and development skills, innovation and a well-qualified workforce (see Figure 63).
-
Figure 62: Company survey: Competitive situation on the international lead markets for environmental technology and resource efficiency
16%
20%
5%
10%
4%
8%
7%
12%
4%
2%
18%
19%
4%
3%
3%
4%
3%
10%
4%
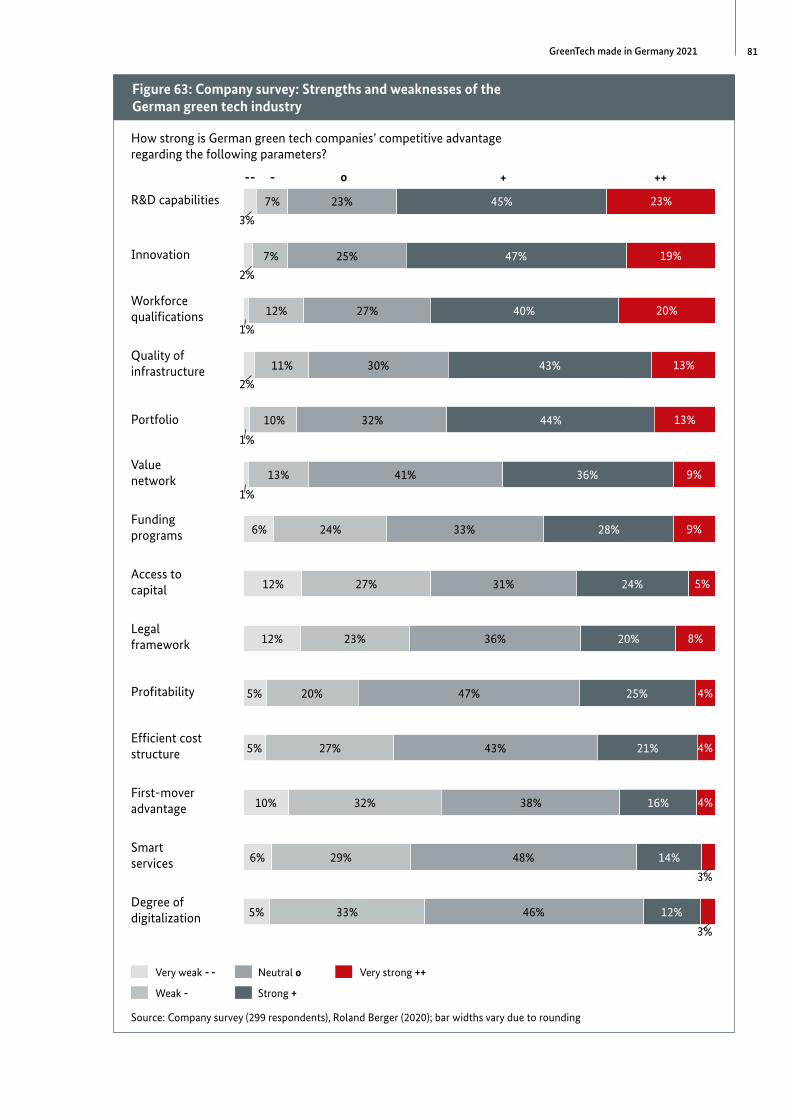
81GreenTech made in Germany 2021
Figure 63: Company survey: Strengths and weaknesses of the German green tech industry
How strong is German green tech companies’ competitive advantage regarding the following parameters?
R&D capabilities
3%
7% 23% 45% 23%
Innovation
2%
7% 25% 47% 19%
Workforce qualifications
1%
12% 27% 40% 20%
Quality of infrastructure
2%
11% 30% 43% 13%
Portfolio
1%
10% 32% 44% 13%
Value network
1%
13% 41% 36% 9%
Funding programs 6% 24% 33% 28% 9%
Access to capital 12% 27% 31% 24% 5%
Legal framework 12% 23% 36% 20% 8%
Profitability 5% 20% 47% 25% 4%
Efficient cost structure 5% 27% 43% 21% 4%
First-mover advantage 10% 32% 38% 16% 4%
Smart services 6% 29% 48% 14%
3%
Degree of digitalization 5% 33% 46% 12%
3%
Very weak - -
Weak -
Neutral o
Strong +
Very strong ++
Source: Company survey (299 respondents), Roland Berger (2020); bar widths vary due to rounding
Figure 63: Company survey: Strengths and weaknesses of the German green tech industry
45%
47%
40%
43%
44%
36%
28%
24%
20%
25%
21%
16%
14%
12%
23%
19%
20%
13%
13%
9%
9%
5%
8%
4%
4%
4%
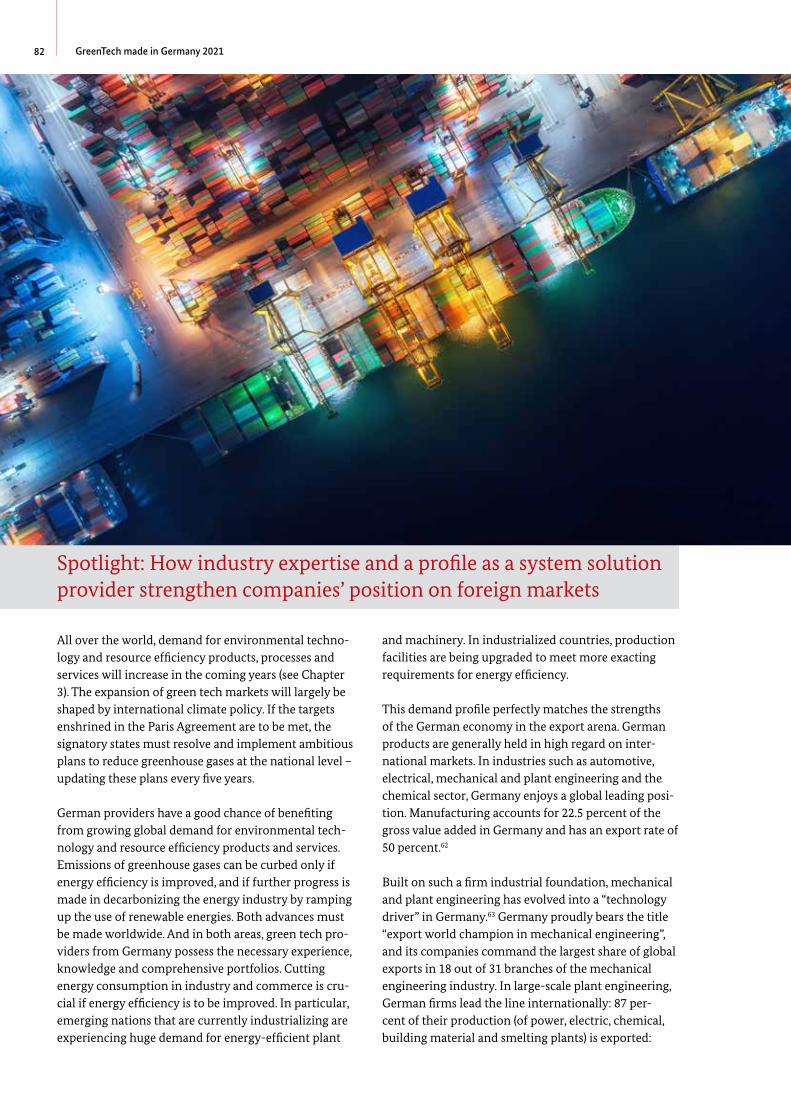
82 GreenTech made in Germany 2021
-
-
-
-
-
-
-
Spotlight: How industry expertise and a profile as a system solution provider strengthen companies’ position on foreign markets
All over the world, demand for environmental technology and resource efficiency products, processes and services will increase in the coming years (see Chapter 3). The expansion of green tech markets will largely be shaped by international climate policy. If the targets enshrined in the Paris Agreement are to be met, the signatory states must resolve and implement ambitious plans to reduce greenhouse gases at the national level – updating these plans every five years.
German providers have a good chance of benefiting from growing global demand for environmental technology and resource efficiency products and services. Emissions of greenhouse gases can be curbed only if energy efficiency is improved, and if further progress is made in decarbonizing the energy industry by ramping up the use of renewable energies. Both advances must be made worldwide. And in both areas, green tech providers from Germany possess the necessary experience, knowledge and comprehensive portfolios. Cutting energy consumption in industry and commerce is crucial if energy efficiency is to be improved. In particular, emerging nations that are currently industrializing are experiencing huge demand for energy-efficient plant
and machinery. In industrialized countries, production facilities are being upgraded to meet more exacting requirements for energy efficiency.
This demand profile perfectly matches the strengths of the German economy in the export arena. German products are generally held in high regard on international markets. In industries such as automotive, electrical, mechanical and plant engineering and the chemical sector, Germany enjoys a global leading position. Manufacturing accounts for 22.5 percent of the gross value added in Germany and has an export rate of 50 percent.62
Built on such a firm industrial foundation, mechanical and plant engineering has evolved into a “technology driver” in Germany.63 Germany proudly bears the title “export world champion in mechanical engineering”, and its companies command the largest share of global exports in 18 out of 31 branches of the mechanical engineering industry. In large-scale plant engineering, German firms lead the line internationally: 87 percent of their production (of power, electric, chemical, building material and smelting plants) is exported:
83GreenTech made in Germany 2021
“German plant engineers are the first port of call even when whole countries target (re)industrialization. Quality, reliability, service, efficiency and environmentally friendly solutions are key assets possessed by the Germans.”64
-
-
---
-
-
-
-
-
-
Given this enviable position, German providers are ideally placed to supply international markets with the technologies they need to master the major challenges that confront manufacturing industries: energy efficiency, environmental protection and digitalization. Process automation has a large part to play, and this is another field of technology in which German companies occupy a very strong position: “Germany predominates in automation technology, is revolutionizing robotics and is out in front in digital production. It is also leading the way in the future market for virtual systems and rolling out a constant stream of new solutions for production systems that are both highly complex and efficient. Furthermore, Germany also supplies the software for high-precision production control.”65
Many countries face the challenge of designing low-carbon power supply systems. The experience Germany is gathering from its own energy transition could thus prove invaluable: “If the project is a success, it could become a blueprint or template for other countries.”66 Technological advances in generating power from renewable sources, the ability to feed these volatile renewable energy sources into the grid and the dovetailing of power, heat and mobility solutions are giving German providers an advantage in terms of knowledge and experience on the international markets.
Emerging nations in particular have sound prospects for the products, processes and services that German providers sell in the lead markets for environmentally friendly power generation, storage and distribution and for energy efficiency. This is because, in these markets, emerging countries have an opportunity to “leapfrog” certain steps in the development process. In the context of power supply, for example, that can involve a country building distributed (sub)systems from the outset, without first establishing a conventional, centralized power grid. In the context of industrialization, leapfrogging can mean planning greenfield plant with a view to energy-efficient and material-efficient process automation right from the word go.
German companies are widely attested to be extremely competent in system solutions.67 On international green tech markets, too, this strength will prove to be a major success factor, as innovations in environmental technology and resource efficiency are increasingly being driven by systemic developments and less by isolated advances. As a rule, system solutions are better
suited to mastering the complex challenges of mitigating climate change and protecting the environment. Individual components are linked together to form systems and create end-to-end solutions. Physical and technical losses impose limits on the efficiency of individual solar cells, for example. Stand-alone photovoltaic installations experience a time lag between the generation of power and the occurrence of demand for that power. Low output likewise causes difficulty regarding integration in the power grid. Each of these components thus has shortcomings that can be minimized only at the cost of substantial research and investment outlays. On the other hand, by focusing on the entire system of power generation, storage and use, far greater potential for improvement arises than if each component is regarded in isolation.
Since digitalization is an enabler of systemic solutions, it is reasonable to assume that “going digital” will unleash tremendous momentum to drive forward the formation of systems in environmental technology and resource efficiency.
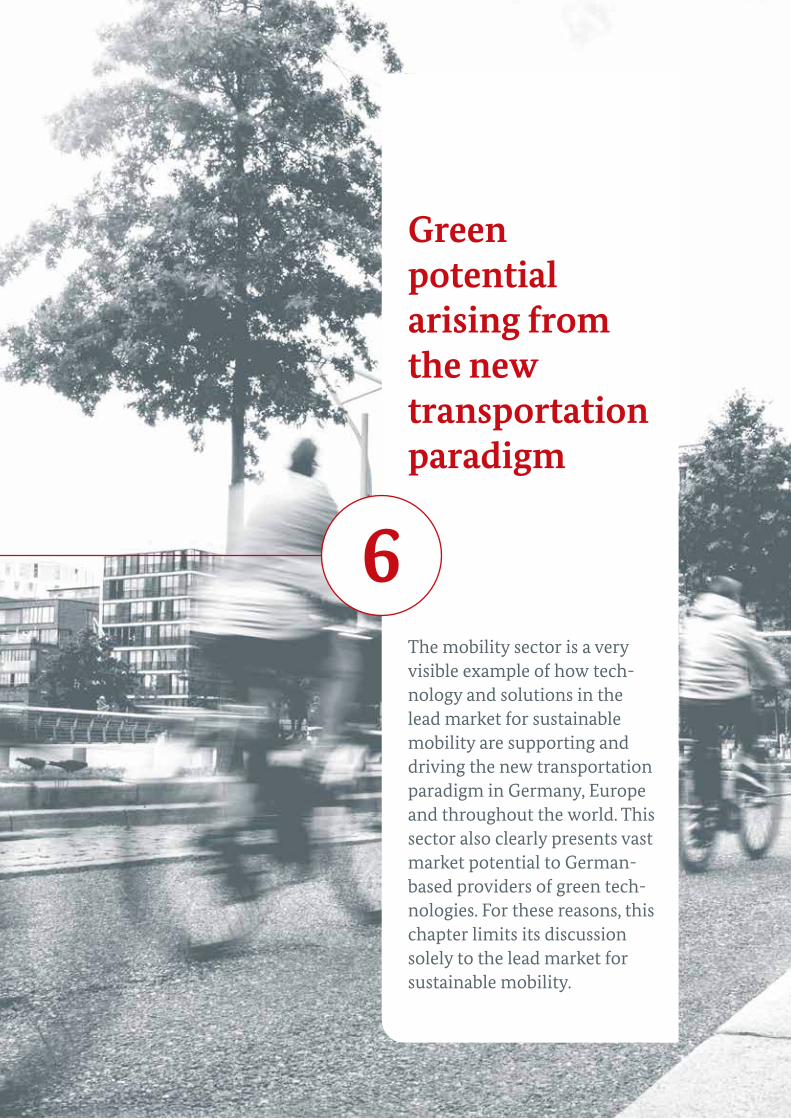
6-
-
Green potential arising from the new transportation paradigm
The mobility sector is a very visible example of how technology and solutions in the lead market for sustainable mobility are supporting and driving the new transportation paradigm in Germany, Europe and throughout the world. This sector also clearly presents vast market potential to German-based providers of green technologies. For these reasons, this chapter limits its discussion solely to the lead market for sustainable mobility.
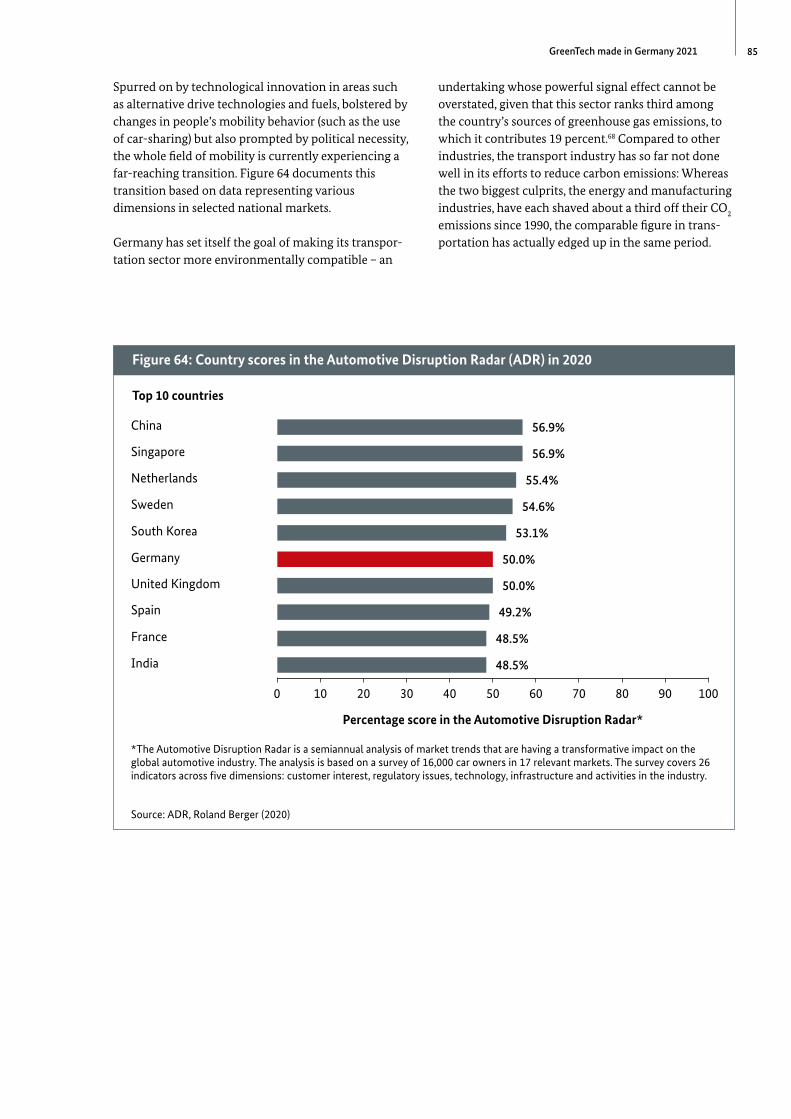
85GreenTech made in Germany 2021
Spurred on by technological innovation in areas such as alternative drive technologies and fuels, bolstered by changes in people’s mobility behavior (such as the use of car-sharing) but also prompted by political necessity, the whole field of mobility is currently experiencing a far-reaching transition. Figure 64 documents this transition based on data representing various dimensions in selected national markets.
--
Figure 64: Country scores in the Automotive Disruption Radar (ADR) in 2020
Top 10 countries
Percentage score in the Automotive Disruption Radar*
China 56.9%
0 10 20 30 40 50 60 70 80 90 100
Singapore 56.9%
Netherlands 55.4%
Sweden 54.6%
South Korea 53.1%
Germany 50.0%
United Kingdom 50.0%
Spain 49.2%
France 48.5%
India 48.5%
*The Automotive Disruption Radar is a semiannual analysis of market trends that are having a transformative impact on the global automotive industry. The analysis is based on a survey of 16,000 car owners in 17 relevant markets. The survey covers 26 indicators across five dimensions: customer interest, regulatory issues, technology, infrastructure and activities in the industry.
Source: ADR, Roland Berger (2020)
Germany has set itself the goal of making its transportation sector more environmentally compatible – an
undertaking whose powerful signal effect cannot be overstated, given that this sector ranks third among the country’s sources of greenhouse gas emissions, to which it contributes 19 percent.68 Compared to other industries, the transport industry has so far not done well in its efforts to reduce carbon emissions: Whereas the two biggest culprits, the energy and manufacturing industries, have each shaved about a third off their CO2 emissions since 1990, the comparable figure in transportation has actually edged up in the same period.
Figure 64: Country scores in the Automotive Disruption Radar (ADR) in 2020
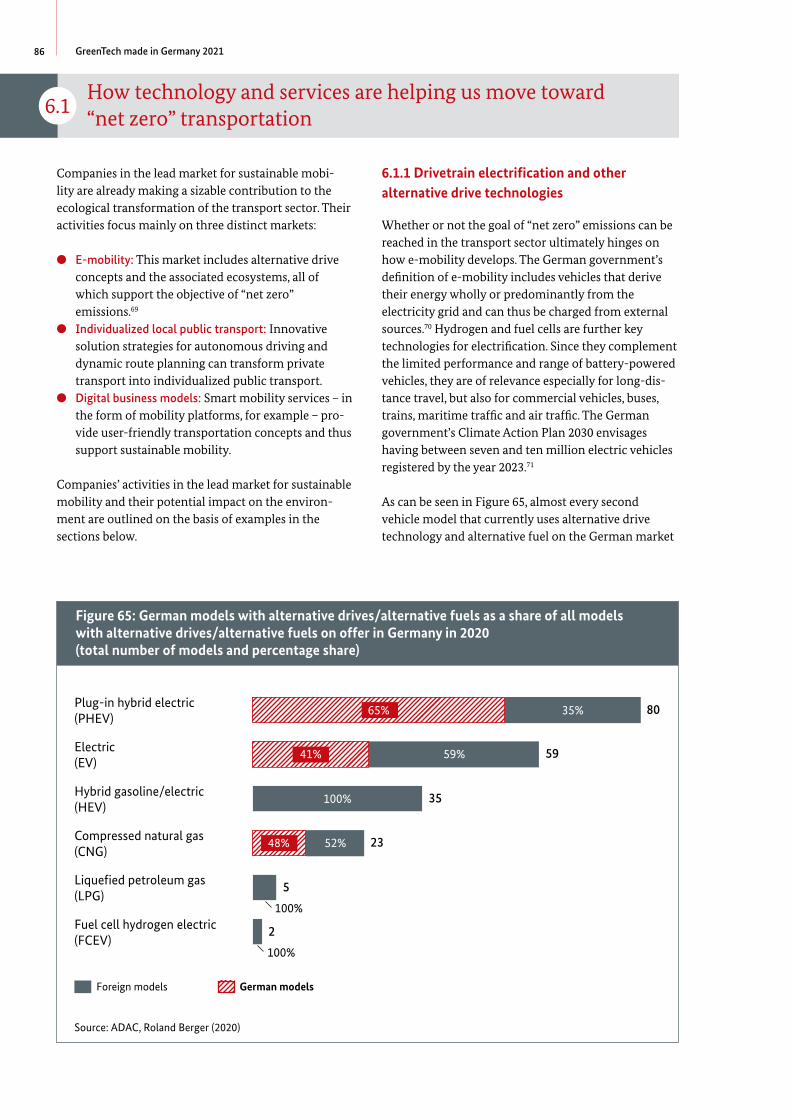
86 GreenTech made in Germany 2021
6.1
-
How technology and services are helping us move toward “net zero” transportation
Companies in the lead market for sustainable mobility are already making a sizable contribution to the ecological transformation of the transport sector. Their activities focus mainly on three distinct markets:
l E-mobility: This market includes alternative drive concepts and the associated ecosystems, all of which support the objective of “net zero” emissions.69
l Individualized local public transport: Innovative solution strategies for autonomous driving and dynamic route planning can transform private transport into individualized public transport.
l Digital business models: Smart mobility services – in the form of mobility platforms, for example – provide user-friendly transportation concepts and thus support sustainable mobility.
-
-
-
Companies’ activities in the lead market for sustainable mobility and their potential impact on the environment are outlined on the basis of examples in the sections below.
6.1.1 Drivetrain electrification and other alternative drive technologies
Whether or not the goal of “net zero” emissions can be reached in the transport sector ultimately hinges on how e-mobility develops. The German government’s definition of e-mobility includes vehicles that derive their energy wholly or predominantly from the electricity grid and can thus be charged from external sources.70 Hydrogen and fuel cells are further key technologies for electrification. Since they complement the limited performance and range of battery-powered vehicles, they are of relevance especially for long-distance travel, but also for commercial vehicles, buses, trains, maritime traffic and air traffic. The German government’s Climate Action Plan 2030 envisages having between seven and ten million electric vehicles registered by the year 2023.71
As can be seen in Figure 65, almost every second vehicle model that currently uses alternative drive technology and alternative fuel on the German market
Figure 65: German models with alternative drives/alternative fuels as a share of all models with alternative drives/alternative fuels on offer in Germany in 2020 (total number of models and percentage share)
German modelsForeign models
Plug-in hybrid electric (PHEV)
65% 35% 80
Electric (EV)
41% 59% 59
Hybrid gasoline/electric (HEV)
100% 35
Compressed natural gas (CNG)
48% 52% 23
Liquefied petroleum gas (LPG)
100%
5
Fuel cell hydrogen electric (FCEV)
100%
2
Source: ADAC, Roland Berger (2020)
Figure 65: German models with alternative drives/alternative fuels as a share of all models with alternative drives/alternative fuels on offer in Germany in 2020 (total number of models and percentage share)
35%
59%
100%
52%
65%
41%
48%
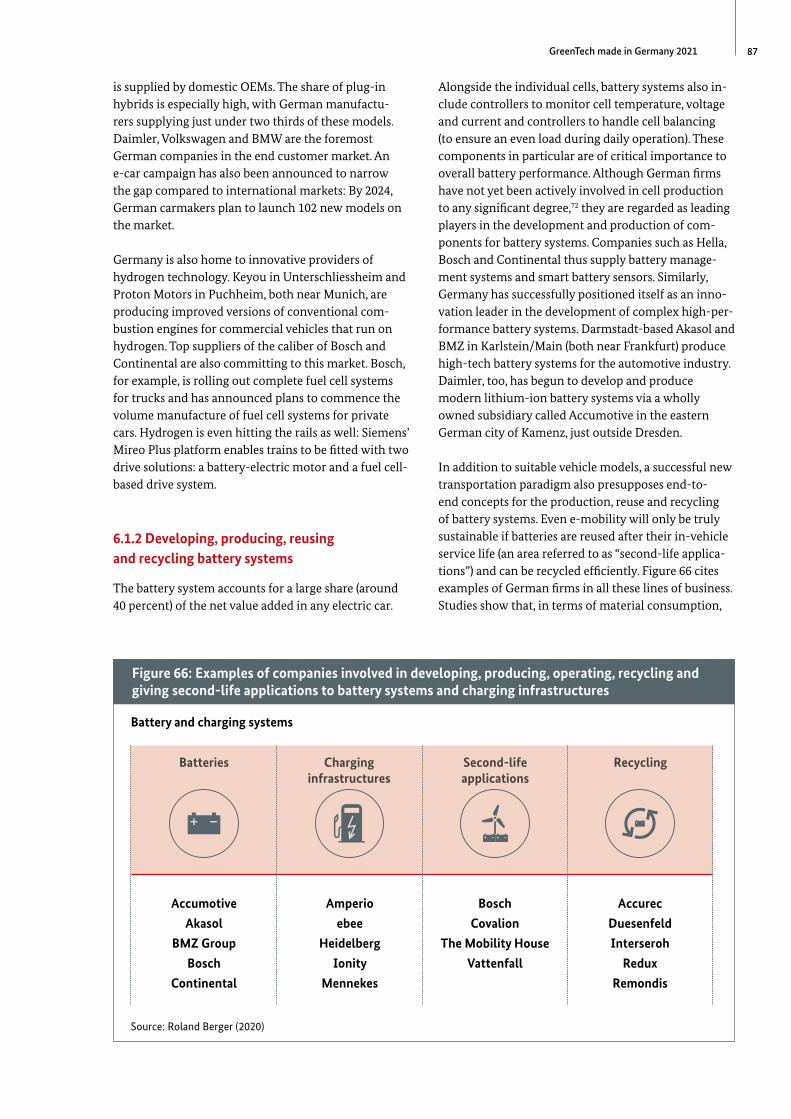
87GreenTech made in Germany 2021
is supplied by domestic OEMs. The share of plug-in hybrids is especially high, with German manufacturers supplying just under two thirds of these models. Daimler, Volkswagen and BMW are the foremost German companies in the end customer market. An e-car campaign has also been announced to narrow the gap compared to international markets: By 2024, German carmakers plan to launch 102 new models on the market.
-
-
Germany is also home to innovative providers of hydrogen technology. Keyou in Unterschliessheim and Proton Motors in Puchheim, both near Munich, are producing improved versions of conventional combustion engines for commercial vehicles that run on hydrogen. Top suppliers of the caliber of Bosch and Continental are also committing to this market. Bosch, for example, is rolling out complete fuel cell systems for trucks and has announced plans to commence the volume manufacture of fuel cell systems for private cars. Hydrogen is even hitting the rails as well: Siemens’ Mireo Plus platform enables trains to be fitted with two drive solutions: a battery-electric motor and a fuel cell-based drive system.
6.1.2 Developing, producing, reusing and recycling battery systems
The battery system accounts for a large share (around 40 percent) of the net value added in any electric car.
Alongside the individual cells, battery systems also include controllers to monitor cell temperature, voltage and current and controllers to handle cell balancing (to ensure an even load during daily operation). These components in particular are of critical importance to overall battery performance. Although German firms have not yet been actively involved in cell production to any significant degree,72 they are regarded as leading players in the development and production of components for battery systems. Companies such as Hella, Bosch and Continental thus supply battery management systems and smart battery sensors. Similarly, Germany has successfully positioned itself as an innovation leader in the development of complex high-performance battery systems. Darmstadt-based Akasol and BMZ in Karlstein/Main (both near Frankfurt) produce high-tech battery systems for the automotive industry. Daimler, too, has begun to develop and produce modern lithium-ion battery systems via a wholly owned subsidiary called Accumotive in the eastern German city of Kamenz, just outside Dresden.
-
-
-
--
-
In addition to suitable vehicle models, a successful new transportation paradigm also presupposes end-to-end concepts for the production, reuse and recycling of battery systems. Even e-mobility will only be truly sustainable if batteries are reused after their in-vehicle service life (an area referred to as “second-life applications”) and can be recycled efficiently. Figure 66 cites examples of German firms in all these lines of business. Studies show that, in terms of material consumption,
Figure 66: Examples of companies involved in developing, producing, operating, recycling and giving second-life applications to battery systems and charging infrastructures
Battery and charging systems
Batteries
Accumotive
Akasol
BMZ Group
Bosch
Continental
Charging infrastructures
Amperio
ebee
Heidelberg
Ionity
Mennekes
Second-life applications
Bosch
Covalion
The Mobility House
Vattenfall
Recycling
Accurec
Duesenfeld
Interseroh
Redux
Remondis
Source: Roland Berger (2020)
Figure 66: Examples of companies involved in developing, producing, operating, recycling and giving second-life applications to battery systems and charging infrastructures

88 GreenTech made in Germany 2021
batteries’ carbon and environmental footprint can be tangibly improved by a second life for stationary applications. Munich-based company The Mobility House and Magdeburg-based GETEC Energie, for example, offer to install and market stationary battery stores. Batteries are prepared for this second life by firms such as Accumotive. Bosch, too, is working on solution concepts for the second-life use of batteries that can no longer be deployed in electric vehicles – for example in photovoltaic systems that incorporate battery storage for residential buildings.
-
One project indicative of current developments in this field is the installation of the world’s biggest stationary battery store, made from former vehicle batteries, on the premises of Remondis in Lünen, western Germany. The Mobility House, Daimler and GETEC Energie are collaborating on this project. The Mobility House is installing the system and will market it together with GETEC Energie. Daimler is contributing over 1,000 battery systems from second-generation “smart fortwo electric drive” vehicles to the project, with subsidiary Accumotive preparing the batteries for their second life.
Duesenfeld, Accurec and Interseroh rank among the leading providers of battery recycling services. Duesenfeld, a chemical company from Wendeburg, near Hanover, has developed a low-pressure nitrogen atmosphere-based shredding process that breaks highly
flammable lithium-ion batteries down into shredded material and electrolyte. (The low-pressure nitrogen atmosphere makes the batteries less easily flammable.) Graphite, manganese, nickel, cobalt and lithium can then be recovered from the shredded “black mass” and used in the production of new batteries. 96 percent of all battery components can thus be fed back into a new production cycle. The process also shrinks new battery production’s CO2 footprint by 40 percent compared to conventional methods.
-
--
6.1.3 Charging infrastructure and services
One of the main success factors in the widespread breakthrough of e-mobility is the build-up of a charging infrastructure. In line with the current Climate Action Plan, a million charging points should be in place in Germany by 2030. About 20,000 have been installed so far. Federal government is subsidizing the roll-out of public charging stations between now and 2025 and has unveiled a master plan to this effect.
Alongside the “hardware” in the form of charging stations and wall boxes, installation and maintenance services must also be available. Consulting and planning services are likewise needed to ensure that capacity and locations are aligned with demand, and to organize concepts for handling and managing the charging
89GreenTech made in Germany 2021
process – from identification to billing. In this context, other relevant products and services include corporate fleet management, site analysis, load and energy management and the monitoring of charging points.
-
Examples of providers of charging infrastructure are Mennekes (from Kirchhundem, western Germany), Ebee (from Berlin) and Heidelberger Druckmaschinen AG (from Heidelberg, southwest Germany), all of which produce charging leads and other systems for private and commercial charging infrastructures, in addition to charging stations and wall boxes (wall-mounted charging stations for home use).
Berlin-based H2 Mobility delivers the hardware needed to develop the hydrogen infrastructure. A broad spectrum of complementary installation and maintenance services is also available. BayWA Mobility Services provides services such as feasibility studies for installation and professional site analysis.
-
-
-
What are known as charging providers interface with end customers to handle the charging process itself. Automotive OEMs such as BMW and VW obviously have their own charging networks, while public power utilities such as EnBW and NATURSTROM likewise play an active role on this market. Additionally, nationwide providers facilitate a kind of roaming facility across different charging networks: Examples include Deutsche Telekom, which operates a dedicated app for this purpose, and automobile club ADAC, which circulates the ADAC eCharge Card. Other companies – among them Ionity in Munich – sell the related billing software as a white label solution that companies can operate under their own name as part of their own portfolio.
6.1.4 Integration in the energy sector
If Germany is to shift up a gear with the new transportation paradigm and further reduce its greenhouse gas emissions, a far larger share of the energy used must in future derive from renewable sources. In the transport sector, however, this share has stalled at just under 6 percent for the past ten years or so. This percentage can be raised only if intelligent links are forged between the energy and transportation sectors – links that benefit both sides. Transportation could thus diminish its dependency on fossil fuels in favor of renewables, while the energy sector would reap the rewards of better load management, a more stable grid and additional storage capacity.
-
One example of this kind of link between the sectors is the “eFarm” project masterminded by GP JOULE
GmbH in Flensburg, north Germany. This is the largest green hydrogen mobility project in the country. In the Nordfriesland region, just south of the Danish border, a green hydrogen infrastructure open to modular expansion is being set up and operated to cover everything from production to processing to fleet deployment. Green hydrogen is generated from regional wind power. The PEM electrolyzers73 and stacks74 needed to produce the hydrogen are supplied by H-TEC SYSTEMS in Augsburg, south Germany.
-
-
-
All in all, the process of ramping up e-mobility confronts the energy industry with huge challenges: The more charging stations are set up, the more urgent it will be to develop and expand distribution networks and local grid transformers. The simultaneous charging of large numbers of e-cars at certain times of day will necessarily lead to peak loads, forcing grid operators to invest more in stabilizing the grid.
It is therefore all the more important for intelligent load management and variable pricing models to optimize charging times and charging currents. At the same time, a growing fleet of e-vehicles will open up new markets for the energy sector – for the development of virtual storage, for example – alongside innovative solutions for volatile renewables. These openings are, however, contingent on the existence of bidirectional charging capabilities: It must be possible to siphon power from the grid and feed it back in again at the same time. The Sion model from Sono Motors, a Munich-based start-up, is an example of an electric car that features bidirectional charging. It was developed in collaboration with Elringklinger, Continenal and Nevs.

90 GreenTech made in Germany 2021
6.2
-
The road from private motorized traffic to individualized public transport
-
In recent years, progress in digitalizing the transportation sector and in autonomous driving has increasingly blurred the line between private and public transport. Two strategies are currently regarded as especially promising: individualized routing in local public
transport and autonomous shuttles along (not yet) prescribed local public transport routes. Figure 67 cites a selection of the players who are working on this kind of solution concept.
Figure 67: Examples of players in the autonomous shuttle and mobility-on-demand spaces for local public transport
Local public transport
Autonomous shuttles
e.GO
IAV
Traffic data & analytics
PTV Group
Siemens
Trafficon
Mobility platforms
DB Navigator
Ioki
MOQO
Transport utilities, municipal utilities
Hochbahn
MVG
VRR
Other players (such as
universities and research
institutes)
Dialego
IKEM
KOMOB
Source: Roland Berger (2020)
Mobility on demand with customizable routing in local public transport – Example: ioki in Hamburg
In Hamburg,74 vehicles operated by DB subsidiary ioki go out and about on demand. Journeys can be booked and billed with an app and are hooked up to the local passenger transport system. The difference between this and autonomous, on-demand, customized local public transport is that ioki still uses human drivers. The subsidiary of Germany’s national rail carrier says it wants to create “integrated local public transport” services by adding on-demand mobility to traditional public transport offerings. This would enable customers to travel individualized routes at the times that suit them best. Since 2018, ioki in Hamburg and local public transport utility VHH (Verkehrsbetriebe Hamburg-Holstein GmbH) have been providing this service with 20 electric vehicles in selected parts of the city. Passengers order their trip by app and are taken to their destination. Average wait times are less than five minutes.
In the first year, 170 tons of CO2 were avoided in this way – the approximate equivalent of the CO2 emissions given off by 150 new cars traveling 15,000 km a year. A study performed by the Institute for Transport Planning and Logistics at the Hamburg University of Technology (TU Hamburg) concluded that every fourth passenger traveling with ioki was already replacing one journey by private car.
Further analysis of ioki in Hamburg showed that the vehicles offering mobility on demand could cover 6.5 million of the total of 25 million kilometers traveled by private vehicles every day within the boundaries of Hamburg. Thousands of tons of CO2 could thus be avoided thanks to higher average vehicle capacity utilization and a climate-friendly fleet.
Figure 67: Examples of players in the autonomous shuttle and mobility-on-demand spaces for local public transport
Mobility on demand with customizable routing in local public transport – Example: ioki in Hamburg
91GreenTech made in Germany 2021
Autonomous driving along prescribed local passenger transport routes – Example: Easyride in Munich
Many German cities are currently hosting autonomous mobility system tests for passenger transport. The concepts under investigation range from purely private usage to deployment in local public transport. Fleets of autonomous “robotaxis” and buses (also known as “people movers”) are empowering passenger transport utilities to tailor mobility to the needs of the individual. Right now, there are nearly 40 test routes for autonomous vehicles in local public transport applications. These activities are currently concentrated in three German states: North Rhine-Westphalia, Baden-Württemberg and Berlin.
One of these pilot projects is “Easyride – Experience the Future” in Munich. Here, municipal utility SWM and local passenger transport company MVG are trialing the use of autonomous shuttle buses along two predefined routes in the Olympic Park. Shuttle
buses of the type e.GO Mover (from e.GO Moove GmbH, a subsidiary of Aachen-based E.GO Mobile AG, founded in 2018) have been deployed.
During the first pilot test phase, the minibuses are not yet automated and use sensor technology to collect environmental data in anonymized form. Based on this data, autonomous driving will be trialed in the second pilot phase. By the end of 2020, the initial aim was to test automated and connected driving in live practice. Technological development is focused on individualized public transport and automated ride-pooling fleets. The latter are to be controlled by algorithms that have interfaces to existing transportation systems and that therefore facilitate optimal routing and pooling. Beyond this, the hope is that the pilot project will yield insights into customer acceptance of these solutions.
-
-
-
Outlook: Dovetailing mobility on demand with autonomous driving in the local passenger transport space
If the autonomous vehicle offerings intended for local passenger transport are complemented by customizable routing (as in the case of ioki), the result will be a concept for autonomous individualized public mobility. Passengers will be picked up at a location of their choice and autonomously transported to their selected destination. Other passengers can get in and out along the way. It is above all a combination of the solution strategies described above that can play an important part in the new transportation paradigm. Why? Because higher average per-vehicle capacity utilization will reduce the overall traffic volume, decreasing both noise and particulate matter in the process while also attenuating CO2 emissions. A further benefit is that far more efficient modern vehicle fleets in terms of weight and the use of space are ideally suited to alternative drive systems in general and electric motors in particular.
Autonomous driving along prescribed local passenger transport routes – Example: Easyride in Munich

92 GreenTech made in Germany 2021
6.3 New digital business models in the mobility sector
Companies with new smart mobility business models are another driver of the new transportation paradigm. Studies show that new service offerings are bringing lasting change to mobility patterns. As shown in Figure 68, these digital business models focus above all on the sharing economy and platform solutions.
New business models in the sharing economy are experiencing outstanding success at the present time. The market for car-sharing alone has expanded by more than 10 percent per annum in recent years (and by 14.9
-
percent in 2019). Added stimulus is coming from the advance of digitalization, as the availability and quality of offerings continue to improve in tandem with user convenience. Whereas car-sharing users used to have to collect the key in advance from a prearranged pick-up point, their smartphone now often doubles up as the key.
Unnecessary journeys can thus be avoided and 24/7 service hours are easy to implement. Two Berlin-based companies – e-moped sharing provider emmy and car-
sharing provider Miles – are actively engaged in this segment. Some businesses already have several modes of transport in service, one example being TIER (also from Berlin), which deploys e-scooters and e-bikes.
Figure 68: Examples of players in the shared mobility space in Germany
Shared mobility
Sharing economy
Car-sharing
-
Miles
ShareNow
E-mopeds
Emmy
Tier
Bike-sharing
Jump
Call a Bike
E-scooters
Lime
Voi
Platforms
Apoca Parking
Free2Move
Jelbi
Mobility inside
Qixxit
Sixt
Whim
Technologies
Ioki
MOQO
Ridecell
Smart Mobility Map
1Klang
Source: Roland Berger (2020)
Seven of the most valuable companies in the world are what are termed platform companies. The same kind of enterprise is gaining a foothold in the mobility sector, too. The key benefit is that platforms incorporate a variety of mobility services from different providers. Customers thus find a selection of mobility services – including car-sharing, bike-sharing, local passenger
transport, taxis and e-scooters – that can be tailored to their individual needs. Conversely, platforms allow suppliers of mobility services to target substantially larger groups of customers than they could via their own channels alone.
One such platform is the Jelbi app launched by Berlin transport utility BVG. Jelbi combines multimodal routing information with the option of buying tickets. It also allows customers to book and use the services of other mobility providers, such as Miles, TIER and emmy. Sixt operates as a nationwide platform provider.
Figure 68: Examples of players in the shared mobility space in Germany
93GreenTech made in Germany 2021
Its app lets users not only hire cars but also choose from the bike-sharing, car-sharing and ride-hailing offerings made available by other companies. Additional platforms simplify urban mobility by offering nationwide parking solutions, Stuttgart-based APCOA being just one example. This company’s app highlights free parking spaces in various cities and facilitates automated billing.
-
-
-
-
Things are also moving fast in the software as a service (SaaS) market, which has been growing at an average annual rate of almost 40 percent since 2009. More and more technical solutions based on software as a service business models are now being marketed as white label products for mobility services. With these models, local passenger transport companies and municipal utilities, for instance, can build up their own sharing offerings on the basis of existing technology platforms. This gives SaaS providers the advantage of scale effects, while their customers enjoy less expensive ways to expand their services compared to the option of proprietary development. MOQO, a company from Aachen, and Frankfurt-based ioki are examples of companies on this market. Within about a month, MOQO allows municipal utilities, for instance, the chance to use its platform to become shared mobility providers for scooters, bikes and/or car-sharing.
Environmental impact of digital business models
Digital business models and the corresponding services are having a verifiable impact on mobility patterns. Depending on the scenario being investigated, positive effects can be identified for mobility as a whole and for the environment. New mobility services can, for example, scale back motorized private traffic by driving a shift toward local public transport. However, the right conditions must be put in place if this transition is to be realized. Studies and practical experience, especially from the USA, both show that there is otherwise the danger of contrary effects.
One other consideration is that, since many new business models are built around fleets of electric vehicles such as e-scooters and e-mopeds, the same volume of mobility should be possible with fewer greenhouse gas emissions and less energy consumption. Depending on the scenario, one study commissioned by Germany’s Federal Ministry of Transport and Digital Infrastructure (BMVI) suggests that new mobility offerings could lower CO2 emissions by between 2 and 13 percent. Moreover, alternative mobility solutions in general send out a powerful signal: Car-sharing pools contain more than 50 times as many electric cars as the country’s total vehicle fleet, which naturally strengthens the presence of e-cars on Germany’s roads.
-
6.4
-
-
--
-
Global market opportunities for the green tech industry in the mobility sector
In addition to openings on the domestic German market, there are also attractive export opportunities worldwide as more and more countries declare the combustion engine to be obsolete. The United Kingdom and France are targeting a ban on combustion engines in newly registered vehicles as of 2040. India plans to do the same from 2030 and Norway as early as 2025. Above all in Asia, unbridled urbanization is pushing mobility systems to the brink of collapse. Six of the ten cities with the most traffic congestion in 2019 are in Asia, as are eight of the ten cities with the worst air pollution. Moreover, environmental protection and sustainable mobility topics are gaining traction in other European countries, too.
By positioning themselves as global pioneers with solutions for a new environmentally friendly transportation paradigm, companies in the lead market for sus
tainable mobility can look forward to lucrative growth prospects. The vast potential that exists worldwide is exemplified by the drive system and shared mobility segments: Around the globe, market potential for electric drive systems (batteries, motors, transmissions and charging devices) is more than 24 times that of the German market alone – and that with the outlook for average annual growth of around 11 percent. On the international market for shared mobility applications, too, experts anticipate growth rates approaching 20 percent over the next decade. Between now and 2025, global export potential in this segment will thus exceed that of the domestic market by a factor of 14.
List of tables and figures
Figure 1: Intensity and duration of the consequences of Covid-19 in selected industries 11
Figure 2: Company survey: Influence of climate policy instruments on corporate development in the green tech industry 15
Figure 3: The seven lead markets for environmental technology and resource efficiency and their market segments 18
Figure 4: Global volume of lead markets for environmental technology and resource efficiency in 2020 (billion euros) 20
Figure 5: Volume of lead markets for environmental technology and resource efficiency in Germany in 2020 (billion euros) 21
Figure 6: Global market volume for environmental technology and resource efficiency in 2020 and projected development by 2030 (billion euros) 22
Figure 7: German market volume for environmental technology and resource efficiency in 2020 and projected development by 2030 (billion euros) 22
Figure 8: Projected global growth in lead markets compared to growth in environmental technology and resource efficiency overall, 2020 to 2030 (average annual change) 24
Figure 9: Projected growth in German lead markets compared to growth in environmental technology and resource efficiency overall, 2020 to 2030 (average annual change) 25
Figure 10: Lead markets’ share of the total global market for environmental technology and resource efficiency in 2020 and projected development by 2030 26
Figure 11: Technologies to adapt to the consequences of climate change – Share of the global market for environmental technology and resource efficiency in 2020 and projected development by 2030 27
Figure 12: Market segments and technology lines in the lead market for environmentally friendly power generation, storage and distribution 27
Figure 13: Global lead market volume for environmentally friendly power generation, storage and distribution in 2020 and projected development by 2030 (billion euros, average annual change in percent) 28
Figure 14: Individual technology lines’ share of the global volume in the market segment for renewable energies in 2020 29
Figure 15: Individual technology lines’ share of the global volume in the market segment for storage technologies in 2020 30
Figure 16: Volume of the lead market for environmentally friendly power generation, storage and distribution in Germany in 2020 and projected development by 2030 (billion euros, average annual change in percent) 31
Figure 17: Market segments and key technology lines in the lead market for energy efficiency 33
94 GreenTech made in Germany 2021
95GreenTech made in Germany 2021
Figure 18: Volume of the global lead market for energy efficiency in 2020 and projected development by 2030 (billion euros, average annual change in percent) 34
Figure 19: Individual technology lines’ share of the global volume in the market segment for cross-sector components in 2020 35
Figure 20: Individual technology lines’ share of the global volume in the market segment for energy-efficient production processes in 2020 36
Figure 21: Individual technology lines’ share of the global volume in the market segment for energy-efficient appliances in 2020 37
Figure 22: Individual technology lines’ share of the global volume in the market segment for energy-efficient buildings in 2020 37
Figure 23: Volume of the lead market for energy efficiency in Germany in 2020 and projected development by 2030 (billion euros, average annual change in percent) 38
Figure 24: Market segments and key technology lines in the lead market for material efficiency 40
Figure 25: Volume of the global lead market for material efficiency in 2020 and projected development by 2030 (billion euros, average annual change in percent) 41
Figure 26: Individual technology lines’ share of the global volume in the renewable resources market segment in 2020 42
Figure 27: Volume of the lead market for material efficiency in Germany in 2020 and projected development by 2030 (billion euros, average annual change in percent) 44
Figure 28: Market segments and key technology lines in the lead market for sustainable mobility 46
Figure 29: Volume of the global lead market for sustainable mobility in 2020 and projected development by 2030 (billion euros, average annual change in percent) 46
Figure 30: Individual technology lines’ share of the global volume in the alternative drive technologies market segment in 2020 47
Figure 31: Individual technology lines’ share of the global volume in the transportation infrastructure and traffic management market segment in 2020 48
Figure 32: Volume of the global lead market for sustainable mobility in Germany in 2020 and projected development by 2030 (billion euros, average annual change in percent) 49
Figure 33: Market segments and key technology lines in the lead market for waste management and recycling 51
Figure 34: Volume of the global lead market for waste management and recycling in 2020 and projected development by 2030 (billion euros, average annual change in percent) 51
Figure 35: Volume of the lead market for waste management and recycling in Germany in 2020 and projected development by 2030 (billion euros, average annual change in percent) 52
Figure 36: Market segments and key technology lines in the lead market for sustainable water management 53
96 GreenTech made in Germany 2021
Figure 37: Volume of the global lead market for sustainable water management in 2020 and projected development by 2030 (billion euros, average annual change in percent) 54
Figure 38: Individual technology lines’ share of the global volume in the market segment for efficiency gains in water usage in 2020 54
Figure 39: Volume of the lead market for sustainable water management in Germany in 2020 and projected development by 2030 (billion euros, average annual change in percent) 55
Figure 40: Market segments and key technology lines in the lead market for sustainable agriculture and forestry 58
Figure 41: Volume of the global lead market for sustainable agriculture and forestry in 2020 and projected development by 2030 (billion euros, average annual change in percent) 59
Figure 42: Volume of the lead market for sustainable agriculture and forestry in Germany in 2020 and projected development by 2030 (billion euros, average annual change in percent) 60
Figure 43: Individual technology lines’ share of the global volume in the lead market for sustainable agriculture and forestry in 2020 60
Figure 44: Traditional industries’ share of the global market for environmental technology and resource efficiency in 2020 63
Figure 45: Environmental technology and resource efficiency’s share of the global market volume in selected industries in 2020 (billion euros; shares in percent) 63
Figure 46: Average projected annual revenue per company by lead market focus, 2020 to 2025 66
Figure 47: Average annual workforce growth projections by lead market focus, 2020 to 2025 67
Figure 48: Average research and development spending per company by lead market focus 68
Figure 49: Service intensity by lead market in Germany in 2020 69
Figure 50: Breakdown of companies’ total revenue volume across the lead markets in Germany in 2020 70
Figure 51: Portfolio of companies’ services along the value chain in 2020 71
Figure 52: Company survey: Business situation and business expectations in Germany’s green tech industry in 2020 72
Figure 53: Company survey: Impact of the coronavirus crisis on the green tech industry and the overall economy in Germany 73
Figure 54: Company survey: Influence of the coronavirus crisis on sustainable management 73
Figure 55: Company survey: Importance of cross-sector technologies for the green tech industry in 2020 74
Figure 56: Company survey: Influence of climate policy instruments on corporate development in the green tech industry 75
Figure 57: German companies’ share of the global market for environmental technology and resource efficiency by lead markets in 2020 76
97GreenTech made in Germany 2021
Figure 58: Company survey: Importance of international sales markets today and in the future, part I 77
Figure 59: Company survey: Importance of international sales markets today and in the future, part II 78
Figure 60: Company survey: Impact of climate change on international sales markets 79
Figure 61: Company survey: Use of transfer channels for exports 79
Figure 62: Company survey: Competitive situation on the international lead markets for environmental technology and resource efficiency 80
Figure 63: Company survey: Strengths and weaknesses of the German green tech industry 81
Figure 64: Country scores in the Automotive Disruption Radar (ADR) in 2020 85
Figure 65: German models with alternative drives/alternative fuels as a share of all models with alternative drives/alternative fuels on offer in Germany in 2020 (total number of models and percentage share) 86
Figure 66: Examples of companies involved in developing, producing, operating, recycling and giving second-life applications to battery systems and charging infrastructures 87
Figure 67: Examples of players in the autonomous shuttle and mobility-on-demand spaces for local public transport 90
Figure 68: Examples of players in the shared mobility space in Germany 92
98 GreenTech made in Germany 2021
Bibliography
Aacatech – Deutsche Akademie der Technikwissenschaften e.V. (2013): Umsetzungsempfehlungen für das Zukunftsprojekt Industrie 4.0. Abschlussbericht des Arbeitskreises Industrie 4.0. [www.acatech.de/wpcontent/uploads/2018/03/Abschlussbericht_Industrie4.0_barrierefrei.pdf; accessed on December 9, 2020]
-
Amtsblatt der Europäischen Union (April 25, 2019): Verordnung (EU) 2019/631 des Europäischen Parlaments und des Rates vom 17. April 2019 zur Festsetzung von CO2-Emissionsnormen für neue Personenkraftwagen und für neue leichte Nutzfahrzeuge und zur Aufhebung der Verordnungen (EG) Nr. 443/2009 und (EU) Nr. 510/2011 (revised version). [https://eur-lex.europa.eu/legal-content/DE/TXT/PDF/?uri=CELEX:32019R0631&from=ES; accessed on November 20, 2020]
BBBDE – Bundesverband der Deutschen Entsorgungs-, Wasser- und Rohstoffwirtschaft e. V. et al. (eds.) (2018): Statusbericht der deutschen Kreislaufwirtschaft 2018. Einblicke und Aussichten. [www.bvse.de/images/pdf/Nachrichten_2018/Statusbericht_2018_Ansicht_und_Druck.pdf; accessed on December 9, 2020]
Becker, Joachim (2017): China unter Strom. Süddeutsche Zeitung, January 28/29, 2017.
Bertelsmann Stiftung (eds.) (2020): Weltklassepatente in Zukunftstechnologien. Die Innovationskraft Ostasiens, Nordamerikas und Europas. [www.bertelsmann-stiftung.de/de/publikationen/publikation/did/weltklassepatente-in-zukunftstechnologien; accessed on November 23, 2020]
Bloomberg New Energy Finance (BNEF) (2020): New Energy Outlook 2020. [https://about.bnef.com/new-energy-outlook/; accessed on November 24, 2020]
BP (2020): Statistical Review of World Energy 2020. [www.bp.com/content/dam/bp/business-sites/en/global/corporate/pdfs/energy-economics/statistical-review/bp-stats-review-2020-full-report.pdf; accessed on November 23, 2020]
Bundesamt für Naturschutz (2020): Wälder im Klimawandel: Steigerung von Anpassungsfähigkeit und Resilienz durch mehr Vielfalt und Heterogenität. [www.bfn.de/fileadmin/BfN/landwirtschaft/Dokumente/BfN-Positionspapier_Waelder_im_Klimawandel_bf.pdf; accessed on January 21, 2021]
Bundesministerium der Finanzen (2020): Das Konjunkturprogramm für alle in Deutschland. [www.bundesfinanzministerium.de/Web/DE/Themen/Schlaglichter/Konjunkturpaket/Konjunkturprogramm-fuer-alle/zusammen-durch-starten.html#t-zukunftsinvestitionen; accessed on November 19, 2020]
Bundesministerium für Umwelt, Naturschutz und nukleare Sicherheit (no date). COP25. Jetzt nach vorne schauen. [www.bmu.de/cop25/; accessed on November 19, 2020]
Bundesministerium für Umwelt, Naturschutz und nukleare Sicherheit (eds.) (2019): Nachhaltigkeit im Ackerbau – Eckpunkte für eine Ackerbaustrategie. [www.bmu.de/download/eckpunkte-fuer-eine-ackerbaustrategie-nachhaltigkeit-im-ackerbau/; accessed on February 9, 2021]
Bundesministerium für Umwelt, Naturschutz und nukleare Sicherheit: GreenTech made in Germany 2018: Umwelttechnik-Atlas für Deutschland.
Bundesministerium für Umwelt, Naturschutz, Bau und Reaktorsicherheit (eds.) (2015). GreenTech made in Germany. Umwelttechnologie-Atlas für Deutschland.
Bundesministerium für Umwelt, Naturschutz und Reaktorsicherheit (eds.) (2012): GreenTech made in Germany 3.0. Umwelttechnologie-Atlas für Deutschland.
Bundesministerium für Umwelt, Naturschutz und Reaktorsicherheit (eds.) (2009): GreenTech made in Germany 2.0. Umwelttechnologie-Atlas für Deutschland.
99GreenTech made in Germany 2021
Bundesministerium für Umwelt, Naturschutz und Reaktorsicherheit (eds.) (2007): GreenTech made in Germany. Umwelttechnologie-Atlas für Deutschland.
Bundesministerium für Wirtschaft und Energie (no date): Wasserstoff: Schlüsselelement für die Energiewende. [www.bmwi.de/Redaktion/DE/Dossier/wasserstoff.html; accessed on November 10, 2020]
Bundesministerium für Wirtschaft und Energie (2020a): Der starke Kern der deutschen Wirtschaft. [www.bmwi.de/Redaktion/DE/Dossier/moderne-industriepolitik.html; accessed on December 9, 2020]
Bundesministerium für Wirtschaft und Energie (2020b): Moderne Industriepolitik. [www.bmwi.de/Redaktion/DE/Dossier/moderne-industriepolitik.html; accessed on December 9, 2020]
DDeutsche Bank Research (2016): Hochburg der Stabilität: Was Deutschland so erfolgreich macht. [www.deutschebank.de/pfb/data/docs/20161215_Hochburg_der_Stabilitaet__Was_Deutschland_so_erfolgreich_macht.pdf; accessed on December 9, 2020]
Deutsche Energie-Agentur (dena) (2018): Einsatzgebiete für Power Fuels: Stahlproduktion. [www.dena.de/fileadmin/dena/Publikationen/PDFs/2019/Factsheet_PowerFuels_Stahlproduktion_Industrielle_Prozesswaerme.pdf; accessed on November 10, 2020]
Deutsche Energie-Agentur (dena) et al (2009): Woher kommt der Wasserstoff in Deutschland bis 2050? Studie im Auftrag des Bundesministeriums für Verkehr, Bau und Stadtentwicklung (BMVBS) und in Abstimmung mit der Nationalen Organisation Wasserstoff- und Brennstoffzellentechnologie (NOW). [www.dena.de/fileadmin/dena/Dokumente/Pdf/9060_MOB_Studie_Woher_kommt_der_Wasserstoff_in_Deutschland_bis_2050__Abschlussbericht_.pdf; accessed on November 10, 2020]
Deutscher Nachhaltigkeitspreis (2019). [www.nachhaltigkeitspreis.de/unternehmen/preistraeger-unternehmen/2019/grossunternehmen/alfred-kaercher-se-co-kg/; accessed on November 19, 2020]
Die Bundesregierung (2018): Deutsche Nachhaltigkeitsstrategie. Aktualisierung 2018. [www.bundesregierung.de/resource/blob/975274/1546450/65089964ed4a2ab07ca8a4919e09e0af/2018-11-07-aktualisierung-dns-2018-data.pdf?download=1; accessed on November 19, 2020]
Digital Water.City (no date). [www.digital-water.city/; accessed on October 26, 2020]
EEuropean Commission (2020). Financing the green transition: The European Green Deal Investment Plan and Just Transition Mechanism. [https://ec.europa.eu/commission/presscorner/detail/en/ip_20_17; accessed on November 19, 2020]
European Commission (no date). Kennzeichnungsvorschriften und anforderungen für Produkte. Elektromotoren. [https://ec.europa.eu/info/energy-climate-change-environment/standards-tools-and-labels/products-labelling-rules-and-requirements/energy-label-and-ecodesign/energy-efficient-products/electric-motors_de#neue-kodesign-anforderungen-ab-julinbsp2021; accessed on November 10, 2020]
European Commission (no date). Übereinkommen von Paris. [https://ec.europa.eu/clima/policies/international/negotiations/paris_de; accessed on November 19, 2020]
FFraunhofer-Gesellschaft/Morgenstadt Initiative (2020): Integrated Water Systems. [www.morgenstadt.de/de/innovationsfelder/smart-and-integrated-water-systems.html; accessed on October 26, 2020]
Fraunhofer IAO (2018): Urban farming in the city of tomorrow. Assessing the global landscape on urban food and resource production with the focus on indoor plant and microalgae cultivation. [http://publica.fraunhofer.de/documents/N-506944.html; accessed on October 26, 2020]
GGlobal Innovation Index 2020. [www.globalinnovationindex.org/userfiles/file/reportpdf/GII_2020_KeyFind_English_web.pdf; accessed on January 20, 2021]
100 GreenTech made in Germany 2021
HHüther, Michael (2015): Defizite in der Spitzentechnologie. In: Wissenschaft und Innovation, Wissenschaftsforschung Jahrbuch 2014, Gesellschaft für Wissenschaftsforschung, Jörg Krüger, Heinrich Parthey, Rüdiger Wink (eds.), Wissenschaftlicher Verlag Berlin.
-
Hydrogen Council (2017): Hydrogen scaling up. A sustainable pathway for the global energy transition. [https://hydrogencouncil.com/wp-content/uploads/2017/11/Hydrogen-scaling-up-Hydrogen-Council.pdf; accessed on December 9, 2020]
IIndustryarc. Analytics. Research. Consulting (ohne Datum): Urban Farming Market - Forecast (2020-2025). [www.industryarc.com/Report/15491/urban-farming-market.html; accessed on October 26, 2020]
Institut für Mittelstandsforschung (2016): KMU-Definition des IfM Bonn. [www.ifm-bonn.org/definitionen/mittelstandsdefinition-des-ifm-bonn; accessed on December 9, 2020]
KKompetenzzentrum Wasser Berlin gGmbH (2020): Digital Water City: Digitale Lösungen für das Wassermanagement in der Stadt (DWC). [www.kompetenz-wasser.de/de/project/dwc/; accessed on October 26, 2020
LLacy, Peter/Rutqvist, Jakob/Buddemeier, Philipp (2015): Wertschöpfung statt Verschwendung: Die Zukunft gehört der Kreislaufwirtschaft. Munich.
Oo’pflanzt is! e.V. (2020). [https://o-pflanzt-is.de/; accessed on October 26, 2020]
PPrinzessinnengarten Kollektiv Berlin (2020): Über uns. [http://prinzessinnengarten-kollektiv.net/wir; accessed on October 26, 2020]
QQNX Software Systems Limited (2017) [www.qnx.de/?lang=de; accessed on April 30, 2017]
QT Mobilitätsservice GmbH (2017): Wo immer du hin willst: Gehe deinen eigenen Weg. Über Qixxit [www.qixxit.de/ueberqixxit/; accessed on April 30, 2017]
RREN21 Renewable Energy Policy Network for the 21st Century: Renewables 2020 Global Status report. [www.ren21.net/wp-content/uploads/2019/05/gsr_2020_full_report_en.pdf; accessed on November 24, 2020]
Roland Berger (2020): Circular Economy in the Construction Industry.
Roland Berger (2020): Unternehmensbefragung zum GreenTech-Atlas 2021. [www.bmu.de/fileadmin/Daten_BMU/Download_PDF/Wirtschaft_und_Umwelt/gta_unternehmensbefragung_bf.pdf; accessed on December 2, 2020]
Roland Berger (2019): Energy efficiency services: a key market in the European industrial landscape. [www.rolandberger.com/en/Publications/Energy-efficiency-services-a-key-market-in-the-European-industrial-landscape.html; accessed on December 9, 2020]
101GreenTech made in Germany 2021
SSaarstahl. Press release dated August 21, 2020: Startklar für die grüne Transformation – Bundeswirtschaftsminister, saarländischer Ministerpräsident und Wirtschaftsministerin überzeugen sich von Grüner-Stahl-Strategie von Dillinger und Saarstahl. [www.saarstahl.com/sag/de/konzern/medien/presse/startklar-fuer-die-gruene-transformation-bundeswirtschaftsminister-saarlaendischer-ministerpraesident-und-wirtschaftsministerin-ueberzeugen-sich-von-gruener-stahl-strategie-von-dillinger-und-saarstahl-94471.shtml; accessed on November 10, 2020]
Statista (2020): IWF Prognose: Top 10 Länder mit dem größten Anteil am kaufkraftbereinigten globalen Bruttoinlandsprodukt (BIP) in den Jahren 2020 bis 2025. [https://de.statista.com/statistik/daten/studie/981806/umfrage/ranking-der-laender-mit-dem-groessten-anteil-am-weltweiten-bruttoinlandsprodukt-in-der-zukunft/; accessed on November 19, 2020]
-
Statistisches Bundesamt (2017). [www-genesis.destatis.de/genesis/online;jsessionid=E823FA0A450239F752C932D8AB5C3E69.tomcat_GO_1_1?operation=previous&levelindex=2&levelid=1490956256698&step=2
;
accessed on December 9, 2020]
UUmweltbundesamt (2020): Energiesparen in Industrie und Gewerbe. [www.umweltbundesamt.de/themen/klima-energie/energiesparen/energiesparen-in-industrie-gewerbe#energieeinsparpotenziale; accessed on November 10, 2020]
Umweltbundesamt (2020): Entwicklungsperspektiven der ökologischen Landwirtschaft in Deutschland. [www.umweltbundesamt.de/publikationen/entwicklungsperspektiven-der-oekologischen; accessed on February 9, 2021]
Umweltbundesamt (2020): Emissionsquellen. [www.umweltbundesamt.de/themen/klima-energie/treibhausgas-emissionen/emissionsquellen#energie-verkehr; accessed on November 23, 2020]
VVereinte Nationen Generalversammlung (2015), Siebzigste Tagung, Tagesordnungspunkte 15 und 116, Dokument Nr. A/70/L.1, deutsche Fassung. [www.un.org/Depts/german/gv-70/band1/ar70001.pdf; accessed on November 19, 2020]
ZZáboji, Niklas: Investieren, investieren und nochmals investieren. In: Frankfurter Allgemeine Zeitung, updated on May 7, 2020. [www.faz.net/aktuell/wirtschaft/investitionsprogramm-oekonomen-rufen-nach-dem-staat-16758201.html; accessed on December 2, 2020]
Zukunft Erdgas e.V. (no date): Biologische Methanisierung: Viessmann wandelt mithilfe von Mikroorganismen Strom in Methan um. [https://zukunft.erdgas.info/themen-ziele/gruene-gase/power-to-gas/biologische-methanisierung; accessed on November 10, 2020]
102 GreenTech made in Germany 2021
Index of abbreviations
ADR Automotive Disruption RadarBDL Bundesverband der Deutschen Luftverkehrswirtschaft (German aviation industry association)BMU Bundesministerium für Umwelt, Naturschutz und nukleare Sicherheit
(Federal Ministry for the Environment, Nature Conservation and Nuclear Safety)BMUB Bundesministerium für Umwelt, Naturschutz, Bau und Reaktorsicherheit
(Federal Ministry for the Environment, Nature Conservation, Building and Nuclear Safety)BMVI Bundesministerium für Verkehr und digitale Infrastruktur
(Federal Ministry of Transport and Digital Infrastructure)bn BillionBRICS Brazil, Russia, India, China and South AfricaCAGR Compound annual growth rateCBD Convention on Biological DiversityCCS Carbon dioxide capture and storage CCU Carbon capture and utilizationCNG Compressed natural gasCOP21 United Nations Framework Convention on Climate Change, 21st Conference of the PartiesCO2 Carbon dioxideCO2e Carbon dioxide equivalentCovid Coronavirus diseaseCSR Corporate social responsibilityDENA Deutsche Energie-Agentur (German Energy Agency)EIB European Investment BankERP Enterprise resource planningErP Directive EU “Ecodesign Directive” (officially known as Directive 2009/125/EC of the European Parliament and
of the Council of 21 October 2009 establishing a framework for the setting of ecodesign requirements for energy-related products)
ETS EU Emissions Trading SystemEU European UnionEUR EuroEV Electric vehicleFCEV Fuell cell electric vehicleGHG Greenhouse gasesG20 Group of TwentyHEV Hybrid electric vehicleHVAC Heating, ventilation and air-conditioningH2 HydrogenIE International Efficiency (classification)IEA International Energy AgencyICT Information and communication technologyIoT Internet of ThingsIT Information technologyJTM Just Transition Mechanism KWB Kompetenzzentrum Berlin Wasser (Berlin Center of Competence for Water)LPG Liquefied petroleum gasm MillionNAPE Nationaler Aktionsplan Energieeffizienz (National Action Plan on Energy Efficiency)NOW Nationale Organisation Wasserstoff- und Brennstoffzellentechnologie
(National Organization for Hydrogen and Fuel Cell Technology)OECD Organisation for Economic Co-operation and DevelopmentOEM Original equipment manufacturerPHEV Plug-in hybrid electric vehiclePower2x Technologies to store or otherwise use excess electricity in the event of an oversupply of
renewable energies
ProgRess Deutsches Ressourceneffizienzprogramm (German resource efficiency program)PtG Power to gasPtL Power to liquidP2G Power to gasPV PhotovoltaicsR&D Research and developmentREN21 Renewable Energy Policy Network for the 21st CenturyRR Renewable resourcesSaaS Software as a service (for rent)SDG Sustainable Development GoalSME Small and medium-sized enterprisesSOFC Solid oxide fuel cellSTEEP Social, Technological, Economic, Environmental, Political/LegalSUV Sport utility vehiclet Tonne(s)TEU Twenty-foot equivalent unitTOE Tonne(s) of oil equivalentTWh Terawatt hourUBA Umweltbundesamt (German Environment Agency)UN United NationsUNESCO United Nations Educational, Scientific and Cultural OrganizationUNFCCC United Nations Framework Convention on Climate ChangeVCI Verband der Chemischen Industrie (German chemical industry association)VDA Verband der Automobilindustrie (German automotive industry association)WHO World Health Organization
104 GreenTech made in Germany 2021
Sources
1 G1 Global Innovation Index 2020. www.globalinnovationindex.org/userfiles/file/reportpdf/GII_2020_KeyFind_English_web.pdf; accessed on January 20, 2021
2 Roland Berger: Unternehmensbefragung zum GreenTech-Atlas 2021. www.bmu.de/fileadmin/Daten_BMU/Download_PDF/Wirtschaft_und_Umwelt/gta_unternehmensbefragung_bf.pdf; accessed on December 2, 2020 3 Ibid 4 Ibid 5 www.faz.net/aktuell/wirtschaft/investitionsprogramm-oekonomen-rufen-nach-dem-staat-16758201.html; accessed on November 19, 2020 6 www.bundesfinanzministerium.de/Web/DE/Themen/Schlaglichter/Konjunkturpaket/Konjunkturprogrammfuer-alle/zusammen-durch-starten.html#t-zukunftsinvestitionen; accessed on November 19, 2020 7 https://ec.europa.eu/commission/presscorner/detail/en/ip_20_17; accessed on November 19, 2020 8 www.un.org/Depts/german/gv-70/band1/ar70001.pdf; accessed on November 19, 2020 9 https://ec.europa.eu/clima/policies/international/negotiations/paris_de; accessed on November 19, 2020 10 https://ec.europa.eu/clima/policies/international/negotiations/paris_de; accessed on November 19, 2020 11 The conference planned for October 2020 was postponed due to the pandemic. 12 www.bundesregierung.de/resource/blob/975274/1546450/65089964ed4a2ab07ca8a4919e09e0af/2018-11-07-aktualisierung-dns-2018-data.pdf?download=1; accessed on November 19, 2020 13 www.nachhaltigkeitspreis.de/unternehmen/preistraeger-unternehmen/2019/grossunternehmen/alfredkaercher-se-co-kg/; accessed on November 19, 2020 14 Roland Berger: Unternehmensbefragung zum GreenTech-Atlas 2021 15 Bertelsmann Stiftung (eds.): Weltklassepatente in Zukunftstechnologien. Die Innovationskraft Ostasiens, Nordamerikas und Europas, 2020. Accessed on November 23, 2020 16 The study defines world-class patents as the top ten percent of patents in key technology groups that are often cited in patent registrations and have been registered in many markets. 17 See Bundesministerium für Umwelt, Naturschutz und Reaktorsicherheit (eds.) (2007), Bundesministerium für Umwelt, Naturschutz und Reaktorsicherheit (eds.) (2009), Bundesministerium für Umwelt, Naturschutz und Reaktorsicherheit (eds.) (2012), Bundesministerium für Umwelt, Naturschutz, Bau und Reaktorsicherheit (eds.) (2015) 18 See United Nations General Assembly (2015), page 2 19 Bundesministerium für Umwelt, Naturschutz und nukleare Sicherheit: GreenTech made in Germany 2018: Umwelttechnik-Atlas für Deutschland 20 The figure of 7.3 percent is calculated from the weighted average of annual average growth rates across the individual lead markets. 21 See Becker, Joachim (2017) 22 See BP Statistical Review of World Energy 2020, S. 4. Accessed on November 23, 2020 23 See www.ren21.net/wp-content/uploads/2019/05/gsr_2020_full_report_en.pdf; accessed on November 24, 2020 24 Bloomberg New Energy Finance (BNEF) “New Energy Outlook 2050”, https://about.bnef.com/new-energyoutlook/#toc-download; accessed on November 24, 2020 25 Hydrogen Council (2017): Hydrogen scaling up. A sustainable pathway for the global energy transition 26 www.bmwi.de/Redaktion/DE/Dossier/wasserstoff.html; accessed on November 10, 2020 27 www.dena.de/fileadmin/dena/Publikationen/PDFs/2019/Factsheet_PowerFuels_Stahlproduktion_Industrielle_Prozesswaerme.pdf; accessed on November 10, 2020 28 www.dena.de/fileadmin/dena/Dokumente/Pdf/9060_MOB_Studie_Woher_kommt_der_Wasserstoff_in_Deutschland_bis_2050__Abschlussbericht_.pdf; accessed on November 10, 2020
105GreenTech made in Germany 2021
29 The auxiliary processes are also referred to as production subsystems.
30 These rules do not apply to old motor systems, which remain bound by the rules valid at the time when they were commissioned. 31 https://ec.europa.eu/info/energy-climate-change-environment/standards-tools-and-labels/products-labellingrules-and-requirements/energy-label-and-ecodesign/energy-efficient-products/electric-motors_de#neue-kodesignanforderungen-ab-julinbsp2021; accessed on November 10, 2020 32 www.umweltbundesamt.de/themen/klima-energie/energiesparen/energiesparen-in-industriegewerbe#energieeinsparpotenziale; accessed on November 10, 2020 33 All figures taken from: Roland Berger: Energy efficiency services market study 2019 34 Resources for food production and water are not considered for the purposes of this lead market. 35 When assessing the use of renewable materials, it is vital to always examine their environmental impact throughout the entire production process and supply chain. If planting energy or industrial crops means chopping down rainforests or establishing monocultures that detract from biodiversity, the benefits in terms of resource efficiency will be severely diminished, if not destroyed altogether. 36 Wertschöpfung statt Verschwendung. Die Zukunft gehört der Kreislaufwirtschaft. Accenture Strategy 2015 37 Roland Berger Market Study: Circular Economy in the Construction Industry, 2020 38 In this context, alternative drive systems include hybrid drives, electric drives and fuel cell drives. 39 https://eur-lex.europa.eu/legal-content/DE/TXT/PDF/?uri=CELEX:32019R0631&from=ES; accessed on November 20, 2020 40 www.digital-water.city/; accessed on October 26, 2020 41 www.morgenstadt.de/de/innovationsfelder/smart-and-integrated-water-systems.html; accessed on October 26, 2020 42 www.kompetenz-wasser.de/de/project/dwc/; accessed on October 26, 2020 43 Bundesministerium für Umwelt, Naturschutz und nukleare Sicherheit: Nachhaltigkeit im Ackerbau – Eckpunkte für eine Ackerbaustrategie; accessed on February 9, 2021 44 See www.bfn.de/fileadmin/BfN/service/Dokumente/skripten/skript240.pdf; accessed on October 26, 2020 45 www.bfn.de/fileadmin/BfN/landwirtschaft/Dokumente/BfNPositionspapier_Waelder_im_Klimawandel_bf.pdf 46 Umweltbundesamt 2020: Entwicklungsperspektiven der kologischen Landwirtschaft in Deutschland. www.umweltbundesamt.de/publikationen/entwicklungsperspektiven-der-oekologischen; accessed on February 9, 2021 47 http://publica.fraunhofer.de/documents/N-506944.html; accessed on October 26, 2020 48 www.industryarc.com/Report/15491/urban-farming-market.html; accessed on October 26, 2020 49 http://prinzessinnengarten-kollektiv.net/wir; accessed on October 26, 2020 50 https://o-pflanzt-is.de/; accessed on October 26, 2020 51 Automotive, mechanical and electrical engineering and the chemical industry together account for revenue totaling 969 billion euros, or roughly 69 percent of all revenue generated by industrial companies in Germany. Around 2.8 million people work in these four industries – about 58 percent of all industrial employees. See Bundesministerium für Wirtschaft und Energie (2020a) 52 To avoid the danger of misinterpretations, please note the following: The fact that mechanical engineering’s market volume is shown to include a 21 percent share of green technology says nothing about the environmentally friendly and low-carbon nature of those products and services that make up the remaining 79 percent. A green tech market volume of 21 percent simply means that this share of revenue from products, processes and services is earned with technology lines that, in keeping with the Roland Berger market model, are attributable to the market for environmental technology and resource efficiency.-
53 Calculated based on data from Germany’s Federal Statistical Office. See Statistisches Bundesamt (2017b)
54 See www.ifm-bonn.org/definitionen/kmu-definition-des-ifm-bonn/; accessed on October 26, 2020 55 Calculated based on data from Germany’s Federal Statistical Office. See Statistisches Bundesamt (2017b) 56 Not weighted by sales revenue
106 GreenTech made in Germany 2021
57 See Hüther, Michael (2015)
58 Roland Berger: Unternehmensbefragung zum GreenTech-Atlas 2021. www.bmu.de/fileadmin/Daten_BMU/Download_PDF/Wirtschaft_und_Umwelt/gta_unternehmensbefragung_bf.pdf; accessed on December 2, 2020 59 See https://de.statista.com/statistik/daten/studie/981806/umfrage/ranking-der-laender-mit-dem-groesstenanteil-am-weltweiten-bruttoinlandsprodukt-in-der-zukunft/; accessed on November 19, 2020 60 Roland Berger: Unternehmensbefragung zum GreenTech-Atlas 2021, published in May 2020. www.bmu.de/fileadmin/Daten_BMU/Download_PDF/Wirtschaft_und_Umwelt/gta_unternehmensbefragung_bf.pdf; accessed on November 23, 2020 61 EUWID Europäischer Wirtschaftsdienst: Kreislaufwirtschaft wächst in Deutschland weiter, veröffentlicht am 17.11.2020. www.euwid-recycling.de/news/wirtschaft/einzelansicht/Artikel/kreislaufwirtschaft-waechst-indeutschland-weiter.html; accessed on January 26, 2021 62 See Bundesministerium für Wirtschaft und Energie (2020b) 63 Deutsche Bank Research (2016), page 8 64 Ibid, page 8 65 Ibid, page 8 66 Ibid, page 9 67 See acatech – Deutsche Akademie der Technikwissenschaften e.V. (2013), page 5 68 www.umweltbundesamt.de/themen/klima-energie/treibhausgas-emissionen/emissionsquellen#energieverkehr; accessed on November 23, 2020 69 “Net zero” means that all anthropogenic emissions of greenhouse gases are canceled out in full by measures to reduce emissions. 70 This definition includes exclusively battery-electric vehicles (BEVs), electric vehicles fitted with a small additional combustion engine as a range extender (REEVs) and plug-in hybrid electric vehicles (PHEVs) that can be charged from the power grid, but that are powered by both an electric motor and a combustion engine. 71 To reach this target, newly registered and converted electric vehicles will remain exempt from road tax until December 31, 2025. 72 To minimize dependency on Asian manufacturers such as LG Chem and Samsung, the aim is also to produce battery cells in Germany in the future. The Opel facility in the western German city of Kaiserslautern, for example, plans to open a new factory in 2024. Other examples include VW in Salzgitter (near Hanover) and CATL in Arnstadt (central Germany). 73 Electrolyzers transform electrical energy into chemical energy, producing hydrogen as an energy source. Proton exchange membrane (PEM) electrolysis uses a solid polymer electrolyte that is immersed in water. 74 Series-wired cells in a fuel cell 75 A similar project that is in live operation is run by Stuttgart’s streetcar utility Stuttgarter Strassenbahnen, for example.
107GreenTech made in Germany 2021
Picture credits
Front page: © Menno van Dijk – iStock.comPage 4: dudlajzov – Adobe StockPage 5: nmann77 – Adobe StockPage 6: thauwald-pictures – Adobe StockPage 10: Kateryna – Adobe StockPage 16: malp – Adobe StockPage 17: R_Yosha – Adobe StockPage 23: Kletr – Adobe StockPage 25: Petair – Adobe StockPage 31: malp – Adobe StockPage 35: © PhonlamaiPhoto – iStock.comPage 39: © zhudifeng – iStock.comPage 43: Tjeerd – Adobe StockPage 44: Bruno Mader – Adobe StockPage 50: Sergey Ryzhov – Adobe StockPage 56: © tuachanwatthana – iStock.comPage 57: sompong_tom – Adobe StockPage 61: ball141030 – Adobe StockPage 62: nordroden – Adobe StockPage 64: © kontrast-fotodesign – iStock.comPage 65: scharfsinn86 – Adobe StockPage 68: engel.ac – Adobe StockPage 71: rh2010 – Adobe StockPage 74: DP – Adobe StockPage 77: djhalcyonic – Adobe StockPage 82: Pawinee – Adobe StockPage 84: photoschmidt – Adobe StockPage 88: © HOCHBAHN