Embed Size (px)
Citation preview
Waste Managementin Germany 2018Facts, data, diagrams

Waste Management in Germany 2018 | Facts, data, diagrams2
Imprint
Published byFederal Ministry for the Environment, Nature Conservation and Nuclear Safety (BMU), Public Relations Division · 11055 Berlin · GermanyEmail: [email protected] · Website: www.bmu.de/english
Edited byBMU, Division WR II 1, Dr Andreas Jaron, Christina Kossmann
DesignPROFORMA GmbH & Co. KG, Berlin
Printed byDruck- und Verlagshaus Zarbock GmbH & Co. KG
Picture creditsSee page 43.
DateMarch 2018
First print1,000 copies
Where to order this publication Publikationsversand der BundesregierungPostfach 48 10 09 · 18132 Rostock · GermanyTel.: +49 (0)30 / 18 272 272 1 · Fax: +49 (0)30 / 18 10 272 272 1Email: [email protected]: www.bmu.de/en/publications
NoteThis publication is part of the public relations work of the Federal Ministry for theEnvironment, Nature Conservation and Nuclear Safety. It is distributed free of chargeand is not intended for sale. Printed on recycled paper.

Waste Management in Germany 2018 | Facts, data, diagrams 3
Introduction 4
Waste generation 6
The modern circular economy 8
Waste prevention 10
Recovery and disposal 12
Commercial waste 16
Waste graphic paper 18
Packaging waste 20
Biowaste 22
Marketing of compost and digestate 25
Sewage sludge 26
Waste electrical and electronic equipment 28
Waste batteries 30
End-of-life vehicles 32
Mineral waste 35
Waste shipment 36
The end of a climate killer 38
Information on the Internet 40
Contents

Waste Management in Germany 2018 | Facts, data, diagrams4
Introduction
The shortage of landfill capacity in the 1980s, coupled with the realisation that we need to curb our use of natural resources and energy, prompted the develop-ment of a modern waste management system. The “circular economy” is a top priority for environmental policy in Germany, and since the early 1990s, work has been ongoing to transform our waste management into a resource manage-ment system. We are acutely aware that a growing global population is reliant on diminishing resources. Germany, with its well-developed industry but above- average per capita consumption of resources, has a particular responsibility here. The German public is generally aware of the importance of waste separation and recycling. Modern sorting, treatment and recycling technologies are now well- established, and recycling capacity has been expanded.
Waste Management in Germany 2018 | Facts, data, diagrams 5
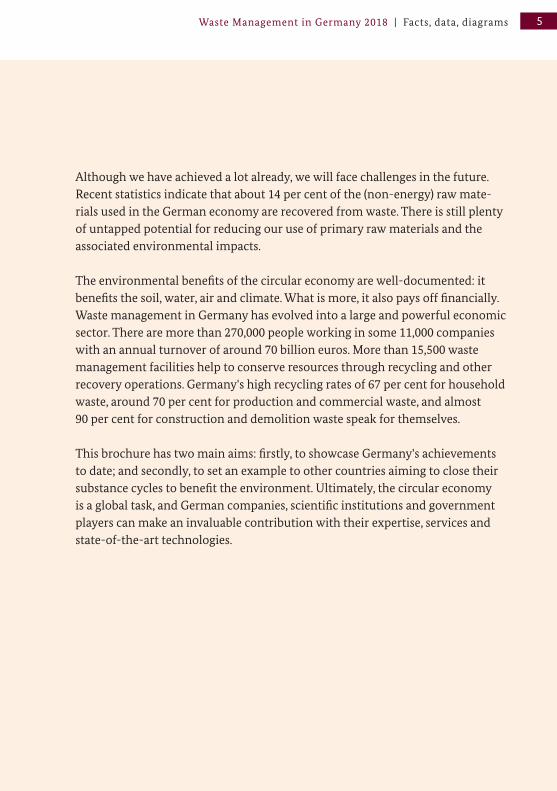
Although we have achieved a lot already, we will face challenges in the future. Recent statistics indicate that about 14 per cent of the (non-energy) raw mate-rials used in the German economy are recovered from waste. There is still plenty of untapped potential for reducing our use of primary raw materials and the associated environmental impacts.
The environmental benefits of the circular economy are well-documented: it benefits the soil, water, air and climate. What is more, it also pays off financially. Waste management in Germany has evolved into a large and powerful economic sector. There are more than 270,000 people working in some 11,000 companies with an annual turnover of around 70 billion euros. More than 15,500 waste management facilities help to conserve resources through recycling and other recovery operations. Germany's high recycling rates of 67 per cent for household waste, around 70 per cent for production and commercial waste, and almost 90 per cent for construction and demolition waste speak for themselves.
This brochure has two main aims: firstly, to showcase Germany's achievements to date; and secondly, to set an example to other countries aiming to close their substance cycles to benefit the environment. Ultimately, the circular economy is a global task, and German companies, scientific institutions and government players can make an invaluable contribution with their expertise, services and state-of-the-art technologies.

Waste Management in Germany 2018 | Facts, data, diagrams6
Although the volume of waste has decreased since 2000, we are still producing too much of it. For household waste in particular, we must strengthen our efforts to promote consumer awareness and waste prevention. The German Waste Pre-vention Programme, adopted in 2013, outlines existing and potential waste pre-vention measures at national, regional and local level. Alongside a host of advice, information and awareness-raising measures, together with research and devel-opment projects, the programme also focuses on waste prevention strategies and incentives.
Since 1999, the figures for “production and commercial wastes” have no longer included waste treated directly on company premises; yet recovery and disposal data are still recorded. As of 2006, the net waste volume (excluding waste from waste treatment facilities) on which this publication is based is roughly compa-rable with the previous statistics.
Waste generation

Waste Management in Germany 2018 | Facts, data, diagrams 7
Fig. 1: Waste generation in Germany 2000 – 2015 Including hazardous waste
450
400
350
300
250
200
150
100
50
02000 2003 2006 2009 2011 2012 2013 2014 2015
Source: Federal Statistical Office, 2017
Construction and demolition waste
Production and commercial waste
Waste from the extraction and processing of mineral resources
Household waste
Total
Million tonnes
50.1
48.2
47.7
260.7
49.6
46.7
46.7
223.4
46.4
42.0
54.8
197.7
48.4
27.5
51.3
195.0
50.2
34.7
58.4
199.4
49.7
30.3
54.2
199.3
49.5
29.2
57.1
202.7
51.1
30.2
59.5
209.5
51.6
31.4
59.2
209.0
406.7
366.4
340.9322.2
342.7333.5 338.5
350.3 351.2

Waste Management in Germany 2018 | Facts, data, diagrams8
The modern circular economy
From 2000 onwards, economic output in Germany rose at a moderate rate, dipped sharply during the financial crisis years of 2008 and 2009, and since then has increased steadily. By contrast, total waste volumes decreased up until 2009, largely independently of economic influences. They then increased at a mod-erate rate, but far less sharply than economic growth. This is reflected in the waste intensity indicator, which dropped steadily until 2012, and since then has increased only slightly. Hence, the link between waste volumes and economic output has been successfully severed, at least in part. Government-directed waste prevention efforts have contributed to this effect, although the exact influence cannot be quantifed to date.
As well as decoupling waste volumes from economic output, there is an increas-ingly pressing need to recover raw materials and energy carriers from waste and return them to the industrial cycle. Waste prevention and the resource-effcient, environmentally sound recovery of valuable materials are the hallmarks of a modern circular economy.
In Germany, the core elements of the circular economy are set out in the Circular Economy Act (KrWG), which entered into force on 1 June 2012. The Act trans-poses the Waste Framework Directive into national law, and outlines the legal basis and fundamental principles of the circular economy. Beginning with the legal defnition of waste, in particular, these core principles include the polluter- pays principle, the five-tier waste hierarchy, and the principle of shared public and private responsibility for waste management. The purpose of this Act is to promote the circular economy to conserve natural resources, and protect human health and the environment from the impacts associated with waste generation and management.

Waste Management in Germany 2018 | Facts, data, diagrams 9
Fig. 2: Severing the link between waste volumes and economic output 2000 – 2015
Source: Federal Statistical Office, 2017
120
115
110
105
100
95
90
85
80
75
702000 2003 2006 2009 2012 2015
Gross Domestic Product (GDP), price-adjusted
Net waste volume
Waste intensity
Per cent
100 100101.0
90.1
83.8
106.7
79.3
105.1
82.0
113.9
86.4
118.3
100
89.5
78.5
75.6
72.1
73.3

Waste Management in Germany 2018 | Facts, data, diagrams10
The modern circular economy does not only entail waste management, but also upstream extraction, production and consumption phases of raw materials and products, insofar as they impact waste disposal. As well as designing recy-cling-friendly products in terms of their ease of dismantling, pollutant content and resource consumption, the various opportunities for waste prevention also play a pivotal role.
In the interests of conserving resources, waste prevention aims to reduce both the volume of waste and its pollutant content. To this end, in 2013, the German govern- ment and the Federal States (Länder) adopted a programme of public-sector measures designed to reduce waste vol-umes. The Waste Prevention Programme will be revised and updated in 2019.
There are also many other ways for pro-ducers and consumers to reduce their waste: by focusing on durable, lean, repairable products; avoiding unnecessary and short-lived items; purchasing ser-vices rather than goods; and using rather than owning, for example. The message is that by acting considerately, each and every one of us can do our bit to protect the environment.
Raising awareness and sensitising the general public to effective waste preven-tion is therefore crucial. Each year in November, Germany stages its own series of events to mark the European Week for Waste Reduction, highlighting what can be achieved through individual activities, ideas and commitment.
Waste prevention

Waste Management in Germany 2018 | Facts, data, diagrams 11
Our approach to plastic bags is a good example. Although Germany's consump-tion of plastic bags was already below the European average, at around 72 bags per person, per year, the voluntary introduction by retailers of a plastic bag charge has reduced this further to around 38 bags, proving that conscious behav-iour by individuals can have a big impact.

Waste Management in Germany 2018 | Facts, data, diagrams12
To achieve sustainable development, we need to decouple resource consumption from economic growth. With this in mind, Germany devised a resource efficiency programme, an updated version of which (ProgRess II) was adopted on 2 March 2016. For long-term success, however, we cannot allow the efficiency gains of such a strategy to be swallowed up by escalating production and consumption. Waste prevention, and the increased recovery of materials from waste, are a key part of this. Our goal is to transform the waste industry into a source of raw materials for the production of goods.
In Germany, the waste management sector contributes to sustainable production with high recycling and recovery rates, which in turn help to save raw materials and primary energy.
Recovery and disposal
Fig. 3: Recovery and disposal rates 2000 – 2015 Waste (total)
Source: Federal Statistical Office, 2017
100
90
80
70
60
50
40
30
20
10
02000 2003 2006 2009 2012 2015
Recovery rate
Disposal rate
26 %
Per cent
68 % 68 %74 %
79 % 79 % 79 %
32 % 32 %
21 % 21 % 21 %

Waste Management in Germany 2018 | Facts, data, diagrams 13
Fig. 4: Composition of household waste 2015 In million tonnes
Source: Federal Statistical Office, 2017
Total: 45.9 million tonnes, of which:
Household and household-like commercial waste
Paper
Plastics/light packaging
Biodegradable garden and park waste
Waste from bio-bins
Bulky waste
Glass
Other (composites, metals, textiles, etc.)
Waste electrical and electronic equipment
Non-recoverable waste must be disposed of safely, without harming the envi-ronment or human health. Before being landfilled, organic waste undergoes mechanical-biological or thermal treatment to render it inert and minimise the release of leachate and landfill gas. The landfilling of untreated organic waste has been banned since mid-2005.
In 2017, there were 68 waste incineration plants operational in Germany with a capacity of around 20 million tonnes, as well as 32 substitute fuel plants with a combustion capacity of around 5 million tonnes. In 2017, 45 bio-mechanical waste treatment plants with a capacity of around 5 million tonnes treated some 4.5 million tonnes of waste, only around 0.5 million tonnes of which ended up in landfill.
14.12.5
4.2
5.8
6.08.1
Total: 45.9 million
tonnes
2.52.1
0.6

Waste Management in Germany 2018 | Facts, data, diagrams14
The five-tier waste hierarchy defines the following order of priority: prevention, preparation for reuse, recycling, other forms of recovery (particularly for energy), and disposal. In each case, priority is given to the most environmentally bene-ficial option. Alongside the environmental impacts, consideration must also be given to the technical options available, as well as the economic and social con-sequences. The circular economy in Germany therefore focuses consistently on waste prevention and recycling, without jeopardising established, high-quality, environmentally sound waste management processes. Up to 68 per cent of typ-ical household waste is already recycled. The new calculation method under EU regulations will result in numerically lower recycling rates. Germany is com-mitted to increasing recycling rates in the future.

Waste Management in Germany 2018 | Facts, data, diagrams 15
Fig. 5: More recyclables than residual waste in 2015 – Household waste
Source: Federal Statistical Office, 2017
Residual waste
Biowaste, packaging, glass, paper
1990
5 10 15 20 25 30 35
2004
2015
0
Fig. 6: Construction and demolition waste 2015 Including non-hazardous road construction waste, in million tonnes
Source: Federal Statistical Office, 2017
Total recovery:
180.9 million tonnes
Material recycling
Energy recovery
Total disposal:
20.9 million tonnes
Landfill
Incineration and treatment179.7
20.61.2
0.3
Total: 201.8 million
tonnes
Million tonnes
34
18
25
24
5
14

Waste Management in Germany 2018 | Facts, data, diagrams16
Each year in Germany, large quantities of commercial waste are generated by more than 3.6 million businesses. Although a large portion of this is already collected separately and recycled, nevertheless, some 6 million tonnes of mixed municipal waste of commercial origin (including mixed packaging) are gener-ated each year.
In recent years, only around 45 per cent of this mixed waste was pretreated in sorting facilities; the remaining 55 per cent or so was used directly for energy recovery. Only around 0.4 million tonnes of the 2.6 million tonnes of pretreated mixed waste was segregated and recycled. In other words, just 7 per cent from a total of 6 million tonnes of mixed municipal waste of commercial origin was recovered for materials.
Commercial waste

Waste Management in Germany 2018 | Facts, data, diagrams 17
This prompted the entry into force of the new Commercial Wastes Ordinance on 1 August 2017. The Ordinance introduced a strict cascade of obligations, spear-headed by the mandatory separate collection of paper, board and cardboard, glass, plastics, metals, wood, textiles, biowaste and other production-specific waste fractions. Any mixed waste remaining after segregration must be pre-treated. 1 January 2019 will see the introduction of mandatory recycling rates of 30 per cent, together with other special requirements for pretreatment plants. The current equal ranking afforded to material and energy recycling for com-mercial waste will be abolished, and replaced with the five-tier waste hierarchy for this important substance flow.

Waste Management in Germany 2018 | Facts, data, diagrams18
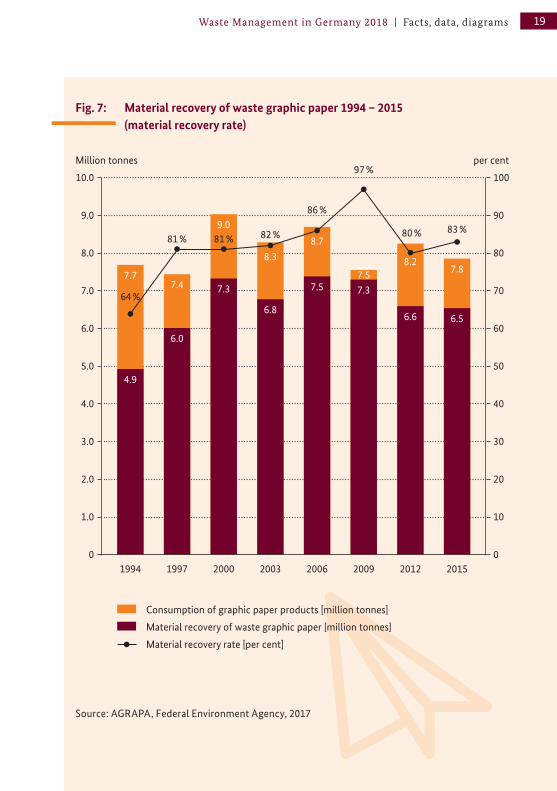
At the initiative of the German Environment Ministry, on 26 September 1994 AGRAPA, an alliance of associations and organisations from the paper manu-facturing industry, paper importers, paper wholesalers, the printing industry and publishers, issued a voluntary declaration pledging to gradually increase the material recovery of waste graphic paper to 60 per cent by the year 2000. Graphic paper refers to print products and paper used in offices and administration. These efforts proved so successful that in September 2001, AGRAPA upgraded its voluntary commitment of 1994, pledging to permanently maintain the recycling rate at 80 per cent (+/- 3 per cent). To date, it has kept its promise.
This is a very welcome development for the environment, and an excellent example of an industry taking responsibility for the waste management of its products. At the same time, it underpins the importance of waste paper recycling in the German paper industry and makes a significant contribution towards relieving pressures on the environment.
Waste graphic paper
Waste Management in Germany 2018 | Facts, data, diagrams 19
Fig. 7: Material recovery of waste graphic paper 1994 – 2015 (material recovery rate)
Source: AGRAPA, Federal Environment Agency, 2017
10.0
9.0
8.0
7.0
6.0
5.0
4.0
3.0
2.0
1.0
01994
Consumption of graphic paper products [million tonnes]
Material recovery of waste graphic paper [million tonnes]
Material recovery rate [per cent]
100
90
80
70
60
50
40
30
20
10
01997 2000 2003 2006 2009 2012 2015
Million tonnes per cent
7.77.4
81 % 81 % 82 %
86 %
97 %
80 % 83 %
64 %
9.0
8.38.7
7.58.2
7.8
4.9
6.0
7.3
6.8
7.5 7.3
6.6 6.5

Waste Management in Germany 2018 | Facts, data, diagrams20
Packaging is part of daily life. Its main constituents are glass, aluminium, tin plate, plastic, paper, cardboard and wood, all of which are valuable (secondary) raw materials. Reusing or recovering these materials helps to conserve natural resources, save energy and reduce emissions of greenhouse gases. The separate collection of household packaging waste introduced by the Packaging Ordinance enjoys a high level of support among the German public.
Packaging waste
Fig. 8: Development of recovery rates of packaging waste 1991 – 2015
1991 1997 2001 2007
Source: Gesellschaft für Verpackungsmarktforschung mbH (GVM), 2017
39.2 % 82.6 % 79.3 % 79.2 %Per cent
100
90
80
70
60
50
40
30
20
10
0
53.7
16.6
37.1
11.6
55.8
83.5
79.7
79.5
61.0
88.6
61.6
85.1
75.3
75.7
51.8
91.9
62.8
83.7
74.2
91.6
62.2
86.9
66.7
Waste Management in Germany 2018 | Facts, data, diagrams 21
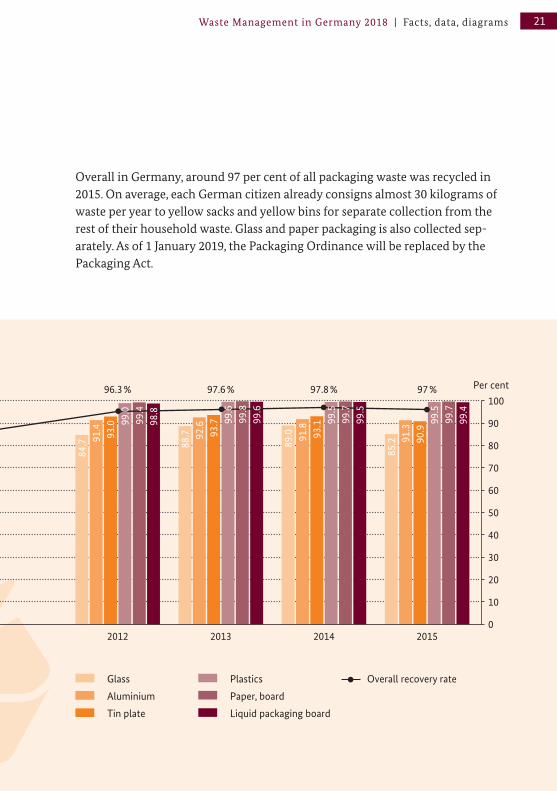
Overall in Germany, around 97 per cent of all packaging waste was recycled in 2015. On average, each German citizen already consigns almost 30 kilograms of waste per year to yellow sacks and yellow bins for separate collection from the rest of their household waste. Glass and paper packaging is also collected sep-arately. As of 1 January 2019, the Packaging Ordinance will be replaced by the Packaging Act.
2012 2013 2014 2015
Glass
Aluminium
Tin plate
96.3 % 97.6 % 97.8 % 97 %
Plastics
Paper, board
Liquid packaging board
Overall recovery rate
Per cent
100
90
80
70
60
50
40
30
20
10
0
84.7 91
.493
.0 99.0
99.4
98.8
88.7 92
.693
.7 99.6
99.8
99.6
89.0 91
.893
.1 99.5
99.7
99.5
85.2 91
.390
.999
.599
.799
.4
Waste Management in Germany 2018 | Facts, data, diagrams22
In 2015, some 13.85 million tonnes of biodegradable waste (primarily waste from bio-bins, biodegradable garden and park waste, market waste and other biode-gradable waste from a variety of sources) were treated in composting and diges-tion plants / biogas installations. Of this, around 4.57 million tonnes were coll-ected separately via bio-bins, together with around 5.1 million tonnes of garden and park waste, corresponding to an average collection rate of 118 kilograms per inhabitant, per year.
According to the latest provisional figures from the Federal Statistical Office, in 2016 the volume of biowaste collected separately from private households rose by more than 500,000 tonnes (an increase of 6 kilograms per inhabitant) com-pared with 2015. Some 4.83 million tonnes were collected separately from bio-bins, together with around 5.35 million tonnes of garden and park waste (total-ling 10.18 million tonnes, or 123 kilograms per inhabitant).
Biowaste
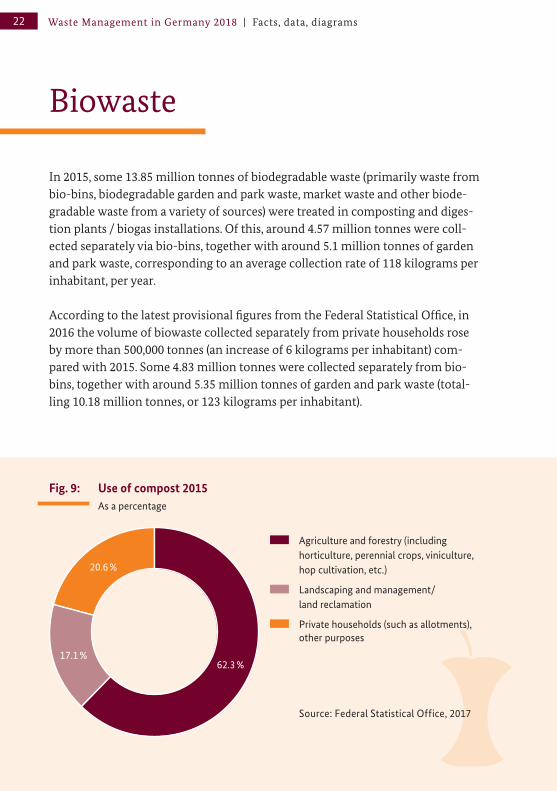
Fig. 9: Use of compost 2015 As a percentage
62.3 %17.1 %
20.6 %
Source: Federal Statistical Office, 2017
Agriculture and forestry (including horticulture, perennial crops, viniculture, hop cultivation, etc.)
Landscaping and management/ land reclamation
Private households (such as allotments), other purposes
Waste Management in Germany 2018 | Facts, data, diagrams 23
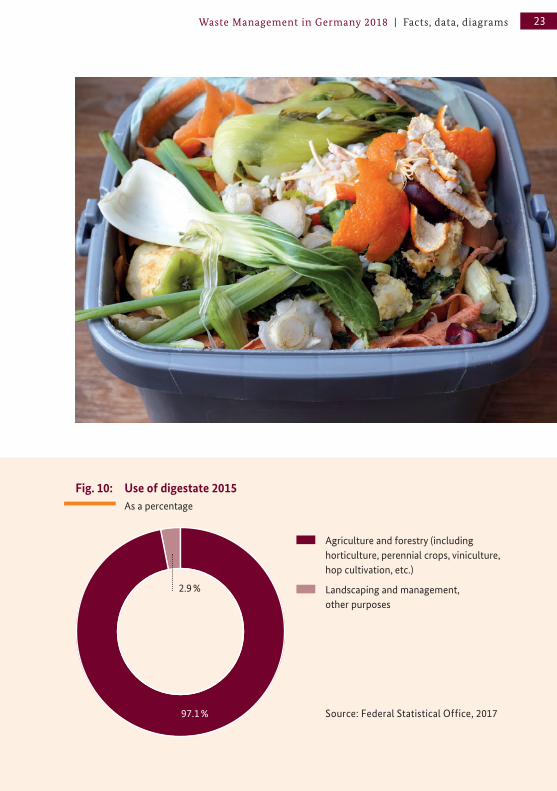
Fig. 10: Use of digestate 2015 As a percentage
97.1 %
2.9 %
Source: Federal Statistical Office, 2017
Agriculture and forestry (including horticulture, perennial crops, viniculture, hop cultivation, etc.)
Landscaping and management, other purposes

Waste Management in Germany 2018 | Facts, data, diagrams24
In 2015, from the total volume of biowaste, 7.37 million tonnes were consigned to 868 composting facilities, and 6.48 million tonnes to 1,392 digestion plants (including combined digestion and composting facilities). This was used to pro-duce around 3.96 million tonnes of compost and 4.09 million tonnes of fermen-tation substrate for use in various sectors as fertilisers or soil additives.

Waste Management in Germany 2018 | Facts, data, diagrams 25
Separately collected biowaste can be made into high-quality compost and digestate, for use as fertilisers (nutrients) and soil improvers (humus). If suitable biowaste is digested in biogas plants, it can additionally be used to recover usable energy (biogas). Finally, composted biowaste and soils can be made into substrate mixtures for specific applications. Approaches of this kind can make a valuable contribution to the conservation of resources.
Biowaste also makes a growing contribution to energy generation. It can be used to generate power and heat, or processed and fed into the natural gas grid. The Renewable Energy Sources Act (EEG) supports operators of existing composting facilities wishing to add a fermentation phase. Combined processes of this kind generate both usable biogas and valuable compost, which can be used as a fertil-iser and as a soil improver.
Marketing of compost and digestate

Waste Management in Germany 2018 | Facts, data, diagrams26
Sewage sludge from public sewage treatment plants (around 1.8 million tonnes dry weight) contains a range of plant nutrients, particularly phosphorus. For this reason, sewage sludge is also used as a fertiliser in agriculture (around 24 per cent in 2016) and in landscaping (around 10 per cent in 2016).
Some 65 per cent of sewage sludge is incinerated, leading to the loss of valuable phosphorus. Mindful of the limited phosphorus reserves available worldwide, the German Government supports the recovery of phosphates from sewage sludge and domestic waste water to supplement the current practice of applying sewage sludge directly to the soil. However, the German Government and the Federal States (Länder) have jointly resolved to scale down soil-related sewage sludge use in agriculture over the next 15 years. The German Environment Min-istry has updated the Sewage Sludge Ordinance of 1992, and included provisions on increasing the recovery of phosphorus, ultimately with a view to nationwide enforcement. The Ordinance entered into force on 3 October 2017.
Sewage sludge

Waste Management in Germany 2018 | Facts, data, diagrams 27
2.0 %23.9 %
64.5 %
9.6 %
Agriculture
Thermal treatment
Landscaping
Other
Fig. 11: Disposal and recovery of sewage sludge 2016 Total sewage sludge volume: 1.8 million tonnes, of which:
Source: Federal Statistical Office, 2017
Fig. 12: Use of sewage sludge in agriculture 1991 – 2016
20.0 %
41.0 %
33.4 %
29.4 % 29.4 %
23.9 %
Source: Federal Statistical Office, 2017
50
40
30
20
10
01991 1997 2003 2009 2012 2016
Per cent

Waste Management in Germany 2018 | Facts, data, diagrams28
Between 2006 and 2015, some 7.2 million tonnes of waste electrical and elec-tronic equipment were collected and treated.
The statistics show that Germany has far exceeded the EU’s prescribed recovery and recycling quotas for waste electrical and electronic equipment every year to date. While annual collection targets were previously based on the number of inhabitants, from 2016 onwards, a new collection/return quota for waste equipment from private households and commerce of 45 per cent of all equip-ment placed on the market during the preceding three years came into force in all EU Member States. Against this background, and given our commitment to boosting resource efficiency, it is important to improve the quality and quantity of collection still further in future.
Waste electrical and electronic equipment

Waste Management in Germany 2018 | Facts, data, diagrams 29
Recovery [per cent]
Recycling [per cent]
Specific volumes collected from private households [kilogram per inhabitant]
Source: German Environment Agency (UBA), 2017
Fig. 13: Collection volumes and recovery rates of waste electrical and electronic equipment 2011 – 2015
2011 2012 2013 2014 2015
2011 2012 2013 2014 2015
710,250 690,711 727,998 722,968 721,872
Volumes returned in tonnes/annum
8.1
96.4 96.3
84.8
7.7
96.2
84.4
7.6
95.4
84.2
7.6
90.3
79.3
7.6 Per centKilogram/ inhabitant
100
90
80
70
60
50
40
30
20
10
0
10
9
8
7
6
5
4
3
2
1
0
84.7

Waste Management in Germany 2018 | Facts, data, diagrams30
Since the European Union Battery Directive entered into force in 2006, the sep-arate collection and recovery of batteries has been mandatory throughout all EU Member States.
A collection rate of 40 per cent has applied in all EU Member States since 2014; in 2016, this was raised to 45 per cent of batteries placed on the market during the preceding three years.
Each year, more than 40,000 tonnes of portable batteries and accumulators enter the German market. Although the Batteries Act obligates end users to collect all waste batteries separately, barely half of them actually end up in the special con-tainers provided in shops and at public collection points. Vehicle and industrial batteries continue to be collected and recovered.
Valuable secondary raw materials such as zinc, steel, ferromanganese, lead, cad-mium and plastic can be recovered from waste batteries and reused.
Waste batteries

Waste Management in Germany 2018 | Facts, data, diagrams 31
Fig. 14: Volumes of portable batteries collected 2014 – 2016
50
40
30
20
10
02014
Collection
300
200
100
02014 2015 2016
Collection ratePer cent
Portable batteries
Lead-acid batteries
Nickel-cadmium batteries
Other batteries
2015 2016 2014 2015 2016
Sales
Source: German Environment Agency (UBA), 2017
44.2
108.1
180.6
39.8 45.3
93.5
225.0
41.2 46.2
103.0
291.5
41.6
43,9
79
42,0
30
42,2
93
43,9
02
43,7
01
45,5
11
16,4
40
19,1
42
17,1
46
19,6
78
17,7
50
20,5
24
1,44
21,
333
1,38
31,
149
1,41
61,
286
0,41
51,
395
0,50
11,
108
0,56
81,
382
Tonnes

Waste Management in Germany 2018 | Facts, data, diagrams32
The Directive 2000/53/EC on end-of-life vehicles and the German End-of-life Vehicle Ordinance stipulated a recycling rate (reuse/recycling) of 80 per cent and an overall recovery rate (reuse/recovery) of 85 per cent of the average vehicle weight for the period 2006 to 2014. In 2015, these targets were raised to 85 per cent (recycling) and 95 per cent (recovery) respectively. These rates apply to the total volume of end-of-life vehicles (ELVs) in a given year; they do not have to be met for every ELV.
The overall recovery rates of more than 100 per cent, achieved between 2010 and 2014, are due to the after-effects of the 2009 environmental premium for the recovery of ELVs: as the number of discarded ELVs in 2009 was approximately four times higher than the average annual amount, the capacities of disman-tling and shredding facilities were exceeded, so that some ELVs had to be put into interim storage. In other words, fewer ELVs were treated or recovered than had been returned. The rates therefore dropped significantly in 2009, while still meeting the targets. Between 2010 and 2014, on the other hand, more ELVs were treated and recovered than had been returned each year, hence stockpiles from interim storage were successfully reduced. As a result, exceptionally high rates were achieved during these five years. In 2015, the situation returned to normal, and the after-effects of the environmental premium are no longer in evidence.
Since 2005 (recycling) and 2006 (recovery) respectively, Germany has regu-larly exceeded the binding targets of 80 and 85 per cent for the period 2006 to 2014; and since 2006 (recycling) and 2010 (recovery) respectively, it has already exceeded even the higher targets of 85 per cent and 95 per cent, applicable only from 2015 on (except in 2009 – the year of the environmental premium – when the recycling rate fell short of the 2015 target; however, if adjusted to allow for the effects of the environmental premium, the recycling rate was exceeded).
End-of-life vehicles

Waste Management in Germany 2018 | Facts, data, diagrams 33
Source: German Environment Agency (UBA), 2017
Fig. 15: End-of-life vehicle recycling rates in Germany 2004 – 2015
Export (non-metals)
Shredder (non-metals)
Dismantling (non-metals)
Metals
2004 2005 2006 2007 2008 2009 2010 2011 2012 2013 2014 2015
80.2
86.8 88.1 89.2
95.593.4 92.3
89.8 89.587.7
Target since 2015 (85%) under the EC End-of-Life Vehicles Directive
Target since 2006 (80%) under the EC End-of-Life Vehicles Directive
100
90
80
70
60
50
40
30
20
10
0
82.9
77.2
Per cent

Waste Management in Germany 2018 | Facts, data, diagrams34
Fig. 16: End-of-life vehicle recovery rates in Germany 2004 – 2015
Source: German Environment Agency (UBA), 2017
2004 2005 2006 2007 2008 2009 2010 2011 2012 2013 2014 2015
90.486.7
106.2 108.2 106.3103.8
101.4
95.8
79.7
89.5
Export (non-metals)
Shredder (non-metals)
Dismantling (non-metals)
Metals
110
100
90
80
70
60
50
40
30
20
10
0
92.9
82.9
Target since 2015 (95%) under the EC End-of-Life Vehicles Directive
Target since 2006 (85%) under the EC End-of-Life Vehicles Directive
Per cent

Waste Management in Germany 2018 | Facts, data, diagrams 35
Mineral waste
Fig. 17: Distribution of mineral waste As a percentage
Source: German Environment Agency, 2017
Construction and demolition waste
Soil and dredged material
Waste from production processes
Waste from thermal processes32.0 %
50.7 %
7.7 %
9.6 %
Mineral wastes are the largest waste stream in Germany, with an annual volume of more than 275 million tonnes. They include construction and demolition wastes and excavated soils, as well as slags and ashes from incineration processes in energy and metal producing industries.
A significant fraction of mineral wastes is used by the construction industry, where they substitute primary construction materials, for example as recycled grit in construction materials, as a substitute for landfill construction materials or as backfill material in open pit mining.
Currently, there is no federal regulation on the production and use of mineral wastes as substitute construction material in Germany. The Federal Govern-ment is planning to introduce the Substitute Construction Materials Ordinance, designed to promote the use of secondary raw materials, thereby strengthening the circular economy and preserving valuable primary raw materials. The sec-ondary raw materials used for construction are strictly controlled in order to protect valuable soil and groundwater resources, and to prevent the uninten-tional release of environmentally hazardous substances.

Waste Management in Germany 2018 | Facts, data, diagrams36
The Basel Convention on the Control of Transboundary Movements of Haz-ardous Wastes and their Disposal, which entered into force in 1992, seeks to ensure environmentally sound waste management practices worldwide and to control transboundary shipments of hazardous wastes. More than 180 countries and the European Union are now Parties to the Convention.
The EU transposed the Basel Convention into binding law for all Member States with the Waste Shipment Regulation.
The Waste Shipment Act contains supplementary provisions applicable to Ger-many. A consent is required in particular for hazardous waste.
Where waste shipments are subject to consent, the authorities check whether there are any objections to the shipment. The shipment is tracked through a movement document. The high level of waste imports into Germany compared with waste exports is primarily attributable to the high standard of recovery and disposal structures in Germany, coupled with economic factors.
Waste shipment

Waste Management in Germany 2018 | Facts, data, diagrams 37
Fig. 18: Transboundary shipment of waste 2007 – 2016
Import Export
Source: German Environment Agency (UBA), 2018
25
20
15
10
5
02007 2012 20142013 2015 2016 2007 2012 20142013 2015 2016
15
10
5
02007 2012 20142013 2015 2016 2007 2012 20142013 2015 2016
6.2 5.9 5.9 6.4 6.5
1.8 1.8 2.0 2.6 2.9
15.8 16.0 16.0 16.615.6
21.8 22.421.3
22.220.9
Consent required
Consent not required
6.53.0
15.7
21.4
Million tonnes

Waste Management in Germany 2018 | Facts, data, diagrams38
A key aim of waste management policy in Germany is to prevent adverse envi-ronmental impacts. Germany maintains very high standards to protect water, soil and the air from the emissions associated with waste treatment and storage. Not least, the ban on dumping untreated waste, in force since 2005, has helped to continuously reduce emissions of climate-damaging gases (primarily methane) from landfills. Recycling and the harvesting of energy from waste also helps to minimise greenhouse gases. In this way, since 1990, annual emissions from the waste management sector have been reduced by some 56 million tonnes of carbon dioxide equivalents. Carbon dioxide equivalent is a way of measuring the global warming potential of a greenhouse gas compared with that of carbon dioxide. This reduction in emissions accounts for more than 20 per cent of the international “Kyoto targets” that Germany has pledged to meet.
The end of a climate killer

Waste Management in Germany 2018 | Facts, data, diagrams 39
CO240
30
20
10
0
-10
-20
-30
-401990 2006 2020
Fig. 19: Greenhouse gas emissions 1990 - 2020
38
-18
-27
Source: Öko-Institut e.V., IFEU Study 2010
Million tonnes of CO2 equivalents

@
Waste Management in Germany 2018 | Facts, data, diagrams40
You will find a wealth of useful information, links and references to the sites of waste management and environmental organisations on the German Environ-ment Ministry’s homepage:
Current information and press releases on the German Government’s waste management policy→ www.bmu.de/WS103-1
Waste policy in Germany, Europe and worldwide→ www.bmu.de/P585-1/
Waste legislation (German only)→ www.bmu.de/P591/
Types of waste/waste flows→ www.bmu.de/P596-1/
Waste treatment/waste technology→ www.bmu.de/P614-1/
International policy→ www.bmu.de/P621-1/
German RETech Partnership→ www.bmu.de/P620-1/→ www.retech-germany.net/?L=1
Waste management statistics→ www.bmu.de/P626-1/
European Week for Waste Reduction→ www.ewwr.eu/en
Information on the Internet

@ @
Waste Management in Germany 2018 | Facts, data, diagrams 41

Waste Management in Germany 2018 | Facts, data, diagrams42

Waste Management in Germany 2018 | Facts, data, diagrams 43
Picture credits
Title page: iStock.com/RawpixelPage 4: iStock.com/pepper82Page 6: iStock.com/BoylosoPage 11: Arit/laifPage 14: Daniel Ernst/stock.adobe.comPage 16: Miravision/stock.adobe.comPage 18: gmg9130/stock.adobe.comPage 23: Gary Perkin/stock.adobe.comPage 24: imray/Shutterstock.comPage 25: Stephan Leyk/stock.adobe.comPage 26: Thomas Leiss/stock.adobe.comPage 28: peno - penofoto.de/stock.adobe.comPage 30: mitifoto/stock.adobe.comPage 36: noomcpk/Shutterstock.comPage 38: bikemp/Shutterstock.comPage 41: momius/stock.adobe.com