Embed Size (px)
Citation preview
Bachelor Thesis
Green Marketing - The impact on consumer-based brand equity A quantitative study among the Swedish Generation
Y in the fashion clothing industry
Authors:
Danial Ahmad David Magariños Supervisor: Dan Halvarsson Examiner: Åsa Devine Date: 23.05.2017 Subject: Marketing Level: Bachelor Course code: 2FE21E

1
Acknowledgements
Firstly, we would like to express our extended gratefulness to our family, friends for their moral
support and to all the people who helped us with their invaluable knowledge, opinions and time
during this entire venture.
Secondly we would like to thank our tutor Dan Halvarsson, for all his support, guidance,
feedback and putting us on the right path throughout the research.
We would also like to express our gratitude to our examiner Åsa Devine for providing us with
her priceless feedback during the seminars and for strengthening our weaknesses.
Lastly we would like to thank all the opposition groups who went through our paper and
provided us with their input, and to all the respondents who took out their valuable time for
answering our questionnaire.
Växjö 23rd of May 2017
_______________________________ _________________________________
David Magariños Danial Ahmad
2
Abstract
Authors: David Magarinos & Danial Ahmad Tutor: Dan Halvarsson Examiner: Åsa Devine Title: Green Marketing - The impact on consumer-based brand equity - Quantitative Study among the Swedish Generation Y in the fashion clothing industry.
Introduction: Recent trends have shown a steady growth regarding environmental concerns along with the pro-environmental attitudes among the consumers, yet a contradicting behaviour is observed in the purchase of environmentally friendly products, giving birth to the phenomena of attitude-behaviour gap. A fair amount of researchers have studied this attitude-behaviour gap over the recent years, investigating this very inconsistency in order to present a solution. This specific study is based on the findings of Davari & Strutton in relation to this attitude-behavior gap, where the researchers presented a simplified model of their study as an effort in overcoming this inconsistency. This specific study is based on the simplified model, where the research unearths the effect of green marketing mix elements on four dimensions of consumer-based brand equity with Swedish Generation Y and clothing fashion industry in perspective. Purpose: The purpose of this study is to explain the impact of green marketing mix elements (product, price, place and promotion) on dimensions of consumer-based brand equity (brand loyalty, brand association, brand trust and perceived brand quality). Methodology: The research is based on quantitative approach designed in respect with the explanatory purpose. A closed-end online questionnaire was designed as the data collection method, resulting in 127 responses. The results were based on the multiple regression analysis, while the validity was tested against pearson's correlation method and reliability was tested through cronbach’s alpha. Conclusion: The study did not measure significant results, where green product stands out as the only element on the green marketing-mix having a positive relationship on one consumer-based brand equity dimension in this case, brand loyalty. Whereas the other elements were concluded as having no significance. Even though all the elements were perceived important by the Swedish Generation Y consumers. Keywords: Green marketing-mix, Consumer-based brand equity, Attitude-behaviour gap, Generation Y.

3
Table of Contents
1 Introduction ............................................................................................................................. 5
1.1 Background ...................................................................................................................... 5
1.2 Problem Discussion .......................................................................................................... 7
1.3 Purpose ............................................................................................................................. 8
2 Theoretical Framework ........................................................................................................... 9
2.1 Green marketing mix ........................................................................................................ 9
2.1.1 Green Product ............................................................................................................ 9
2.1.2 Green Price .............................................................................................................. 10
2.1.3 Green Place .............................................................................................................. 11
2.1.4 Green Promotion...................................................................................................... 12
2.2 Consumer-based brand equity ........................................................................................ 13
2.2.1 Brand loyalty ........................................................................................................... 14
2.2.2 Brand association ..................................................................................................... 14
2.2.3 Brand trust ............................................................................................................... 14
2.2.4 Perceived brand quality ........................................................................................... 15
2.3 Hypothesized relationships ............................................................................................ 15
3 Methodology ......................................................................................................................... 18
3.1 Research approach.......................................................................................................... 18
3.1.1 Deductive research .................................................................................................. 18
3.1.2 Quantitative research ............................................................................................... 19
3.2 Research Design ............................................................................................................. 19
3.3 Data sources ................................................................................................................... 20
3.4 Data collection method................................................................................................... 21
3.5 Data collection instrument ............................................................................................. 21
3.5.1 Operationalization ................................................................................................... 21
3.5.2 Questionnaire design ............................................................................................... 25
3.5.3 Pretesting ................................................................................................................. 26
3.6 Sampling......................................................................................................................... 27
3.6.1 Sampling frame........................................................................................................ 28
3.6.2 Sample selection ...................................................................................................... 28
3.7 Data analysis method ..................................................................................................... 29
3.7.2 Descriptive statistics ................................................................................................ 29
3.7.3 Correlation analysis ................................................................................................. 30
3.7.4 Regression analysis.................................................................................................. 30

4
3.8 Quality criteria................................................................................................................ 30
3.8.1 Content validity ....................................................................................................... 31
3.8.2 Construct validity .................................................................................................... 31
3.8.3 Criterion validity...................................................................................................... 32
3.8.4 Reliability ................................................................................................................ 32
3.9 Ethical considerations .................................................................................................... 33
4 Results ................................................................................................................................... 35
4.1 Descriptive statistics ....................................................................................................... 35
4.2 Reliability ....................................................................................................................... 37
4.3 Validity ........................................................................................................................... 38
4.4 Hypothesis testing .......................................................................................................... 39
4.4.1 Multiple linear regression ........................................................................................ 40
5 Discussion ............................................................................................................................. 44
5.1 Hypothesis 1 ................................................................................................................... 44
5.2 Hypothesis 2 ................................................................................................................... 45
5.3 Hypothesis 3 ................................................................................................................... 46
5.4 Hypothesis 4 ................................................................................................................... 47
5.5 Hypothesis 5 ................................................................................................................... 48
5.6 Hypothesis 6 ................................................................................................................... 48
5.7 Hypothesis 7 ................................................................................................................... 49
5.8 Hypothesis 8 ................................................................................................................... 50
5.9 Hypothesis 9 ................................................................................................................... 51
6 Conclusion ............................................................................................................................ 52
6.1 Theoretical implications ................................................................................................. 53
6.2 Managerial implications ................................................................................................. 54
6.3 Limitations and directions for further research .............................................................. 55
References ................................................................................................................................ 56
Appendix .................................................................................................................................. 66

5
1 Introduction
This chapter will include the introduction to concepts of corporate social responsibility,
sustainability, green marketing and brand equity. This would lead to the discussion and
problematization of these concepts and lastly land into the purpose of the study.
1.1 Background
Over the recent years, the growing concern regarding the environment has been observed not
only as an important public issue but also a central topic in the academic research (Elham &
Nabsiah Abdul, 2011). The consumers, interest groups and the governments are progressively
critical to the companies to behave in a more socially responsible fashion. The organisations
are more frequently expected to draw the decisions that does not only concern the organisation
or the shareholders, but are also in best interest of the society on the whole (Grimmer &
Woolley, 2014).
To be able to cater the changing needs and demands of the consumers, along with answering
the arising request from the society on a richer social responsible behavior, an organization
could enhance their approach on the development of an effective corporate social responsibility
strategy. Shuili, Bhattacharya & Sankar (2011) explain the corporate social responsibility
(CSR) as “…a firm’s commitment to maximize long-term economic, societal, and
environmental well-being through business practices, policies, and resources” (p1528). The
firms that are seen to be engaged in developing better CSR strategies are able to build a stronger
customer bonding along with conveyance of a positive firm´s image (Lee et al., 2016). Du &
Sen (2016) emphasize on the initiatives that are able to make a difference for the consumers,
enables the firms to win the consumer's heart which is a key in building close and long-lasting
ties with the firm. They further argue how these practices surpass the standard marketing mix
which leads to an effective reshaping of the competitive game, resulting in an increment in both
business and social value of a firm (Du & Sen, 2016).
Sustainability could be observed as one the key branches under the notion of CSR. The concept
sustainability, is assumed to have made its impact in the marketing and strategy literature since
the start of this century (Tollin, Christensen & Wilke, 2015). The concept Sustainability has
been defined as “the consumption of goods and services that meet basic needs and quality of
6
life without jeopardizing the needs of future generations” (p143) (Gordon, Carrigan &
Hastings, 2011). The authors Fuentes (2015) argue how the environmentally friendly products
provide a set of solutions in regards to sustainability, and a way of transforming a complex
process into a profitable one for the companies. They further argue on the notion of green
marketing as adapting the traditional marketing techniques in line with the environmental
issues. The authors Mishra & Sharma (2014) define the concept green marketing as “…the
process of developing products and services and promoting them to satisfy the customers who
prefer products of good quality, performance and convenience at affordable cost, which at the
same time do not have a detrimental impact on the environment ” (p79).
The concept green marketing has been explained from a different perspective, as the activities
that are designed in order to create and promote any form of transaction that is intended to
satisfy the human needs and wants, in a way that the process of satisfaction takes place with
the least adverse effects on the natural environment (Chockalingam & Isreal, 2016). Keeping
in view the different alterations of explanations available, the green marketing strategy could
be viewed as, the desire of an organisation to foster actions that are designed to adjust the
marketing and corporate objectives, while protecting the natural surroundings (Fraj, Martinez
& Matute, 2011). The explanation is observed in line with the authors Leonidou, Katsikeas &
Morgan (2013), as they conceptualized green marketing strategy that takes into consideration
each marketing mix element. They further argue the notion as the Price, Product, Place and
Promotion is to be designed and carried out in a way that does not cause an adverse effect on
the natural environment.
As there is an increase in the levels of organisations competing with each other, globalization
and with the steady growth of awareness among the consumers, the brand equity is considered
as one of the firm’s greatest treasured asset (Girard et al, 2017). The authors further argues the
importance of brand equity, as it has been evident from the recent trend of growing body in
literature, housing this concept (Girard et al, 2017). The concept of brand equity in the
marketing literature for years has been described “...as the value added by the brand name to
a product that does not possess a brand name” (p5) (Davcik, da Silva & Hair, 2015).
7
1.2 Problem Discussion
According to Tan, Johnstone & Yang (2016) consumers awareness of environmental issues
and positive attitudes increased over the years. Although the populations concerns for the
environment are growing, consumers are not willing to purchase environmentally friendly
products (Gupta & Ogden, 2009; Tan, Johnstone & Yan, 2016). Through that inconsistency a
phenomena arises which is called “attitude-behavior gap” (Vermeir & Verbeke, 2006; Gupta
& Ogden, 2009; Tan, Johnstone & Yan, 2016). The gap represents the problem that consumers
attitude towards the environment is positive but it does not transcribe into a real purchase
behavior (Vermeir & Verbeke, 2006; Gupta & Ogden, 2009; Tan, Johnstone & Yan, 2016).
Several authors argue that the attitude-behavior gap is a social dilemma and therefore it creates
the need to further investigate the inconsistency and originate a solution to close the gap
(Vermeir & Verbeke, 2006; Gupta & Ogden, 2009; Tan, Johnstone & Yan, 2016).
There are different explanations through the literature regarding reasons why consumers do not
purchase environmentally friendly products, such as low perceived availability of
environmentally friendly products, personal benefits, or also higher costs that are involved
(Vermeir & Verbeke, 2006; Davari & Strutton, 2014). That is where long-term green marketing
strategies must be implemented in order to communicate the environmentally friendly aspect
of the company to the consumer and thus establish the relationship with consumers in order to
drive them to an actual purchase behavior, hence close the existing attitude-behavior gap
(Davari & Strutton, 2014). The application of such a green marketing strategy implies the
integration of the green marketing mix elements product, price, place and promotion into the
strategy (Leonidou, Katsikeas & Morgan, 2013). Furthermore, Davari & Strutton (2014) argue
that green marketing strategies are usually more rewarding if they establish brand loyalty,
create positive brand associations, form more trust and encourage the perceptions of brand
quality. Consequently, Davari & Strutton (2014) tested a model where they evaluated the
influence of green marketing mix elements on the aforementioned aspects, namely brand
loyalty, brand association, brand trust and brand quality, which are part of the consumer-based
brand equity construct. Furthermore, the authors added two moderating variables to the model
namely environmental concerns and consideration of consequences.
Through their findings Davari & Strutton (2014) were able to reject several relationships
between green marketing mix and consumer-based brand equity. The influence of green price
on brand association and perceived brand quality resulted as insignificant, further the impact
8
of green place on brand association and brand trust was denied and finally the effect of
promotion on brand association, brand trust and perceived brand quality was not supported
either. With respect to brand loyalty none of the hypotheses was rejected. Additionally, the
influence of the moderating variable consideration of consequences was not supported,
whereas the other moderating variable environmental concerns was significant. However, the
authors argued that it is logical that consumers which are already interested in environmental
topics, will probably react more favorably towards the impact of green marketing mix on
consumer-based brand equity. Therefore, the findings from Davari & Strutton (2014) result in
a simplified model with the need of being tested, which makes this research an extension study
of the previous study (Berthon et al., 2002).
Despite the findings of Davari & Strutton (2014), the authors were not able to generate
sufficient understanding about the topic in order to close the attitude-behavior gap, therefore
more knowledge is needed concerning how strongly the green marketing mix elements
influence consumer-based brand equity. Hence, the simplified model needs to be tested in order
to create managerial implications explaining how marketers conveniently apply the green
marketing mix and thus improve their green marketing strategies, so that consumers pro-
environmental attitudes emanate into an actual purchase behavior. Furthermore, theoretical
implications unearthing the relationship of green marketing mix when connected to consumer-
based brand equity are needed, in order to add up to the poorly studied literature in this field
(Davari & Strutton, 2014).
1.3 Purpose
This purpose is to explain the impact of green marketing mix elements (product, price, place
and promotion) on dimensions of consumer-based brand equity (brand loyalty, brand
association, brand trust and perceived brand quality).

9
2 Theoretical Framework
This chapter would examine the current literature and discuss it to develop insights regarding
the elements of green marketing mix and the selected dimensions of consumer-based brand
equity. With the insights from the literature the hypotheses would be constructed and a model
will be presented at the end of the chapter.
2.1 Green marketing mix
Developing the marketing mix is part of the whole marketing process of a company (Rex &
Baumann, 2007). The difference between green marketing and conventional marketing is, that
the marketing mix is green-oriented. Values are created to aim environmental and ethical
commitments. In other words, green advertising includes environmental issues in their
marketing mix (Rex & Baumann, 2007). Product development, the effectuation of pricing,
promotional and supply chain strategies are elements of a green marketing mix (Kinoti, 2011).
When implementing green products into their business, firms face substantial alterations. The
market must be modified, the products need to be redefined, the benefits from its use have to
be highlighted and the promotion must be adjusted in a way, that the consumer gets informed
instead of getting impressed (Chockalingam & Isreal, 2016). How each element of the
conventional marketing mix is applied on green marketing strategies is going to be presented
in the next section.
2.1.1 Green Product
Tan, Johnstone & Yang (2016) explain green products as goods that are recognized as being
environmentally-friendly. This can be due to several reasons, as the fabrication process, the
components or substances used for the manufacturing and also the packaging. Whereas the
green products are defined by Leonidou, Katsikeas & Morgan (2013) as the decisions and
actions that are related to the products, based on the sole purpose of protection and interest of
the natural environment by sustaining the energy and resources factor along with reduction of
pollution and waste. The authors further stress on the two approaches with this program, being
the tactical and strategical. The tactical scenario argues about how the products are packaged
and labelled in a better environmentally friendly fashion, Where the strategical approach
focuses on the design techniques, procedures and the manufacturing process in a more
sustainable practice (Leonidou, Katsikeas & Morgan, 2013).

10
The description of Kinoti (2011) says that green goods are lasting, non-toxic and fabricated
through the use of recycled materials or minimally packaged. Therefore green product
strategies encompass recycling, reduced amount of packaging materials, sustainable raw
materials, lasting products and safety for the disposal as well as use. However, according to
Chockalingam & Isreal (2016) the green attributes of an eco-friendly product alone are not
satisfying for a consumer. The product needs to be characterised as well by an additional profit
like taste, disposal or safety. According to the authors the label of the products is of high
significance. The use of environmental labelling schemes allow to inform and declare about
the environmental qualities of the green product and therefore avoid the criticism from rival
companies as well as consumer organizations and even legal regulatories (Rex & Baumann,
2007). The meaning must be clear to the consumer, it has to stand out from other labels that
consumers are exposed to and the organization which certifies the product as green, must be
trustworthy for the consumer (Chockalingam & Isreal, 2016).
2.1.2 Green Price
Most of the consumers automatically relate green products to a higher price class (Kinoti,
2011). Even though their speculations might represent the reality, eco-friendly goods are in
fact not overpriced. When companies decide to go green, they face high costs (Eneizan et al.,
2016). The acquirement of new technologies and equipment is necessary, people must be
educated and the waste needs to be transformed into recyclable units. Therefore the price for
green products is automatically a premium price. On the other hand, Kinoti (2011) states that
eco-friendly goods are in fact not overpriced, instead conventional products are placed in a
price range that is to low to be realistic. Socio-environmental costs of manufacturing, use of
product and its disposal are ignored, which makes it possible to sell the product in this price
category. Kinoti (2011) argues that firms must clarify the consumer about the environmental
damage that the conventional products generate. Trying to compete with conventional products
in terms of the price is not convertible. Therefore the only way to realize a change in consumers
habits, is to nourish them with the benefits of green products. However, Eneizan et al. (2016)
argues that through the withdrawal of packaging material the price could be reduced, and
therefore it could be a more desirable option for the consumer. But they also state that anyway
consumers must be motivated to pay for the premium price. According to the authors,
consumers can be encouraged to pay the premium price if the product offers additional

11
attributes that complement certain facets of the product such as performance, function, design,
and visual appeal which are perceived by the consumer as valuable.
The authors Leonidou, Katsikeas & Morgan (2013) explain the green pricing concept as, the
practices that are accountable for both the economic and environmental costs incurred during
the production and marketing process, while serving value to customers and profit to the firm.
In tactical conditions the firms could either choose on rebates on the return of recyclable
packaging, or induce a higher price for the environment unfriendly products. From a strategic
point of view the techniques include life-cycle cost of the product from the research to disposal,
which help in the pricing of products from a sustainable perspective (Leonidou, Katsikeas &
Morgan, 2013).
2.1.3 Green Place
According to Davari & Strutton (2014) green place denotes distribution tactics from the
production point of green products to the consumption point. Eneizan et al. (2016) states that
green distribution relates to the selection of mediums which produce less environmental
pollution. Therefore, collaborations with distribution partners are useful in order to establish
arrangements for product reuse and disposal and additionally, to provide consumers with the
facility to return recyclable materials (Eneizan et al., 2016). The authors argue that the
recycling process is part of a two-way distribution system which allows them to strengthen the
relationship with the consumers.
According to Tan, Johnstone & Yang (2016) the availability of a product is a significant
condition for the purchase behavior of a consumer. If it is to challenging for consumers to
access an eco-friendly product, they will be less willing to buy it. Consequently, how and where
the product is accessible are key points within this marketing mix element (Mishra & Sharma,
2012). This argument is further strengthened by Eneizan et al. (2016) which states that the
location and availability of the green product have an impact on the intentions of the consumer
to purchase the product. Additionally, Tan, Johnstone & Yang (2016) argue that green
consumers represent a niche market whereas the non-green consumers speak for the general
society. This implies that firms should endeavor to enlarge eco-friendly product consumption
within the non-green consumer market. The statement of Mishra & Sharma (2012) strengthens
former mentioned point, where they discourage the use of niche market distribution techniques

12
for green products. They argue with the fact that it is more beneficial when consumers
frequently encounter green goods over all the market.
The tactical strategies include, firms working conjointly with allies to establish product reuse
and disposal layouts, and assuring the customers having the possibility to return the recyclable
goods. While strategically organisations could construct policies that require the suppliers and
distributors to take into considerations the environmental friendly standards in achieving their
desired marketing roles (Leonidou, Katsikeas & Morgan, 2013).
2.1.4 Green Promotion
Green promotion refers to the action of advertising goods without creating a negative impact
on the environment. Green promotion can also specify the publicity of an environmentally
friendly lifestyle without demonstrating any product. Green promotion can also just mean the
demonstration of corporate social responsibility (Banerjee, Gulas & Iyer, 1995). However, as
with conventional products, the choice of the right communication channel plays a fundamental
role in terms of how successful the impact of the green product will be on the market. The
advertisement needs to convey an accurate message about the meaning and benefits of the
product (Chockalingam & Isreal, 2016). On the other hand, Shrum, McCarty & Lowrey (1995)
state that green advertisements are often applied to create and impact on the corporate image
rather than the product itself.
According to Chockalingam & Isreal (2016) there is a relationship between green consumers
and newspaper reading. Therefore printed media turns out to be a suitable medium. Carlson,
Grove & Kangun (1993) approve that advertisements in form of printed media enhances the
image of the company by relating the firm to a positive environmental cause. They further
argue that the process of technology, production or disposal is thereby not the main focus of
the advertisement. This declaration goes in line with Shrum, McCarty & Lowrey (1995) which
explain that the advertisement underlines the environmentally friendly production of goods and
emphasizes less on the disposal. However Chockalingam & Isreal (2016) also claim that for
adolescent consumers the use of buzz marketing is more convenient. They argue that instead
of forcing them to buy a certain product it is more fruitful to encourage consumers to speak
about the environmental issues and the benefits of green products with their relatives. The
formation of word of mouth messages in a face-to-face way or through social media is therefore

13
more effective for the establishment of brand trust than paid advertisement (Chockalingam &
Isreal, 2016).
From a tactical point of view, the promotion process that take into consideration the actions
that could reduce any adverse environmental impact, when it comes to an organisation’s
marketing communication efforts. From a more strategic perspective, promotion strategies that
are developed to broadcast the environmental benefits in regards to the firm’s products or
services. This scenario could include advertising environmental claims, appeals and efforts on
the packaging of a product (Leonidou, Katsikeas & Morgan, 2013).
2.2 Consumer-based brand equity
The concept of consumer-based brand equity is explained by Christodoulides, Cadogan, &
Veloutsou (2015) as the idea that the consumer mind holds the strength of the brand, which the
authors further describe as the “...differential effect of brand knowledge on consumer response
to the marketing of the brand” (p309) (Christodoulides, Cadogan, & Veloutsou, 2015). The
authors Davcik, da Silva & Hair (2015) shed light on the concept as the assets and liabilities
that are attached to the brand, the name or the symbol which expands or diminishes the value
supplied by a firm through products or services. While on the other hand brand equity is being
argued as the word “equity” could be connected to the realm of finance, but the concepts
foundation is laid on more subjective view which speaks for the intangible notions that are
added and/or are of value to the consumer (Davcik, da Silva & Hair, 2015).
The concept of brand equity can be examined as a multidimensional concept, as observed from
the steadily growing literature regarding the concept, the consumer-based brand equity is
argued to bear distinct dimensions (Naresh & Ravi Shekhar, 2013). The study conducted by
Girard et al. (2017), the authors referred to the brand image, perceived quality, brand awareness
and brand loyalty as the dimensions that are connected to the consumer based brand equity.
Keeping in view these dimensions (Naresh & Ravi Shekhar, 2013) also recognized brand trust
as a dimension, that has been acknowledged as one of the key dimension by the researchers in
this concept. However, the main focus of this study is to unearth the key antecedents that are
in focus with the model of the study conducted by Davari & Strutton (2014), that fall in the
consumer-based brand equity within green marketing strategy. Namely brand loyalty, brand
association, brand trust and perceived brand quality.

14
2.2.1 Brand loyalty
According to Leckie, Nyadzayo & Johnson (2016) brand loyalty could be explained as the
“...degree of attachment a customer has for a particular brand”(p563). The researchers further
shed light on brand loyalty being the commitment that is observed from the consumer with the
brand in focus, as well as the intention of repurchasing the product or service provided by the
brand (Leckie, Nyadzayo & Johnson, 2016). The preceding statement is in line with the authors
Yoo & Donthu (2001) where they explain the approach of brand loyalty, as the tendency of a
consumer to be loyal to a specific brand, through demonstrating it with the intention of
purchasing a brand as their principal choice.
2.2.2 Brand association
The concept is termed as one of the core component of consumer-based brand behavior, the
term brand association is defined as the “...knowledge of a brand that is stored in a consumer
memory as individual pieces of brand information which are linked together to form a complex
associative network of the brand” (p1357) (Alan & Gareth, 2013). The researchers argue that
this brand information is recollected from the memory of a consumer through an activation
process, where one association is being linked and stimulated to another or others. This whole
series of reaction administer the energy of the consumer that runs their cognition cycle (Alan
& Gareth, 2013). The authors Van Osselaer & Janiszewski (2001) argue that the brand
associations have an active role to play in consumers mind, when it comes to the evaluation
and choice process. They further explain as the more the brand name arises with the aspect of
benefit, whether it is by direct or indirect involvement, the more vigorous is the connection
between the brand and the benefit (Van Osselaer & Janiszewski, 2001). Severi & Choon Ling
(2013) add that besides benefits, attitudes can generate a connection to the brand name as well.
2.2.3 Brand trust
The approach brand trust from a consumer perspective, is created on the basis of cognitive
beliefs and also the affective perceptions regarding a brand (Becerra & Badrinarayanan, 2013).
The notion is explained as the “...beliefs that include expectations of brand reliability,
consistency, competence, and/or predictability of performance across all products sold under
that brand” (p374) (Becerra & Badrinarayanan, 2013). The author Chen (2010) shed light on
the aspect of brand trust being the level of confidence, that the brand as it would behave in a
way as it is expected by the consumer, also that it is the intention to accept the accountability

15
of a brand based on the positive expectations. The concept falls under the willingness and
dependency on the brand, established on the expectations provided in regard with the brand
reliability, ability and benevolence (Chen, 2010).
2.2.4 Perceived brand quality
The term perceived brand quality by the authors Erdogmus & Budeyri‐Turan, 2012 is defined
as “...the consumer’s judgment about the superiority or excellence of a product which is based
on the subjective perception” (p404). It can be elaborated as the attitude, which is a result based
on the comparison process of the consumer expectations distinguished with the actual
performance of the product or service (Erdogmus & Budeyri‐Turan, 2012). The explanation is
observed to be in line with the author Calvo-Porral & Lévy-Mangin (2017) that the perceived
quality plays a vital role when it comes to the consumer purchase decision, this concept under
the consumer-based brand equity is also considered to be of importance with a direct correlation
to the brand proneness. Furthermore, Rao & Monroe (1989) argue that the brand name has a
significant effect on the quality perceptions of consumers.
2.3 Hypothesized relationships
Because of the poorly studied field of green marketing, current literature focused on the effects
of conventional marketing mix on brand equity (Yoo, Donthu & Lee, 2000; Aghaei et al.,
2014). However, Yoo, Donthu & Lee (2000) and Aghaei (2014) analyzed the influence of the
marketing mix elements on dimensions of brand equity namely, perceived brand quality, brand
loyalty, brand associations and brand awareness. However, brand awareness is not focus of this
study, and thus was disregarded. Even though the studies did not relate marketing mix to a
green context and the dimensions of brand equity were not investigated separately, instead
brand equity was analyzed as a whole construct, it still shows the relevance of testing those
relationships given that both studies found a positive relationship. However, Davari & Strutton
(2014) analyzed the relationship of green marketing mix elements on the aforementioned
dimensions of brand equity, including the dimension of brand trust. Through their findings
Davari & Strutton (2014) concluded that some elements of the green marketing mix do not
practice any important effect on the consumer-based brand equity construct, which results in a
simplified model with hypothesized relationships among green marketing mix and consumer-
based brand equity that need to be tested. Due to the lack of the scientific literature available,
only the hypotheses regarding brand loyalty could be further strengthened by additional

16
literature. For the remaining hypotheses, Davari & Strutton (2014) were the only researcher
putting forward their contribution.
Davari & Strutton (2014) reveal in their findings that all four marketing mix elements are
related to brand loyalty. However, they argue that green price is negatively associated with
loyalty. The authors explain the phenomena through the fact that consumers automatically
connect green products to higher prices without thinking about the larger value implemented
in the product. Consequently, loyalty decreases if prices are high. Furthermore, Pourdehghan,
(2015) indicated in his study, that product elements, distribution channels and promotional
activities created a positive impact on brand loyalty, which strengthens the following four
hypotheses:
Hypothesis 1: Green product is positively related to brand loyalty.
Hypothesis 2: Green price is negatively related to brand loyalty.
Hypothesis 3: Green place is positively related to brand loyalty.
Hypothesis 4: Green promotion is positively related to brand loyalty.
Davari & Strutton (2014) argue that only green product has a significant influence on brand
association. In addition, the findings reveal that green price, place and promotion were not
connected to brand association, which leads to the disclosure of the aforementioned elements
resulting in the following hypothesis:
Hypothesis 5: Green product is positively related to brand association.
Davari & Strutton (2014) reveal that green product and price are connected to brand trust.
However, they argue that green price is negatively associated with trust. The authors reason
that consumers automatically connect green products to higher prices ignoring the larger value
implemented in the product, which results in a decrease of trust. Additionally, green place and
promotion are not related to brand trust, which ends up with the two following hypotheses:

17
Hypothesis 6: Green product is positively related to brand trust.
Hypothesis 7: Green price is negatively related to brand trust.
Davari & Strutton (2014) state that only green product and place have an influence on the
perceived brand quality. Whereas green price and green promotion did not result significant in
relation to perceived brand quality, which ends up with the two following hypotheses:
Hypothesis 8: Green product is positively related to perceived brand quality.
Hypothesis 9: Green place is positively related to perceived brand quality.
Figure 1: Theoretical model based on the study of Davari & Strutton (2014)

18
3 Methodology
This chapter justifies the methodology chosen for the study. The different choices were made
so that the purpose of the study can be answered. The concepts in focus include research
design, method for data collection, operationalization table, sampling, validity, reliability and
at the end ethical considerations are presented.
3.1 Research approach
The research approach is a broad outline of how to conduct the research, which involves several
aspects as the philosophical perspective, the research design that is connected to that belief and
the different methods that enable such a study (Creswell, 2014).
3.1.1 Deductive research
In order to connect theory and empirical data there are two different research approaches
namely deductive and inductive research as stated by Bryman & Bell (2011). The difference
of a deductive and inductive approach lies in the philosophical belief and the way of gaining
knowledge (Bryman & Bell, 2011). A deductive research aims to test theory, by formulating
hypotheses based on the theory, which are tested later through the collection of data. This
allows researchers to reject or approve the hypotheses and hence modify the theory.
Furthermore, deductive research follows a structured nature in order to ensure future
researchers to replicate the study and further test the theory (Bryman & Bell, 2011; Greener,
2008; Saunders, Lewis & Thornhill, 2009). On the other hand, inductive research leads the
researcher to collect data and afterwards create a theory based on the analyzed results from that
data (Bryman & Bell, 2011; Saunders, Lewis & Thornhill, 2009).
The research problem of the study leads the researcher to take in a specific philosophical
orientation (Creswell, 2014). Therefore the logic of the research answers the question if a study
should be conducted in a deductive or inductive way (Collis & Hussey, 2009). Since this study
is a replication of a previous study, the research originates from existing theory. Therefore, the
aim of this research is not to create theory, instead it is to further test theory, which makes a
deductive research the most suitable approach.

19
3.1.2 Quantitative research
Knowing which philosophical orientation the study takes is not enough in order to realize the
research (Creswell, 2014). Hence, quantitative and qualitative research methods are part of the
research approach. Collis & Hussey (2009) explain that both quantitative and qualitative
research approaches constitute the process of collecting and analyzing data. However, both
approaches exhibit opposite characteristics in terms of that qualitative research uses words and
open-ended questions rather than numbers and closed-ended questions as in the quantitative
approach (Creswell, 2014; Bryman & Bell, 2011). Creswell (2014) explains quantitative
research as an approach which measures the relationship between variables through numerical
data in order to test theories. Whereas qualitative research explores the meanings that each
human being or groups of persons assign to a social thing (Creswell, 2014). Even though it is
rare, it is possible to relate an inductive approach to a quantitative research and also a
qualitative research to a deductive approach (Greener, 2008; Bryman & Bell, 2011). However,
both Bryman & Bell (2008) and Greener (2008) argue that quantitative research is most often
used within a deductive approach in order to test theory with measurable data, whereas
qualitative research is connected to an inductive approach which seeks to construct theory.
In the former chapter the philosophical nature of this thesis was explained, where it departs
from a deductive approach. The purpose of this thesis implies theory as a foundation of research
in order to break down the theory into measurable hypotheses which test then the relationship
between green marketing mix and consumer-based brand equity. Thus the testing of hypotheses
require the collection of numerical data in order to verify or falsify them. Therefore a
quantitative approach is most suitable for this thesis.
3.2 Research Design
Malhotra & Birks (2006) state that with the appropriate research design, the task can be realized
more efficiently. According to Collis & Hussey (2009) the research design answers the
question why the research is executed. The authors further argue that the purpose of the study
is the determinant for the most convenient research design. Pursuant to Bryman & Bell (2011)
there are three different types of approaches namely exploratory, descriptive and explanatory.
The exploratory study is conducted when the topic of issue has not been studied that much
before, so there is not much knowledge about it and thus new discoveries are needed. It deals
20
with the question of “what” (Neuman, 2003). Bryman and Bell (2011) explain that an
exploratory nature is preferable in a qualitative research, since it is not associated with the
testing of theory instead the researcher engages more with individuals in order to explore
something. On the other hand, the descriptive research design is used to describe a phenomena
(Collis & Hussey, 2009). It is more specific than the exploratory research, having its foundation
on a precise issue in order to focus on generating information around this certain problem area
in order to specify the particular issue. The research design seeks to answer the question of
“how” and “who” (Collis & Hussey, 2009; Neuman, 2003). The descriptive research design is
often used in a quantitative research (Bryman & Bell, 2011). Finally, the explanatory study is
characterized as being an extension of the descriptive and therefore also exploratory research.
The reason “why” something occurs is investigated which implies that the research problem
must be well-known in order to further examine it. The explanatory design seeks to focus on
the relationships among different variables and identify the reason for the connection (Collis
& Hussey, 2009; Neuman, 2003).
Since this research is replicating a previous study and therefore founded upon existing theory,
an exploratory research design can be excluded from the beginning. However, there is still the
need to clarify if a descriptive or explanatory research is more appropriate. Hence this research
will explain the relationship between the independent and dependent variables, an explanatory
research design was considered to be the most convenient.
3.3 Data sources
Data can be divided in two categories, primary and secondary data (Saunders, Lewis &
Thornhill, 2009). The data that is collected explicitly for the sole purpose of research by the
authors is termed as the primary data, while secondary data is a form of data that is easily
accessible to the public (Zikmund et al., 2010). The use of secondary data was gathered during
this study in order to conduct the literature review, which was crucial in constructing the
theoretical framework. The primary data was used in order to collect information to the specific
purpose of this study. This notion is argued by the author Saunders, Lewis & Thornhill, (2009),
as the main objective of primary data is always connected with the collection of data that relates
to a very specific purpose. The primary data is argued to include various methods in the
collection of data including surveys, observations, interviews etc (Saunders, Lewis &
Thornhill, 2009). The authors of this research incorporated the primary data to observe the

21
deeper insights from the respondents related to the impact of the selected green marketing mix
elements on the brand equity, as previously discussed in the paper.
3.4 Data collection method
According to Bryman & Bell (2011) there exist different research methods for the collection
of data. Given that a quantitative approach was chosen, several methods are automatically
removed as an option. Therefore four methods are left, namely structured interview, as well as
observation, content analysis and survey questionnaire (Bryman & Bell, 2011). The content
analysis is an approach more of the nature of studying documents and newspapers rather than
a tool for generating data, therefore it drops out as a viable method for this study. The structured
observation is hard to apply in the context of this paper which is why it falls away as well. In a
direct comparison between the survey questionnaire and the structured interview, the former
mentioned turns out to take much more time to administer, it implies interviewer effects which
can generate a negative impact and lead to biases, and it is also less convenient for the
respondents. Besides these mentioned points, which already deliver good reasons to choose
survey questionnaire instead of structured interview, there is another significant aspect to take
into consideration. The most important point for the decision to conduct a questionnaire is, that
the survey allows to collect a big sample in a short time whereas the structured interview needs
more time in case that a large sample is aimed. Given that the time frame for this study is short,
the survey questionnaire turns out to be most convenient.
3.5 Data collection instrument
3.5.1 Operationalization
In order to formulate the concepts of green marketing mix and consumer-based brand equity,
an operationalization must be constructed where the theory is broken down into measurable
terms. Four dimensions of the consumer-based brand equity construct are used as the dependent
variables. The independent variables are represented by the four green marketing mix elements.

22
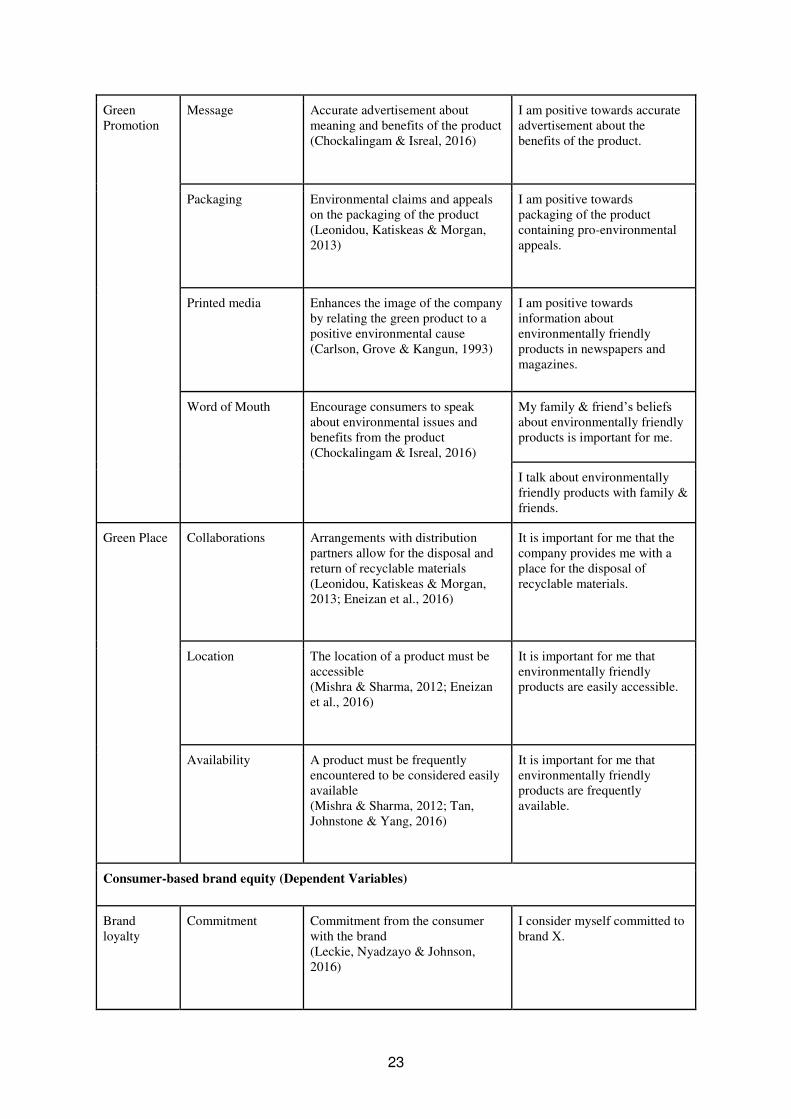
Table 1: Operationalization
Green marketing mix (Independent Variables)
Green Product
Environmentally-friendly attributes
Lasting and non-toxic attributes in a product are of significance in order to reduce environmental pollution and waste (Kinoti, 2011; Leonidou, Katsikeas & Morgan, 2013).
I prefer products that have a long product life.
I prefer products that are non-toxic.
Manufacturing process
Sustainable raw materials as well as recyclable materials are used for the fabrication process (Kinoti, 2011; Tan, Johnstone & Yang 2016)
I prefer products that are manufactured using recyclable materials.
Packaging Reduced amount of packaging material is used to make the product more environmentally-friendly (Kinoti, 2011; Leonidou, Katsikeas & Morgan, 2013)
I prefer products with reduced amount of packaging.
Labelling Clear, outstanding & trustworthy information about environmental qualities of the product (Rex & Baumann, 2007; Chockalingam & Isreal, 2016)
I prefer products where the label makes the qualities of the product stand out.
I prefer products where the label contains certification from a trustworthy organisation.
Green Price Premium price Green products are more expensive than non-green alternatives (Kinoti, 2011; Eneizan et al., 2016)
I am willing to pay a higher price for environmentally friendly products.
Valuable attributes Price for green products is reasonable, whereas price of conventional products is too low because environmental aspects are ignored (Kinoti, 2011; Eneizan et al., 2016)
I believe a premium price for environmentally friendly products is justified by the additional value they give.
Desirable option Receiving a rebate for returning the recyclable packaging of the product (Leonidou, Katiskeas & Morgan, 2013)
I am willing to pay a higher price if I receive a discount for returning the recyclable packaging.
23
Green Promotion
Message Accurate advertisement about meaning and benefits of the product (Chockalingam & Isreal, 2016)
I am positive towards accurate advertisement about the benefits of the product.
Packaging Environmental claims and appeals on the packaging of the product (Leonidou, Katiskeas & Morgan, 2013)
I am positive towards packaging of the product containing pro-environmental appeals.
Printed media Enhances the image of the company by relating the green product to a positive environmental cause (Carlson, Grove & Kangun, 1993)
I am positive towards information about environmentally friendly products in newspapers and magazines.
Word of Mouth Encourage consumers to speak about environmental issues and benefits from the product (Chockalingam & Isreal, 2016)
My family & friend’s beliefs about environmentally friendly products is important for me.
I talk about environmentally friendly products with family & friends.
Green Place Collaborations Arrangements with distribution partners allow for the disposal and return of recyclable materials (Leonidou, Katiskeas & Morgan, 2013; Eneizan et al., 2016)
It is important for me that the company provides me with a place for the disposal of recyclable materials.
Location The location of a product must be accessible (Mishra & Sharma, 2012; Eneizan et al., 2016)
It is important for me that environmentally friendly products are easily accessible.
Availability A product must be frequently encountered to be considered easily available (Mishra & Sharma, 2012; Tan, Johnstone & Yang, 2016)
It is important for me that environmentally friendly products are frequently available.
Consumer-based brand equity (Dependent Variables)
Brand loyalty
Commitment Commitment from the consumer with the brand (Leckie, Nyadzayo & Johnson, 2016)
I consider myself committed to brand X.
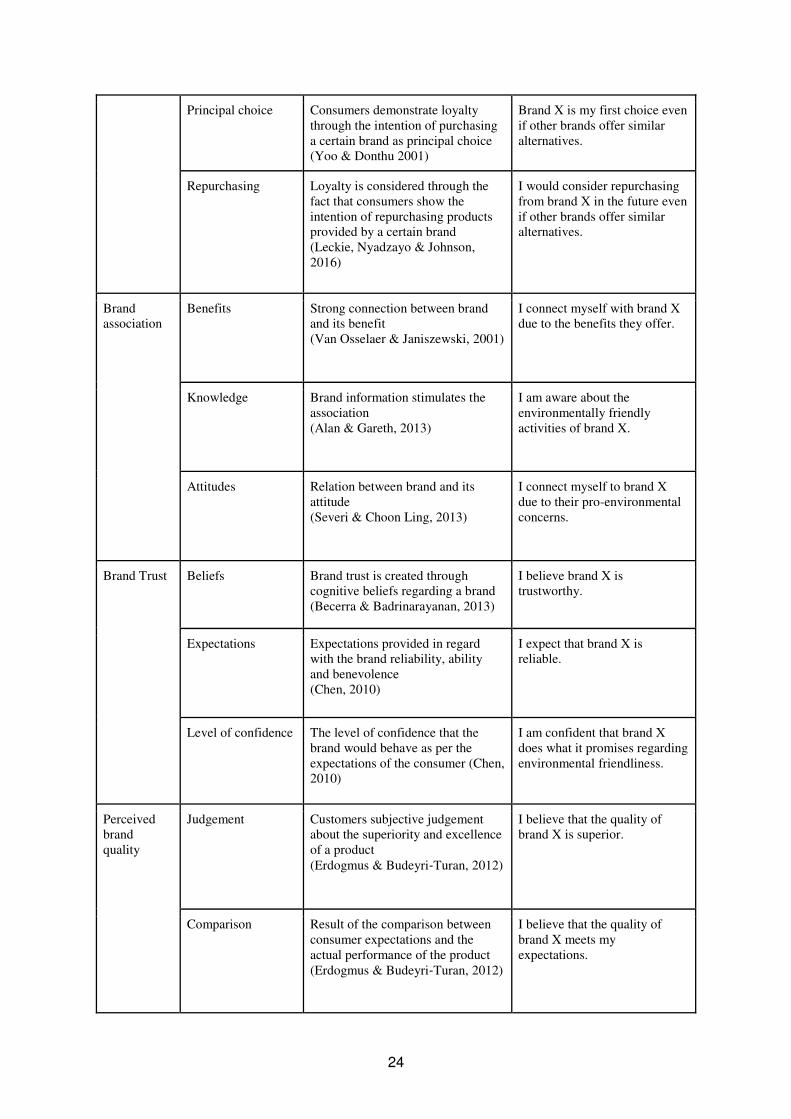
24
Principal choice Consumers demonstrate loyalty through the intention of purchasing a certain brand as principal choice (Yoo & Donthu 2001)
Brand X is my first choice even if other brands offer similar alternatives.
Repurchasing Loyalty is considered through the fact that consumers show the intention of repurchasing products provided by a certain brand (Leckie, Nyadzayo & Johnson, 2016)
I would consider repurchasing from brand X in the future even if other brands offer similar alternatives.
Brand association
Benefits Strong connection between brand and its benefit (Van Osselaer & Janiszewski, 2001)
I connect myself with brand X due to the benefits they offer.
Knowledge Brand information stimulates the association (Alan & Gareth, 2013)
I am aware about the environmentally friendly activities of brand X.
Attitudes Relation between brand and its attitude (Severi & Choon Ling, 2013)
I connect myself to brand X due to their pro-environmental concerns.
Brand Trust Beliefs Brand trust is created through cognitive beliefs regarding a brand (Becerra & Badrinarayanan, 2013)
I believe brand X is trustworthy.
Expectations Expectations provided in regard with the brand reliability, ability and benevolence (Chen, 2010)
I expect that brand X is reliable.
Level of confidence The level of confidence that the brand would behave as per the expectations of the consumer (Chen, 2010)
I am confident that brand X does what it promises regarding environmental friendliness.
Perceived brand quality
Judgement Customers subjective judgement about the superiority and excellence of a product (Erdogmus & Budeyri‐Turan, 2012)
I believe that the quality of brand X is superior.
Comparison Result of the comparison between consumer expectations and the actual performance of the product (Erdogmus & Budeyri‐Turan, 2012)
I believe that the quality of brand X meets my expectations.

25
Brand name The name of a brand influences consumers perceptions (Rao & Monroe, 1989)
I believe that the name of brand X makes me perceive it as high quality.
3.5.2 Questionnaire design
The authors Bryman & Bell (2011) argue that the data collection could vary considering the
research strategy survey. There are two main types of data collection methods, one being the
offline survey which includes pen and paper, in person or a telephone. The other method is the
online survey which focuses on online mediums or email. According to Singh et al., (2009)
due to the advancement in the web-building tools as well as the developing acceptance for the
online surveys from the respondents, the researchers prefer online surveys for the scientific
research over the traditional form of offline surveys.
The key advantages of an online questionnaire could be outlined as its user-friendliness, the
security measures and the intuitive system that makes the complex procedure of compiling the
results in a more easier and effective way. The analysis of the numeric data that is produced by
the online survey, makes it manageable for the researchers to present the high-level of validity
(Kalucy et al., 2008). The authors Kalucy et al., (2008) further argue the disadvantages of
utilizing online surveys is having no power and possibility to overcome the complexity if the
respondent fails to understand the question, as the researcher has no form of communication
with the respondent.
Based on the aforementioned arguments the researchers utilized an online form of survey and
developed an online questionnaire, in order to collect the specific empirical data which would
beneficial in achieving the purpose of this particular study. As this study is directed towards
the Generation Y sample, which are mainly considered to have access to the internet, Google
Forms was made use of in forming the online questionnaire, based on its user-friendliness and
ease to the respondents. While designing the questionnaire control variables are included at the
beginning of the questionnaire, in order to limit the research to only the generation Y sample
and the context of this study, which in this case is Sweden. Also between the questions related
to the independent and dependent variables, an additional control variable was placed, making

26
respondents think about a brand X in order to correctly fulfill the following questions regarding
consumer-based brand equity.
The questionnaire for this specific research was designed using the Likert scale, the authors
Malhotra & Birks (2006) explains the likert scale as a scale that allows the respondents to
indicate the intensity of compliance with the series of questions or statements provided.
According to (Dawes, 2008) the literature about the likert scale essentially portrays between a
5 or 7 point formats of the likert scale, where the 5-point scale compared to the 7-point is
considered fairly straightforward with the range of scale descriptors. The 5-point scale is
usually constructed ranging between strongly disagree, disagree, neither disagree nor agree,
agree, strongly agree (Dawes, 2008). Taking into consideration the ease and fairness of the 5-
point likert scale, the authors of this research proceeded with incorporating the 5-point likert
scale in the designed questionnaire.
3.5.3 Pretesting
The authors Bryman & Bell (2011) stresses on the construction of a pre-test before the
collection of the relevant empirical data for the research. Hilton (2017) elaborates on the
complexities that could arise with the questionnaire design, where the respondents frequently
misinterpret the questions as this complication has been steadily observed in the past. The
author further explains the concept of pretesting as a tool to investigate that the questions are
being well understood among the respondents of the survey. This very method is considered
adequate to diminish any sampling errors and increment in the questionnaire response rate
(Hilton, 2017).
The first step of the pretesting involved the feedback from an expert in this specific theoretical
field, where the researchers went through every single question and adjusted and structured as
per the advice of the expert. The second phase of pre-test procedure was applied on fifteen
respondents, and was put in line with the author Bolton (1991) arguments, where the
questionnaire was pretested for the appropriate vocabulary, the order how the questions were
presented, the interest of the respondent and well being of the respondent. The time and the
skip patterns were also observed during the pretest method. The respondents were instructed
to think out loud (Foddy, 1993) while they were asked to complete the questionnaire. After the
feedback from the respondents the questionnaire was put through revision again, resulting in
the correction of linguistic and structural aspects of the questions.

27
3.6 Sampling
When doing an extension study, Berthon et al. (2002) argue that researcher are allowed to
change the context of the study in order to extend the previous research. McNeill & Moore
(2015) describe the phenomena of the attitude-behavior gap within the fashion industry. This
leads the authors of this thesis to change the context of the previous study from Davari &
Strutton (2014) from the food industry to the fashion industry. Furthermore, in the previous
study the data was collected within the United States, whereas Sweden is selected to be the
context of this specific research due to its increasing competitive industry. Additionally, the
country has been observed to have developed globally successful fashion retailers and
producers. The swedish fashion industry is perceived to be one of the strongest industry and
the most powerful industry within sweden, with its turnover of 11 billion US Dollars in 2016
(Lee-Youn & Ostberg, 2013). Furthermore, this research will be conducted on the Swedish
Generation Y population. The term population according to Saunders, Lewis & Thornhill,
(2009) is not used in its real meaning, where they elaborate the term as the full set of cases or
elements. The authors Lee and Lings (2008) define the term population as the one towards
which the researchers wish to generalise the results. The researchers of this thesis found the
Swedish Generation Y as the most relevant population for this specific study, as it is argued
that this specific population results as an important target audience when it comes to retailers
and the consumer product companies, considering the significance of the size and buying power
of Generation Y (Parment, 2013; Valentine & Powers, 2013). Generation Y according to
Brown (2017) also known as millennials are perceived to be born between the year 1982 and
somewhere in the early 2000. The Generation Y is observed to be supportive towards the social
causes as well as the social responsible companies, as they are inclined towards purchasing the
products offered and the social message from the company (Brown, 2017; Valentine & Powers,
2013).
Since the population of this research is considered to be fairly large, it is rather difficult to
gather the exact figures of individuals for this population. Considering the size of the
population, certain limitations were put in order and a sample was thus considered as the
representation of the population. Bryman & Bell (2011) explain the term sampling as the
portion of the population that is being selected for the examination, which in other words mean
a subdivision of a population. As argued by Saunders, Lewis & Thornhill, (2009) an approach
for the researchers to gather the data from an entire set of population with a manageable size -

28
census, however it is not deemed to provide better results than collection of data through a
sample which represents the population.
3.6.1 Sampling frame
According to the authors Bryman & Bell (2011) the concept is explained as listing complete
units within the population from which the sample is chosen. The authors Saunders, Lewis &
Thornhill, (2009) argue that if the sampling frame is missing, the approach towards selecting a
probability sample is unattainable. Due to time and cost constraints, the authors of this research
can not attain a sampling frame, which leads them to utilize the non-probability sampling. The
author further elaborates that within the context of business research due to the lack of sampling
frame, the sample must be selected through a different approach. The authors of this thesis
research opted the non-probability sampling, which provides different dimensions and
alternatives in order to select a sample (Saunders, Lewis & Thornhill, 2009).
3.6.2 Sample selection
The convenience sampling procedure was applied to gather the sample for this study. A
convenience sample consists of people which are available for the researcher because it is
effortless to access them (Bryman & Bell, 2011). Another aspect was kept in mind as,
convenience sampling is the highest pertinent method utilized for non-probability sampling.
Thus, the medium of social media named Facebook was used in order to create a sample of
respondents because the procedure is uncomplicated. Additionally, it is a quite straightforward
process because the authors of this thesis themselves form part of the Swedish Generation Y
and therefore their friends and other connections on Facebook will most probably also make
part of it. Thus it is a simple way of achieving responses from people belonging to the
population.
Regarding the sample size there are no clear guidelines about what makes a sample statistically
justified. However, the bigger the sample size the more it represents the population (Bryman
& Bell, 2011). Despite of that fact, there are different factors to take into consideration when
selecting a sample size, as the nature of research, the number of variables, the sample size of
similar studies, or the resource constraints that the researcher faces (Bryman & Bell, 2011).
The decision of conducting a non-probability and convenience sampling technique was
influenced by time and cost aspects, therefore the sample size is influenced the same way. By
using the rule of thumb (n>50+8m), where “n” stand for the sample size and “m” stands for the
29
number of independent variables (Green, 1991) the authors of this thesis calculated a minimum
sample size of 82. Therefore, this study collected answers from 127 respondents.
3.7 Data analysis method
3.7.2 Descriptive statistics
Descriptive statistics are used to summarize and characterize data in order to compare and
describe variables from a numerical perspective (Zikmund et al., 2010; Saunders, Lewis &
Thornhill, 2009). Therefore two measures namely the central tendency and the dispersion are
used to describe data (Saunders, Lewis & Thornhill, 2009). The central tendency is thereby
usually expressed in terms of mean, median and mode showing the distribution of values. The
mean represents the average value, whereas the median shows the middle value in a distribution
of points, while the mode is the value that appears most regularly (Bryman & Bell, 2011;
Saunders, Lewis & Thornhill, 2009). The dispersion serves as to display how the data is spread
around the central tendency and can be measured with both the inter-quartile range or the
standard deviation. The inter-quartile range includes a range between an upper and a lower
quartile and the data is equal to the difference of that range (Saunders, Lewis & Thornhill,
2009). The standard deviation is the number of variation around the mean expressed as an
average value (Bryman & Bell, 2011). Furthermore, in order to evaluate the shape of
distribution of the data, the skewness and kurtosis are used, where one should aim for a normal
distribution (Hair et al., 2010). Whereas skewness represents the symmetry within the
distribution, kurtosis demonstrates if the shape of the distribution is peaked or flat.
The skewness normally ranges from -1 to +1, where a negative value shows that the data is left
skewed and a positive value demonstrates that the data is right skewed. The kurtosis regularly
ranges from -3 to +3, where values outside this range are considered as extreme and therefore
not normally distributed. Concerning the kurtosis, negative values imply a flatter distribution
and thus fewer outliers. Hence positive values demonstrate a more peaked distribution which
implies more extreme outliers. Hence, for both skewness and kurtosis values close to zero
represent a normal distribution (Hair et al., 2010).
30
3.7.3 Correlation analysis
In order to assess the relationship between variables, the correlation analysis is used (Zikmund
et al., 2010). This procedure is realized through measuring the Pearson correlation coefficient,
which stands for the strength of the relationship between variables (Bryman & Bell, 2011) The
correlation ranges from 0 to 1, where 0 means no relationship and 1 means a perfect correlation.
Furthermore, the pearson correlation coefficient can also result in a negative value, which in
that case indicates a negative relationship between the variables (Bryman & Bell, 2011).
However, a correlation coefficient of less than 0.3 is regarded as weak, whereas one above 0.9
is considered as extremely high. Therefore, a correlation between 0.3 and 0.9 demonstrates a
moderate relationship (Dancey & Reidy, 2004).
3.7.4 Regression analysis
Regression analysis is employed to evaluate the relationship between the independent and the
dependent variables (Bryman & Bell, 2011). In other words, regression analysis simply
measures the alteration of a dependent variable after changing the value of an independent
variable. The bigger the size of the change, the more significant are the dependent and the
independent variable in its relationship. According to Saunders, Lewis & Thornhill, (2009) a
multiple linear regression is conducted in case that there are several independent variables. The
linear regression, denoted as R-square, shows how much of the variation of the dependent
variable is explained by the independent variable (Malhotra and Birks, 2007; Zikmund et al.,
2009). The values range from -1 to +1, where 1 means that the independent variable fully
explains the variation of the dependent variable. The Beta value, is another measure of the
linear regression, which represents how a change in the independent variable affects the
dependent variable. Values above zero show a positive relationship whereas values below zero
stand for a negative relationship (Bryman & Bell, 2011). However, Hair et al. (2011) explains
that the R-squared values have to be reliable. In doing so, the statistical significance level 95%
is employed, which implies p<0.005, otherwise the hypothesis must be rejected (Bryman &
Bell, 2011; Hair et al. 2011).
3.8 Quality criteria
The authors Saunders, Lewis & Thornhill, 2009; Bryman & Bell (2011) argue that the
reliability and validity are the two quality criteria that are needed to be put in place, while
conducting a research. Both these quality criterions are needed to be considered in a
31
quantitative research, while collecting the empirical data necessary for the research (Bryman
& Bell, 2011). The validity and reliability criterions will be further presented and elaborated in
the sub-chapters below, as to how the researchers of this thesis approached and assessed the
quality criteria necessary for this quantitative study.
3.8.1 Content validity
According to the authors Rubio et al., (2003), the term content validity could be explained as
the amount to which the elements on a measure assess the equivalent content or how strong the
material of the content was sampled within the measure. Where the elements in this specific
case could be observed as, everything that could cause an impact to the data. The authors
(Sireci, 1998) elaborate the importance of the elements and tasks comprising of the test are able
to represent the intended content domain, in order to validate the test for a specific testing
purpose. The authors Rubio et al., (2003) further argue as, the content validity could be
characterized as logical and the face validity. Where face validity illustrates as the measure
appears as being valid, and the logical validity includes experts in the field of study gauging
the content validity of the measure (Rubio et al., 2003).
The content validity approach provides the researchers with the insight about the clarity and
representation of each element, and the experts evaluation of the elements provides the means
of improving the measure, hence the revised measure could then be utilized in the pilot study
(Rubio et al., 2003; Sireci, 1998). During this research the authors went through consultation
process with an expert in the field, the expert then evaluated the questionnaire and the elements
utilized in order to review the content validity, before it was sent out to the respondents to
collect the primary data.
3.8.2 Construct validity
The term construct validity is being described as the measure of the operationalisation of the
research concept, on how in depth and to which extent it measures the concept (Bagozzi et al.,
1991). The authors Bagozzi et al., (1991) further stress on the importance of construct validity
as, without the assessment of construct validity the researcher may thus reject or could be
accept the hypothesis on the basis of excessive error in measuring the data, and not depending
on the basis of theory utilized. Bryman & Bell (2011) argue correlation as the approach of
measuring the construct validity.

32
The correlation between the two measured variables is usually estimated with the help of
Pearson correlation coefficient, where the degree of the estimate depicts how vigorous the
relation is between the two variables (Bryman & Bell 2011; Wiedermann & Hagmann, 2016).
Bryman & Bell (2011) explain as the value of the pearson correlation coefficient lies between
0 to 1, which could be denoted as the strength of relationship between the two variables. Where
the 0 means no relationship and 1 meaning a perfect relationship. The authors further explain
as closer the coefficient value is to 1 portrays the strong relationship, while if it is observed to
closer to 0 it is observed as a weak relationship. The Pearson correlation coefficient could also
result as positive or negative value, which merely illustrates a negative or positive relationship
between the variables (Bryman & Bell, 2011).
However considering the literature (Dancey & Reidy, 2004) for this specific research, the
Pearson correlation coefficient for the sake of significance should lie between 0.3 to 0.9, as a
value more than 0.9 would result in an extremely high similarity and 0.3 would compute a
highly weak relationship between the variables.
3.8.3 Criterion validity
The term criterion validity denotes the ability of the questions in the developed questionnaire
to produce definite predictions, meaning the questionnaire performs in a way it was expected
to perform (Saunders, Lewis & Thornhill, 2009). The authors Bryman & Bell (2011) divide the
concept into two sub validity concepts namely, concurrent and predictive validity. The
concurrent validity stands for, as to how far the operationalisation of the research could make
predictions of the expected constructs, while the predictive validity explains where researcher
utilizes the future criterion (Bryman & Bell, 2011). This thesis focuses on the concurrent
validity aspect, where the questions have been put to evaluation for their credible nature and
being in context with the concurrent theory, therefore the criterion validity has been established
for this specific research.
3.8.4 Reliability
According to Saunders, Lewis & Thornhill, (2009), reliability can be explained if the researcher
is able to gather the same findings if the research design is to be replicated. Hence the findings
produced are being consistent and are replicable in nature, if the research is being executed in
a distinct time frame or being duplicated by some other researcher (Saunders, Lewis &
Thornhill, 2009). The authors Hendrickson et al., (1993) argue that the reliability could be
33
observed by examining the test of internal consistency, replication of the research incorporating
different samples and the test and retest procedure of the same sample. Where the test and retest
procedure checks for consistency with the same sample with changes and various
administration in the instrument, that could be changes in the indicators and the items of
variables utilized for the research.
When a multiple-item instrument is being constructed to grasp the underlying concept, an
approach that is widely being used for the research purposes to examine the reliability is a
statistic measurement called Cronbach’s alpha (Kopalle & Lehmann, 1997). The concept
measures the consistency between the responses generated from the questionnaire that are put
together to form a scale in order to measure a precise concept (Bryman & Bell; Saunders, Lewis
& Thornhill, 2009). The value of the coefficient alpha or Cronbach’s alpha ranges from the
value between 0 to 1, where the value 0 means no correlation between the items meaning no
reliability and 1 meaning high correlation and perfect reliability (Bryman & Bell; Saunders,
Lewis & Thornhill, 2009). Though it is observed that many researchers argued in the previous
literatures for the reliable alpha value generated measuring cronbach’s alpha, the lowest value
of 0.65 is considered adequate for the research purposes (Kopalle & Lehmann, 1997). Taking
that into consideration, the researchers considered the lowest value of cronbach’s alpha to be
0.65 for this research.
3.9 Ethical considerations
The authors Saunders, Lewis & Thornhill (2009) explain how the ethical concerns are
developed during the design and construct of the research, while getting in contact with the
individuals in order to manage and report the required data. These concerns include the consent
and privacy of the respondents, harm to the individuals participating, any form of deception
how the researchers present the study to the participants, making sure that the participants of
the research have the full liberty to choose if they wish be part of the research or otherwise and
lastly handling of the gathered data (Bryman & Bell 2011; Saunders, Lewis & Thornhill, 2009).
Ethical concerns are of a very sensitive nature and it is the researcher's task to establish that the
study is conducted in the best possible way, assuring all the ethical guidelines are followed
Saunders, Lewis & Thornhill, (2009).

34
During this specific research the questionnaire developed was posted and personally messaged
to the participants using Facebook and Email, along with a small introduction about the nature
of the research. Any response that resulted in an answer was viewed from the consent point as
not every individual answered the questionnaire sent out. The researchers made sure that the
anonymity and privacy of the respondents were remain intact as well as it was made sure the
data gathered for the research would solely be used for research purposes. It was made sure
that the participants are presented with a short and effective background of the study, in order
to clear out any deceptive element regarding the research. Lastly the participants were
motivated to give feedbacks if they found the questionnaire easy to understand as well as to
identify any of the elements in the study make crosses their comfort.

35
4 Results
This chapter will present the findings which were calculated through the statistical programme
SPSS and put into tables in order to describe them logically. Hence the results are presented
in terms of descriptive statistics, reliability, validity and multiple regression testing. This
research collected answers from 127 respondents. However, some respondents had to be
removed from the actual sample because they did not fulfil the requirements of the control
questions. Therefore the final sample size contains 119 respondents.
4.1 Descriptive statistics
Table 2: Descriptive statistics
Minimum Maximum Mean Std. Deviation Skewness Kurtosis
Product1 1 5 4,40 0,785 -1,494 2,781
Product2 1 5 4,30 0,935 -1,592 2,656
Product3 1 5 3,70 0,926 -0,206 -0,205
Product4 1 5 3,79 0,929 -0,084 -0,760
Product5 1 5 3,71 0,967 -0,426 -0,239
Product6 1 5 3,99 0,916 -0,724 0,429
Price1 1 5 3,46 0,990 -0,400 -0,191
Price2 1 5 3,61 0,940 -0,584 0,202
Price3 1 5 3,94 0,959 -0,643 -0,222
Promotion1 1 5 4,08 0,819 -0,816 0,927
Promotion2 2 5 4,03 0,727 -0,188 -0,675
Promotion3 1 5 3,87 0,892 -0,775 0,755

36
Promotion4 1 5 3,24 1,010 -0,140 -0,234
Promotion5 1 5 3,03 1,205 -0,036 -0,868
Place1 1 5 3,65 0,946 -0,235 -0,277
Place2 2 5 3,98 0,837 -0,324 -0,725
Place3 2 5 3,96 0,855 -0,423 -0,515
Loyalty1 1 5 3,25 1,062 -0,334 -0,246
Loyalty2 1 5 3,03 1,121 -0,051 -0,869
Loyalty3 1 5 3,47 1,052 -0,492 -0,020
Association1 1 5 3,38 1,029 -0,153 -0,478
Association2 1 5 3,23 1,143 -0,287 -0,675
Association3 1 5 2,92 1,095 0,074 -0,404
Trust1 1 5 3,55 1,034 -0,468 -0,300
Trust2 1 5 3,64 1,017 -0,673 -0,033
Trust3 1 5 3,42 1,105 -0,210 -0,678
Quality1 1 5 3,24 1,130 -0,084 -0,636
Quality2 1 5 3,78 0,926 -0,663 0,293
Quality3 1 5 3,14 1,056 -0,028 -0,485
Table 2 shows information regarding descriptive statistics for each question of the survey.
Thereby each variable of the theoretical model of this study is displayed on the first column of
table 2. Between 3 and 6 questions were asked for each of the different variables. The
questionnaire was based on a likert scale with the ratio 1 to 5, 1 representing the lowest answer

37
and 5 representing the highest answer. Therefore the column named minimum shows always
the lowest answer of all respondents regarding that question, whereas the next column called
maximum presents the highest answer of all respondents concerning that question.
The next column displays the mean, which represents the average of the answers. For almost
all questions the mean ranges between 3 and 4. Just within the dimension of product and
promotion there are means above 4 and within the dimension of association there exists one
mean below 3. Looking at the next column, the standard deviation is displayed, which explains
the degree of variation of the answer from the mean. In this results the standard deviation ranges
from the lowest 0.727 to the highest 1.205.
The last two columns represent the skewness and kurtosis. In order to get regularly distributed
responses the skewness and kurtosis should be within the range of -1 to +1 and the kurtosis
should be within the range of -3 to +3. Regarding the skewness, just two questions of product
lie below -1, which can be explained by the extremely high means regarding those questions.
However, the values for skewness are not extreme thus it implies a normal distribution.
Regarding the kurtosis, all responses lie between the range, hence the results are regularly
distributed.
4.2 Reliability
Table 3: Cronbach’s alpha
Cronbach's alpha Items
Product 0,703 6
Price 0,747 3
Promotion 0,654 5
Place 0,764 3
Loyalty 0,857 3
Association 0,702 3
Trust 0,917 3
Quality 0,837 3

38
To be able to measure the reliability of the questions developed, the Cronbach’s alpha was
calculated so that the internal consistency of the questions can be ensured. In other words,
whether the questions measure the same concept or not. As shown in the table 3 the column to
the left represents each concept, both independent and dependent variables. In the middle
column the cronbach’s alpha is represented and the column to the right shows the number of
items, in this case questions, were included in each variable. As described earlier the value of
cronbach’s alpha ranges between 0 to 1, where 0 represents no reliability and 1 denotes perfect
reliability (Bryman & Bell, 2011). Thus the lowest value of 0.65 is considered adequate for
this specific research (Kopalle & Lehmann, 1997). An example could be observed from the
table 3, where the Cronbach’s alpha for product is 0.703, which is greater than the lowest
adequate value for this research. Since all the values measured surpass the minimum value of
alpha regarded for this research, hence deemed reliable.
4.3 Validity
Table 4: Pearson’s Correlation Coefficient
Pearson's
Correlation
Coefficient
Product Price Promotion Place
Product 1 0,524 0,624 0,531
Price 0,524 1 0,522 0,331
Promotion 0,624 0,522 1 0,524
Place 0,531 0,331 0,524 1
To be able to assess the construct validity the Pearson’s correlation coefficient was calculated.
As seen from the values presented in the table 4 above, a positive correlation could be observed
between the four variables and measuring above the significant level of 0.01 in every presented
value. The positive correlation meaning the positive relationship between the two variables.
Taking an example from the table 4, the correlation coefficient between the product and price
is 0.524 at a significance level of 0.01 , which depicts a positive relationship between product
and price, concluding that if there is an increment in the notion of product, the notion of price
would also increase. As according to Bryman & Bell, (2011), the closer the coefficient value
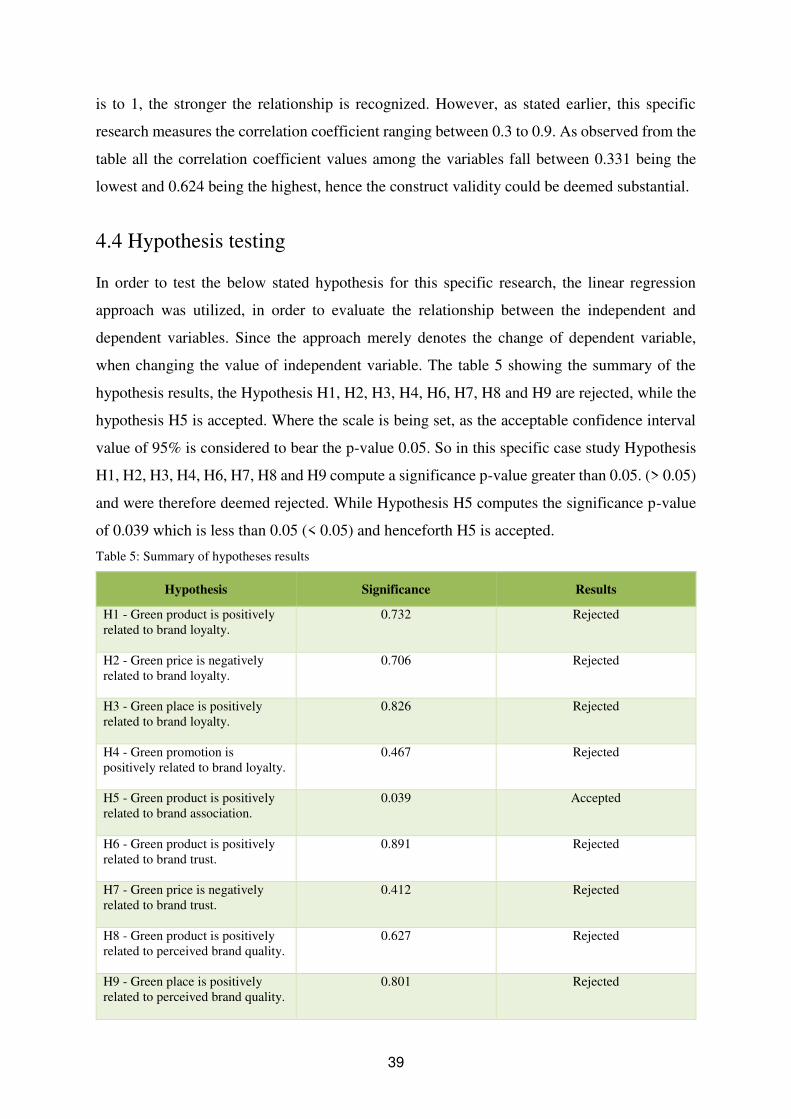
39
is to 1, the stronger the relationship is recognized. However, as stated earlier, this specific
research measures the correlation coefficient ranging between 0.3 to 0.9. As observed from the
table all the correlation coefficient values among the variables fall between 0.331 being the
lowest and 0.624 being the highest, hence the construct validity could be deemed substantial.
4.4 Hypothesis testing
In order to test the below stated hypothesis for this specific research, the linear regression
approach was utilized, in order to evaluate the relationship between the independent and
dependent variables. Since the approach merely denotes the change of dependent variable,
when changing the value of independent variable. The table 5 showing the summary of the
hypothesis results, the Hypothesis H1, H2, H3, H4, H6, H7, H8 and H9 are rejected, while the
hypothesis H5 is accepted. Where the scale is being set, as the acceptable confidence interval
value of 95% is considered to bear the p-value 0.05. So in this specific case study Hypothesis
H1, H2, H3, H4, H6, H7, H8 and H9 compute a significance p-value greater than 0.05. (> 0.05)
and were therefore deemed rejected. While Hypothesis H5 computes the significance p-value
of 0.039 which is less than 0.05 (< 0.05) and henceforth H5 is accepted.
Table 5: Summary of hypotheses results
Hypothesis Significance Results
H1 - Green product is positively related to brand loyalty.
0.732 Rejected
H2 - Green price is negatively related to brand loyalty.
0.706 Rejected
H3 - Green place is positively related to brand loyalty.
0.826 Rejected
H4 - Green promotion is positively related to brand loyalty.
0.467 Rejected
H5 - Green product is positively related to brand association.
0.039 Accepted
H6 - Green product is positively related to brand trust.
0.891 Rejected
H7 - Green price is negatively related to brand trust.
0.412 Rejected
H8 - Green product is positively related to perceived brand quality.
0.627 Rejected
H9 - Green place is positively related to perceived brand quality.
0.801 Rejected
40
4.4.1 Multiple linear regression
As mentioned above, a multiple linear regression analysis has been conducted, in order to test
the different hypotheses. Given that this study’s purpose is involving four dependent variables,
it was considered to create a separate table for each dependent variable in order to make it
easier for the reader. The control variables of the study were disclaimed in these tables, because
they just depict the requirements to be able to fulfill the questionnaire and thus not influence
the hypotheses or the dependent variable.
Each of the tables is build on the same basis, where the left column represents the intercept of
the whole model, the different hypotheses with the corresponding independent variables,
followed by the adjusted R-square and the standard Error of the Estimates. The following
column represents if the relationship between the independent and dependent variable is
expected to be positive or negative. Then depending on how many hypotheses will be analyzed
on each dependent variable, there will be between 1 to 5 columns representing the different
models. Within the cells the first number is the beta-value and the second number within
parenthesis represents the standard error of the independent variable. Next to the beta-value, a
star (*) will be placed if the hypothesis is considered to be statistically significant with a 95%
confidence interval. Next to the beta-value of the intercept-row, two stars (**) will be placed
if the intercept of the model is considered to be statistically significant with a 99% confidence
interval. However, the last model of the table is the one that always represents the cause and
effect that all the independent variables have on the dependent variable. Whereas the previous
columns represent just the cause and effect of one independent variable on the dependent
variable. The last column will summarize if the hypothesis is rejected or accepted. Regarding
the adjusted R-square, the values will show how much of the dependent variable is explained
by the independent variable.

41
Table 6: Multiple linear regression for the dependent variable: Brand loyalty
Expected sign
Model 1 Model 2 Model 3 Model 4 Model 5 Hypothesis
Intercept 2.991** (0.616)
2.968** (0.422)
2.868** (0.533)
2.783** (0.483)
2.751** (0.674)
H1 - Green Product
+ 0.39 (0.153)
-0.045 (0.218)
Rejected
H2 - Green Price
- 0.62 (0.112)
0.044 (0.140
Rejected
H3 - Green Promotion
+ 0.067 (0.144)
0.029 (0.024)
Rejected
H4 - Green Place
+ 0.090 (0.123)
0.085 (0.153)
Rejected
Adjusted R-square
-0.007 -0.005 -0.004 0.000 -0.025
Std. Error of the Estimates
0.955 0.953 0.953 0.956 0.967
**p<0.001, N=119
The intercept of the five models are all regarded to be statistically significant with a 99%
confidence interval and thus were marked with two stars (**). However, hypotheses 1 to 4 are
not considered to be statistically significant, as their significance value falls above p>0.05
(table 5). The beta values support the extremely weak correlation between the variables.
Looking at H1 and H2 on its own, one can see that the beta value is slightly higher (0.39 and
0.62), but still too low to be significant. Furthermore, the adjusted R-square values are so close
to zero and therefore very low, which implies that the independent variables explain almost
nothing of the dependent variable. This notion could be seen in line regarding the fact that all
four hypotheses were rejected.
Table 7: Multiple linear regression for the dependent variable: Brand association
Expected sign Model 1 Hypothesis Intercept 2.045**
(0.549)
H5 - Green Product + 0.190* (0.136)
Accepted
Adjusted R-square 0.028 Std. Error of the Estimates
0.850
*p<0.05; **p<0.001, N=119
The intercept of the model is regarded to be statistically significant with a 99% confidence
interval and thus was marked with two stars (**). Hypothesis 5 is considered to be statistically
significant with a 95% confidence interval, as its significance value falls below p<0.05 (table
5), thus was marked with a star (*). The beta value (0.190) shows that the correlation between
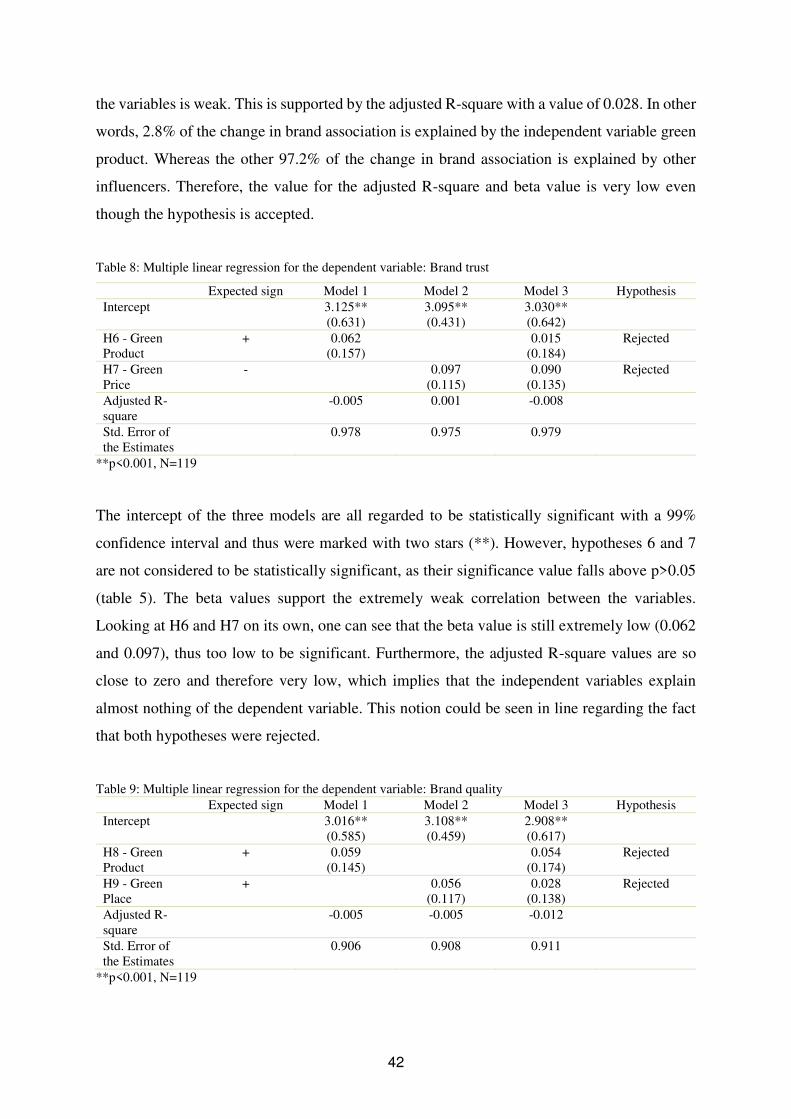
42
the variables is weak. This is supported by the adjusted R-square with a value of 0.028. In other
words, 2.8% of the change in brand association is explained by the independent variable green
product. Whereas the other 97.2% of the change in brand association is explained by other
influencers. Therefore, the value for the adjusted R-square and beta value is very low even
though the hypothesis is accepted.
Table 8: Multiple linear regression for the dependent variable: Brand trust
Expected sign Model 1 Model 2 Model 3 Hypothesis Intercept 3.125**
(0.631) 3.095** (0.431)
3.030** (0.642)
H6 - Green Product
+ 0.062 (0.157)
0.015 (0.184)
Rejected
H7 - Green Price
- 0.097 (0.115)
0.090 (0.135)
Rejected
Adjusted R-square
-0.005 0.001 -0.008
Std. Error of the Estimates
0.978 0.975 0.979
**p<0.001, N=119
The intercept of the three models are all regarded to be statistically significant with a 99%
confidence interval and thus were marked with two stars (**). However, hypotheses 6 and 7
are not considered to be statistically significant, as their significance value falls above p>0.05
(table 5). The beta values support the extremely weak correlation between the variables.
Looking at H6 and H7 on its own, one can see that the beta value is still extremely low (0.062
and 0.097), thus too low to be significant. Furthermore, the adjusted R-square values are so
close to zero and therefore very low, which implies that the independent variables explain
almost nothing of the dependent variable. This notion could be seen in line regarding the fact
that both hypotheses were rejected.
Table 9: Multiple linear regression for the dependent variable: Brand quality Expected sign Model 1 Model 2 Model 3 Hypothesis Intercept 3.016**
(0.585) 3.108** (0.459)
2.908** (0.617)
H8 - Green Product
+ 0.059 (0.145)
0.054 (0.174)
Rejected
H9 - Green Place
+ 0.056 (0.117)
0.028 (0.138)
Rejected
Adjusted R-square
-0.005 -0.005 -0.012
Std. Error of the Estimates
0.906 0.908 0.911
**p<0.001, N=119

43
The intercept of the three models are all regarded to be statistically significant with a 99%
confidence interval and thus were marked with two stars (**). However, hypotheses 8 and 9
are not considered to be statistically significant, as their significance value falls above p>0.05
(table 5). The beta values support the extremely weak correlation between the variables.
Looking at H8 and H9 on its own, one can see that the beta value is still extremely low (0.059
and 0.056), thus too low to be significant. Furthermore, the adjusted R-square values are so
close to zero and therefore very low, which implies that the independent variables explain
almost nothing of the dependent variable. This notion could be seen in line regarding the fact
that both hypotheses were rejected.

44
5 Discussion
This chapter presents a discussion regarding the results from the previous section. Where
theory is connected to the results, in order to try to explain the outcome of the statistical
analysis. The chapter would include the discussion revolving around the rejection and
acceptance of the designed hypothesis.
5.1 Hypothesis 1
The hypothesis H1 tested if green product is positively related to brand loyalty. Even though
in terms of the previous study conducted by Davari & Strutton (2014) the positive relationship
between the variables was accepted, the findings of this thesis oppose the previous findings
and reject H1 based on the significance level of 0.732 (table 5) gained through the regression
analysis. However, the information does not necessarily imply that the product has no
relationship with the brand loyalty, considering a different set of research, which may include
a different sample and research instrument could reveal contrasting results than the findings of
this specific study.
Taking the insights from the previous studies conducted in regards to product and brand loyalty
relationship. The previous research depicts the link between product and brand loyalty seems
to lack the concept’s empirical depth in the literature (Quester & Lin, 2003). The authors
LeClerc & Little, (1997) puts the concept into perspective where they shed light on the fact
that the high-involvement products are considered to be linked with brand loyalty. From this
concept, one could argue if the consumers perceive the product as an high-involvement
product, which in this case of the study, it could be observed that the consumer’s do not
specifically consider a green fashion clothing product a high-involvement product and hence
is not considered related to the brand loyalty. From looking at the findings from a different
perspective, the notion of green product being related to the brand loyalty could be described
under the concept presented by (Quester & Lin, 2003), as brand loyalty could be observed to
have an attachment to the individual’s ego. The consumers that show a fairly less involvement
to a product, are seen to have a large set of considerations involved which results in a low
commitment to the brand, hence diminishing effect on the brand loyalty. Henceforth one can
portray, the opposition of green product having a positive impact on brand loyalty, could be
connected to the literature already presented previously. Though keeping in view this research

45
was specific to the sample of generation Y (18 to 35 years). Based on the characteristics of
young generation, it could be argued that the Generation Y look at green product like any other
product available hence falling in the trap of showing less commitment to the product, caused
on the basis of peer pressure or the sense of belonging, In regards to this, one could argue that
the results could have varied if the older generation was selected for the research purpose.
Looking at the descriptive statistics from table 2, the responses in relation to the green product
resulted all in a high mean value, (Environmentally-Friendly attributes) 4.40 & 4.30,
(Manufacturing Process) 3.70, (Packaging) 3.79 and (Labelling) 3.71 & 3.99 respectively. An
interesting aspect could be observed looking at the measure’s of the mean, one could argue the
importance of the marketing mix element green product for the Generation Y.
5.2 Hypothesis 2
Hypothesis 2 seeked to test if green price is negatively related to brand loyalty, which results
in H2 being rejected. This finding contradicts with the result from the previous study of Davari
& Strutton (2014), which supports the aforementioned relationship. The findings of this thesis
proved to be different, through the regression analysis where the significance level measured
0.706 for H2, shown in in table 5. However, another study conducted by Kim & Hyun (2011)
reported that the expected positive influence of price on brand loyalty was not supported either.
Even though the study is not conducted in a green context, general implications can be inferred
to the green context. Therefore it shows that price does not influence brand loyalty neither in a
positive nor in a negative way. Regarding that fact, Abratt (1986) argues that the importance
of price regarding the brand choice decision is regarded as little. This fact might explain why
brand loyalty is not significantly affected by green price.
Despite this finding, it does not imply that price has no relationship with brand loyalty.
Considering that the theories used for the elaboration of the questionnaire of this study differ
from previous studies, the answers probably vary as well, which in turn affect the final results.
Furthermore, the sample of this study contained people from the Generation Y. It would be
interesting to see, when conducting the research on an older generation, if price would be
related to brand loyalty or not. Especially due to that an older generation is perceived to be in
a more stable state of life, which implies more wealth. Eventually they would rather accept the
premium price and would also show more willingness to pay a higher price, which could result

46
in a higher degree of brand loyalty. Analyzing it from another perspective, one could start
question why price did not have a negative relation towards brand loyalty as expected. If the
eventually unstable state of life of Generation Y impede them to pay the premium price, then
it seems logical that higher price would end up decreasing their brand loyalty, which in turn
would lead to a negative relation between green price and brand loyalty.
Although H2 was not supported, it does not imply that green price is not an important aspect.
Looking at the descriptive statistics from table 2, the responses regarding two constructs related
to the green price resulted all in a high mean value (value attributes) 3.61 and (desirable option)
3.94, which shows that price executes a certain importance for the respondents and therefore it
should not be disregarded.
5.3 Hypothesis 3
The Hypothesis 3, which investigates that green place has a positive relation to brand loyalty,
in this specific study was rejected. The study conducted earlier by Davari and Strutton (2014)
constructed a positive relationship between green place and brand loyalty, this specific research
did not conclude the expected notion from the previous study, based on the regression analysis
with the significance level of 0.826 shown in table 5. The rejection is followed even though the
study presented by Jang et al., (2015) have concluded, that the consumers show their loyalty
towards the green place, where the disposal and recycling of products, location and availability
of green products is known to the consumers. Having the perspective of this study, the thought
of green place having a positive relationship with the brand loyalty emerges in the picture. The
notion is further argued by the authors Sylvia et al., (2016) as, having a positive experience of
consumers on the place they visit, leads to a development of favorability and memories, hence
adding to the brand loyalty. Keeping in mind the previous studies, and this study rejecting the
positive relationship, one can not state, considering the significance level from table 5, that
place does not relate positively to the brand loyalty. Hence the change in the sample selection
and the instrument utilized may lead to a different result than this study identifies.
Although the Hypothesis H3 is being rejected by the researchers of this study, as it shows a
rather weak correlation between the green place and brand loyalty, A compelling facet could
be noted, considering the mean measured and reported in table 2 containing the descriptive
statistics. One could observe the mean of the responses related to green place, where it

47
measured (Collaboration) 3,65, (Location) 3.98 and (Availability) 3.96 respectively. Hence,
these concepts are indeed of importance to the respondents, even though the relationship
between the two variables was considered as not significant. Thus green place could be seen as
of significance to the consumers, therefore should be considered.
5.4 Hypothesis 4
Hypothesis 4 evaluates if green promotion is positively related to brand loyalty, which results
in H4 being rejected. Regarding the previous study of Davari & Strutton (2014), green
promotion was considered to be positively related to brand loyalty and therefore their finding
is not in line with the results from this research. The findings of this thesis were not significant
in this regard, as the confidence interval of 0.467 was measured through the regression analysis,
as observed from table 5. This contradiction might be due to several reasons. However, the
sample of respondents consisting of people from the Generation Y could be one of the
explanations. Generation Y is a population which supports very strongly social causes and
socially responsible companies (Valentine & Powers, 2013), which eventually might results in
the fact that they put even more attention to the message delivered by companies. Furthermore,
this generation is strongly influenced by technology and the internet, which makes it a difficult
population to target because they are not as receptive to traditional media as more mature
generations (Valentine & Powers, 2013). Therefore the constructs (message, packaging,
printed media and word of mouth) derived from the theory about green promotion, might not
be adequate in order to catch the attention of this generation. It would be interesting to
investigate, if the results would be affected through the inclusion of digital promotion into the
questionnaire. However, regarding three questions related to green promotion, the responses
indicated with a mean of (message) 4.08, (packaging) 4.03 & (printed media) 3.87 that the
respondents were quite positive towards the constructs message, packaging and printed media.
Therefore the meaning of green promotion is definitely significant and should not be
disregarded even though it was not found to be positively related to brand loyalty.
All in all, according to Valentine & Powers (2013) Generation Y is not a brand loyal
population, which might be an argument for the fact that none of the four green marketing mix
elements was found to be related to brand loyalty.
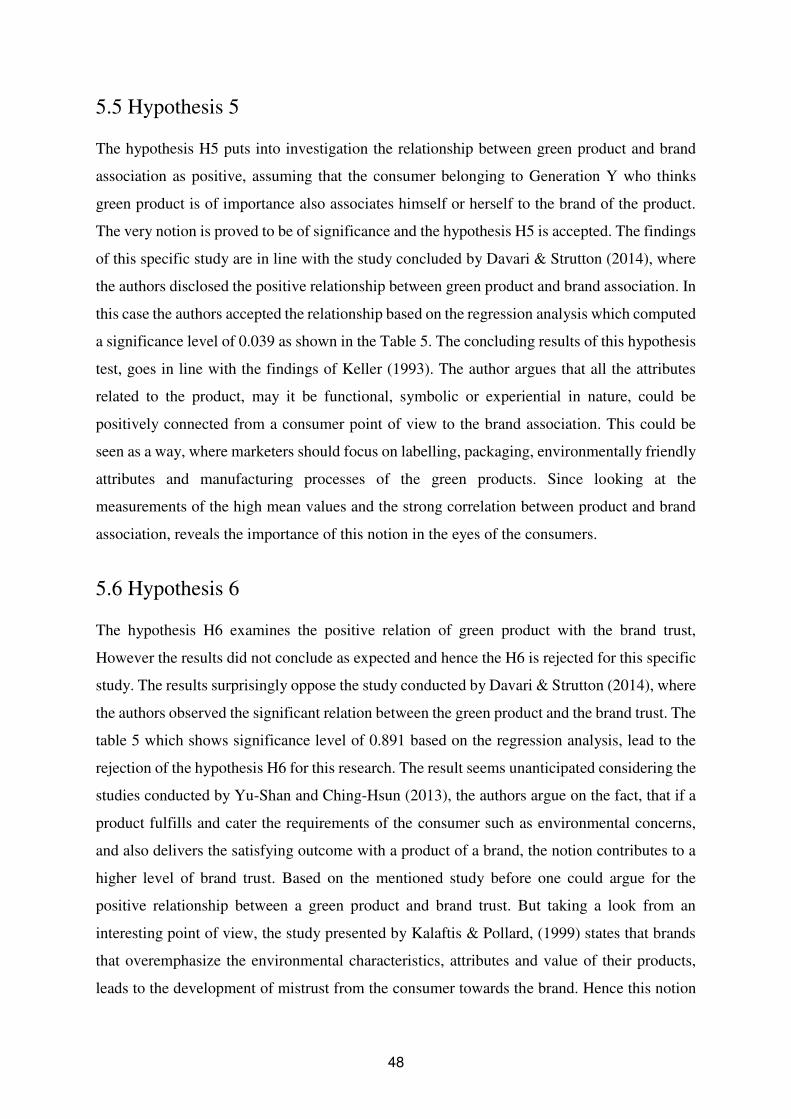
48
5.5 Hypothesis 5
The hypothesis H5 puts into investigation the relationship between green product and brand
association as positive, assuming that the consumer belonging to Generation Y who thinks
green product is of importance also associates himself or herself to the brand of the product.
The very notion is proved to be of significance and the hypothesis H5 is accepted. The findings
of this specific study are in line with the study concluded by Davari & Strutton (2014), where
the authors disclosed the positive relationship between green product and brand association. In
this case the authors accepted the relationship based on the regression analysis which computed
a significance level of 0.039 as shown in the Table 5. The concluding results of this hypothesis
test, goes in line with the findings of Keller (1993). The author argues that all the attributes
related to the product, may it be functional, symbolic or experiential in nature, could be
positively connected from a consumer point of view to the brand association. This could be
seen as a way, where marketers should focus on labelling, packaging, environmentally friendly
attributes and manufacturing processes of the green products. Since looking at the
measurements of the high mean values and the strong correlation between product and brand
association, reveals the importance of this notion in the eyes of the consumers.
5.6 Hypothesis 6
The hypothesis H6 examines the positive relation of green product with the brand trust,
However the results did not conclude as expected and hence the H6 is rejected for this specific
study. The results surprisingly oppose the study conducted by Davari & Strutton (2014), where
the authors observed the significant relation between the green product and the brand trust. The
table 5 which shows significance level of 0.891 based on the regression analysis, lead to the
rejection of the hypothesis H6 for this research. The result seems unanticipated considering the
studies conducted by Yu-Shan and Ching-Hsun (2013), the authors argue on the fact, that if a
product fulfills and cater the requirements of the consumer such as environmental concerns,
and also delivers the satisfying outcome with a product of a brand, the notion contributes to a
higher level of brand trust. Based on the mentioned study before one could argue for the
positive relationship between a green product and brand trust. But taking a look from an
interesting point of view, the study presented by Kalaftis & Pollard, (1999) states that brands
that overemphasize the environmental characteristics, attributes and value of their products,
leads to the development of mistrust from the consumer towards the brand. Hence this notion
49
could be taken into consideration, when compared to the results generated by the Generation
Y sample for this study. As this might be the case where the consumer sample of this study
perceive the brand as, exaggerating the environmentally friendly aspects related to the product,
hence not adding towards the brand trust in this case.
Shown in table 2 of descriptive statistics the responses generated a mean of (Environmentally-
Friendly attributes) 4.40 & 4.30, (Manufacturing Process) 3.70, (Packaging) 3.79 and
(Labelling) 3.71 & 3.99 respectively. One could argue on the fact that green product is
considerably valued by the consumers, even though the relationship between green product and
brand trust is not significant. However this could be a result of the notion presented by Kalaftis
& Pollard (1999), where brands overstating their green products to the consumers, are returned
with distrust towards the brand.
5.7 Hypothesis 7
Hypothesis H7, which investigates the relationship of the green price being negative in nature
when related with brand trust. The notion did not hold when it was put to test as H7 is rejected
in this specific study. Davari & Strutton (2014) presented a negative relationship between the
two concepts, and discussed that green price is a negative significant influencer on the brand
trust. This study presented the results based on the regression analysis, as seen from table 5,
H7 shows a significance level of 0.412 and therefore deemed rejected. As discussed by
Alhaddad (2015), the author argues that in order for a company to develop brand trust, it should
be consistent when it comes to price of a product. The concept can be discussed as, if the price
of a product is fluctuating the consumer would have a hard time trusting the brand, denoting
higher price would lead to lower brand trust. This concept is in line with the research presented
by Davari & Strutton (2014). Considering the findings from a different point of view, the study
conducted by the authors Elliot & Yannopoulou (2007), the researchers argue that if the price
of a product is considerably high the brand trust needs to be inspired to the consumers, so the
brand wins the preference of the consumer and higher price is being accepted. From this study,
one could argue as, in order to justify the higher price for the environmentally friendly products,
the brand trust needs to be raised as well. Taking into consideration the high means of the
responses related to two components of green price, (value attributes) 3.61 and (desirable
option) 3.94 (table 2), it could be argued that green price plays an important role for the
respondents and therefore it should be considered.

50
5.8 Hypothesis 8
The Hypothesis H8 investigates if green product is positively related to perceived brand
quality, which results in H8 being rejected. This discovery surprisingly counters the result from
Davari & Strutton (2014), where the same hypothesis was approved. This specific research
found different findings contradicting the expected results, where the regression analysis
measured the significance level of 0.627 shown in table 5, hence deemed rejected. This
contradiction might be due to the study context. Hoffman (2007) argues that fashion trends are
getting replaced by a new trend in a very short time. This is further strengthened by Bhardwaj
& Fairhurst (2010), mentioning that the consumer is changing towards a more demanding way,
where they change their product whishes much quicker. Therefore fashion retailers are urged
to yield faster in order to meet consumer expectations, which results in a throwaway or so
called fast fashion industry (Bhardwaj & Fairhurst, 2009). Crewe & Davenport (1991) argues
how this fast fashion concept differs within different generations, due to that the members of
Generation Y are more likely to support this throwaway philosophy, compared to their parents
generation known as Baby Boomers. Therefore, given that the respondents eventually follow
this fast fashion idea, as shopping depicts to be part of Generation Y’s lifestyle according to
Bakewell & Mitchell (2003), one could argue that the quality aspects of the brand does not
matter enough to the respondents to base their purchase intention on. They might rather
consider style and price as determinants to buy the product as emphasized by Davis (1987).
Eventually the fast fashion concept counters the brand quality dimension, hence following this
philosophy could make it difficult to demand for quality at the same time.
Furthermore, observing it from this fashion perspective, the theory used in order to derive the
questionnaire was general and therefore it might not have been absolutely appropriate in order
to capture the fashion context of the study. Considering the means within green product, the
theoretical components packaging and labelling received lower values even though they are
still above average (3.79, 3.71 & 3.99) compared to the other theoretical components that
compose green product. Therefore one could argue that packaging eventually does not play
such an important role when it comes to clothing. Also the two questions regarding labelling
might emphasize too much on the qualities of the product. As already mentioned in the
paragraph above, the qualities of the brand and product are not considered significant in the
fast fashion industry.
51
5.9 Hypothesis 9
Hypothesis H9 evaluates if green place is positively related to perceived brand quality, which
results in H9 being rejected, although Davari & Strutton (2014) found a positive connection
between those variables. The results for the regression analysis revealed 0.801 significance
level as seen in table 5, hence based on the significance level the hypothesis is rejected. This
contradiction is surprising, given that the previous study was replicated so similar findings were
expected. However, Jacoby, Olson & Haddock (1971) introduce pertinent factors when
forming brand quality. Price, product compositions, manufacturer, store image, advertising and
past purchase experience all create impressions of quality, while price performs as the most
influential component because it is concrete and measurable (Jacoby, Olson & Haddock, 1971).
Hence, manufacturer and store image obviously represent the marketing mix element place.
Thus it supports the results from Davari & Strutton (2014) even though it is not inferred to a
green context. Despite of that, one could also argue that place might not be the most influential
aspect in order to increase the perceived brand quality as price takes a more prominent role
(Jacoby, Olson & Haddock 1971).
Even though green place was not considered to have a positive relation to brand quality, the
importance of green place should not be disregarded. As already mentioned before, the mean
values for the questions (Collaborations) 3.65, (Location) 3.98 and (Availability) 3.96
concerning green place were high, hence it is seen as a significant element for the respondents.
However, Davari & Strutton (2014) argue that green distributors might be an aspect of green
place which allows companies to take advance in regards to the competitors which eventually
do not provide green distributors and thus companies should communicate the additional value
resulting out of it. Therefore, one could argue that the green distributors should be included in
the theory and thus derive the concept to the questionnaire in order to eventually get different
results.

52
6 Conclusion
Based on the recent trends, positive attitudes towards environmental issues increased.
However, consumers pro-environmental attitudes do not emanate in a purchasing behavior.
Hence this attitude-behavior gap emerged as a popular field to study within the literature. This
specific research seeked to replicate a previous study of Davari & Strutton (2014) where the
traditional marketing mix elements put in a green context, were proven to have a significant
relation to four dimensions of the consumer-based brand equity construct namely brand loyalty,
brand association, brand trust and perceived brand quality. Even though the researchers Davari
& Strutton (2014) were not able to generate enough insights in order to close the attitude-
behavior gap, they could establish a simplified model. Therefore, this study consequently
intended to test this new model while aiming for the development of theoretical and practical
implications regarding the poorly studied green marketing mix. Thus the adequate application
of a green marketing mix would result in an increase of consumer-based brand equity, which
in turn would lead consumers positive attitudes to emanate in an actual purchase behavior,
hence close the attitude-behavior gap.
The purpose of this study was to explain the impact of green marketing mix elements (product,
price, place and promotion) on dimensions of consumer-based brand equity (brand loyalty,
brand association, brand trust and perceived brand quality). Through the empirical research it
is possible to present a positive relation of green product to brand association. However, the
multiple linear regression showed that green product only explains 2.8% of brand association,
which questions the real impact that green product performs on brand association. The
remaining hypotheses were rejected, even though these findings contradict other previous
studies, which actually provide a stronger relation between the relevant green marketing mix
elements and the consumer-based brand equity dimensions. Even though the green marketing
mix did not influence consumer-based brand equity, the results still indicate that the green
marketing mix is considered as important for the respondents. In which green product emerged
to have the highest significance, green place is subsequent, green price comes after, while
tightly followed by green promotion.
53
6.1 Theoretical implications
The steady advancement in the field of green marketing has aroused the interest of researchers
towards this concept of study. The focus is caused on the basis of awareness depicted by the
consumers in this matter, as their concern regarding the environment are growing, yet the
purchasing habits are not in line with the positive attitudes depicted by the consumers (Gupta
& Ogden, 2009; Tan, Johnstone & Yang, 2016; Vermeir & Verbeke, 2006). There is a fair
amount of concern and arguments observed in the literature, where the researchers have pointed
towards the relatively few studies concerning in this regard being actually carried out, despite
the concept being a major factor in the field of marketing (Fuentes, C 2015). From a different
viewpoint the authors Chockalingam & Israel (2016) argue that the vacuum exists in the
scientific research regarding the green marketing mix for turning the non-purchasers into
purchasers of the environmentally products.
Therefore the researchers of this thesis planned to crack this nutshell, to gather insights and
empirical findings in order to make their contribution in this developing field of green attitude
and behaviour. The influence of this specific research is motivated by the study constructed by
Davari & Strutton (2014), where they look into this significant gap between the pro-
environmental beliefs and the contradicting consumption attitude among the consumers and
presented a simplified model. In regards to the previous study, the simplified model was tested
for the first time by the researchers of this thesis, adding their contribution to the literature
through finding and adding credibility to the simplified model presented.
This specific research contributes with the insights of green product being one of the element
of the green marketing mix having a positive relationship with the brand association, as the
study concluded on the fact that green product is perceived to have influence and adds a sense
of association towards a specific brand. In regards to the other elements within the green
marketing mix, no significant relationship was observed in regards to the four dimensions of
consumer-based brand equity. This specific study could also be seen as a contribution towards
the lacking literature in this field, as it could be termed as one of the few explanatory researches.
Unearthing the relationship of green marketing mix elements when brought in contact with the
consumer-based brand equity dimensions, to develop insights within the attitude-behavior gap
notion.

54
6.2 Managerial implications
Subsequent several managerial implications will be derived from the outcome of this study.
Thereby green product emerged to have the highest significance within the green marketing
mix elements. Green place arose to have the second most influential impact, green price coming
after, while tightly followed by green promotion. Each implication reveals how managers best
implement the green marketing mix in order to change consumers beliefs to actual purchases
and therefore close the attitude-behavior gap.
Green product is the only element of the marketing mix which has statistically proven to
influence consumer-based brand equity. Therefore, it definitely depicts as an important aspect
for consumers, where the product attributes make consumers associate themselves with the
brand. Hence, in order to engage consumers with the brand and therefore encourage them to
purchase, managers should emphasize on the environmentally friendly attributes, the
manufacturing process, the packaging and labelling of the product, which all proved to be
significant factors. By disclosing a certification from a well-known organization regarding the
environmentally friendliness of the product, consumers engagement with the product and brand
might be enhanced.
Even though green place, price and promotion did not achieve statistical significance
concerning the relation towards consumer-based brand equity, they still emerged as being
important for the respondents through the achievement of high means (3.86, 3.67 and 3.65).
Therefore, managers should still take the elements of the mix into consideration regardless of
their statistical insignificance towards consumer-based brand equity. Regarding green place,
the location and availability of products build up to the consumer engagement with
environmentally friendly brands and thus it might help encourage consumers to purchase. Also
the collaboration with green distributors in order to facilitate the disposal could encourage
consumers. Concerning the green price aspect, lowering the premium price is not possible
regarding the additional costs implied. Therefore, managers should communicate a justification
for the higher price of their environmentally friendly products demonstrating the additional
value of their products and highlighting the dark sides of the cheap conventional alternatives.
Highlighting the reasons for the cheap prices from competitors will hopefully create a change
in consumers mind and convince them that the green alternative is a more desirable option.
Finally, with respect to green promotion, managers should focus on delivering an accurate
55
message through the packaging of the product. This will most probably attract the attention of
consumers. Furthermore, the communication through digital medium might emphasize the
awareness about environmentally friendly products and thus lead consumers to engage much
more with them, with the hope to emanate in a purchase behavior.
6.3 Limitations and directions for further research
As any other quantitative research allows, the idea behind is generalizing the results with the
assessment of findings through the views and responses from the selected sample. The sample
for this specific research was Generation Y and a non-probability sampling approach was
utilized, the findings could have resulted in a not truly generalizable as it could have been
demarcated to a specific group of respondents. Considering this notion, a probability sampling
could have resulted in different findings of the study. Keeping in mind the results may also
vary, if a different sample other than the Swedish Generation Y was regarded for this study.
Based on the lack of resources and time, the study could also not be conducted on a large
sample, which would have provided more insights to the study conducted.
Another limitation could be seen as the closed end questionnaire designed by the researchers,
where the respondents are limited to very specific answers provided to them leaving very little
room for their responses. The responses for the study were gathered based on the fashion
context, where the responses could have varied based on different respondents viewing fashion
in their own context. Lastly, due to the lack of theory in the terrain of green marketing, the
limited literature utilized to construct the measurement items might not have suffice to extract
the expected outcome adequately. Another approach to look at the research would be to
segment the target sample, one segment could be where the consumers that show environmental
concern, and the second segment where the consumers are not environmentally concerned at
all. Hence if the research would treat these segments differently, this might have revealed
different implications regarding marketing strategies that eventually work for one segment but
not for the other group. Therefore one could conclude that, these limitations should be
considered in the future research in order to gather truly generalizable results.

56
References
Articles
Abratt, R. (1986) Industrial buying in high-tech markets. Industrial Marketing Management,
Vol. 15 No. 4, 293-298
Aghaei, M, Vahedi, E, Kahreh, M, & Pirooz, M 2014, 'An Examination of the Relationship
between Services Marketing Mix and Brand Equity Dimensions', Procedia - Social And
Behavioral Sciences, 109, 2nd World Conference on Business, Economics and Management,
pp. 865-869
Alan, F, & Gareth, S 2013, 'Measuring brand association strength: a consumer based brand
equity approach', European Journal Of Marketing, 8, p. 1356
Alhaddad, A 2015, ‘Perceived Quality, Brand Image and Brand Trust as Determinants of Brand
Loyalty’, Journal of Research in Business and Management, Vol. 3, pp: 01-08
Bagozzi, R, Youjae, Y, & Phillips, L 1991, 'Assessing Construct Validity in Organizational
Research', Administrative Science Quarterly, 36, 3, pp. 421-458
Banerjee, S., Gulas, C. S. & Iyer, E. (1995) Shades of Green: A Multidimensional Analysis of
Environmental Advertising, Journal of Advertising, Vol. 24 No. 2, 21-31
Becerra, E, & Badrinarayanan, V 2013, 'The influence of brand trust and brand identification
on brand evangelism', Journal Of Product & Brand Management, 22, 5/6, pp. 371-383
Bhardwaj, V., & Fairhurst, A. (2010). Fast fashion: Response to changes in the fashion
industry. The International Review of Retail, Distribution and Consumer Research, 20(1), 165-
173.
Bolton, RN 1991, 'An Exploratory Investigation Of Questionnaire Pretesting With Verbal
Protocol Analysis', Advances In Consumer Research, 18, 1, pp. 558-565, Business Source
Premier

57
Brown, G 2017, 'The Millennials (Generation Y): Segregation, Integration and Racism', ABNF
Journal, 28, 1, pp. 5-8
Calvo-Porral, C, & Lévy-Mangin, J 2017, 'Store brands’ purchase intention: Examining the
role of perceived quality', European Research On Management And Business Economics, 23,
pp. 90-95
Carlson, L., Grove, S. J., Kangun, N. (1993) A content analysis of environmental advertising
claims: a matrix method approach, Journal of Advertising, Vol. 22 No. 3, 27-39
Cathy, Bakewell and Mitchell Vincent, 2003, 'Generation Y female consumer decision-making
styles', International Journal of Retail & Distribution Management, no. 2, p. 95
Chen, Y 2010, 'The Drivers of Green Brand Equity: Green Brand Image, Green Satisfaction,
and Green Trust', Journal of Business Ethics, 2, p. 307
Chockalingam, S., & Isreal, D. (2016). Redesigning the marketing mix for eco-friendly product
consumption among non-purchasers in India. Management & Marketing, 11(1), 355-370
Christodoulides, G, Cadogan, J, & Veloutsou, C 2015, 'Consumer-based brand equity
measurement: lessons learned from an international study', International Marketing Review,
32, 3/4, pp. 307-328
Crewe, L., and E. Davenport. 1991. The puppet-show: Changing buyer-supplier relationships
within clothing retailing. Transactions of the Institute for British Geogaphers 17, no. 2: 183–
97.
Davari, A, & Strutton, D 2014, 'Marketing mix strategies for closing the gap between green
consumers' pro-environmental beliefs and behaviors', Journal Of Strategic Marketing, 22, 7,
pp. 563-586
58
Davcik, N, da Silva, R, & Hair, J 2015, 'Towards a unified theory of brand equity:
conceptualizations, taxonomy and avenues for future research', Journal Of Product & Brand
Management, 24, 1, pp. 3-17
Davis, L. (1987) Consumer Use of Label Information In Ratings of Clothing Quality and
Clothing Fashionability, Clothing and Textiles Research Journal, Vol. 6 No. 1
Dawes, J 2008, 'Do data characteristics change according to the number of scale points used?',
International Journal Of Market Research, 50, 1, pp. 61-77
Du, S, & Sen, S 2016, 'Challenging Competition with CSR: Going Beyond the Marketing Mix
to Make a Difference', Gfk Marketing Intelligence Review, Vol 8, Iss 1, Pp 18-23 (2016), 1, p.
18
Elham, R, & Nabsiah Abdul, W 2011, 'Investigation of green marketing tools' effect on
consumers' purchase behavior', Business Strategy Series, 2, p. 73
Elliott, R, & Yannopoulou, N 2007, 'The nature of trust in brands: a psychosocial model',
European Journal Of Marketing, 41, 9/10, p. 988
Eneizan, B., Abd Wahab, K., Zainon, M., Obaid, T. (2016) Effects of Green Marketing Strategy
on the Financial and Non-Financial Performance of Firms: A conceptual paper, Arabian
Journal of Business and Management Review, Vol. 5 (12), pp. 14-27
Foddy, W. (1993) Constructing Questions for Interviews and Questionnaires. Theory and
Practice in Social Research. Cambridge, UK: Cambridge University Press.
Fuentes, Christian, 2015, 'How Green Marketing Works: Practices, Materialities and Images',
Scandinavian Journal Of Management, 2, p. 192
Fraj, E, Martínez, E, & Matute, J 2011, 'Green marketing strategy and the firm's performance:
the moderating role of environmental culture', Journal Of Strategic Marketing, 19, 4, pp. 339-
355

59
Girard, T, Trapp, P, Pinar, M, Gulsoy, T, & Boyt, T 2017, 'Consumer-Based Brand Equity of
a Private-Label Brand: Measuring and Examining Determinants', Journal Of Marketing Theory
& Practice, 25, 1, pp. 39-56
Gordon, R, Carrigan, M, & Hastings, G 2011, 'A framework for sustainable marketing',
Marketing Theory, 11, 2, pp. 143-163, Business Source Premier, EBSCOhost
Grimmer, M, & Woolley, M 2014, 'Green marketing messages and consumers' purchase
intentions: Promoting personal versus environmental benefits', Journal Of Marketing
Communications, 20, 4, pp. 231-250
Hair, J. F., Black, W. C. & Babin, B. J., 2010. Multivariate Data Analysis: A Global
Perspective. 7th ed. New Jersey: Pearson Prentice Hall
Hendrickson, AR, Massey, PD, & Cronan, TP 1993, 'On the Test-Retest Reliability of
Perceived Usefulness and Perceived Ease of Use Scales', MIS Quarterly, vol. 17, no. 2, pp.
227-230
Hilton, CE 2017, 'The importance of pretesting questionnaires: a field research example of
cognitive pretesting the Exercise referral Quality of Life Scale (ER-QLS)', International
Journal Of Social Research Methodology, 20, 1, pp. 21-34
Irem Erdogmus, Isıl Budeyri‐Turan, (2012) "The role of personality congruence, perceived
quality and prestige on ready‐to‐wear brand loyalty", Journal of Fashion Marketing and
Management: An International Journal, Vol. 16 Issue: 4, pp.399-417
Jacoby, J., Olson, J., Haddock, R., & Feishman, Edwin A. (1971). Price, brand name, and
product composition characteristics as determinants of perceived quality. Journal of Applied
Psychology,55(6), 570-579.
Jang, Y, Kim, W, & Lee, H 2015, 'Coffee shop consumers’ emotional attachment and loyalty
to green stores: The moderating role of green consciousness', International Journal Of
Hospitality Management, 44, p. 146

60
Kalafatis, SP, & Pollard, M 1999, 'Green marketing and Ajzen's theory of planned behaviour:
a cross-market examination', Journal of Consumer Marketing, vol. 16, no. 4/5, pp. 441-460
Kalucy, E, Hordacre, A, & Patterson, S 2008, 'Going online: experiences with a web survey',
Australian Health Review: A Publication Of The Australian Hospital Association, 32, 2, pp.
366-370
Keller, KL 1993, 'Conceptualizing, Measuring, Managing Customer-Based Brand Equity',
Journal Of Marketing, 57, 1, pp. 1-22
Kim, & Hyun. (2011). A model to investigate the influence of marketing-mix efforts and
corporate image on brand equity in the IT software sector. Industrial Marketing Management,
40(3), 424-438.
Kinoti, M. W. (2011). Green marketing intervention strategies and sustainable development: A
conceptual paper. International Journal of Business and Social Science, 2, 263–273
Kopalle, P, & Lehmann, D 1997, 'Alpha Inflation? The Impact of Eliminating Scale Items on
Cronbach's Alpha', Organizational Behavior & Human Decision Processes, 70, 3, pp. 189-197
Leckie, C, Nyadzayo, M, & Johnson, L 2016, 'Antecedents of consumer brand engagement and
brand loyalty', Journal Of Marketing Management, 32, 5-6, pp. 558-578
Leclerc, F, & Little, J 1997, 'Can Advertising Copy Make FSI Coupons More Effective?',
Journal Of Marketing Research (JMR), 34, 4, pp. 473-484
Lee, E, Lee, HJ, Pae, J, & Park, S 2016, 'The important role of corporate social responsibility
capabilities in improving sustainable competitive advantage', Social Responsibility Journal,
vol. 12, no. 4, p. 642.
Lee-Youn, J & Ostberg, J 2013, A case study of the Swedish fashion industry from the systems
perspective of creativity' 2013, Journal Of Global Fashion Marketing, 2, p. 128.

61
Leonidou, C, Katsikeas, C, & Morgan, N 2013, ''Greening' the marketing mix: do firms do it
and does it pay off?', Journal Of The Academy Of Marketing Science, 41, 2, p. 151
McNeill, L. & Moore, R. (2015) Sustainable fashion consumption and the fast fashion
conundrum: fashionable consumers and attitudes to sustainability in clothing choice,
International Journal of Consumer Studies, Vol. 39 No. 3, pp. 212-222.
Mishra, P, & Sharma, P 2014, 'Green Marketing: Challenges and Opportunities for Business',
BVIMR Management Edge, 7, 1, pp. 78-86
Naresh, M, & Ravi Shekhar, K 2013, 'The nature and antecedents of brand equity and its
dimensions', Marketing Intelligence & Planning, 2, p. 141
Parment, A 2013, 'Generation Y vs. Baby Boomers: Shopping behavior, buyer involvement
and implications for retailing', Journal Of Retailing And Consumer Services, 20, pp. 189-
199.
Pierre Berthon, Leyland Pitt, Michael Ewing and Christopher L. Carr. (2002) Potential
Research Space in MIS: A Framework for Envisioning and Evaluating Research Replication,
Extension, and Generation, Information Systems Research, Vol. 13, No. 4 (December 2002),
pp. 416-427
Pourdehghan, A. (2015). The impact of marketing mix elements on brand loyalty: A case
study of mobile phone industry. Marketing and Branding Research, 2(1), 44-63.
Quester, P, & Ai Lin, L 2003, 'Product involvement/brand loyalty: is there a link?', Journal Of
Product & Brand Management, 12, 1, p. 22
Rao, A. & Monroe, K. (1989) The Effect of Price, Brand Name and Store Name on Buyers
Perceptions of Product Quality: An Integrative Review, Journal of Marketing Research, Vol.
26, pp. 351-357

62
Rubio, D, Berg-Weger, M, Tebb, S, Lee, E, & Rauch, S 2003, 'Objectifying content validity:
conducting a content validity study in social work research', Social Work Research, 27, 2, pp.
94-104
Rex, Emma, & Baumann, Henrikke. (2007). Beyond ecolabels:: What green marketing can
learn from conventional marketing. Journal Of Cleaner Production, 15(6), 567-576
Severi, E. & Choon Ling, K. (2013) The Mediating Effects of Brand Association, Brand
Loyalty, Brand Image and Perceived Quality on Brand Equity, Asian Social Sciences, 9 (3),
125-137
Shrum, L., Mccarty, J., & Lowrey, T. (1995). Buyer Characteristics of the Green Consumer
and Their Implications for Advertising Strategy. Journal of Advertising,24(2), 71-82
Shruti Gupta, & Denise T. Ogden. (2009). To buy or not to buy? A social dilemma perspective
on green buying. Journal of Consumer Marketing, 26(6), 376-391.
Shuili, D, Bhattacharya, C, & Sankar, S 2011, 'Corporate Social Responsibility and
Competitive Advantage: Overcoming the Trust Barrier', Management Science, 57, 9, pp. 1528-
1545
Singh, A, Taneja, A & Mangalaraj, G 2009, 'Creating online surveys: some wisdom from the
trenches tutorial', IEEE Transactions On Professional Communication, Professional
Communication, IEEE Transactions On, IEEE Trans. Profess. Commun, 2, p. 197
Sireci, SG 1998, 'Gathering and Analyzing Content Validity Data', Educational Assessment, 5,
4, pp. 299-321
Sylvia, Cardinale, Nguyen Bang, and Melewar TC. 2016. "Place-based brand experience, place
attachment and loyalty." Marketing Intelligence & Planningno. 3: 302
Tan, L, Johnstone, M, & Yang, L 2016, 'Barriers to green consumption behaviours: The roles
of consumers' green perceptions', Australasian Marketing Journal (AMJ), 24, pp. 288-299

63
Tollin, K, Christensen, L, & Wilke, R 2015, 'Sustainability in business from a marketing
perspective', Journal Of Strategic Marketing, 23, 6, p. 471, Publisher Provided Full Text
Searching File, EBSCOhost
Dawn B. Valentine Thomas L. Powers , (2013)," Generation Y values and lifestyle segments
", Journal of Consumer Marketing, Vol. 30 Iss 7 pp. 597 - 606
Van Osselaer, S, & Janiszewski, C 2001, 'Two Ways of Learning Brand Associations', Journal
Of Consumer Research, 28, 2, pp. 202-223
Vermeir, I, & Verbeke, W 2006, 'SUSTAINABLE FOOD CONSUMPTION: EXPLORING
THE CONSUMER "ATTITUDE - BEHAVIORAL INTENTION" GAP', Journal Of
Agricultural & Environmental Ethics, 19, 2, pp. 169-194
Wiedermann, W, & Hagmann, M 2016, 'Asymmetric properties of the Pearson correlation
coefficient: Correlation as the negative association between linear regression residuals',
Communications In Statistics: Theory & Methods, 45, 21, pp. 6263-6283
Yoo, B, & Donthu, N 2001, 'Developing and validating a multidimensional consumer-based
brand equity scale', Journal Of Business Research, 52, pp. 1-14
Yoo, B, Donthu, N, & Lee, S 2000, 'An Examination of Selected Marketing Mix Elements and
Brand Equity', Journal Of The Academy Of Marketing Science, 28, 2, p. 195
Yu-Shan, C, & Ching-Hsun, C 2013, 'Towards green trust : The influences of green perceived
quality, green perceived risk, and green satisfaction', Management Decision, 1, p. 63

64
Books
Bryman, A. & Bell, E. (2011) Business Research Methods. Oxford University Press Inc., New
York
Collis, J. & Hussey, R. (2009). Business research: a practical guide for undergraduate &
postgraduate students. (3. ed.) Basingstoke: Palgrave Macmillan
Creswell, John W. (2014) Research Design: Qualitative, Quantitative, and Mixed Methods
Approaches. (4th ed.) SAGE Publications, Inc., Los Angeles
Dancey, C.P. and Reidy, J. 2011. Statistics without maths for psychology, 5th edition. Harlow:
Pearson Prentice Hall.
Green, S. B. (1991) How many subject does it take to do a regression analysis? Multivariate
Behavioral Research, Vol 26, No3, pp. 499-510
Greener, S. (2008) Business Research Methods. Dr. Sue Greener & Ventus Publishing ApS
Hair, J, Black, W, Babin, B, Anderson, R, 2010, Multivariate Data Analysis: A Global
Perspective, 7ed.: Upper Saddle River, N.J: Pearson Education, cop. 2010.
Hair, J., Wolfinbarger, M., Money, A., Samouel, P. and Page, M. 2011. Essentials of Business
Research Methods. 2nd Edition. New York: M.E. Sharpe.
Hoffman, W. 2007. Logistics get trendy. Traffic World 271, no. 5: 15.
Lee, N. & Lings, I. (2008). Doing business research: a guide to theory and practice. London:
SAGE Publications Ltd
Malhotra, Naresh, (2004), Marketing Research: An Applied Orientation, 4th edition,
Pearson/Prentice Hall.
Malhotra, N.K., Birks, D.F., 2006. Marketing research: an applied approach. Financial
Times/Prentice Hall, Harlow, England; New York, N.Y

65
Neuman, W.L., 2003. Social Research Methods - Qualitative and Quantitative Approaches. 7th
ed. Edinburgh Gate: Pearson Education Limited.
Saunders, M., Lewis, P. & Thornhill, A. (2009): “Research Methods for Business Students”,
Harlow, UK: Pearson
Zikmund, W. G., Babin, B. J., Carr, J. C. & Griffin, M. (2010): “Business Research Methods”,
8th Edition, Cincinnati, OH, USA: South-Western College Pub

66
Appendix
Hello! We are two students studying at Linnaeus University and currently writing our bachelor thesis about green marketing. We are conducting our study on the fashion clothing industry and thereby analyzing the Swedish Generation Y. We would be very grateful if you could take 5 minutes of your precious time to help us develop our project. All responses will be treated anonymously and will not be utilized in any way beyond research purpose. Thank you very much! Green marketing in the fashion clothing industry Green marketing refers to the process of selling products and/or services based on their environmental benefits. Green marketing is typically practiced by companies that are committed to sustainable development and corporate social responsibility.
1. I am between 18 - 35 years old.
Yes No
2. I am currently living in Sweden.
Yes No
3. I prefer products that have a long product life.
Strongly disagree 1 2 3 4 5 Strongly agree
4. I prefer products that are non-toxic.
Strongly disagree 1 2 3 4 5 Strongly agree
5. I prefer products that are manufactured using recyclable materials.
Strongly disagree 1 2 3 4 5 Strongly agree
6. I prefer products with reduced amount of packaging
Strongly disagree 1 2 3 4 5 Strongly agree
7. I prefer products where the label makes the qualities of the product stand out.
Strongly disagree 1 2 3 4 5 Strongly agree

67
8. I prefer products where the label contains certification from a trustworthy organisation.
Strongly disagree 1 2 3 4 5 Strongly agree
9. I am willing to pay a higher price for environmentally friendly products.
Strongly disagree 1 2 3 4 5 Strongly agree
10. I believe a premium price for environmentally friendly products is justified by the additional value they give.
Strongly disagree 1 2 3 4 5 Strongly agree
11. I am willing to pay a higher price if I receive a discount for returning the recyclable packaging.
Strongly disagree 1 2 3 4 5 Strongly agree
12. I am positive towards accurate advertisement about the benefits of the product.
Strongly disagree 1 2 3 4 5 Strongly agree
13. I am positive towards packaging of the product containing pro-environmental appeals.
Strongly disagree 1 2 3 4 5 Strongly agree
14. I am positive towards information about environmentally friendly products in newspapers and magazines.
Strongly disagree 1 2 3 4 5 Strongly agree
15. My family & friend’s beliefs about environmentally friendly products is important for me. Strongly disagree 1 2 3 4 5 Strongly agree
16. I talk about environmentally friendly products with family & friends.
Strongly disagree 1 2 3 4 5 Strongly agree
17. It is important for me that the company provides me with a place for the disposal of recyclable materials.
Strongly disagree 1 2 3 4 5 Strongly agree

68
18. It is important for me that the location of environmentally friendly products are easily accessible.
Strongly disagree 1 2 3 4 5 Strongly agree
19. It is important for me that environmentally friendly products are frequently available.
Strongly disagree 1 2 3 4 5 Strongly agree 20. Think about a brand X which stands out for environmentally friendly products and have it in
mind, when you answer the following questions (In case you don´t recall any brand X, here you see some examples of brands which stand for environmentally friendly products H&M, Dressmann, Lindex, Jack&Jones, NUDIE JEANS, Filippa K, ASOS).
21. I consider myself committed to brand X.
Strongly disagree 1 2 3 4 5 Strongly agree
22. Brand X is my first choice even if other brands offer similar alternatives
Strongly disagree 1 2 3 4 5 Strongly agree
23. I would consider repurchasing from brand X in the future even if other brands offer similar alternatives.
Strongly disagree 1 2 3 4 5 Strongly agree
24. I connect myself with brand X due to the benefits they offer.
Strongly disagree 1 2 3 4 5 Strongly agree
25. I am aware about the environmentally friendly activities of brand X.
Strongly disagree 1 2 3 4 5 Strongly agree
26. I connect myself to brand X due to their pro-environmental concerns.
Strongly disagree 1 2 3 4 5 Strongly agree
27. I believe brand X is trustworthy.
Strongly disagree 1 2 3 4 5 Strongly agree
28. I expect that brand X is reliable.
Strongly disagree 1 2 3 4 5 Strongly agree

69
29. I am confident that brand X does what it promises regarding environmental friendliness.
Strongly disagree 1 2 3 4 5 Strongly agree
30. I believe that the quality of brand X is superior.
Strongly disagree 1 2 3 4 5 Strongly agree
31. I believe that the quality of brand X meets my expectations.
Strongly disagree 1 2 3 4 5 Strongly agree
32. I believe that the name of brand X makes me perceive it as high quality.
Strongly disagree 1 2 3 4 5 Strongly agree
END Thank you very much for your participation!