Embed Size (px)
Citation preview
GPS and GIS-Based Data Collection and Image Mapping in the Antarctic Peninsula
by Richard D. Sanchez
Open-File Report 99-402 U.S. Department of the Interior U.S. Geological Survey
GPS AND GIS-BASED DATA COLLECTION AND IMAGE MAPPING IN THE ANTARCTIC PENINSULA
Richard D. Sanchez
U.S. Geological Survey 521 National Center Reston, Va. 20192
ABSTRACT
High-resolution satellite images combined with the rapidly evolving global positioning system (GPS) and geographic information system (GIS) technology may offer a quick and effective way to gather information in Antarctica. GPS- and GIS-based data collection systems are used in this project to determine their applicability for gathering ground truthing data in the Antarctic Peninsula. These baseline data will be used in a later study to examine changes in penguin habitats resulting in part from regional climate warming. The research application in this study yields important information on the usefulness and limits of data capture and high-resolution images for mapping in the Antarctic Peninsula.
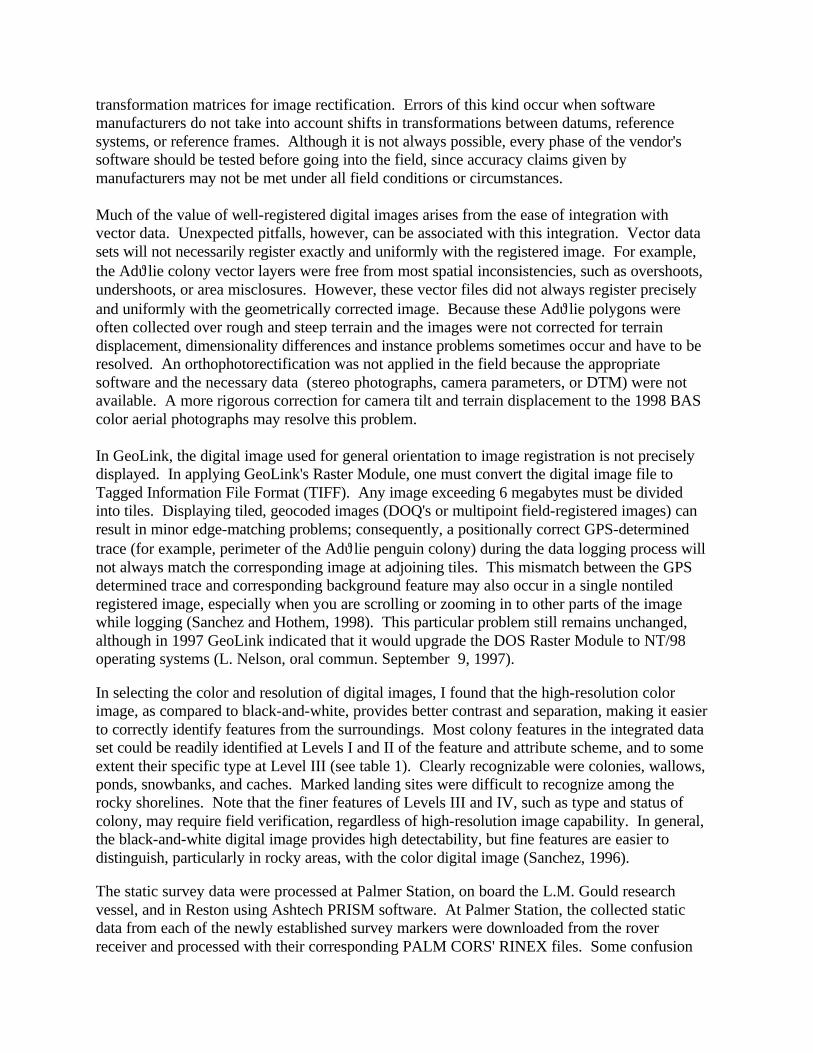
INTRODUCTION In 1998, the National Science Foundation (NSF), Arlington, Va., joined the U.S. Geological Survey (USGS), Reston, Va., in a pilot study to determine the feasibility of using global positioning system (GPS) and geographic information system (GIS) based data capture systems combined with high-resolution images for accurately developing base line data near Palmer Station, Antarctic Peninsula. The ultimate goal of this project, in support of Dr. William R. Fraser, Montana State University, and NSF grant S-035, is to use these data to map the pattern and trend of Adϑlie penguin habitats and their relationship to regional climate change. The fieldwork was carried out between January 6 and February 12, 1999, under the auspices of the NSF and as a cooperative project between the Mapping Applications Center of the USGS, and the Polar Oceans Research Group, Montana State University. Project Area and Source Data The project area is located in the Antarctic Peninsula, the long extended finger of the Andes that reaches south into the Antarctic continent (fig. 1). The Antarctic Peninsula and adjoining islands are often grouped together as the Antarctandean Ridge (Arctowski, 1895). The geology of the peninsula and adjoining islands is dominated by igneous rocks of the Andean Granite-Gabbro intrusive suite, which is estimated to make up over 80 per cent of the total area (Harrington, 1962). The peninsula is a jagged succession of snow peaks, black cliffs, nunataks, and glacier-cloaked mountains. Along side the peninsula are a string of islands covered with rocky moraine ___________________________
Any use of trade, product, or firm names is for descriptive purposes only and does not imply endorsement by the U.S. Government.
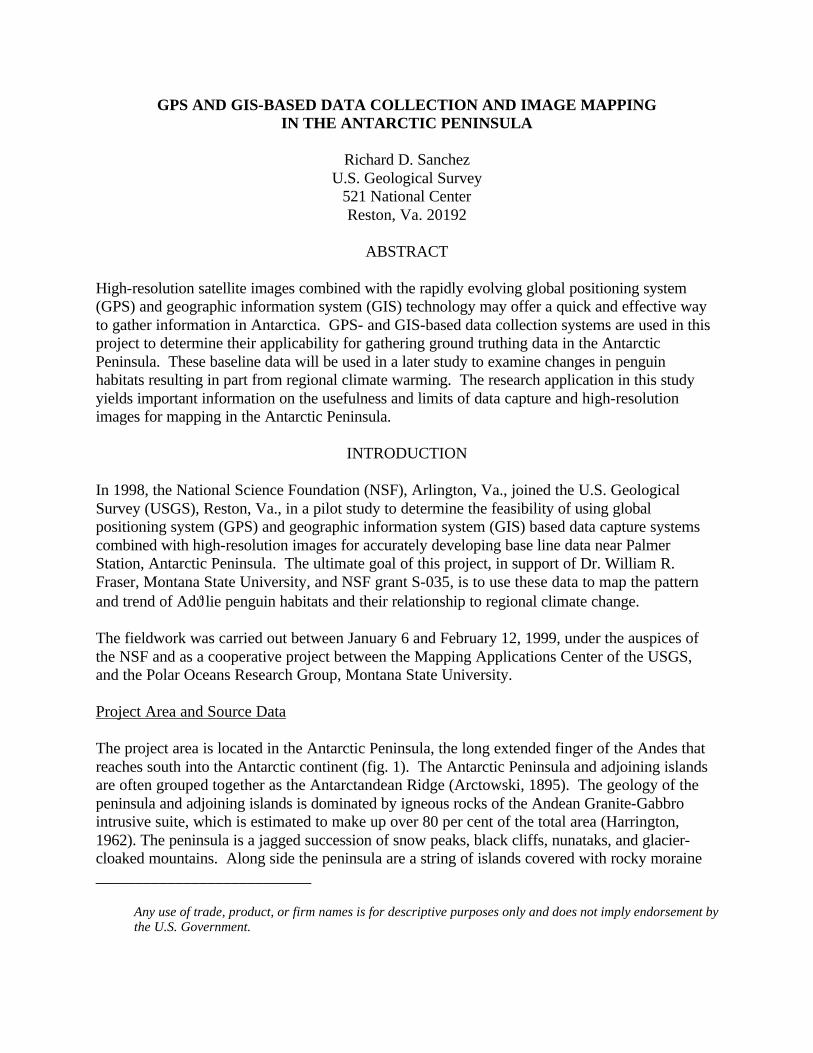
debris left behind by retreating glaciers. These islands, where beaches and cliffs offer snow-free nesting places, are home to millions of penguins, petrels, skuas, shags, and seals. Plants such as lichens and a few mosses, are able to inhabit the windswept, dry surface of the bare rock, which often displays a colorful (yellow, orange, and black) layer fertilized by bird droppings or guano. Mats of blue-green and green algae thrive in the vicinity of many of the bird colonies in part because of the nitrate- and phosphate-rich feces. As many an offshore passer-by will affirm, the air is tainted by the enormous amount of guano produced by penguin colonies. Cushions and turves of moss flourish on gravelly soils, especially where there is some shelter and moisture. There are only two flowering plants that are able to tolerate the peninsula's subzero weather, the low-matted Antarctic hairgrass Deschampsia antarctica and the compact, cushioned Antarctic pearlwort Colobanthus quitensis (Soper, 1994).
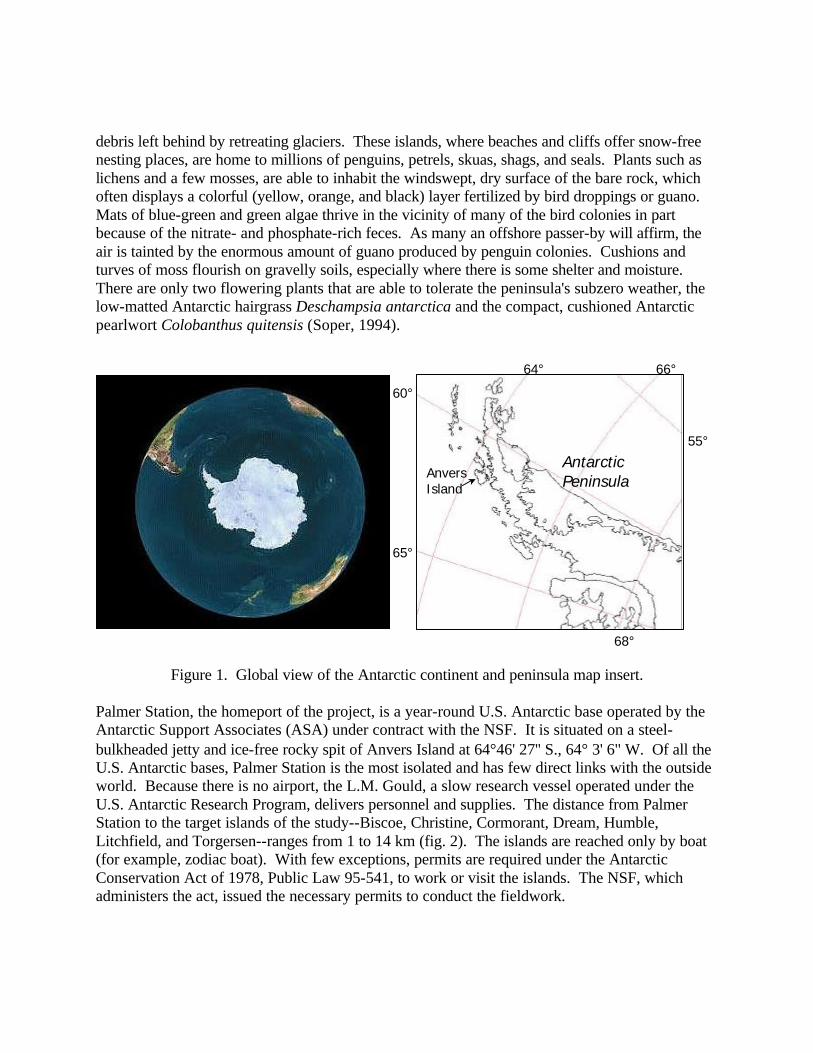
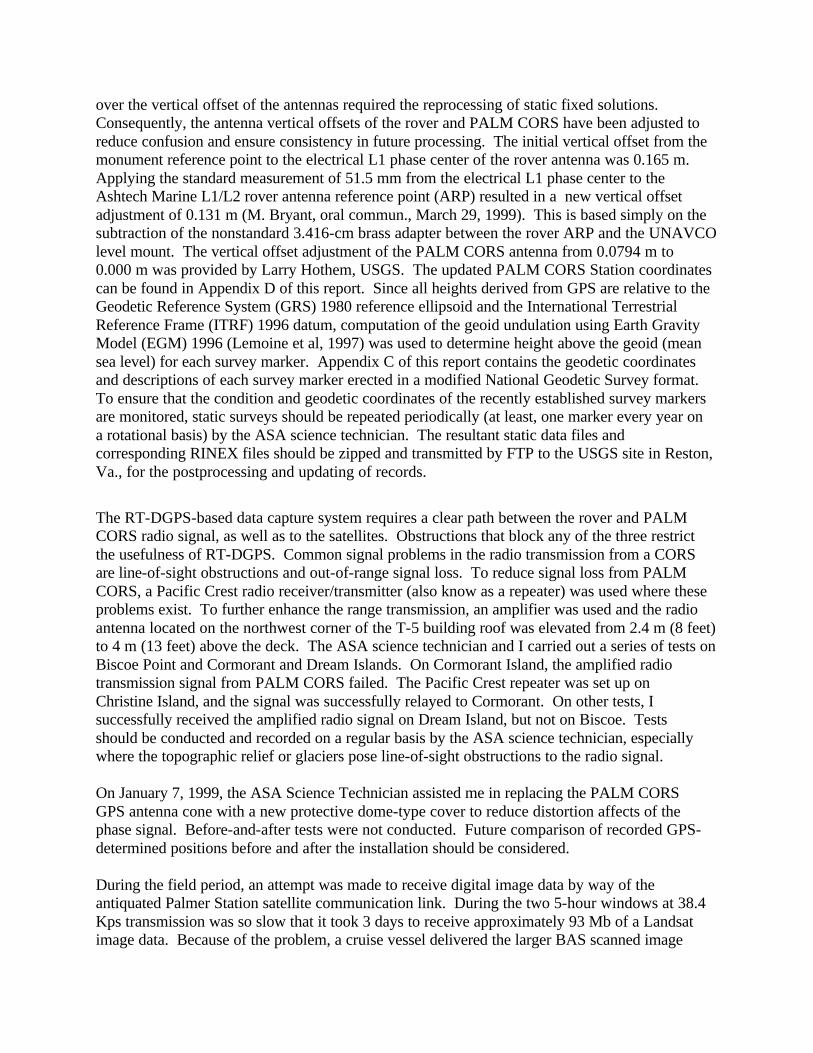
Figure 1. Global view of the Antarctic continent and peninsula map insert. Palmer Station, the homeport of the project, is a year-round U.S. Antarctic base operated by the Antarctic Support Associates (ASA) under contract with the NSF. It is situated on a steel-bulkheaded jetty and ice-free rocky spit of Anvers Island at 64°46' 27'' S., 64° 3' 6" W. Of all the U.S. Antarctic bases, Palmer Station is the most isolated and has few direct links with the outside world. Because there is no airport, the L.M. Gould, a slow research vessel operated under the U.S. Antarctic Research Program, delivers personnel and supplies. The distance from Palmer Station to the target islands of the study--Biscoe, Christine, Cormorant, Dream, Humble, Litchfield, and Torgersen--ranges from 1 to 14 km (fig. 2). The islands are reached only by boat (for example, zodiac boat). With few exceptions, permits are required under the Antarctic Conservation Act of 1978, Public Law 95-541, to work or visit the islands. The NSF, which administers the act, issued the necessary permits to conduct the fieldwork.
60°
55°
65°
64° 66°
68°
Anvers Island
Antarctic Peninsula
The project resource materials include low-altitude (457-m) aerial photographs collected by the British Antarctic Survey (BAS) in December 1998, National Technical Means (NTM) data approved by the Civilian Application Committee, and archived images from the U.S. Antarctic Resource Center (US-ARC). The primary field mapping components comprised an Ashtech Z-12 dual-frequency GPS receiver and ERDAS Imagine 8.3.1 (including Arc-structured Vector Module), ArcView 3.1, PRISM, and GeoLink 5.7-K software installed on a ruggedized GRID notebook PC. Augmenting the RT-DGPS capability was the Rockwell Precise GPS Receiver (PLGR +96) with precise positioning service (PPS).
Figure 2. Satellite view of Anvers Island and project area.
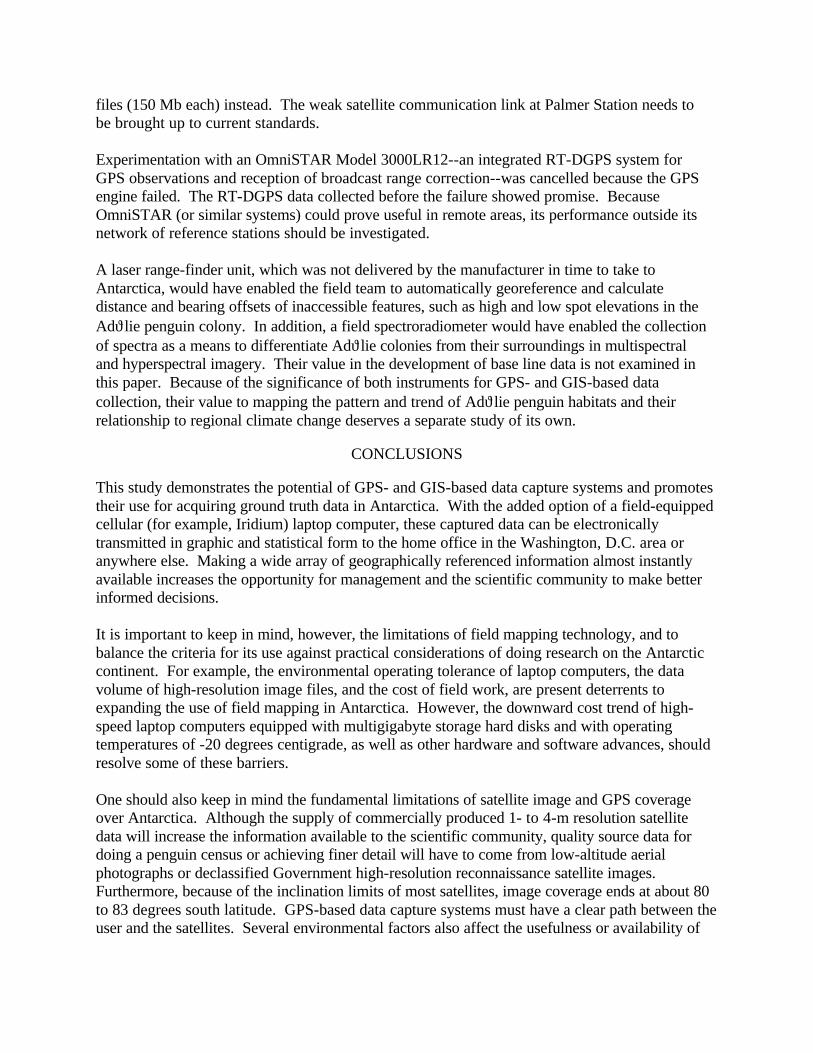
METHODOLOGY The flow chart in figure 3 shows the methodology applied in this investigation. Fieldwork was conducted during the austral summer, which provided the benefit of long daylight periods. Before going to the field, the study group did an inventory, collection, and evaluation of existing image and vector data; next they developed the data dictionary and transformed any useable data into a GIS-compatible format. Very little detailed, accurate geographic digital data and few published or unpublished maps exist for the seven target islands. Local map sketches of landings, caches, and colony locations were available, although not always complete. A USGS unpublished report on the construction of the permanent GPS continuous operation reference station at Palmer Station (PALM CORS) proved useful (Baumann, 1997). Defining Features and Attribute Table Although the Adϑlie penguin habitat was of primary interest to this study, other landscape features were included. The multilevel land use and land cover classification of the USGS system (Anderson et al., 1976) was adapted for use by modifying several categories in creating the data dictionary (table 1). After the data dictionary was developed, the features and attributes were collected on the nearest target island (for example, Torgersen Island). This collection served as a test of the equipment and of the feature and attribute scheme. Once the template was
Anvers Island
Cape Monaco
Biscoe Point Litchfield Island Cormorant Island
Humble Island
Christine Island Torgersen Island
0 10 km5
Dream Island PALMER STATION
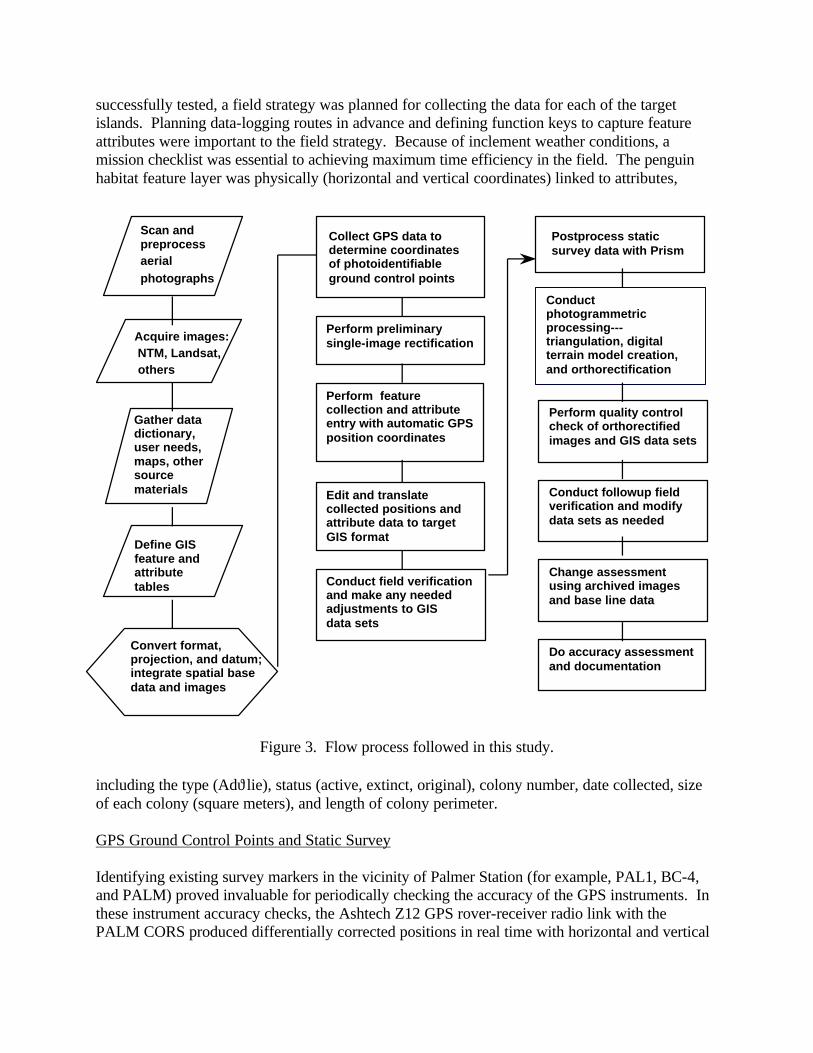
successfully tested, a field strategy was planned for collecting the data for each of the target islands. Planning data-logging routes in advance and defining function keys to capture feature attributes were important to the field strategy. Because of inclement weather conditions, a mission checklist was essential to achieving maximum time efficiency in the field. The penguin habitat feature layer was physically (horizontal and vertical coordinates) linked to attributes,
Figure 3. Flow process followed in this study.
including the type (Adϑlie), status (active, extinct, original), colony number, date collected, size of each colony (square meters), and length of colony perimeter. GPS Ground Control Points and Static Survey Identifying existing survey markers in the vicinity of Palmer Station (for example, PAL1, BC-4, and PALM) proved invaluable for periodically checking the accuracy of the GPS instruments. In these instrument accuracy checks, the Ashtech Z12 GPS rover-receiver radio link with the PALM CORS produced differentially corrected positions in real time with horizontal and vertical
Convert format, projection, and datum; integrate spatial base data and images
NTM, Landsat,Acquire images:
others
Gather data dictionary, user needs, maps, other source materials
Define GIS feature and attribute tables
preprocess Scan and
aerial photographs
Collect GPS data to determine coordinates of photoidentifiable ground control points
Perform preliminary single-image rectification
Perform feature collection and attribute entry with automatic GPS position coordinates
Edit and translate collected positions and attribute data to target GIS format
Perform quality control check of orthorectified images and GIS data sets
Conduct field verification and make any needed adjustments to GIS data sets
Postprocess static survey data with Prism
Conduct photogrammetric processing---triangulation, digital terrain model creation, and orthorectification
Conduct followup field verification and modify data sets as needed
Change assessment using archived images and base line data
Do accuracy assessment and documentation
accuracies at the millimeter-to-centimeter levels (see Appendix A). The Rockwell PLGR with PPS for point positions determined by autonomous methods produced horizontal and vertical accuracies in the submeter-to-meter range. To synchronize with the GPS-based data collection and to know the precise grid coordinate of any point on the islands, during January 1999 the field team located a minimum of 15 photo-identifiable and well-distributed RT-DGPS-collected ground control points for each island.
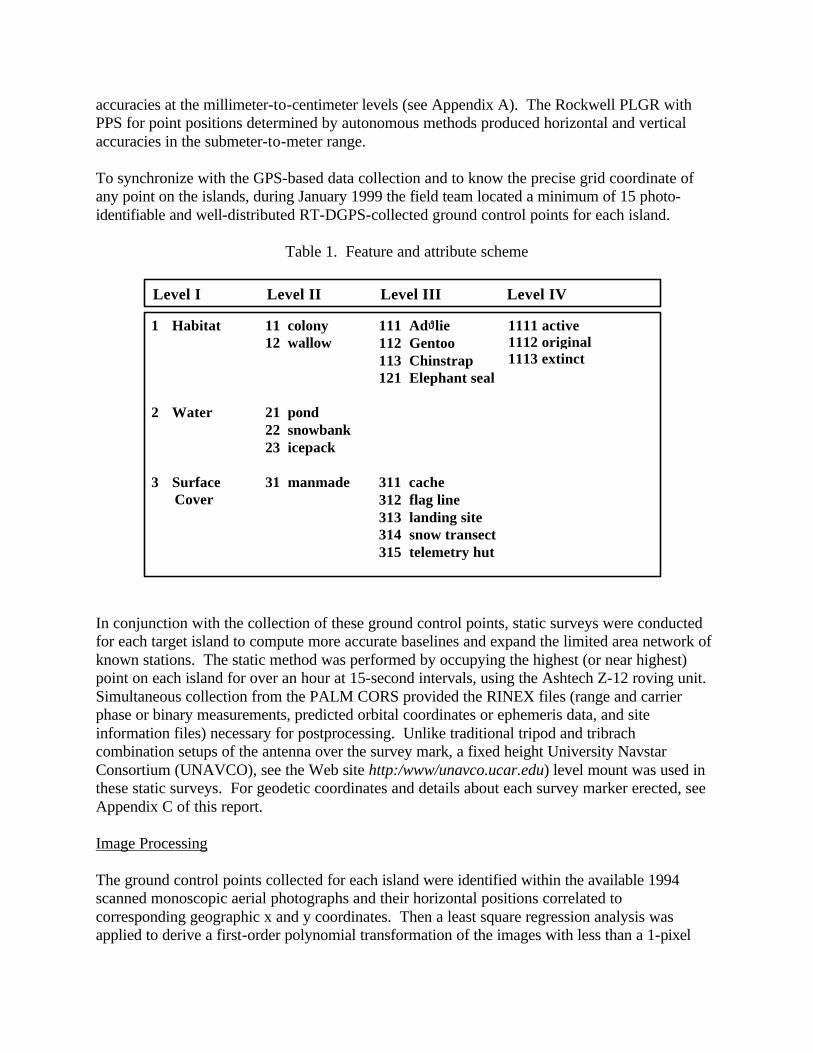
Table 1. Feature and attribute scheme
Level I Level II Level III Level IV
1 Habitat
2 Water
3 Surface Cover
11 colony12 wallow
21 pond22 snowbank23 icepack
31 manmade
111 Adϑϑlie112 Gentoo113 Chinstrap121 Elephant seal
311 cache312 flag line313 landing site314 snow transect315 telemetry hut
1111 active 1112 original 1113 extinct
In conjunction with the collection of these ground control points, static surveys were conducted for each target island to compute more accurate baselines and expand the limited area network of known stations. The static method was performed by occupying the highest (or near highest) point on each island for over an hour at 15-second intervals, using the Ashtech Z-12 roving unit. Simultaneous collection from the PALM CORS provided the RINEX files (range and carrier phase or binary measurements, predicted orbital coordinates or ephemeris data, and site information files) necessary for postprocessing. Unlike traditional tripod and tribrach combination setups of the antenna over the survey mark, a fixed height University Navstar Consortium (UNAVCO), see the Web site http:/www/unavco.ucar.edu) level mount was used in these static surveys. For geodetic coordinates and details about each survey marker erected, see Appendix C of this report. Image Processing The ground control points collected for each island were identified within the available 1994 scanned monoscopic aerial photographs and their horizontal positions correlated to corresponding geographic x and y coordinates. Then a least square regression analysis was applied to derive a first-order polynomial transformation of the images with less than a 1-pixel
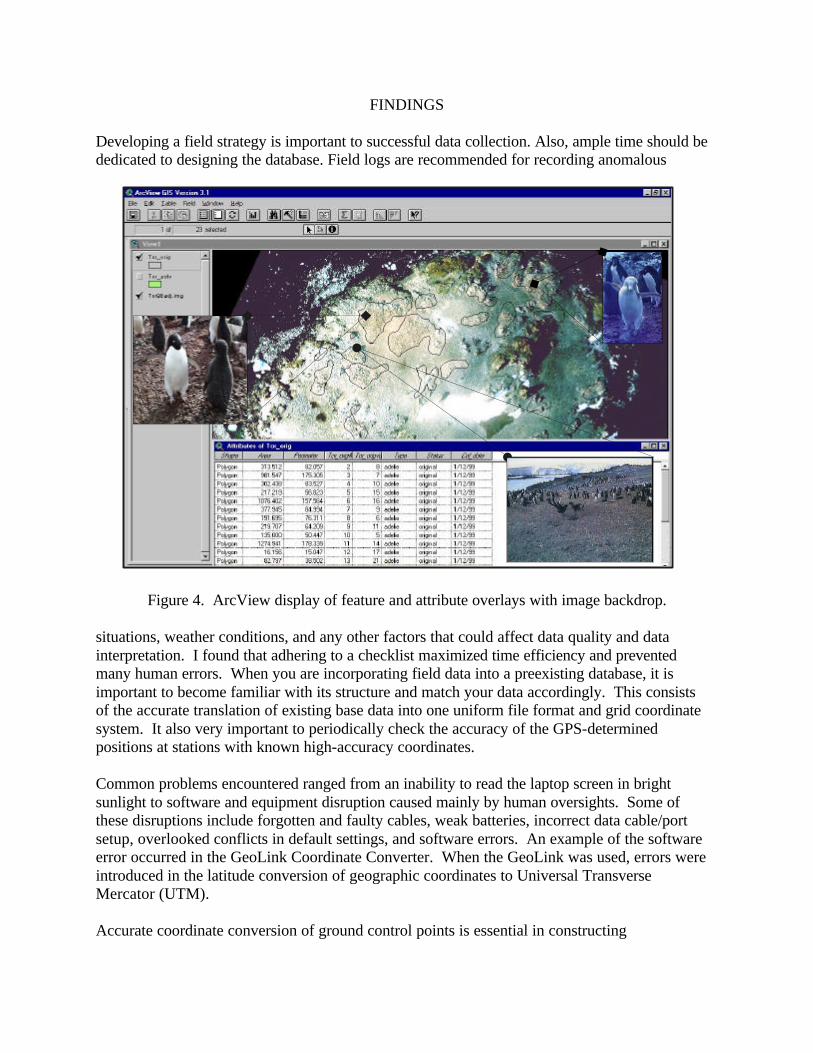
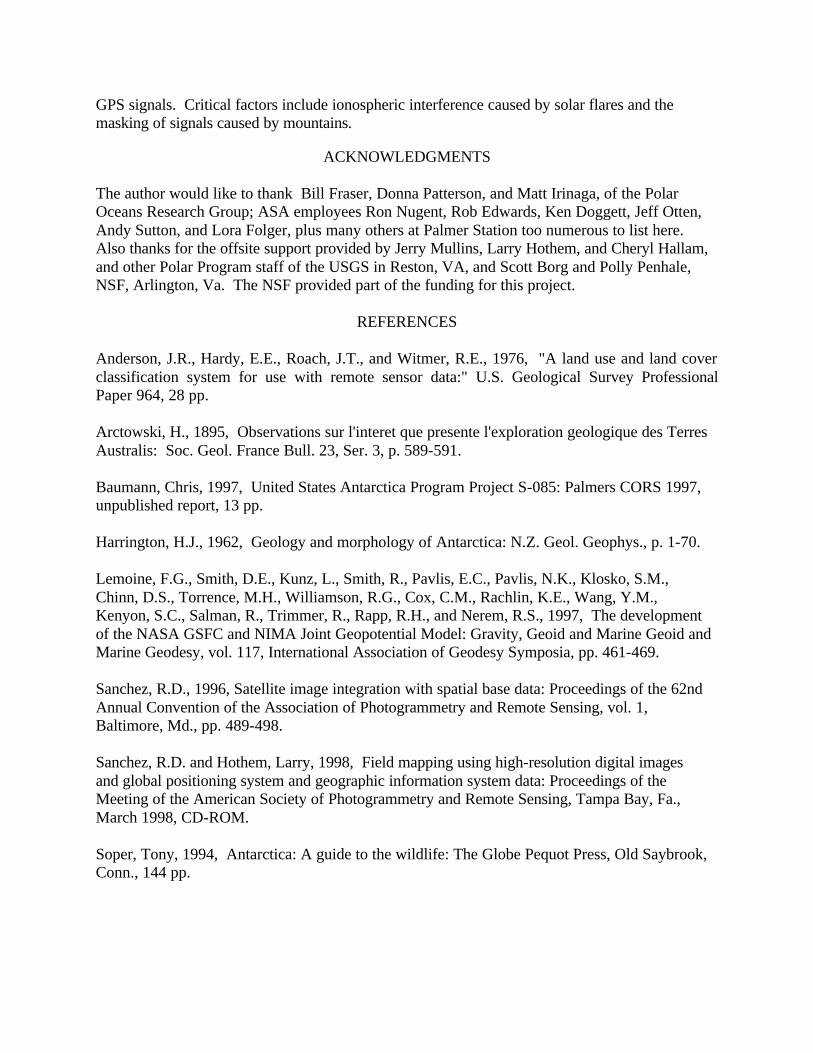
root-mean-square error. Following the geometric correction and nearest neighbor resampling at an output pixel size of 1 m by 1 m, I used a high pass box filter to enhance higher spatial frequency components of the image. Because most of the island topography contained steep relief, correction for terrain displacement with a digital terrain model (DTM) was deemed essential. However, owing to the late arrival (February 7, 1999) of the scanned stereoscopic BAS aerial photographs, plus software limitations, the DTM creation and orthorectification had to be processed in Reston, Va., using Softcopy Exploitation Tool Set (SOCET SET). Feature Collection and Attribute Entry The GPS receiver and GeoLink field mapping software were used primarily to collect colony features and attributes. The GPS and GeoLink interface allowed the laptop operator to log the footpath continuously. The positional data were transmitted from the GPS receiver to GeoLink by National Marine Electronics Association Interface Standard (NMEA 0183) protocol. The GeoLink export program translated the captured data from its native storage format to ArcSHAPE, the target GIS file format. Most of the area data were collected with the GPS receiver's external antenna magnetic-mounted to the field pack pole. Where there were no line-of-sight obstructions on the islands, the external antenna often required less than 5 seconds to obtain a fix on the satellites. Once the field team obtained the fix on the satellites, tracking began at 1-second intervals. Stops were made to identify and photograph features and collect attribute data. Information about feature attributes was keyed into the computer simultaneously as GPS-determined coordinates were automatically collected. The digital camera image allowed the team to cross-check the accuracy of the attribute data collected. It took less than 1 minute to enter attributes related to any colony feature. The descriptive data of features were collected by using predefined "hot keys" on the keyboard for different attributes (for example, type, status, and so on). Upon returning to Palmer Station and after inspecting the data collection results, I exported the data from GeoLink's native storage format (.DAT, .PLG .MDB and .IDB files) to the target GIS or ArcView interchange format (.SHP, .SHX, and .DBF files). During the export of the data to ArcSHAPE file format, they were cleaned by setting the GeoLink Translate Filters with an average cluster outlier tolerance of 10 to collapse small unwanted polygons and the weed filter of 10 m to remove unnecessary points. Setting the ArcView file extension to ERDAS Imagine Image support allowed the rectified images to be viewed as backdrops. Color and black-and-white ArcView graphic and tabular information was printed to supplement the verification process. Each spatial base overlay was individually viewed in contrasting colors over the image and systematically inspected for proper fit (fig. 4). The ability to switch overlays and toggle to adjust the ArcView color display provided a quick visual check of the registration revealed and any spatial inconsistencies. A random sampling was accomplished by systematically reviewing a vector display of the data set and image backdrop in subsections. Any feature that appeared to be either missing, altered, or unidentifiable in the image was marked for further inspection. Once compiled, the base line vector layers were stored on compact discs and on the hard disk of the Palmer Station science server.
FINDINGS
Developing a field strategy is important to successful data collection. Also, ample time should be dedicated to designing the database. Field logs are recommended for recording anomalous
Figure 4. ArcView display of feature and attribute overlays with image backdrop. situations, weather conditions, and any other factors that could affect data quality and data interpretation. I found that adhering to a checklist maximized time efficiency and prevented many human errors. When you are incorporating field data into a preexisting database, it is important to become familiar with its structure and match your data accordingly. This consists of the accurate translation of existing base data into one uniform file format and grid coordinate system. It also very important to periodically check the accuracy of the GPS-determined positions at stations with known high-accuracy coordinates. Common problems encountered ranged from an inability to read the laptop screen in bright sunlight to software and equipment disruption caused mainly by human oversights. Some of these disruptions include forgotten and faulty cables, weak batteries, incorrect data cable/port setup, overlooked conflicts in default settings, and software errors. An example of the software error occurred in the GeoLink Coordinate Converter. When the GeoLink was used, errors were introduced in the latitude conversion of geographic coordinates to Universal Transverse Mercator (UTM). Accurate coordinate conversion of ground control points is essential in constructing
transformation matrices for image rectification. Errors of this kind occur when software manufacturers do not take into account shifts in transformations between datums, reference systems, or reference frames. Although it is not always possible, every phase of the vendor's software should be tested before going into the field, since accuracy claims given by manufacturers may not be met under all field conditions or circumstances. Much of the value of well-registered digital images arises from the ease of integration with vector data. Unexpected pitfalls, however, can be associated with this integration. Vector data sets will not necessarily register exactly and uniformly with the registered image. For example, the Adϑlie colony vector layers were free from most spatial inconsistencies, such as overshoots, undershoots, or area misclosures. However, these vector files did not always register precisely and uniformly with the geometrically corrected image. Because these Adϑlie polygons were often collected over rough and steep terrain and the images were not corrected for terrain displacement, dimensionality differences and instance problems sometimes occur and have to be resolved. An orthophotorectification was not applied in the field because the appropriate software and the necessary data (stereo photographs, camera parameters, or DTM) were not available. A more rigorous correction for camera tilt and terrain displacement to the 1998 BAS color aerial photographs may resolve this problem. In GeoLink, the digital image used for general orientation to image registration is not precisely displayed. In applying GeoLink's Raster Module, one must convert the digital image file to Tagged Information File Format (TIFF). Any image exceeding 6 megabytes must be divided into tiles. Displaying tiled, geocoded images (DOQ's or multipoint field-registered images) can result in minor edge-matching problems; consequently, a positionally correct GPS-determined trace (for example, perimeter of the Adϑlie penguin colony) during the data logging process will not always match the corresponding image at adjoining tiles. This mismatch between the GPS determined trace and corresponding background feature may also occur in a single nontiled registered image, especially when you are scrolling or zooming in to other parts of the image while logging (Sanchez and Hothem, 1998). This particular problem still remains unchanged, although in 1997 GeoLink indicated that it would upgrade the DOS Raster Module to NT/98 operating systems (L. Nelson, oral commun. September 9, 1997). In selecting the color and resolution of digital images, I found that the high-resolution color image, as compared to black-and-white, provides better contrast and separation, making it easier to correctly identify features from the surroundings. Most colony features in the integrated data set could be readily identified at Levels I and II of the feature and attribute scheme, and to some extent their specific type at Level III (see table 1). Clearly recognizable were colonies, wallows, ponds, snowbanks, and caches. Marked landing sites were difficult to recognize among the rocky shorelines. Note that the finer features of Levels III and IV, such as type and status of colony, may require field verification, regardless of high-resolution image capability. In general, the black-and-white digital image provides high detectability, but fine features are easier to distinguish, particularly in rocky areas, with the color digital image (Sanchez, 1996). The static survey data were processed at Palmer Station, on board the L.M. Gould research vessel, and in Reston using Ashtech PRISM software. At Palmer Station, the collected static data from each of the newly established survey markers were downloaded from the rover receiver and processed with their corresponding PALM CORS' RINEX files. Some confusion
over the vertical offset of the antennas required the reprocessing of static fixed solutions. Consequently, the antenna vertical offsets of the rover and PALM CORS have been adjusted to reduce confusion and ensure consistency in future processing. The initial vertical offset from the monument reference point to the electrical L1 phase center of the rover antenna was 0.165 m. Applying the standard measurement of 51.5 mm from the electrical L1 phase center to the Ashtech Marine L1/L2 rover antenna reference point (ARP) resulted in a new vertical offset adjustment of 0.131 m (M. Bryant, oral commun., March 29, 1999). This is based simply on the subtraction of the nonstandard 3.416-cm brass adapter between the rover ARP and the UNAVCO level mount. The vertical offset adjustment of the PALM CORS antenna from 0.0794 m to 0.000 m was provided by Larry Hothem, USGS. The updated PALM CORS Station coordinates can be found in Appendix D of this report. Since all heights derived from GPS are relative to the Geodetic Reference System (GRS) 1980 reference ellipsoid and the International Terrestrial Reference Frame (ITRF) 1996 datum, computation of the geoid undulation using Earth Gravity Model (EGM) 1996 (Lemoine et al, 1997) was used to determine height above the geoid (mean sea level) for each survey marker. Appendix C of this report contains the geodetic coordinates and descriptions of each survey marker erected in a modified National Geodetic Survey format. To ensure that the condition and geodetic coordinates of the recently established survey markers are monitored, static surveys should be repeated periodically (at least, one marker every year on a rotational basis) by the ASA science technician. The resultant static data files and corresponding RINEX files should be zipped and transmitted by FTP to the USGS site in Reston, Va., for the postprocessing and updating of records.
The RT-DGPS-based data capture system requires a clear path between the rover and PALM CORS radio signal, as well as to the satellites. Obstructions that block any of the three restrict the usefulness of RT-DGPS. Common signal problems in the radio transmission from a CORS are line-of-sight obstructions and out-of-range signal loss. To reduce signal loss from PALM CORS, a Pacific Crest radio receiver/transmitter (also know as a repeater) was used where these problems exist. To further enhance the range transmission, an amplifier was used and the radio antenna located on the northwest corner of the T-5 building roof was elevated from 2.4 m (8 feet) to 4 m (13 feet) above the deck. The ASA science technician and I carried out a series of tests on Biscoe Point and Cormorant and Dream Islands. On Cormorant Island, the amplified radio transmission signal from PALM CORS failed. The Pacific Crest repeater was set up on Christine Island, and the signal was successfully relayed to Cormorant. On other tests, I successfully received the amplified radio signal on Dream Island, but not on Biscoe. Tests should be conducted and recorded on a regular basis by the ASA science technician, especially where the topographic relief or glaciers pose line-of-sight obstructions to the radio signal. On January 7, 1999, the ASA Science Technician assisted me in replacing the PALM CORS GPS antenna cone with a new protective dome-type cover to reduce distortion affects of the phase signal. Before-and-after tests were not conducted. Future comparison of recorded GPS-determined positions before and after the installation should be considered. During the field period, an attempt was made to receive digital image data by way of the antiquated Palmer Station satellite communication link. During the two 5-hour windows at 38.4 Kps transmission was so slow that it took 3 days to receive approximately 93 Mb of a Landsat image data. Because of the problem, a cruise vessel delivered the larger BAS scanned image
files (150 Mb each) instead. The weak satellite communication link at Palmer Station needs to be brought up to current standards. Experimentation with an OmniSTAR Model 3000LR12--an integrated RT-DGPS system for GPS observations and reception of broadcast range correction--was cancelled because the GPS engine failed. The RT-DGPS data collected before the failure showed promise. Because OmniSTAR (or similar systems) could prove useful in remote areas, its performance outside its network of reference stations should be investigated. A laser range-finder unit, which was not delivered by the manufacturer in time to take to Antarctica, would have enabled the field team to automatically georeference and calculate distance and bearing offsets of inaccessible features, such as high and low spot elevations in the Adϑlie penguin colony. In addition, a field spectroradiometer would have enabled the collection of spectra as a means to differentiate Adϑlie colonies from their surroundings in multispectral and hyperspectral imagery. Their value in the development of base line data is not examined in this paper. Because of the significance of both instruments for GPS- and GIS-based data collection, their value to mapping the pattern and trend of Adϑlie penguin habitats and their relationship to regional climate change deserves a separate study of its own.
CONCLUSIONS This study demonstrates the potential of GPS- and GIS-based data capture systems and promotes their use for acquiring ground truth data in Antarctica. With the added option of a field-equipped cellular (for example, Iridium) laptop computer, these captured data can be electronically transmitted in graphic and statistical form to the home office in the Washington, D.C. area or anywhere else. Making a wide array of geographically referenced information almost instantly available increases the opportunity for management and the scientific community to make better informed decisions. It is important to keep in mind, however, the limitations of field mapping technology, and to balance the criteria for its use against practical considerations of doing research on the Antarctic continent. For example, the environmental operating tolerance of laptop computers, the data volume of high-resolution image files, and the cost of field work, are present deterrents to expanding the use of field mapping in Antarctica. However, the downward cost trend of high-speed laptop computers equipped with multigigabyte storage hard disks and with operating temperatures of -20 degrees centigrade, as well as other hardware and software advances, should resolve some of these barriers. One should also keep in mind the fundamental limitations of satellite image and GPS coverage over Antarctica. Although the supply of commercially produced 1- to 4-m resolution satellite data will increase the information available to the scientific community, quality source data for doing a penguin census or achieving finer detail will have to come from low-altitude aerial photographs or declassified Government high-resolution reconnaissance satellite images. Furthermore, because of the inclination limits of most satellites, image coverage ends at about 80 to 83 degrees south latitude. GPS-based data capture systems must have a clear path between the user and the satellites. Several environmental factors also affect the usefulness or availability of
GPS signals. Critical factors include ionospheric interference caused by solar flares and the masking of signals caused by mountains.
ACKNOWLEDGMENTS The author would like to thank Bill Fraser, Donna Patterson, and Matt Irinaga, of the Polar Oceans Research Group; ASA employees Ron Nugent, Rob Edwards, Ken Doggett, Jeff Otten, Andy Sutton, and Lora Folger, plus many others at Palmer Station too numerous to list here. Also thanks for the offsite support provided by Jerry Mullins, Larry Hothem, and Cheryl Hallam, and other Polar Program staff of the USGS in Reston, VA, and Scott Borg and Polly Penhale, NSF, Arlington, Va. The NSF provided part of the funding for this project.
REFERENCES Anderson, J.R., Hardy, E.E., Roach, J.T., and Witmer, R.E., 1976, "A land use and land cover classification system for use with remote sensor data:" U.S. Geological Survey Professional Paper 964, 28 pp. Arctowski, H., 1895, Observations sur l'interet que presente l'exploration geologique des Terres Australis: Soc. Geol. France Bull. 23, Ser. 3, p. 589-591. Baumann, Chris, 1997, United States Antarctica Program Project S-085: Palmers CORS 1997, unpublished report, 13 pp. Harrington, H.J., 1962, Geology and morphology of Antarctica: N.Z. Geol. Geophys., p. 1-70. Lemoine, F.G., Smith, D.E., Kunz, L., Smith, R., Pavlis, E.C., Pavlis, N.K., Klosko, S.M., Chinn, D.S., Torrence, M.H., Williamson, R.G., Cox, C.M., Rachlin, K.E., Wang, Y.M., Kenyon, S.C., Salman, R., Trimmer, R., Rapp, R.H., and Nerem, R.S., 1997, The development of the NASA GSFC and NIMA Joint Geopotential Model: Gravity, Geoid and Marine Geoid and Marine Geodesy, vol. 117, International Association of Geodesy Symposia, pp. 461-469. Sanchez, R.D., 1996, Satellite image integration with spatial base data: Proceedings of the 62nd Annual Convention of the Association of Photogrammetry and Remote Sensing, vol. 1, Baltimore, Md., pp. 489-498. Sanchez, R.D. and Hothem, Larry, 1998, Field mapping using high-resolution digital images and global positioning system and geographic information system data: Proceedings of the Meeting of the American Society of Photogrammetry and Remote Sensing, Tampa Bay, Fa., March 1998, CD-ROM. Soper, Tony, 1994, Antarctica: A guide to the wildlife: The Globe Pequot Press, Old Saybrook, Conn., 144 pp.
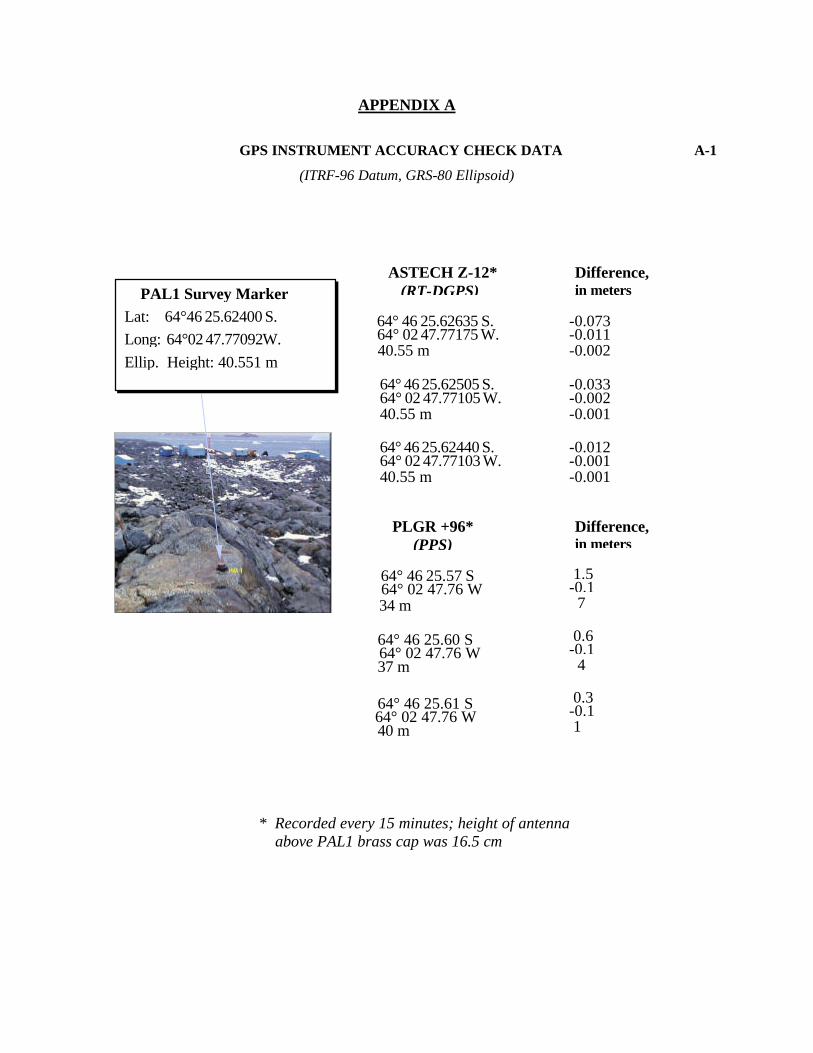
APPENDIX A
GPS INSTRUMENT ACCURACY CHECK DATA A-1
(ITRF-96 Datum, GRS-80 Ellipsoid)
* Recorded every 15 minutes; height of antenna above PAL1 brass cap was 16.5 cm
ASTECH Z-12* (RT-DGPS)
64° 46� 25.62635� S. 64° 02� 47.77175� W. 40.55 m
64° 46� 25.62440� S.64° 02� 47.77103� W.40.55 m
64° 46� 25.62505� S.64° 02� 47.77105� W.40.55 m
PLGR +96* (PPS)
64° 02� 47.76� W 64° 46� 25.57� S
34 m
64° 02� 47.76� W 64° 46� 25.60� S
37 m
64° 02� 47.76� W 64° 46� 25.61� S
40 m
PAL1 Survey Marker Lat: 64°46� 25.62400� S.
Long: 64°02� 47.77092�W.
Ellip. Height: 40.551 m
Difference, in meters
-0.073 -0.011 -0.002
-0.012 -0.001 -0.001
-0.033 -0.002 -0.001
Difference, in meters
1.5 -0.1 7
0.3 -0.1 1
0.6 -0.1 4
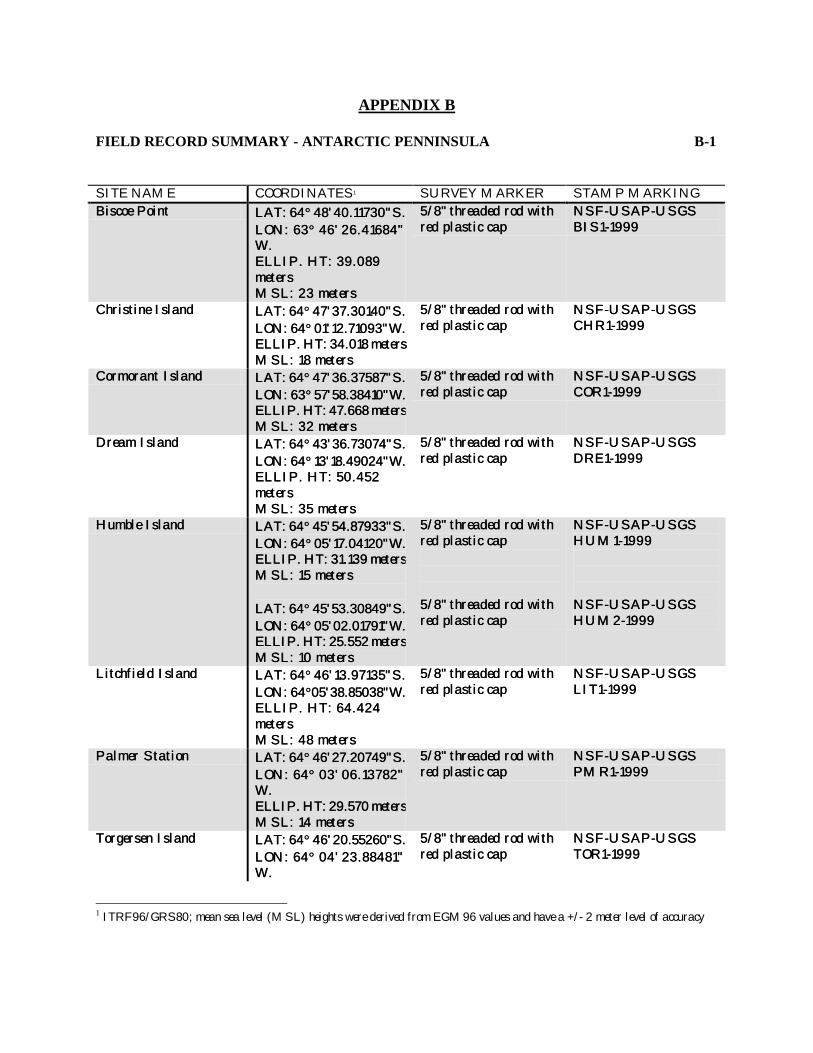
APPENDIX B
FIELD RECORD SUMMARY - ANTARCTIC PENNINSULA B-1 SITE NAME COORDINATES1 SURVEY MARKER STAMP MARKING Biscoe PointBiscoe Point LAT: 64LAT: 64°° 48' 40.11730" S. 48' 40.11730" S.
LON: 63LON: 63°° 46' 26.41684" 46' 26.41684" W.W. ELLIP. HT: 39.089 ELLIP. HT: 39.089 metersmeters MSL: 23 metersMSL: 23 meters
5/8" t5/8" threaded rod withhreaded rod with red plastic capred plastic cap
NSFNSF--USAPUSAP--USGSUSGS BIS1BIS1--19991999
Christine IslandChristine Island LAT: 64LAT: 64°° 47' 37.30140" S. 47' 37.30140" S. LON: 64LON: 64°° 01' 12.71093" W. 01' 12.71093" W. ELLIP. HT: 34.018 metersELLIP. HT: 34.018 meters MSL: 18 metersMSL: 18 meters
5/8" threaded rod with5/8" threaded rod with red plastic capred plastic cap
NSFNSF--USAPUSAP--USGSUSGS CHR1CHR1--19991999
Cormorant IslandCormorant Island LAT: 64LAT: 64°° 47' 36.37587" S. 47' 36.37587" S. LON: 63LON: 63°° 57' 58.38410" W. 57' 58.38410" W. ELLIP. HT: 47.668 metersELLIP. HT: 47.668 meters MSL: 32 metersMSL: 32 meters
5/8" threaded rod with5/8" threaded rod with red plastic capred plastic cap
NSFNSF--USAPUSAP--USGSUSGS COR1COR1--19991999
Dream IslandDream Island LAT: 64LAT: 64°° 43' 36.73074" S. 43' 36.73074" S. LON: 64LON: 64°° 13' 18.49024" W. 13' 18.49024" W. ELLIP. HT: 50.452 ELLIP. HT: 50.452 metersmeters MSL: 35 metersMSL: 35 meters
5/85/8" threaded rod with" threaded rod with red plastic capred plastic cap
NSFNSF--USAPUSAP--USGSUSGS DRE1DRE1--19991999
Humble IslandHumble Island LAT: 64LAT: 64°° 45' 54.87933" S. 45' 54.87933" S. LON: 64LON: 64°° 05' 17.04120" W. 05' 17.04120" W. ELLIP. HT: 31.139 metersELLIP. HT: 31.139 meters MSL: 15 metersMSL: 15 meters LAT: 64LAT: 64°° 45' 53.30849" S. 45' 53.30849" S. LON: 64LON: 64°° 05' 02.01791" W. 05' 02.01791" W. ELLIP. HT: 25.552 metersELLIP. HT: 25.552 meters MSL: 10 metMSL: 10 metersers
5/8" threaded rod with5/8" threaded rod with red plastic capred plastic cap 5/8" threaded rod with5/8" threaded rod with red plastic capred plastic cap
NSFNSF--USAPUSAP--USGSUSGS HUM1HUM1--19991999 NSFNSF--USAPUSAP--USGSUSGS HUM2HUM2--19991999
Litchfield IslandLitchfield Island LAT: 64LAT: 64°° 46' 13.97135" S. 46' 13.97135" S. LON: 64LON: 64°°05' 38.85038" W.05' 38.85038" W. ELLIP. HT: 64.424 ELLIP. HT: 64.424 metersmeters MSL: 48 metersMSL: 48 meters
5/8" threa5/8" threaded rod withded rod with red plastic capred plastic cap
NSFNSF--USAPUSAP--USGSUSGS LIT1LIT1--19991999
Palmer StationPalmer Station LAT: 64LAT: 64°° 46' 27.20749" S. 46' 27.20749" S. LON: 64LON: 64°° 03' 06.13782" 03' 06.13782" W.W. ELLIP. HT: 29.570 metersELLIP. HT: 29.570 meters MSL: 14 metersMSL: 14 meters
5/8" threaded rod with5/8" threaded rod with red plastic capred plastic cap
NSFNSF--USAPUSAP--USGSUSGS PMR1PMR1--19991999
Torgersen IslandTorgersen Island LAT: 64LAT: 64°° 46' 2 46' 20.55260" S.0.55260" S. LON: 64LON: 64°° 04' 23.88481" 04' 23.88481" W.W.
5/8" threaded rod with5/8" threaded rod with red plastic capred plastic cap
NSFNSF--USAPUSAP--USGSUSGS TOR1TOR1--19991999
1 ITRF96/GRS80; mean sea level (MSL) heights were derived from EGM96 values and have a +/- 2 meter level of accuracy

ELLIP. HT: 33. 439 ELLIP. HT: 33. 439 metersmeters MSL: 17 metersMSL: 17 meters
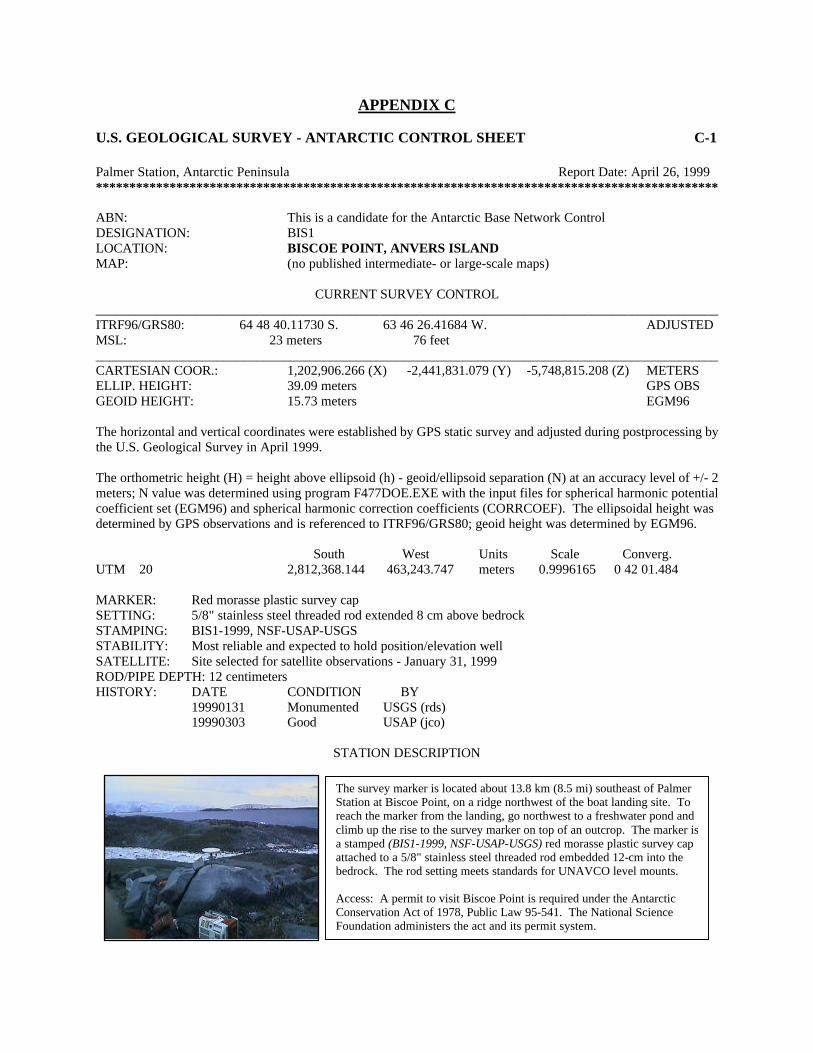
APPENDIX C
U.S. GEOLOGICAL SURVEY - ANTARCTIC CONTROL SHEET C-1 Palmer Station, Antarctic Peninsula Report Date: April 26, 1999 ********************************************************************************************* ABN: This is a candidate for the Antarctic Base Network Control DESIGNATION: BIS1 LOCATION: BISCOE POINT, ANVERS ISLAND MAP: (no published intermediate- or large-scale maps)
CURRENT SURVEY CONTROL _____________________________________________________________________________________________ ITRF96/GRS80: 64� 48� 40.11730� S. 63� 46� 26.41684� W. ADJUSTED MSL: 23 meters 76 feet _____________________________________________________________________________________________ CARTESIAN COOR.: 1,202,906.266 (X) -2,441,831.079 (Y) -5,748,815.208 (Z) METERS ELLIP. HEIGHT: 39.09 meters GPS OBS GEOID HEIGHT: 15.73 meters EGM96 The horizontal and vertical coordinates were established by GPS static survey and adjusted during postprocessing by the U.S. Geological Survey in April 1999. The orthometric height (H) = height above ellipsoid (h) - geoid/ellipsoid separation (N) at an accuracy level of +/- 2 meters; N value was determined using program F477DOE.EXE with the input files for spherical harmonic potential coefficient set (EGM96) and spherical harmonic correction coefficients (CORRCOEF). The ellipsoidal height was determined by GPS observations and is referenced to ITRF96/GRS80; geoid height was determined by EGM96. South West Units Scale Converg. UTM 20 2,812,368.144 463,243.747 meters 0.9996165 0 42 01.484 MARKER: Red morasse plastic survey cap SETTING: 5/8" stainless steel threaded rod extended 8 cm above bedrock STAMPING: BIS1-1999, NSF-USAP-USGS STABILITY: Most reliable and expected to hold position/elevation well SATELLITE: Site selected for satellite observations - January 31, 1999 ROD/PIPE DEPTH: 12 centimeters HISTORY: DATE CONDITION BY 19990131 Monumented USGS (rds) 19990303 Good USAP (jco)
STATION DESCRIPTION
The survey marker is located about 13.8 km (8.5 mi) southeast of Palmer Station at Biscoe Point, on a ridge northwest of the boat landing site. To reach the marker from the landing, go northwest to a freshwater pond and climb up the rise to the survey marker on top of an outcrop. The marker is a stamped (BIS1-1999, NSF-USAP-USGS) red morasse plastic survey cap attached to a 5/8" stainless steel threaded rod embedded 12-cm into the bedrock. The rod setting meets standards for UNAVCO level mounts. Access: A permit to visit Biscoe Point is required under the Antarctic Conservation Act of 1978, Public Law 95-541. The National Science Foundation administers the act and its permit system.
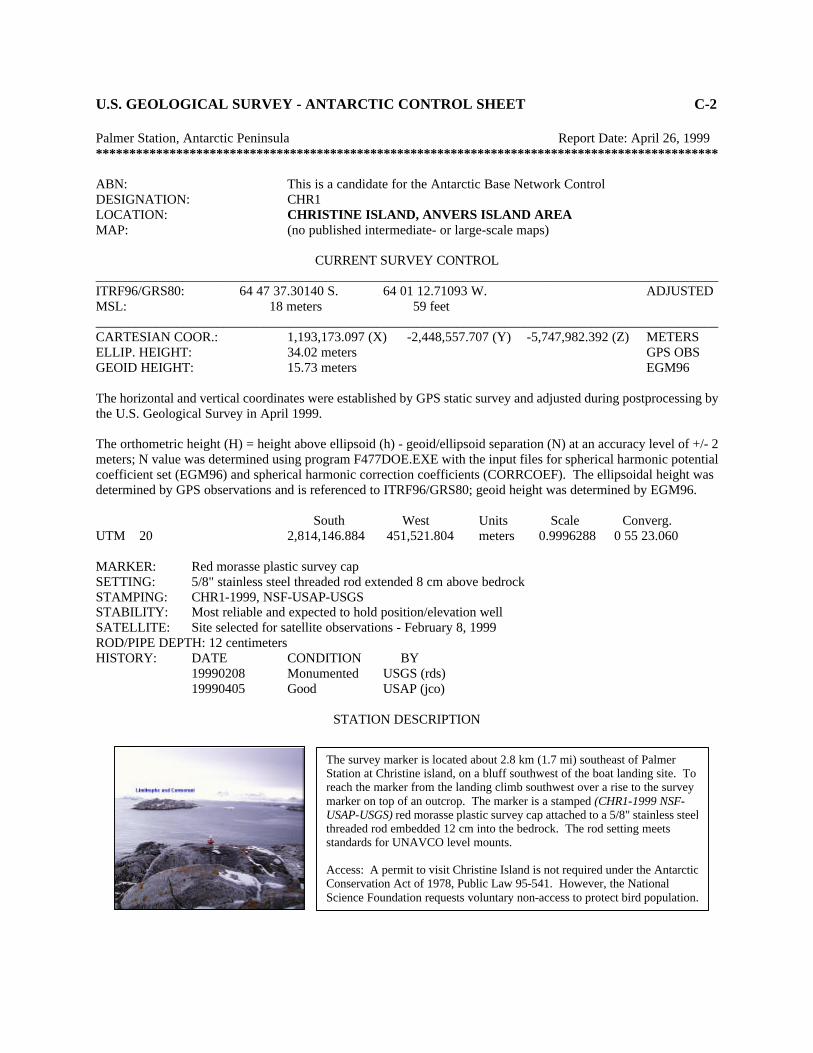
U.S. GEOLOGICAL SURVEY - ANTARCTIC CONTROL SHEET C-2 Palmer Station, Antarctic Peninsula Report Date: April 26, 1999 ********************************************************************************************* ABN: This is a candidate for the Antarctic Base Network Control DESIGNATION: CHR1 LOCATION: CHRISTINE ISLAND, ANVERS ISLAND AREA MAP: (no published intermediate- or large-scale maps)
CURRENT SURVEY CONTROL _____________________________________________________________________________________________ ITRF96/GRS80: 64� 47� 37.30140� S. 64� 01� 12.71093� W. ADJUSTED MSL: 18 meters 59 feet _____________________________________________________________________________________________ CARTESIAN COOR.: 1,193,173.097 (X) -2,448,557.707 (Y) -5,747,982.392 (Z) METERS ELLIP. HEIGHT: 34.02 meters GPS OBS GEOID HEIGHT: 15.73 meters EGM96 The horizontal and vertical coordinates were established by GPS static survey and adjusted during postprocessing by the U.S. Geological Survey in April 1999. The orthometric height (H) = height above ellipsoid (h) - geoid/ellipsoid separation (N) at an accuracy level of +/- 2 meters; N value was determined using program F477DOE.EXE with the input files for spherical harmonic potential coefficient set (EGM96) and spherical harmonic correction coefficients (CORRCOEF). The ellipsoidal height was determined by GPS observations and is referenced to ITRF96/GRS80; geoid height was determined by EGM96. South West Units Scale Converg. UTM 20 2,814,146.884 451,521.804 meters 0.9996288 0 55 23.060 MARKER: Red morasse plastic survey cap SETTING: 5/8" stainless steel threaded rod extended 8 cm above bedrock STAMPING: CHR1-1999, NSF-USAP-USGS STABILITY: Most reliable and expected to hold position/elevation well SATELLITE: Site selected for satellite observations - February 8, 1999 ROD/PIPE DEPTH: 12 centimeters HISTORY: DATE CONDITION BY 19990208 Monumented USGS (rds) 19990405 Good USAP (jco)
STATION DESCRIPTION
The survey marker is located about 2.8 km (1.7 mi) southeast of Palmer Station at Christine island, on a bluff southwest of the boat landing site. To reach the marker from the landing climb southwest over a rise to the survey marker on top of an outcrop. The marker is a stamped (CHR1-1999 NSF-USAP-USGS) red morasse plastic survey cap attached to a 5/8" stainless steel threaded rod embedded 12 cm into the bedrock. The rod setting meets standards for UNAVCO level mounts. Access: A permit to visit Christine Island is not required under the Antarctic Conservation Act of 1978, Public Law 95-541. However, the National Science Foundation requests voluntary non-access to protect bird population.
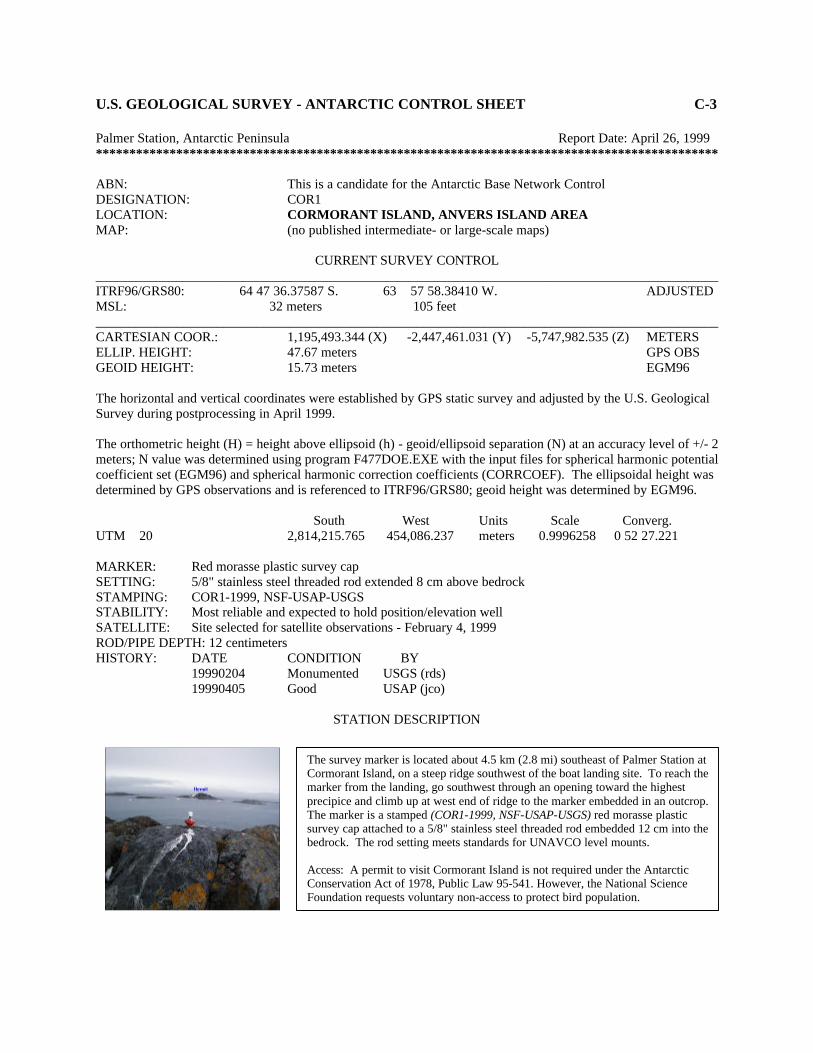
U.S. GEOLOGICAL SURVEY - ANTARCTIC CONTROL SHEET C-3 Palmer Station, Antarctic Peninsula Report Date: April 26, 1999 ********************************************************************************************* ABN: This is a candidate for the Antarctic Base Network Control DESIGNATION: COR1 LOCATION: CORMORANT ISLAND, ANVERS ISLAND AREA MAP: (no published intermediate- or large-scale maps)
CURRENT SURVEY CONTROL _____________________________________________________________________________________________ ITRF96/GRS80: 64� 47� 36.37587� S. 63� 57� 58.38410� W. ADJUSTED MSL: 32 meters 105 feet _____________________________________________________________________________________________ CARTESIAN COOR.: 1,195,493.344 (X) -2,447,461.031 (Y) -5,747,982.535 (Z) METERS ELLIP. HEIGHT: 47.67 meters GPS OBS GEOID HEIGHT: 15.73 meters EGM96 The horizontal and vertical coordinates were established by GPS static survey and adjusted by the U.S. Geological Survey during postprocessing in April 1999. The orthometric height (H) = height above ellipsoid (h) - geoid/ellipsoid separation (N) at an accuracy level of +/- 2 meters; N value was determined using program F477DOE.EXE with the input files for spherical harmonic potential coefficient set (EGM96) and spherical harmonic correction coefficients (CORRCOEF). The ellipsoidal height was determined by GPS observations and is referenced to ITRF96/GRS80; geoid height was determined by EGM96. South West Units Scale Converg. UTM 20 2,814,215.765 454,086.237 meters 0.9996258 0 52 27.221 MARKER: Red morasse plastic survey cap SETTING: 5/8" stainless steel threaded rod extended 8 cm above bedrock STAMPING: COR1-1999, NSF-USAP-USGS STABILITY: Most reliable and expected to hold position/elevation well SATELLITE: Site selected for satellite observations - February 4, 1999 ROD/PIPE DEPTH: 12 centimeters HISTORY: DATE CONDITION BY 19990204 Monumented USGS (rds) 19990405 Good USAP (jco)
STATION DESCRIPTION
The survey marker is located about 4.5 km (2.8 mi) southeast of Palmer Station at Cormorant Island, on a steep ridge southwest of the boat landing site. To reach the marker from the landing, go southwest through an opening toward the highest precipice and climb up at west end of ridge to the marker embedded in an outcrop. The marker is a stamped (COR1-1999, NSF-USAP-USGS) red morasse plastic survey cap attached to a 5/8" stainless steel threaded rod embedded 12 cm into the bedrock. The rod setting meets standards for UNAVCO level mounts. Access: A permit to visit Cormorant Island is not required under the Antarctic Conservation Act of 1978, Public Law 95-541. However, the National Science Foundation requests voluntary non-access to protect bird population.
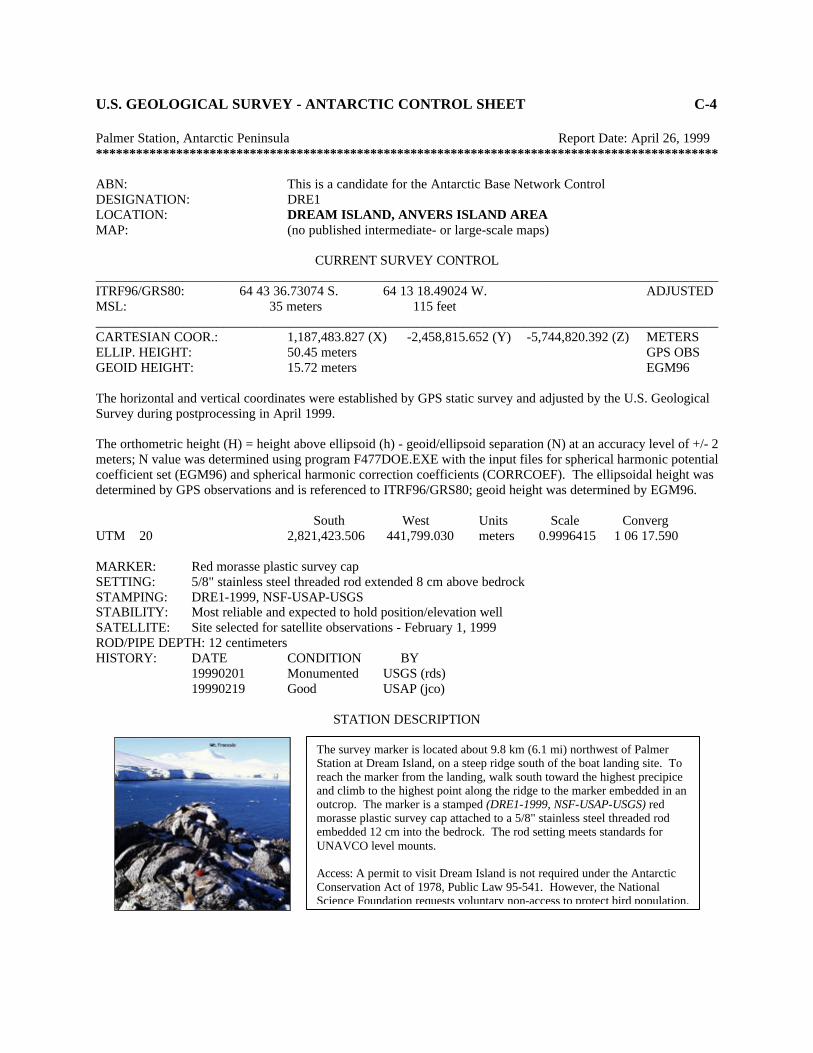
U.S. GEOLOGICAL SURVEY - ANTARCTIC CONTROL SHEET C-4 Palmer Station, Antarctic Peninsula Report Date: April 26, 1999 ********************************************************************************************* ABN: This is a candidate for the Antarctic Base Network Control DESIGNATION: DRE1 LOCATION: DREAM ISLAND, ANVERS ISLAND AREA MAP: (no published intermediate- or large-scale maps)
CURRENT SURVEY CONTROL _____________________________________________________________________________________________ ITRF96/GRS80: 64� 43� 36.73074� S. 64� 13� 18.49024� W. ADJUSTED MSL: 35 meters 115 feet _____________________________________________________________________________________________ CARTESIAN COOR.: 1,187,483.827 (X) -2,458,815.652 (Y) -5,744,820.392 (Z) METERS ELLIP. HEIGHT: 50.45 meters GPS OBS GEOID HEIGHT: 15.72 meters EGM96 The horizontal and vertical coordinates were established by GPS static survey and adjusted by the U.S. Geological Survey during postprocessing in April 1999. The orthometric height (H) = height above ellipsoid (h) - geoid/ellipsoid separation (N) at an accuracy level of +/- 2 meters; N value was determined using program F477DOE.EXE with the input files for spherical harmonic potential coefficient set (EGM96) and spherical harmonic correction coefficients (CORRCOEF). The ellipsoidal height was determined by GPS observations and is referenced to ITRF96/GRS80; geoid height was determined by EGM96. South West Units Scale Converg UTM 20 2,821,423.506 441,799.030 meters 0.9996415 1 06 17.590 MARKER: Red morasse plastic survey cap SETTING: 5/8" stainless steel threaded rod extended 8 cm above bedrock STAMPING: DRE1-1999, NSF-USAP-USGS STABILITY: Most reliable and expected to hold position/elevation well SATELLITE: Site selected for satellite observations - February 1, 1999 ROD/PIPE DEPTH: 12 centimeters HISTORY: DATE CONDITION BY 19990201 Monumented USGS (rds) 19990219 Good USAP (jco)
STATION DESCRIPTION
The survey marker is located about 9.8 km (6.1 mi) northwest of Palmer Station at Dream Island, on a steep ridge south of the boat landing site. To reach the marker from the landing, walk south toward the highest precipice and climb to the highest point along the ridge to the marker embedded in an outcrop. The marker is a stamped (DRE1-1999, NSF-USAP-USGS) red morasse plastic survey cap attached to a 5/8" stainless steel threaded rod embedded 12 cm into the bedrock. The rod setting meets standards for UNAVCO level mounts. Access: A permit to visit Dream Island is not required under the Antarctic Conservation Act of 1978, Public Law 95-541. However, the National Science Foundation requests voluntary non-access to protect bird population.
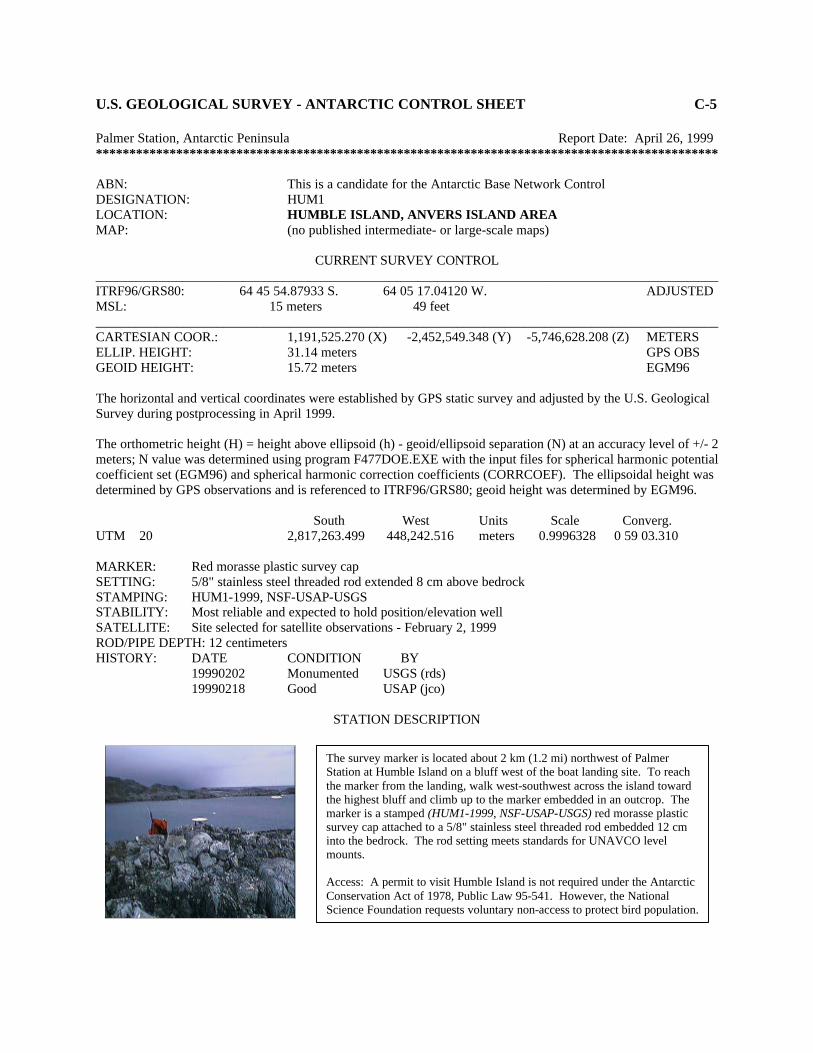
U.S. GEOLOGICAL SURVEY - ANTARCTIC CONTROL SHEET C-5 Palmer Station, Antarctic Peninsula Report Date: April 26, 1999 ********************************************************************************************* ABN: This is a candidate for the Antarctic Base Network Control DESIGNATION: HUM1 LOCATION: HUMBLE ISLAND, ANVERS ISLAND AREA MAP: (no published intermediate- or large-scale maps)
CURRENT SURVEY CONTROL _____________________________________________________________________________________________ ITRF96/GRS80: 64� 45� 54.87933� S. 64� 05� 17.04120� W. ADJUSTED MSL: 15 meters 49 feet _____________________________________________________________________________________________ CARTESIAN COOR.: 1,191,525.270 (X) -2,452,549.348 (Y) -5,746,628.208 (Z) METERS ELLIP. HEIGHT: 31.14 meters GPS OBS GEOID HEIGHT: 15.72 meters EGM96 The horizontal and vertical coordinates were established by GPS static survey and adjusted by the U.S. Geological Survey during postprocessing in April 1999. The orthometric height (H) = height above ellipsoid (h) - geoid/ellipsoid separation (N) at an accuracy level of +/- 2 meters; N value was determined using program F477DOE.EXE with the input files for spherical harmonic potential coefficient set (EGM96) and spherical harmonic correction coefficients (CORRCOEF). The ellipsoidal height was determined by GPS observations and is referenced to ITRF96/GRS80; geoid height was determined by EGM96. South West Units Scale Converg. UTM 20 2,817,263.499 448,242.516 meters 0.9996328 0 59 03.310 MARKER: Red morasse plastic survey cap SETTING: 5/8" stainless steel threaded rod extended 8 cm above bedrock STAMPING: HUM1-1999, NSF-USAP-USGS STABILITY: Most reliable and expected to hold position/elevation well SATELLITE: Site selected for satellite observations - February 2, 1999 ROD/PIPE DEPTH: 12 centimeters HISTORY: DATE CONDITION BY 19990202 Monumented USGS (rds) 19990218 Good USAP (jco)
STATION DESCRIPTION
The survey marker is located about 2 km (1.2 mi) northwest of Palmer Station at Humble Island on a bluff west of the boat landing site. To reach the marker from the landing, walk west-southwest across the island toward the highest bluff and climb up to the marker embedded in an outcrop. The marker is a stamped (HUM1-1999, NSF-USAP-USGS) red morasse plastic survey cap attached to a 5/8" stainless steel threaded rod embedded 12 cm into the bedrock. The rod setting meets standards for UNAVCO level mounts. Access: A permit to visit Humble Island is not required under the Antarctic Conservation Act of 1978, Public Law 95-541. However, the National Science Foundation requests voluntary non-access to protect bird population.
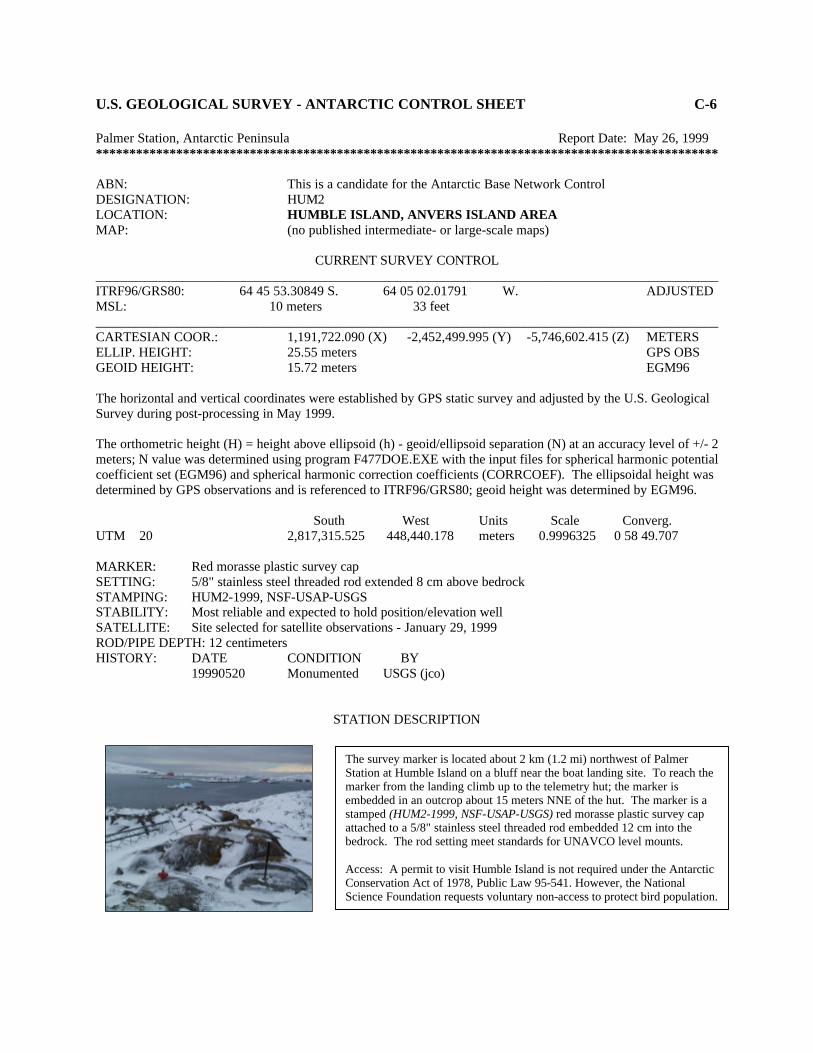
U.S. GEOLOGICAL SURVEY - ANTARCTIC CONTROL SHEET C-6 Palmer Station, Antarctic Peninsula Report Date: May 26, 1999 ********************************************************************************************* ABN: This is a candidate for the Antarctic Base Network Control DESIGNATION: HUM2 LOCATION: HUMBLE ISLAND, ANVERS ISLAND AREA MAP: (no published intermediate- or large-scale maps)
CURRENT SURVEY CONTROL _____________________________________________________________________________________________ ITRF96/GRS80: 64� 45� 53.30849� S. 64� 05� 02.01791� W. ADJUSTED MSL: 10 meters 33 feet _____________________________________________________________________________________________ CARTESIAN COOR.: 1,191,722.090 (X) -2,452,499.995 (Y) -5,746,602.415 (Z) METERS ELLIP. HEIGHT: 25.55 meters GPS OBS GEOID HEIGHT: 15.72 meters EGM96 The horizontal and vertical coordinates were established by GPS static survey and adjusted by the U.S. Geological Survey during post-processing in May 1999. The orthometric height (H) = height above ellipsoid (h) - geoid/ellipsoid separation (N) at an accuracy level of +/- 2 meters; N value was determined using program F477DOE.EXE with the input files for spherical harmonic potential coefficient set (EGM96) and spherical harmonic correction coefficients (CORRCOEF). The ellipsoidal height was determined by GPS observations and is referenced to ITRF96/GRS80; geoid height was determined by EGM96. South West Units Scale Converg. UTM 20 2,817,315.525 448,440.178 meters 0.9996325 0 58 49.707 MARKER: Red morasse plastic survey cap SETTING: 5/8" stainless steel threaded rod extended 8 cm above bedrock STAMPING: HUM2-1999, NSF-USAP-USGS STABILITY: Most reliable and expected to hold position/elevation well SATELLITE: Site selected for satellite observations - January 29, 1999 ROD/PIPE DEPTH: 12 centimeters HISTORY: DATE CONDITION BY 19990520 Monumented USGS (jco)
STATION DESCRIPTION
The survey marker is located about 2 km (1.2 mi) northwest of Palmer Station at Humble Island on a bluff near the boat landing site. To reach the marker from the landing climb up to the telemetry hut; the marker is embedded in an outcrop about 15 meters NNE of the hut. The marker is a stamped (HUM2-1999, NSF-USAP-USGS) red morasse plastic survey cap attached to a 5/8" stainless steel threaded rod embedded 12 cm into the bedrock. The rod setting meet standards for UNAVCO level mounts. Access: A permit to visit Humble Island is not required under the Antarctic Conservation Act of 1978, Public Law 95-541. However, the National Science Foundation requests voluntary non-access to protect bird population.
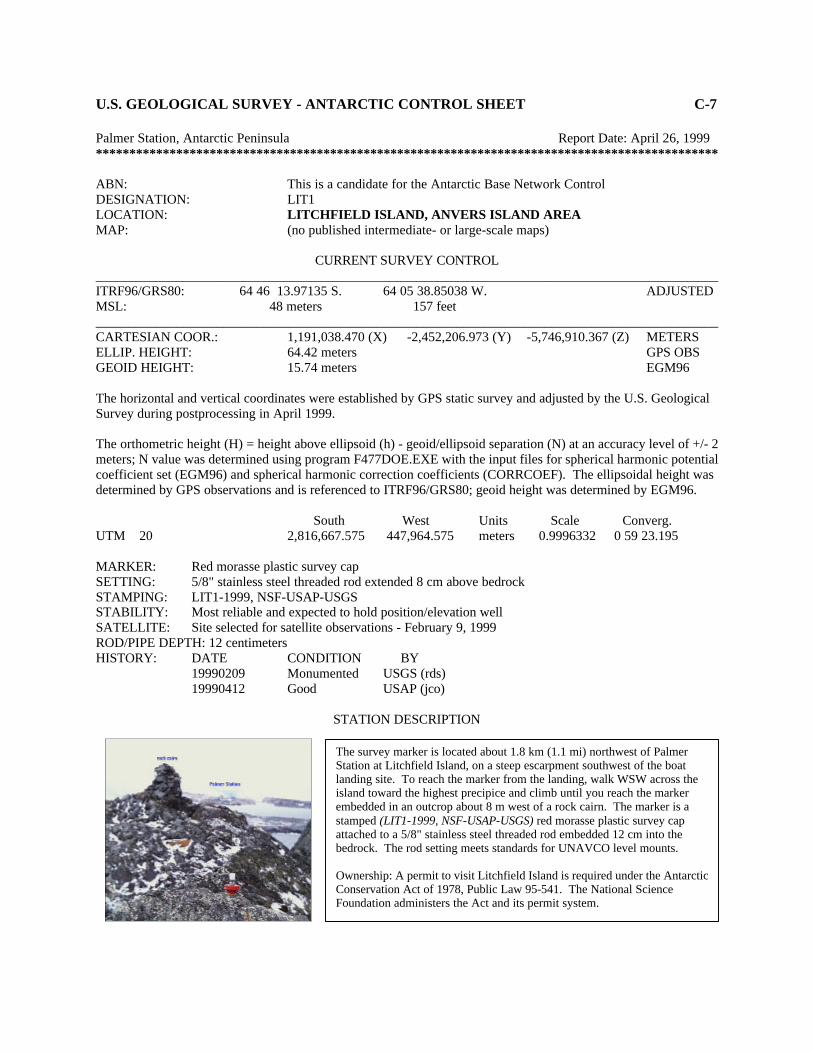
U.S. GEOLOGICAL SURVEY - ANTARCTIC CONTROL SHEET C-7 Palmer Station, Antarctic Peninsula Report Date: April 26, 1999 ********************************************************************************************* ABN: This is a candidate for the Antarctic Base Network Control DESIGNATION: LIT1 LOCATION: LITCHFIELD ISLAND, ANVERS ISLAND AREA MAP: (no published intermediate- or large-scale maps)
CURRENT SURVEY CONTROL _____________________________________________________________________________________________ ITRF96/GRS80: 64� 46� 13.97135� S. 64� 05� 38.85038� W. ADJUSTED MSL: 48 meters 157 feet _____________________________________________________________________________________________ CARTESIAN COOR.: 1,191,038.470 (X) -2,452,206.973 (Y) -5,746,910.367 (Z) METERS ELLIP. HEIGHT: 64.42 meters GPS OBS GEOID HEIGHT: 15.74 meters EGM96 The horizontal and vertical coordinates were established by GPS static survey and adjusted by the U.S. Geological Survey during postprocessing in April 1999. The orthometric height (H) = height above ellipsoid (h) - geoid/ellipsoid separation (N) at an accuracy level of +/- 2 meters; N value was determined using program F477DOE.EXE with the input files for spherical harmonic potential coefficient set (EGM96) and spherical harmonic correction coefficients (CORRCOEF). The ellipsoidal height was determined by GPS observations and is referenced to ITRF96/GRS80; geoid height was determined by EGM96. South West Units Scale Converg. UTM 20 2,816,667.575 447,964.575 meters 0.9996332 0 59 23.195 MARKER: Red morasse plastic survey cap SETTING: 5/8" stainless steel threaded rod extended 8 cm above bedrock STAMPING: LIT1-1999, NSF-USAP-USGS STABILITY: Most reliable and expected to hold position/elevation well SATELLITE: Site selected for satellite observations - February 9, 1999 ROD/PIPE DEPTH: 12 centimeters HISTORY: DATE CONDITION BY 19990209 Monumented USGS (rds) 19990412 Good USAP (jco)
STATION DESCRIPTION
The survey marker is located about 1.8 km (1.1 mi) northwest of Palmer Station at Litchfield Island, on a steep escarpment southwest of the boat landing site. To reach the marker from the landing, walk WSW across the island toward the highest precipice and climb until you reach the marker embedded in an outcrop about 8 m west of a rock cairn. The marker is a stamped (LIT1-1999, NSF-USAP-USGS) red morasse plastic survey cap attached to a 5/8" stainless steel threaded rod embedded 12 cm into the bedrock. The rod setting meets standards for UNAVCO level mounts. Ownership: A permit to visit Litchfield Island is required under the Antarctic Conservation Act of 1978, Public Law 95-541. The National Science Foundation administers the Act and its permit system.
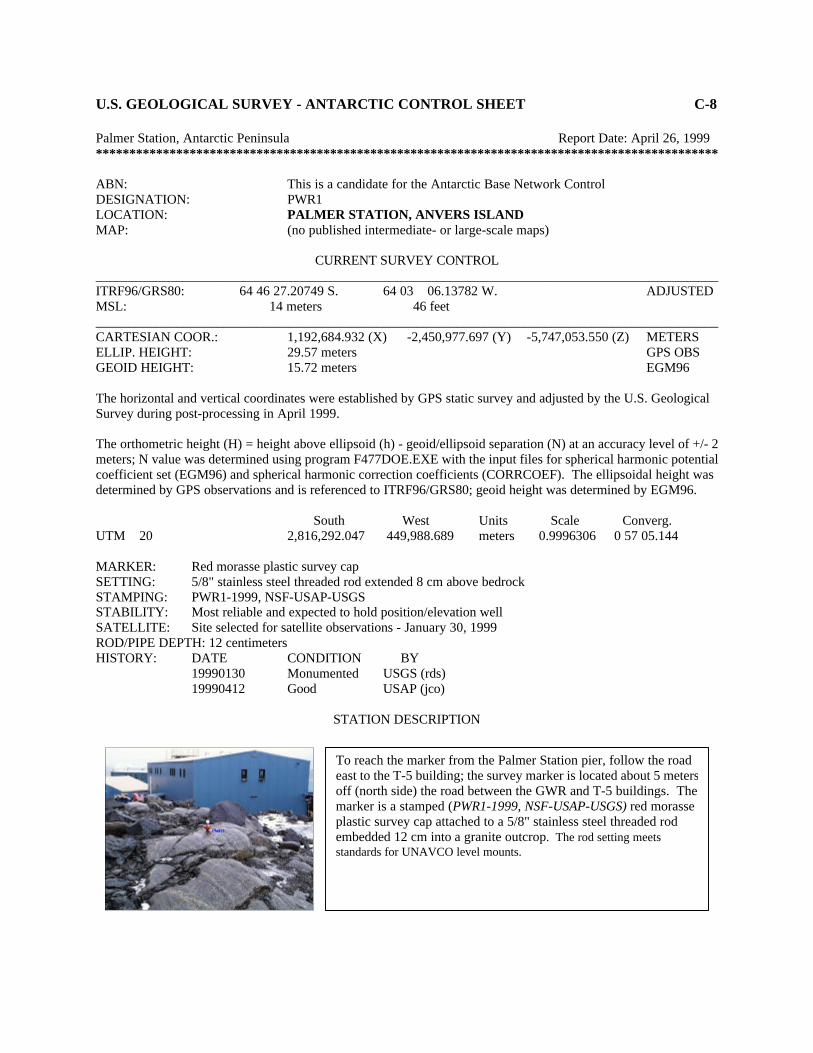
U.S. GEOLOGICAL SURVEY - ANTARCTIC CONTROL SHEET C-8 Palmer Station, Antarctic Peninsula Report Date: April 26, 1999 ********************************************************************************************* ABN: This is a candidate for the Antarctic Base Network Control DESIGNATION: PWR1 LOCATION: PALMER STATION, ANVERS ISLAND MAP: (no published intermediate- or large-scale maps)
CURRENT SURVEY CONTROL _____________________________________________________________________________________________ ITRF96/GRS80: 64� 46� 27.20749� S. 64� 03 � 06.13782� W. ADJUSTED MSL: 14 meters 46 feet _____________________________________________________________________________________________ CARTESIAN COOR.: 1,192,684.932 (X) -2,450,977.697 (Y) -5,747,053.550 (Z) METERS ELLIP. HEIGHT: 29.57 meters GPS OBS GEOID HEIGHT: 15.72 meters EGM96 The horizontal and vertical coordinates were established by GPS static survey and adjusted by the U.S. Geological Survey during post-processing in April 1999. The orthometric height (H) = height above ellipsoid (h) - geoid/ellipsoid separation (N) at an accuracy level of +/- 2 meters; N value was determined using program F477DOE.EXE with the input files for spherical harmonic potential coefficient set (EGM96) and spherical harmonic correction coefficients (CORRCOEF). The ellipsoidal height was determined by GPS observations and is referenced to ITRF96/GRS80; geoid height was determined by EGM96. South West Units Scale Converg. UTM 20 2,816,292.047 449,988.689 meters 0.9996306 0 57 05.144 MARKER: Red morasse plastic survey cap SETTING: 5/8" stainless steel threaded rod extended 8 cm above bedrock STAMPING: PWR1-1999, NSF-USAP-USGS STABILITY: Most reliable and expected to hold position/elevation well SATELLITE: Site selected for satellite observations - January 30, 1999 ROD/PIPE DEPTH: 12 centimeters HISTORY: DATE CONDITION BY 19990130 Monumented USGS (rds) 19990412 Good USAP (jco)
STATION DESCRIPTION
To reach the marker from the Palmer Station pier, follow the road east to the T-5 building; the survey marker is located about 5 meters off (north side) the road between the GWR and T-5 buildings. The marker is a stamped (PWR1-1999, NSF-USAP-USGS) red morasse plastic survey cap attached to a 5/8" stainless steel threaded rod embedded 12 cm into a granite outcrop. The rod setting meets standards for UNAVCO level mounts.
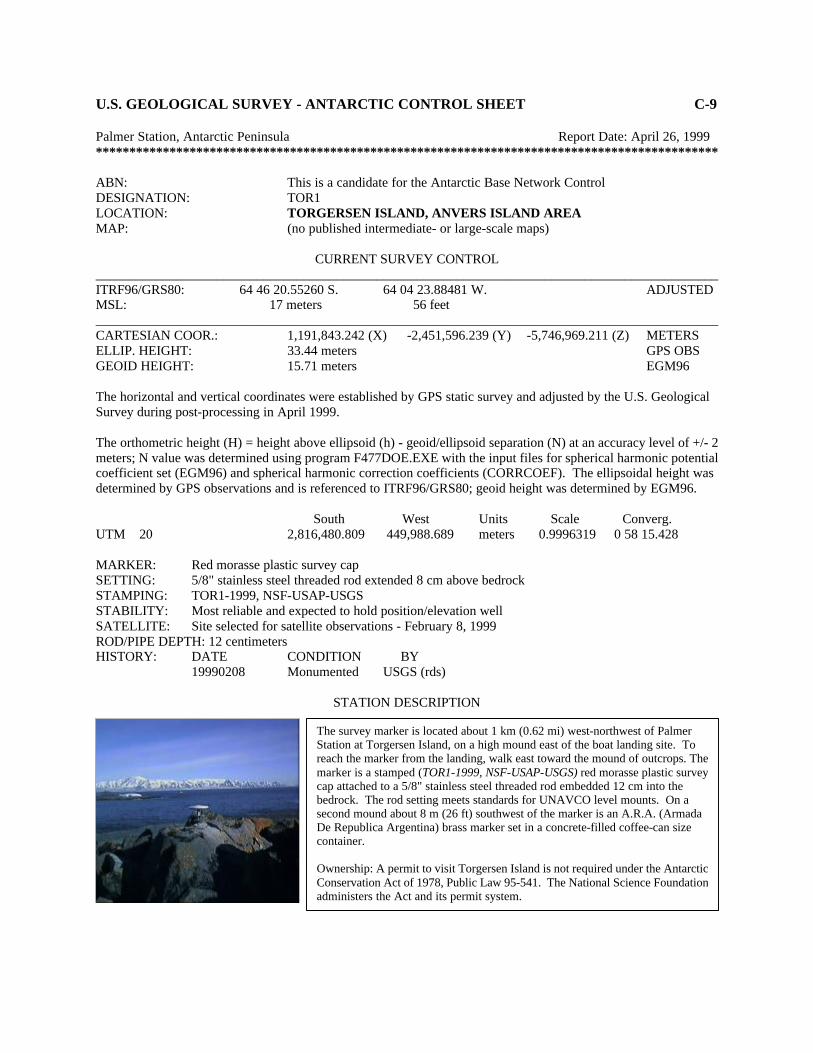
U.S. GEOLOGICAL SURVEY - ANTARCTIC CONTROL SHEET C-9 Palmer Station, Antarctic Peninsula Report Date: April 26, 1999 ********************************************************************************************* ABN: This is a candidate for the Antarctic Base Network Control DESIGNATION: TOR1 LOCATION: TORGERSEN ISLAND, ANVERS ISLAND AREA MAP: (no published intermediate- or large-scale maps)
CURRENT SURVEY CONTROL _____________________________________________________________________________________________ ITRF96/GRS80: 64� 46� 20.55260� S. 64� 04� 23.88481� W. ADJUSTED MSL: 17 meters 56 feet _____________________________________________________________________________________________ CARTESIAN COOR.: 1,191,843.242 (X) -2,451,596.239 (Y) -5,746,969.211 (Z) METERS ELLIP. HEIGHT: 33.44 meters GPS OBS GEOID HEIGHT: 15.71 meters EGM96 The horizontal and vertical coordinates were established by GPS static survey and adjusted by the U.S. Geological Survey during post-processing in April 1999. The orthometric height (H) = height above ellipsoid (h) - geoid/ellipsoid separation (N) at an accuracy level of +/- 2 meters; N value was determined using program F477DOE.EXE with the input files for spherical harmonic potential coefficient set (EGM96) and spherical harmonic correction coefficients (CORRCOEF). The ellipsoidal height was determined by GPS observations and is referenced to ITRF96/GRS80; geoid height was determined by EGM96. South West Units Scale Converg. UTM 20 2,816,480.809 449,988.689 meters 0.9996319 0 58 15.428 MARKER: Red morasse plastic survey cap SETTING: 5/8" stainless steel threaded rod extended 8 cm above bedrock STAMPING: TOR1-1999, NSF-USAP-USGS STABILITY: Most reliable and expected to hold position/elevation well SATELLITE: Site selected for satellite observations - February 8, 1999 ROD/PIPE DEPTH: 12 centimeters HISTORY: DATE CONDITION BY 19990208 Monumented USGS (rds)
STATION DESCRIPTION
The survey marker is located about 1 km (0.62 mi) west-northwest of Palmer Station at Torgersen Island, on a high mound east of the boat landing site. To reach the marker from the landing, walk east toward the mound of outcrops. The marker is a stamped (TOR1-1999, NSF-USAP-USGS) red morasse plastic survey cap attached to a 5/8" stainless steel threaded rod embedded 12 cm into the bedrock. The rod setting meets standards for UNAVCO level mounts. On a second mound about 8 m (26 ft) southwest of the marker is an A.R.A. (Armada De Republica Argentina) brass marker set in a concrete-filled coffee-can size container. Ownership: A permit to visit Torgersen Island is not required under the Antarctic Conservation Act of 1978, Public Law 95-541. The National Science Foundation administers the Act and its permit system.