Embed Size (px)
Citation preview
GP.BullhoundDealmakers in Technology
CLOUD CONFESSIONS BUSINESS EDITION
Oskar Herdland, Director ECM
2018-04-17

Confidential
2
GP Bullhound introduction
Market update
2018 tech predictions
1
2
3
4 Global Software Market Perspectives

4
510+Successful transactions
8,500+In contact with
GP Bullhound team annually
1,000+VC / PE contacts
60+Dedicated tech bankers
9Offices
1,500+Strategic buyer contacts
300+Events, keynotes &
Research reports
19Years since inception
Our missionTo advise the most passionate
technology entrepreneurs

5
Marquee transactions
SEENE
SNAPCHAT
Sold to
Undisclosed
RIGHTWARE
THUNDERSOFT
Sold to
€64 million
PRODIGY FINANCE
INDEX VENTURES, BALDERTON, ALPHACODE, DEUTSCHE BANK
Expansion raise
$240 million
OLSON
ICF INTERNATIONAL
Sold to
$295 million
SEQUENCE
SALESFORCE
Sold to
Undisclosed
ESSENCE
WPP
Sold to
Undisclosed
INNOGAMES
MODERN TIMES GROUP
Sale of equity stake
€260m valuation
PARADIGMA
INDRA
Sold to
Undisclosed
AUTOTRADER SA
OLX/NASPERS
Sold to
Undisclosed
ICOMERA
ENGIE INEO
Sold to
Undisclosed
ANSIRA
ADVENT INTERNATIONAL
Acquired by
Undisclosed
13TH LAB
Undisclosed
Sold to
6
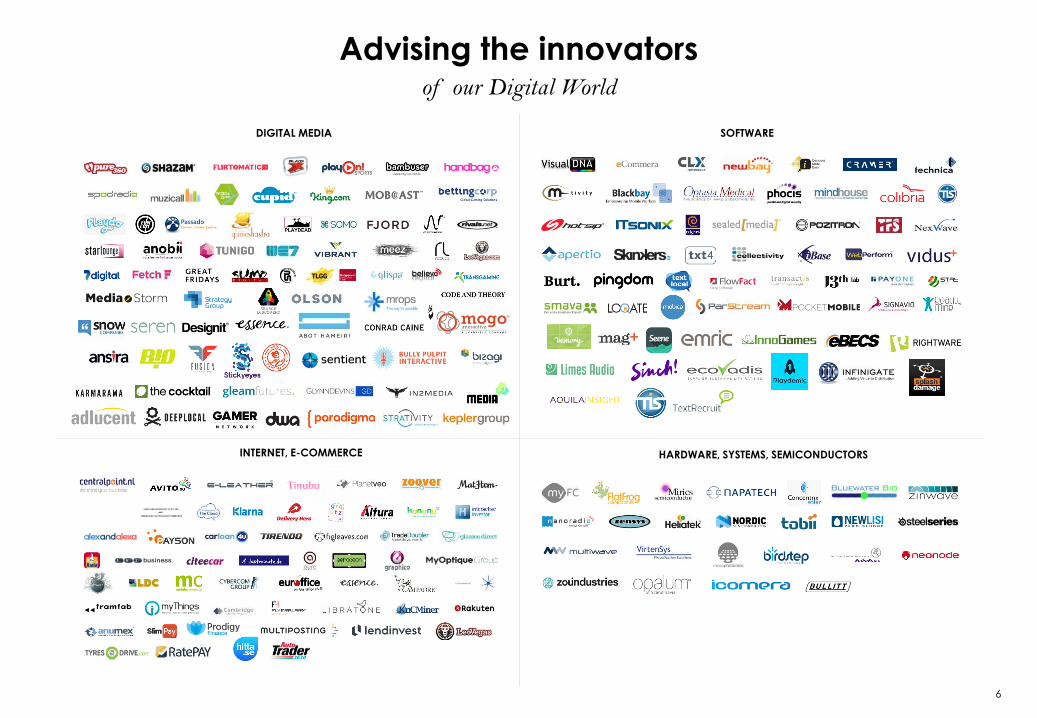
Advising the innovators
DIGITAL MEDIA
HARDWARE, SYSTEMS, SEMICONDUCTORS
of our Digital World
INTERNET, E-COMMERCE
SOFTWARE

Selected Investments
BELIEVE DIGITAL
SPOTIFY KLARNAQUIXEL
AVITO
LEOVEGAS
IPO (13.4x)
FISHBRAIN WALLAPOP
Sold to Accenture (4.6x)
MATHEM 13TH LAB
Sold to Facebook (2.0x)Sold to Bestseller (2.4x)
FJORD
Sold to Naspers (18.6x)
TIPTAPP

Confidential
8
GP Bullhound introduction
Market update
2018 tech predictions
1
2
3
4 Global Software Market Perspectives

9
Confidential
1 000
2 000
3 000
4 000
5 000
6 000
Cumulative equity returnsRebased to January 2004
Source: CapitalIQ
Note: Data from CapitalIQ as of 10 April 2018
Index
+239%
+354%
FAANG
S&P 500
Nasdaq Composite
+4,841%

10
Confidential
Founder-led companies outperforming the marketRebased to January 2004
Source: CapitalIQ
Note: Data from CapitalIQ as of 10 April 2018. Founder-led companies include Facebook, Amazon, Apple, Netflix and Google. Not founder-led companies proxied using S&P 500 index
IndexFounder-led
Not founder-led
1 000
2 000
3 000
4 000
5 000
6 000
+4,841%
+239%

11
Confidential
51,0
25,5
20,6
16,0
12,0 11,0 10,0 10,0 9,0
6,0 5,2 5,0 4,5 4,1 4,0 3,5 3,5 3,3 3,0 3,0
Nearly all unicorns are founder-ledTop 20 US venture-backed private companies
Source: Wall Street Journal (11 November 2015)
Valuation, $bn Founder-led
Not founder-led

Confidential
12
GP Bullhound introduction
Market update
2018 tech predictions
1
2
3
4 Global Software Market Perspectives

13
Confidential
GP Bullhound’s 2018 Predictions
An Uneasy Future for Politics and Technology1
Cyber Security Exposure and Adoption2
Mobile Trumps TV in China3
Translation Technology Takes Hold4
Over and Out Email5
International Labor Arbitrage Flourishes6
The Unlikely Comeback of the Software Suite7
Industry 4.08
Regulators Rule on Boom and Bust of Initial Coin Offerings9
Augmented Reality Adapts for Early Adoption10

Cyber Security Exposure and Adoption2

15
Confidential
Cyber Security Exposure and Adoption2
Increasingly cyber attacks are affecting the end user/consumer
» Uber, Equifax, Gmail…
IoT has led to an explosion in the number of connected devices
» Consumers and households have never been as connected, and exposed, as today
» Nearly 1/5 American households contain 10 or more internet connected devices
» The median household contains 5 such devices
Awareness has increased, but knowledge of how to protect is still low
» 75%+ of consumers are concerned about security, privacy, or websites tracking them
» Few consumers are educated on how to limit their exposure to these kinds of incidents
We will see a large increase in the number of households and individuals
adopting consumer cyber security software
» Home network security software, fraud protection and device security are set to benefit

Over and Out Email5

17
Confidential
Over and Out Email5
2018 will represent the year that use of email will cease to grow and begin to
decline in the US
» Growth in email usage is projected to slow to 1.7% in the US in 2018
Companies increasingly shifting to enterprise communications tools
» Slack, Facebook, Google and Microsoft all have offerings in the market
» Amazon rumored to be interested in entering enterprise productivity/communication
Slack is clear market leader
» 6 million DAUs and 50K business customers
» 43% of the Fortune 100 using Slack
Rise of project management platforms further eroding email’s prevalence
» Companies providing tools to streamline processes and remove ineffective uses of internal
and external email
» Mobile workforce embracing enterprise messaging platforms
Email marketing is still a large proportion of sent emails
» Average email monthly send rates dropped from 9.8 to 8.1
» Other marketing tools starting to overtake email in effectiveness

International Labor Arbitrage Flourishes6

19
Confidential
International Labor Arbitrage Flourishes6
The cost of centralizing startups in established tech hubs is becoming unsustainable for
many startups
» The average one bedroom apartment in San Francisco is $3,600 per month vs $2,600 in NYC
» The average salary for a software engineer in Silicon Valley is $134k vs $71k in the UK
The advancement of cloud collaboration tools has made distributed organizations
possible
» Communication tools (e.g. video and chat) have decreased the need for in person meetings
» The increase in number of rounds and total funding for enterprise collaboration software has fueled innovation
252 249431
807 641
895
1880
10801180
68 6983
98
138
168
141
133
102
0
60
120
180
0
500
1000
1500
2000
2008 2009 2010 2011 2012 2013 2014 2015 2016
Funding Amount ($m) Number of rounds
Number of rounds and total funding in global enterprise collaboration software market*
* Tracxn, Enterprise Collaboration Software Report, November 2016

20
Confidential
International Labor Arbitrage Flourishes6
Companies now beginning to distribute their workforces to lower cost geographies
» Global trend impacting companies in the US and Europe, most notably
» Most common to locate technical teams in lower cost countries/cities
Key benefits
» Companies can significantly lower salary and operating costs
» Lower competition, higher employee retention and employee standard of living
Potential drawbacks
» Internal collaboration more challenging with distributed teams
» Complex internal workforce structures potential negatives for buyers and investors
» Technology consolidators often prefer centralized technical / engineering teams
Selected examples

The Unlikely Comeback of the Software Suite7

22
Confidential
18.5%projected CAGR*
$200bncloud software
revenue in 2021*
$85bncloud software
revenue in 2016*
* IDC Market Analysis Perspective: Worldwide SaaS and Cloud Software, 2017
The Unlikely Comeback of the Software Suite7
The growth in adoption of cloud-based software has cluttered the
market for enterprise solutions
» Founding a cloud software company is easier than ever in the current market
» The average medium size enterprise has a vendor list of over 100 applications
» Decision makers are beginning to realize the lack of visibility they have into the utilization and expense of these vendors
Enterprise customers are reverting back to suite solutions
» The promise of the best of breed approach is proving to be unrealizable and costly
» Unintended complexity from managing a large vendor lists is muddling the overall IT strategy
Two particular sectors where we are seeing a movement to suites are
HR and marketing software
» The suites in these markets require less integration and the procurement is much more transparent

Confidential
23
GP Bullhound introduction
Market update
2018 tech predictions
1
2
3
4 Global Software Market Perspectives

24
Confidential
Software consolidators are hyper focused on “growth acquisitions”
– SaaS companies with as little as $5 million of ARR have attracted such interest when growing north of 100%
– Acquirers are not evaluating build vs. buy as often in these scenarios
– Targets are being integrated, but left alone to continue momentum and growth
Strategic M&A processes have been catalyzed through “market checks” in parallel to companies’ investment processes
– Companies are weighing the advantages of exiting prior to their next financing as opposed to further dilution and time horizon
– Investor interest and term sheets can often drive strategics to act
– Companies exiting to strategics or PE buyers in lieu of raising fresh capital and continued standalone growth
Despite the initial tailwinds for a robust IPO market in 2018, volatility could threaten the IPO market in the near-term
– Over the past year, technology listings have returned an average of 28 percent, more than triple the return of all other IPOs. The next name
scheduled to join this elite class is Zuora.
– Market volatility spiked dramatically in early February as the Dow had one of its biggest point losses in recent times
– IPOs price above initial guidance and/or last privately marked valuations
Dropbox is a marquee software IPO – fastest SaaS company to $1B in revenue – 9x FTM rev
– Prolific IPO – 500m user over 180 countries, just 11m are paying customers – initial offering $18-20, IPO at $21, now $31 +48%
– Dropbox is primarily a consumer-focused SaaS business with much different metrics than most enterprise SaaS companies
– Dropbox’s net revenue retention of 100% is low for a SaaS company; land & expand efforts may not be working as well as others
Zscaler IPO – Cloud security, Security as a Service +106% surge on first IPO day to $33 ($16) - $4bn market cap. 16x
Zuora IPO – subscriptions based ERP platform - $1.2bn IPO valuation – upped price 20% $11-13 ($9-11) – 5x
Q1 SaaS Market Highlights

25
Confidential
Large established SaaS companies are focusing on shifting to PaaS for their customers
– Customers want to be able to customize their own applications, add new services and shape their product. They can also integrate new
features and functionalities that are prohibitive to develop on their own, for example AI features
– Salesforce is the best example of a SaaS company shifting to PaaS, with their Force.com platform spawning multiple innovative and
successful companies leveraging their technology
» Financial Force – by being native on Force.com they are able to build cloud ERP apps on the largest customer success platform, making
teams more nimble, the services better, and the cost of synchronizing transactions lower
– Other companies focusing on platform offerings are Google, Microsoft, Oracle, SAP and Workday
Customer acquisition cost for SaaS companies has increased almost 65% over the past 5 years lowering margin
expectations for software companies, and making optimization of sales strategies more difficult
– Competition among SaaS vendors has made the cost of acquiring customers increase quite significantly, particularly larger enterprise
solutions
– While competition is responsible for driving up prices, another factor that inevitably affects SaaS companies of scale is a shrinking number of
sales channels to tap
» As early sales channels become saturated, converting clients from this source becomes increasingly difficult and expensive
» Sales channels further down the continuum usually have a marginally higher cost. Channel sales is the exception, having an existing
customer to sell to or through is much cheaper than a new sale and the upfront friction that comes with it
The newly signed tax bill in the US will lead to repatriation of profits, creating an extremely favorable M&A environment
for large technology & software consolidators
– Apple could bring back cash to the order of $252B, Cisco $65B and Google $55B – the possibilities are numerous, with multiple software
companies at large public valuations, and many more with significant value that could contribute scale to the largest technology acquirers
» E.g. Apple / Tesla, Apple / Netflix, Microsoft / Citrix, Google / Salesforce
Our Views on Current Trends in Software
Source: Redpoint Ventures, Capital IQ

26
Confidential
18,3
14,5
13,2
12,6
9,9
7,3
6,1
5,9
5,6
5,4
4,9
4,5
4,4
4,3
4,2
4,1
4,0
Salesforce
ServiceNow
Workday
Square
j2 Global
Splunk
Atlassian
Veeva
Ultimate Software
LogMeIn
Paycom
athenahealth
Proofpoint
RingCentral
Zendesk
2U
RealPage
HubSpot
MuleSoft
New Relic
GP Bullhound Selected SaaS Index Market Valuations
Source(s): Capital IQ as of 02/28/2018
Note: Includes the 20 largest companies by market cap from the GP Bullhound SaaS index, constituents can be found in Appendix A
(Market Cap Values in $ in billions)
84.0
28.1
26.6

27
Confidential
3,0x
4,0x
5,0x
6,0x
7,0x
8,0x
9,0x
10,0x
11,0x
12,0x
13,0x
14,0x
GPB SaaS Index - TEV/Total Revenues GPB SaaS Index - TEV/Forward Total Revenue
Analysis of GP Bullhound SaaS Index ValuationsRevenue Multiple Trends – Last Five Years
Source(s): Capital IQ as of 2/28/2018
Note: GP Bullhound SaaS Index constituents can be found in Appendix A
Mean: 8.5x
Mean: 6.8x
As of Feb 28: 8.7x
As of Feb 28: 7.4x
Public market bubble? Current SaaS valuations are
in line with the mean of the last five year

Confidential
28
Key SaaS MetricsDefinitions & Calculations
Metric Definition Calculation
Normalized measurement of recurring revenue, most frequently
measured with a constant value in each month of the
subscription periodMRR
All S&M expenses for new customers. Sometimes excludes people
management S&M costsCAC =
𝑆&𝑀
# 𝑜𝑓 𝑛𝑒𝑤 𝑐𝑢𝑠𝑡𝑜𝑚𝑒𝑟𝑠
Customer Acquisition Cost (CAC)
Amount of profit a customer is calculated to deliver to the
company over the lifetime of the customerCLV =
𝐴𝑅𝑃𝑈 ∗ 𝐺𝑀
𝐶ℎ𝑢𝑟𝑛 𝑟𝑎𝑡𝑒
Customer Lifetime Value (CLV)
The number of months a company requires to payback its cost of
customer acquisitionPayback Period =
𝐶𝐴𝐶
𝐴𝑅𝑃𝐴 ∗ 𝐺𝑀Payback Period
Churn (Gross & Net)
Gross Churn is the number of customers you lose in a given period
or cohort regardless of account expansion or growth
Net Churn is the number of customers gained or lost in a given
period or cohort after taking into consideration new, reactivated,
or expanded accounts Net Churn =
(𝑐𝑢𝑠𝑡𝑜𝑚𝑒𝑟𝑠 𝑙𝑜𝑠𝑡𝑜𝑣𝑒𝑟 𝑡𝑖𝑚𝑒 𝑝𝑒𝑟𝑖𝑜𝑑 − 𝑐𝑢𝑠𝑡𝑜𝑚𝑒𝑟𝑠 𝑔𝑎𝑖𝑛𝑒𝑑
𝑜𝑣𝑒𝑟 𝑡𝑖𝑚𝑒 𝑝𝑒𝑟𝑖𝑜𝑑)𝑐𝑢𝑠𝑡𝑜𝑚𝑒𝑟𝑠 𝑎𝑡
𝑏𝑒𝑔𝑖𝑛𝑛𝑖𝑛𝑔 𝑜𝑓 𝑡𝑖𝑚𝑒 𝑝𝑒𝑟𝑖𝑜𝑑
Gross Churn = 𝑐𝑢𝑠𝑡𝑜𝑚𝑒𝑟𝑠 𝑙𝑜𝑠𝑡 𝑜𝑣𝑒𝑟 𝑡𝑖𝑚𝑒 𝑝𝑒𝑟𝑖𝑜𝑑
𝑐𝑢𝑠𝑡𝑜𝑚𝑒𝑟𝑠 𝑎𝑡 𝑏𝑒𝑔𝑖𝑛𝑛𝑖𝑛𝑔 𝑜𝑓 𝑡𝑖𝑚𝑒 𝑝𝑒𝑖𝑟𝑜𝑑
MRR= # 𝑜𝑓 𝑝𝑎𝑦𝑖𝑛𝑔 𝑐𝑢𝑠𝑡𝑜𝑚𝑒𝑟𝑠 ∗ 𝐴𝑅𝑃𝐴/𝑚𝑜𝑛𝑡ℎ

Confidential
29
Key SaaS Metrics (Cont’d)
• Monthly Recurring Revenues (MRR), Annual Recurring Revenue (ARR), Annual Run Rate Revenue (ARRR) are the key
metrics that investors will focus on
– Note: ARRR = ARR + Non-recurring revenue items
– Also important to understand, the % on-demand SaaS vs. traditional license, and the mix between software and
services
• Important to show continued growth in top line revenue (both reported and for the above metrics)
MRR / ARR / ARRR
• Customer Acquisition Cost (CAC) payback period is typically stated in months. Represents the time taken to fully pay
back sales and marketing investments
• Growth is the key target for SaaS companies, but sales and marketing investments should ultimately be profitable. CAC
payback periods:
– For SMEs, CAC payback period should be 6-12 months
– For Enterprise Customers, CAC payback period should be 9-15 months
– A CAC payback period of >24months should be a cause for concern
• Customer Lifetime Value = NPV of recurring gross profit of a customer less the initial cost of customer acquisition
• For SMEs, CLV should be between 3 & 4 years
– For Enterprise Customers, CLV should be between 5 & 7 years
CAC vs. CLV
• Logo Churn: Churn of absolute number of customers. Top companies have a Logo Churn of <7%
• MRR Churn: Churn of customer MRR that has been lost over given period of time. Top companies have a MRR Churn of
<5%, including upgrades/customer expansion, churn is ideally negative
• MRR Renewal: Total MRR of renewed customers/Total MRR of existing customers at year beginning. Top companies
have a MRR Renewal percentage of 105-110% due to upsells to its installed base
• Net Revenue Retention:
– Key metric for performance of SaaS business
– >100% upsells more than make up for churn
– ARR as a Percentage of Upsells: 15%+
Churn & Renewal Rates
• Growth is of paramount importance, with excess cash being used to fuel growth
• Important, therefore, to understand the cash burn in the business and planning for capital efficient hyper-growth
Free Cash Flow /
Burn Rate
Source(s): GP Bullhound analysis
Investors focus on key SaaS metrics, long-term business model viability and valuations

Events &Speaking
Offices
Awards
Latestreports
• GP Bullhound Summit
• Investor Allstars
• Northern Tech Awards
• Mobile World Congress
• SLUSH
• South Summit
• Game Developers Conference
• WebSummit
• CNN
• CNBC
• BBC
• Bloomberg
30
LONDONSAN
FRANCISCOSTOCKHOLM BERLIN MANCHESTER PARIS HONG KONG MADRID
GLOBAL SOFTWARE
MARKET PERSPECTIVES
FINTECHANYTHING BUT ALTERNATIVE
ASIAN HORIZONS
EUROPE’S TITANS OF TECH
SPANISH TECH
SPOTIFY UPDATE OCTOBER 2017
TECHNOLOGY PREDICTIONS 2018
NEW YORK

The contents of this presentation document ("Presentation") shall not be deemed to be any form of offer or binding commitment on the part of GP Bullhound
LLP. This Presentation is provided for use by the intended recipient for information purposes only. It is prepared on the basis that the recipients are
sophisticated investors with a high degree of financial sophistication and knowledge. No representation or warranty, express or implied, is or will be made in
respect of the information contained in this Presentation and no responsibility or liability is or will be accepted by GP Bullhound LLP in this regard. In
particular, but without prejudice to the generality of the foregoing, no representation or warranty is given as to the accuracy, completeness or reasonableness
of any projections, targets, estimates or forecasts contained in this Presentation or in such other written or oral information that may be provided by GP
Bullhound LLP. All liability is expressly excluded to the fullest extent permitted by law. This Presentation may contain forward-looking statements, which
involve risks and uncertainties. Actual results may differ significantly from the results described in such forward-looking statements. Any past performance
information contained in this Presentation is provided for illustrative purposes only and is not necessarily a guide to future performance and the value of
securities may fall as well as rise. In particular, investments in the technology sector can involve a high degree of risk and investors may not get back the full
amount invested. This Presentation should not be construed in any circumstances as a solicitation or offer, or recommendation, to acquire or dispose of any
investment or to engage in any other transaction, or to provide any investment advice or service and you should not act or refrain from acting upon any
information contained on it without seeking appropriate professional advice. In the event that you should wish to engage GP Bullhound LLP, separate
documentation, including an engagement letter, will be provided to you. For the purposes of the rules and guidance issued by the Financial Conduct
Authority ("the FCA"), this Presentation has been communicated by GP Bullhound LLP, which is authorised and regulated by the FCA in the United
Kingdom under number 527314.
This Presentation is only directed at persons who fall within the category of “Professional Clients” as defined in the rules and guidance issued by the FCA
from time to time and any investment or investment activity to which this Presentation relates is available only to such persons and will be engaged in only
with such persons. The information contained in this Presentation must not be relied upon by persons who are not Professional Clients and any person who is
not a Professional Client should return it immediately to GP Bullhound LLP at the address below. This Presentation and any other information or opinions
supplied or given to you by GP Bullhound LLP constitute confidential information. Neither the whole nor any part of the information contained in this
Presentation may be duplicated in any form or by any means. Neither should the information contained in this Presentation, or any part thereof, be
redistributed or disclosed to anyone without the prior written consent of GP Bullhound LLP. GP Bullhound LLP is a limited liability partnership registered
in England and Wales, registered number OC352636, and is authorised and regulated by the FCA. Any reference to a partner in relation to GP Bullhound
LLP is to a member of GP Bullhound LLP or an employee with equivalent standing and qualifications. A list of the members of GP Bullhound LLP is
available for inspection at its registered office: 52 Jermyn Street, London SW1Y 6LX.
LONDONtel. +44 207 101 7560
52 Jermyn Street
London, SW1Y 6LX
United Kingdom
SAN FRANCISCOtel. +1 415 986 0191
One Maritime Plaza Suite 1620
San Francisco, CA 94111
USA
STOCKHOLMtel. +46 8 545 074 14
Grev Turegatan 30
Stockholm, 114 38
Sweden
BERLINtel. +49 30 610 80 600
Kleine Jaegerstr. 8
Berlin, 101 17
Germany
PARIStel. +33 1 82 88 43 40
45 rue de Lisbonne
75 008 Paris
France
MANCHESTERtel. +44 161 413 5030
1 New York Street
Manchester, M1 4HD
United Kingdom
HONG KONGtel. +852 5806 1310
Level 6, Champion Tower
3 Garden Road, Central
Hong Kong
MADRIDtel. +34 951 12 72 32
Paseo de Recoletos 6
28001 Madrid
Spain
NEW YORKtel. +1 212 759 1870
Three Park Ave, 31st Floor
New York, NY 10016
USA